
September 2015 Volume 7, Number 15 Preface to the special edition Mehmet Baha Karan Vice-President...
48
September 2015 – Volume 7, Number 15 Special edition edited by Mehmet Baha Karan x Mehmet Baha Karan: preface to the special edition x Christian Hoedeman discusses the possible impact of IFRS 15 on the energy business of a multinational corporation x Robert Klijn and Marcel Schulze show how stock exchanges contribute to sustainable businesses x Nanne Brunia and Wim Westerman present a case on valu- ining a European energy firm ISSN: 2211-8691 http://www.centerforenergyandvalue.org/publications.html
-
Upload
nguyenkiet -
Category
Documents
-
view
216 -
download
1
Transcript of September 2015 Volume 7, Number 15 Preface to the special edition Mehmet Baha Karan Vice-President...
September 2015 – Volume 7, Number 15 Special edition edited by Mehmet Baha Karan
x Mehmet Baha Karan: preface to the special edition
x Christian Hoedeman discusses the possible impact of IFRS 15 on the energy business of a multinational corporation
x Robert Klijn and Marcel Schulze show how stock exchanges contribute to sustainable businesses
x Nanne Brunia and Wim Westerman present a case on valu-ining a European energy firm
ISSN: 2211-8691 http://www.centerforenergyandvalue.org/publications.html

ii
CEVI/ Energy and Value Issues Board
Board members Özgür Arslan-Ayaydin, University of Illinois, Chicago, USA
André Dorsman, VU University Amsterdam, The Netherlands
Mehmet Baha Karan, Hacettepe University, Ankara, Turkey
John Simpson, J. Simpson & Associates, Perth, Australia
Wim Westerman, University of Groningen, The Netherlands
Advisory board member Ephraim Cark, SKEMA Business School, Lille, France
Editorial Policy The Energy and Value Letter brings together academics and practitioners worldwide to dis-cuss timely valuation issues in the energy sector. It publishes news from the Centre for Ener-gy and Value Issues (CEVI), its linked organizations and others (including calls for papers), columns on topical issues, practitioners’ papers: short articles from institutions, firms, con-sultants, etcetera, as well as peer-reviewed academic papers: short articles on theoretical, qualitative or modeling issues, empirical results and the like. Specific topics will refer to en-ergy economics and finance in a broad sense. The journal welcomes unsolicited contribu-tions. Please e-mail to [email protected] (Wim Westerman), a copy of a news item, col-umn or a completed paper. Include the affiliation, address, phone, and e-mail of each author with your contribution. A column or news item should not have more than 400 words and a paper should not exceed 3,000 words, albeit that occasionally larger articles can be accepted.
2
Preface to the special edition
Mehmet Baha Karan
Vice-President of CEVI
Hacettepe University, Ankara, Turkey e-mail: [email protected]
CEVI offers a platform for energy-related articles in the financial economics area. In our books we strive for publishing rigorous articles that are rather mono-disciplinary oriented. However, we wel-come e.g. in our conferences contributions that go beyond energy issues per se, focus on accounting, legal, policy and other themes and use rather descriptive methodologies. The Energy and Value Letter (EVL) is our outlet that takes on a broad perspective. As it matters, the EVL is happy to have received three articles with a special flavor, which I am happy to present to you in this special edition. In May 2014, the IASB issued the new revenue recognition reporting standard IFRS 15. Hoedeman assesses the impact of the new standard on Siemens’ Power Generation and Wind Power business units. IFRS 15 contains a completely new 5-step model for revenue recognition. Several aspects in this model can have a significant impact on timing and amount of revenue, but also on business prac-tice and contracts. Moreover, various other impacts can be expected. The impacts can be substantial and ask for intensive preparations. I hope that this very timely article provokes much further research. Klijn and Schulze discuss how stock exchanges contribute to more sustainable business and how this affects companies in the energy sector. The Sustainable Stock Exchange (SSE) initiative by the Unit-ed Nations stimulates stock exchanges to apply sustainability principles. The authors present the measures that have already been undertaken as an outcome of the SSE efforts and how the various stock exchanges worldwide have put forward various sustainability policies aimed at the stock market participants. Personally, I am happy to note that my home country Turkey is doing well in this respect and that the Istanbul Stock Exchange is well-positioned to reach a world class level in this respect. Brunia and Westerman study the case of a large Dutch firm. Multi-level regulation issues and energy market developments make articles like this one interesting. Key value drivers discerned are growth of revenues (prices x volumes), earnings before interest, depreciation and amortization margins to net sales margins (“EBITDA margins”), capital expenditures (“CAPEX”) and costs of capital. A check-list shows, in a sector specific way, a vast number of relevant inputs for a transaction valuation. I look forward to see applications (and very likely also alterations) of the framework to timely cases. Now let me take the opportunity to thank our reviewers. All of the (lengthy) articles were reviewed by three or four experts. Their advices helped to ensure the quality of the articles presented in this special edition. Whilst their names cannot be revealed here, I trust they accept my appreciation of their efforts this way. Of course, I would also like to thank the authors for their fine contributions and swift cooperation to enable a rapid publication of this special issue. I end this foreword by thanking Wim Westerman, who normally edits the EVL, for his organisational help.

3
Revenue recognition regulation (IFRS 15): the impact on Siemens’ energy business
C.R. (Christian) Hoedeman1 [email protected]
Abstract In May 2014, the IASB issued the new revenue recognition reporting standard IFRS 15. This study assesses the impact of the new standard on Siemens’ Power Generation and Wind Power business units. IFRS 15 contains a completely new 5-step model for revenue recognition. Several aspects in this model can have a significant impact on timing and amount of revenue, but also on business prac-tice and contracts. Moreover, other impacts include more extensive disclosure and presentation re-quirements, possible impacts on tax-planning, sales incentives, and key-financial ratios, as well as adjustments that have to be made to internal control, IT systems and processes. The impacts can be substantial and ask for intensive preparations. JEL classification: M40, M41, M42 Keywords: IFRS 15, Accounting standard, Revenue recognition, Siemens
1 This study would not have been possible without the time and dedication of the Siemens business unit inter-viewees, Redelf-Dietrich David, Ralph ter Hoeven, members of Siemens’ Accounting & Controlling depart-ment and others. The author remains fully responsible for any mistakes and omissions, however.
4
1. Introduction Revenue is a primary part of the financial statement of any firm and is especially crucial when being assessed on financial performance. Accounting regulations for recognising and measuring revenue are developed by the International Accounting Standards Board (IASB), by way of International Finan-cial Reporting Standards (IFRS). In May 2014, the IASB completed IFRS 15, ‘Revenue from Con-tracts with Customers’. The new standard replaces current standards such as IAS 11 ‘Construction contracts’ and IAS 18 ‘Revenue’. IFRS 15 could entail deviations in corporate financial statements and thus in reported financial performance, because of deviations in amounts and timing of revenue relative to current accounting practice. IFRS 15 was intended to be effective from the 1st of January 2017 onwards, but the IASB decided to defer the effective date to the 1st of January 2018. Siemens A.G., dating back to 1847, is a large conglomerate, active internationally and in various in-dustries and listed on German and Swiss stock exchanges. Siemens has set up an internal project or-ganization to assess the impact and coordinate the implementation of IFRS 15. Various financial, IT and juridical functions from central and regional teams, as well as in local business units are working together with business partners and auditors to ensure a consistent and sustainable implementation and transition process. The focus of this study lies on Siemens Nederland N.V., the firm’s Dutch enti-ty. The main research question is: “How does the new standard for revenue recognition, IFRS 15, affect Siemens’ energy business units?” The results of this study can likely also be used by other firms facing likewise consequences from IFRS 15. IFRS 15 is often regarded as one of the biggest accounting changes in over a decade of time. Thus, IFRS 15 is a hot topic in accounting departments and auditing firms at this moment, but a simple bul-let-list of impacts is not possible to create, IFRS 15 requires a fresh sheet of paper as it uses new ter-minology, a new model and untried judgments (Davies, 2015). This new model consists of five steps where sequentially a contract with a customer is identified, performance obligations are identified in the contract, the transaction price is determined, the transaction price is allocated to the performance obligations and the performance obligations are satisfied. The steps are designed to enable the stand-ard to cover the most simple but also the most complex contracts with customers in all industries. All of the steps hold various aspects that could require deviations in accounting practice. The main objective of this research is to deliver a clarification of the implications of IFRS 15 on Sie-mens’ current and future business transactions. These business transactions relate to the sale of goods and services to customers and thus the impact on the profit and loss accounts of Siemens. This im-plies that it is necessary to know how the business transactions and contracts of Siemens are set up. Business unit interviews helped to identify types of business transactions that are affected by the new standard. They were followed by an in-depth analysis, incidental example calculations and expert interviews. Important impacts are likely to occur in construction contracts or multiple-element con-tracts. Therefore, the business units Compressors, Healthcare, Mobility, Power Generation and Wind Power were studied, of which the latter two units are singled out in this article. It becomes apparent that the distinctness of performance obligations, ‘penalties for Siemens’, and ‘uninstalled materials’ could result in a significant deviation in current account practice and a differ-ence in timing or amount of revenue recognition. Other areas of impact from IFRS 15 include direct effects from changes in revenue, such as changes in key financial ratios, sales incentives and bonus-plans as well as tax strategies and planning. Moreover, IFRS 15 requires significantly more from enti-ties regarding the disclosure of information and presentation. In general, it is argued that IFRS 15 provides more guidance than current standards and requires more judgment. The harmonisation of accounting standards between the FASB and IASB is regarded as a major achievement, but the real work for firms such as Siemens has just started. The remainder of this article is organized as follows. First, an overview of the available academic literature and guiding documents regarding the implications of IFRS 15 is presented in section 2. Next, the research methodology and data are described in section 3. In section 4, the business unit

5
interview results are provided. These results are analysed per step and discussed with experts in sec-tion 5. Section 6 presents a description of other implications of IFRS 15 and the IFRS 15 implementa-tion process within Siemens. The article is ended with conclusions and recommendations in section 7.
2. Literature Review IFRS 15 ‘Revenue from Contracts with Customers’ and Topic 606 are the result of a joint project of the IASB and the Financial Accounting Standards Board (FASB) to improve the financial reporting standards under the IFRS and the US Generally Accepted Accounting Principles (US GAAP) (IASB, 2014a). IFRS 15 is more principle-based opposed to the rules-based current US GAAP standards (Bloom and Kamm, 2014). Further, IFRS 15 uses an assets and liabilities approach opposed to an earnings process model (Biondi et al., 2014). This earnings process model has led in the US alone to more than 200 specific requirements related to revenue recognition of which much is industry specific and often conflicting (Bloom and Kamm, 2014; IASB, 2007). With the new revenue recognition standard, the IASB succeeded to get closer to overall harmonization of accounting standards. The new requirements are aimed to enable financial statement users to understand the nature, amount, timing and uncertainty of revenue and cash flows (KPMG, 2014a). IFRS 15 supersedes the following standards; IAS 11 ‘Construction Contracts’, IAS 18 ‘Revenue’, IFRIC 13 ‘Customer Loyalty Pro-grammes’, IFRIC 15 ‘Agreements for the Construction of Real Estate’, IFRIC 18 ‘Transfers of Assets from Customers, and SIC-31 ‘Revenue-Barter Transactions Involving Advertising Services’ (IASB, 2014b §IN3), and is believed to have more guidance on revenue topics than the old standards com-bined (BDO, 2014a). The core principle of IFRS 15 is: “an entity recognises revenue to depict the transfer of promised goods or services to customers in an amount that reflects the consideration to which the entity expects to be entitled in exchange for those goods or services.” (IASB, 2014b). In this principle some defini-tion of revenue is needed: “Income arising in the course of an entity’s ordinary activities.” (Ibid), where ‘income’ is: “Increases in economic benefits during the accounting period in the form of in-flows or enhancements of assets or decreases of liabilities that result in an increase in equity, other than those relating to contributions from equity participants” (Ibid) and a customer’ is: “A party that has contracted with an entity to obtain goods or services that are an output of the entity’s ordinary activities in exchange for consideration.” (Ibid). What is left is an explanation of ‘ordinary activities’. This term is not defined by the IASB and this led to critics by Nobes (2012; 2014), who stated that definitions of the IASB results in problems and even has said to contain errors. However, the IASB explicitly noted not to reconsider the definitions as part of the project around IFRS 15 (IASB, 2014a). The scope of the IFRS 15 is applicable to all contracts with customers (Devonish-Mills, 2014). The IASB (2014a) distinguishes the contracts to be accounted under IFRS 15 and the contracts that should be accounted under other reporting standards. Collaborators and business partners are examples that are not considered as customers under IFRS 15 (Devonish-Mills, 2014). Furthermore, contracts with customers related to leases, insurance, and rights or obligations are in the scope of financial instru-ments guidance, and thus not within the reach of IFRS 15 (KPMG, 2014a). IFRS 15’s core principle enables an entity to recognise revenue over time or at a point in time by applying five steps (IASB, 2014b; KPMG 2014a). The main steps in the ‘5-step model’ (Deloitte, 2014a; EY, 2014b; KPMG, 2014a) are abbreviated:
- Step 1: Identify the contract(s) with a customer; - Step 2: Identify the performance obligations in the contract; - Step 3: Determine the transaction price; - Step 4: Allocate the transaction price to the performance obligations in the contract; - Step 5: Recognise revenue when (or as) the entity satisfies a performance obligation.
6
The five steps used in IFRS 15 can be delineated further as described by various advisory firms. An overview is available with the author upon request. Furthermore, as the 5-step model forms the basis of IFRS 15, these steps are used as a frame in several other parts of this study.
3. Methodology The research method used is an exploratory case study regarding one firm, Siemens Nederland N.V. The case study of Siemens can give a picture of what the impact of the new accounting standard can be for likewise firms. Initially, a literature review was performed on the new standard, IFRS 15, and guiding documents from auditing firms (e.g. EY, 2014a; Grant Thornton, 2014; KPMG, 2014a). This enabled to gain a solid base of knowledge about the possible impacts of the new standard. Subse-quently, several business unit controllers of Siemens were interviewed. The business unit controllers were selected on basis of where the most impact of IFRS 15 was expected because of expected com-plexity and length of contracts in these business units. Upon advice of the Head of the department Accounting & Controlling of Siemens, the business units Compressors, Healthcare, Mobility, Power Generation and Wind Power were studied (the latter two are focussed upon here). Semi-structured interviews were held to obtain information about the business units itself, the types of their contracts, a rough indication of the contract contents and their background, as well as the impli-cations for current accounting practice. The interview sessions contained a presentation of the main findings from the literature review. These often resulted in a discussion from where valuable insights into what aspects from IFRS 15 will be important were gained. In the sessions with the business unit controllers, the interviewees pointed out similar concerns regarding the impact of IFRS 15. Also, the author was involved in live meetings of a regional project team and he received information from Siemens’ central team. This triangulation process (Yin, 2014) provides indications or information with more robustness while reducing the risk of systematic biases (Maxwell, 2005). Following, the concerns of the business unit controllers, as indicated in the interviews, were studied in depth by using IASB documents (i.e. IASB, 2014a; IASB, 2014b) and guiding documents from auditors (e.g. EY, 2014a; Deloitte, 2014b; Grant Thornton, 2014). Also, the results were compared with results from other studies. Incidental calculations showed the possible direction and magnitude of the accounting standard changes. The results were discussed in meetings with the Head of Ac-counting & Controlling of Siemens and an auditing firm partner who is also Professor in Financial Accounting. With these persons, discussions were held to obtain knowledge on the weight of the as-pects and to get valuable insights from both business and auditing. In this way the impact of the as-pects could be assessed, as the analysis results were directly reflected to issues that are present in practice. Data for this study mainly comes from the new standards itself and related documents from the IASB (e.g. IASB, 2014a; IASB, 2014b). Other information comes from external sources which are mainly the Big Four and other auditing firms (e.g. EY, 2014a; Deloitte, 2014a; KPMG, 2014b). The remain-ing data from this study comes from internal sources within Siemens. A major part of this study was written on two Siemens locations and interviews were conducted at the spot. The key financial staff invited for the business unit interviews consisted of CFO’s or business unit controllers. They will hereafter be referred to as the business units. The interviewees were welcomed to invite other people to the interviews. All meetings were attended by both the Head of Accounting & Controlling of Sie-mens and the author. The interviews were pre-run and conducted in a semi-structured form.
4. Business unit interview results In the interviews, the business units were questioned to be able to construct an overview of what type of business transactions are common in the business units, what kind of contracts are related to those transactions and how the business units currently account for revenue. An overview of the categories of transactions that are mainly used in the energy business units is given in Table I.

7
Table 1. Business transactions of the business units categorised by accounting standards.
Business units Sale of Goods
(IAS 18) Rendering of Ser-
vices (IAS 18)
Long-term con-tracts - POC
(IAS 11)
Multiple-Element Arrangements
(MEA) Power Genera-tion 25% 25% 25% 25%
Wind Power 100% The figures are not exact. The Percentage-Of-Completion (POC) method is a recognition method for revenue often used in construction contracts.
4.1. Power Generation The session with the business unit Power Generation was held in two parts, which were attended by the Business Unit Controller and a Business Controller. The business unit consists of separate units, a unit for service and a unit for ‘new business’. The service department accounts for all service and maintenance on steam turbines, gas turbines and compressors. The product competence centre (PCC) informs the business unit that certain equipment needs service and subsequently the PCC develops the quotation and carries out the work, while the business unit will add a mark-up and additional activi-ties as the business unit holds the sales rights in the Netherlands from Siemens A.G. The additional activities that the business unit performs are mainly project management and coordination. The ser-vice contracts, called long-term service-agreements (LTSA’s), have a very long-term horizon, some-times up to 25 years. The maintenance can be either corrective or preventive and is directed from a location in Germany. Next to the service contracts, larger projects, multiple-element arrangement type contracts and smaller spare part orders are also run through the business unit in the Netherlands. As the business unit is the regional entity for Siemens Power Generation in the Netherlands, all the contracts in the Netherlands are run through it. The service contracts are either accounted for as POC or using the straight-line method, depending on the size of the contract. The work is mainly executed by the PCC’s, but the business unit in the Netherlands takes all the costs and accounts for the external revenue. Customers of the long-term service contracts could order spare-parts or additional services during the contract-term, this is currently booked as a change order. As a result of customer machines operating less than expected, they regularly want to revise their LTSA’s such that the same volume is spread over a longer period. Thus in Step 1, it is indicated that contract modifications are interesting for this business unit. Variable consideration was indicated as an interesting aspect in Step 3, as the LTSA’s of the business unit contain price escalation clauses on basis of material or salary indexes. The following Steps, 4 and 5, contained no interesting topics for the business unit Power Generation.
4.2. Wind Power The session with the business unit Wind Power was held with the Business Unit Controller of the business unit Wind Power. The controller indicated to have an accountancy background and he had already explored IFRS 15. The business unit Wind Power consists of three parts, Wind Power On-shore and Offshore, and a Service unit which accounts for both Onshore and Offshore service activi-ties. Contracts are divided in contracts that are for building wind farms and contracts that are for maintenance of the parks. The turbines are delivered in batches and transfer of ownership occurs at acceptance of the customer. Current examples of projects for the business unit Wind Power are the Gemini Project, which is with an order value of more than € 1.5 billion for Siemens one of the largest offshore wind farms in the world (Siemens Nederland N.V., 2014a), and the Westermeerwind project, a turn-key project for Siemens which makes it a complex contract (Westermeerwind, 2013). The business unit projects are accounted for under the POC method, more specifically the cost-to-cost method. The turbines come from Siemens Denmark as the sub-supplier of the main contractor, Sie-mens Nederland. Of the two revenue streams, internal and one external, Siemens Nederland N.V. accounts for the latter. Deliveries from Siemens Denmark go almost directly through to the customer.
8
In large turn-key projects, Siemens delivers not only the turbines, but also the substations, cables and foundations. In these projects, transferral of ownership and risk occurs at the end of the project. Sie-mens has external sub-suppliers in these contracts. Other contracts are service contracts, which are also split, with Siemens Denmark being responsible for broken parts and Siemens Nederland handling maintenance and repairs. For service contracts, the business unit makes estimates on basis of histori-cal data and accounts for revenue on basis of POC. Another interesting part of the service contracts is that the invoices are based on energy production of the turbines. Therefore invoiced amounts are de-pendent upon wind, but most important, availability of the turbines. Consequently, consideration is variable. For Step 1, the business unit noted that the difficult part in this step is not really identifying a con-tract, but identifying additional work. Additional work makes it difficult because it is often based temporarily on an oral agreement and what the business unit can or cannot do in that situation is based on management judgment. The ‘distinct’ aspect in Step 2 remained unclear. A complete wind farm includes turbines, cables, subsystems, project management, engineering and more. It was diffi-cult to assess whether the total project should be seen as one performance obligation or whether there are separate obligations. In Step 3 it became clear that in its contracts, the business unit has to deal with advance payments which are longer than one year in advance. Another interesting aspect is penalties that are to be paid by the customer due to possible delays they can cause. In such cases the performance of Siemens does not change, but the payment they get is more. The question here is, “Should it be accounted for as a reduction in cost or as an increase in revenue?” And, “When should they recognise this?” The wind farms are almost always built on the customer’s site, this would possibly mean that the business unit could generate revenue over time as “the entity’s performance creates or enhances an asset (for example, work in progress) that the cus-tomer controls as the asset is created or enhanced (…)” IASB (2014b §35). However, the question remains as to what extend the customer controls the turbines in the project execution phase.
4.3. Additional remarks Prominent examples of concern are when contracts are to be combined and how to deal with contract modifications in Step 1, significant financing components and variable consideration (e.g. penalties for Siemens) in Step 3, and uninstalled materials and an enforceable right to payment in Step 5. Whether a performance obligation is distinct is an area of concern. This is not surprising as the use of these terms are new and the assessment is highly judgmental and bound to create debates (Davies, 2015). Further, the new terminology and the new model used in IFRS 15 created discussions among business units. Major aspects of concern are summarised for the two energy business units in Table 2. Table 2. Aspects identified by business units as potentially having impact. Business units Step 1 Step 2 Step 3 Step 4 Step 5
Power Generation
- Combinations of contracts - Modifications of contracts
- Distinct .- Variable consideration .(general)
Wind Power
- Modifications of contracts
- Distinct .- Significant financing .component .- Variable consideration .(general) .- Variable consideration .(penalties for Siemens) .- Variable consideration .(penalties for the .customer)
.- Uninstalled materials .- Performance obligations satisfied .over time (enforcea-ble right to payment)

9
5. Analysis and discussion The aspects of concern as indicated by the business units in the interviews are compared with findings from auditing firms and analysed in depth to give a complete understanding of the topics at hand.
5.1. Main aspects of concern: Step 1 In Step 1, the main question is whether a contract modification should be accounted for as a modifica-tion to the existing contract or as a separate contract. According to EY (2014a), IFRS 15’s regulations on contract modifications are relatively consistent with the regulations in IAS 11 but they are new in comparison with the regulations in IAS 18. Thus, the regulations are similar to the regulations cur-rently for construction contracts, however, they should now be used for every contract with a custom-er (Davies, 2015). The new regulations in IFRS 15 could result in a significant change in patterns of revenue recognition (BDO, 2014b). The aspect ‘combination of contracts’ holds a similar story, cur-rent practice is relatively similar to the guidelines in IFRS 15 (EY, 2014a). EY (2014a) further indi-cates that entities may need to combine contracts under IFRS 15 where they currently do not, because of the lack of guidance regarding this topic in IAS 18. In the last criterion to assess whether a contract with a customer exists, an entity needs to consider collectability, or customer credit risk, which concerns the customer’s ability and intention to pay (IASB, 2014b). This aspect goes beyond the contractual agreements with the customer. BDO (2014a) indicates that IAS 18 includes a similar but softer criterion. PwC (2014) notes that the term ‘probable’ is defined differently in IFRS 15 and current practice, but EY (2014a) indicates that the terms ‘proba-ble’ and ‘more likely than not’, for IFRS 15 and current IFRS respectively, are similar. Moreover, most auditing firms do not expect a significant impact in practice relating to this aspect (cf. EY, 2014a; KPMG, 2014a).
5.2. Main aspects of concern: Step 2 The ‘distinct’ aspect created discussions in the interviews held with the business units. This aspect is used to determine whether a good, service or a combination of these is a performance obligation, a new term which is according to Davies (2015): “essentially a discrete component of the overarching deliverable”. IFRS 15 gives indicators rather than criteria for entities in defining performance obliga-tions (PwC, 2014). Identifying the performance obligations is likely to be complex and in itself huge-ly judgmental (Davies, 2015). Davies (2015) further indicates that it is bound to create debates, which was confirmed the sessions with the business units. The before mentioned notifications could be the reason for the IASB to decide to add illustrative examples to IFRS 15 regarding identifying perfor-mance obligations (IASB, 2015).
5.3. Main aspects of concern: Step 3 An entity needs to adjust the amount of consideration when the contract contains a significant financ-ing component (KPMG, 2014a). Payments in arrears will result in interest income and a reduction in revenue while advance payments will result in interest expenses and an increase in revenue (BDO, 2014b). The guidance in IFRS 15 is different than current regulations related to how to apply the time value of money aspect (PwC, 2014). BDO (2014a) indicated that this could result in a significant change in practice for some entities. Thus, regulations regarding financing components in contracts could differ from how entities currently account for them. Variable consideration is another interesting topic in Step 3. Variable consideration can come in vari-ous forms such as discounts, refunds, price concessions, penalties, bonuses and more (Grant Thornton, 2014). In determining the transaction price, an entity needs to estimate the portion of varia-ble consideration (IASB, 2014b). The estimation of the variable amount could provide a significant change for some entities when they are currently deferring revenue until an outcome is certain (Da-vies, 2015). In the interviews, the business units indicated that they are rather conservative in making judgments, in this case, it is possible that Siemens can recognise revenue earlier under IFRS 15 than under current practice.
10
An interesting sub-topic of variable consideration is penalties. Penalties are also considered as a part of variable consideration (IASB, 2014b) and penalties for Siemens should be reduced from revenue. The business units indicated in the interviews that currently they account for penalties as expenses. Thus, penalties in IFRS 15 are to be significantly differently accounted for under IFRS 15 than under current practice. An example of a project with penalties calculated under IFRS 15 and current practice is available with the author upon request. The figures show that the profits absolute figures stay equal, however, the profits as percentage of revenue are quite different. It is interesting that the guiding doc-uments from the large accounting firms (e.g. Deloitte, 2014b; EY, 2014a; KPMG, 2014b) do not clearly point out this difference. Penalties for the customer should also be considered as a part of var-iable consideration but these will arguably be harder to estimate.
5.4. Main aspects of concern: Step 4 Discounts in multiple-element arrangements are an interesting topic for the business unit Healthcare, which is not singled out here. An entity may allocate discounts to some, but not all, performance ob-ligations when certain criteria are met (IASB, 2014b). EY (2014a) points out that this ability is a sig-nificant change from current practice. PwC (2014) states that a contract needs to have at least three performance obligations to apply for this. This modus operandi is only possible when the entity has observable evidence of the obligations to which the entire discount belongs (Grant Thornton, 2014). Thus, deviation from current practice is possible, but only when certain criteria apply.
5.5. Main aspects of concern: Step 5 The business unit Wind Power indicated that their performance obligations would often be satisfied over time because “the entity’s performance creates or enhances an asset (for example, work in pro-gress) that the customer controls as the asset is created or enhanced (…)” IASB (2014b). As the wind turbines are delivered in batches, it could be that the customer gains control of the asset (the wind farm), as it is created or enhanced. The question that remains is whether the customer obtains control, i.e. obtains benefits from the asset (IASB, 2014b) and thus to what extent the customer can benefit from the delivered batch. EY (2014a) indicates that contracts could also contain clauses indi-cating that any work-in-progress is owned by the customer. Performance obligations can be satisfied over time because: “the entity’s performance does not create an asset with an alternative use to the entity (…) and the entity has an enforceable right to payment for performance completed to date (…)” IASB (2014b). An example of a good that would have no alternative use to the entity is a good that would need significant rework to make it sellable to another customer (IASB, 2014a). Other factors that could lead to that conclusion are contractual restrictions, protective rights and other specific asset characteristics (KPMG, 2014b). However, the criterion also requires the business unit to have an enforceable right to payment. For the enforceability part, the business unit should consider the contractual terms, as well as any overriding legislation or legal precedents (Grant Thornton, 2014). Deloitte (2014b) mentioned that under this criterion, recognition of revenue will depend on specific terms of the contract. The enforceable right to payment is included because it is a good indicator that the customer can ben-efit from the performance completed to that date (Davies, 2015). Thus, when a business unit wants to recognise revenue over time (IASB, 2014b), it should consider its contractual terms in setting up its contracts to have an enforceable right to payment for performance completed to date. This right to payment should be for an amount that compensates the entity for its performance completed to date in the event that the contract is terminated for other reasons than the entity’s failure (IASB, 2014b). The IASB (2014b) further indicates that the amount should enable the entity to recover its cost in-curred plus a reasonable profit margin. Thus, the entity should include terms in their contracts to ena-ble it to have an enforceable right to payment from the customer. These terms need to be aligned with the customer and the customer would most often want to have these terms aligned to the performance

11
of the entity, as a willingness to pay from a customer for the performance completed to date indicates that the customer has benefit from that performance (EY, 2014a). Lastly, uninstalled materials are identified as an interesting topic in Step 5. These materials are con-sidered to be not proportionate to the entity’s progress in satisfying a performance obligation (IASB, 2014b; KPMG, 2014b). In such cases, a faithful depiction of the entity’s performance might be to recognise revenue to an amount equal to the costs (IASB, 2014b). This while using the POC-method of IAS 11, those costs would not be included in the costs incurred to date (IASB, 1993). A scenario analysis, available with the author upon request, showed a significant difference in reported perfor-mance under IFRS 15 and IAS 11 considering the transaction price. However, under IAS 11, future years would hold higher revenue than under IFRS 15 to rectify this difference.
5.6. In general The above findings confirm the argument of Nobes (2014) that most interesting new ideas are found in Steps 2, 3 and 5. Moreover, the business unit Wind Power shows impacts in nearly the same steps as KPMG (2014b) expects (i.e. Step 1, 3, and 5). More commonalities are found when looking at the ‘Building and construction’ industry which would arguably have similarities to the business unit Wind Power, there, KPMG (2014b) expects impacts in Steps 3 and 5. The business unit Power Gen-eration differs somewhat in being impacted in the Steps 1, 2 and 3. Thus, findings from the interviews regarding the impacts of the different Steps in the 5-step model are in general consistent with current literature. Certain aspects within IFRS 15 indeed could have a significant impact on business.
5.7. Discussion with the Head of Accounting & Controlling and a Partner of Deloitte Two discussions complete the analysis, one with Redelf-Dietrich David, Siemens’ Head of the Ac-counting & Controlling department (hereafter: the Head) and one with Professor Dr. Ralph ter Hoeven RA, audit partner of Deloitte who is also a University Professor in Financial Accounting. These discussions were held to gain valuable and new insights from both business and an auditor on the results of this study. Further, in the discussion with the Head, the weight of the various aspects could be identified and the most important topics for Siemens are indicated and pointed out. Firstly, after reading the results of the study the Head quickly came to the conclusion that the impact of the penalties would be greatest for Siemens. According to the Head these penalties occur because Siemens is involved in a lot of highly innovative projects and new state-of-the-art projects. These projects contain penalty clauses for example for less performance and late delivery. The impact of IFRS 15 to the revenue of Siemens could be quite significant and reach high figures, but actual fig-ures cannot be provided and penalty amounts are not disclosed in Siemens’ financial reports. It is clear that a reduction in revenue could look like a business shrink which can result in negative reac-tions from investors. Therefore it will be essential for Siemens to quickly provide clarity and aware-ness to investors and other stakeholders about the impact of IFRS 15 on their financial figures. The second important aspect that was discussed is the enforceable right to payment and the ‘distinct’ aspect relating to performance obligations. The Head pointed out that a mistake in a contract could result in an impact on the profit and loss account. Further, to create an enforceable right to payment, contracts will need to be aligned with the customer to create such a right to payment. This means that Siemens must have a good relationship with the customer, and the customer must be aware of IFRS 15 and its demands. In developed countries this would probably not result in many problems, but the Head pointed out that in less developed countries it might be that customers care less about contracts, and will not see the benefit of having milestones included in the contract. Therefore, it could be diffi-cult to align the contract with the customer here. The question remains whether a customer will see a contract milestone as being beneficial, and thus whether he is willing to pay for that milestone. Other aspects like ‘uninstalled materials’ were also highlighted but would not have such a great im-pact as penalties will have. The performance obligations in IFRS 15 which are to be used in multiple-
12
element arrangements is not a new thing to Siemens as Siemens already uses US GAAP guidance to support their multiple-element accounting. Lastly, Professor Ter Hoeven, who has written several articles about the new standard, argued that because the old standards (i.e. IAS 18 and IAS 11) are principle-based, they are open for interpreta-tion which causes diversification in current accounting practice among firms. This means that the impact of IFRS 15 with regards to current practice could be different among firms. Whereas IFRS 15 provides more guidance than current standards, a significant amount of judgment is still needed. This can be seen particularly when considering whether additional work on an order needs to be accounted for as a separate contract or needs to be combined with the original one in Step 1, or when consider-ing which parts of a contract are ‘distinct’ in Step 2, how much variable consideration an entity will be entitled to, it’s monitoring and estimating values when no historic data is available in Step 3 and 4, and whether to recognise revenue over time or at a point in time in Step 5. Ter Hoeven pointed out that firms that want to recognise revenue over time under the criterion: “the entity’s performance does not create an asset with an alternative use to the entity (…) and the entity has an enforceable right to payment for performance completed to date (…)” IASB (2014b §35) need a termination clause in their contracts to ensure that they can recognise revenue for their performance (IASB, 2014). He further argued that a lot of businesses (e.g. construction firms) currently do not have these types of clauses in their contracts, indicating that businesses will significantly have to con-sider implementing these clauses in future contract negotiations.
6. Other areas of impact and Siemens’ internal process Although not the focus of this study, IFRS 15 has other areas of impact than impacts on recognition of revenue (amount and timing). These impacts come directly from differences in revenue recogni-tion, which can be differences in tax planning and sales incentives, but also indirectly such as changes in IT systems. Next to these areas of impact, IFRS 15 imposes additional requirements on disclosure and presentation. Alongside other areas of impact from IFRS 15, this section will describe the internal process of Siemens on the implementation of IFRS 15.
6.1. Disclosure and presentation Disclosure was often said to be a ‘bugbear’ for regulators, having not enough clarity and too much generic language (Davies, 2015). The disclosure requirements of IFRS 15 are much more detailed than under current IFRS (EY, 2014a). The citation below indicates this: “The objective of the disclosure requirements is for an entity to disclose sufficient information to enable users of financial statements to understand the nature, amount, timing and uncertainty of rev-enue and cash flows arising from contracts with customers. To achieve that objective, an entity shall disclose qualitative and quantitative information about all of the following: (a) its contracts with customers (see paragraphs 113-122); (b) the significant judgements, and changes in the judgements, made in applying this Standard to those contracts (see paragraphs 123–126); and (c) any assets recognised from the costs to obtain or fulfil a contract with a customer in accordance with paragraph 91 or 95 (see paragraphs 127–128)” IASB (2014b). EY (2014a) holds that IFRS 15 is based on the notion of contract assets and contract liabilities, these assets and liabilities are subject to an impairment analysis under IFRS 9 or IAS 39 and impairment profits or losses should be recognised immediately. The disclosure of information increases signifi-cantly under IFRS 15 (EY, 2014a; Deloitte, 2014b; KPMG, 2014a). Aarab, Bissessur and Ter Hoeven (2015) even argue that there is an excess of regulations with the new revenue standard. This is argua-bly one of the main reasons why some prepares of financial statements indicate that the costs exceed the benefits of IFRS 15 (Aarab et al., 2015). The new standard presents a single systematic procedure for presentation and disclosure approach instead of different approaches for different contracts under current IFRS (KPMG, 2014b).

13
The new disclosure and presentation requirements under IFRS 15 could require new systems, pro-cesses and internal controls (PwC, 2014). These effects on systems, processes and controls means that personnel from various functions need to be involved (Tysiac, 2014). The systems need to be able to cope with the information requirements under IFRS 15 and the way transactions are to be accounted for (EY, 2014a). The importance of IT for a project like this makes that linkages between Finance and IT are crucial to the implementation project (Tysiac, 2014). Furthermore, new controls or adjustments could be needed to address judgments and estimates, and to ensure ongoing regulatory compliance (EY, 2014a). This means that various functions within businesses need to capture information and document it properly, especially when it relates to judgment and estimates (KPMG, 2014b).
6.2. Impacts occurring because of changes in amount and timing of revenue recognition Changes in revenue recognition, i.e. timing or amount of revenue, have direct impact on key financial ratios, sales incentives, tax planning and more. Not only revenue, but also profit and thus various key financial ratios could be impacted by IFRS 15. The impacts on key financial ratios could affect a firm’s (loan) covenants (Demerjian, 2007; 2011). Deloitte (2014b) indicates that a potential impact of IFRS 15 could be the non-compliance of these covenants. KMPG (2014b) points out that entities may need to realign sales incentives and bonus plans to their corporate goals as staff bonuses and sales incentive plans could be affected. IFRS 15 can have implications for tax strategies and planning, while entities need to assess whether it is wise to adjust their transfer prices as well (EY, 2014a). An advice for firms is to closely communicate the expected impacts with stakeholders to the firm such as investor relations, regulators, audit committees and lenders (EY, 2014a, KPMG, 2014b). Au-dit committees could be a valuable source of information for the firm while investors could be affect-ed as the availability of profits for distribution (Deloitte, 2014b) and the ability to pay dividends in some jurisdictions could be affected (KPMG, 2014a).
6.3. Siemens’ IFRS 15 implementation process Siemens has internally set up a central project team to globally assess the implications of IFRS 15, adjust their internal financial reporting guidelines accordingly and to change processes and (IT) sys-tems to meet the requirements of the new standard. Coordination follows from the central team which means that they have set-up an online workspace for information and a global blue-print on IFRS 15 (counting up to 200 pages), provide trainings and organise live meetings to spread information. Next to the central team, regional teams are set-up and work close with the business units in the related region (e.g. region North-West Europe). The project teams consist of various finance functions which work together with IT specialists, busi-ness partners and Siemens’ auditor EY. Siemens’ has currently stretched its efforts around IFRS 15 because of the IASB’s proposed deferral of the new standard. Siemens started relatively early with the project teams to create awareness within the business units. Siemens tries to ensure a consistent implementation, IFRS 15 ‘readiness’, a centrally managed and sustainable transition process and au-dit alignment. It seems that Siemens will have a sufficient amount of time left to assess the implemen-tation, especially with the recent announced deferral. With this aspect in mind and Siemens’ well-organized project teams and planning, the firm seems to be on the right track for a successful imple-mentation of IFRS 15.
7. Conclusions and recommendations IFRS 15 is the new reporting standard for revenue recognition and will apply to all firms who report under IFRS or US GAAP (KPMG, 2014a). The standard was introduced in May 2014 and is consid-ered as one of the biggest accounting changes in over a decade of time (Crump, 2015). It uses new terminology and untried judgments which is the reason that a simple bullet list of differences of IFRS 15 to current practice is not possible to construct (Davies, 2015). Most impact in timing and amount of revenue recognised is expected in complex and long-term contracts such as construction contracts or contracts with multiple-elements (Davies, 2015; Grant Thornton, 2014).
14
The research question of this study is: “How does the new standard for revenue recognition, IFRS 15, affect Siemens’ energy business units?” This study attempts to assess the impact of IFRS 15 on Sie-mens, which is a multinational conglomerate that is active in various industries. The methodology used for this study is unique in its triangulation of literature and interviews. The methodology used in this paper can possibly also be used by future research on other new IFRS standards or by firms who did not start investigating the impact of IFRS 15 yet. Literature was obtained from the accounting standard itself, other documents from the IASB and guiding documents from various auditors. Interview meetings were held in the form of sessions with five business units of Siemens, of which Power Generation and Wind Power were singled out, and discussions with the Siemens’ Head of Accounting & Controlling and an audit partner from Deloitte. The interviews provided valuable insights into the daily practice of business and helped to construct an impact assessment. Even Siemens’ Head of Accounting & Controlling was sometimes unaware of the types of contracts that the business units have, which indicates the usefulness of interviews as a tool in this study. A main finding of this study is that contractual penalties are regarded as a reduction in revenue under IFRS 15, while under current accounting practice these penalties are accounted as costs. When the new revenue standard will be used by Siemens, this can result in a significant reduction of revenue. This finding is not clearly pointed out by any other study known to the author. Also, when an en-forceable right to payment is needed to be able to recognise revenue, an entity will need to align its contractual clauses closely with the customer. This could lead to problems when customers are un-willing to pay for a milestone in which they do not see the benefit for them. Costs for uninstalled materials are to be recognised as revenue on a zero-profit margin basis under IFRS 15 while under IAS 11 these costs are excluded from the POC calculation. This means that a change in timing of revenue recognition could occur and under certain conditions entities could be able to recognise reve-nue earlier. Contractual terms matter in all circumstances. Specific parts of the contracts can influence accounting practices under IFRS 15 and thus changes in amount and timing of revenue and impacts on financial reports, as indicated by KPMG (2014b). Thus, IFRS 15 can possibly impose significant differences regarding current accounting practice, but one should be aware that ‘current practice’ is not uniform for all firms. Changes in revenue recognition can alter a firm’s key financial ratios. This means that IFRS 15 can have impact on sales incentives, bonus plans, (loan) covenants, tax planning/strategy and a firm’s rating from rating agencies and banks. Case-wise calculations, sensitivity analyses, and also later event studies, may show the direction and magnitude of these impacts. Another important aspect of concern in IFRS 15 is its extensive disclosure and presentation requirements. The disclosure require-ments and impacts from changes in financial ratios should not be underestimated and could result in significant costs and necessary changes in internal controls and IT systems (EY, 2014a; Aarab et al., 2015). Further research may show these effects and may also help to find ways for efficient imple-mentations. With IFRS 15, the IASB and FASB have succeeded to issue a converged accounting standard on one of the most important measures in financial reports. In general the standard is considered to provide more guidance than the old standards (BDO, 2014a), but significant amounts of judgment remains needed. The new standard does not remain free from critics (Nobes, 2014; Aarab et al., 2015). Firms are advised to quickly and clearly communicate the expected impacts of IFRS 15 to investors and other stakeholders of the firm (EY, 2014a; KPMG, 2014b). In the case of communicating expected impacts of IFRS 15, and especially in cases where significant impacts to key financial figures occur (what penalties could be for Siemens), behavioural aspects have to be taken into account, such as connotative meaning, cognitive style (Weißenberger and Holthoff, 2013) and message framing (Tian and Zhou, 2015).
15
Although this study is believed to provide valuable insights into the impact of IFRS 15, there are some limitations to this study and possibilities for future research. Within the business units of Sie-mens, a selection was made on the basis of where most impact is expected. Thus, additional research on the business units and industries left out from this study is needed. Davies (2015) and Grant Thornton (2014) indicate that most impacts are expected for entities with complex construction con-tracts and multiple-element arrangements. But as this study focuses on business units with only these types of contracts, impacts in relatively simple contracts could be overlooked. It is not safe to assume that the simpler contracts are free of any changes in practice (Davies, 2015). Thus, future research could give more insights in the impacts that occur in the relatively more simple types of contracts. Furthermore, it is advised for future research to provide illustrative examples and simulations to sup-port conclusions. These exercises help making the expectations of impact tangible and provide prac-tice with a handhold. Aarab et al. (2015) indicate that with IFRS 15, moved is from a profit- and loss approach to a bal-ance-sheet approach in reporting. In the past a move to the balance-sheet approach has led to a de-cline in the usage of balance sheet covenants (Demerjian, 2011). Some preparers of financial state-ments argued that the costs of IFRS 15 will exceed the benefits (Aarab et al., 2015). Future research could analyse ex post the costs and benefits of IFRS 15, but it must be acknowledged that the benefits will be difficult to estimate. Future research could also give insights in what communication strategy is best to use when communicating impacts of IFRS 15, or any other new accounting standard, to shareholders. Firms which have many contracts with penalty clauses could be used to assess which communication strategy softens shareholders’ reaction to negative news, enhancing knowledge on behavioural accounting regarding management communication strategy and message framing. 8. References Aarab, H., Bissessur, S., and Ter Hoeven, R.L., 2015. Percepties van opstellers van de jaarrekening op de kosten en baten van IFRS 15: Revenue From Contracts With Customers. [Perceptions of pre-parers of financial statements on the costs and benefits of IFRS 15: Revenue From Contracts With Customers] Maandblad voor Accountancy en Bedrijfseconomie, 89(1/2): 18-27. BDO, 2014a. IFRS In Practice – IFRS 15 Revenue from Contracts with Customers. Retrieved Febru-ary 25, 2015, from http://www.bdointernational.com/Services/Audit/IFRS/IFRS%20in%20 Prac-tice/Pages/default.aspx BDO, 2014b. IFRS Industry Issues – IFRS 15 Manufacturing. Retrieved May 8, 2015, from http://www.bdointernational.com/Services/Audit/IFRS/IFR-Bulletins-2011/Pages/default.aspx Biondi, Y., Tsujiyama, E., Glover, J., Jenkins, N.T., Jorgensen, B., Lacey, J., and Macve, R., 2014. ‘Old Hens Make the Best Soup’: Accounting for the Earning Process and the IASB/FASB Attempt to Reform Revenue Recognition Accounting Standards. Accounting in Europe, 11(1): 13-33. Bloom, R., and Kamm, J. 2014. Revenue Recognition – How We Got Here and Where it Will Take Us. Financial Executive, Summer 2014. Crump, R., 2015. IFRS Foundation calls for delay to revenue recognition. Accountancy Age. Re-trieved May 7, 2015, from http://www.accountancyage.com/aa/news/2405049/ifrs-foundation-calls-for-delay-to-revenue-recognition Davies, A., 2015. Revenue recognition: the countdown to IFRS 15. Retrieved May 6, 2015, from https://www.accountancylive.com/revenue-recognition-countdown-ifrs-15 Deloitte, 2014a. IFRS 15 - Revenue from Contracts with Customers, <http://www.iasplus.com/en/standards/ifrs/ifrs15>. Deloitte, 2014b. IFRS in Focus – IASB issues new Standard on revenue recognition. IFRS Global office – www.iasplus.com. Demerjian, P.R., 2007. Financial Ratios and Credit Risk: The Selection of Financial Ratio Covenants in Debt Contracts. Financial Accounting & Reporting Section (FARS) Meeting Paper. Demerjian, P.R., 2011. Accounting standards and debt covenants: Has the “balance sheet approach” led to a decline in the use of balance sheet covenants? Journal of Accounting and Economics, 52: 178-202.

16
Devonish-Mills, L., 2014. The New Revenue Recognition Standard. Strategic Finance, September 2014. EY, 2014a. A closer look at the revenue recognition standard. EYG No. AU2516 - www.ey.com. EY, 2014b. IASB and FASB issue new revenue recognition standard – IFRS 15. EYG No. AU2427 – www.ey.com. Grant Thornton, 2014. A shift in the top line – the new global revenue standard is here at last. IFRS News, June 2014 - www.gti.org. International Accounting Standards Board (IASB), 1993. International Accounting Standard 11 – Construction Contracts. IFRS Foundation. Retrieved February 4, 2015, from http://eifrs.ifrs.org/eifrs/UnaccompaniedIas International Accounting Standards Board (IASB), 2007. Information for Observers – Memo: An asset and liability approach (Agenda paper 4B). International Accounting Standards Board (IASB), 2014a. Basis for Conclusions on IFRS 15 Revenue from Contracts with Customers. IFRS Foundation. International Accounting Standards Board (IASB), 2014b. International Financial Reporting Stand-ard 15, Revenue from Contracts with Customers. IFRS Foundation. International Accounting Standards Board (IASB), 2015. Revenue from Contracts with Customers - Issues emerging from TRG discussions (Agenda Paper 7). IASB Update. Retrieved March 20, 2015, from http://media.ifrs.org/2015/IASB/February/IASB-Update-February-2015.html#3 KPMG, 2014a. First Impressions: Revenue from Contracts with Customers. Publication number: 131471 – www.kpmg.com. KPMG, 2014b. Issues In-Depth – Revenue from Contracts with Customers. Publication number: 131907 – www.kpmg.com. Maxwell, J.A., 2005. Qualitative research design: An interactive approach, 2nd ed. Applied Social Research Methods Series (Vol. 41) - Sage Publications. ISBN: 0-7619-2608-9. Nobes, C., 2012. On the definitions of Income and Revenue in IFRS. Accounting in Europe, 9(1):85-94. Nobes, C., 2014. IFRS 15: What’s the point of it? Wiley-Insight – IFRS. Retrieved May 6, 2015, from http://ifrs.wiley.com/news/ifrs-15-what-s-the-point-of-it PwC, 2014. Revenue from contracts with customers: The standard is final – A comprehensive look at the new revenue model. In depth No. INT2014-02 – www.pwc.com. Siemens Nederland N.V., 2014a. Siemens levert 150 windturbines voor grootste Nederlandse offsho-re windproject. [Siemens delivers 150 wind turbines for largest Dutch offshore windmill project] Retrieved April 29, 2015, from http://www.corporate.siemens.nl/nl/pers-nieuws/siemens-levert-150-windturbines-voor-grootste-nederlandse-offshore-windproject.htm Tian, Y., and Zhou, H., 2015. From bottom line to consumers’ mind: The framing effects of account-ing information. Accounting, Organizations and Society, 43: 56-66. Tysiac, K., 2014. Revenue Recognition: No Time to Wait. Journal of Accountancy, July. Weißenberger, B.E., and Holthoff, G., 2013. Cognitive style and connotative meaning in management accounting communication. Journal of Management Control, 24(1): 1-25. Westermeerwind, 2014. Westermeerwind contracteert Siemens voor turnkey bouw. Retrieved April 29, 2015, from http://www.westermeerwind.nl/westermeerwind-contracteert-siemens-voor-turnkey-bouw-buitendijkse-deel-windpark-noordoostpolder/ Yin, R.K., 2014. Case Study Research – Design and Methods, 5th edition. Sage Publications.
17
Sustainable Stock Exchanges
Robert Klijn
ESG specialist Fair Impact
Sweelinckstraat 7 1962 BH Heemskerk
The Netherlands tel. +31 6 525 877 25
Marcel Schulze
Managing Director Tradinfo PO Box 197
2270 AD Voorburg The Netherlands
+31 6 24 869 475 [email protected]
Abstract How do stock exchanges, in their role as facilitators and owners of the world’s largest money plat-forms, contribute to more sustainable businesses and what is their effect on companies in the energy sector? We show how stock exchanges, who strive to attract and control capital flows to their own platforms by applying free market principles, realize that sustainability is an inevitable way of how markets in the 21st century should be aligned in the long run. Creating a level playing field is one of the conditions to make progress in this area; another is the changing attitude of shareholders. E.g. pension funds and insurers could stimulate with their invest-ment policies the companies in which they are invested and those on the short-list, to more transpar-ency on how they have integrated sustainability. The Sustainable Stock Exchange initiative, launched by the United Nations, and thus at the highest intergovernmental level, is best positioned to stimulate stock exchanges in applying sustainability principles. This paper will therefore show which measures have been undertaken as an outcome of the SSE efforts, and how the various stock exchanges worldwide have implemented consequently various sustainability policies aimed at the capital market participants. Keywords Stock exchange, sustainability, capital market

18
1 Introduction The world hosts a jungle of sustainability initiatives. Since many years, it is noted that companies and governments are urged to act more sustainable, to be more transparent and to take more care of their constituents. On every level there is the possibility to ‘step in’ and comply with certain sustainability standards. In addition, for every organization there is the possibility to find consultation methods, rating tools and best in class peers. The unfortunate result is that, at first glance, it seems that the sus-tainability ecosystem itself is not transparent at all. In contradiction to what many of them preach as the cornerstone of their ‘religion’. Nonetheless, in our opinion the good news is that ‘sustainability’ is growing in support; transforming from an avantgardistic movement 45 years ago, into a more and more mainstream reality in many segments of our nowadays’ society. We don’t find ourselves anymore solely as either spectator or participant of a sustainability evolution. It’s often a matter of both: we separate our garbage, but still drive a polluting car. Nevertheless, the development is progressing and it will be upon the new, yet unborn, generations to make this world fully sustainability compliant. In order to pledge the route, we have to break down the remaining barriers so that sustainability will become a true 'conditio sine qua non’ for life and businesses. Capital markets are driven by financial flows, which are mainly directed between risk and yield lev-els. Not always will sustainability measures bring more financial result. Moreover, in the short term there is probably more cost involved, because of changing policies and working methods. A certain ‘level playing field’ in key capital market segments is therefore a precondition to endorse the sustain-ability process to move on. In every market there will be first-movers, but in order to get sustainabil-ity more widespread adopted, a worldwide applied set of top down measures, agreements and policies are necessary since many financial organizations compete on global level. In addition to other global organizations, the world’s stock exchanges are important actors in the process to stimulate more sus-tainable capital markets. Therefore this paper will answer the following question: what is the attribu-tion of stock exchanges in the sustainability development of listed companies and their shareholders? Stock exchanges could play a 3-dimensional role in the evolution of sustainability. First of all, they could lead by example with applying a sustainability policy as an organization themselves. Secondly, they could streamline their market place by introducing mandatory sustainability principles for all market actors. Thirdly, they could endorse sustainability related investment products (e.g. green bonds, shares of renewables or sustainable ETF’s) by lowering trading fees or creating special sus-tainability indices. In the underlying contribution, we present all the information on the different stock exchanges policies that we have available. In section 2, we will focus on what has been undertaken by the several global intergovernmental or-ganizations, to make these capital markets more sustainable. More in particular, we will present a deeper analysis on the Sustainable Stock Exchange Initiative, which is launched in 2009 by the UN-supported Principles for Responsible Investment, the United Nations Conference on Trade and De-velopment, the United Nations Environment Program Finance Initiative, and the UN Global Compact. Finally, across all sustainability advocates, several main issues are always being discussed such as pollution, water, energy, etc. Especially for the purpose of this paper, we will make - where relevant and possible - a link with ‘energy’ and explain if applicable the effect of the measures undertaken. 2 Capital market organizations and sustainability policies This section describes how stock exchanges, regulators, investors, stock brokers and companies work together to enhance transparency on reporting and therewith to incorporate operational performance on sustainability. Global, intergovernmental capital market organizations like the Sustainable Stock Exchange Initiative, UN Principles for Responsible Investment and UN Global Compact seek to in-
19
fluence company policy with a top-down approach. They are capable to stimulate corporate sustaina-bility reporting. This is the low hanging fruit that could lead to more efficient use of resources and a more sustainable world. According to Aronson (2012) there is a clear correlation between the moment a company becomes a sustainability leader and the innovation of that company. In the first year of its leadership a company has a more than 400% higher chance to become a top-innovator and in the second year even a 600% higher chance. A reason is that sustainability can help a company to think differently about existing subjects or think about different subjects. According to SAP (2011 and 2014), the German software company, had fully implemented sustaina-bility in 2009. Short-term and long-term profits were balanced by addressing economic, environmen-tal and social risk and opportunities in a holistic way. As a consequence, in the following year SAP presented a new corporate strategy driven by strategic innovations. E.g. it developed software that helps energy companies with the transformation from selling energy to orchestrating energy con-sumption based on cloud computing and advanced analysis techniques. Another strategic innovation is the delivery of software that supports transformation of selling cars to selling mobility. A renewables company that produces for example solar, wind or biomass energy has started a differ-ent way of energy production. We believe the market has considered the early renewable energies companies as top-innovators that were initiated with sustainability motives. Stock exchanges like to have such companies as their issuing clients. They lead to new innovations. On the German Stock Exchange for example DAX Renewable Energies subsector indices2 are listed. Thematic indices are one way to invest in renewable energies companies. Other investment possibilities are actively man-aged thematic mandates or mutual funds. UNGC was launched in 2000. According to its website, this strategic policy initiative targets compa-nies, governments, businesses, labor and civil society organizations. The initiative has grown to more than 12,000 participants, including over 8,000 businesses in approximately 145 countries around the world. UNGC stimulates businesses that align their policies and operations with ten universally ac-cepted principles in the areas of human rights, labor, environment and anti-corruption. It “promotes corporate communication on strategies, policies and procedures that allow stakeholders to assess whether a company is positioned to perform well in the future” (Global LEAD and PRI, 2013, p.8). PRI was launched in 2006. It targets asset owners, investment managers and professional service partners as consultants, research providers and stock exchanges. According to its website, the initia-tive has grown to more than 1,300 participants, including nearly 900 investment managers and nearly 300 asset owners in more than 50 countries around the world. PRI aims to understand the implica-tions of sustainability for investors. This network of investors is working together to incorporate the sustainability issues of the six Principles for Responsible Investment into their investment decision-making and ownership practices. The SSE was launched in 2009. It targets all individual stock exchanges worldwide. The PRI and SSE websites show that 4 of the 18 stock exchanges that are participants of the SSE have also signed up to the PRI. Currently, eighteen exchanges have become partner exchanges to the SSE Initiative, includ-ing BM&FBOVESPA, Bolsa Comercio Santiago, Bolsa de Valores de Colombia, Borsa Istanbul Stock Exchange, BSE Ltd., Colombian Securities Exchange, Deutsche Börse, Jamaica Stock Ex-change, Johannesburg Stock Exchange, Egyptian Exchange, Lima Stock Exchange, London Stock Exchange Group, Mexican Exchange, NASDAQ OMX, Nigerian Stock Exchange, NYSE, Stock Exchange of Thailand and Warsaw Stock Exchange. Further information on SSE is presented in sec-tion 3.
2 http://www.dax-indices.com/EN/index.aspx?pageID=15
20
Engagement as means to achieve the objectives The intergovernmental organizations above are accommodating engagement between investors and companies. Engagement aims for a dialogue about implementing a more sustainable corporate strate-gy and better transparency about sustainability issues. Group and one-on-one meetings, conference calls, webinars, road shows and in-depth-investor days are all formats to facilitate engagement. According to its website, UNGC offers its stakeholders a variety of engagement opportunities such as ESG (Environment(al), Social and Governance) Investor Briefings. This variant of the term sustaina-bility is mostly used by institutional investors. ESG briefings of the UNGC and the PRI offer the op-portunity for companies to connect with mainstream investors. A specific tool helps companies “to identify and communicate the sustainability factors that drive value within their company. The project also assists companies in their communication of material ESG factors to investors and facilitates direct feedback from interested investors” (Global LEAD and PRI, 2013, p.8). Another engagement activity mentioned on the PRI website is the so-called PRI Clearinghouse. This is a private forum for investors to collect resources and share information. Therefore it is not only used for investor meetings with companies, but also for meetings with policymakers and other stake-holders. Besides the mentioned intergovernmental capital market organizations, also organizations are facili-tating engagement about sustainability issues as (part of) their business model. An example is the Carbon Disclosure Project3, a non-governmental organization. Other examples are professional ser-vice partners such as GES4, stockbrokers such as KeplerCheuvreux5 and investors like De Pury Pictet Turrettini & Co6. Disclosure of sustainability indicators Despite the call for engagement and corporate transparency, only 128 of the world’s 4,609 large listed companies (2.8%) currently disclose all of the seven by Corporate Knights selected “first-generation” sustainability indicators: employee turnover, energy, greenhouse gas emissions, injury rate, payroll, waste and water. According to Corporate Knights (2014) is the number of companies disclosing each of these metrics is becoming higher but it is still disconcertingly low. Only 39% of them currently disclose their greenhouse gas emissions (GHGs). Equally troubling is that disclosure rates on the seven first-generation indicators appear to be plat-eauing. As one illustration, the number of large listed companies that disclosed their energy use in-creased by 88% from 2008 to 2012 but only by 5% from 2011 to 2012. A similar reporting slowdown is occurring on the other first-generation indicators” (Corporate Knights, 2014, p.5). The proportion of the world’s large listed companies that report their energy consumption is only 40%. In all 10 Global Industry Classification Standard sectors7 energy use is ranked top 3 among the sustainability indicators. Comparing disclose on all 10 GICS sectors shows that the materials sector is the best overall per-former, according to Corporate Knights (2014). This sector has achieved the highest rates on energy use, GHGs, injury rate, waste and water. The highest disclosure rates of all GICS sectors 2 are shown in Table 1 below. 3 www.cdp.net/Docs/investor/investor-engagement-tool.pdf 4 www.ges-invest.com/pages/index.asp?ID=311 5 www.keplercheuvreux.com/About_Us/ 6 www.ppt.ch/en/ 7 MSCI and S&P developed the GICS structure. It includes 10 sectors, 24 industry groups, 68 industries and 154 sub-industries. See www.spindices.com/documents/index-policies/methodology-gics.pdf.
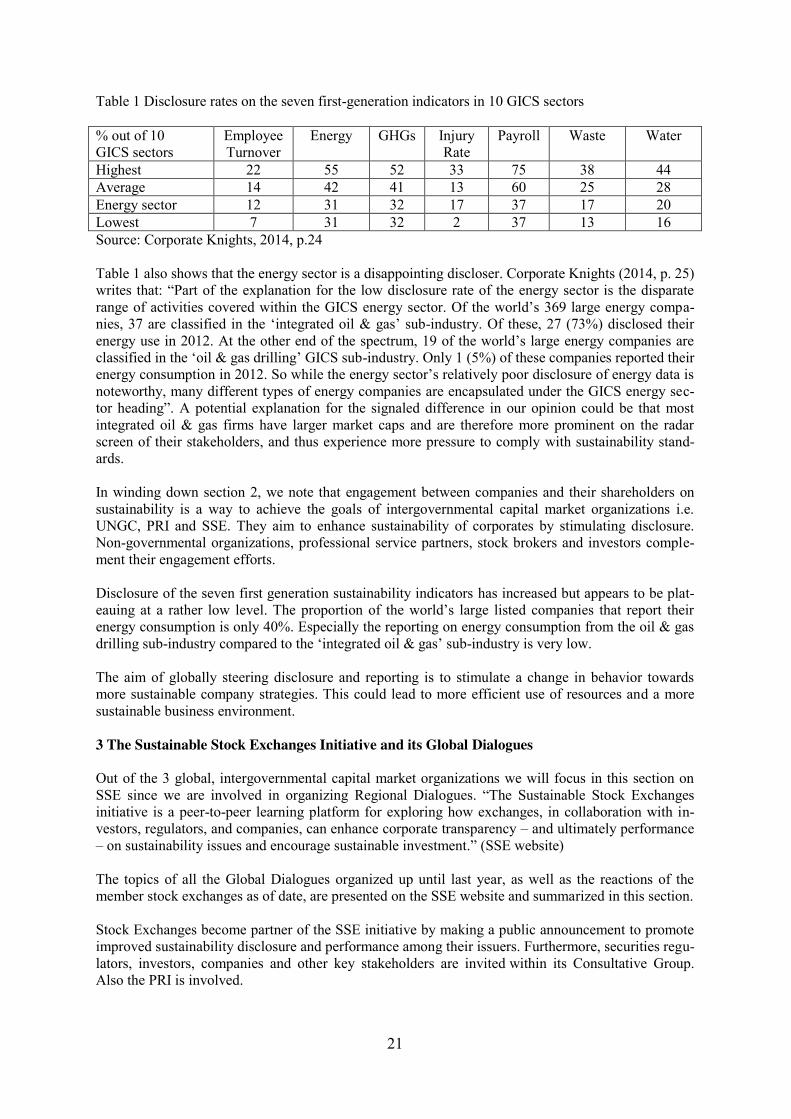
21
Table 1 Disclosure rates on the seven first-generation indicators in 10 GICS sectors % out of 10 GICS sectors
Employee Turnover
Energy GHGs Injury Rate
Payroll Waste Water
Highest 22 55 52 33 75 38 44 Average 14 42 41 13 60 25 28 Energy sector 12 31 32 17 37 17 20 Lowest 7 31 32 2 37 13 16 Source: Corporate Knights, 2014, p.24 Table 1 also shows that the energy sector is a disappointing discloser. Corporate Knights (2014, p. 25) writes that: “Part of the explanation for the low disclosure rate of the energy sector is the disparate range of activities covered within the GICS energy sector. Of the world’s 369 large energy compa-nies, 37 are classified in the ‘integrated oil & gas’ sub-industry. Of these, 27 (73%) disclosed their energy use in 2012. At the other end of the spectrum, 19 of the world’s large energy companies are classified in the ‘oil & gas drilling’ GICS sub-industry. Only 1 (5%) of these companies reported their energy consumption in 2012. So while the energy sector’s relatively poor disclosure of energy data is noteworthy, many different types of energy companies are encapsulated under the GICS energy sec-tor heading”. A potential explanation for the signaled difference in our opinion could be that most integrated oil & gas firms have larger market caps and are therefore more prominent on the radar screen of their stakeholders, and thus experience more pressure to comply with sustainability stand-ards. In winding down section 2, we note that engagement between companies and their shareholders on sustainability is a way to achieve the goals of intergovernmental capital market organizations i.e. UNGC, PRI and SSE. They aim to enhance sustainability of corporates by stimulating disclosure. Non-governmental organizations, professional service partners, stock brokers and investors comple-ment their engagement efforts. Disclosure of the seven first generation sustainability indicators has increased but appears to be plat-eauing at a rather low level. The proportion of the world’s large listed companies that report their energy consumption is only 40%. Especially the reporting on energy consumption from the oil & gas drilling sub-industry compared to the ‘integrated oil & gas’ sub-industry is very low. The aim of globally steering disclosure and reporting is to stimulate a change in behavior towards more sustainable company strategies. This could lead to more efficient use of resources and a more sustainable business environment. 3 The Sustainable Stock Exchanges Initiative and its Global Dialogues Out of the 3 global, intergovernmental capital market organizations we will focus in this section on SSE since we are involved in organizing Regional Dialogues. “The Sustainable Stock Exchanges initiative is a peer-to-peer learning platform for exploring how exchanges, in collaboration with in-vestors, regulators, and companies, can enhance corporate transparency – and ultimately performance – on sustainability issues and encourage sustainable investment.” (SSE website) The topics of all the Global Dialogues organized up until last year, as well as the reactions of the member stock exchanges as of date, are presented on the SSE website and summarized in this section. Stock Exchanges become partner of the SSE initiative by making a public announcement to promote improved sustainability disclosure and performance among their issuers. Furthermore, securities regu-lators, investors, companies and other key stakeholders are invited within its Consultative Group. Also the PRI is involved.

22
The most important event of the SSE is its Global Dialogues, organized every two year, in order to discuss input of its stakeholders and to analyze, promote and endorse communication CSR sustaina-bility. Global Dialogue topics addressed in 2010-2014 include:
1. The broader policy dimensions of building more responsible capital markets; 2. The role of regulation versus voluntary initiatives; 3. The options for strengthening collaboration between investors, exchanges and regulators; 4. The exploration on the role of stock exchanges and capital markets and driving sustainability
disclosure and improved performance by listed companies in the context of Rio+20; 5. A discussion on the progress of stock exchanges, investors, and regulators in promoting sus-
tainable investment. 6. The regulatory dimension of sustainability disclosure following the Rio+20 conference. 7. What role can stock exchanges, regulators and investors play to improve the sustainability
performance of companies? What are the experiences of listed companies in this area? 8. What are the main challenges taking this agenda forward? Following on developments since
the 2012 Sustainable Stock Exchanges Dialogue at the Earth Summit in Rio, how can capital market leaders build on the growing momentum? How can exchanges and other capital mar-ket participants contribute to the financing of the Sustainable Development Goals?
9. What next steps can be taken by policy makers, regulators, investors, companies and ex-changes collectively? What are the key roles for each actor? What policy options are availa-ble to reinforce existing voluntary best practices?
(Re-) actions of the partner stock exchanges on the Global Dialogues The status and commitment of the members of the SSE, in reflection to the 2014 SSE Global Dia-logue are indicated below per continent and can also be found on the SSE website. These reactions have been given by the stock exchanges themselves to the SSE, in reflection of the three Global Dia-logues that have been organized in the past five years. Please note that in this respect not all stock exchanges have joined immediately at the start of the first Global Dialogue. AFRICA 1. Egyptian Stock Exchange In Egypt, the EGX main aim is to raise awareness on sustainability in the corporate and investment community. A national dialogue with policy makers, issuers, investors, and regulators is foreseen in 2015. 2. Johannesburg Stock Exchange In South Africa, the Johannesburg Stock Exchange will remain actively involved in discussing sus-tainable and responsible business practices on national and international level. One of its objectives from 2015 upon is to promote sustainability disclosure and to create a Social Responsible Investment Index. Furthermore, seminars on disclosure indicators and data collection processes, as well as in-volving investors on these topics are on the agenda. In addition, JSE will stimulate meetings between issuers and investors seminars to enhance the debate as well as an annual ESG Investor Briefing to inform investors on the constituents of the SRI index. Finally, JSE as a corporate will continue with an active internal policy as well as by producing an annual integrated report on its efforts. 3. Nigerian Stock Exchange The Nigerian Stock Exchange is working on being aligned with international best practice. Therefore it stimulates responsible investments and takes a leading role in creating a more sustainable stock market. In order to achieve this it works on a strategic implementation plan, which will be rolled out in different stages with strong involvement of its issuers, investors and the capital market community; including an overview of the present sustainability practices of the NSE’s issuers. In addition, NSE plans to create also Sustainability Reporting Guidelines, a certification label as well as to host train-

23
ings on reporting and disclosure. The NSE has also launched a Corporate Governance Rating System to assess issuers based on the quality of their corporate integrity; corporate compliance; understanding of fiduciary responsibilities by their directors and their corporate reputation. CGRS indicates the con-tribution of a company’s efforts on better governance serve to investors and other stakeholders. The Premium Board and a tradable Corporate Governance Index will make use of the findings on CGRS. ASIA 1. Bombay Stock Exchange The Bombay Stock Exchange in India makes continuous efforts to have sustainability adopted by the capital markets by offering on- and ‘offline’ seminars for the investment community on how to adopt sustainability criteria. Furthermore, BSE presents different sustainability indices and aims to continue making efforts on this topic. As for an example, the participation in the Confederation of Indian In-dustry’s aims to strive for more integrated reporting in India and offers therefore several services to capital market participants. In addition, BSE joints efforts with the Indian Institute of Corporate Af-fairs, on topics such as corporate sustainability and investor education. Finally, BSE works together with CDP (Carbon Disclosure Project) India in order to urge filing sustainability data with CDP. 2. The Stock Exchange of Thailand According to SET sustainability should be in the DNA of its employees to advance the day-to-day sustainability efforts of the exchange. For the market, SET is working on a sustainability roadmap based on the Sustainability Development Framework Board approved by the Board of Governors followed by an implementation plan. In addition, SET has started to issue its own sustainability report based on the GRI’s G4 Sustainability Reporting Guidelines. Furthermore, an own sustainability index will be launched and issuers will be encouraged to enter the Dow Jones Sustainability Index. Issuers and investors will also be provided with educational tools to improve sustainability practices, such as free-of-charge seminars, trainings, publications, as well as consulting and coaching services for listed companies on sustainability development and performance disclosure. EUROPE 1. German Stock Exchange The German Stock Exchange endorses ongoing sustainable capital markets by continuing with differ-ent initiatives to improve transparency e.g. by the expansion of its sustainability index offering, ESG Best Practice Guide and sustainability data/information for free on its investors portal. In addition, the German Stock Exchange would like to set the right standard by also applying itself corporate sustainability standards, to publish about it, investing in sustainability standards education and endorsing best practice internationally. Finally, the German Stock Exchange engages its ecosys-tem to facilitate the dialogue and corporate disclosure. 2. Istanbul Stock Exchange In Turkey, Borsa İstanbul provides knowledge and consultation on sustainability. In addition, it pre-sents on the website the efforts on sustainability of its members and issuers. Furthermore, Borsa Is-tanbul is working on the “Handbook for Sustainability Guidance” every actor with a listing on the stock exchange. In addition, it has launched a sustainability index. Borsa İstanbul aims increase awareness on sustainability and will integrate improvements suggested in the different sustainability activities it organizes, also further in its own operations and services. 3. London Stock Exchange The LSE in the United Kingdom has identified four pillars for its approach to responsibility that is closely connected to its operating business. These are: markets, services, people and community. Best practice on corporate reporting is encouraged by FTSE, and in particular its FTSE4Good Index Se-ries. The FTSE4Good Indices have also contributed to better ESG disclosure and practice internation-
24
ally. In addition, new services are being created such as FTSE ESG Ratings covering over 3.000 shares globally, FTSE LCE industrial classification system enabling investors to process their expo-sure to this industrial transition. The LSE collaborates worldwide with other exchanges to support them in collecting sustainability data and in launching their own sustainability indices. 3. NASDAQ OMX Although NASDAQ OMX encompasses among others also stock exchanges in Europe (Scandinavia), we present their feedback under the North America heading, see below. 4. Warsaw Stock Exchange The Warsaw Stock Exchange in Poland has a true top down approach in its effort to provide a Sus-tainability Guide for the issuers’ Supervisory Boards. The guide will explain and raise awareness for Corporate Social Responsibility related to the business strategy. The WSE will also stimulate the adoption of ESG criteria by investors and thus endorse sustainable and responsible investing in Poland. In addition, CSR Index, the RESPECT Index, will be stimulated by increasing issuers’ participation and interest of investors and aiming to turn it into a benchmark for sustainable and responsible investments. In addition, the RESPECT rating is offered to companies not adopted in the RESPECT Index, but that are interested in a CSR certification. NORTH AMERICA 1. Jamaica Stock Exchange Jamaica Stock Exchange achieves to promote and raise awareness of sustainability related issues. As a result JSE will create in 2015 together with the Private Sector Organization of Jamaica a Corporate Governance Index. In addition on online investor education program will be launched. 2. NASDAQ OMX NASDAQ OMX focuses on three objectives. 1) As an index creator and data provider it will continue to create new sustainability-themed financial products. In addition, since NASDAQ believes this market is growing, it regularly consults with stakeholders on the appetite of investors on this topic, so its offering may be sufficiently differentiated and attractive. 2) Furthermore, the exchange will use its involvement in the World Federation of Exchanges Sustainability Working Group and in the UN Sustainable Stock Exchanges initiative to strive for a shared vision on the value, quality, and availa-bility of sustainability data. 3) Finally, NASDAQ OMX will host and organize sustainability and learning events at its own conference facility in New York, in order to stimulate corporate engage-ment, research dissemination, and media awareness. 3. NYSE ICE/NYSE supports its listed companies stimulating discussion among peers about best practices and challenges on sustainability. In addition, it organizes thought-leadership events that promote sustaina-bility. Finally, new sustainability-related products will be offered to the market. SOUTH AMERICA 1. BM&FBOVESPA BM&FBOVESPA, the stock exchange of Brazil, is building together with the National Association of Brokerage Firms and Dealers of Stocks, Exchange and Commodities (ANCORD) a sustainability program, aiming to have this embraced by all the brokerage houses and banks. As a result BM&FBOVESPA will also include sustainability criteria in its Operational Qualification Program (PQO). This program qualifies the services of brokerage houses and gives them the right to use Quali-fication Seals, indicating to the investment community their high level standards with which they offer their services.
25
2. Colombian Securities Exchange The Colombian Securities Exchange will publish its Guides to Responsible Investment. In addition it endorses the development of the Colombian chapter of the Latin Forum for Sustainable & Responsi-ble Investment (Latin SIF). Finally, it has an in-house fund “Investor” which aims to select the best social investments. 3. Lima Stock Exchange The Lima Stock Exchange in Peru remains to endorse sustainable business practices in the stock mar-ket. Their objective is to stimulate responsible long-term investments by organizing an sustainability event, endorsing its issuers to comply with its Good Corporate Governance Index principles, leading the Responsible Investment Program (RIP) to promote responsible investment practices and climate financing in Peru. 4. Mexican Stock Exchange The Mexican Stock Exchange seeks the possibility of creating mandatory measures to adopt the presentation of social and environmental information in their issuers’ annual reports. In this process also the respective market authorities and the issuers themselves are involved. In addition, the stock exchange has started to issue its own sustainability report based on the GRI’s G4 Sustainability Reporting Guidelines. Furthermore, an own sustainability index will be launched and issuers will be encouraged to enter the Dow Jones Sustainability Index. We find that SSE member stock exchanges are exploring the best ways to contribute to a more sus-tainable business environment. Reporting on the latest sustainability reporting guidelines as a stock exchange, offering seminars on integrated reporting, implementing sustainability indices are ways to lead by example. However, SSE members do not seem to have a special focus on the energy sector, neither on endorsing sustainability linked companies such as renewable energy companies. The actions of the member stock exchanges as presented on the SSE website will change and develop in due time. In a nutshell, at this point in time we could say that the main efforts which stock ex-changes are exploring could be summarized as follows:
x ‘Serving and leading’ by example through the Stock Exchange itself; x Implementing sustainability indices and creating a business model out of it; x Promoting ‘disclosure’ or making it mandatory through integrating reporting and/or by pre-
senting information on the stock exchange’s website or in a database; x Offering (for free) guides, seminars, workshops, trainings and education.
Developed markets are not necessarily more advanced in sustainability. Maybe because it’s more difficult to change already quite regulated markets than to roll out new measures in markets where regulation is lagging behind. In this case the ‘rule of the restrictive head start’ between developed and emerging markets could be applicable. Another reason could be that developed markets do not want to lose their competitive position by adding regulation and thus potentially increasing transaction cost for companies and investors. Emerging markets could consider being sustainable for instance by making integrated reporting man-datory, as a selling point in order to become more appealing and reliable for foreign investors. 4 Sustainability disclosure rates The sustainability reporting rates in the markets of member stock exchanges are shown in Table 2. These rates are likely to be correlated with the actions undertaken to stimulate companies to disclose their sustainability key performance indicators. There may also be a correlation with the dates that stock exchanges joined the SSE. The first five stock exchanges joined in June 2012. For calculating the 2013 CSR reporting rates KPMG (2013) sought reports published between mid-2012 and mid-
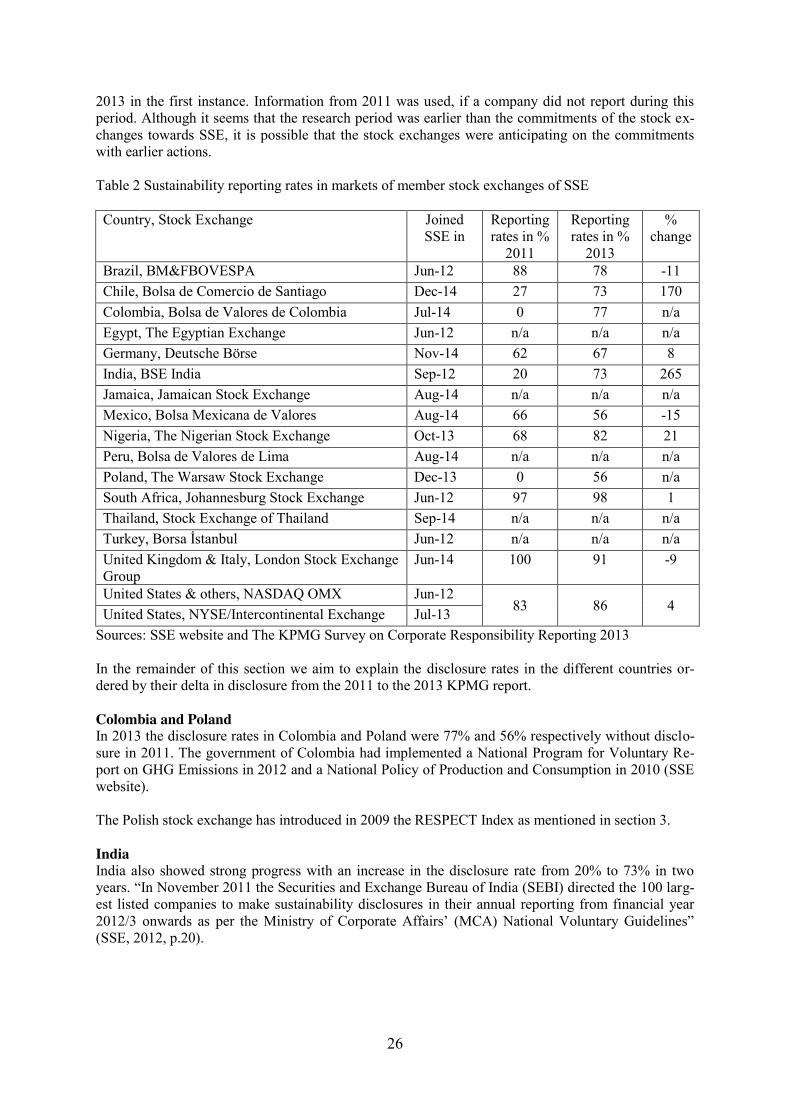
26
2013 in the first instance. Information from 2011 was used, if a company did not report during this period. Although it seems that the research period was earlier than the commitments of the stock ex-changes towards SSE, it is possible that the stock exchanges were anticipating on the commitments with earlier actions. Table 2 Sustainability reporting rates in markets of member stock exchanges of SSE Country, Stock Exchange Joined
SSE in Reporting rates in %
2011
Reporting rates in %
2013
% change
Brazil, BM&FBOVESPA Jun-12 88 78 -11 Chile, Bolsa de Comercio de Santiago Dec-14 27 73 170 Colombia, Bolsa de Valores de Colombia Jul-14 0 77 n/a Egypt, The Egyptian Exchange Jun-12 n/a n/a n/a Germany, Deutsche Börse Nov-14 62 67 8 India, BSE India Sep-12 20 73 265 Jamaica, Jamaican Stock Exchange Aug-14 n/a n/a n/a Mexico, Bolsa Mexicana de Valores Aug-14 66 56 -15 Nigeria, The Nigerian Stock Exchange Oct-13 68 82 21 Peru, Bolsa de Valores de Lima Aug-14 n/a n/a n/a Poland, The Warsaw Stock Exchange Dec-13 0 56 n/a South Africa, Johannesburg Stock Exchange Jun-12 97 98 1 Thailand, Stock Exchange of Thailand Sep-14 n/a n/a n/a Turkey, Borsa İstanbul Jun-12 n/a n/a n/a United Kingdom & Italy, London Stock Exchange Group
Jun-14 100 91 -9
United States & others, NASDAQ OMX Jun-12 83 86 4 United States, NYSE/Intercontinental Exchange Jul-13
Sources: SSE website and The KPMG Survey on Corporate Responsibility Reporting 2013 In the remainder of this section we aim to explain the disclosure rates in the different countries or-dered by their delta in disclosure from the 2011 to the 2013 KPMG report. Colombia and Poland In 2013 the disclosure rates in Colombia and Poland were 77% and 56% respectively without disclo-sure in 2011. The government of Colombia had implemented a National Program for Voluntary Re-port on GHG Emissions in 2012 and a National Policy of Production and Consumption in 2010 (SSE website). The Polish stock exchange has introduced in 2009 the RESPECT Index as mentioned in section 3. India India also showed strong progress with an increase in the disclosure rate from 20% to 73% in two years. “In November 2011 the Securities and Exchange Bureau of India (SEBI) directed the 100 larg-est listed companies to make sustainability disclosures in their annual reporting from financial year 2012/3 onwards as per the Ministry of Corporate Affairs’ (MCA) National Voluntary Guidelines” (SSE, 2012, p.20).
27
Chili Chili achieved as well a strong increase in sustainability disclosure rate from 27% to 73% towards 2013. In Chili a “recommendation to disclose and/or voluntary guidance is given or referred to” (SSE, 2014, p.10, note 2). According to the SSE website already in 2003 a Guide for Preparing Sustainabil-ity Reports was published by the industry association AccionRSE. In 2006 in government published The Economic Dimension – Embedding social sustainability Reports. Nigeria Nigeria realized an increase from 68% to 82%. According to KPMG (2014) the Central Bank of Ni-geria requires from financial services companies to do sustainability reporting. The Securities and Exchange Commission of Nigeria Corporate Governance Code recommends companies to disclose on sustainability. Germany and United States Germany and United States showed small disclosure increases from 62% to 67% and from 83% to 86% respectively. According to the SSE website, the German government introduced the Reform Act on Accounting Regulations (BilReG) in 2005 followed by the voluntary German Sustainability Code in 2011. In the US in 2012 the Dodd-Frank Wall Street Reform and Consumer Protection Act was introduced by the Securities and Exchange Commission (SEC). Its Section 1502 requires publicly listed compa-nies to report on their use of conflict minerals, whose purchase contribute to conflicts in the Demo-cratic Republic of the Congo. Under Section 1504 issuers that commercially develop oil, natural gas, or minerals need to disclose certain payments made to the US or a foreign government. The SEC has also proposed new pay-ratio employee disclosure rules, in line with Section 953(b) of the Act. Under Regulation S-K, revised in 2009, the SEC requires publicly held companies and foreign private issu-ers to disclose material financial risks associated with environmental compliance and legal liability to shareholders. South Africa In South Africa sustainability disclosure was already in 2011 nearly complete with 97% and stabi-lized in 2013 with 98%. This seems related to the fact that the Johannesburg Stock Exchange “was the world’s first stock exchange to require integrated reporting from its listed companies on an “apply or explain” basis in 2010” (SSE, 2012, p.20). This is based on the third version from 2010 of the non-legislated code on good corporate governance: King III. The first version of this mandatory King code was introduced already in 1994 by the government in South Africa. Another governmental act is the Employment Equity Act from 1998. It seeks to elimi-nate unfair discrimination in the workplace and implement affirmative action for black people, wom-en, or people with disabilities. All designated employers submit annually Employment Equity reports. Other acts include the Broad-Based Black Economic Empowerment Act from 2003 and the Air Quality Act from 2004. They are mandatory for all companies, according to the SSE website. It seems that the specific history of South Africa with apartheid was the basis for early regulation on ESG is-sues. United Kingdom In the United Kingdom all companies showed disclosure. Yet, it decreased from 100% to 91% in 2013. In 2006 the UK Parliament approved the Companies Act, which was amended several times. On a “comply-or-explain” basis, quoted companies report on GHG emissions, human rights and di-versity in the company. The government also introduced the Climate Change Act in 2008, the Carbon Reduction Commitment Energy Efficiency Scheme in 2010 and the Quoted companies GHG report-ing in 2013. These are all mandatory.
28
The London Stock Exchange introduced in 2012 mandatory regulation that all listed companies must disclose GHG emissions in annual reports, according to the SSE website. It seems that early govern-mental action resulted in early disclosure, but recently also companies choose for the explanation about their non-disclosure. Brazil Brazil also decreased from 88% to 78% on disclosure. The Brazilian stock exchange encourages “businesses listed on its platform to produce an integrated report (or sustainability report) on a “re-port-or-explain” basis” (Corporate Knights, 2014, p.2). Already in 2009 the Brazilian Securities and Exchange Commission made disclosure on environmental policy and environmental costs mandatory for companies listed on the Brazilian stock exchange. This was enacted in Instruction 480, according to the SSE website. Mexico Mexico showed the largest decrease in disclosure rate from 66% to 56%. This seems to contradict with the introduction of the Climate Change Law in 2012, establishing a new leading global legal best practice to address climate change and transition to a green economy. In 2004 the government already introduced a voluntary GHG Program, according to the SSE website. We observe that the highest disclosure rates (above 90% in 2011) were in South Africa and the UK. They were very early in implementing legislation that stimulates reporting on sustainability issues. Brazil and the US had sustainability disclosure rates above 80%. All four countries had mandatory regulation before 2010. In 2013 also Chili, Colombia, India and Nigeria reported sustainability disclosure rates above 70%. In Chili and Colombia there is only voluntary guidance. India has mandatory regulation for a limited number of companies. In general, we think it is fair to argue that early legislation has a positive effect on sustainability dis-closure rates and that without ongoing intervention by governments or stock exchanges it is unlikely that sustainability disclosure will be widely adopted by the market itself. Nevertheless, or maybe therefore, we believe that step-by-step there will be a further integration of sustainability measures in the various capital markets. Every year more stock exchanges sign up for the SSE, more investors apply to PRI or other sustainability standards and more companies are investing time and money in CSR. Especially after the financial and economic crisis, there is a call by investors and other stake-holders for lowering risk and achieving more transparency. As described above, many stock exchang-es have in order to remain an attractive market for investors replied by launching sustainability pro-grams, as it contributes to more disclosure and thus to potentially lower risk profiles of their constitu-ent organizations. Thus, as a result, sustainability policies are being institutionalized and they are not a hype anymore. This makes turning back the clock unlikely, since it will demotivate all stakeholders and it will lead to extra transition cost. 5. Summary and Conclusions The capital markets have not shown to be the first movers when it comes to sustainability, which may be understandable because their downside risk of losing competitive position could be substantial. Nevertheless, structural steps by stock exchanges in the good direction are being made, such as: in-troducing (mandatory) disclosure through integrated reporting, launching sustainability indices for investors and by creating a global platform for debate and sharing experiences followed up by nation-al and regional dialogues between local business and political leaders.

29
Since the span of control of stock exchanges is broad, they have in just a few years already worldwide impact. Their positive influence on sustainability and thus more in particular on ‘energy’ could be enormous. The good news is that there is still a huge potential improvement that could be realized. However, it’s difficult to pinpoint a direct effect on the energy sector and on energy consumption out of the current capital market measures. Disclosure of the sustainability indicators has increased but appears to be plateauing at a rather low level. For example the proportion of the world’s large listed companies that report their energy consumption is only 40%. To what extent companies would like to obtain sustainability principles is still a voluntary process. Ongoing intervention by governments or stock exchanges will still be needed for some time. Once all shareholders truly engage and urge companies as well to commit to sustainability standards, also fur-ther in the supply chain (e.g. in a supplier and client relation), then we might finally tap in the afore-mentioned potential. Having intergovernmental organizations such as the UN and the PRI committed to achieve their ob-jectives regarding sustainability ensures that a top down endorsement is anchored and ongoing. Yet, the attribution of stock exchanges to sustainability is a first step to sustainable markets. In our opinion most of it can be qualified as good intentions, mandatory or not. Probably, this is the applica-ble pace that fits with making policy and behavior changes in large markets. In due time new genera-tions of business leaders will hopefully be inspired by their predecessors to finally incorporate sus-tainability in the DNA of the markets as a normal business attitude, since we believe that sustainabil-ity should never be a status quo. Real change will take time, and should be realized in education pro-grams of young people and students. References x Aronson, D. 2012, “The Sustainability - Innovation Connection”, Deloitte’s Sustainable Business
Blog, http://blogs.deloitte.com/greenbusiness/2012/10/the-sustainability-innovation-connection. html
x BVC website, http://en.bvc.com.co/pps/tibco/portalbvc/Home/AcercaBVC/Responsabilidad_Social /Nuestra_Estrategia?action=dummy
x Corporate Knights, 2014, “Measuring Sustainability Disclosure: Ranking the World’s Stock Ex-changes”, www.corporateknights.com/wp-content/uploads/ 2014/10/2014_World_Stock_Exchange.pdf
x Global LEAD and PRI, 2013, “Enhancing Company-Investor Communication, Insights From The ESG Investor Briefing Project” www.unglobalcompact.org/docs/issues_doc/lead/ Enhancing_Compacy_Investor_Communication_ESG_IB_Project.pdf
x KPMG, 2013, “The KPMG Survey of Corporate Responsibility Reporting 2013”, www.kpmg.com/Global/en/IssuesAndInsights/ArticlesPublications/corporate-responsibility/Documents/corporate-responsibility-reporting-survey-2013-exec-summary.pdf
x PRI website, www.unpri.org/signatories/signatories/#investment_managers and http://www.unpri.org/areas-of-work/clearinghouse
x SAP, 2011, “2010 Annual Report” x SAP, 2014, “Open SAP course Sustainability and Business Innovation” x SSE, 2012, “Sustainable Stock Exchanges Report: A Report on Progress”, SSE Secretariat, https:
//www.unglobalcompact.org/docs/issues_doc/Financial_markets/Sustainable_Stock_Exchanges. pdf
x SSE, 2014, “Sustainable Stock Exchanges Report: A Report on Progress”, SSE Secretariat http://www.sseinitiative.org/wp-content/uploads/2012/03/SSE-2014-ROP.pdf
30
x SSE website, www.sseinitiative.org/stock-exchanges, www.sseinitiative.org/2014-commitments, “Sustainability Reporting Policies: 2012 Compilation” and “G20 Review: 2014 Report on Pro-gress” www.sseinitiative.org/sustainabilityreporting
x UNGC website, www.unglobalcompact.org/AboutTheGC/index.html, www.unglobalcompact.org/HowToParticipate/Engagement_Opportunities/index.html and www.unglobalcompact.org/Issues/financial_markets/esg_investor_briefings.html
x Warsaw Stock Exchange, 2014, “Management Board Report on the Activities of the Gielda Pa-pierow Wartosciowychw Warszawie S.A. Group for the year 2013” www.gpw.pl/pub/files/PDF/Sprawozdanie2013/skonsolidowane/WSE_Management_Board_report_on_activities_of_WSE_Group_2013.pdf
Abbreviations
x BM&FBOVESPA = Bolsa de Valores, Mercadorias & Futuros de Sao Paulo x BMV = Mexican Exchange x BSE = Bombay Stock Exchange x BVC = Colombian Securities Exchange x BVL = Lima Stock Exchange x CDP = Carbon Disclosure Project x CEVI = Center for Energy and Value Issues x CGRS = Corporate Governance Rating System x CSR = Corporate Social Responsibility x EGX = Egyptian Exchange x ESG = Environmental, Social and Governance x GES = Global Engagement Services x GHG = Greenhouse gas x GICS = Global Industry Classification Standard x GRI = Global Reporting Initiative x ICE = InterContinental Exchange x JSE = Jamaica Stock Exchange x JSE = Johannesburg Stock Exchange x LCE = Low Carbon Economy x LSE = London Stock Exchange Group x NGO = non-governmental organization x NSE = Nigerian Stock Exchange x NYSE = New York Stock Exchange x PRI = Principles for Responsible Investment x SET = Stock Exchange of Thailand x SRI = Social Responsible Investment x SSE = Sustainable Stock Exchange x UNCTAD = United Nations Conference on Trade and Development x UNEP FI = United Nations Environment Program Finance Initiative x UNGC = United Nations Global Compact

31
Valuing a European energy firm with fossil fuel and renewables business
Nanne Brunia and Wim Westerman8
Abstract
We study the case of a large Dutch firm, having fossil and renewable energy business, with also pres-ence in near-by Europe and even beyond. Valuing energy firms does in principle not differ from valu-ing firms in general, but multi-level regulation issues and energy market developments make things different. Key value drivers include growth of revenues (prices x volumes), earnings before interest, depreciation and amortization margins to net sales margins (“EBITDA margins”), capital expendi-tures (“CAPEX”) and costs of capital. The actual valuation requires processing many data on regula-tion, market and firm specifics, as well as much economically relevant and precise calculation work. A checklist shows a vast number of relevant inputs for a transaction valuation. It singles out the valu-ation base, accounting, cash flows, cost of capital, cost of equity and debt, terminal value, buyer spe-cifics and alternative valuations. While our checklist is still valid in the present volatile energy mar-kets, a useful addition to it would be to consider technology drivers specifically.
Key words: valuation, energy firm, Europe JEL codes: G34, M41
8 Nanne Brunia ([email protected]) and Wim Westerman ([email protected]), corresponding au-thor) are affiliated with the Faculty of Economics and Business of the University of Groningen, the Netherlands. This paper owes much to the helpful contributions of Dirk Dijksma, Maurits van Maren and Pieter Melching. However, the authors are fully and completely responsible for the current text.
32
1.Introduction It is fair to say that the valuation of European energy firms used to be relatively easy in the 90’s and the 00’s. The firms to be valued were typically conglomerates that operated at a regional or national level, with modest international affairs. They were in essence single business and integrated firms, although some reminiscence to other utility business was still around. The disentangling of produc-tion, distribution and sales functions did bring about some valuator worries, as did messy privatiza-tion, liberalisation and harmonisation movements at various levels, whereas there was also some lim-ited but upcoming renewables business that required specific attention, but that was about it. To be honest, it was actually nice for valuators that there were at least some challenges that made their work not exactly a no brainer to be coped with a set of hunches on ratio’s, some basic net present value calculations and weakly founded thoughts on competition gaming. It is in this quite orderly world that our case is set. Although having reminiscence to the circumstanc-es of a real life European firm, some alternations have been made to simplify things and to protect the innocent. We will call the case firm TEC (“The Energy Company”) and discuss its value from the view of a buyer firm (“Big Energy”). Interesting is that TEC is a Dutch multi-business firm, having fossil and renewable energy business, with also presence in near-by Europe and beyond. The latest case draft is presented in section 2. Valuing energy firms does in principle not differ from valuing firms in general, although multi-level regulation issues and energy market developments make things different. Key value drivers are growth of revenues (prices x volumes), earnings before interest, de-preciation and amortization margins to net sales (“EBITDA margins”), capital expenditures (“CAPEX”) and costs of capital. These issues are addressed in section 3. The actual valuation re-quires processing an array of regulation, market and firm data, much precise calculation work and economically relevant sensitivity analyses. Our added value to the existing literature is that we point at a vast number of relevant items that may be taken into account in a way that is specific to the ener-gy sector. Whereas our case valuation has a decreasing practical relevance in volatile energy markets, we nevertheless believe that our approach is still largely valid. We therefore conclude with a positive outlook in section 4. 2. Case description Seller and buyer profile The case is situated around the transaction of a multinational energy firm, The Energy Company N.V. (hereafter "TEC" or the “Company”). After the liberalisation of the European energy markets, sup-ported by the European Commission, its consolidation started. TEC has shown stable performance over the last three years and expectations for the Dutch market are promising. TEC is owned by the municipalities of Rotterdam and Amsterdam and the provinces of Noord- and Zuid-Holland (“Own-ers”). The Owners have decided to divest in the Company in the light of the ongoing pan-European consolidation. TEC exists of three divisions, of which two are part of the object for sale. TEC Energy Supply (“TES”) generates and trades gas, electricity and heat and TEC Solar produces and markets solar modules (“TS”). The third division TEC Network (“TN”) will be sold before the transaction. So it is not part of the object for sale and it hence it is excluded in the data presented hereafter. In addi-tion, TEC holds via TES a minority stake of 10% in a small energy company TransEnergy (“TE”). A Germany-based conglomerate firm, Big Energy A.G. (“BE”), has been approached by the invest-ment bank that runs the auction of TEC. BE is one of Europe’s leading energy suppliers in terms of both business volume and profitability. With 72% of its revenues, the group's activities are highly focused on fossil energy generation and power supply. In addition, a small part of revenue relates to renewable energy (wind, hydro and solar energy). In 2012, BE reported revenues of EUR 12.1 bln of which EUR 11.5 bln correspond to its fossil energy division. The remainder (EUR 0.6 bln) relates to renewable energy. Approximately 40% of the revenues correspond to the Group's international activi-ties, which are mainly carried out in the European Union and other Eastern European countries. BE will value (relevant parts of) TES as of December 31, 2012.
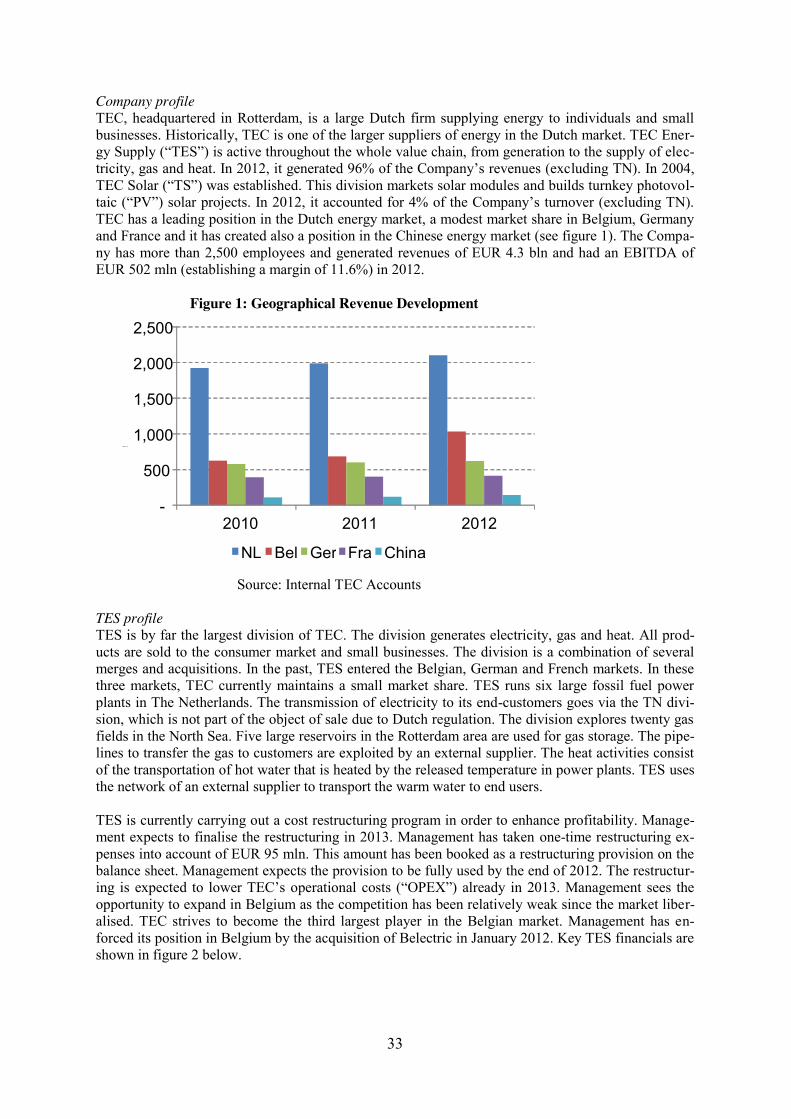
33
Company profile TEC, headquartered in Rotterdam, is a large Dutch firm supplying energy to individuals and small businesses. Historically, TEC is one of the larger suppliers of energy in the Dutch market. TEC Ener-gy Supply (“TES”) is active throughout the whole value chain, from generation to the supply of elec-tricity, gas and heat. In 2012, it generated 96% of the Company’s revenues (excluding TN). In 2004, TEC Solar (“TS”) was established. This division markets solar modules and builds turnkey photovol-taic (“PV”) solar projects. In 2012, it accounted for 4% of the Company’s turnover (excluding TN). TEC has a leading position in the Dutch energy market, a modest market share in Belgium, Germany and France and it has created also a position in the Chinese energy market (see figure 1). The Compa-ny has more than 2,500 employees and generated revenues of EUR 4.3 bln and had an EBITDA of EUR 502 mln (establishing a margin of 11.6%) in 2012. Figure 1: Geographical Revenue Development
Source: Internal TEC Accounts TES profile TES is by far the largest division of TEC. The division generates electricity, gas and heat. All prod-ucts are sold to the consumer market and small businesses. The division is a combination of several merges and acquisitions. In the past, TES entered the Belgian, German and French markets. In these three markets, TEC currently maintains a small market share. TES runs six large fossil fuel power plants in The Netherlands. The transmission of electricity to its end-customers goes via the TN divi-sion, which is not part of the object of sale due to Dutch regulation. The division explores twenty gas fields in the North Sea. Five large reservoirs in the Rotterdam area are used for gas storage. The pipe-lines to transfer the gas to customers are exploited by an external supplier. The heat activities consist of the transportation of hot water that is heated by the released temperature in power plants. TES uses the network of an external supplier to transport the warm water to end users. TES is currently carrying out a cost restructuring program in order to enhance profitability. Manage-ment expects to finalise the restructuring in 2013. Management has taken one-time restructuring ex-penses into account of EUR 95 mln. This amount has been booked as a restructuring provision on the balance sheet. Management expects the provision to be fully used by the end of 2012. The restructur-ing is expected to lower TEC’s operational costs (“OPEX”) already in 2013. Management sees the opportunity to expand in Belgium as the competition has been relatively weak since the market liber-alised. TEC strives to become the third largest player in the Belgian market. Management has en-forced its position in Belgium by the acquisition of Belectric in January 2012. Key TES financials are shown in figure 2 below.
-
500
1,000
1,500
2,000
2,500
2010 2011 2012
EUR mln
NL Bel Ger Fra China

34
Figure 2: Key TES financials
Source: Internal TEC Accounts TS TEC Solar (“TS”) is an international operating, innovative and leading solar company that markets PV solar modules and turnkey PV projects. The division is one of the mid-sized players in the Dutch market and has a moderate position on the Chinese market. The solar panel business was started in the Netherlands in 2004. In the year 2007, TEC acquired a solar panel manufacturer in China. The activities within China have a promising outlook and are expected to drive TEC’s future growth. The solar modules are sold under the Company’s own brand “TEC Solar” and target the consumer market, small businesses and PV plants. TS operates at the end of the value chain. TS directly buys the solar cells from a premium third party. From these cells TS produces its own solar modules. TS executes geographical expansion through its network of TES and enhances its position in the Dutch and Chi-nese markets. TS’ strategy is to expand along the international network of TES. Within three years, TS plans to introduce its solar products in Belgium, Germany and France. TS expects declining sales prices. To remain profitable, TS developed a rapid sales growth strategy for the Dutch, Belgian, French and Chinese market. In addition, it works on some technological improvements that will enable TEC to lower its costs price and establish a high margin in order to realise economies of scale. The develop-ments in the solar industry have had a negative effect on margins in 2010. In 2011, the market was recovering. Even though the industry faced overcapacity in 2012, analyst reports state that the market is ready for further recovering after the fall-back in 2012. Figure 3 below informs about the key TS financials. Figure 3: Key TS financials
Source: Internal TEC Accounts
143 149 177
20.4% 20.9% 21.4%
- 21.6% - 20.2% - 15.1%
-25% -20% -15% -10% -5% 0% 5% 10% 15% 20% 25%
- 25 50 75
100 125 150 175 200 225 250 275 300
2010 2011 2012
EUR mln
Revenues EBITDA margin EBIT Margin
3,486 3,644 4,135
11.1% 11.2% 11.2%
4.8% 5.0% 5.3%
0%
2%
4%
6%
8%
10%
12%
- 500
1,000 1,500 2,000 2,500 3,000 3,500 4,000 4,500 5,000
2010 2011 2012
EUR mln
Revenues EBITDA margin EBIT Margin

35
Market information: General Global energy consumption is projected to increase by 1.5% per year from 2010 to 2040 (EIA, 2013). Key drivers for the growth of the energy market are an increasing energy consumption per capita (especially in emerging markets) and growth of the population size. The energy market shows a trend towards renewable sources. This trend is driven firstly by government regulations. Conventional sources such as oil and gas become scarcer and put more pressure on the environment. Governments stimulate renewable energy as a substitute of fossil energy. Secondly, the trend is also driven by pric-es of fossil fuels and renewable energies. Scarcity of fossil fuel results in higher oil, gas and coal prices. Decreasing costs for innovative renewable energies are expected to result in lower prices. World energy consumption is forecasted to increase with 56% between 2010 and 2040 (EIA, 2013). Total energy demand in the OECD (Organization for Economic Cooperation and Development) coun-tries is expected to increase by 17% and an increase of 90% is expected in the non-OECD countries. Strong long-term GDP growth in emerging economies of non-OECD countries drives growth in glob-al energy demand. Despite the fact that renewable energy will capture a larger part of the market, fossil fuels (liquid fuels and other petroleum, natural gas, and coal) are expected to continue to grow in absolute numbers. In the late 90’s, the European Commission decided to liberalise the European energy markets. The new environment created global energy markets and enforced more competition. The opening of the market stimulated cross-border acquisitions and the creation of large multinational energy suppliers. TEC forecasts for its relevant markets, drawn from public and private expert sources, are shown in table 1 and table 2.
The Dutch energy market is a relatively small energy market within the EU. It corresponds to approx-imately 10% of the total European gas demand and 6% of the electricity demand. Nevertheless, The Netherlands sources nearly 20% of the total European gas demand. Domestic gas production is fore-casted to decrease by 40% until 2030 (making the Netherlands a net importer). The Dutch market is recognised for its early adoption of innovations and the expected shortage of fossil resources. The renewable energy market share, although still being a poor 3% in 2012, is expected to grow signifi-cantly to some 14% in 2020. In 2004, the Dutch energy market has been liberalised. TEC is amongst the five key players dominat-ing the market, competition is heavy and marketing campaigns have significant effects on customers. Electrabel (Belgium) is the leading local energy supplier (20% market share). The company is owned by one of the world largest energy suppliers, GDF–Suez (France). Essent is also a large supplier of energy in the Dutch market (15% market share). Essent is owned by RWE (Germany). Nuon is the
In % 2012 2013 2014 2015 Actual LE FC FC
Netherlands 1.9% 4.5% 4.5% 4.5% Belgium 0.9% 4.0% 4.0% 4.0% Germany 1.4% 3.0% 3.0% 3.0% France 1.7% 2.5% 2.5% 2.5% Source: TEC Management information
Table 2: Energy consumption
In % 2012 2013 2014 2015 Actual LE FC FC
Netherlands 1.9% 1.0% 1.0% 1.0% Belgium 0.9% 0.5% 0.5% 0.5% Germany 1.4% 0.5% 0.5% 0.5% France 1.7% 1.5% 1.5% 1.5% Source: TEC Management information
Table 1: Population forecast

36
third-largest energy supplier (15% market share). The firm is owned by Vattenfall (Sweden). E.ON is a German energy supplier with a significant share in the Dutch market (10% market share). There are also some small local players in the market left. The Belgian energy market shows growth in line with GDP. The largest share of the energy market is generation of electricity. Two players in the Belgian market generate 80% of the national production. The liberalisation process has had the merit of opening up the production-side of the market, but this did not yet lead to much competition on a national level. Market research showed opportunities for a large third player in the Belgian market. Several smaller players backed by large foreign energy com-panies strive to acquire this position. Electrabel is the Belgian market leader with 50% market share. The company is backed by one of the world largest energy suppliers GDF–Suez and has realised a successful growth strategy. EDF Luminus, formerly called SPE, is Belgium’s second largest energy supplier. Since the opening of the market, EDF has seen its market share decline to 25%. The local renewable energy market share is expected to grow significantly from 3% in 2012 to 13% in 2020. Germany is Europe’s largest energy market. The market shows stable growth in line with GDP. In Germany both the electricity and gas market are fully liberalised. This dramatic opening has intro-duced a great deal of competition, allowing the entry of foreign payers and resulting in cheaper prices for the consumer. As a result of its poor energy resources, Germany became Europe’s leading pro-ducer of renewable energies. Both renewable and nuclear energy are expected to gain more market share. Despite the opening of the market, three large German companies dominate the market. RWE is Europe’s number five energy company. By way of acquisitions, it executed a successful growth strategy. The current local market share is 25%. E-ON is one of Europe’s largest energy companies. More than 65% of its revenues are driven by the sales of gas. Its market share is 20%. Vattenfall en-tered the German market by the acquisition of Bewag. Currently, Vattenfall is the third party in the German market with a market share of 18%. The local renewables’ market share is expected to grow from about 8% to about 18% from 2012 to 2020. The French market is Europe’s second largest market and is dominated by nuclear energy production. After liberalization of the market, EDF, a former state company, remained 28% market share in France. The former state gas company transformed into a comprehensive provider of energy. It has grown to an all-round energy supplier with a strong focus on the French market. The first player in the market, GDF-Suez, has a market share of 60%. The French market is relatively conservative. Re-newable energies are not foreseen to have an important impact in the next few years, however France strives to be leading on a longer term. GDF-Suez is the number five producer of energy in the world. The market share of renewable energy in France has picked up remarkably recently and it is expected to grow from 12% in 2012 to 23% in 2020. Market information: Solar Solar energy techniques were developed in the 1980’s. As a result of the then low oil price, this did not develop to a profitable business until the 1990’s. The current generation of solar energy panels is the first that can compete to other energy sources in some places around the world. The demand for solar panels is mainly driven by four determinants. Firstly, global energy demand is expected to con-tinue its growth, driven predominantly by non-OECD economies, such as Brazil, Russia, India and China. However, part of the growth can be attributed to population increases and increasing per-capita energy consumption. Secondly, environmental concerns drive renewable energy growth. Fossil fuels are limited in supply, with easily extractable reserves quickly being depleted. As the world ap-proaches peak oil, the scarcity of new reserves will likely drive up renewable energy demand. Third-ly, there is a trend towards private electricity generation, because of fossil energy price levels. Lastly, governments are vital in adopting solar technology. Solar panel prices are still too high to compete with traditional energy without subsidies. Countries that support solar panels with subsidies have shown higher sales.
37
The market for solar power products is competitive and continuously evolving. The growing demand for renewable energy and governmental regulation stimulates the development of better quality and more efficient solar systems. However, as a result of the economic turndown, demand was somewhat under pressure and forecasts for the recent future are both diverse and varying per region or country. For the long run, drivers affecting increasing demand are expected to be favourable. The leading players in the market experience rapidly growing revenues. In the early stage of the product cycle, companies are faced with losses resulting from high R&D costs. High quality firms are expected to become profitable on a short term. TEC positions itself as a global, top-quality solar panel manufac-turer. The production volume of the Company was 190 MW in 2010 and 375 MW in 2012. TEC wants to be leader on quality instead of volume. The economic turndown negatively affected the solar market in 2012. The global solar module market is dominated by four global solar companies (as presented below) and several smaller innovative firms. Many of these firms specialize in a specific stage of the value chain. The four large competitors of TEC all operate a vertical integration strategy. OCI Solar Power develops, owns and operates solar PV power plants throughout the U.S.A. Current-ly, it is developing several solar PV projects nationwide. SunPower, once owned in majority by Cy-press Semiconductor, is a US manufacturer and distributor of silicon based solar modules, which are used to convert sunlight to electricity. In 2012, shipments to the American continent increased be-cause of price drops, however shipments to Europe decreased due to lower demand. The Chinese company Suntech Generation is one of the leading solar energy companies worldwide and the largest solar module manufacturer in the world. Kin Shen (Japan) is a fast-growing solar company active in development, production and marketing of PV cells. The company will reinforce its production bases in Japan, Mexico, Europe and China. Its production more than doubled in 2011 and 2012. Historical financial analysis: TES The TES revenue growth rates differ per country. The Dutch market is characterised by a faster grow-ing demand compared to other countries. The 2012 TES revenues increased sharply (13.5%) mainly driven by the acquisition of Belectric, which solely markets energy in the Belgian market. Manage-ment decided to acquire this company in order to increase its foothold in Belgium. The energy market is renowned by its relative low gross margins, due to energy generation costs being high. All genera-tion costs are included in the costs of goods sold (COGS). Depreciation of gas fields and energy pro-duction facilities illustrate the capital intensity of the TES business. A restructuring of the TES divi-sion in 2011-2012 is expected to decrease operational costs. The restructuring costs are presented in the “other exceptional items” in the Profit and Loss (P&L) account. The goodwill related to the acqui-sition of Belectric in 2012 was not impaired in the first year. Management expects it has done a great deal and therefore no impairment is expected. The income from associates relates to a minority stake of 10% in TransEnergy, a US firm. For more information regarding TEC’s most recent P&L account, refer to table 3 below.
38
Historical financial analysis: TS The solar energy market is the key driver of TS’s growth. TS was established in 2004. In 2007, TS got the opportunity to acquire a China-based solar panel manufacturer. Due to this unique market entrance, TS was able to show rapid growth in Asia in 2008 and 2009. The revenues of TS are ex-pected to grow autonomously further over the forecast period. The solar panel plant in China sources its goods to various countries in Asia. The innovative nature of the solar energy business requires high R&D costs. Management expects the R&D expenses to grow gradually to a level of about 55m EUR in 2013. Thereafter the R&D expenses will remain stable. In 2010, the EBIT margin increased only slightly as a result of lower revenue growth during the economic downturn. Going forward oper-ating expenses (OPEX) as a percentage of revenue will decrease as the organisation will grow and realise certain cost efficiencies. Revenue growth and relative lower R&D costs have resulted in fur-ther increasing EBITDA margins as of 2011. High initial investments have incurred high depreciation costs. During the forecast period, depreciation is expected to become more in line with revenues. The start-up of TS required significant investments. However, TEC has a very high cash position on the balance sheet and most of the investments are funded by cash. See also table 4 below.
All amounts in EUR mln 2010 2011 2012 Actual Actual Actual
The Netherlands 1,890 1,960 2,068 Belgium 624 684 1,034 Germany 580 600 620 France 392 400 413
Total revenues 3,486 3,644 4,135 Growth rate 4.5% 13.5%
Cost of Goods Sold (2,707) (2,827) (3,237) Gross Margin 779 817 898 As % of Revenues 22.4% 22.4% 21.7% EBITDA 387 408 464 As % of Revenues 11.1% 11.2% 11.2%
Depreciation (222) (226) (244) Amortisation - - - EBIT 166 182 220 As % of Revenues 4.8% 5.0% 5.3%
Interest Expenses (35) (35) (35) Income from Associates 20 21 22 Other Exceptional Items - - (95) Taxes (38.42) (43) (28)
. Net Income 112 125 83 As % of Revenues 3.2% 3.4% 2.0% Source: Internal TEC Accounts
Table 3: P&L TES
39
Historical financial analysis: TEC Comparing TES and TS, currently TS has a negative contribution to the Company’s profitability. Management expects this to change in the upcoming years as solar power is becoming a substitute for traditional energy sources. In table 5 below, the consolidated TEC Profit and Loss account is shown.
All amounts in EUR mln 2010 2011 2012 Actual Actual Actual
The Netherlands 33 30 34 China 110 119 143
Total revenues 143 149 177 Growth rate 4.2% 18.8%
Cost of Goods Sold (62) (64) (75) Gross Margin 81 85 102 As % of Revenues 56.6% 57.0% 57.6%
Personnel Expenses (14) (15) (18) Cost of Materials General & Administrative Expenses (6) (6) (7) Research and Development Expenses (29) (30) (35) Other Operating Costs (3) (3) (4) EBITDA 29 31 38 As % of Revenues 20.3% 20.8% 21.5%
Depreciation (60) (61) (65) Amortisation - - - EBIT (31) (30) (27) As % of Revenues -21.7% -20.1% -15.3%
Interest Expenses (25) (25) (25) Other Exceptional Items Taxes 14 14 13
. Net Income (42) (41) (39) As % of Revenues -29.2% -27.5% -21.9% Source: Internal TEC Accounts
Table 4: P&L TS
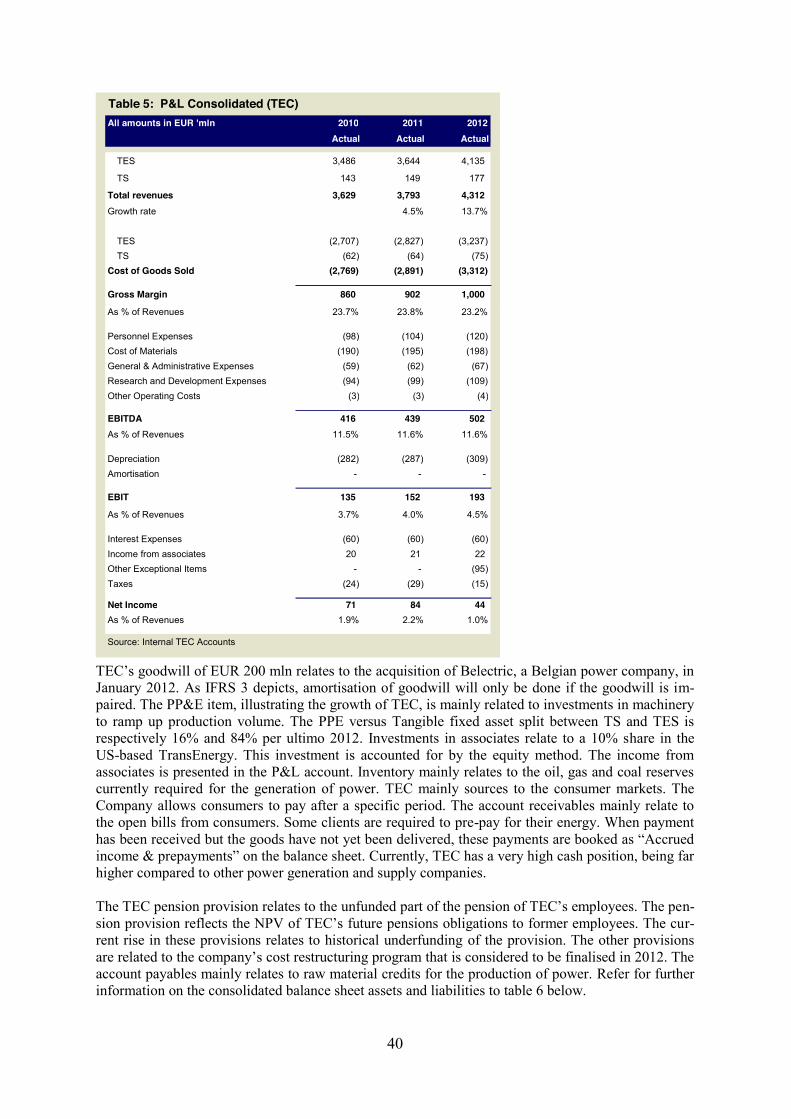
40
TEC’s goodwill of EUR 200 mln relates to the acquisition of Belectric, a Belgian power company, in January 2012. As IFRS 3 depicts, amortisation of goodwill will only be done if the goodwill is im-paired. The PP&E item, illustrating the growth of TEC, is mainly related to investments in machinery to ramp up production volume. The PPE versus Tangible fixed asset split between TS and TES is respectively 16% and 84% per ultimo 2012. Investments in associates relate to a 10% share in the US-based TransEnergy. This investment is accounted for by the equity method. The income from associates is presented in the P&L account. Inventory mainly relates to the oil, gas and coal reserves currently required for the generation of power. TEC mainly sources to the consumer markets. The Company allows consumers to pay after a specific period. The account receivables mainly relate to the open bills from consumers. Some clients are required to pre-pay for their energy. When payment has been received but the goods have not yet been delivered, these payments are booked as “Accrued income & prepayments” on the balance sheet. Currently, TEC has a very high cash position, being far higher compared to other power generation and supply companies. The TEC pension provision relates to the unfunded part of the pension of TEC’s employees. The pen-sion provision reflects the NPV of TEC’s future pensions obligations to former employees. The cur-rent rise in these provisions relates to historical underfunding of the provision. The other provisions are related to the company’s cost restructuring program that is considered to be finalised in 2012. The account payables mainly relates to raw material credits for the production of power. Refer for further information on the consolidated balance sheet assets and liabilities to table 6 below.
All amounts in EUR 'mln 2010 2011 2012 Actual Actual Actual
TES 3,486 3,644 4,135 TS 143 149 177
Total revenues 3,629 3,793 4,312 Growth rate 4.5% 13.7%
TES (2,707) (2,827) (3,237) TS (62) (64) (75)
Cost of Goods Sold (2,769) (2,891) (3,312) Gross Margin 860 902 1,000 As % of Revenues 23.7% 23.8% 23.2% Personnel Expenses (98) (104) (120) Cost of Materials (190) (195) (198) General & Administrative Expenses (59) (62) (67) Research and Development Expenses (94) (99) (109) Other Operating Costs (3) (3) (4) EBITDA 416 439 502 As % of Revenues 11.5% 11.6% 11.6% Depreciation (282) (287) (309) Amortisation - - - EBIT 135 152 193 As % of Revenues 3.7% 4.0% 4.5% Interest Expenses (60) (60) (60) Income from associates 20 21 22 Other Exceptional Items - - (95) Taxes (24) (29) (15) Net Income 71 84 44 As % of Revenues 1.9% 2.2% 1.0% Source: Internal TEC Accounts
Table 5: P&L Consolidated (TEC)
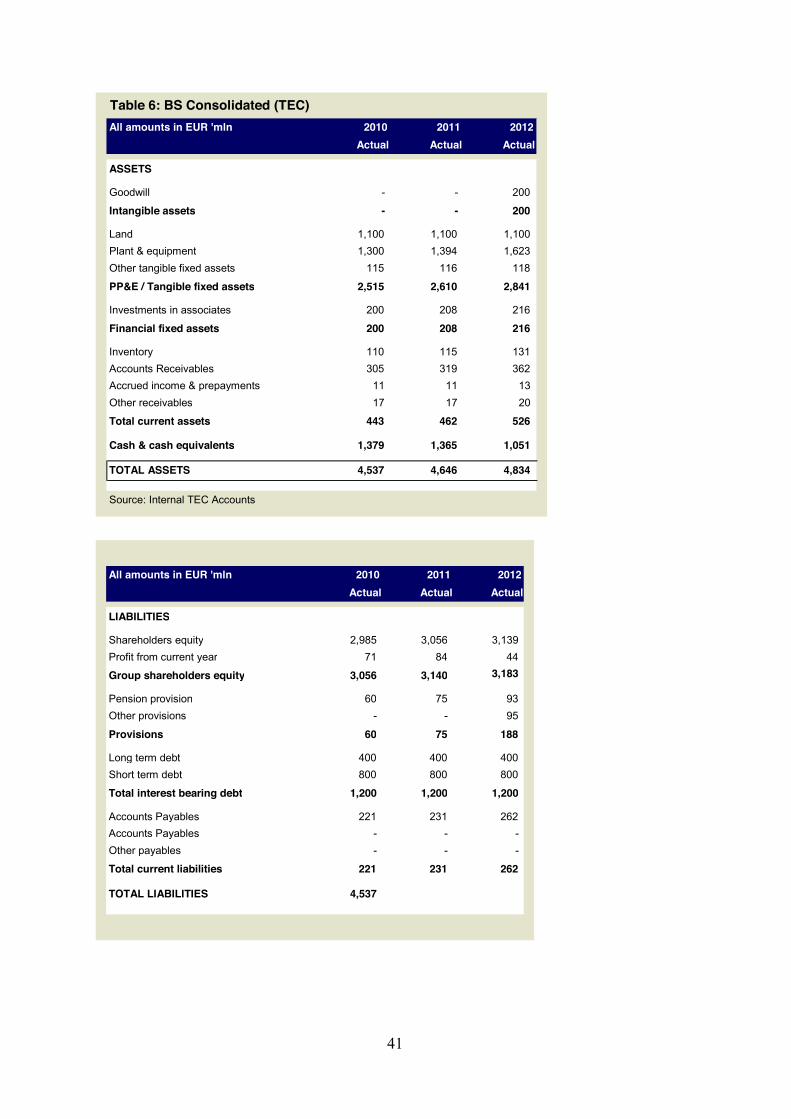
41
4,646 4,834 Source: Internal TEC Accounts
Table 6b: BS Consolidated (TEC), Liabilities
All amounts in EUR 'mln 2010 2011 2012 Actual Actual Actual
LIABILITIES Shareholders equity 2,985 3,056 3,139 Profit from current year 71 84 44 Group shareholders equity 3,056 3,140 3,183 Pension provision 60 75 93 Other provisions - - 95 Provisions 60 75 188 Long term debt 400 400 400 Short term debt 800 800 800 Total interest bearing debt 1,200 1,200 1,200 Accounts Payables 221 231 262 Accounts Payables - - - Other payables - - - Total current liabilities 221 231 262 TOTAL LIABILITIES 4,537
All amounts in EUR 'mln 2010 2011 2012 Actual Actual Actual
ASSETS Goodwill - - 200 Intangible assets - - 200 Land 1,100 1,100 1,100 Plant & equipment 1,300 1,394 1,623 Other tangible fixed assets 115 116 118 PP&E / Tangible fixed assets 2,515 2,610 2,841 Investments in associates 200 208 216 Financial fixed assets 200 208 216 Inventory 110 115 131 Accounts Receivables 305 319 362 Accrued income & prepayments 11 11 13 Other receivables 17 17 20 Total current assets 443 462 526 Cash & cash equivalents 1,379 1,365 1,051 TOTAL ASSETS 4,537 4,646 4,834 Source: Internal TEC Accounts
Table 6: BS Consolidated (TEC)
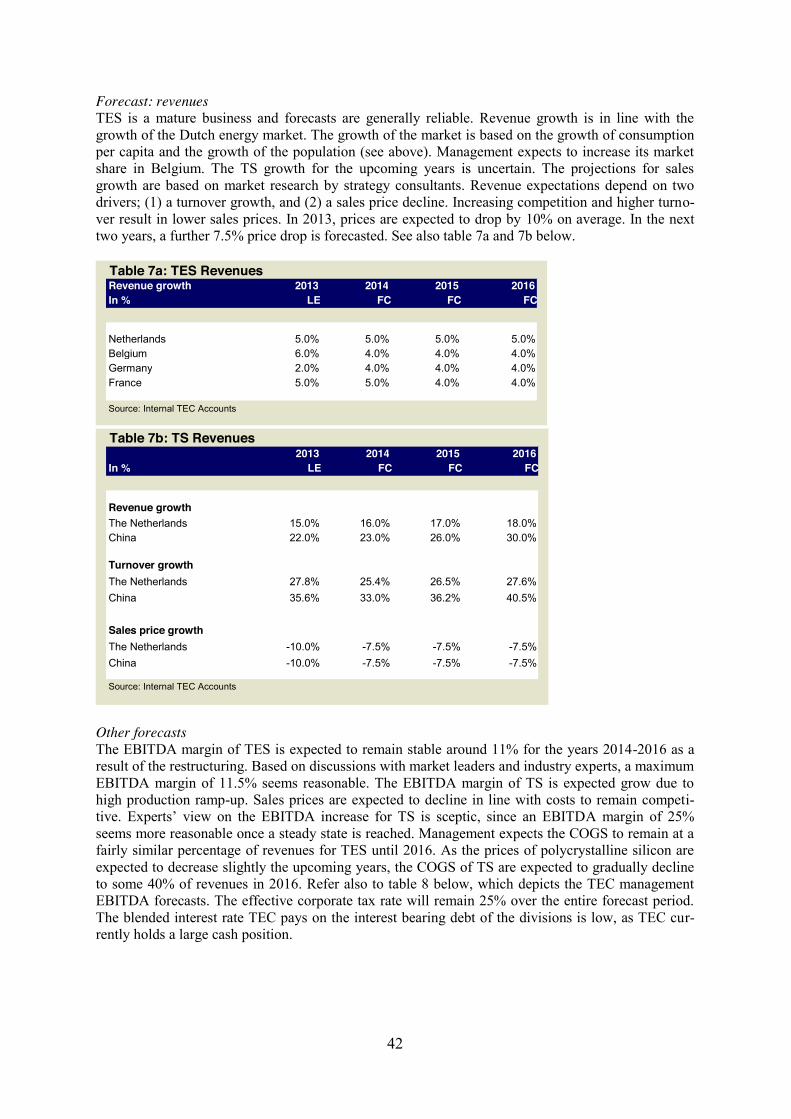
42
Forecast: revenues TES is a mature business and forecasts are generally reliable. Revenue growth is in line with the growth of the Dutch energy market. The growth of the market is based on the growth of consumption per capita and the growth of the population (see above). Management expects to increase its market share in Belgium. The TS growth for the upcoming years is uncertain. The projections for sales growth are based on market research by strategy consultants. Revenue expectations depend on two drivers; (1) a turnover growth, and (2) a sales price decline. Increasing competition and higher turno-ver result in lower sales prices. In 2013, prices are expected to drop by 10% on average. In the next two years, a further 7.5% price drop is forecasted. See also table 7a and 7b below.
Other forecasts The EBITDA margin of TES is expected to remain stable around 11% for the years 2014-2016 as a result of the restructuring. Based on discussions with market leaders and industry experts, a maximum EBITDA margin of 11.5% seems reasonable. The EBITDA margin of TS is expected grow due to high production ramp-up. Sales prices are expected to decline in line with costs to remain competi-tive. Experts’ view on the EBITDA increase for TS is sceptic, since an EBITDA margin of 25% seems more reasonable once a steady state is reached. Management expects the COGS to remain at a fairly similar percentage of revenues for TES until 2016. As the prices of polycrystalline silicon are expected to decrease slightly the upcoming years, the COGS of TS are expected to gradually decline to some 40% of revenues in 2016. Refer also to table 8 below, which depicts the TEC management EBITDA forecasts. The effective corporate tax rate will remain 25% over the entire forecast period. The blended interest rate TEC pays on the interest bearing debt of the divisions is low, as TEC cur-rently holds a large cash position.
2013 2014 2015 2016 In % LE FC FC FC
Revenue growth The Netherlands 15.0% 16.0% 17.0% 18.0% China 22.0% 23.0% 26.0% 30.0%
Turnover growth The Netherlands 27.8% 25.4% 26.5% 27.6% China 35.6% 33.0% 36.2% 40.5%
Sales price growth The Netherlands -10.0% -7.5% -7.5% -7.5% China -10.0% -7.5% -7.5% -7.5% Source: Internal TEC Accounts
Table 7b: TS Revenues
Revenue growth 2013 2014 2015 2016 In % LE FC FC FC
Netherlands 5.0% 5.0% 5.0% 5.0% Belgium 6.0% 4.0% 4.0% 4.0% Germany 2.0% 4.0% 4.0% 4.0% France 5.0% 5.0% 4.0% 4.0% Source: Internal TEC Accounts
Table 7a: TES Revenues
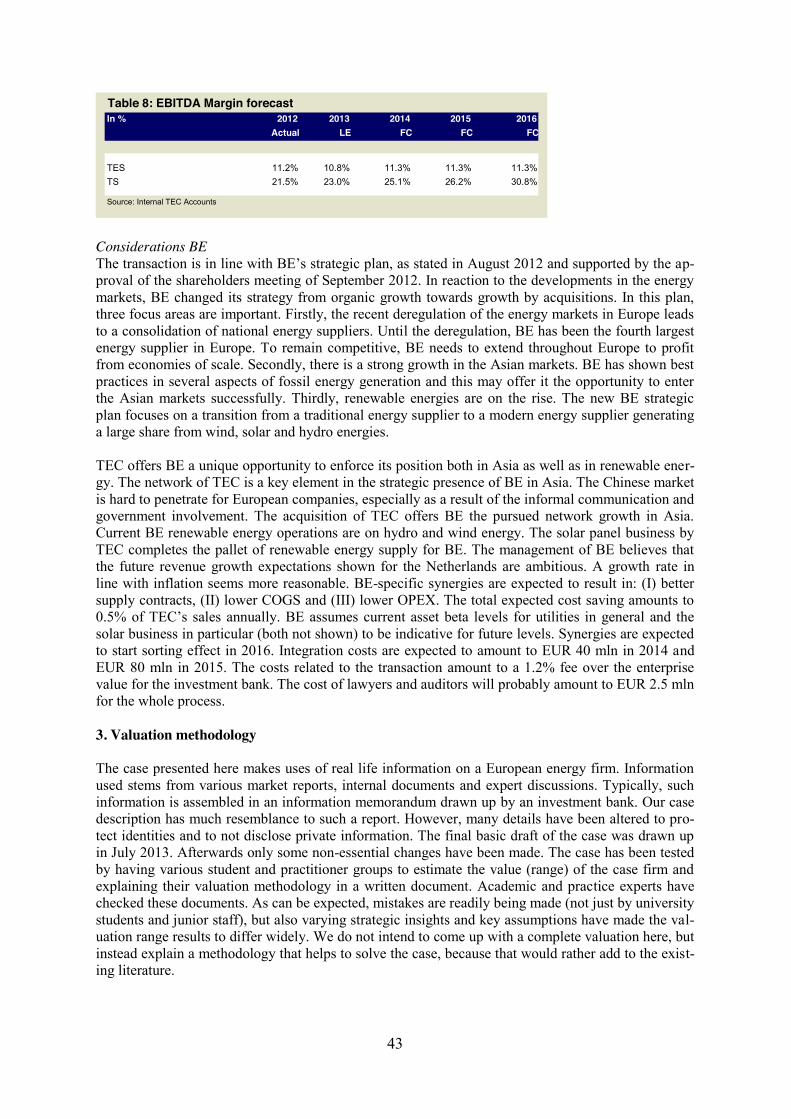
43
Considerations BE The transaction is in line with BE’s strategic plan, as stated in August 2012 and supported by the ap-proval of the shareholders meeting of September 2012. In reaction to the developments in the energy markets, BE changed its strategy from organic growth towards growth by acquisitions. In this plan, three focus areas are important. Firstly, the recent deregulation of the energy markets in Europe leads to a consolidation of national energy suppliers. Until the deregulation, BE has been the fourth largest energy supplier in Europe. To remain competitive, BE needs to extend throughout Europe to profit from economies of scale. Secondly, there is a strong growth in the Asian markets. BE has shown best practices in several aspects of fossil energy generation and this may offer it the opportunity to enter the Asian markets successfully. Thirdly, renewable energies are on the rise. The new BE strategic plan focuses on a transition from a traditional energy supplier to a modern energy supplier generating a large share from wind, solar and hydro energies. TEC offers BE a unique opportunity to enforce its position both in Asia as well as in renewable ener-gy. The network of TEC is a key element in the strategic presence of BE in Asia. The Chinese market is hard to penetrate for European companies, especially as a result of the informal communication and government involvement. The acquisition of TEC offers BE the pursued network growth in Asia. Current BE renewable energy operations are on hydro and wind energy. The solar panel business by TEC completes the pallet of renewable energy supply for BE. The management of BE believes that the future revenue growth expectations shown for the Netherlands are ambitious. A growth rate in line with inflation seems more reasonable. BE-specific synergies are expected to result in: (I) better supply contracts, (II) lower COGS and (III) lower OPEX. The total expected cost saving amounts to 0.5% of TEC’s sales annually. BE assumes current asset beta levels for utilities in general and the solar business in particular (both not shown) to be indicative for future levels. Synergies are expected to start sorting effect in 2016. Integration costs are expected to amount to EUR 40 mln in 2014 and EUR 80 mln in 2015. The costs related to the transaction amount to a 1.2% fee over the enterprise value for the investment bank. The cost of lawyers and auditors will probably amount to EUR 2.5 mln for the whole process.
3. Valuation methodology The case presented here makes uses of real life information on a European energy firm. Information used stems from various market reports, internal documents and expert discussions. Typically, such information is assembled in an information memorandum drawn up by an investment bank. Our case description has much resemblance to such a report. However, many details have been altered to pro-tect identities and to not disclose private information. The final basic draft of the case was drawn up in July 2013. Afterwards only some non-essential changes have been made. The case has been tested by having various student and practitioner groups to estimate the value (range) of the case firm and explaining their valuation methodology in a written document. Academic and practice experts have checked these documents. As can be expected, mistakes are readily being made (not just by university students and junior staff), but also varying strategic insights and key assumptions have made the val-uation range results to differ widely. We do not intend to come up with a complete valuation here, but instead explain a methodology that helps to solve the case, because that would rather add to the exist-ing literature.
Table 8: EBITDA Margin forecast In % 2012 2013 2014 2015 2016
Actual LE FC FC FC
TES 11.2% 10.8% 11.3% 11.3% 11.3% TS 21.5% 23.0% 25.1% 26.2% 30.8% Source: Internal TEC Accounts
44
Standard literature Koller, Goedhart and Wessels (2015) from McKinsey & Company take a rigorous modelling stand, fairly in line with what is often recommended in the vast academic literature. They put forward a key value driver formula that is broken down in two parts down here:
(1) Value = FCF / (WACC – g) (2) FCF = NOPLATt=1 ( 1 – g/ROIC)
The basic value drivers for a company valuation are the net operating income less adjusted taxes (NOPLAT), the growth rate of NOPLAT (g), the return on invested capital (ROIC) and the weighted average cost of capital (WACC). In determining the net present value (or as the authors call it the discounted cash flow) of the company, the free cash flow (FCF) has to be calculated and discounted properly. Whereas during the forecast period various inputs may require sophisticated modelling, the key value driver formula can be used to calculate the continuing value. A business only generates Economic Profit when it has a positive net operating income (NOPLAT) and a positive economic spread (ROIC – WACC). Although the enterprise value matters, it is ultimately the equity value for the shareholders that counts. In addition, the approach of Standard & Poor’s (McCann, 2010) on electricity firm valuation fits well with general practices in the “valuation industry” (investment banks, accountancy firms, consultan-cies). Standard & Poor’s (S&P) recognises that the energy industry is moving to a competitive market place and that financial assessments should go beyond looking at the dividend yield: the annual divi-dend divided by the stock price. S&P focuses at three items. Firstly, qualitative factors affect the business position: location, customer mix, competitive position, fuel mix and supply, plant opera-tions, business strategy and the regulatory environment. Second comes the income statement: revenue growth, operating expenses, non-cash items (including deferrals and write-offs) and non-operating expenses (foremost interest payments). Thirdly, balance sheet, cash flow and valuation measures are studied: capitalisation ratios (long-term debt relative to capital), debt ratings, cash flow, return on equity (typically 10% - 13%), market-to-book ratio (normally one to two), price earnings ratio (P/E, normally 9 - 15) and dividend yield (in general 3% to 7%). Our approach If performed in an organised and comprehensive way, any valuation methodology might do its work. No single valuation approach is superior to the other and taken together they convey more infor-mation than taken apart. However, a non-restrictive and holistic view is impracticable if it does not set accents with a particular stand on business and methods, thereby making a proper rundown of valuation constructs, concepts and variables. Or to put it bluntly: one must have a sound story on the firm’s business profile and an orderly valuation checklist to handle the vast amount of data. While acknowledging that we limit ourselves much this way, this is however exactly what we are going to do now. We start with a broad brush body analysis that gets its hands and feet with a fine-tuned checklist. The energy industry in Europe and beyond has a stable demand structure: the population growth drives via rising energy consumption the market growth. However, an ever fiercer competition desta-bilises market shares, which remain fairly predictable in basically oligopolistic and locally organised markets. While the energy mix is shifting in favour of renewable sources, fossil sources are still lead-ing and their mix is quite stable. This implies a fairly stable price elasticity of demand. The industry is capital intensive, with largely fixed cost structures, implying a steady operating leverage. Here, historical financial information can be used to value a company, albeit that expert insights should be well taken into account. Growth of revenues (prices x volumes) and earnings before interest, depreci-ation and amortization margins to net sales (“EBITDA margins”) are key issues. Fossil fuel and re-newables businesses must be valued separately. If being loss making in free cash flow or economic spread terms, investments cannot be justified. In round words: one should split up the valuation of TEC business-wise, calculate decent value ranges on both businesses and divest the solar business if it has a negative value. Two other key value drivers are capital expenditures (“CAPEX”) and costs of

45
capital. Furthering on these observations, we have compiled a checklist of 50 items that addresses actual valuation issues (see table 9 below). The list singles out items on the valuation base, account-ing, cash flows, cost of capital, cost of equity and debt, terminal value, buyer specifics and alternative valuations. Table 9: Valuation checklist TEC
Valuation base TES and TS together constitute TEC Include TE minority stake properly Single out excess cash properly Valuation TES and TS is complete Positive value of operations TES and TS Have positive enterprise value of TEC No mixing up of stand-alone value and strategic value Clear and transparent (modelling of) value bridge Accounting Differ excess cash balances from total cash balances Calculate net (operating) profits properly Goodwill is not separately valued Value of tax shield is not separately valued Debt (structure) is properly included Pension provision is (properly) included Restructuring provision is (properly) included No operating liabilities are included Have value of debt in line with balance sheet Model accumulation of equity clearly and properly Consolidated balance sheet (properly) balances Operating cash flows No non-relevant cash flows are included Operating cash flow does not contain any financing item CAPEX is properly included in the operating cash flows Depreciation is properly included in the operating cash flows Have non-financial working capital investments in operating CF's Cost of capital Discount all relevant TES and TS cash flows properly WACC’s are correctly calculated (formula) WACC’s are based on market weights Weights in WACC do not depend on operating liabilities No mixing up of debt-to-equity and debt-to-value ratios Net interest depends on last year’s level of debt Corporate taxes depend on taxable income Cost of equity and debt CAPM is correctly applied to cost of equity Cost of equity is in line with target capital structure Target leverage and beta is based on direct competitors only Accurate market risk premium, risk free rate and credit spread Cost of equity is adjusted for (small) size Cost of equity is adjusted for country risk premium (to be continued on the next page)
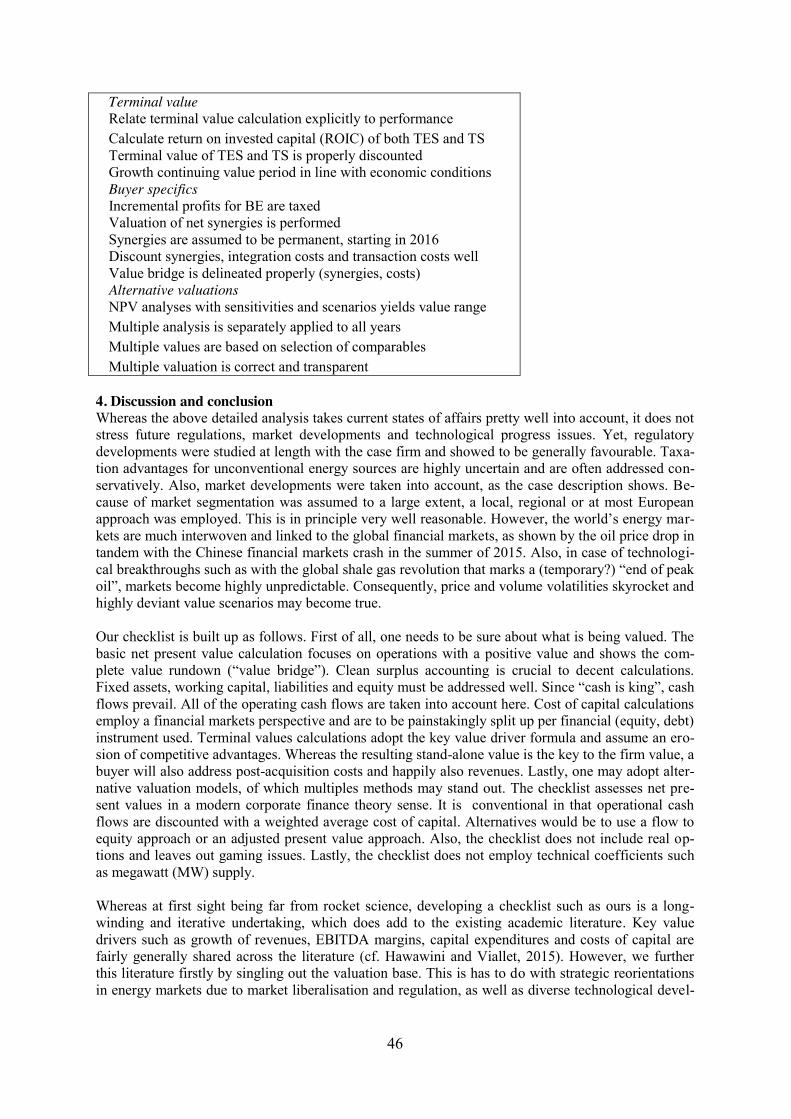
46
Terminal value Relate terminal value calculation explicitly to performance Calculate return on invested capital (ROIC) of both TES and TS Terminal value of TES and TS is properly discounted Growth continuing value period in line with economic conditions Buyer specifics Incremental profits for BE are taxed Valuation of net synergies is performed Synergies are assumed to be permanent, starting in 2016 Discount synergies, integration costs and transaction costs well Value bridge is delineated properly (synergies, costs) Alternative valuations NPV analyses with sensitivities and scenarios yields value range Multiple analysis is separately applied to all years Multiple values are based on selection of comparables Multiple valuation is correct and transparent
4. Discussion and conclusion Whereas the above detailed analysis takes current states of affairs pretty well into account, it does not stress future regulations, market developments and technological progress issues. Yet, regulatory developments were studied at length with the case firm and showed to be generally favourable. Taxa-tion advantages for unconventional energy sources are highly uncertain and are often addressed con-servatively. Also, market developments were taken into account, as the case description shows. Be-cause of market segmentation was assumed to a large extent, a local, regional or at most European approach was employed. This is in principle very well reasonable. However, the world’s energy mar-kets are much interwoven and linked to the global financial markets, as shown by the oil price drop in tandem with the Chinese financial markets crash in the summer of 2015. Also, in case of technologi-cal breakthroughs such as with the global shale gas revolution that marks a (temporary?) “end of peak oil”, markets become highly unpredictable. Consequently, price and volume volatilities skyrocket and highly deviant value scenarios may become true. Our checklist is built up as follows. First of all, one needs to be sure about what is being valued. The basic net present value calculation focuses on operations with a positive value and shows the com-plete value rundown (“value bridge”). Clean surplus accounting is crucial to decent calculations. Fixed assets, working capital, liabilities and equity must be addressed well. Since “cash is king”, cash flows prevail. All of the operating cash flows are taken into account here. Cost of capital calculations employ a financial markets perspective and are to be painstakingly split up per financial (equity, debt) instrument used. Terminal values calculations adopt the key value driver formula and assume an ero-sion of competitive advantages. Whereas the resulting stand-alone value is the key to the firm value, a buyer will also address post-acquisition costs and happily also revenues. Lastly, one may adopt alter-native valuation models, of which multiples methods may stand out. The checklist assesses net pre-sent values in a modern corporate finance theory sense. It is conventional in that operational cash flows are discounted with a weighted average cost of capital. Alternatives would be to use a flow to equity approach or an adjusted present value approach. Also, the checklist does not include real op-tions and leaves out gaming issues. Lastly, the checklist does not employ technical coefficients such as megawatt (MW) supply. Whereas at first sight being far from rocket science, developing a checklist such as ours is a long-winding and iterative undertaking, which does add to the existing academic literature. Key value drivers such as growth of revenues, EBITDA margins, capital expenditures and costs of capital are fairly generally shared across the literature (cf. Hawawini and Viallet, 2015). However, we further this literature firstly by singling out the valuation base. This is has to do with strategic reorientations in energy markets due to market liberalisation and regulation, as well as diverse technological devel-
47
opments in both the fossil fuel and the renewables business. Secondly, we emphasise accounting is-sues. While decent clean surplus accounting is of course necessary in the valuation of any company, proper accounting is crucial in the energy sector for the same reasons as just mentioned. Thirdly, cost of equity and debt issues are emphasised because of the changing businesses of the companies and the limited number of comparable companies in the market. Fourthly, terminal values are important be-cause of the long depreciation periods that are generally associated with assets in the energy sector and the limited number periods for which reliable detailed cash flow forecasts can be made. We hold that our approach has added value, but we also agree that its practical use diminishes over time. Not just therefore, it is useful to study additions to our approach. An example of this would be to calculate the return on assets, measured by gross sales to total assets (Novy-Marx, 2013) or (infla-tion-adjusted) return on total assets (Hall, 2014). Future researchers are encouraged to take our check-list as a starter for further exploring the valuation of energy firms with both fossil and renewable business. We have studied the case of a large Dutch firm, with also presence in near-by Europe and even beyond. It is interesting to see how cases from other countries fit with our valuation methodolo-gy. Although regulation issues, market developments and technological developments are industry-specific, valuing energy firms does in principle not differ from valuing firms in general. Our approach may therefore also be relevant in other industries, such as we have already been finding out ourselves with other cases. The key value drivers that have been singled out in our study are fairly generally shared across (heavy) industries. However, it is interesting to find out whether our focus on cost of capital issues (cf. Damodaran, 2015) is shared widely. Furthering all of what has been noted above, we hold that “a different energy future” (PwC, 2015) is a fascinating research object, especially to those who are interested in corporate valuation issues. Literature Damodaran, A. (2015). Applied Corporate Finance, Wiley, Hoboken NJ, 4th edition. EIA (2013). International Energy Outlook 2013, US Energy Information Administration, July. Hall, J.H. (2014). Toward improved use of value creation measures in financial decision making
http://www.mfsociety.org/modules/modDashboard/uploadFiles/conferences/MC20~473~p17qi11lhm1vqikr6niegmq1mcs4.pdf (working paper).
Hawawini, G., Viallet, C. (2015). Finance for Executives: Managing for Value Creation, Cengage Learning, Andover (Hampshire), 5th edition.
Koller, T., Goedhart, M., Wessels, D. (2015). Valuation: Measuring and Managing the Value of Companies, Wiley, Hoboken NJ, 6th Edition.
McCann, J.C. (2010). Industry Surveys: Electric Utilities, Standard and Poor’s Equity Research Ser-vices, New York NY. Novy-Marx, R. (2013). The other side of value: The gross profitability premium, Journal of Financial
Economics, 108(1), 1-28. PwC (2015). A different energy future. Where energy transformation is leading us.
http://www.pwc.com/gx/en/utilities/global-power-and-utilities-survey/, PwC Global Energy Util-ity and Mining group, May.