Seoul BRT - United Nations Centre for Regional … · Seoul BRT - Innovative system of meeting the...
20
Seoul BRT - Innovative system of meeting the travel demand - 2010. 8. 24 (The 5 th EST Forum in Bangkok) KWON, Young Jong A Senior Research Fellow, Korea Transport Institute
Transcript of Seoul BRT - United Nations Centre for Regional … · Seoul BRT - Innovative system of meeting the...
Seoul BRT
- Innovative system of meeting the travel demand -
2010. 8. 24
(The 5th EST Forum in Bangkok)
KWON, Young Jong
A Senior Research Fellow, Korea Transport Institute

Overview
I. Introduction of the Seoul Metropolitan Areas
II. Recent Travel Conditions and Patterns in the Seoul
Metropolitan Areas
III. Bus Rapid Transit Policy in the Seoul Metropolitan
Areas
I. Introduction of the Seoul
Metropolitan Areas
1. Area, Pop. and Economy
2. Suburbanization and Density

1. Location, Pop. and Economy
I. Introduction of the Seoul Metropolitan Areas
LocationFunction
Area(km2)
Population(1,000 person)
GRDP(billion $)
Entire Korea 99,678 (100%) 49,624 (100%) 8,178 (100%)
SMAs 11,739 (11.8%) 24,127 (48.6%) 3,870 (47.3%)
Seoul
Incheon
Kyunggi
605 (0.6%)
1,002 (1.0%)
10,132 (10.2%)
10,356 (20.9%)
2,664 (5.4%)
11,107 (22.4%)
1,851 (22.6%)
379 (4.6%)
1,640 (20.1%)
Pop., Area, &
Economy

2. Suburbanization and Development DensityI. Introduction of the Seoul Metropolitan Areas
Development
Density
• Early 1990s
• Housing-Oriented Sub.
• First-Dev. Then Transport
• Road-Oriented Tran. Pol.
Pop.Density(1000
per./㎢)
EmployeeDensity
(100Emp./㎢)
FirmDensity(100Firm/㎢)
SMA 2.06 6.65 1.28
Seoul
Incheon
Kyunggi
17.12
2.66
1.10
64.37
7.44
3.12
12.13
1.55
0.61
Suburbanization

II. Recent Travel Conditions and Patterns
in the Seoul Metropolitan Areas
1. Increasing Travel Demand and Modal Split
2. Increasing Travel Distance and Worsening Traffic
Congestion

1. Increasing Travel Demand and Modal Split
II. Recent Travel Condition and Pattern
in the Seoul Metropolitan Areas
Population
(1,000)
Car Registration
(1,000)
Car Trips
(1,000)
Metropolitan
Area
Yr. 2002 22,877 6,484 4,748
Yr. 2006 24,127 7,319 5,587
Change (%) 5.5% 12.9% 17.7%
Seoul
Yr. 2002 10,281 2,691 2,054
Yr. 2006 10,356 2,852 2,260
Change (%) 0.7% 6.0% 10.0%
Trend ofPopulation,
Car Registrationand Car Trips
29.3% 32.9% 35.4%
53.4%52.6% 51.5%
17.3% 14.5% 13.1%
0%
10%
20%
30%
40%
50%
60%
70%
80%
90%
100%
Yr 1996 Yr 2002 Yr 2006
Moda
l Spli
t
Private Cars Public Transit Etc.
Modal SplitTrend of Private Cars and Public
Transit

2. Increasing Travel Distance and Worsening
Traffic Congestion
II. Recent Travel Condition and Pattern
in the Seoul Metropolitan Areas
Seoul Incheon Kyunggi Metropolitan Area
Yr 1995 7.06㎞ 6.31㎞ 7.79㎞ 7.37㎞Yr 2000 6.58㎞ 6.06㎞ 8.19㎞ 7.41㎞Yr 2005 7.76㎞ 6.92㎞ 9.27㎞ 8.49㎞
Change
(‘95~’05)
0.7㎞(110.02%)
0.61㎞(109.67%)
1.48㎞(119.00%)
1.12㎞(115.20%)
Source: Korea Transport Institute (2008) “Impacts of School Supply Policy on Transportation in the Seoul Metropolitan Area,
Policy Meeting Report, p.53.
Change Trendof Commuting
Distance
a) Congestion costs of major cities (b) Trend of congestion costs for
0 1000 2000 3000 4000 5000 6000 7000
Traffic Congestion Cost(Unit: Billion KWR, $1=1,000KWR)
Seoul
Busan
Daegu
Incheon
Kwangju
Daejun
Ulsan
0
1000
2000
3000
4000
5000
6000
7000
8000
1996 1997 1998 1999 2000 2001 2002 2003 2004 2005 2006
Year
Congestion C
ost(U
nit:
Billion K
WR)
Source: Cho and Shim (2008)
Road congestion
costs

III. Bus Rapid Transit Policy in
the Seoul Metropolitan Areas
1. New Town Development and TOD
2. Case Study: Unjeong New Town TOD Project
3. TOD and Housing Policy in Seoul
4. Regional BRT Plan and Policy
5. BRT Operation and Construction Plan in the Seoul
City

1. New Town Development and TOD
New Town
Development
1st New Towns
2nd New Towns
3rd New Towns
Yr. 1989-1995
1.2M People
Yr. 2003-2010
0.4 M People
Yr. 2007-2013
0.15 M People
Policy
Changes
1st New Towns
2nd New Towns
• Pop. Decentralization
• Stabilizing Housing Price
• Housing-Oriented Dev.
• Dev. First, then Transport
• Self-Sufficiency
• Relatively Low-Density for
Env. Preservation
• New Town TOD
3rd New Towns
• Same as 2nd NT Dev.
• Stabilizing Housing Price
esp. Kangnam-subcenter area
III. Bus Rapid Transit Policy in the Seoul Metropolitan Areas

2. Case Study: Unjeong New Town TOD Prj.
Source: Kim(2006)
Land Use Plan & Rail StationsLand Use Plan & Rail Stations
Unjeong Stn.
New Stn.
Land Use Plan & Rail StationsLand Use Plan & Rail StationsLand Use Plan & Rail StationsLand Use Plan & Rail Stations
Unjeong Stn.Unjeong Stn.
New Stn.New Stn.
Time Span 2004.12~2009.12
Developer Korea National Housing
Corporation +
Paju City
Develop.
Outline
Area: 9,407,766㎡Population: 124,898 persons
(46,256 households)
Density: 133 persons/ha
Land Use Plan Area Ratio
Total 9,407,766㎡ 100.0%
Residential 3,248,327㎡ 34.6%
Park& Green 2,851,160㎡ 30.3%
Road 1,446,830㎡ 15.3%
School 488,002㎡ 5.2%
Commercial 411,502㎡ 4.4%
Others 1,264,274㎡ 13.4%
LocationDevelopment
Plan
Source: Kho(2006)
III. Bus Rapid Transit Policy in the Seoul Metropolitan Areas
Seoul
3 2
1
6
5
7
4
BRT-C
BRT-A
BRT-B
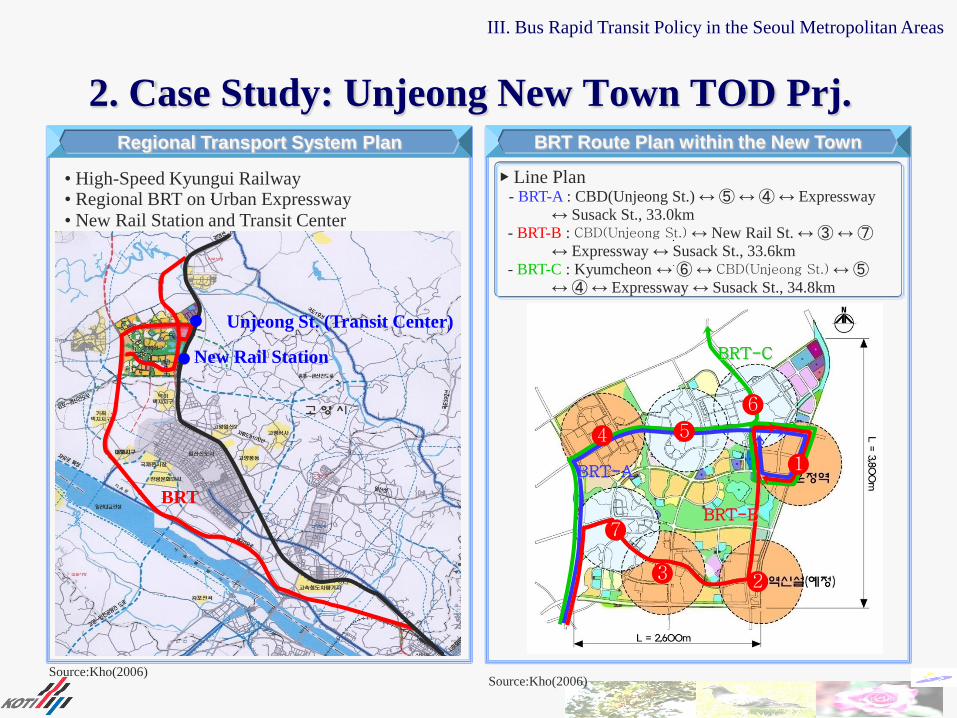
▶ Line Plan- BRT-A : CBD(Unjeong St.) ↔ ⑤ ↔ ④ ↔ Expressway
↔ Susack St., 33.0km
- BRT-B : CBD(Unjeong St.) ↔ New Rail St. ↔ ③ ↔ ⑦↔ Expressway ↔ Susack St., 33.6km
- BRT-C : Kyumcheon ↔ ⑥ ↔ CBD(Unjeong St.) ↔ ⑤↔ ④ ↔ Expressway ↔ Susack St., 34.8km
2. Case Study: Unjeong New Town TOD Prj.
Source:Kho(2006)
Regional Transport System Plan
• High-Speed Kyungui Railway• Regional BRT on Urban Expressway
• New Rail Station and Transit Center
Unjeong St. (Transit Center)
New Rail Station
BRT
BRT Route Plan within the New Town
Source:Kho(2006)
III. Bus Rapid Transit Policy in the Seoul Metropolitan Areas

2. Case Study: Unjeong New Town TOD Prj.
Source:Kho(2006)Source:Kho(2006)
Unjeong St. Transit Center
Travel Demand of Unjeong St. in 2029
Unjeong
Station
Transfer Modes
Walking BusCar
Taxi BikePark & Ride Kiss & Ride
Getting On 28,043 16,981 9,316 437 1,181 84 44
Getting Off 28,139 17,039 9,940 439 677 44
(Unit: Person/Day)
Location of Unjeong St. Transit Center Transit Center
Transit Center
III. Bus Rapid Transit Policy in the Seoul Metropolitan Areas
Bus & Ride
Bus & Ride
Park & Ride

3. TOD and Housing Supply Policy in the city of Seoul
Walking-
Available
Distance
Rail station
Underground
Non-residential use
High-density
residential use
Dev
elop
men
t Den
sityDistance
Low-density residential use
Walking-
Available
Distance
Rail station
Underground
Non-residential use
High-density
residential use
Dev
elop
men
t Den
sityDistance
Low-density residential use
• Late Prof. Kang’s “Rosario” Concept in 1980
• Coordination b/w subway construction plan and urban development within the city
• Inducing all development to accommodate population growth in 2000 (10 M people)
• Urban Comprehensive Plan (Yr 1992 and Yr 1997)
• However, not succeeded because of new town development by the central government
Rosario
Concept
• Housing Supply Plan for 160,000 HHs in the Rail Station Area until Yr. 2018
• Long-term rental housing for 30,000 HHs (Low-income group, the elderly, etc)
• Incentives: releasing such regulations as FAR, Height for development through
upzoning
Current
Plan(2008)
III. Bus Rapid Transit Policy in the Seoul Metropolitan Areas
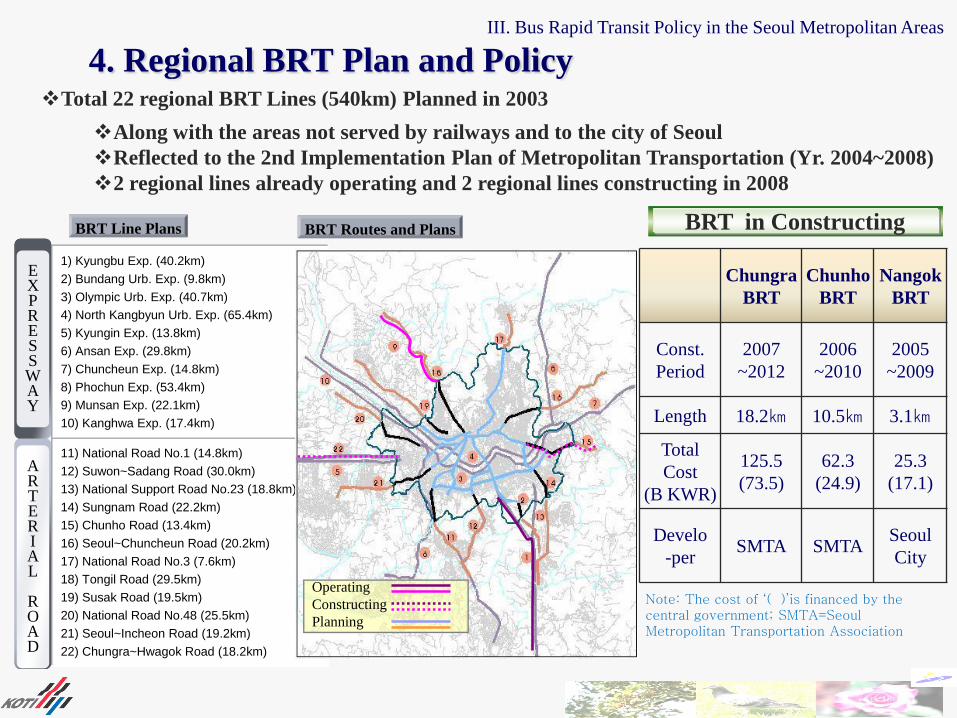
4. Regional BRT Plan and PolicyIII. Bus Rapid Transit Policy in the Seoul Metropolitan Areas
BRT Line Plans BRT Routes and Plans
EXPRESSWAY
1) Kyungbu Exp. (40.2km)
2) Bundang Urb. Exp. (9.8km)
3) Olympic Urb. Exp. (40.7km)
4) North Kangbyun Urb. Exp. (65.4km)
5) Kyungin Exp. (13.8km)
6) Ansan Exp. (29.8km)
7) Chuncheun Exp. (14.8km)
8) Phochun Exp. (53.4km)
9) Munsan Exp. (22.1km)
10) Kanghwa Exp. (17.4km)
ARTERIAL
ROAD
11) National Road No.1 (14.8km)
12) Suwon~Sadang Road (30.0km)
13) National Support Road No.23 (18.8km)
14) Sungnam Road (22.2km)
15) Chunho Road (13.4km)
16) Seoul~Chuncheun Road (20.2km)
17) National Road No.3 (7.6km)
18) Tongil Road (29.5km)
19) Susak Road (19.5km)
20) National Road No.48 (25.5km)
21) Seoul~Incheon Road (19.2km)
22) Chungra~Hwagok Road (18.2km)
Operating
Constructing
Planning
BRT Line Plans BRT Routes and Plans
EXPRESSWAY
EXPRESSWAY
1) Kyungbu Exp. (40.2km)
2) Bundang Urb. Exp. (9.8km)
3) Olympic Urb. Exp. (40.7km)
4) North Kangbyun Urb. Exp. (65.4km)
5) Kyungin Exp. (13.8km)
6) Ansan Exp. (29.8km)
7) Chuncheun Exp. (14.8km)
8) Phochun Exp. (53.4km)
9) Munsan Exp. (22.1km)
10) Kanghwa Exp. (17.4km)
ARTERIAL
ROAD
ARTERIAL
ROAD
11) National Road No.1 (14.8km)
12) Suwon~Sadang Road (30.0km)
13) National Support Road No.23 (18.8km)
14) Sungnam Road (22.2km)
15) Chunho Road (13.4km)
16) Seoul~Chuncheun Road (20.2km)
17) National Road No.3 (7.6km)
18) Tongil Road (29.5km)
19) Susak Road (19.5km)
20) National Road No.48 (25.5km)
21) Seoul~Incheon Road (19.2km)
22) Chungra~Hwagok Road (18.2km)
Operating
Constructing
Planning
Chungra
BRT
Chunho
BRT
Nangok
BRT
Const.
Period
2007
~2012
2006
~2010
2005
~2009
Length 18.2㎞ 10.5㎞ 3.1㎞
Total
Cost
(B KWR)
125.5
(73.5)
62.3
(24.9)
25.3
(17.1)
Develo
-perSMTA SMTA
Seoul
City
BRT in Constructing
Total 22 regional BRT Lines (540km) Planned in 2003
Along with the areas not served by railways and to the city of Seoul
Reflected to the 2nd Implementation Plan of Metropolitan Transportation (Yr. 2004~2008)
2 regional lines already operating and 2 regional lines constructing in 2008
BRT Line Plans BRT Routes and Plans
EXPRESSWAY
1) Kyungbu Exp. (40.2km)
2) Bundang Urb. Exp. (9.8km)
3) Olympic Urb. Exp. (40.7km)
4) North Kangbyun Urb. Exp. (65.4km)
5) Kyungin Exp. (13.8km)
6) Ansan Exp. (29.8km)
7) Chuncheun Exp. (14.8km)
8) Phochun Exp. (53.4km)
9) Munsan Exp. (22.1km)
10) Kanghwa Exp. (17.4km)
ARTERIAL
ROAD
11) National Road No.1 (14.8km)
12) Suwon~Sadang Road (30.0km)
13) National Support Road No.23 (18.8km)
14) Sungnam Road (22.2km)
15) Chunho Road (13.4km)
16) Seoul~Chuncheun Road (20.2km)
17) National Road No.3 (7.6km)
18) Tongil Road (29.5km)
19) Susak Road (19.5km)
20) National Road No.48 (25.5km)
21) Seoul~Incheon Road (19.2km)
22) Chungra~Hwagok Road (18.2km)
Operating
Constructing
Planning
BRT Line Plans BRT Routes and Plans
EXPRESSWAY
EXPRESSWAY
1) Kyungbu Exp. (40.2km)
2) Bundang Urb. Exp. (9.8km)
3) Olympic Urb. Exp. (40.7km)
4) North Kangbyun Urb. Exp. (65.4km)
5) Kyungin Exp. (13.8km)
6) Ansan Exp. (29.8km)
7) Chuncheun Exp. (14.8km)
8) Phochun Exp. (53.4km)
9) Munsan Exp. (22.1km)
10) Kanghwa Exp. (17.4km)
ARTERIAL
ROAD
ARTERIAL
ROAD
11) National Road No.1 (14.8km)
12) Suwon~Sadang Road (30.0km)
13) National Support Road No.23 (18.8km)
14) Sungnam Road (22.2km)
15) Chunho Road (13.4km)
16) Seoul~Chuncheun Road (20.2km)
17) National Road No.3 (7.6km)
18) Tongil Road (29.5km)
19) Susak Road (19.5km)
20) National Road No.48 (25.5km)
21) Seoul~Incheon Road (19.2km)
22) Chungra~Hwagok Road (18.2km)
Operating
Constructing
Planning
Note: The cost of ‘( )’is financed by the central government; SMTA=Seoul Metropolitan Transportation Association

4. Regional BRT Plan and Policy
III. Bus Rapid Transit Policy in the Seoul Metropolitan Areas
Kyungbu Expressway BRT Susack BRT
Opening in 2008
Total Length = 44.8km
Operating fr. 7 to 21
O’clock
Kyungbu Inter-regional
Expressway
190,000 → 250,000 trips
per day
Opening in 2006
24-hour operating on the
arterial road
Total Length = 15.6km
Travel time decreased
up to 11 min. for bus and
3 min. for car
5. BRT Planning and Policy in Seoul
III. Bus Rapid Transit Policy in the Seoul Metropolitan Areas
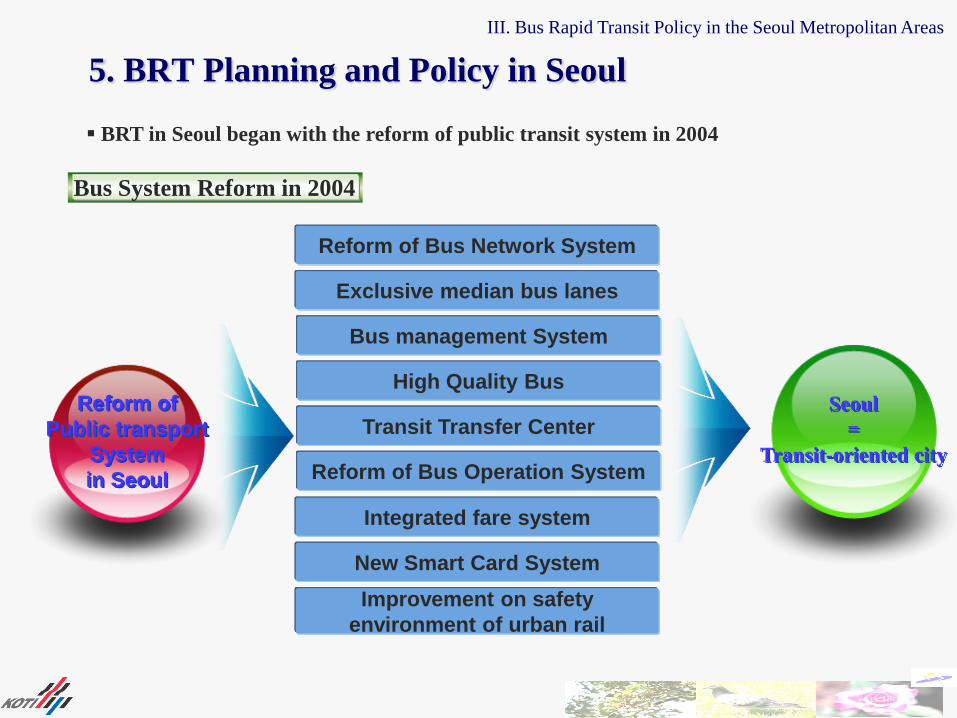
Reform of
Public transport
System
in Seoul
Reform of Bus Network System
Exclusive median bus lanes
Seoul
=
Transit-oriented city
Bus management System
High Quality Bus
Transit Transfer Center
Reform of Bus Operation System
New Smart Card System
Improvement on safety
environment of urban rail
Integrated fare system
Bus System Reform in 2004
BRT in Seoul began with the reform of public transit system in 2004

5. BRT Plan and Policy in Seoul
III. Bus Rapid Transit Policy in the Seoul Metropolitan Areas
Punctuality
Speed
LineDist
(km)
T-time
(min)
Deviation from
Schedule
(Bus_min)
Deviation from
Schedule
(Car_min)
Dobong-Mia 15.2 44.3 2.7 15.3
Susack-Sungsan 6.8 18.1 1.2 15.6
Kangnam 4.8 16.7 1.3 4.6
Ridership
Safety
• Number of Traffic Accident
7,966 ⇒ 5,971 (25% decreased)
• Number of Deaths
60 ⇒ 41 (31.7% decreased)
• Source : http://www.seoul.go.kr
Before: the 4th quarter of 2004
After: the 4th quarter of 2005
Evaluation of BRT Operation Performance in the City of Seoul

5. BRT Plan and Policy in Seoul
III. Bus Rapid Transit Policy in the Seoul Metropolitan Areas
Additional BRT Lines and Plan in the city of Seoul
BRT Line Opening Time Length
Chunho-Hajeong 2003.7 7.6Km
Dobond-Mia
2004.7
15.8Km
Susack-Sungsan 6.8 Km
Kangnam(Samil Road) 5.9 Km
Mangou2005.7
4.8 Km
Kyungin 6.8 Km
Sheung·Daebang 2005.12 9.4 Km
Hangang2006.12
5.5 Km
Mapho 5.3 Km
Songpa 2007..1 5.6 Km
Total BRT lines = 10 in 2008
Total BRT Length =73.5 km in 2008
Add 5 lines (44.1km) in 2009

End….
Thanks !