Sensitivity of population smoke exposure to fire locations ...
20
Sensitivity of population smoke exposure to fire locations in Equatorial Asia Citation Kim, Patrick S., Daniel J. Jacob, Loretta J. Mickley, Shannon N. Koplitz, Miriam E. Marlier, Ruth S. DeFries, Samuel S. Myers, Boon Ning Chew, and Yuhao H. Mao. 2015. “Sensitivity of Population Smoke Exposure to Fire Locations in Equatorial Asia.” Atmospheric Environment 102 (February): 11–17. doi:10.1016/j.atmosenv.2014.09.045. Published Version doi:10.1016/j.atmosenv.2014.09.045 Permanent link http://nrs.harvard.edu/urn-3:HUL.InstRepos:14550027 Terms of Use This article was downloaded from Harvard University’s DASH repository, and is made available under the terms and conditions applicable to Open Access Policy Articles, as set forth at http:// nrs.harvard.edu/urn-3:HUL.InstRepos:dash.current.terms-of-use#OAP Share Your Story The Harvard community has made this article openly available. Please share how this access benefits you. Submit a story . Accessibility
Transcript of Sensitivity of population smoke exposure to fire locations ...

Sensitivity of population smoke exposure to fire locations in Equatorial Asia
CitationKim, Patrick S., Daniel J. Jacob, Loretta J. Mickley, Shannon N. Koplitz, Miriam E. Marlier, Ruth S. DeFries, Samuel S. Myers, Boon Ning Chew, and Yuhao H. Mao. 2015. “Sensitivity of Population Smoke Exposure to Fire Locations in Equatorial Asia.” Atmospheric Environment 102 (February): 11–17. doi:10.1016/j.atmosenv.2014.09.045.
Published Versiondoi:10.1016/j.atmosenv.2014.09.045
Permanent linkhttp://nrs.harvard.edu/urn-3:HUL.InstRepos:14550027
Terms of UseThis article was downloaded from Harvard University’s DASH repository, and is made available under the terms and conditions applicable to Open Access Policy Articles, as set forth at http://nrs.harvard.edu/urn-3:HUL.InstRepos:dash.current.terms-of-use#OAP
Share Your StoryThe Harvard community has made this article openly available.Please share how this access benefits you. Submit a story .
Accessibility

1
Sensitivity of population smoke exposure to fire locations in Equatorial Asia 1
Patrick S. Kim1,*, Daniel J. Jacob1,2, Loretta Mickley2, Shannon Koplitz1, Miriam E. 2
Marlier3, Ruth DeFries3, Samuel S. Myers4,5, Boon Ning Chew6 3
4
1Department of Earth and Planetary Sciences, Harvard University, Cambridge, MA, USA 5
2School of Engineering and Applied Sciences, Harvard University, Cambridge, MA, 6
USA 7
3Department of Ecology, Evolution, and Environmental Biology, Columbia University, 8
New York, NY, USA 9
4Department of Environmental Health, Harvard School of Public Health, Harvard 10
University, Cambridge, MA, USA 11
5Harvard University Center for the Environment, Harvard University, Cambridge, MA, 12
USA 13
6Centre for Remote Imaging, Sensing and Processing, National University of Singapore, 14
Singapore 15
16
Corresponding Author: Patrick S. Kim, Department of Earth and Planetary Sciences, 17
Harvard University, Cambridge, MA 02138, USA. ([email protected]) 18
19
20
21
22
23

2
Key Points 24
25
1) Smoke exposure sensitivity to Equatorial Asian fires computed with adjoint model 26
2) Protecting Sumatran peatswamp forests is key to future regional air quality 27
3) GEOS-Chem adjoint can provide guidance for targeted land conservation 28
29
Abstract 30
31
Land clearing by fire in Equatorial Asia, a substantial fraction for conversion to 32
oil palm plantations, can lead to high smoke concentrations across this densely populated 33
region and represents a serious public health concern. Here we use the adjoint of the 34
GEOS-Chem chemical transport model to show that population exposure to the smoke is 35
highly dependent on where the fires from clearing (and other activities) take place. In 36
2006, we find that Sumatran fires disproportionately contributed to the regional 37
population-weighted smoke exposure (37% of regional fire emissions, 63% of the 38
exposure). The information from the adjoint can provide guidance for targeted land 39
conservation as oil palm agriculture expands. Protecting peatswamp forests in Southeast 40
Sumatra emerges as a high priority. We present the adjoint as a tool that can be useful in 41
a cost-benefit analysis to inform policymakers on the relative merits of targeting 42
conservation in different regions of Equatorial Asia. 43
44
Index Terms 45
0305 Aerosols and particles (0345, 4801, 4906) 46

3
0345 Pollution: urban and regional (0305, 0478, 4251, 4325) 47
0365 Troposphere: composition and chemistry 48
3355 Regional modeling (4316) 49
50
Keywords 51
Equatorial Asia, Adjoint, Palm Oil, Fire, Conservation, Population-Exposure 52
53
1. Introduction 54
55
Global palm oil production has more than doubled since 2000 in response to 56
soaring demand [FAO, 2013]. Indonesia and Malaysia together account for 86% of the 57
world’s production and Indonesia plans to double its output by 2020 [AFP, 2009; Koh 58
and Ghazoul, 2010]. The demand for palm oil is driving rapid deforestation to clear land 59
for new plantations [Koh et al., 2011; Miettinen et al. 2012]. As a result, the area covered 60
by oil palm plantations in Indonesia tripled from 2000 to 2012 [FAO, 2013]. The land is 61
mainly cleared by fire since it is the most economical method available. The resulting 62
smoke pollutes the airshed of one of the most densely populated regions of the world. 63
According to Marlier et al. [2013], the unusually large fire season of 1997 resulted in 64
10,000 excess deaths from smoke exposure in Equatorial Asia. More recently, Sumatran 65
fires in June 2013 caused a 24-h maximum smoke concentration of 300 µg m-3 in 66
Singapore, far exceeding the 25 µg m-3 air quality guideline from the World Health 67
Organization [WHO, 2005]. 68

4
The fire season in Equatorial Asia is July - November (dry season), with large 69
interannual variation in intensity, as illustrated in Figure 1 by comparison of 2006 (a high 70
fire year) to the 2004 - 2010 average. This variability is largely driven by dry conditions 71
related to the El Nino-Southern Oscillation. Dry conditions also increase the likelihood of 72
escaped, or unintentional, fires to burn out of control [Reid et al., 2013]. There is less 73
interannual variability in the location of the fires, as land conversion presently takes place 74
mostly in the South Sumatran lowlands and the southern and western coasts of Borneo 75
[Miettinen et al., 2010]. The fire plumes are transported by a prevailing southeasterly to 76
southwesterly flow (Figure 1) such that some population centers are minimally affected 77
by the smoke (e.g., Jakarta), while others are heavily affected (e.g., Singapore). This 78
difference in impact has important political implications for land management, but also 79
suggests opportunities, as some potential oil palm development regions (western Borneo, 80
northern Sumatra) might lead to much smaller overall population exposure to smoke than 81
other regions (southern Sumatra). The analysis below using the adjoint of the GEOS-82
Chem chemical transport model (CTM) allows us to identify where fires could most 83
effectively be restricted to reduce population exposure and to readily determine the air 84
pollution exposure associated with any future land management scenario. 85
86
2. Methods 87
88
The GEOS-Chem CTM is driven by Goddard Earth Observing System (GEOS-5) 89
assimilated meteorological data from the NASA Modeling and Assimilation Office 90
(GMAO). The data have a native horizontal resolution of 0.50° x 0.67° with 72 pressure 91
5
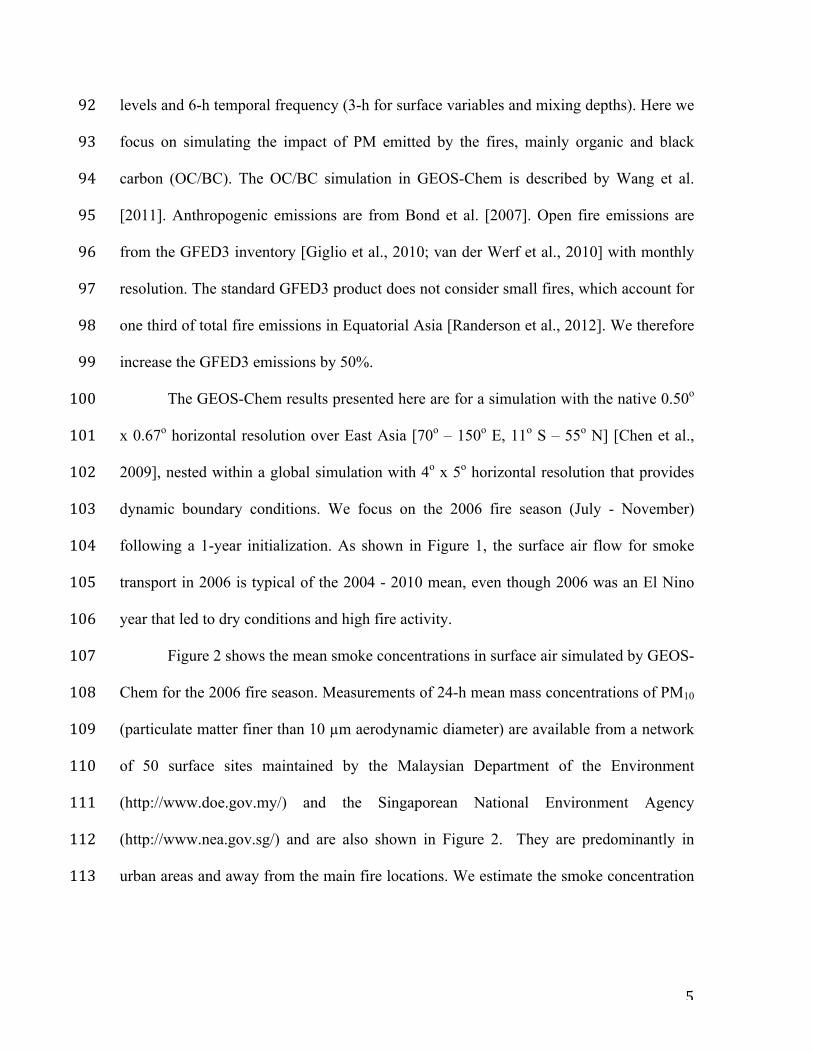
levels and 6-h temporal frequency (3-h for surface variables and mixing depths). Here we 92
focus on simulating the impact of PM emitted by the fires, mainly organic and black 93
carbon (OC/BC). The OC/BC simulation in GEOS-Chem is described by Wang et al. 94
[2011]. Anthropogenic emissions are from Bond et al. [2007]. Open fire emissions are 95
from the GFED3 inventory [Giglio et al., 2010; van der Werf et al., 2010] with monthly 96
resolution. The standard GFED3 product does not consider small fires, which account for 97
one third of total fire emissions in Equatorial Asia [Randerson et al., 2012]. We therefore 98
increase the GFED3 emissions by 50%. 99
The GEOS-Chem results presented here are for a simulation with the native 0.50o 100
x 0.67o horizontal resolution over East Asia [70o – 150o E, 11o S – 55o N] [Chen et al., 101
2009], nested within a global simulation with 4o x 5o horizontal resolution that provides 102
dynamic boundary conditions. We focus on the 2006 fire season (July - November) 103
following a 1-year initialization. As shown in Figure 1, the surface air flow for smoke 104
transport in 2006 is typical of the 2004 - 2010 mean, even though 2006 was an El Nino 105
year that led to dry conditions and high fire activity. 106
Figure 2 shows the mean smoke concentrations in surface air simulated by GEOS-107
Chem for the 2006 fire season. Measurements of 24-h mean mass concentrations of PM10 108
(particulate matter finer than 10 µm aerodynamic diameter) are available from a network 109
of 50 surface sites maintained by the Malaysian Department of the Environment 110
(http://www.doe.gov.my/) and the Singaporean National Environment Agency 111
(http://www.nea.gov.sg/) and are also shown in Figure 2. They are predominantly in 112
urban areas and away from the main fire locations. We estimate the smoke concentration 113

6
at each site in the observations by subtracting the mean concentration for the bracketing 114
non-burning months (June and December). 115
There are frequent events with smoke in excess of 100 µg m-3 and these are 116
captured by the model, as illustrated in Figure 2 for Singapore and Sibu (Borneo). 117
Observed July - November mean smoke concentrations are typically in the range of 10-118
50 µg m-3 and this is again well captured by the model, with r = 0.84 for the spatial 119
pattern shown in Figure 2 (n = 50). GEOS-Chem underestimates the mean smoke 120
concentration on Malaysian Borneo (the northern coast), which may be due to the 121
inability of the model to resolve fine-scale transport around the Tama Abu mountain 122
range on the island [Wang et al., 2013]. The model simulates seasonal mean smoke 123
concentrations in excess of 100 µg m-3 in southern Sumatra and southern Borneo but 124
there are no observations there. This includes the city of Palembang (1.5 million people) 125
in southern Sumatra (Figure 1). 126
We use the adjoint of GEOS-Chem v34 [Henze et al., 2007] for source attribution 127
of the simulated smoke concentrations at selected receptor sites and for the Equatorial 128
Asian population as a whole over the July - November duration of the fire season [to, t1]. 129
A single simulation with the adjoint model operating backward in time over [t1, to] yields 130
the complete time-dependent footprint of sources contributing to the smoke 131
concentrations at a particular receptor site and for any averaging time. 132
Smoke concentrations in GEOS-Chem are proportional to the fire emissions so 133
that the total smoke PM(xR, t’) concentration at receptor site xR and time t’ is given by 134
135
PM (xR ,t ') =∂PM (xR ,t ')∂E(x,t)
E(x,t)dxdtx!∫∫to
t '∫ [1]
136

7
where E(x, t) is the emission flux (g m-2 s-1) at location x and time t < t’, to is the 137
beginning of the fire season, and the spatial integration is over the entire emitting domain. 138
One adjoint simulation conducted over the time period [t1, to] provides the ensemble of 139
sensitivities ∂PM(xR, t’)/∂E(x, t) for the PM concentration at a selected receptor site xR 140
and at all times t’ to the emissions for all domain grid squares (x) and all prior times (t < 141
t’). Instead of a single location for a receptor site, the adjoint can also provide the same 142
ensemble of sensitivities for the population-weighted mean smoke concentration (𝑃𝑀) 143
over the entire Equatorial Asian domain (i.e. ∂𝑃𝑀(t’)/∂E(x, t)). 144
145
3. Results and Discussion 146
147
Figure 3 shows the sensitivities of mean smoke concentrations during July – 148
November 2006 to the mean emissions over the same time period for four receptor sites 149
(Singapore, Jakarta, Palembang, and the population-weighted region). The sensitivities 150
highlight the difference in exposure to the same emissions, but in different locations, and 151
they are very different for the receptor sites shown. Singapore is particularly sensitive to 152
fires in southeastern Sumatra. Jakarta has no sensitivity to fires in Sumatra or Borneo but 153
high sensitivity to fires in Java and islands to the east. The population-weighted smoke 154
concentration is much more sensitive to fires in Sumatra than in Borneo. It is most 155
sensitive to fires in Java but fire activity there is low. 156
The sensitivities computed in this manner for selected receptor sites can be 157
combined with knowledge of emission patterns to immediately deduce the smoke 158
concentrations at the receptor site and the contributions from different source regions. 159

8
The sensitivities are dependent on meteorological conditions, but the July-November 160
2006 period used seems typical of climatological conditions (Figure 1). 161
Present-day fires in Equatorial Asia are concentrated most in southeastern 162
Sumatra and southern Borneo (Figure 1). Figure 4 shows the resulting contributions to 163
annual mean smoke concentrations for 2006 in Singapore and for all of Equatorial Asia 164
weighted by population. Sumatra was responsible for 37% of total fire emissions in 165
Equatorial Asia in 2006 but contributed to 64% of the smoke concentration in Singapore 166
and 63% of the smoke concentration to which the ensemble of the Equatorial Asian 167
population was exposed. Preventing fire emissions in Southeast Sumatra would be of 168
considerable benefit to Singapore and also benefit the region as a whole. 169
The adjoint sensitivities can be readily applied to any future emission scenario to 170
derive the resulting population exposure to smoke. Marlier [2014] describes two possible 171
2009-2032 scenarios for Sumatra, a “High Oil Palm” scenario with plantation expansion 172
into peatswamp forest (where fuel loads are particularly high), and a “Peat Protection” 173
scenario where all remaining peatswamp forests are preserved. Figure 5 shows their mean 174
fire season emissions for present-day (2004-2010, 256 Gg a-1 for all of Sumatra), the 175
High Oil Palm scenario (414 Gg a-1) and the Peat Protection scenario (186 Gg a-1). Their 176
present-day emission estimates are 40% lower than ours for the same time period, likely 177
due to their explicit treatment of small fires compared to our application of a scale factor 178
as correction to the standard GFED3 product (Figure 1). We have some confidence in our 179
estimate on the basis of better comparisons to observed smoke concentrations (Figure 2). 180
The Marlier [2014] present-day Sumatran emissions nevertheless serve as a baseline 181
against which their future projections can be compared. 182

9
The annual mean smoke concentrations from Sumatran fires, as obtained by 183
applying the adjoint sensitivities to the Marlier [2014] emissions, are shown inset in 184
Figure 5 for Singapore and for population-weighted Equatorial Asia. Values are low 185
compared to Figure 2 because they are annual means for an average fire year, consider 186
only Sumatran fires, and assume a lower base emission estimate, as discussed above. The 187
smoke concentration in Singapore drops for both future scenarios compared to present-188
day due to a shift of emissions away from Southeast Sumatra where Singapore is most 189
sensitive; by contrast, the population-weighted mean concentration increases by 60% 190
under the High Oil Palm scenario. The Peat Protection scenario reduces mean smoke 191
concentrations relative to the High Oil Palm scenario by a factor of 4 for Singapore and a 192
factor of 2 for the population-weighted mean. This example illustrates how the adjoint 193
sensitivities allow us to immediately assess the public health benefits of different land 194
management decisions in the region. 195
196
Acknowledgments 197
198
Data supporting Figure 2 is available upon request to BNC. Input files necessary for 199
GEOS-Chem are available at http://geos-chem.org/. 200
201
This work was funded by the Rockefeller Foundation and the Gordon and Betty Moore 202
Foundation through the Health & Ecosystems: Analysis of Linkages (HEAL) program, 203
and by a Department of Energy Office of Science Graduate Fellowship to PSK made 204
possible in part by the American Recovery and Reinvestment Act of 2009, administered 205

10
by ORISE-ORAU under contract no. DE-AC05-06OR23100. The authors would like to 206
thank Singapore's National Environment Agency and Malaysia's Department of 207
Environment for collecting and archiving the surface air quality data. We thank Zifeng 208
Lu for his assistance with the population data. 209
210
References 211
212
AFP (May, 27, 2009), Indonesia to double palm oil production by 2020, AFP Asian 213
Edition. Available at http://www.thefreelibrary.com/Indonesia+to+double+palm 214
+oil+production+by+2020-a01611882134. 215
Bond, T. C., E. Bhardwaj, R. Dong, R. Jogani, S. Jung, C. Roden, D. G. Streets, and N. 216
M. Trautmann (2007), Historical emissions of black and organic carbon aerosol 217
from energy-related combustion, 1850-2000, Global Biogeochem. Cycles, 21, 218
GB2018, doi:10.1029/2006GB002840. 219
Chen, D., Y. Wang, M. B. McElroy, K. He, R. M. Yantosca, and P. Le Sager (2009), 220
Regional CO pollution and export in China simulated by the high-resolution 221
nested-grid GEOS-Chem model, Atmos. Chem. Phys., 9, 3825-3839, 222
doi:10.5194/acp-9-3825-2009. 223
FAO (2013), FAOSTAT: Statistical Databases and Data-Sets, Food and Agriculture 224
Organization of the United Nations (FAO), Rome, Italy. 225
Giglio, L., J. T. Randerson, G. R. van der Werf, P. S. Kasibhatla, G. J. Collatz, D C. 226
Morton, and R. S. DeFries (2010), Assessing variability and long-term trends in 227

11
burned area by merging multiple satellite fire products, Biogeosciences, 7, 1171-228
1186, doi:10.5194/bg-7-1171-2010. 229
Henze, D. K., A. Hakami, and J. H. Seinfeld (2007), Development of the adjoint of 230
GEOS-Chem, Atmos. Chem. Phys., 7, 2413-2433, doi:10.5194/acp-7-2413-2007. 231
Koh, L. P. and J. Ghazoul (2010), Spatially explicit scenario analysis for reconciling 232
agricultural expansion, forest protection, and carbon conservation in Indonesia, 233
Proc. Natl. Acad. Sci., 107, 11140-11144, doi:10.1073/pnas.1000530107. 234
Koh, L. P., J. Miettinen, S. C. Liew, and J. Ghazoul (2011), Remotely sensed evidence of 235
tropical pealand conversion to oil palm, Proc. Natl. Acad. Sci., 108, 5127-5132, 236
doi:10.1073/pnas.1018776108. 237
Marlier, M. E., R. S. DeFries, A. Voulgarakis, P. L. Kinney, J. T. Randerson, D. T. 238
Shindell, Y. Chen, and G. Faluvegi (2013), El Nino and health risks from 239
landscape fire emissions in southeast Asia, Nature Climate Change, 3, 131-136, 240
doi:10.1038/nclimate1658. 241
Marlier, M. E. (2014), Public health impacts from fires in tropical landscapes, Ph.D. 242
thesis, Department of Earth and Environmental Sciences, Columbia University, 243
New York, NY, USA. 244
Miettinen, J., C. Shi, and S. C. Liew (2010), Deforestation rates in insular Southeast Asia 245
between 2000 and 2010, Global Change Biology, 17, 2261-2270, 246
doi:10.1111/j.1365-2486.2011.02398.x. 247
Mietinnen, J., A. Hooijer, C. Shi, D. Tollenaar, R. Vernimmen, S. C. Liew, C. Malins, 248
and S. E. Page (2012), Extent of industrial plantations on Southeast Asian 249

12
peatlands in 2010 with analysis of historical expansion and future projections, 250
GCB Bioenergy, 4, 908-918, doi:10.1111/j.1757-1707.2012.01172.x. 251
Oak Ridge National Laboratory (ORNL): LandScan High Resolution Global Population 252
Data Set (http://web.ornl.gov/sci/landscan/landscan_documentation.shtml), Oak 253
Ridge National Laboratory, Oak Ridge, TN, USA, 2011. 254
Randerson, J. T., Y. Chen, G. R. van der Werf, B. M. Rogers, and D. C. Morton (2012), 255
Global burned area and biomass burning emissions from small fires, J. Geophys. 256
Res., 117, G04012, doi:10.1029/2012JG002128. 257
Reid, J. S., E. J. Hyer, R. S. Johnson, B. N. Holben, R. J. Yokelson, J. Zhang, J. R. 258
Campbell, S. A. Christopher, L. DiGirolamo, L. Giglio, R. E. Holz, C. Kearney, J. 259
Miettinen, E. A. Reid, F. J. Turk, J. Wang, P. Xian, G. Zhao, R. Balasubramanian, 260
B. N. Chew, S. Janjai, N. Lagrosas, P. Lestari, N.-H. Lin, M. Mahmud, A. X. 261
Nguyen, B. Norris, N. T. K. Oanh, M. Oo, S. V. Salinas, E. J. Welton, S. C. Liew 262
(2013), Observing and understanding the Southeast Asian aerosol system by 263
remote sensing: An initial review and analysis for the Seven Southeast Asian 264
Studies (7SEAS) program, Atmos. Res., 122, 403-468, 265
doi:10.1016/j.atmosres.2012.06.005. 266
van der Werf, G. R., J. T. Randerson, L. Giglio, G. J. Collatz, M. Mu, P. S. Kasibhatla, D. 267
C. Morton, R. S. DeFries, Y. Jin, and T. T. Leeuwen (2010), Global fire emissions 268
and the contribution of deforestation, savanna, forest, agricultural, and peat fires 269
(1997-2009), Atmos. Chem. Phys., 10, 11707-11735, doi:10.5194/acp-10-11707-270
2010. 271

13
Wang, J., C. Ge, Z. Yang, E. J. Hyer, J. S. Reid, B.-N. Chew, M. Mahmud, Y. Zhang, and 272
M. Zhang (2013), Mesoscale modeling of smoke transport over the Southeast 273
Asian Continent: Interplay of sea breeze, trade wind, typhoon, and topography, 274
Atmos. Res., 122, 486-503, doi:10.1016/j.atmosres.2012.05.009. 275
Wang, Q., D. J. Jacob, J. A. Fisher, J. Mao, E. M. Leibensperger, C. C. Carouge, P. Le 276
Sager, Y. Kondo, J. L. Jimenez, M. J. Cubison, S. J. Doherty (2011), Sources of 277
carbonaceous aerosols and deposited black carbon in the Arctic in winter-spring: 278
implications for radiative forcing, Atmos. Chem. Phys., 11, 12453-12473, 279
doi:10.5194/acp-11-12453-2011. 280
WHO (2006), WHO Air quality guidelines for particulate matter, ozone, nitrogen dioxide 281
and sulfur dioxide. 282
283
Figure Captions 284
285
Figure 1: Fire emissions and mean 0-1 km vector winds in Equatorial Asia in July - 286
November. The top panel is for 2006 (a high fire year) and the bottom panel is the 2004-287
2010 mean. Fire emissions are from the GFED3 inventory, increased by 50% to account 288
for small fires (see text). Winds are from GEOS-5 assimilated meteorological data. Also 289
shown are the locations of cities with more than one million people. 290
291
Figure 2: Surface smoke concentration in Equatorial Asia, July – November 2006. The 292
top panel shows seasonal mean concentrations observed at a network of sites (circles; see 293
text for details) and simulated by GEOS-Chem. The bottom panels show the time series 294
14
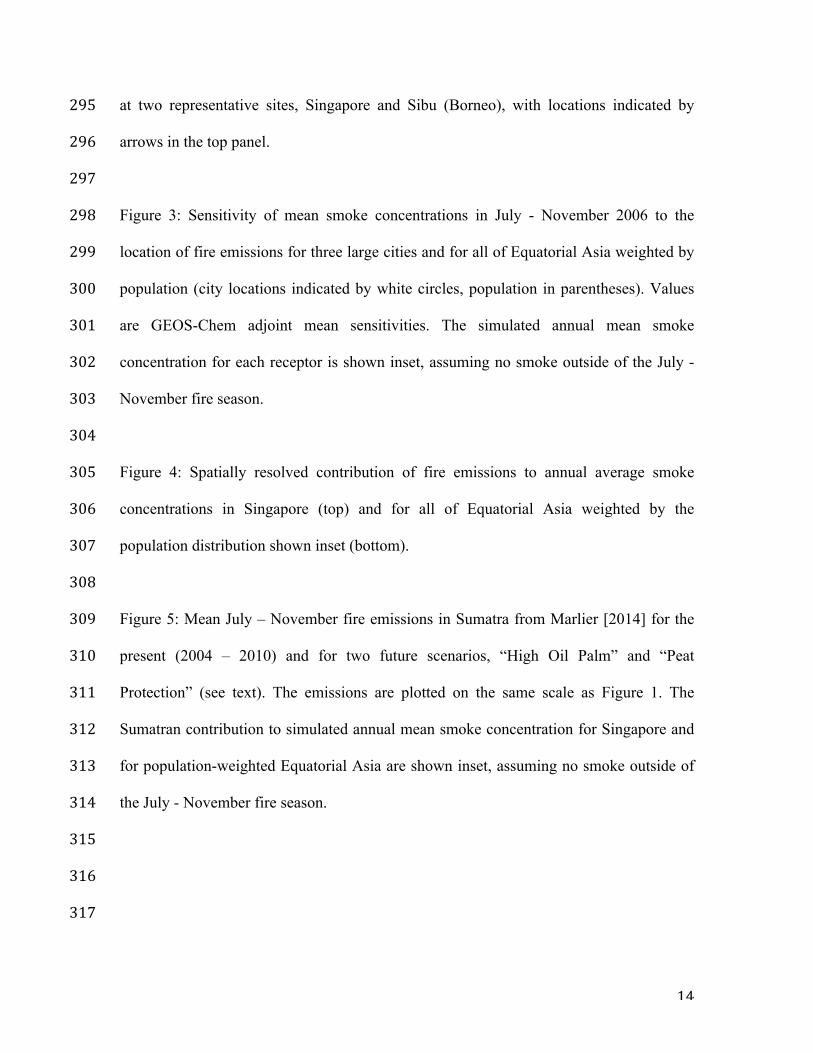
at two representative sites, Singapore and Sibu (Borneo), with locations indicated by 295
arrows in the top panel. 296
297
Figure 3: Sensitivity of mean smoke concentrations in July - November 2006 to the 298
location of fire emissions for three large cities and for all of Equatorial Asia weighted by 299
population (city locations indicated by white circles, population in parentheses). Values 300
are GEOS-Chem adjoint mean sensitivities. The simulated annual mean smoke 301
concentration for each receptor is shown inset, assuming no smoke outside of the July - 302
November fire season. 303
304
Figure 4: Spatially resolved contribution of fire emissions to annual average smoke 305
concentrations in Singapore (top) and for all of Equatorial Asia weighted by the 306
population distribution shown inset (bottom). 307
308
Figure 5: Mean July – November fire emissions in Sumatra from Marlier [2014] for the 309
present (2004 – 2010) and for two future scenarios, “High Oil Palm” and “Peat 310
Protection” (see text). The emissions are plotted on the same scale as Figure 1. The 311
Sumatran contribution to simulated annual mean smoke concentration for Singapore and 312
for population-weighted Equatorial Asia are shown inset, assuming no smoke outside of 313
the July - November fire season. 314
315
316
317

15
Figures 318
319
Figure 1 320
321
322
323
324
325
326
327
328
329
1 M5 M
City Size
Fire Emissions ( )
5 m/s
10 S
5 S
0
5 N
10 N
100 E 120 E 140 E
Jul - Nov 2006
Jul - Nov 2004 - 2010
ug m s-2 -1
0.001 0.002 0.005 0.01 0.02 0.05 0.1 0.2 0.5 1.0
10 S
5 S
0
5 N
10 N

16
Figure 2 330
331
332
333
334
335
336
337
338
Smoke Concentration in Surface Air (Jul - Nov 2006)
1 2 5 10 20 50 100 200
Smoke Concentration ( )ug m -3100 E 120 E 140 E
10 S
5 S
0
5 N
10 N
Singapore
Jul Aug Sep Oct Nov
0
50
100
150Sibu
Jul Aug Sep Oct NovSmok
e Co
ncen
tratio
n (
)
ug m
-3
ObservationsGEOS-Chem

17
Figure 3 339
340
341
342
343
344
345
346
347
348
349
350
351
352
353
Singapore (5.13 million) Palembang (1.46 million)
Jakarta (9.61 million) Population-weighted Equatorial Asia (281 million)
0.2 -3ug m
7.2 -3ug m
6.2 -3ug m
126 -3ug m
Sensitivity of Smoke Concentration at Receptor Site to Location of Emissions ( )ug m s-2 -1ug m /-3
10 20 50 100 200 500 1000
100 E 120 E 140 E 100 E 120 E 140 E10 S
5 S
0
5 N
10 N
10 S
5 S
0
5 N
10 N

18
Figure 4 354
355
356
357
358
359
360
361
362
363
364
10 S
5 S
5 N
10 N
0
1e-14 1e-13 1e-12 1e-11
Fire Emission Contribution to Smoke Concentration at Receptor ( )
120 E 140 E100 E10 S
5 S
0
5 N
10 N
1e3 1e4 1e5 1e6
Popu
latio
n
Singapore
Population-weighted Equatorial Asia
m -2ug m -3

19
Figure 5 365
366
367
5 N
0
5 S
High Oil Palm Scenario Peat Protection Scenario
Fire Emissions ( )ug m s-2 -1
0.001 0.002 0.005 0.01 0.02 0.05 0.1 0.2 0.5 1.0
Marlier 2004 - 2010 Mean
95 E 100 E 105 E 95 E 100 E 105 E 95 E 100 E 105 E
ug m-3SingaporePopulation
: 0.68ug m-3: 0.95
ug m-3SingaporePopulation
: 0.83ug m-3: 0.60
ug m-3SingaporePopulation
: 0.18ug m-3: 0.45