Sensitivity of population smoke exposure to fire...
7
Sensitivity of population smoke exposure to fire locations in Equatorial Asia Patrick S. Kim a, * , Daniel J. Jacob a, b , Loretta J. Mickley b , Shannon N. Koplitz a , Miriam E. Marlier c , Ruth S. DeFries c , Samuel S. Myers d, e , Boon Ning Chew f , Yuhao H. Mao g, h a Department of Earth and Planetary Sciences, Harvard University, Cambridge, MA, USA b School of Engineering and Applied Sciences, Harvard University, Cambridge, MA, USA c Department of Ecology, Evolution, and Environmental Biology, Columbia University, New York, NY, USA d Department of Environmental Health, Harvard School of Public Health, Harvard University, Cambridge, MA, USA e Harvard University Center for the Environment, Harvard University, Cambridge, MA, USA f Centre for Remote Imaging, Sensing and Processing, National University of Singapore, Singapore g Department of Atmospheric and Oceanic Sciences, University of California, Los Angeles, CA, USA h Joint Institute for Regional Earth System Science and Engineering, University of California, Los Angeles, CA, USA highlights Smoke exposure sensitivity to Equatorial Asian fires computed with adjoint model. Protecting Sumatran peatswamp forests is key to future regional air quality. The GEOS-Chem adjoint can provide guidance for targeted land conservation. article info Article history: Received 14 March 2014 Received in revised form 11 September 2014 Accepted 18 September 2014 Available online 19 September 2014 Keywords: Equatorial Asia Adjoint Palm oil Fire Conservation Population-exposure abstract High smoke concentrations in Equatorial Asia, primarily from land conversion to oil palm plantations, affect a densely populated region and represent a serious but poorly quantified air quality concern. Continued expansion of the oil palm industry is expected but the resulting population exposure to smoke is highly dependent on where this expansion takes place. We use the adjoint of the GEOS-Chem chemical transport model to map the sensitivity of smoke concentrations in major Equatorial Asian cities, and for the population-weighted region, to the locations of the fires. We find that fires in southern Sumatra are particularly detrimental, and that a land management policy protecting peatswamp forests in Southeast Sumatra would be of great air quality benefit. Our adjoint sensitivities can be used to immediately infer population exposure to smoke for any future fire emission scenario. © 2014 The Authors. Published by Elsevier Ltd. This is an open access article under the CC BY-NC-ND license (http://creativecommons.org/licenses/by-nc-nd/3.0/). 1. Introduction Global palm oil production has more than doubled since 2000 in response to soaring demand (FAO, 2013). Indonesia and Malaysia together account for 86% of the world's production and Indonesia plans to further double its output by 2020 (AFP, 2009; Koh and Ghazoul, 2010). The demand for palm oil is driving rapid defores- tation to clear land for new plantations (Koh et al., 2011; Mietinen et al., 2012). The area covered by oil palm plantations in Indonesia tripled from 2000 to 2012 (FAO, 2013). The land is mainly cleared and managed by fire. The resulting smoke pollutes the airshed of one of the most densely populated regions of the world. According to Marlier et al. (2013), the unusually large fire season of 1997 resulted in 10,000 excess deaths from smoke exposure in Equatorial Asia. More recently, Sumatran fires in June 2013 caused a 24-h maximum particulate matter (PM) concentration of 300 mgm 3 * Corresponding author. Department of Earth and Planetary Sciences, Harvard University, Cambridge, MA 02138, USA. E-mail address: [email protected] (P.S. Kim). Contents lists available at ScienceDirect Atmospheric Environment journal homepage: www.elsevier.com/locate/atmosenv http://dx.doi.org/10.1016/j.atmosenv.2014.09.045 1352-2310/© 2014 The Authors. Published by Elsevier Ltd. This is an open access article under the CC BY-NC-ND license (http://creativecommons.org/licenses/by-nc-nd/3.0/). Atmospheric Environment 102 (2015) 11e17
Transcript of Sensitivity of population smoke exposure to fire...

lable at ScienceDirect
Atmospheric Environment 102 (2015) 11e17
Contents lists avai
Atmospheric Environment
journal homepage: www.elsevier .com/locate/atmosenv
Sensitivity of population smoke exposure to fire locations inEquatorial Asia
Patrick S. Kim a, *, Daniel J. Jacob a, b, Loretta J. Mickley b, Shannon N. Koplitz a,Miriam E. Marlier c, Ruth S. DeFries c, Samuel S. Myers d, e, Boon Ning Chew f,Yuhao H. Mao g, h
a Department of Earth and Planetary Sciences, Harvard University, Cambridge, MA, USAb School of Engineering and Applied Sciences, Harvard University, Cambridge, MA, USAc Department of Ecology, Evolution, and Environmental Biology, Columbia University, New York, NY, USAd Department of Environmental Health, Harvard School of Public Health, Harvard University, Cambridge, MA, USAe Harvard University Center for the Environment, Harvard University, Cambridge, MA, USAf Centre for Remote Imaging, Sensing and Processing, National University of Singapore, Singaporeg Department of Atmospheric and Oceanic Sciences, University of California, Los Angeles, CA, USAh Joint Institute for Regional Earth System Science and Engineering, University of California, Los Angeles, CA, USA
h i g h l i g h t s
� Smoke exposure sensitivity to Equatorial Asian fires computed with adjoint model.� Protecting Sumatran peatswamp forests is key to future regional air quality.� The GEOS-Chem adjoint can provide guidance for targeted land conservation.
a r t i c l e i n f o
Article history:Received 14 March 2014Received in revised form11 September 2014Accepted 18 September 2014Available online 19 September 2014
Keywords:Equatorial AsiaAdjointPalm oilFireConservationPopulation-exposure
* Corresponding author. Department of Earth andUniversity, Cambridge, MA 02138, USA.
E-mail address: [email protected] (P.S. Kim).
http://dx.doi.org/10.1016/j.atmosenv.2014.09.0451352-2310/© 2014 The Authors. Published by Elsevier
a b s t r a c t
High smoke concentrations in Equatorial Asia, primarily from land conversion to oil palm plantations,affect a densely populated region and represent a serious but poorly quantified air quality concern.Continued expansion of the oil palm industry is expected but the resulting population exposure to smokeis highly dependent on where this expansion takes place. We use the adjoint of the GEOS-Chem chemicaltransport model to map the sensitivity of smoke concentrations in major Equatorial Asian cities, and forthe population-weighted region, to the locations of the fires. We find that fires in southern Sumatra areparticularly detrimental, and that a land management policy protecting peatswamp forests in SoutheastSumatra would be of great air quality benefit. Our adjoint sensitivities can be used to immediately inferpopulation exposure to smoke for any future fire emission scenario.© 2014 The Authors. Published by Elsevier Ltd. This is an open access article under the CC BY-NC-ND
license (http://creativecommons.org/licenses/by-nc-nd/3.0/).
1. Introduction
Global palm oil production hasmore than doubled since 2000 inresponse to soaring demand (FAO, 2013). Indonesia and Malaysiatogether account for 86% of the world's production and Indonesiaplans to further double its output by 2020 (AFP, 2009; Koh and
Planetary Sciences, Harvard
Ltd. This is an open access article u
Ghazoul, 2010). The demand for palm oil is driving rapid defores-tation to clear land for new plantations (Koh et al., 2011; Mietinenet al., 2012). The area covered by oil palm plantations in Indonesiatripled from 2000 to 2012 (FAO, 2013). The land is mainly clearedand managed by fire. The resulting smoke pollutes the airshed ofone of the most densely populated regions of the world. Accordingto Marlier et al. (2013), the unusually large fire season of 1997resulted in 10,000 excess deaths from smoke exposure in EquatorialAsia. More recently, Sumatran fires in June 2013 caused a 24-hmaximum particulate matter (PM) concentration of 300 mg m�3
nder the CC BY-NC-ND license (http://creativecommons.org/licenses/by-nc-nd/3.0/).

P.S. Kim et al. / Atmospheric Environment 102 (2015) 11e1712
in Singapore, far exceeding the 25 mgm�3 air quality guideline fromthe World Health Organization (WHO, 2006).
The fire season in Equatorial Asia is typically JulyeNovember(dry season), with large interannual variation in intensity (van derWerf et al., 2010) driven in part by the El Nino-Southern Oscillationand associated dryness (Reid et al., 2012, 2013). Presently there isless interannual variability in the location of the fires, with landconversion mostly occurring in the South Sumatran lowlands andthe southern and western coasts of Borneo (Miettinen et al., 2010).
The fire plumes are transported by the prevailing southwesterlyflow (Fig. 1) such that some population centers are minimallyaffected by the smoke (e.g., Jakarta), while others are heavilyaffected (e.g., Singapore). Fires in different areas have very differentair quality implications depending on the population downwind.Public health costs could be reduced by targeting sensitive areas forconservation while allowing palm oil development in other areas.Previous studies have examined the transport of smoke in Equa-torial Asia using chemical transport model (CTM) simulations (Heilet al., 2007; Hyer and Chew, 2010; Wang et al., 2013) and trajectoryanalyses (Koe et al., 2001; He et al., 2010; Atwood et al., 2013). Theyhave highlighted the importance of peat burning in Sumatra andBorneo on downstream surface air quality (Heil et al., 2007) as wellas the complexity of local scale meteorological phenomena,including the sea-breeze effect and surface topography (Wanget al., 2013).
Here we use the adjoint of the GEOS-Chem CTM (Bey et al.,2001; Henze et al., 2007) to map the sensitivity of smoke concen-trations to fire location for selected urban receptor locations inEquatorial Asia as well as for the entire population of the region.The adjoint is the transpose of the CTM, allowing model sensitiv-ities to be tracked back in time through the CTM fields (Kopaczet al., 2011). It is a computationally efficient method to determinethe sensitivity of model output to many input parameters (Errico
Fig. 1. Fire emissions and mean 0e1 km vector winds in Equatorial Asia in JulyeNovember. TFire emissions are from the GFED3 inventory, increased by 50% to account for small fires (slocations of cities with more than one million people.
and Vukicevic, 1992). Our work provides a basis to identify wherefires could most effectively be restricted to reduce populationexposure, and to readily determine the exposure associated withany future land management scenario.
2. Materials & methods
We examine here the sensitivity of different population centers(receptor sites) in Equatorial Asia to the geographical distribution ofsmoke emissions throughout the region. Our analysis is based onmeteorological data for JulyeNovember 2006 and is applied todifferent present and future fire scenarios. The smoke simulationuses the GEOS-Chem CTM and is evaluated with a surface networkof observations in Malaysia and Singapore. Sensitivity of receptorsites to different fire locations is computed with the GEOS-Chemadjoint.
2.1. The GEOS-Chem CTM and its adjoint
We use GEOS-Chem v8-02-01 (www.geos-chem.org) driven byassimilated meteorological data from the Goddard Earth ObservingSystem (GEOS-5) of the NASA Modeling and Assimilation Office(GMAO). The data have a native horizontal resolution of0.50� � 0.67� with 72 pressure levels and 6-h temporal frequency(3-h for surface variables and mixing depths). We focus on simu-lating primary PM (smoke) emitted by the fires as organic and blackcarbon (OC/BC). The OC/BC simulation in GEOS-Chem is describedby Wang et al. (2011). Open fire emissions are from the GFED3 in-ventory (Giglio et al., 2010; van der Werf et al., 2010) with monthlyresolution. The standard GFED3 product does not consider smallfires, which account for one third of total fire emissions in Equa-torial Asia (Randerson et al., 2012). We therefore increase theGFED3 emissions by 50%.
he top panel is for 2006 (a high fire year) and the bottom panel is the 2004e2010 mean.ee text). Winds are from GEOS-5 assimilated meteorological data. Also shown are the

P.S. Kim et al. / Atmospheric Environment 102 (2015) 11e17 13
Fig. 1 shows the spatial distribution of fire emissions in Equa-torial Asia for 2006 and for 2004e2010, and Fig. 2 (top panel) showsthe interannual variability in total fire emissions for the region.2006 was a high fire year associated with El Nino conditions (vander Werf et al., 2010; Reid et al., 2012) while 2010 had almost nofires. The fires are mainly in Sumatra and Borneo for all years.Sumatra accounts for 36e60% of total regional emissions depend-ing on the year (2004e2009). Emissions are highest in the peat-lands of southeastern Sumatra and southern Borneo.
The GEOS-Chem results presented here are for a simulationwiththe native 0.50� � 0.67� horizontal resolution over East Asia[70�e150� E, 11� Se55� N] (Chen et al., 2009), nested within aglobal simulation with 4� � 5� horizontal resolution that providesdynamic boundary conditions. We focus on the 2006 fire season(JulyeNovember) following a 1-year initialization. As shown inFig. 1, the boundary layer winds (0e1 km) in 2006 were typical ofthe 2004e2010 mean.
We use the GEOS-Chem adjoint version 34 (Kopacz et al., 2011)for source attribution of the simulated smoke concentrations atselected receptor sites (Singapore, Palembang, and Jakarta) and forthe whole population-weighted Equatorial Asia region (populationdistribution from http://web.ornl.gov/sci/landscan). The adjointsimulation is conducted for the JulyeNovember duration of the fire
0
1
2
3
4
5
0
5
10
15
20
0
5
10
15
20
2004 2005 2006 2007 2008 2009 2010
PM
(μg/
m )3
PM
(μg/
m )3
Sm
oke
Em
issi
on (T
g C
)
Smoke, Singapore
Eq. Asia Fire Emissions
Smoke, population-weighted Eq. Asia
Year
Other
Source Region
Borneo
Sumatra
Fig. 2. Interannual variability in smoke emissions and associated population exposurein Equatorial Asia (domain of Fig. 1). The top panel shows total JulyeNovemberemissions and the bottom panels show mean JulyeNovember smoke concentrationsfor Singapore and for population-weighted Equatorial Asia computed from the GEOS-Chem adjoint (Equation (1)) with 2006 meteorology. The smoke concentrations arepartitioned into contributions from fires in Borneo, Sumatra, and other regions.
season [to, t1]. A single simulationwith the adjoint model operatingbackward in time over [t1, to] yields the complete time-dependentfootprint of sources contributing to the smoke concentrations at aparticular receptor site and for any averaging time. The GEOS-Chemadjoint has previously been used in this manner to determinesource contributions to BC/OC aerosol concentrations in theHimalayas (Kopacz et al., 2011).
Smoke concentrations in GEOS-Chem are proportional toemissions so that the total smoke mass concentration PM(xR, t0) atreceptor site xR and time t0 is given by
PMðxR; t0Þ ¼Zt0
to
%x
vPMðxR; t0ÞvEðx; tÞ Eðx; tÞdxdt (1)
where E(x, t) is the emission flux (g m�2 s�1) at location x and timet < t0, to is the beginning of the fire season, and the spatial inte-gration is over the entire emitting domain. One adjoint simulationconducted over the time period [t1, to] provides the ensemble ofsensitivities vPM(xR, t0)/vE(x, t) for PM at a selected receptor site xRand at all times t0 to the emissions for all domain grid squares (x)and all prior times (t < t0). Instead of a single receptor location, theadjoint can also provide the same ensemble of sensitivities for thepopulation-weighted mean smoke concentration (PM) over theentire Equatorial Asia domain (i.e. vPM(t0)/vE(x, t)).
2.2. Surface PM10 observations
Measurements of 24-h mean PM10 (mass concentration of par-ticulate matter finer than 10 mm aerodynamic diameter) are avail-able from a network of surface sites maintained by the MalaysianDepartment of the Environment (http://www.doe.gov.my/) and theSingaporean National Environment Agency (http://www.nea.gov.sg/) (Hyer and Chew, 2010). The site locations (marked on themap in Fig. 3) are predominantly in urban areas and away from themain fire locations. We estimate the smoke concentration at eachsite in the observations by subtracting as baseline the mean con-centration for the bracketing non-burning months (June andDecember).
2.3. Future fire scenarios
The adjoint sensitivities vPM(xR, t0)/vE(x, t) described in Section2.1 can be used with Equation (1) to immediately derive populationexposure to smoke under any future emission scenario E(x, t). Herewe examine the impact of two possible 2009e2032 future emissionscenarios for Sumatra described byMarlier et al. (2014): a “High OilPalm” scenario with continued rapid plantation expansion(including into peatswamps where fuel loads are particularly high),and a “Green Vision with Peat Protection” scenario that promotessustainable development and where all remaining peatswampforests are preserved. Marlier et al. (2014) give mean Sumatranemissions of 256 Gg a�1 for present-day (2004e2010), 414 Gg a�1
for the High Oil Palm scenario, and 186 Gg a�1 for the Peat Pro-tection scenario. Their present-day emission estimates are 40%lower than ours for the same time period, likely due to their explicittreatment of small fires compared to our application of a 50% in-crease to the standard GFED3 product. We have some confidence inour estimate on the basis of better comparisons to observed smokeconcentrations (next section). The Marlier et al. (2014) present-daySumatran emissions nevertheless serve as a baseline against whichtheir future projections can be compared.

Fig. 3. Mean smoke concentration in surface air for JulyeNovember 2006, observed at a network of sites (circles; see text for details) and simulated by GEOS-Chem. Arrows point tothe locations of Singapore and Sibu (western Borneo) for which time series of concentrations are shown in Fig. 4.
Singapore (R = 0.51)
Jul Aug Sep Oct Nov
0
50
100
150Sibu (R = 0.33)
Jul Aug Sep Oct NovSmok
e C
once
ntra
tion
(
)ug
m -3
ObservationsGEOS-Chem
Fig. 4. Time series of observed and simulated 24-h surface mean smoke concentrations at Singapore and Sibu (western Borneo). Temporal correlation coefficients are inset. Sitelocations are indicated by arrows in Fig. 3.
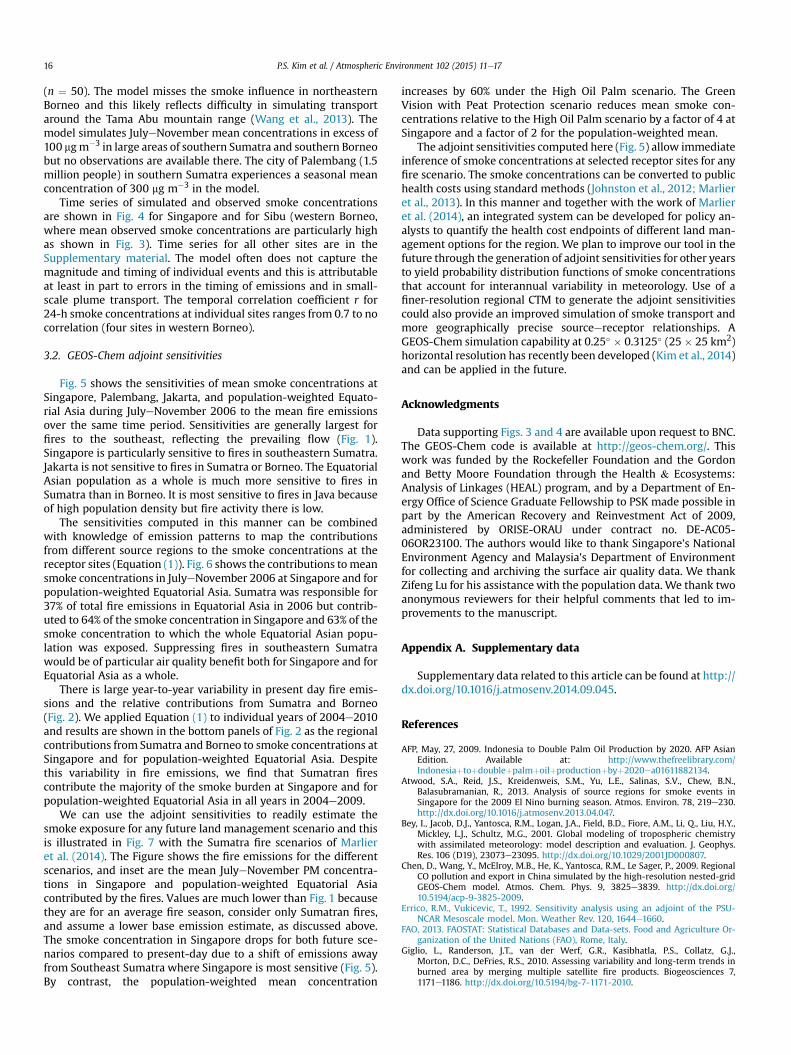
Fig. 5. Sensitivity of mean smoke concentrations in JulyeNovember 2006 to the location of fire emissions for three large cities and for all of Equatorial Asia weighted by population(city locations indicated by white circles, population in parentheses). Values are GEOS-Chem adjoint mean sensitivities. The simulated JulyeNovember mean smoke concentrationfor each receptor is shown inset.
P.S. Kim et al. / Atmospheric Environment 102 (2015) 11e1714

Fig. 6. Spatially resolved contributions of fire emissions to JulyeNovember 2006 mean smoke concentrations in Singapore (top) and for all of Equatorial Asia weighted by thepopulation distribution shown inset (bottom).
P.S. Kim et al. / Atmospheric Environment 102 (2015) 11e17 15
3. Results and discussion
3.1. Smoke concentrations
Fig. 3 shows the mean surface air smoke concentrations inJulyeNovember 2006 observed at the surface monitoring stationsand simulated by GEOS-Chem. The observed baseline PM10
Fig. 7. Mean JulyeNovember fire emissions in Sumatra from Marlier et al. (2014) for the presPeat Protection” (see text). The emissions are plotted on the same scale as Fig. 1. The Sumatrand for population-weighted Equatorial Asia is shown inset.
concentrations (mean concentrations in June and December whensmoke influence is negligible) range from 21 to 71 mg m�3
depending on the site. Mean smoke concentrations in JulyeNo-vember elevate this baseline by 10e50 mg m�3 depending on thesite. The observed smoke concentrations and spatial patterns arewell captured by themodel, with amean relative bias of�27% and aspatial correlation coefficient r ¼ 0.84 for the ensemble of sites
ent (2004e2010) and for two future scenarios, “High Oil Palm” and “Green Vision withan contribution to simulated JulyeNovember mean smoke concentration for Singapore
P.S. Kim et al. / Atmospheric Environment 102 (2015) 11e1716
(n ¼ 50). The model misses the smoke influence in northeasternBorneo and this likely reflects difficulty in simulating transportaround the Tama Abu mountain range (Wang et al., 2013). Themodel simulates JulyeNovember mean concentrations in excess of100 mgm�3 in large areas of southern Sumatra and southern Borneobut no observations are available there. The city of Palembang (1.5million people) in southern Sumatra experiences a seasonal meanconcentration of 300 mg m�3 in the model.
Time series of simulated and observed smoke concentrationsare shown in Fig. 4 for Singapore and for Sibu (western Borneo,where mean observed smoke concentrations are particularly highas shown in Fig. 3). Time series for all other sites are in theSupplementary material. The model often does not capture themagnitude and timing of individual events and this is attributableat least in part to errors in the timing of emissions and in small-scale plume transport. The temporal correlation coefficient r for24-h smoke concentrations at individual sites ranges from 0.7 to nocorrelation (four sites in western Borneo).
3.2. GEOS-Chem adjoint sensitivities
Fig. 5 shows the sensitivities of mean smoke concentrations atSingapore, Palembang, Jakarta, and population-weighted Equato-rial Asia during JulyeNovember 2006 to the mean fire emissionsover the same time period. Sensitivities are generally largest forfires to the southeast, reflecting the prevailing flow (Fig. 1).Singapore is particularly sensitive to fires in southeastern Sumatra.Jakarta is not sensitive to fires in Sumatra or Borneo. The EquatorialAsian population as a whole is much more sensitive to fires inSumatra than in Borneo. It is most sensitive to fires in Java becauseof high population density but fire activity there is low.
The sensitivities computed in this manner can be combinedwith knowledge of emission patterns to map the contributionsfrom different source regions to the smoke concentrations at thereceptor sites (Equation (1)). Fig. 6 shows the contributions tomeansmoke concentrations in JulyeNovember 2006 at Singapore and forpopulation-weighted Equatorial Asia. Sumatra was responsible for37% of total fire emissions in Equatorial Asia in 2006 but contrib-uted to 64% of the smoke concentration in Singapore and 63% of thesmoke concentration to which the whole Equatorial Asian popu-lation was exposed. Suppressing fires in southeastern Sumatrawould be of particular air quality benefit both for Singapore and forEquatorial Asia as a whole.
There is large year-to-year variability in present day fire emis-sions and the relative contributions from Sumatra and Borneo(Fig. 2). We applied Equation (1) to individual years of 2004e2010and results are shown in the bottom panels of Fig. 2 as the regionalcontributions from Sumatra and Borneo to smoke concentrations atSingapore and for population-weighted Equatorial Asia. Despitethis variability in fire emissions, we find that Sumatran firescontribute the majority of the smoke burden at Singapore and forpopulation-weighted Equatorial Asia in all years in 2004e2009.
We can use the adjoint sensitivities to readily estimate thesmoke exposure for any future land management scenario and thisis illustrated in Fig. 7 with the Sumatra fire scenarios of Marlieret al. (2014). The Figure shows the fire emissions for the differentscenarios, and inset are the mean JulyeNovember PM concentra-tions in Singapore and population-weighted Equatorial Asiacontributed by the fires. Values are much lower than Fig. 1 becausethey are for an average fire season, consider only Sumatran fires,and assume a lower base emission estimate, as discussed above.The smoke concentration in Singapore drops for both future sce-narios compared to present-day due to a shift of emissions awayfrom Southeast Sumatra where Singapore is most sensitive (Fig. 5).By contrast, the population-weighted mean concentration
increases by 60% under the High Oil Palm scenario. The GreenVision with Peat Protection scenario reduces mean smoke con-centrations relative to the High Oil Palm scenario by a factor of 4 atSingapore and a factor of 2 for the population-weighted mean.
The adjoint sensitivities computed here (Fig. 5) allow immediateinference of smoke concentrations at selected receptor sites for anyfire scenario. The smoke concentrations can be converted to publichealth costs using standard methods (Johnston et al., 2012; Marlieret al., 2013). In this manner and together with the work of Marlieret al. (2014), an integrated system can be developed for policy an-alysts to quantify the health cost endpoints of different land man-agement options for the region. We plan to improve our tool in thefuture through the generation of adjoint sensitivities for other yearsto yield probability distribution functions of smoke concentrationsthat account for interannual variability in meteorology. Use of afiner-resolution regional CTM to generate the adjoint sensitivitiescould also provide an improved simulation of smoke transport andmore geographically precise sourceereceptor relationships. AGEOS-Chem simulation capability at 0.25� � 0.3125� (25 � 25 km2)horizontal resolution has recently been developed (Kim et al., 2014)and can be applied in the future.
Acknowledgments
Data supporting Figs. 3 and 4 are available upon request to BNC.The GEOS-Chem code is available at http://geos-chem.org/. Thiswork was funded by the Rockefeller Foundation and the Gordonand Betty Moore Foundation through the Health & Ecosystems:Analysis of Linkages (HEAL) program, and by a Department of En-ergy Office of Science Graduate Fellowship to PSK made possible inpart by the American Recovery and Reinvestment Act of 2009,administered by ORISE-ORAU under contract no. DE-AC05-06OR23100. The authors would like to thank Singapore's NationalEnvironment Agency and Malaysia's Department of Environmentfor collecting and archiving the surface air quality data. We thankZifeng Lu for his assistance with the population data. We thank twoanonymous reviewers for their helpful comments that led to im-provements to the manuscript.
Appendix A. Supplementary data
Supplementary data related to this article can be found at http://dx.doi.org/10.1016/j.atmosenv.2014.09.045.
References
AFP, May, 27, 2009. Indonesia to Double Palm Oil Production by 2020. AFP AsianEdition. Available at: http://www.thefreelibrary.com/Indonesiaþtoþdoubleþpalmþoilþproductionþbyþ2020ea01611882134.
Atwood, S.A., Reid, J.S., Kreidenweis, S.M., Yu, L.E., Salinas, S.V., Chew, B.N.,Balasubramanian, R., 2013. Analysis of source regions for smoke events inSingapore for the 2009 El Nino burning season. Atmos. Environ. 78, 219e230.http://dx.doi.org/10.1016/j.atmosenv.2013.04.047.
Bey, I., Jacob, D.J., Yantosca, R.M., Logan, J.A., Field, B.D., Fiore, A.M., Li, Q., Liu, H.Y.,Mickley, L.J., Schultz, M.G., 2001. Global modeling of tropospheric chemistrywith assimilated meteorology: model description and evaluation. J. Geophys.Res. 106 (D19), 23073e23095. http://dx.doi.org/10.1029/2001JD000807.
Chen, D., Wang, Y., McElroy, M.B., He, K., Yantosca, R.M., Le Sager, P., 2009. RegionalCO pollution and export in China simulated by the high-resolution nested-gridGEOS-Chem model. Atmos. Chem. Phys. 9, 3825e3839. http://dx.doi.org/10.5194/acp-9-3825-2009.
Errico, R.M., Vukicevic, T., 1992. Sensitivity analysis using an adjoint of the PSU-NCAR Mesoscale model. Mon. Weather Rev. 120, 1644e1660.
FAO, 2013. FAOSTAT: Statistical Databases and Data-sets. Food and Agriculture Or-ganization of the United Nations (FAO), Rome, Italy.
Giglio, L., Randerson, J.T., van der Werf, G.R., Kasibhatla, P.S., Collatz, G.J.,Morton, D.C., DeFries, R.S., 2010. Assessing variability and long-term trends inburned area by merging multiple satellite fire products. Biogeosciences 7,1171e1186. http://dx.doi.org/10.5194/bg-7-1171-2010.
P.S. Kim et al. / Atmospheric Environment 102 (2015) 11e17 17
He, J., Zielinska, B., Balasubramanian, R., 2010. Composition of semi-volatile organiccompounds in the urban atmosphere of Singapore: influence of biomassburning. Atmos. Chem. Phys. 10, 11401e11413. http://dx.doi.org/10.5194/acp-10-11401-2010.
Heil, A., Langmann, B., Aldrian, E., 2007. Indonesian peat and vegetation fireemissions: study on factors influencing large-scale smoke haze pollution usinga regional atmospheric chemistry model. Mitig. Adapt. Strat. Glob. Change 12,113e133. http://dx.doi.org/10.1007/s11027-006-9045-6.
Henze, D.K., Hakami, A., Seinfeld, J.H., 2007. Development of the adjoint of GEOS-Chem. Atmos. Chem. Phys. 7, 2413e2433. http://dx.doi.org/10.5194/acp-7-2413-2007.
Hyer, E.J., Chew, B.N., 2010. Aerosol transport model evaluation of an extremesmoke episode in Southeast Asia. Atmos. Environ. 44, 1422e1427. http://dx.doi.org/10.1016/j.atmosenv.2010.01.043.
Johnston, F.H., Henderson, S.B., Chen, Y., Randerson, J.T., Marlier, M., DeFries, R.S.,Kinney, P., Bowman, D.M.J.S., Brauer, M., 2012. Estimated global mortalityattributable to smoke from landscape fires. Environ. Health Perspect. 120,695e701. http://dx.doi.org/10.1289/ehp.1104422.
Kim, P.S., Jacob, D.J., Fisher, J.A., Jimenez, J.L., Hair, J.W., Travis, K.R., Zhu, L., Yu, K.,2014, April. Interpretation of SEAC4RS Aerosol Observations Over the SoutheastUS with the GEOS-Chem Chemical Transport Model. Poster presented at theSEAC4RS Science Team Meeting, Boulder, CO.
Koe, L.C.C., Arellano, A.F., McGregor, J.L., 2001. Investigating the haze transport from1997 biomass burning in Southeast Asia: its impact upon Singapore. Atmos.Environ. 35, 2723e2734. http://dx.doi.org/10.1016/s1352-2310(00)00395-2.
Koh, L.P., Ghazoul, J., 2010. Spatially explicit scenario analysis for reconciling agri-cultural expansion, forest protection, and carbon conservation in Indonesia.Proc. Natl. Acad. Sci. 107, 11140e11144. http://dx.doi.org/10.1073/pnas.1000530107.
Koh, L.P., Miettinen, J., Liew, S.C., Ghazoul, J., 2011. Remotely sensed evidence oftropical pealand conversion to oil palm. Proc. Natl. Acad. Sci. 108, 5127e5132.http://dx.doi.org/10.1073/pnas.1018776108.
Kopacz, M., Mauzerall, D.L., Wang, J., Leibensperger, E.M., Henze, D.K., Singh, K.,2011. Origin and radiative forcing of black carbon transported to the Himalayasand Tibetan Plateau. Atmos. Chem. Phys. 11, 2837e2852. http://dx.doi.org/10.5194/acp-11-2837-2011.
Marlier, M.E., DeFries, R.S., Voulgarakis, A., Kinney, P.L., Randerson, J.T., Shindell, D.T.,Chen, Y., Faluvegi, G., 2013. El Nino and health risks from landscape fire emis-sions in southeast Asia. Nat. Clim. Change 3, 131e136. http://dx.doi.org/10.1038/nclimate1658.
Marlier, M.E., DeFries, R., Pennington, D., Nelson, E., Ordway, E.M., Lewis, J.,Koplitz, S.N., Mickley, L.J., 2014. Future fire emissions associated with projected
land use change in Sumatra. Glob. Change Biol. http://dx.doi.org/10.1111/gcb.12691 (in press).
Miettinen, J., Shi, C., Liew, S.C., 2010. Deforestation rates in insular Southeast Asiabetween 2000 and 2010. Glob. Change Biol. 17, 2261e2270. http://dx.doi.org/10.1111/j.1365-2486.2011.02398.x.
Mietinnen, J., Hooijer, A., Shi, C., Tollenaar, D., Vernimmen, R., Liew, S.C., Malins, C.,Page, S.E., 2012. Extent of industrial plantations on Southeast Asian peatlands in2010 with analysis of historical expansion and future projections. GCB Bio-energy 4, 908e918. http://dx.doi.org/10.1111/j.1757-1707.2012.01172.x.
Randerson, J.T., Chen, Y., van der Werf, G.R., Rogers, B.M., Morton, D.C., 2012. Globalburned area and biomass burning emissions from small fires. J. Geophys. Res.117, G04012. http://dx.doi.org/10.1029/2012JG002128.
Reid, J.S., Xian, P., Hyer, E.J., Flatau, M.K., Ramirez, E.M., Turk, F.J., Sampson, C.R.,Zhang, C., Fukada, E.M., Maloney, E.D., 2012. Mulit-scale meteorological con-ceptual analysis of observed active fire hotspot activity and smoke optical depthin the Maritime Continent. Atmos. Chem. Phys. 12, 2117e2147. http://dx.doi.org/10.5194/acp-12-2117-2012.
Reid, J.S., Hyer, E.J., Johnson, R.S., Holben, B.N., Yokelson, R.J., Zhang, J., Campbell, J.R.,Christopher, S.A., DiGirolamo, L., Giglio, L., Holz, R.E., Kearney, C., Miettinen, J.,Reid, E.A., Turk, F.J., Wang, J., Xian, P., Zhao, G., Balasubramanian, R., Chew, B.N.,Janjai, S., Lagrosas, N., Lestari, P., Lin, N.-H., Mahmud, M., Nguyen, A.X., Norris, B.,Oanh, N.T.K., Oo, M., Salinas, S.V., Welton, E.J., Liew, S.C., 2013. Observing andunderstanding the Southeast Asian aerosol system by remote sensing: an initialreview and analysis for the Seven Southeast Asian Studies (7SEAS) program.Atmos. Res. 122, 403e468. http://dx.doi.org/10.1016/j.atmosres.2012.06.005.
van der Werf, G.R., Randerson, J.T., Giglio, L., Collatz, G.J., Mu, M., Kasibhatla, P.S.,Morton, D.C., DeFries, R.S., Jin, Y., Leeuwen, T.T., 2010. Global fire emissions andthe contribution of deforestation, savanna, forest, agricultural, and peat fires(1997e2009). Atmos. Chem. Phys. 10, 11707e11735. http://dx.doi.org/10.5194/acp-10-11707-2010.
Wang, J., Ge, C., Yang, Z., Hyer, E.J., Reid, J.S., Chew, B.-N., Mahmud, M., Zhang, Y.,Zhang, M., 2013. Mesoscale modeling of smoke transport over the SoutheastAsian Continent: interplay of sea breeze, trade wind, typhoon, and topography.Atmos. Res. 122, 486e503. http://dx.doi.org/10.1016/j.atmosres.2012.05.009.
Wang, Q., Jacob, D.J., Fisher, J.A., Mao, J., Leibensperger, E.M., Carouge, C.C., LeSager, P., Kondo, Y., Jimenez, J.L., Cubison, M.J., Doherty, S.J., 2011. Sources ofcarbonaceous aerosols and deposited black carbon in the Arctic in wintere-spring: implications for radiative forcing. Atmos. Chem. Phys. 11, 12453e12473.http://dx.doi.org/10.5194/acp-11-12453-2011.
WHO, 2006. WHO Air Quality Guidelines for Particulate Matter, Ozone, Nitrogendioxide and Sulfur dioxide.