
Sensitive measurement of optical nonlinearities using a ... · Sensitive Measurement of Optical...
10
760 IEEE JOURNAL OF QUANTUM ELECTRONICS. VOL. 26. NO. 4, APRIL 1990 Sensitive Measurement of Optical Nonlinearities Using a Single Beam MANSOOR SHEIK-BAHAE, MEMBER, IEEE,ALI A. SAID, TAI-HUE1 WEI, DAVID J. HAGAN, MEMBER, IEEE AND E. w . VAN STRYLAND, SENIOR MEMBER, IEEE Abstract-We report a sensitive single-beam technique for measur- ing both the nonlinear refractive index and nonlinear absorption coef- ficient for a wide variety of materials. We describe the experimental details and present a comprehensive theoretical analysis including cases where nonlinear refraction is accompanied by nonlinear absorption. In these experiments, the transmittance of a sample is measured the propagation path (z) of a focused Gaussian beam. The sign and magnitude of the nonlinear refraction are easily deduced from such a transmittance curve (Z-scan). Employing this technique, a sensitivity of better than 1/300 wavefront distortion is achieved in n2 measure- ments of BaF2 using picosecond frequency-doubled Nd:YAG laser pulses. In cases where nonlinear refraction is accompanied by nonlin- ear absorption, it is possible to separately evaluate the nonlinear re- fraction as well as the nonlinear absorption by performing a second Z scan with the aperture removed. We demonstrate this method for ZnSe at 532 nm where two-photon absorption is present and n2 is negative. I. INTRODUCTION We will describe this simple technique, referred to as a G GZ-~~~~,’ 9 in section 11. ~ h ~ ~ ~ ~ ~ i ~ ~ analyses of z - ~ ~ ~ measurements are given in Section ‘I1 for a “thin” non- linear medium. It Will be shown that for many Practical cases, nonlinear refraction and its sign can be obtained transmittance changes and the induced phase distortion without the need for performing calculations’ In Section IV, we present measurements of nonlinear refrac- tion in a number of materials such as CS2 and transparent dielectrics at wavelengths of 532 nm, 1.06 pm, and 10.6 pm. In CS2 at 10 pm, for example, both thermooptical and effects were identified using na- nosecond and picosecond Pulses, respectively. Further- more, in Section V, we will consider the case of samples having a significant absorptive nonlinearity as well as a refractive one. This occurs in, for example, two-photon absorbing semiconductors. It will be shown that both ef- fects can easily be separated and measured in the Z-scan scheme. We also show how effects of linear sample in- homogeneities (e.g., bulk index variations) can be effec- tively removed from the experimental data. through a finite aperture in the farfield as the sample is moved along from a simple linear relationship between the observed ECENTLY we reported a single-beam method for measuring the sign and magnitude of n2 that has a sensitivity comparable to interferometric methods [ 11. Here, we describe this method in detail and demonstrate how it can be applied and analyzed for a variety of ma- terials. We also extend this method to the measurement R of nonlinear refraction in the presence of nonlinear ab- 11. THE Z-SCAN TECHNIQUE sorption. Thus, this method allows a direct measurement of the nonlinear absorption coefficient. In addition, we present a simple method to minimize parasitic effects due to the presence of linear sample inhomogeneities. Previous measurements of nonlinear refraction have used a variety of techniques including nonlinear interfer- ometry [2], [3], degenerate four-wave mixing [4], nearly degenerate three-wave mixing [5], ellipse rotation [6], and beam distortion measurements [7], [8]. The first three methods, namely, nonlinear interferometry and wave mixing, are potentially sensitive techniques, but all re- quire relatively complex experimental apparatus. Beam distortion measurements, on the other hand, are relatively insensitive and require detailed wave propagation analy- sis. The technique reported here is based on the principles of spatial beam distortion, but offers simplicity as well as very high sensitivity. Manuscript received November 6, 1989. This work was supported by the National Science Foundation under Grant ECS-8617066, the DARPAi CNVEO, and the Florida High Technology and Industry Council. The authors are with the Center for Research in Electro-optics and La- sers (CREOL), University of Central Florida, Orlando, FL 32826. IEEE Log Number 8933825. Using a single Gaussian laser beam in a tight focus ge- ometry, as depicted in Fig. l, we measure the transmit- tance of a nonlinear medium through a finite aperture in the fur field as a function of the sample position z mea- sured with respect to the focal plane. The following ex- ample will qualitatively elucidate how such a trace (Z- scan) is related to the nonlinear refraction of the sample. Assume, for instance, a material with a negative nonlin- ear refractive index and a thickness smaller than the dif- fraction length of the focused beam (a thin medium). This can be regarded as a thin lens of variable focal length. Starting the scan from a distance far away from the focus (negative z), the beam irradiance is low and negligible nonlinear refraction occurs; hence, the transmittance (D2/D1 in Fig. 1) remains relatively constant. As the sample is brought closer to focus, the beam irradiance in- creases, leading to self-lensing in the sample. A negative self-lensing prior to focus will tend to collimate the beam, causing a beam narrowing at the aperture which results in an increase in the measured transmittance. As the scan in z continues and the sample passes the focal plane to the right (positive z ), the same self-defocusing increases the 0018-9197/90/0400-0760$01 .OO O 1990 IEEE
Transcript of Sensitive measurement of optical nonlinearities using a ... · Sensitive Measurement of Optical...
760 IEEE JOURNAL OF QUANTUM ELECTRONICS. VOL. 26. NO. 4, APRIL 1990
Sensitive Measurement of Optical Nonlinearities Using a Single Beam
MANSOOR SHEIK-BAHAE, MEMBER, IEEE, ALI A. SAID, TAI-HUE1 WEI, DAVID J. HAGAN, MEMBER, IEEE AND E. w . VAN STRYLAND, SENIOR MEMBER, IEEE
Abstract-We report a sensitive single-beam technique for measur- ing both the nonlinear refractive index and nonlinear absorption coef- ficient for a wide variety of materials. We describe the experimental details and present a comprehensive theoretical analysis including cases where nonlinear refraction is accompanied by nonlinear absorption. In these experiments, the transmittance of a sample is measured
the propagation path ( z ) of a focused Gaussian beam. The sign and magnitude of the nonlinear refraction are easily deduced from such a transmittance curve (Z-scan). Employing this technique, a sensitivity of better than 1/300 wavefront distortion is achieved in n2 measure- ments of BaF2 using picosecond frequency-doubled Nd:YAG laser pulses. In cases where nonlinear refraction is accompanied by nonlin- ear absorption, it is possible to separately evaluate the nonlinear re- fraction as well as the nonlinear absorption by performing a second Z scan with the aperture removed. We demonstrate this method for ZnSe at 532 nm where two-photon absorption is present and n2 is negative.
I. INTRODUCTION
We will describe this simple technique, referred to as a G G Z - ~ ~ ~ ~ , ’ 9 in section 11. ~ h ~ ~ ~ ~ ~ i ~ ~ l analyses of z - ~ ~ ~ ~ measurements are given in Section ‘I1 for a “thin” non- linear medium. It Will be shown that for many Practical cases, nonlinear refraction and its sign can be obtained
transmittance changes and the induced phase distortion without the need for performing calculations’ In Section IV, we present measurements of nonlinear refrac- tion in a number of materials such as CS2 and transparent dielectrics at wavelengths of 532 nm, 1.06 pm, and 10.6 pm. In CS2 at 10 pm, for example, both thermooptical and effects were identified using na- nosecond and picosecond Pulses, respectively. Further- more, in Section V, we will consider the case of samples having a significant absorptive nonlinearity as well as a refractive one. This occurs in, for example, two-photon absorbing semiconductors. It will be shown that both ef- fects can easily be separated and measured in the Z-scan scheme. We also show how effects of linear sample in- homogeneities (e.g., bulk index variations) can be effec- tively removed from the experimental data.
through a finite aperture in the farfield as the sample is moved along from a simple linear relationship between the observed
ECENTLY we reported a single-beam method for measuring the sign and magnitude of n2 that has a
sensitivity comparable to interferometric methods [ 11. Here, we describe this method in detail and demonstrate how it can be applied and analyzed for a variety of ma- terials. We also extend this method to the measurement
R
of nonlinear refraction in the presence of nonlinear ab- 11. THE Z-SCAN TECHNIQUE sorption. Thus, this method allows a direct measurement of the nonlinear absorption coefficient. In addition, we present a simple method to minimize parasitic effects due to the presence of linear sample inhomogeneities.
Previous measurements of nonlinear refraction have used a variety of techniques including nonlinear interfer- ometry [2], [3], degenerate four-wave mixing [4], nearly degenerate three-wave mixing [5], ellipse rotation [6], and beam distortion measurements [ 7 ] , [8]. The first three methods, namely, nonlinear interferometry and wave mixing, are potentially sensitive techniques, but all re- quire relatively complex experimental apparatus. Beam distortion measurements, on the other hand, are relatively insensitive and require detailed wave propagation analy- sis. The technique reported here is based on the principles of spatial beam distortion, but offers simplicity as well as very high sensitivity.
Manuscript received November 6, 1989. This work was supported by the National Science Foundation under Grant ECS-8617066, the DARPAi CNVEO, and the Florida High Technology and Industry Council.
The authors are with the Center for Research in Electro-optics and La- sers (CREOL), University of Central Florida, Orlando, FL 32826.
IEEE Log Number 8933825.
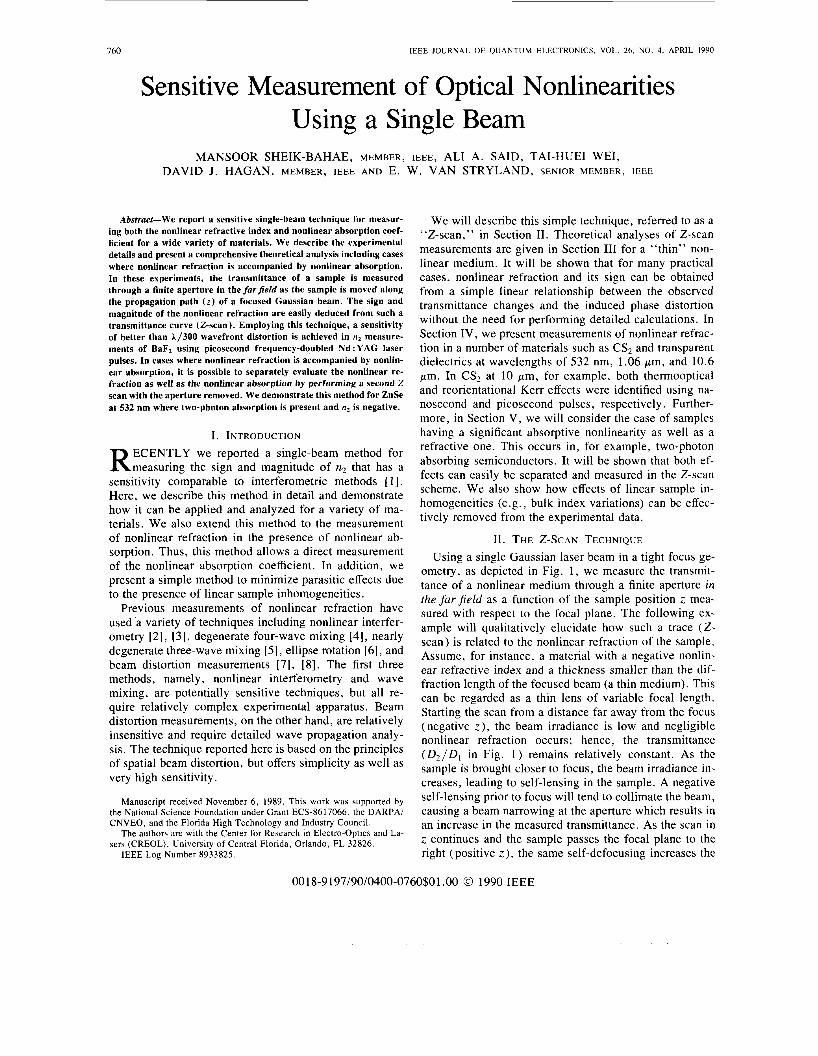
Using a single Gaussian laser beam in a tight focus ge- ometry, as depicted in Fig. l , we measure the transmit- tance of a nonlinear medium through a finite aperture in the fur field as a function of the sample position z mea- sured with respect to the focal plane. The following ex- ample will qualitatively elucidate how such a trace ( Z - scan) is related to the nonlinear refraction of the sample. Assume, for instance, a material with a negative nonlin- ear refractive index and a thickness smaller than the dif- fraction length of the focused beam (a thin medium). This can be regarded as a thin lens of variable focal length. Starting the scan from a distance far away from the focus (negative z ) , the beam irradiance is low and negligible nonlinear refraction occurs; hence, the transmittance ( D 2 / D 1 in Fig. 1 ) remains relatively constant. As the sample is brought closer to focus, the beam irradiance in- creases, leading to self-lensing in the sample. A negative self-lensing prior to focus will tend to collimate the beam, causing a beam narrowing at the aperture which results in an increase in the measured transmittance. As the scan in z continues and the sample passes the focal plane to the right (positive z ), the same self-defocusing increases the
0018-9197/90/0400-0760$01 .OO O 1990 IEEE
SHEIK-BAHAE et al . : SENSITIVE MEASUREMENT OF OPTICAL NONLINEARITIES USING SINGLE BEAM
~
76 1
SAMPLE APERTURE
-2 c__ +2
Fig. 1 . The Z-scan experimental apparatus in which the ratio 0 2 / 0 1 IS recorded as a function of the sample position L.
In general, nonlinearities of any order can be consid- ered; however, for simplicity, we first examine only a cu- bic nonlinearity where the index of refraction n is ex- pressed in terms of nonlinear indexes n2(esu) or y ( m2 / W ) through
( 1 )
beam divergence, leading to beam broadening at the ap- erture, and thus a decrease in transmittance. This suggests that there is a null as the sample crosses the focal plane. This is analogous to placing a thin lens at or near the fo- cus, resulting in a minimal change of the far-field pattern of the beam. The Z-scan is completed as the sample is moved away from focus (positive z ) such that the trans- mittance becomes linear since the irradiance is again low. Induced beam broadening and narrowing of this type have been previously observed and explained during nonlinear refraction measurements of some semiconductors [9], [lo]. A similar technique was also previously used to measure thermally induced beam distortion by chemicals in solvents [ l 1 1 .
A prefocal transmittance maximum (peak) followed by a postfocal transmittance minimum (valley) is, therefore, the Z-scan signature of a negative refractive nonlinearity. Positive nonlinear refraction, following the same anal- ogy, gives rise to an opposite valley-peak configuration. It is an extremely useful feature of the 2-scan method that the sign of the nonlinear index is immediately obvious from the data, and as we will show in the following sec- tion, the magnitude can also be easily estimated using a simple analysis for a thin medium.
In the above picture describing the Z-scan, one must bear in mind that a purely refractive nonlinearity was con- sidered assuming that no absorptive nonlinearities (such as multiphoton or saturation of absorption) are present. Qualitatively, multiphoton absorption suppresses the peak and enhances the valley, while saturation produces the opposite effect. The sensitivity to nonlinear refraction is entirely due to the aperture, and removal of the aperture completely eliminates the effect. However, in this case, the 2-scan will still be sensitive to nonlinear absorption. Nonlinear absorption coefficients can be extracted from such “open” aperture experiments. We will show in Sec- tion V how the data from the two Z-scans, with and with- out the aperture, can be used to separately determine both the nonlinear absorption and the nonlinear refraction. We will demonstrate this data analysis on semiconductors where two-photon absorption and self-refraction are simultaneously present.
111. THEORY Much work has been done in investigating the propa-
gation of intense laser beams inside a nonlinear material and the ensuing self-refraction [ 121, [ 131. Considering the geometry given in Fig. 1, we will formulate and discuss a simple method for analyzing the Z-scan data based on modifications of existing theories.
where no is the linear index of refraction, E is the peak electric field (cgs), and I denotes the irradiance (MKS) of the laser beam within the sample. (n, and y are related through the conversion formula n,(esu) = ( c n o / 4 0 7 r ) y ( m 2 / W ) where c ( m / s ) is the speed of light in vacuum. ) Assuming a TEMoo Gaussian beam of beam waist radius wo traveling in the + z direction, we can write E as
where w 2 ( z ) = w i ( 1 + z ’ / z i ) is the beam radius, R ( z ) = z ( 1 + zi/z2) is the radius of curvature of the wave- front at z , zo = kw6/2 is the diffraction length of the beam, k = 2 a / X is the wave vector, and X is the laser wave- length, all in free space. Eo( t ) denotes the radiation elec- tric field at the focus and contains the temporal envelope of the laser pulse. The e-’“(““) term contains all the ra- dially uniform phase variations. As we are only concerned with calculating the radial phase variations A’ ( r ) , the slowly varying envelope approximation (SVEA) applies, and all other phase changes that are uniform in r are ig- nored.
If the sample length is small enough that changes in the beam diameter within the sample due to either diffraction or nonlinear refraction can be neglected, the medium is regarded as “thin,” in which case the self-refraction pro- cess is referred to as “external self-action” [ 141. For lin- ear diffraction, this implies that L << zo, while for non- linear refraction, L << z,/A+(O). In most experiments using the Z-scan technique, we find that the second cri- terion is automatically met since A’ is small. Addition- ally, we have found that the first criterion for linear dif- fraction is more restrictive than it need be, and it is sufficient to replace it with L < to. We have determined this empirically by measuring n2 in the same material using various zo’s and the same analysis and have ob- tained the same value for n,. Such an assumption simpli- fies the problem considerably, and the amplitude $I and phase 4 of the electric field as a function of z ’ are now governed in the SVEA by a pair of simple equations:
- - ”’ - A n ( Z ) k dz‘
and
- = - a ( I ) I d l
dz ’
( 3 )
(4 )
162 IEEE JOURNAL OF QUANTUM ELECTRONICS. VOL. 26. NO. 4. APRIL 1990
where z ' is the propagation depth in the sample and a (I ), in general, includes linear and nonlinear absorption terms. Note that z' should not be confused with the sample po- sition z . In the case of a cubic nonlinearity and negligible nonlinear absorption, (3) and (4) are solved to give the phase shift A+ at the exit surface of the sample which simply follows the radial variation of the incident irradi- ance at a given position of the sample z . Thus,
with
A+,-,( t ) , the on-axis phase shift at the focus, is defined as
A%(t> = kAno(t) L f f (6 ) where Leff = ( 1 - e -aL) /a , with L the sample length and a the linear absorption coefficient. Here, AnO = yZO ( t ) with Zo ( t ) being the on-axis irradiance at focus (i.e., z = 0). We ignore Fresnel reflection losses such that, for example, Z O ( t ) is the irradiance within the sam- ple.
The complex electric field exiting the sample E, now contains the nonlinear phase distortion
. ( 7 ) -aL/2 eiA+(z,r, t) E,(r, z , t ) = E ( z , r, t ) e
By virtue of Huygen's principle, one can obtain the far- field pattern of the beam at the aperture plane through a zeroth-order Hankel transformation of E, [ 151. We will follow a more convenient treatment applicable to Gauss- ian input beams which we refer to as the "Gaussian de- composition" (GD) method given by Weaire et al. [14], in which they decompose the complex electric field at the exit plane of the sample into a summation of Gaussian beams through a Taylor series expansion of the nonlinear phase term eiA'(z,r.t) in (7). That is,
Each Gaussian beam can now be simply propagated to the aperture plane where they will be resummed to recon- struct the beam. When including the initial beam curva- ture for the focused beam, we derive the resultant electric field pattern at the aperture as
r2 ikr2 - exp (- 7 - - wm 2Rm (9 )
Defining d as the propagation distance in free space from the sample to the aperture plane and g = 1 + d / R ( z ) , the remaining parameters in (9) are expressed as
w; = w t o [ g2 + $1
and
The expression given by (9) is a general case of that de- rived by Weaire et al. [15] where they considered a col- limated beam ( R = 03) for which g = 1. We find that this GD method is very useful for the small phase distor- tions detected with the Z-scan method since only a few terms of the sum in (9) are needed. The method is also easily extended to higher order nonlinearities.
The transmitted power through the aperture is obtained by spatially integrating E, ( r , t ) up to the aperture radius r,, giving
~ r ( ~ * o ( t ) ) = cconon ja IEa(r7 t ) l 2 rdr ( 1 0 )
where cO is the permittivity of vacuum. Including the pulse temporal variation, the normalized Z-scan transmittance T ( z ) can be calculated as
S 3 P i ( [ ) dt -m
where P , ( t ) = n w ; Z O ( t ) / 2 is the instantaneous input power (within the sample) and S = 1 - exp( -2r: /w:) is the aperture linear transmittance, with w, denoting the beam radius at the aperture in the linear regime.
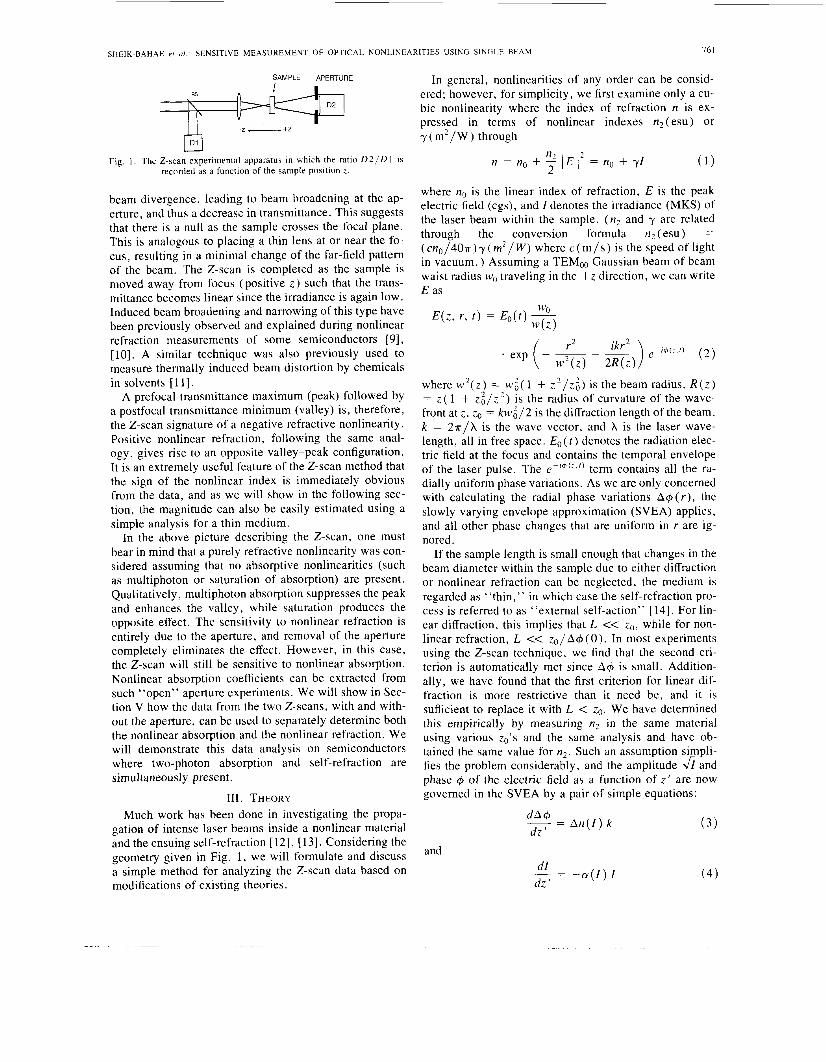
We first consider an instantaneous nonlinearity and a temporally square pulse to illustrate the general features of the 2-scan. This is equivalent to assuming CW radia- tion and the nonlinearity has reached the steady state. The normalized transmittance T ( z ) in the far field is shown in Fig. 2 for A+O = +0.25 and a small aperture ( S = 0.01 ). They exhibit the expected features, namely, a valley-peak ( U - p ) for the positive nonlinearity and a peak-valley ( p - U ) for the negative one. For a given A+o, the mag- nitude and shape of T ( z ) do not depend on the wavelength or geometry as long as the far-field condition for the ap- erture plane ( d >> z O ) is satisfied. The aperture size S , however, is an important parameter since a large aperture reduces the variations in T ( z ) . This reduction is more prominent in the peak where beam narrowing occurs and can result in a peak transmittance which cannot exceed ( 1 - S ) . Needless to say, for very large aperture or no ap- erture ( S = l ) , the effect vanishes and T ( z ) = 1 for all z and A+O. For small I A a O 1 , the peak and valley occur
SHEIK-BAHAE rt al . : SENSITIVE MEASUREMENT OF OPTICAL NONLINEARITIES USlNG SINGLE BEAM 763
1.08 , I 1 AO,=f0.25 I
0.92 -8 -3
2/20
Fig. 2. Calculated Z-scan transmittance curves for a cubic nonlinearity with either polarity and a small aperture ( S = 0.01 ).
at the same distance with respect to focus, and for a cubic nonlinearity, this distance is found to be =0.86 zo as shown in the Appendix. With larger phase distortions ( 1 A + o \ > l ) , numerical evaluation of (9)-(11) shows that this symmetry no longer holds and peak and valley both move toward +z for the corresponding sign of non- linearity ( +A+o) such that their separation remains nearly constant, given by
AZ,-,. cz 1.7 zO. (12)
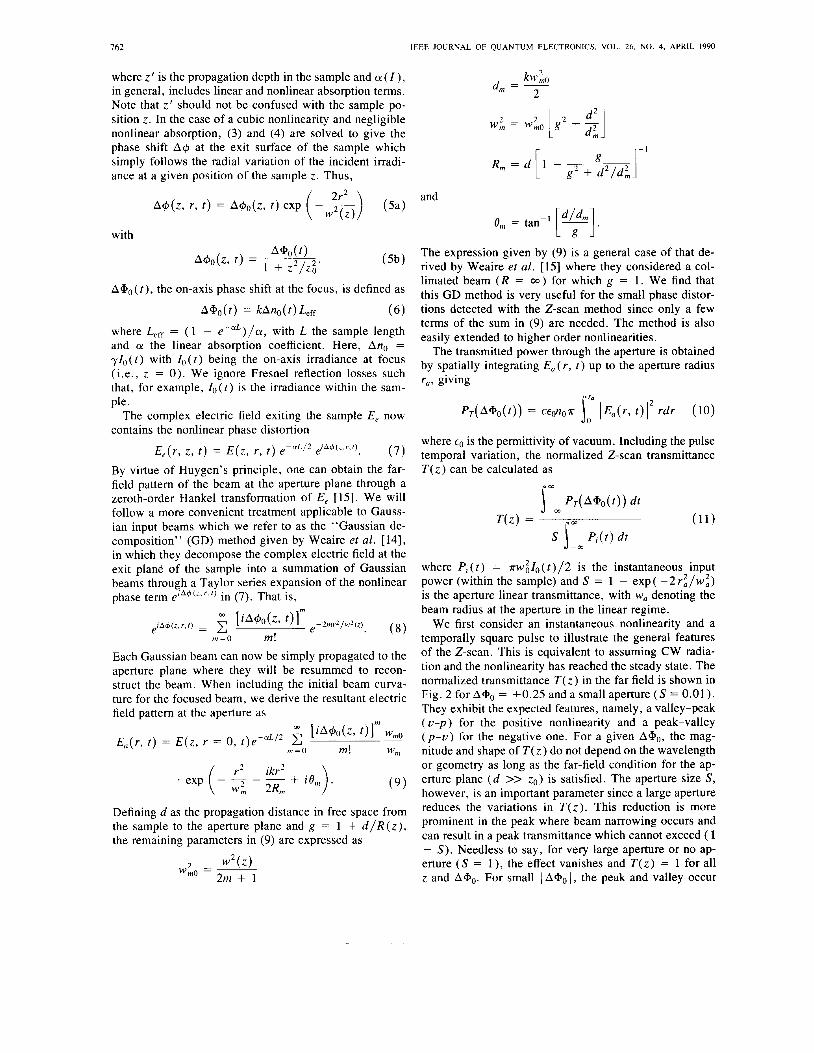
We can define an easily measurable quantity AT,_,, as the difference between the normalized peak and valley trans- mittance: T,-T,,. The variation of this quantity as a func- tion of I A+o 1 , as calculated for various aperture sizes, is illustrated in Fig. 3. These curves exhibit some useful features. First, for a given order of nonlinearity, they can be considered universal. In other words, they are inde- pendent of the laser wavelength, geometry (as long as the far-field condition is met), and the sign of nonlinearity. Second, for all aperture sizes, the variation of AT,_,, is found to be almost linearly dependent on ( A + o ( . As shown in the Appendix for small phase distortion and small aperture ( S - 0) ,
AT,-,, 2: 0.406 1 AGO I . (13a)
Numerical calculations show that this relation is accurate to within 0.5 percent for 1 AGO I I T . As shown in Fig. 3, for larger apertures, the linear coefficient 0.406 de- creases such that with S = 0.5, it becomes -0.34, and at S = 0.7, it reduces to -0.29. Based on a numerical fitting, the following relationship can be used to include such variations within a + 2 % accuracy:
ATp-,, - 0.406( 1 - S)o'25 I A+.,\
for lA+ol I n. (13b)
The implications of (13a) and (13b) are quite promising in that they can be used to readily estimate the nonlinear index ( n 2 ) with good accuracy after a Z-scan is per- formed. What is most intriguing about these expressions is that they reveal the highly sensitive nature of the Z-scan
09
> h 0.6 c
0.3
0.0 0 n/2 TI
l A + O l Fig. 3 . Calculated AT, , as a function of the phase shift at the focus ( A + , , ) .
The sensitivity, as indicated by the slope of the curves. decreases sloul) for larger aperture sizes (S > 0 ) .
technique. For example, if our experimental apparatus and data acquisition systems are capable of resolving trans- mittance changes A Tp-,, of = 1 %, we will be able to mea- sure phase changes corresponding to less than h/250 wavefront distortion. Achieving such sensitivity, how- ever, requires relatively good optical quality of the sam- ple under study. We describe in the experimental Section IV a means to minimize problems arising from poor op- tical quality samples.
We can now easily extend the steady-state results to include transient effects induced by pulsed radiation by using the time-averaged index change ( Ano( r ) ) where
(14)
The time-averaged ( A+,,( f ) ) is related to ( An,( t ) ) through (6). With a nonlinearity having instantaneous re- sponse and decay times relative to the pulsewidth of the laser, one obtains for a temporally Gaussian pulse
( A n o ( [ ) ) = Ano/& (15 )
where Ano now represents the peak-on-axis index change at the focus. For a cumulative nonlinearity having a decay time much longer than the pulsewidth (e.g., thermal), the instantaneous index change is given by the following in- tegral:
An,,(r) = A i f ro(r '1 d t ' (16) - m
where A is a constant which depends on the nature of the nonlinearity. If we substitute (16) into (14), we obtain a fluence averaging factor of 1 /2 . That is,
(17 ) 1 ( A n o ( t ) ) = 5 A F
~
764
where F is the pulse fluence at focus within the sample. Interestingly, the factor of 1 /2 is independent of the tem- poral pulse shape.
These equations were obtained based on a cubic non- linearity (i.e., a x ' ~ ' effect). A similar analysis can be per- formed for higher order nonlinearities. Regardless of the order of the nonlinearity, the same qualitative features are to be expected from the 2-scan analysis. In particular, to quantify such features, we examined the effects of a x'" nonlinearity which can be represented by a nonlinear in- dex change given as An = V I * . Nonlinearities encoun- tered in semiconductors where the index of refraction is altered through charge carriers generated by two-photon absorption (i.e., a sequential x ' ~ ' : x"' effect) appear as such a fifth-order nonlinearity [20].
For a fifth-order effect, assuming a thin sample and using the GD approach, we find that the peak and valley are separated by = 1.2 zo as compared to 1.7 zo obtained for the third-order effect. Furthermore, the calculations also show that for a small aperture ( S = 0) ,
AT,_,, = 0.21 IA+.,I (18) where, in this case, the phase distortion is given by
Calculations also indicate that the aperture size depen- dence of (18) can be approximated by multiplying the right-hand term by ( 1 - S )o.2s, as was the case for a third- order nonlinearity.
As will be shown in Section V, we can also determine the nonlinear refraction in the presence of nonlinear ab- sorption by separately measuring the nonlinear absorption in a 2-scan performed with the aperture removed. Within approximations elaborated in Section V, a simple division of the curves obtained from the two Z-scans will give the nonlinear refraction.
IV. EXPERIMENTAL RESULTS We examined the nonlinear refraction of a number of
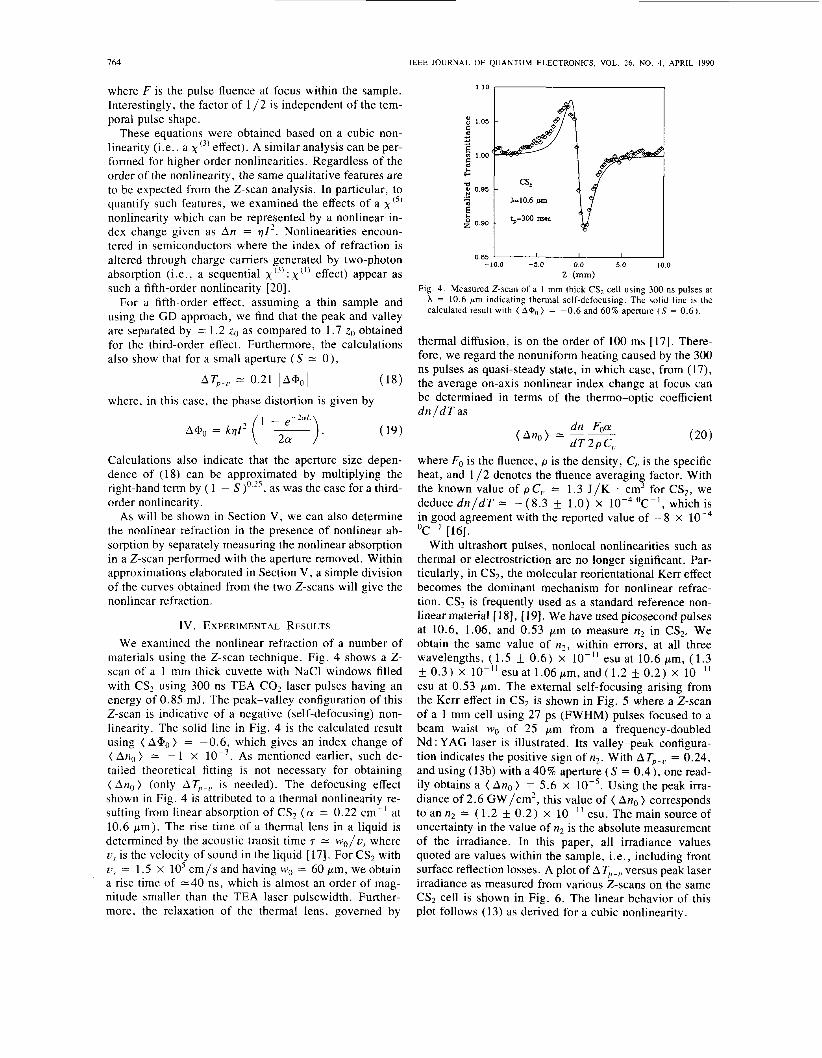
materials using the 2-scan technique. Fig. 4 shows a Z- scan of a 1 mm thick cuvette with NaCl windows filled with CS2 using 300 ns TEA CO2 laser pulses having an energy of 0.85 mJ. The peak-valley configuration of this 2-scan is indicative of a negative (self-defocusing) non- linearity. The solid line in Fig. 4 is the calculated result using ( A+, , ) = -0.6, which gives an index change of ( An,, ) = - 1 x lop3. As mentioned earlier, such de- tailed theoretical fitting is not necessary for obtaining ( A n o ) (only AT,-,, is needed). The defocusing effect shown in Fig. 4 is attributed to a thermal nonlinearity re- sulting from linear absorption of CS2 ( CY = 0.22 cm-' at 10.6 pm) . The rise time of a thermal lens in a liquid is determined by the acoustic transit time 7 = w 0 / u , where U , is the velocity of sound in the liquid [ 171. For CS2 with U , = 1.5 X lo5 cm/s and having wo = 60 pm, we obtain a rise time of =40 ns, which is almost an order of mag- nitude smaller than the TEA laser pulsewidth. Further- more, the relaxation of the thermal lens, governed by
IEEE JOURNAL OF QUANTUM ELECTRONICS, VOL. 26. NO. 4, APRIL 1990
1.10 , I
0.85 ' I I I I -10.0 -5.0 0.0 5.0 10.0
(mm) Fig. 4. Measured Z-scan of a I mm thick CS2 cell using 300 ns pulses at
A = 10.6 pm indicating thermal self-defocusing. The solid line is the calculated result with ( A*o) = -0.6 and 60% aperture ( S = 0.6).
thermal diffusion, is on the order of 100 ms [17]. There- fore, we regard the nonuniform heating caused by the 300 ns pulses as quasi-steady state, in which case, from (17), the average on-axis nonlinear index change at focus can be determined in terms of the thermo-optic coefficient d n / d T as
dn F0a! ( A n , ) = --
d T 2 P e,, where F, is the fluence, p is the density, e,, is the specific heat, and 1 /2 denotes the fluence averaging factor. With the known value of p C t , = 1.3 J / K cm3 for C S 2 , we deduce d n / d T = - (8 .3 f 1.0) X OC-', which is in good agreement with the reported value of -8 X OC-' [16].
With ultrashort pulses, nonlocal nonlinearities such as thermal or electrostriction are no longer significant. Par- ticularly, in CS2, the molecular reorientational Kerr effect becomes the dominant mechanism for nonlinear refrac- tion. CS2 is frequently used as a standard reference non- linear material [ 18 ], [ 191. We have used picosecond pulses at 10.6, 1.06, and 0.53 pm to measure n2 in CS2, We obtain the same value of n2 , within errors, at all three wavelengths, (1 .5 i- 0.6) x lo- ' ' esu at 10.6 pm, (1.3
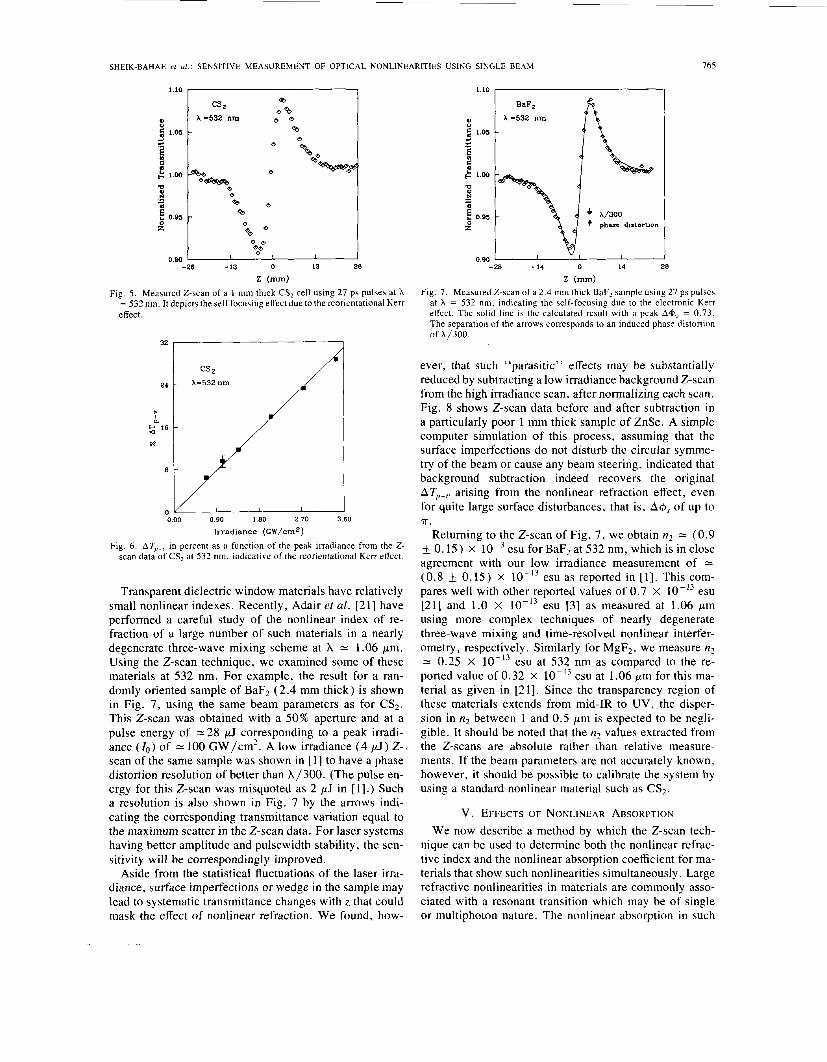
0 .3) X lo-' ' esuat 1.06 pm, and (1.2 f 0.2) x lo-' ' esu at 0.53 pm. The external self-focusing arising from the Kerr effect in CS2 is shown in Fig. 5 where a Z-scan of a 1 mm cell using 27 ps (FWHM) pulses focused to a beam waist wo of 25 pm from a frequency-doubled Nd : YAG laser is illustrated. Its valley-peak configura- tion indicates the positive sign of n2. With AT,_,, = 0.24, and using (13b) with a 40% aperture ( S = 0.4), one read- ily obtains a ( An,,) = 5.6 x Using the peak irra- diance of 2.6 GW /cm2, this value of ( Ano ) corresponds to an n2 = ( 1.2 k 0.2) x lo-' ' esu. The main source of uncertainty in the value of n2 is the absolute measurement of the irradiance. In this paper, all irradiance values quoted are values within the sample, i.e., including front surface reflection losses. A plot of AT,_,, versus peak laser irradiance as measured from various 2-scans on the same CS2 cell is shown in Fig. 6 . The linear behavior of this plot follows (13) as derived for a cubic nonlinearity.
SHEIK-BAHAE er al.: SENSITIVE MEASUREMENT OF OPTICAL NONLINEARITIES USING SINGLE BEAM 765
1.10 r I
cs 2
A-532 nm
Q Q .- - 8 E 0.95 s 0
B e a
I “ o ” , 0.90 I
-26 - 13 0 13 26
2 (mm) Fig. 5 . Measured Z-scan of a 1 mm thick CS2 cell using 27 ps pulses at X
= 532 nm. It depicts the self focusing effect due to the reorientational Kerr effect.
> I P
‘d 16
R
8
0 0.00 0.90 1.60 2.70 3.60
Irradiance (GW/cmz)
Fig. 6. AT,.,, in percent as a function of the peak irradiance from the Z - scan data of CS, at 532 nm, indicative of the reorientational Kerr effect.
Transparent dielectric window materials have relatively small nonlinear indexes. Recently, Adair et al. [21] have performed a careful study of the nonlinear index of re- fraction of a large number of such materials in a nearly degenerate three-wave mixing scheme at X = 1.06 pm. Using the 2-scan technique, we examined some of these materials at 532 nm. For example, the result for a ran- domly oriented sample of BaF2 (2 .4 mm thick) is shown in Fig. 7, using the same beam parameters as for CS2. This 2-scan was obtained with a 50% aperture and at a pulse energy of -28 pJ corresponding to a peak irradi- ance (lo) of = 100 GW/cm2. A low irradiance ( 4 pJ) Z-, scan of the same sample was shown in [ 11 to have a phase distortion resolution of better than X/300. (The pulse en- ergy for this Z-scan was misquoted as 2 pJ in [ 11 .) Such a resolution is also shown in Fig. 7 by the arrows indi- cating the corresponding transmittance variation equal to the maximum scatter in the Z-scan data. For laser systems having better amplitude and pulsewidth stability, the sen- sitivity will be correspondingly improved.
Aside from the statistical fluctuations of the laser irra- diance, surface imperfections or wedge in the sample may lead to systematic transmittance changes with z that could mask the effect of nonlinear refraction. We found, how-
I I
-28 - 14 0 14 28
z (mm) Fig. 7. Measured Z-scan of a 2.4 mm thick BaF, sample using 27 ps pulses
at X = 532 nm, indicating the self-focusing due to the electronic Kerr effect. The solid line is the calculated result with a peak Aa0 = 0.73. The separation of the arrows corresponds to an induced phase distortion of X/300.
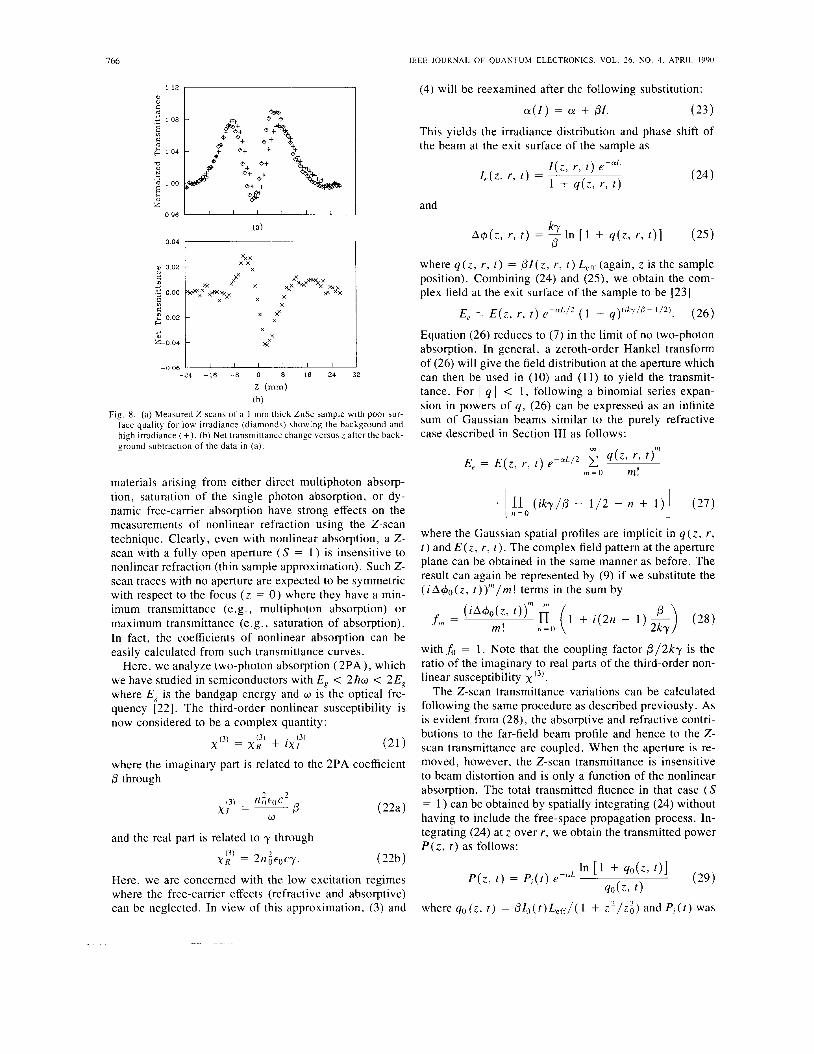
ever, that such “parasitic” effects may be substantially reduced by subtracting a low irradiance background Z-scan from the high irradiance scan, after normalizing each scan. Fig. 8 shows 2-scan data before and after subtraction in a particularly poor 1 mm thick sample of ZnSe. A simple computer simulation of this process, assuming that the surface imperfections do not disturb the circular symme- try of the beam or cause any beam steering, indicated that background subtraction indeed recovers the original ATp-*, arising from the nonlinear refraction effect, even for quite large surface disturbances, that is, of up to
Returning to the 2-scan of Fig. 7, we obtain n2 = (0.9 f 0.15) X lop3 esu for BaF, at 532 nm, which is in close agreement with our low irradiance measurement of = (0.8 f 0.15) X esu as reported in [1]. This com- pares well with other reported values of 0.7 x esu [21] and 1.0 x esu [3] as measured at 1.06 pm using more complex techniques of nearly degenerate three-wave mixing and time-resolved nonlinear interfer- ometry, respectively. Similarly for MgF2, we measure n2 2: 0.25 X esu at 532 nm as compared to the re- ported value of 0.32 x esu at 1.06 pm for this ma- terial as given in [21]. Since the transparency region of these materials extends from mid-IR to UV, the disper- sion in n2 between 1 and 0.5 pm is expected to be negli- gible. It should be noted that the n2 values extracted from the Z-scans are absolute rather than relative measure- ments. If the beam parameters are not accurately known, however, it should be possible to calibrate the system by using a standard nonlinear material such as CS2.
V. EFFECTS OF NONLINEAR ABSORPTION We now describe a method by which the Z-scan tech-
nique can be used to determine both the nonlinear refrac- tive index and the nonlinear absorption coefficient for ma- terials that show such nonlinearities simultaneously. Large refractive nonlinearities in materials are commonly asso- ciated with a resonant transition which may be of single or multiphoton nature. The nonlinear absorption in such
T .
766 IEEE JOURNAL OF QUANTUM ELECTRONICS. VOL. 26. NO. 4. APRIL 1990
(4) will be reexamined after the following substitution: 0, l2 7 1 U C m
2 108
E z 8 1 0 4
N 0,
l o o z
a(Z) = (Y + OZ. (23)
This yields the irradiance distribution and phase shift of the beam at the exit surface of the sample as
and
(mm) (b)
Fig. 8 . (a) Measured Z-scans of a 1 mm thick ZnSe sample with poor sur- face quality for low irradiance (diamonds) showing the background and high irradiance (+) . (b) Net transmittance change versus z after the back- ground subtraction of the data in (a).
materials arising from either direct multiphoton absorp- tion, saturation of the single photon absorption, or dy- namic free-carrier absorption have strong effects on the measurements of nonlinear refraction using the Z-scan technique. Clearly, even with nonlinear absorption, a Z- scan with a fully open aperture ( S = 1 ) is insensitive to nonlinear refraction (thin sample approximation). Such Z- scan traces with no aperture are expected to be symmetric with respect to the focus ( z = 0 ) where they have a min- imum transmittance (e.g., multiphoton absorption) or maximum transmittance (e.g., saturation of absorption). In fact, the coefficients of nonlinear absorption can be easily calculated from such transmittance curves.
Here, we analyze two-photon absorption (2PA) , which we have studied in semiconductors with E, < 2hw < 2E, where E, is the bandgap energy and w is the optical fre- quency [22]. The third-order nonlinear susceptibility is now considered to be a complex quantity:
where the imaginary part is related to the 2PA coefficient through
and the real part is related to y through
Here, we are concerned with the low excitation regimes where the free-carrier effects (refractive and absorptive) can be neglected. In view of this approximation, ( 3 ) and
where q ( z , r , t ) = PZ(z, r , t ) Leff (again, z is the sample position). Combining (24) and (25), we obtain the com- plex field at the exit surface of the sample to be [23]
. (26) E , = E ( z , r , t ) e - c i L / 2 (1 + q ) “ k Y / ” l / 2 )
Equation (26) reduces to (7) in the limit of no two-photon absorption. In general, a zeroth-order Hankel transform of (26) will give the field distribution at the aperture which can then be used in (10) and (11) to yield the transmit- tance. For I q 1 < 1, following a binomial series expan- sion in powers of q, (26) can be expressed as an infinite sum of Gaussian beams similar to the purely refractive case described in Section I11 as follows:
m - a L / 2 c q(z7 r , fSfZ E, = E(z, r , t ) e
m = O m!
. [n ( i k y / P - 1/2 - n + l ) ] (27) n = O
where the Gaussian spatial profiles are implicit in q ( z , r , t ) and E ( z , r , t ) . The complex field pattern at the aperture plane can be obtained in the same manner as before. The result can again be represented by (9) if we substitute the ( i A & ( z , t ) ) m / m ! terms in the sum by
with fo = 1. Note that the coupling factor 0 / 2 k y is the ratio of the imaginary to real parts of the third-order non- linear susceptibility x ( 3 ) .
The Z-scan transmittance variations can be calculated following the same procedure as described previously. As is evident from (28), the absorptive and refractive contri- butions to the far-field beam profile and hence to the Z- scan transmittance are coupled. When the aperture is re- moved, however, the Z-scan transmittance is insensitive to beam distortion and is only a function of the nonlinear absorption. The total transmitted fluence in that case ( S = 1 ) can be obtained by spatially integrating (24) without having to include the free-space propagation process. In- tegrating (24) at z over r , we obtain the transmitted power P ( z , t ) as follows:
where qO(z, t ) = pZO(t)Le, , /( 1 + z 2 / z i ) and P , ( t ) was
SHEIK-BAHAE et U / . : SENSITIVE MEASUREMENT OF OPTICAL NONLINEARITIES USING SINGLE BEAM 167
defined in (1 1). For a temporally Gaussian pulse, (29) can be time integrated to give the normalized energy trans- mittance
. 1 In[ 1 + q o ( z , 0 ) F T 2 ] d r . ( 3 0 )
For I qo 1 < 1, this transmittance can be expressed in terms of the peak irradiance in a summation form more suitable for numerical evaluation:
- m
Thus, once an open aperture (S = 1 ) Z-scan is per- formed, the nonlinear absorption coefficient /3 can be un- ambiguously deduced. With /3 known, the Z-scan with ap- erture in place ( S < 1 ) can be used to extract the remaining unknown, namely, the coefficient y.
An experimental example of this procedure is shown in Fig. 9 where a 2.7 mm thick ZnSe sample is examined using 27 ps (FWHM) pulses at 532 nm. ZnSe with a band- gap energy of 2.67 eV is a two-photon absorber at this wavelength. With a linear index of 2.7, the diffraction length inside the sample ( n o z o ) was approximately four times the sample thickness. This allows us to safely apply the thin sample analysis developed in this paper. Fig. 9(a) depicts the open aperture data at a peak irradiance Io of 0.21 GW/cm2. Also plotted is the theoretical result using (28) in (9) with 0 = 5.8 cm/GW. This is in excellent agreement with the previously measured value of 5.5 cm/GW [22]. Under the same conditions, the Z-scan with a 40% aperture, as shown in Fig. 9(b), exhibits a self- defocusing effect. These data have had a low irradiance background Z-scan subtracted to reduce the effects of lin- ear sample inhomogeneities. Note the significant differ- ence between this Z-scan and that of a purely refractive case. Here, the nonlinear absorption (2PA) has greatly suppressed the peak and enhanced the valley of the trans- mittance. The theoretical fit in Fig. 9(b) is obtained by setting /3 = 5.8 cm/GW and adjusting y to be 6.8 X
cm2/W ( n 2 = 4.4 x lo-” esu) with an uncer- tainty of *25 % arising predominantly from the irradiance calibration.
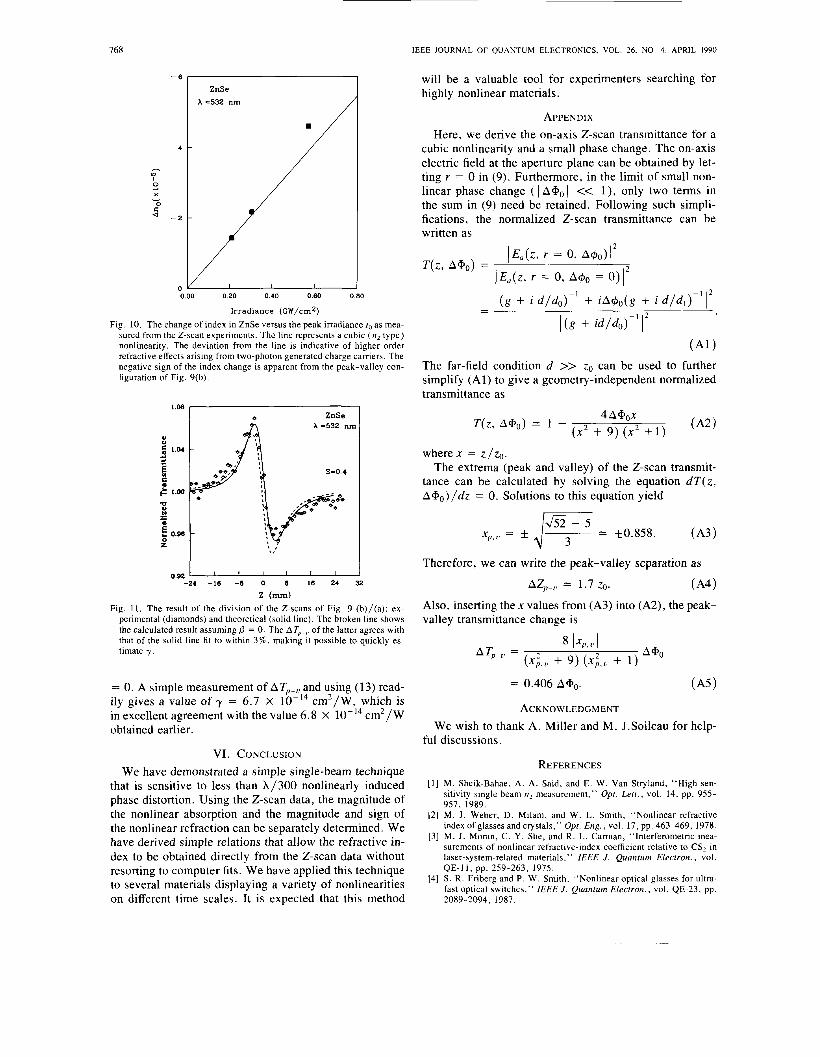
An irradiance-dependent Z-scan study of the ZnSe in- dicates that for an irradiance In < 0.5 GW/cm2, the non- linear refraction is dominated by a third-order effect. This is depicted in Fig. 10 where the measured nonlinear index change Ano varies linearly with the irradiance. At higher irradiance levels, however, the nonlinear refraction caused by 2PA generated charge carriers, an effective fifth-order nonlinearity, becomes important. This is indicated in Fig. 10 by the small deviation of Ano at Io = 0.57 GW/cm’ from the line representing the cubic nonlinearity. An ear- lier investigation of ZnSe using picosecond time-resolved degenerate four-wave mixing (DFWM) at 532 nm had in- dicated that a fast x ( ~ ) effect followed by a slowly decay-
1.04 ZnSe
A -532 nn
1.04
ZnSe A -532 n m
U
5 1.00
s a c” 0.w B
4 4
- 0
E 0.92 z
0.88 -24 -16 -8 0 8 16 24 32
z (mm)
(b) Fig. 9. Normalized Z-scan transmittance of ZnSe measured using pico-
second pulses at h = 532 nm with I , = 0.21 GW/cm2. The solid lines are the theoretical results. (a) No aperture ( S = 1 ) data and fit using 5.8 cm/GW. (b) 40% aperture data fitted with p = 5.8 cm/GW and y = 6.8 X 10-’cm’/GW.
( 5 ) ing Xeff resulting from two-photon generated charge car- riers was responsible for the DFWM signal [24]. Z-scan experiments reported here verify those results, and in ad- dition, can accurately determine the sign and magnitude of these nonlinearities.
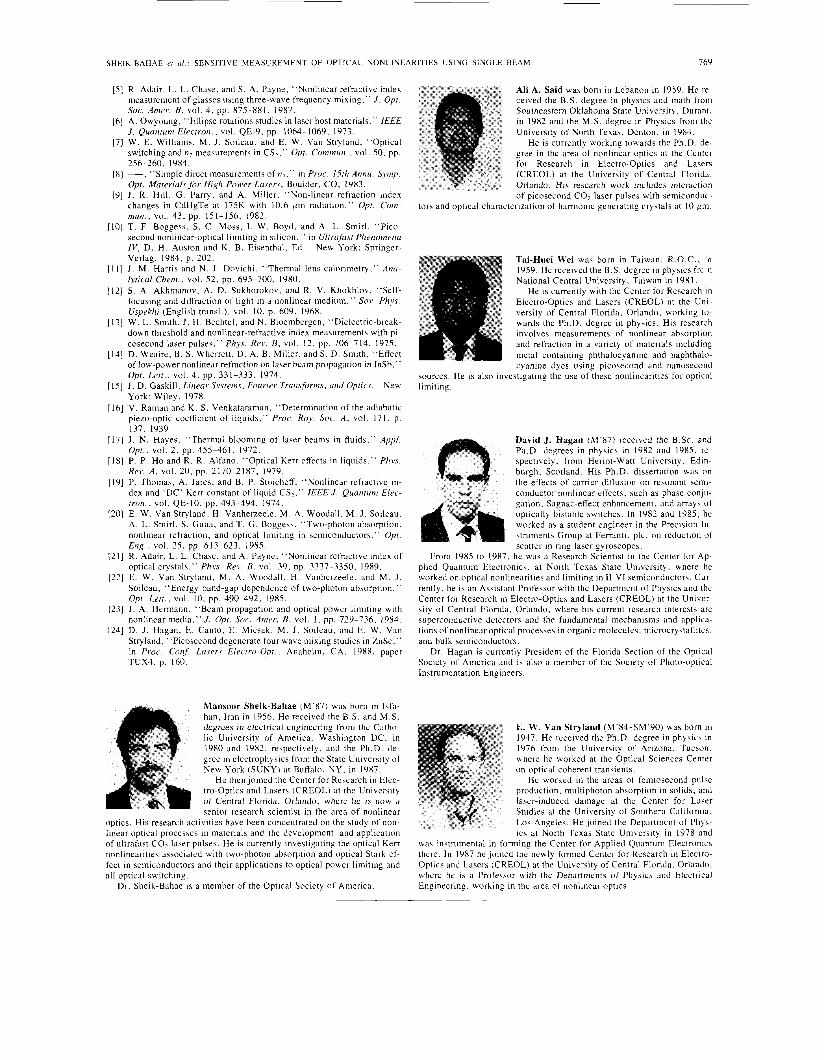
As was done for the case of a purely refractive effect, it is desirable to be able to estimatc -, : -A 9 without hav- ing to perform a detailed fitting of the experimental data. A thorough numerical evaluation of the theoretical results derived in this section indicated that within less than 10% uncertainty, such a procedure is possible provided that 90 (0, 0 ) I 1 and /3 / 2 k y I 1. The first condition can be met by adjusting the irradiance. The second condition is an intrinsic property of the material implying that the Im ( x ‘ ~ ’ ) should not be larger than the Re ( x ‘ ~ ’ ) . This is the case for the semiconductors studied as well as for a wide variety of other materials. The separation and eval- uation process is simple: divide the closed aperture ( S < 1 ) normalized 2-scan (with background subtracted) by the one with open aperture ( S = 1 ) . The result is a new Z- scan where AI; , agrees to within & 10% of that obtained from a purely refractive Z-scan. The result of this proce- dure for the Z-scans of Fig. 9 is illustrated in Fig. 11 where the division of the two 2-scans of both experiment and theory are compared to the calculated Z-scan with /3
~
768
ZnSe A =532 nm
- 4 -
10
0 c
0.00 0.20 0.40 0.60 0.80
Irradiance (GW/cmz) Fig. 10. The change of index in ZnSe versus the peak irradiance lo as mea-
sured from the Z-scan experiments. The line represents a cubic ( n , type) nonlinearity. The deviation from the line is indicative of higher order refractive effects arising from two-photon generated charge camers . The negative sign of the index change is apparent from the peak-valley con- figuration of Fig. 9(b).
1.08 ZnSe
-24 -18 -8 0 8 I 6 24 32
Z (mm) Fig. 11. The result of the division of the Z-scans of Fig. 9 (b) / (a) : ex-
perimental (diamonds) and theoretical (solid line). The broken line shows the calculated result assuming 0 = 0. The AT,.,. of the latter agrees with that of the solid line fit to within 3 % , making it possible to quickly es- timate y .
= 0. A simple measurement of ATp-,, and using (13) read- ily gives a value of y = 6.7 X cm2/W, which is in excellent agreement with the value 6.8 X cm2/W obtained earlier.
VI. CONCLUSION We have demonstrated a simple single-beam technique
that is sensitive to less than X/300 nonlinearly induced phase distortion. Using the Z-scan data, the magnitude of the nonlinear absorption and the magnitude and sign of the nonlinear refraction can be separately determined. We have derived simple relations that allow the refractive in- dex to be obtained directly from the Z-scan data without resorting to computer fits. We have applied this technique to several materials displaying a variety of nonlinearities on different time scales. It is expected that this method
IEEE JOURNAL OF QUANTUM ELECTRONICS, VOL. 26, NO. 4. APRIL 1990
will be a valuable tool for experimenters searching for highly nonlinear materials.
APPEND I x Here, we derive the on-axis Z-scan transmittance for a
cubic nonlinearity and a small phase change. The on-axis electric field at the aperture plane can be obtained by let- ting r = 0 in (9). Furthermore, in the limit of small non- linear phase change ( I A+,, 1 << 1 ), only two terms in the sum in (9) need be retained. Following such simpli- fications, the normalized Z-scan transmittance can be written as
The far-field condition d >> zo can be used to further simplify (A 1) to give a geometry-independent normalized transmittance as
wherex = z / z o . The extrema (peak and valley) of the Z-scan transmit-
tance can be calculated by solving the equation d T ( z , A a 0 ) / d z = 0. Solutions to this equation yield
Therefore, we can write the peak-valley separation as
AZp_,, 1.7 zO. (A4)
Also, inserting the x values from (A3) into (A2), the peak- valley transmittance change is
= 0.406 A+o. (A5)
ACKNOWLEDGMENT We wish to thank A. Miller and M. J.Soileau for help-
ful discussions.
REFERENCES M . Sheik-Bahae, A . A. Said, and E. W. Van Stryland, “High sen- sitivity single beam n2 measurement,” Opt. Le t t . , vol. 14, pp. 955- 957, 1989. M . J . Weber, D. Milam, and W. L. Smith, “Nonlinear refractive index of glasses and crystals,” Opt. Eng . , vol. 17, pp. 463-469, 1978. M. J . Moran, C. Y . She, and R. L. Carman, “Interferometric mea- surements of nonlinear refractive-index coefficient relative to CS2 in laser-system-related materials,’’ lEEE J . Quantum Elecrron. , vol.
S . R. Friberg and P. W. Smith, “Nonlinear optical glasses for ultra- fast optical switches,” IEEE J . Quantum Electron., vol. QE-23, pp.
QE-11, pp. 259-263, 1975.
2089-2094, 1987.
SHEIK-BAHAE er al . : SENSITIVE MEASUREMENT OF OPTICAL NONLINE
[SI R. Adair, L . L . Chase, and S. A. Payne, “Nonlinear refractive index measurement of glasses using three-wave frequency mixing.” J . Opt. Soc. Anier. B, vol. 4 . pp. 875-881, 1987.
[6] A. Owyoung, “Ellipse rotations studies in laser host materials.” IEEE J . Quunrum Elecrrori., vol. QE-9, pp. 1064-1069. 1973.
171 W . E. Williams, M . J . Soileau. and E. W . Van Stryland. “Optical switching and n2 measurements in CS,.” Opt. Commun.. vol. SO. pp. 256-260. 1984.
[8] -, “Simple direct measurements of nZ.” in Proc. 15rh Annu. Synp. Opr. Mureriuls fitr High Power Lrisrrs. Boulder, CO, 1983.
[9] J . R . Hill, G . Parry, and A. Miller, “Non-linear refraction index changes in CdHgTe at 175K with 10.6 p n radiation,” Opr. Com- mun., vol. 43 , pp. 151-156, 1982.
[IO] T . F . Boggess, S . C . Moss, 1. W . Boyd. and A. L . Smirl, “Pico- second nonlinear-optical limiting in silicon,” in Ulrrufusr Phenomeriu IV , D . H. Auston and K. B. Eisenthal, Ed . New York: Springer- Verlag, 1984, p. 202.
[ 1 I] J . M. Harris and N. J . Dovichi, “Thermal lens calorimetry.” Anu- lvricul Chem., vol. 52, pp. 695-700. 1980.
[ 121 S . A. Akhmanov, A. D . Sukhorokov. and R. V . Khokhlov, ”Self- focusing and diffraction of light in a nonlinear medium.” Sora. Phys. Uspekhi (English transl.), vol. I O , p. 609, 1968.
1131 W . L. Smith, J . H . Bechtel. and N. Bloembergen, “Dielectric-break- down threshold and nonlinear-refractive index measurements with pi- cosecond laser pulses.” Phys. ReL,. E , vol. 12, pp. 706-714, 1975.
[ 141 D. Weaire, B. S. Wherrett, D . A. B. Miller, and S . D . Smith, “Effect of low-power nonlinear refraction on laser beam propagation in InSb,” Opt. Letr.. vol. 4. pp. 331-333, 1974.
[15] J . D . Gaskill, Linear SFsrems, Fourier Trunsforms, and Oprics. New York: Wiley, 1978.
[16] V. Raman and K . S . Venkataraman. ”Determination of the adiabatic piezo-optic coefficient of liquids,” Proc. Roy. Soc. A . vol. 171. p . 137. 1939.
1171 J . N. Hayes, ”Thermal blooming of laser beams in fluids.” Appl. Opr. , vol. 2 , pp. 455-461, 1972.
[I81 P. P . Ho and R. R. Alfano. “Optical Kerr effects in liquids,” Phys. Rev. A , vol. 20. pp. 2170-2187, 1979.
[19] P. Thomas, A. Jares. and B. P . Stoicheff. “Nonlinear refractive in- dex and ‘DC’ Kerr constant of liquid CS,,” lEEE J . Q U U J ~ I U I J I Elec- tron., vol. QE-IO, pp. 493-494. 1974.
[20] E . W . Van Stryland. H . Vanherzeele, M . A. Woodall, M . J . Soileau. A. L . Smirl. S . Guha, and T. G. Boggess. “Two-photon absorption. nonlinear refraction. and optical limiting in semiconductors.” Opr.
1211 R. Adair, L . L . Chase, and A. Payne, “Nonlinear refractive index of optical crystals.” Phys. Rev. B , vol. 39, pp. 3337-3350, 1989.
[22] E . W . Van Stryland, M . A. Woodall, H . Vanherzeele. and M . J . Soileau, “Energy band-gap dependence of two-photon absorption.“ Opr. Lert., vol. I O , pp. 490-492. 1985.
1231 J . A. Hermann. “Beam propagation and optical power limiting with nonlinear media.” J . Opr. Soc. Amrr. B, vol. I , pp. 729-736. 1984.
1241 D. J . Hagan, E. Canto. E . Miesak. M . J . Soileau, and E . W . Van Stryland, “Picosecond degenerate four wave mixing studies in ZnSe.” in Proc. Conf. Lasers Elecrro-Opr., Anaheim, CA. 1988, paper TUX4. p. 160.
En,7., vol. 25. pp. 613-623. 1985.
Mansoor Sheik-Bahae (M‘87) was born in Isfa- han, Iran in 1956. He received the B.S. and M.S. degrees in electrical engineering from the Catho- lic University of America. Washington DC. in 1980 and 1982. respectively, and the Ph .D. de- gree in electrophysics from the State University of New York (SUNY) at Butfalo, NY, in 1987.
He then joined the Center for Research in Elec- tro-optics and Lasers (CREOL) at the University of Central Florida. Orlando. where he is now a senior research scientist in the area of nonlinear
optics. His research activities have been concentrated on the study of non- linear optical processes in materials and the development and application of ultrafast CO, laser pulses. He is currently investigating the optical Kerr nonlinearities associated with two-photon absorption and optical Stark ef- fect in semiconductors and their applications to optical power limiting and all optical switching.
Dr. Sheik-Bahae is a member of the Optical Society of America.
ARITIES USING SINGLE BEAM 769
Ali A. Said was born in Lebanon in 1959. He re- ceived the B.S. degree in physics and math from Southeastern Oklahoma State University. Durant. in 1982 and the M.S. degree in Physics from the University of North Texas, Denton, in 1984.
He is currently working towards the Ph.D. de- gree in the area of nonlinear optics at the Center for Research in Electro-optics and Lasers (CREOL) at the University of Central Florida. Orlando. His research work includes interaction of picosecond CO, laser pulses with semiconduc-
tors and optical characterization of harmonic generating crystals at 10 jm.
Tai-Huei Wei was born in Taiwan. R.O.C. . .n 1959. He received the B.S. degree in physics frc n National Central University, Taiwan in 1981.
He is currently with the Center for Research in Electro-optics and Lasers (CREOL) at the Uni- versity of Central Florida. Orlando, working to- wards the Ph.D. degree in physics. His research involves measurements of nonlinear absorption and refraction in a variety of materials including metal containing phthalocyanine and naphthalo- cyanine dyes using picosecond and nanosecond
sources. He is also investigating the use of these nonlinearities for optical limiting.
David J . Hagan (M’87) received the B Sc dnd Ph D degrees in physics in 1982 dnd 1985. re spectively. from Heriot-Watt Unibersity, Edin burgh. Scotland His Ph D dissertation was on the effects of carrier diffusion on reconant semi- conductor nonlinear effects. 5uch as Dha5e coniu- gdtion, Sagnac-effect enhancement. and arrays ot optically bistable switches In 1982 dnd 1985, he worked as a ctudent engineer in the Precision In- strumentc Group at Ferranti. plc on reduction of scatter in ring laser gyroscopes
From 1985 to 1987. he was a Research Scientist in the Center for Ap- plied Quantum Electronics. at North Texas State University. where he worked on optical nonlinearities and limiting in 11-VI semiconductors. Cur- rently. he is an Assistant Professor with the Department of Physics and the Center for Research in Electro-optics and Lasers (CREOL) at the Univer- sity of Central Florida, Orlando. where his current research interests are superconductive detectors and the fundamental mechanisms and applica- tions of nonlinear optical processes in organic molecules, microcrystallites. and bulk semiconductors.
Dr. Hagan is currently President of the Florida Section of the Optical Society of America and is also a member of the Society of Photo-optical Instrumentation Engineers.
E. W . Van Stryland (M’84-SM‘90) was born in 1947. He received the Ph .D. degree in physics in 1976 from the University of Arizona. Tucson. where he worked at the Optical Sciences Center on optical coherent transients.
He worked in the areas of femtosecond pulsc production, multiphoton absorption in solids, and laser-induced damage at the Center for Laser Studies at the University of Southern California. Los Angeles. He joined the Department of Phys- ics at North Texas State University in 1978 and
was instrumental in forming the Center for Applied Quantum Electronics there. In I987 he joined the newly formed Center for Research in Electro- Optics and Lasers (CREOL) at the University of Central Florida. Orlando. where he is a Professor with the Departments of Physics and Electrical Engineering, working in the area of nonlinear optic.;.


![[3.4]_Fiber Nonlinearities](https://static.fdocuments.net/doc/165x107/55cf8e81550346703b92da6f/34fiber-nonlinearities.jpg)
