SENIORSHOUSING MARKET OVERVIEW & VALUATION … · SENIORS HOUSING MARKET TRENDS CONSTRUCTION STARTS...
54
SENIORS HOUSING MARKET OVERVIEW & VALUATION METHODOLOGY JULY 24, 2019 PREPARED FOR
Transcript of SENIORSHOUSING MARKET OVERVIEW & VALUATION … · SENIORS HOUSING MARKET TRENDS CONSTRUCTION STARTS...

SENIORS HOUSING MARKET OVERVIEW& VALUATION METHODOLOGY
JULY 24, 2019
PREPARED FOR

2 APPRAISAL INSTITUTE | SENIORS HOUSINGCBRE
SENIORS HOUSING VALUATION & ADVISORY SERVICESVAS PLATFORM OVERVIEW
2018Business Activity
Seniors Housing1,800+ Assignments
$30b Valuations
AppraisalsMarket Studies
Litigation SupportDue Diligence Support

INDUSTRY OVERVIEW
MARKET TRENDS
VALUATION METHODOLOGY & RESOURCES

INDUSTRY OVERVIEW

5 APPRAISAL INSTITUTE | SENIORS HOUSINGCBRE
INDUSTRY OVERVIEW INDEPENDENT LIVING COMMUNITY (ILC)

6 APPRAISAL INSTITUTE | SENIORS HOUSINGCBRE
INDUSTRY OVERVIEW ASSISTED LIVING RESIDENCE (ALR)

7 APPRAISAL INSTITUTE | SENIORS HOUSINGCBRE
INDUSTRY OVERVIEW SKILLED NURSING FACILITY (SNF)

8 APPRAISAL INSTITUTE | SENIORS HOUSINGCBRE
INDUSTRY OVERVIEW CONTINUING CARE RETIREMENT COMMUNITY (CCRC/ LPC)

9 APPRAISAL INSTITUTE | SENIORS HOUSINGCBRE
Resident Choice Relative Influence Relative Choice Doctor Choice
INDUSTRY OVERVIEW CONTINUUM OF CARE
Shelter Activities Transport, Laundry
Meals Basic Care Services
ADL Care Services
Specialized MC
Long-Term Chonic Care
55+
AA
IL
AL
MC
NC
Real Estate Component Services Component
Real Estate Component Services Component
Real Estate Component
Real Estate Component Services Component
Real Estate Component Services Component
Real Estate Component Outsourced

10 APPRAISAL INSTITUTE | SENIORS HOUSINGCBRE
INDUSTRY OVERVIEW IMPLIED MARKET VALUES
$0
$500
$1,000
$1,500
$2,000
$2,500
$3,000
$3,500
$4,000
Seniors Housing & Care Hotels Apartments
Billio
ns
Independent Living Assisted Living Nursing Care
Source: ©2019 National Investment Center, NCREIF, & NMHC

11 APPRAISAL INSTITUTE | SENIORS HOUSINGCBRE
INDUSTRY OVERVIEWPROJECTED POPULATION GROWTH
0.0%
2.0%
4.0%
6.0%
8.0%
10.0%
12.0%
14.0%
0
10
20
30
40
50
60
1980A 1990A 2000A 2010A 2017A 2020F 2025F 2030F 2035F 2040F 2045F 2050F 2055F 2060F
% of Total Population
75+
Popu
latio
n (M
illion
s)
Population 75+ % of Total Population
Source: U.S. Census Bureau

12 APPRAISAL INSTITUTE | SENIORS HOUSINGCBRE
INDUSTRY OVERVIEWNATIONAL HEALTH EXPENDITURES
$2,688 $2,795 $2,878$3,029
$3,206$3,358
$3,539$3,746
$3,966$4,197
$4,442$4,700
$4,972$5,255
$5,549
$0
$1,000
$2,000
$3,000
$4,000
$5,000
$6,000
A-2011 A-2012 A-2013 A-2014 A-2015 P-2016 P-2017 P-2018 P-2019 P-2020 P-2021 P-2022 P-2023 P-2024 P-2025
Billio
ns
Source: Centers for Medicare & Medicaid Services

13 APPRAISAL INSTITUTE | SENIORS HOUSINGCBRE
INDUSTRY OVERVIEW RAPIDLY EVOLVING SECTOR

14 APPRAISAL INSTITUTE | SENIORS HOUSINGCBRE
INDUSTRY OVERVIEWINCREASING COMPETITIVE LANDSCAPE

SENIORS HOUSING MARKET TRENDS

16 APPRAISAL INSTITUTE | SENIORS HOUSINGCBRE
SENIORS HOUSING MARKET TRENDSFOUR-QUARTERS ROLLING TRANSACTION VOLUME
$0
$5,000
$10,000
$15,000
$20,000
$25,000
$30,000
1Q2008 1Q2009 1Q2010 1Q2011 1Q2012 1Q2013 1Q2014 1Q2015 1Q2016 1Q2017 1Q2018 1Q2019
Milli
ons
Seniors Housing Nursing Care
Source: ©2019 National Investment Center for Seniors Housing & Care; NIC MAP Q1 2019

17 APPRAISAL INSTITUTE | SENIORS HOUSINGCBRE
SENIORS HOUSING MARKET TRENDSFOUR-QUARTERS ROLLING VALUATION TRENDS
4.0%
4.5%
5.0%
5.5%
6.0%
6.5%
7.0%
7.5%
8.0%
8.5%
9.0%
$20
$40
$60
$80
$100
$120
$140
$160
$180
$200
Q1 2011 Q1 2012 Q1 2013 Q1 2014 Q1 2015 Q1 2016 Q1 2017 Q1 2018 Q1 2019
Cap
italiz
atio
n R
ates
Pric
e Pe
r Uni
t (Th
ousa
nds)
Seniors Housing Pice Per Unit Multifamily Price Per UnitSeniors Housing Cap Rates Multifamily Cap Rates
Source: ©2019 National Investment Center for Seniors Housing & Care, CBRE Research, U.S. Department of the Treasury

18 APPRAISAL INSTITUTE | SENIORS HOUSINGCBRE
SENIORS HOUSING MARKET TRENDSUNLEVERED RETURNS BY ASSET CLASS
0
2
4
6
8
10
12
14
16
One Year Three Years Five Years Ten Year
Unl
ever
ed R
etur
ns (%
)
Seniors Housing NPI Apartment Hotel Industrial Office Retail
Source: NCREIF Property Index Q4 2018

19 APPRAISAL INSTITUTE | SENIORS HOUSINGCBRE
SENIORS HOUSING MARKET TRENDSSENIORS HOUSING POSTS FAVORABLE YOY RETURNS
Source: NCREIF Property Index Q4 2018
-20
-15
-10
-5
0
5
10
15
20
25
2006 2007 2008 2009 2010 2011 2012 2013 2014 2015 2016 2017 2018
Unl
ever
ed R
etur
ns (%
)
Seniors Housing Multifamily

20 APPRAISAL INSTITUTE | SENIORS HOUSINGCBRE
SENIORS HOUSING MARKET TRENDSTIME SERIES RETURNS - SENIORS HOUSING
Source: NCREIF Property Index Q4 2018
-15%
-5%
5%
15%
25%
35%
45%
2005 2006 2007 2008 2009 2010 2011 2012 2013 2014 2015 2016 2017 2018
Income Return Capital Return Total Return

21 APPRAISAL INSTITUTE | SENIORS HOUSINGCBRE
SENIORS HOUSING MARKET TRENDSTIME SERIES RETURNS - APARTMENT
Source: NCREIF Property Index Q4 2018
-30%
-20%
-10%
0%
10%
20%
30%
2005 2006 2007 2008 2009 2010 2011 2012 2013 2014 2015 2016 2017 2018
Income Return Capital Return Total Return

22 APPRAISAL INSTITUTE | SENIORS HOUSINGCBRE
SENIORS HOUSING MARKET TRENDSBUYER COMPOSITION
Source: ©2019 Real Capital Analytics, Inc. ©2019 National Investment Center
25% 26%33%
17% 9%
37% 34%
42%
59%
48%
30% 33%
20% 21%
24%
0%
10%
20%
30%
40%
50%
60%
70%
80%
90%
100%
2016 2017 2018 2019 YTD All CRE
User/ Other Public Private Institutional Cross-Border

23 APPRAISAL INSTITUTE | SENIORS HOUSINGCBRE
SENIORS HOUSING MARKET TRENDSSTABILIZED OCCUPANCY TRENDS
Source: ©2019 National Investment Center for Seniors Housing & Care; NIC MAP Q1 2019
85%
86%
87%
88%
89%
90%
91%
92%
93%
94%
95%
Q1 2008 Q1 2009 Q1 2010 Q1 2011 Q1 2012 Q1 2013 Q1 2014 Q1 2015 Q1 2016 Q1 2017 Q1 2018 Q1 2019
Independent Living Assisted Living Memory Care

24 APPRAISAL INSTITUTE | SENIORS HOUSINGCBRE
SENIORS HOUSING MARKET TRENDSRENT GROWTH TRENDS
0%
1%
1%
2%
2%
3%
3%
4%
4%
Q12009
Q32009
Q12010
Q32010
Q12011
Q32011
Q12012
Q32012
Q12013
Q32013
Q12014
Q32014
Q12015
Q32015
Q12016
Q32016
Q12017
Q32017
Q12018
Q32018
Q12019
% o
f Ren
tal G
row
th
Independent Living Assisted Living Memory Care
Source: ©2019 National Investment Center for Seniors Housing & Care; NIC MAP Q1 2019

25 APPRAISAL INSTITUTE | SENIORS HOUSINGCBRE
SENIORS HOUSING MARKET TRENDSFOUR-QUARTERS ROLLING ABSORPTION TRENDS
0
1,000
2,000
3,000
4,000
5,000
6,000
7,000
8,000
Q12010
Q32010
Q12011
Q32011
Q12012
Q32012
Q12013
Q32013
Q12014
Q32014
Q12015
Q32015
Q12016
Q32016
Q12017
Q32017
Q12018
Q32018
Q12019
# of
Uni
ts A
bsor
bed
Independent Living Assisted Living Memory Care
Source: ©2019 National Investment Center for Seniors Housing & Care; NIC MAP Q4 2018
26 APPRAISAL INSTITUTE | SENIORS HOUSINGCBRE
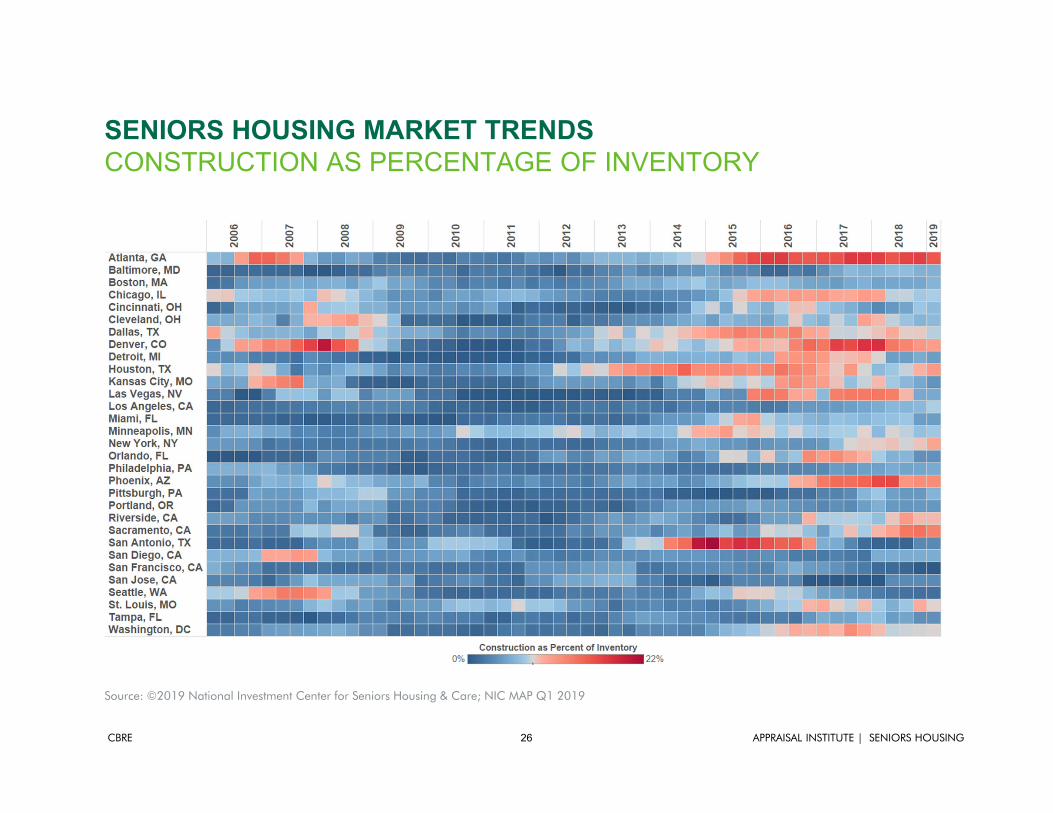
SENIORS HOUSING MARKET TRENDSCONSTRUCTION AS PERCENTAGE OF INVENTORY
Source: ©2019 National Investment Center for Seniors Housing & Care; NIC MAP Q1 2019

27 APPRAISAL INSTITUTE | SENIORS HOUSINGCBRE
SENIORS HOUSING MARKET TRENDSUNITS UNDER CONSTRUCTION
0
5,000
10,000
15,000
20,000
25,000
Q1 2008 Q1 2009 Q1 2010 Q1 2011 Q1 2012 Q1 2013 Q1 2014 Q1 2015 Q1 2016 Q1 2017 Q1 2018 Q1 2019
Independent Living Assisted Living Memory Care
Source: ©2019 National Investment Center for Seniors Housing & Care; NIC MAP Q1 2019

28 APPRAISAL INSTITUTE | SENIORS HOUSINGCBRE
SENIORS HOUSING MARKET TRENDSANNUAL INVENTORY GROWTH SINCE Q4 2015
Source: ©2019 National Investment Center for Seniors Housing & Care; NIC MAP Q4 2018

29 APPRAISAL INSTITUTE | SENIORS HOUSINGCBRE
SENIORS HOUSING MARKET TRENDSCONSTRUCTION STARTS
0
500
1,000
1,500
2,000
2,500
3,000
3,500
Q12015
Q22015
Q32015
Q42015
Q12016
Q22016
Q32016
Q42016
Q12017
Q22017
Q32017
Q42017
Q12018
Q22018
Q32018
Q42018
Q12019
Num
ber o
f Uni
ts
Independent Living Assisted Living Memory Care
Source: ©2019 National Investment Center for Seniors Housing & Care; NIC MAP Q1 2019

30 APPRAISAL INSTITUTE | SENIORS HOUSINGCBRE
SENIORS HOUSING MARKET TRENDSSUPPLY AND DEMAND OUTLOOK
500
1,000
1,500
2,000
2,500
3,000
3,500
0
5,000
10,000
15,000
20,000
25,000
30,000
35,000
2015 2017 2019 2021 2023 2025 2027 2029 2031 2033 2035 2037 2039 2041 2043 2045 2047 2049
Units (Thousands)
(Pop
ulat
ion)
Tho
usan
ds
80+ Population Supply Trend Equilibrium
Supply Shortage
Source: NIC MAP & U.S. Census Bureau
!

31 APPRAISAL INSTITUTE | SENIORS HOUSINGCBRE
TRENDS - OPPORTUNITIES - RESOURCESTOP TRENDS – AFFORDABILITY CRISIS
What does the landscape look like for middle income seniors in 2029 (peak demand is 2045)?
• Number of middle income seniors will double to 14.4 million 60% will have mobility limitations 20% will have high health care and functional needs
• 75–84 ‐ annuitized financial resources of $25,001 to $74,298• 85+ ‐ $24,450 to $95,051• Average monthly rent for assisted living is $4,577, or $50,000 per year,
before care
Over half of middle income seniors will not have adequate finances.
Source: The Forgotten Middle

32 APPRAISAL INSTITUTE | SENIORS HOUSINGCBRE
TRENDS - OPPORTUNITIES - RESOURCESTOP TRENDS – AFFORDABILITY CRISIS
Still Not Convinced?
NIC Investment Guide Reports a total of 874,000 assisted living and memory care units. 1,569,000 if you include independent living.
• 14.4 million Middle Income Seniors• 8.64 million at 60% with mobility needs• 2.88 million at 20% with high health care and functional needs
Total Demand = 2.88m Middle Income SeniorsTotal Supply = 1.80m seniors housing units (trended for supply growth)Net Demand = 1.08m total units
Conclusion = CrisisSource: The Forgotten Middle & NIC MAP Investment Guide 5th Edition

VALUATION METHODOLOGY &
RESOURCES
34 APPRAISAL INSTITUTE | SENIORS HOUSINGCBRE
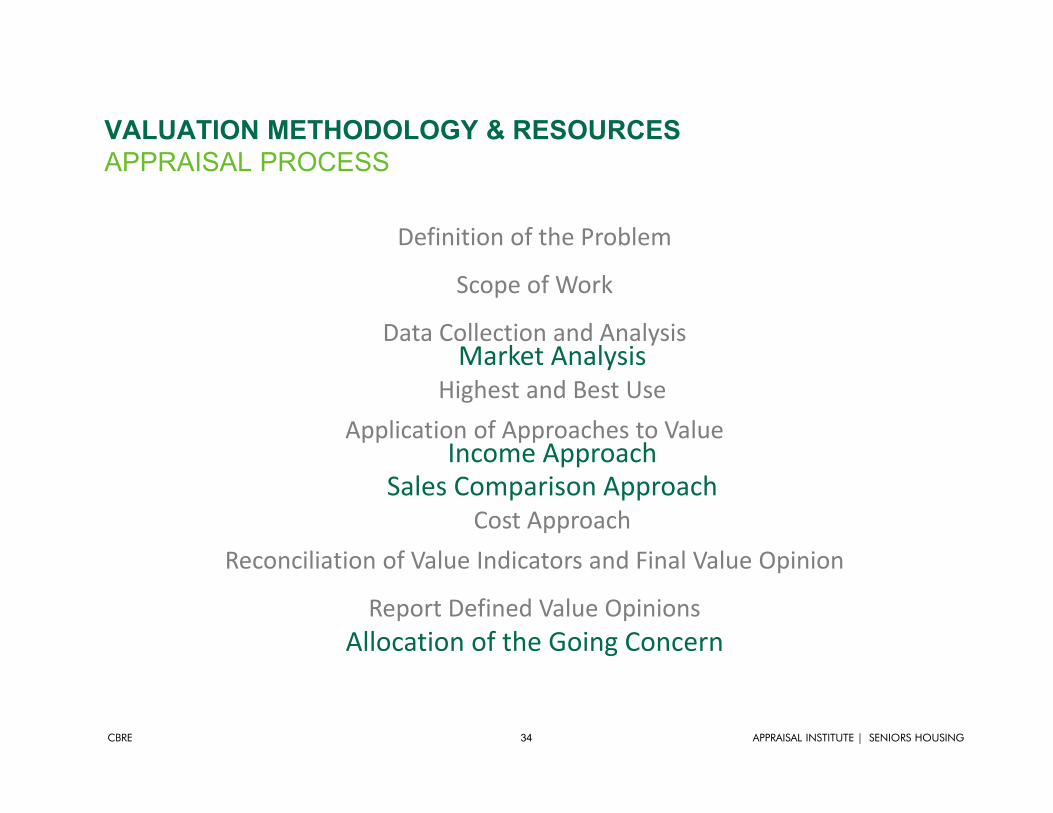
Definition of the Problem
Scope of Work
Data Collection and AnalysisMarket Analysis
Highest and Best UseApplication of Approaches to Value
Income ApproachSales Comparison Approach
Cost ApproachReconciliation of Value Indicators and Final Value Opinion
Report Defined Value OpinionsAllocation of the Going Concern
VALUATION METHODOLOGY & RESOURCESAPPRAISAL PROCESS

35 APPRAISAL INSTITUTE | SENIORS HOUSINGCBRE
A Level “B” or “C” or Fundamental Market Analysis is typically expected.
Defined Primary Market Area – Where 80% of residents lived prior to moving.
Penetration Analysis• Competitive Supply / Age Qualified Households • Simple, yet allows for apples‐to‐apples comparison to other markets• Requires comparable local, regional, and national data‐points• Penetration must be considered with occupancy• Identifies market depth and impact of future supply on market balance
Demand Coverage Analysis• Delineates PMA by age and income qualified population• Recognizes healthcare requirements IADLs and ADLs (utilization factors)• Identifies Net Demand in terms of actual number of units by property type• Identifies impact of state subsidies and +/‐ net immigrations• PMA specific
VALUATION METHODOLOGY & RESOURCESMARKET ANALYSIS

36 APPRAISAL INSTITUTE | SENIORS HOUSINGCBRE
Penetration Rates Alone Have Multiple Meanings:
Low Penetration/ High Occupancy: Local population is accepting the subject’s product type,significant room for expansion. Expect strong occupancy levels, stable rent growth, and healthyabsorption for proposed properties. Most favorable.
Low Penetration/ Low Occupancy: Local population is either not accepting the subject propertytype or are traveling outside the defined PMA due to preference. Market opportunity doesexist, but will likely require additional marketing efforts in order to achieve favorable occupancylevels.
High Penetration/ High Occupancy: Competitive market, yet presumes the local population isgenerally receptive and well educated with the property type. Requires less marketing effortsin terms of product education, but may require more resources from an overall competitivestandpoint or the offering of something unique to the market, such as superior quality oraffordable rents. Prevalence of state subsidies are also common in this market (MA).
High Penetration/ Low Occupancy: Competitive market; this combination is the least favorableand depicts a saturated market. Decreasing rental rates, prevalence of concessions, and lessthan favorable occupancy can be expected.
VALUATION METHODOLOGY & RESOURCESMARKET ANALYSIS

37 APPRAISAL INSTITUTE | SENIORS HOUSINGCBRE
SENIORS HOUSING MARKET STATISTICSCategory Subject's PMA Subject MSA MAP Primary
Assisted Living
Stabilized/Average Occupancy 87.39% 92.20% 90.40%
Average Monthly Rent $4,726 $4,251 $4,304
Property Count 22 54 2,545
Inventory (Units) 1,746 4,686 200,044
Construction (Units) 90 526 10,750
Projected 3-Year Inventory Growth 5.15% 2.40% 2.10%
Penetration 10.30% 5.70% 4.80%
Source: NIC MAP
2014 2019
Assisted Living
Age Qualified Households (75+) 16,949 19,280
Total AL Supply 1,746 1,836
Indicated AL/MC Penetration Rate: 10.30% 9.52%
Compiled by CBRE
MARKET PENETRATION
VALUATION METHODOLOGY & RESOURCESMARKET ANALYSIS

38 APPRAISAL INSTITUTE | SENIORS HOUSINGCBRE
2014 AL
Total Demand 1,181
Frictional Vacancy 12.61%
Total Adjusted Demand 1,352
Total Supply 1,746
Net Surplus Demand (Units) -394
Market Balance Over Supply2019 AL
Total Demand 1,437
Frictional Vacancy 12.61%
Total Adjusted Demand 1,644
Total Supply 1,836
Net Surplus Demand (Units) -192
Market Balance Over Supply
Compiled By: CBRE
DEMAND COVERAGE
VALUATION METHODOLOGY & RESOURCESMARKET ANALYSIS

39 APPRAISAL INSTITUTE | SENIORS HOUSINGCBRE
Income Approach• The underlying operations of the business are what drives overall value
of the real estate. Highly intensive operating model.• Most appraisals will assume experienced and capable management.• Utilized as primary determinant of value.
Sales Comparison Approach• Primarily utilized to extract market pricing and as a test or reasonability
for the conclusions derived from the income approach• Comparable Sales, NOI Analysis, and EGIM Analysis• Comparables are selected from a regional if not national geography
Cost Approach• Least reliable and often omitted• Primarily utilized as a method of allocating the Going Concern or
project feasibility
VALUATION METHODOLOGY & RESOURCESAPPROACH TO VALUE

40 APPRAISAL INSTITUTE | SENIORS HOUSINGCBRE
The income capitalization approach reflects the subject’s income‐producing capabilities.
• The “active management” component is viewed as adding incremental risk and complexity versus the conventional commercial real estate asset classes. Property Management will make or brake market value.
• Market value appraisals involving not‐for‐profit or government, and poor operators should reflect the likely buyers’ perspective, and in most cases, this would be for‐profit entities.
• Proper rental comparables and operating expense comparables are essential in achieving accurate underwriting.
‐ Per resident day is the most accurate unit of measure for underwriting purposes.
‐ % of EGI can have multiple meanings depending on property specific operating format andshould only be used as a secondary test of reasonableness.
• The market derived capitalization rate is applied to the subject’s stabilized EBITA, which includes replacement reserves and management fees.
VALUATION METHODOLOGY & RESOURCESAPPROACH TO VALUE
41 APPRAISAL INSTITUTE | SENIORS HOUSINGCBRE
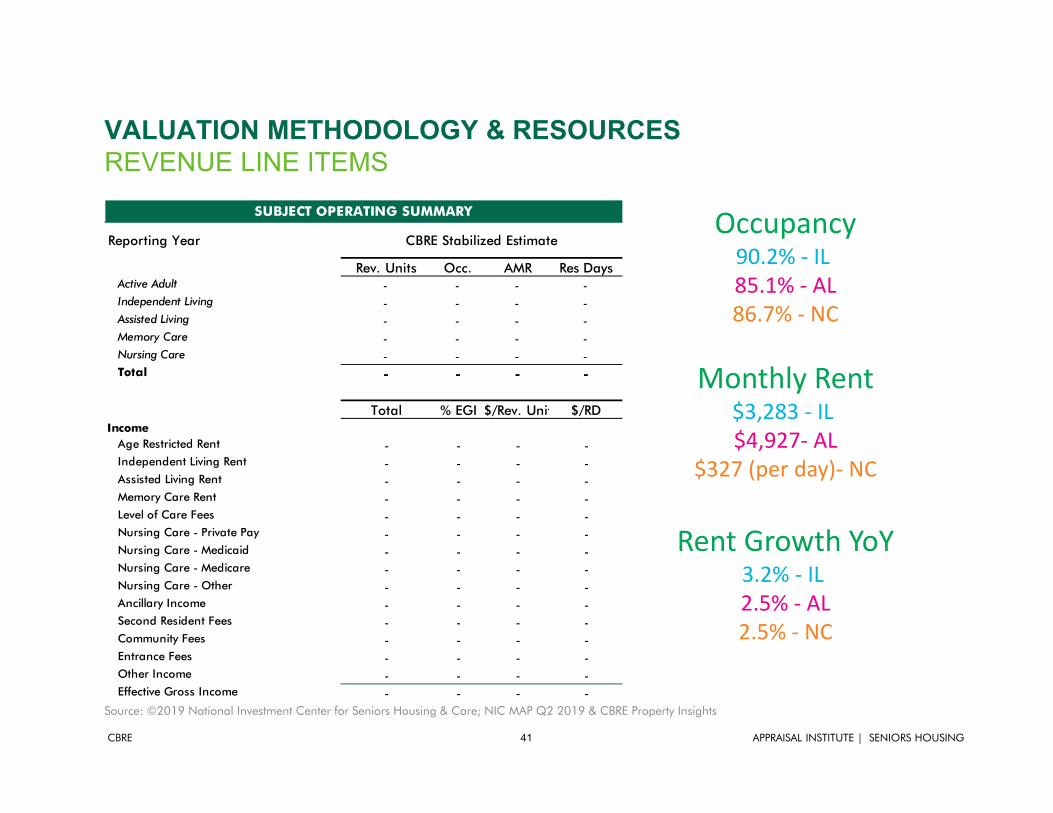
VALUATION METHODOLOGY & RESOURCESREVENUE LINE ITEMS
SUBJECT OPERATING SUMMARY
Reporting Year
Rev. Units Occ. AMR Res DaysActive Adult - - - -Independent Living - - - -Assisted Living - - - -Memory Care - - - -Nursing Care - - - -Total - - - -
Total % EGI $/Rev. Unit $/RDIncome
Age Restricted Rent - - - -Independent Living Rent - - - -Assisted Living Rent - - - -Memory Care Rent - - - -Level of Care Fees - - - -Nursing Care - Private Pay - - - -Nursing Care - Medicaid - - - -Nursing Care - Medicare - - - -Nursing Care - Other - - - -Ancillary Income - - - -Second Resident Fees - - - -Community Fees - - - -Entrance Fees - - - -Other Income - - - -Effective Gross Income - - - -
CBRE Stabilized EstimateOccupancy90.2% ‐ IL 85.1% ‐ AL86.7% ‐ NC
Monthly Rent$3,283 ‐ IL $4,927‐ AL
$327 (per day)‐ NC
Rent Growth YoY3.2% ‐ IL 2.5% ‐ AL2.5% ‐ NC
Source: ©2019 National Investment Center for Seniors Housing & Care; NIC MAP Q2 2019 & CBRE Property Insights

42 APPRAISAL INSTITUTE | SENIORS HOUSINGCBRE
VALUATION METHODOLOGY & RESOURCESOPERATING EXPENSE LINE ITEMS – PROPERTY INSIGHTS
Expenses (Per Resident Day)Lower
Quartile AverageUpper
QuartileLower
Quartile AverageUpper
QuartileLower
Quartile AverageUpper
Quartile Real Estate Tax $3.4 $7.1 $8.7 $3.0 $6.0 $7.4 $1.1 $2.8 $3.4 Property Insurance 1.1 1.7 2.2 1.2 2.0 2.5 1.6 2.9 4.0 Total Utilities 4.2 5.2 6.2 4.0 5.0 6.0 3.7 4.7 5.5 Admin & General 3.0 4.5 5.6 4.0 6.0 7.0 6.0 9.4 10.1 Marketing 1.6 2.3 2.9 1.6 2.5 3.3 0.3 0.7 1.0 Culinary Services 6.6 8.0 9.0 6.8 8.2 9.2 7.2 8.7 9.5 Culinary Food 5.7 6.5 7.5 6.0 6.9 7.8 5.8 6.7 7.6 Culinary Supplies 0.9 1.6 1.6 0.8 1.6 1.5 1.1 2.3 2.0 Laundry & Housekeeping 0.3 0.6 0.7 0.5 0.8 0.9 1.3 2.7 2.9 Resident Care 0.3 2.4 1.5 0.5 3.7 1.5 20.0 33.6 40.7 Maintenance 2.8 3.9 4.7 2.7 3.7 4.5 2.6 3.4 4.0 Programing & Activities 0.6 0.9 1.2 0.5 1.0 1.2 0.3 0.7 0.8Total Payroll, Taxes & Benefits 20.3 36.4 49.7 38.7 54.7 63.3 91.2 108.9 114.8 Admin Payroll 4.6 6.1 7.2 5.4 7.1 8.0 7.3 9.5 10.4 Marketing Payroll 1.5 2.3 2.8 1.5 2.3 3.0 1.0 2.3 2.5 Culinary Payroll 6.5 8.3 9.7 6.0 8.2 10.0 6.5 8.1 8.8 Laundry & Housekeeping Payroll 1.9 2.6 3.0 1.7 2.6 2.9 5.0 5.6 6.4 Resident Care Payroll 12.8 20.2 25.5 17.2 27.4 31.5 59.0 73.1 80.0 Maintenance Payroll 1.4 1.9 2.3 1.4 1.9 2.3 1.5 2.0 2.5 Programing Payroll 1.3 2.1 2.7 1.5 2.4 3.0 2.6 3.8 4.9 Payroll Taxes 2.0 3.5 4.6 3.4 5.1 6.2 6.9 8.3 9.0 Employee Benefits 2.0 4.2 5.5 3.0 5.5 7.0 5.0 9.4 11.6 Other 0.3 2.8 2.8 0.3 12.4 1.3 0.1 1.2 0.6Operating Expenses $53.1 $75.5 $89.6 $73.3 $99.5 $111.9 $163.8 $198.2 $215.0
Net Operating Income $39 $58 $73 $40 $62 $75 $39 $50 $57Management Fee 4.7 6.5 7.9 5.8 8.0 9.2 10.2 12.3 13.4Reserves for Replacement 1.0 1.2 1.1 1.0 1.1 1.1 1.1 1.2 1.2
Adjusted Operating Expenses $58.5 $82.9 $98.0 $79.9 $107.8 $121.8 $175.1 $211.7 $229.4
Adjusted Net Operating Income $33.0 $50.8 $64.2 $32.9 $52.6 $64.3 $26.0 $36.8 $43.4
Independent Living Assisted Living Skilled Nursing

43 APPRAISAL INSTITUTE | SENIORS HOUSINGCBRE
Sales Comparison Regional/ national comp set is
acceptable
Adjustments are mostly qualitative and challenging to support
Not utilized by market participants
Do not overlay NOI adjustments
NOI Analysis Provides most realistic pricing utilized
by market participants
Infers all physical property and locational differences
Utilizes regression analysis to estimate a per unit/ bed indication
EGIM Analysis Easy to extract from market
Does not include operating expenses in pricing
Select EGIM for subject by analyzing expense ratio of subject respective of comparable set
VALUATION METHODOLOGY & RESOURCESAPPROACH TO VALUE

44 APPRAISAL INSTITUTE | SENIORS HOUSINGCBRE
NET OPERATING INCOME ANALYSIS
Compiled by CBRE
$396,517.13
$215,205
$265,205
$315,205
$365,205
$415,205
$465,205
$15,327 $20,327 $25,327 $30,327
Pri
ce p
er
Unit
NOI per Unit
Comparable Sales
Subject Indication
Trendline
VALUATION METHODOLOGY & RESOURCESAPPROACH TO VALUE

45 APPRAISAL INSTITUTE | SENIORS HOUSINGCBRE
Cost Residual: The value of the business is estimated by taking the market valueof the subject and deducting the estimated personal property, land and realestate values. The remaining value represents the contribution of the business.
• Straight forward approach and widely accepted in the appraisal industry• Utilizes estimates contained in the Cost Approach which is considered the less reliable indication of value and often omitted
• Not utilized by market participant
Management Extraction: Business Value is calculated based upon the capitalizedvalue of the management fee. The concluded business value and FF&E arededucted to get to the real estate only allocation.
• Additional BEV is inherent in the operations• Capitalization rates applied to the Management Fee are difficult to accurately extract from the market with the applied rate considered to be highly subjective
• Not utilized by market participants
VALUATION METHODOLOGY & RESOURCESALLOCATION OF THE GOING CONCERN

46 APPRAISAL INSTITUTE | SENIORS HOUSINGCBRE
Lease Coverage Analysis: A market derived lease coverage ratio is applied to theconcluded net operating income. The result is an indicated market lease payment forthe subject, or real estate only cash flow. A net lease cap rate is applied to theestimated lease payment in order to obtain the value attributed to the real estate only.
• Lease Coverage Ratios and Net Lease Cap Rates are easily and accurately extracted from the market.
• Only arm’s length leases should be utilized.
• Know where FF&E fits. Part of Lease or owned separately by tenant
• Market lease coverage ratios will range from 1.10 to 1.30 for IL and AL, and 1.50 to 2.00 for SNFs.
• Net lease cap rates typically fall 200 to 300 bps below a going concern cap rate.
• Higher the coverage, higher the spread (lower risk).
• Utilized by market participants.
VALUATION METHODOLOGY & RESOURCESALLOCATION OF THE GOING CONCERN

47 APPRAISAL INSTITUTE | SENIORS HOUSINGCBRE
VALUATION METHODOLOGY & RESOURCESALLOCATION OF THE GOING CONCERN
As Is
February 20, 2019
Concluded Stabilized NOI $3,146,480
Divided Lease Coverage Ratio 1.30
Cash Flow to the Real Estate $2,420,369
Real Estate Only Cap Rate 8.00%
Indicated Real Estate Value $30,254,616
Market Value of the Going Concern $33,900,000
FF&E $1,177,500
Indicated Real Estate Value $30,254,616
Indicated Business Value $2,467,884
Compiled by CBRE
LEASE COVERAGE ANALYSIS

48 APPRAISAL INSTITUTE | SENIORS HOUSINGCBRE
VALUATION METHODOLOGY & RESOURCESCBRE PROPERTY INSIGHTS - VALUATION INDEX
Source: Source: CBRE Econometric Advisors, Seniors Housing Property Insights
I n vest men t Cla ss A Lower Decile Lower Quartile Average Upper Quartile Upper DecileIndependent LivingCapitalization Rate 5.7% 6.0% 6.6% 7.0% 7.0%Expense Ratio 41.9% 49.3% 52.0% 62.0% 65.0%Net Operating Income/Rev. per Unit $12,467 $18,868 $22,873 $27,029 $33,442Market Valuation/ Rev. per Unit $129,011 $245,833 $324,902 $374,150 $484,110Assisted Living & Memory CareCapitalization Rate 5.9% 6.0% 6.9% 7.0% 7.0%Expense Ratio 56.0% 60.0% 60.8% 64.0% 71.0%Net Operating Income/Rev. per Unit $18,525 $21,082 $26,428 $28,031 $36,922Market Valuation/ Rev. per Unit $210,462 $262,832 $344,784 $381,132 $492,013
I n vest men t Cla ss B/ C Lower Decile Lower Quartile Average Upper Quartile Upper DecileIndependent LivingCapitalization Rate 6.2% 6.8% 7.2% 7.0% 8.3%Expense Ratio 41.3% 59.0% 59.4% 60.3% 66.7%Net Operating Income/Rev. per Unit $6,353 $8,668 $13,258 $17,099 $21,430Market Valuation/ Rev. per Unit $61,667 $106,803 $163,973 $218,022 $269,465Assisted Living & Memory CareCapitalization Rate 6.5% 7.0% 8.2% 9.0% 10.0%Expense Ratio 61.0% 62.7% 63.0% 72.0% 75.0%Net Operating Income/Rev. per Unit $7,682 $10,416 $16,647 $20,854 $25,685Market Valuation/ Rev. per Unit $62,500 $98,684 $181,502 $235,368 $309,098
49 APPRAISAL INSTITUTE | SENIORS HOUSINGCBRE
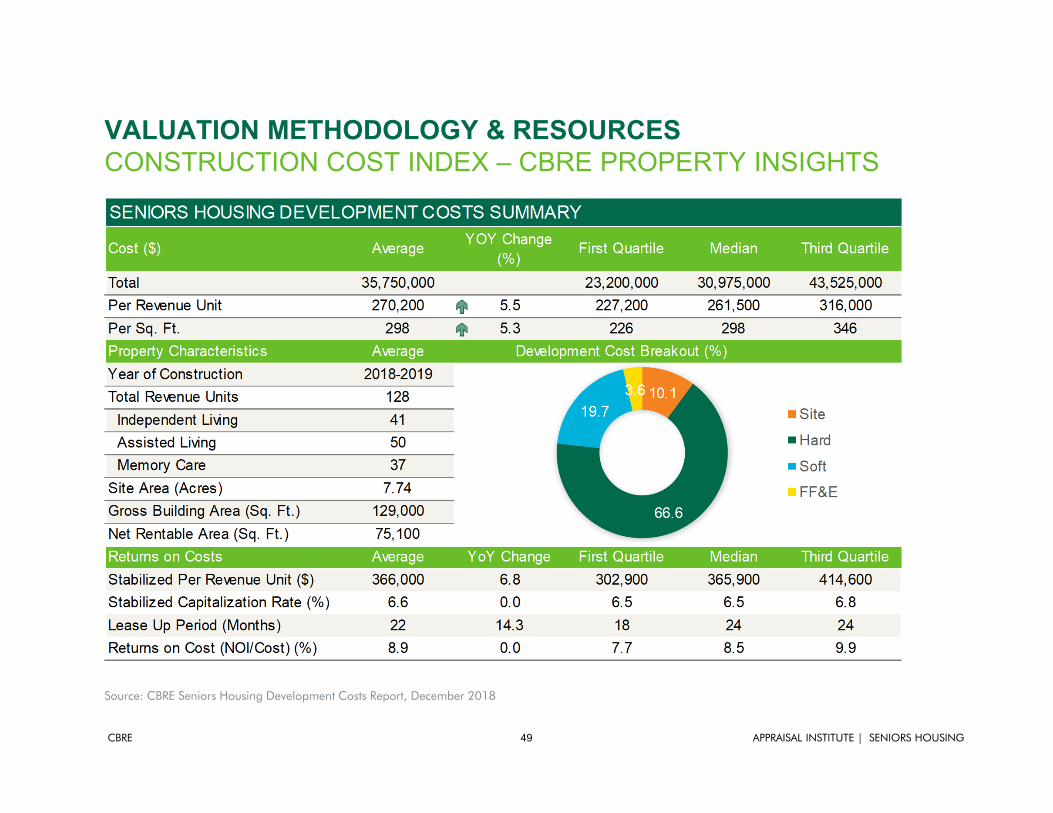
VALUATION METHODOLOGY & RESOURCESCONSTRUCTION COST INDEX – CBRE PROPERTY INSIGHTS
Source: CBRE Seniors Housing Development Costs Report, December 2018

50 APPRAISAL INSTITUTE | SENIORS HOUSINGCBRE
A - B Ch a n g e B - C Ch a n g e A - C Ch a n g e A Ch a n g e B Ch a n g e C Ch a n g eIndependent Living 102 -1 131 3 232 2 Independent Living 113 2 81 -6 75 -5Assisted Living 97 -1 138 6 236 5 Assisted Living 75 9 55 -1 42 -2Memory Care 77 -14 122 11 200 -3 Memory Care 45 -8 33 1 23 -12Nursing Care 96 10 137 1 233 12 Nursing Care 78 12 56 6 65 19CCRC/LPC 72 -15 134 -2 206 -17 CCRC 65 7 60 2 47 13
Independent Living 70 -10 125 4 195 -6Assisted Living 78 -10 125 4 203 -6Memory Care 65 -6 112 -2 177 -8Nursing Care 73 4 146 14 219 18CCRC/LPC 66 -20 121 9 187 -11
Core
Non-
Core
L oca t ion Sp r ea d s - Cor e v s. N on -Cor e (b p s)I n vest men t Cla ss Sp r ea d s (b p s)
VALUATION METHODOLOGY & RESOURCESSENIORS HOUSING INVESTOR SURVEY – CAP RATES
Source: CBRE Spring 2019 Investor Survey
L ow (%) H ig h (%) Avg . (%)Ch a n g e (b p s) L ow (%) H ig h (%) Avg . (%)
Ch a n g e (b p s) L ow (%) H ig h (%) Avg . (%)
Ch a n g e (b p s)
Independent Living 4.0 8.0 5.4 -5 5.0 8.0 6.4 -7 6.0 10.0 7.7 -4Assisted Living 5.0 8.0 6.1 -7 6.0 9.5 7.1 -8 6.0 10.5 8.5 -2Memory Care 5.0 9.5 7.0 11 6.0 9.5 7.7 -3 7.0 11.0 9.0 8Nursing Care 9.0 14.0 11.3 -12 9.5 14.5 12.2 -1 12.0 15.0 13.6 0CCRC/LPC 6.0 10.0 7.3 9 6.0 10.5 8.0 -7 7.0 12.0 9.3 -9
Independent Living 5.0 9.0 6.5 -3 6.0 10.0 7.2 -13 7.0 11.0 8.5 -9Assisted Living 5.5 9.0 6.9 2 6.0 10.0 7.6 -9 7.0 11.0 8.9 -4Memory Care 6.0 10.0 7.4 3 7.0 11.0 8.1 -3 8.0 11.0 9.2 -5Nursing Care 10.0 14.0 12.1 1 11.0 16.0 12.8 5 13.0 16.0 14.3 19CCRC/LPC 6.0 10.0 7.9 15 7.0 11.0 8.6 -5 8.0 12.0 9.8 4
Core
Non-
Core
C la ss B Cla ss CCla ss A
51 APPRAISAL INSTITUTE | SENIORS HOUSINGCBRE
• Understand the property specific operations and local market attributes; understand where yourproperty fits in the market; current property trend lines may not be telling the whole story. There isno one size fits all.
• Have boots on the ground and take the time to speak with the competition. The most sophisticatedanalysis is useless of your inputs are not accurate, well researched, and properly understood.
• The appraisal report should identify the assets being valued and distinguish the assets not beingvalued. This should reflect actions taken by market participants.
• Multiple entities often control the total assets of the business. Ownership structure must be fullyunderstood in order to reflect value appropriate cash flows.
• Market value appraisals involving not‐for‐profit entities or governmental entities should reflect thelikely buyers’ perspective, and in most cases, that would be from the perspective of for‐profitentities, which may take a different view of future operations.
• Comparable sales should be verified directly with source. Purchase price reported on deeds rarelyreflect the total consideration with only the allocated real estate value being reported.
VALUATION METHODOLOGY & RESOURCESFINAL CONSIDERATIONS

52 APPRAISAL INSTITUTE | SENIORS HOUSINGCBRE
• Only the sub‐property type should be utilized for comparable purposes. Ie: don’t use independentliving sales to compare to memory care. This is even more critical SNF to assisted and independentliving sales, and applies to all comparable purposes (sales, operations, rents, etc).
• Standard commercial adjustments do not always apply and may in‐fact be counterintuitive to whatwe are taught as general commercial appraisers. Ie: size adjustments, expense ratios as an indicationof market operations.
• Market participants do not contemplate the value by adding the value of the real estate to theseparate values of the tangible and intangible personal property; they focus on the overall valuewhich is derived by their expectations of cash flow and applied return requirement. In place cashflow is considered, but often adjusted by the buyer for pricing purposes. The magnitude of theadjustment will be reflected in the capital market assumptions.
=
VALUATION METHODOLOGY & RESOURCESFINAL CONSIDERATIONS

53 APPRAISAL INSTITUTE | SENIORS HOUSINGCBRE
• NIC (National Investment Center for the Seniors Housing &Care Industry)
• ASHA (American Seniors Housing Assoc.)
• Irving Levin & Assoc.
‐ SeniorCare Investor
‐ Senior Housing News
‐ Annual SeniorCare Investor Report
• CBRE Seniors Housing | Valuation & Advisory Services
‐ Bi‐annual Cap Rate Survey & Market Outlook
‐ Annual Construction Cost Report
‐ Seniors Housing Property Insights
‐ Please take full advantage of our platform
VALUATION METHODOLOGY & RESOURCESRESOURCES

Zach Bowyer, MAISenior Managing DirectorValuation & Advisory ServicesHealthcare Practice Leader+1 617 512 [email protected]
THANK YOU
JULY 24, 2019