Q1 2015 US Commercial Real Estate Market Overview
50
Q1 CRE Market Real Estate Research Powered by MaximusiQ Peter Muoio, Ph.D. January 2015
-
Upload
auctioncom -
Category
Real Estate
-
view
916 -
download
2
Transcript of Q1 2015 US Commercial Real Estate Market Overview

Q1 CRE Market Real Estate Research Powered by MaximusiQ
Peter Muoio, Ph.D. January 2015

Macro Overview: Economic Recovery Healthy
2
Sustained Gains in Key Economic Indicators
GDP Growth Has Been Robust and Well Balanced
Employment Growth Was Consistently Strong Throughout 2014 and Started 2015 With a Bang
Sources: BEA, BLS, Auction.com

Labor Market Stabilizing
3
Labor Market Conditions Improving: Quits are on the Rise, Participation Rate Decline Has Petered Out and Wages are Finally Increasing
Labor Force Participation Finally Looking Like it May Be Stabilizing
Rising Quits Another Sign of Improving Labor Market Conditions
Sources: BLS, Auction.com

Uncertainty Back to Normal Levels
4
Stronger Economic Momentum a Dividend of Lower Uncertainty
Sources: Steven Davis, Scott Baker and Nicholas Bloom, Auction.com
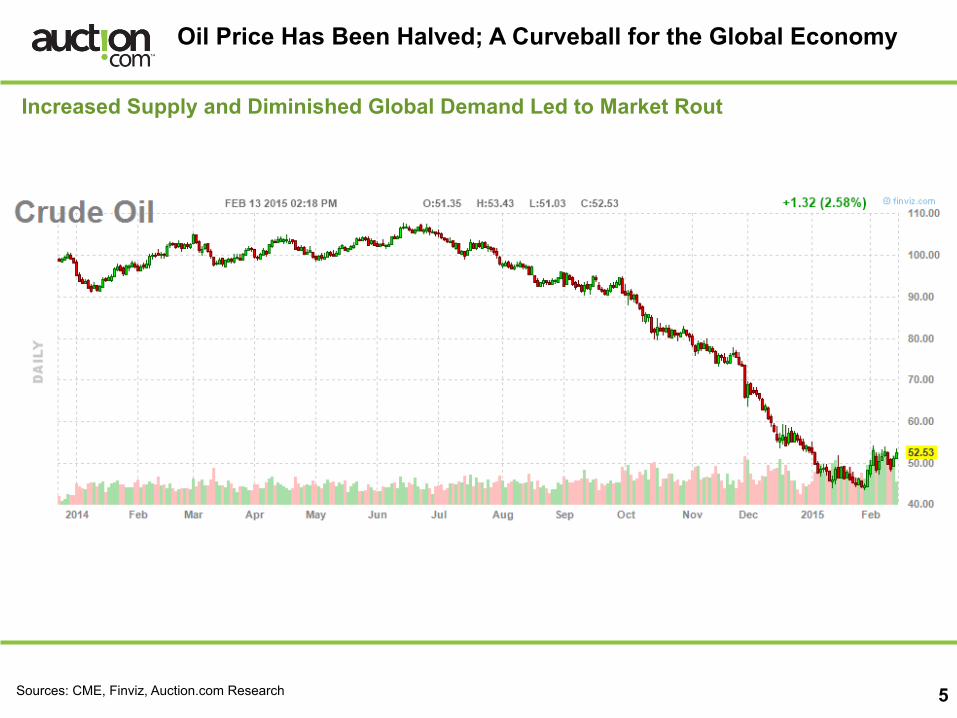
Oil Price Has Been Halved; A Curveball for the Global Economy
5
Increased Supply and Diminished Global Demand Led to Market Rout
Sources: CME, Finviz, Auction.com Research

Low Oil Effect Has Started Trickling Down
6
Lower Oil Prices Have Already Begun Slowing Oil-Related Activities
Oil and Gas Extraction Employment Stalled in January, Will Likely Turn South Soon
Sources: BLS, Baker-Hughes, Auction.com Research
Oil Rig Count Declining, Garnering a Lot of Negative Attention

Texas (and other Energy Producer) Economies and Demographics Very Sensitive to Oil Prices
7
After Diversifying in 1990s, Texas Has Become More Dependent on Oil Again
Population Growth Swung from 1.8% Increase in 1986 to 0.3% Gain in 1988
Sources: BLS, CRB, Auction.com Research
After 1986 Oil Bust, TX Employment Shifted from About 3% Annual Growth to a 2% Decline and Then
Remained Flat

While Much Attention Focusing on Negative Impact to Energy Producers, Lower Oil Has a Positive Multiplier Effect on GDP
8
» GDP gets a boost from consumer and lower imports, mitigated by slowdown in enlarged energy segment.
» Boost increases over time should oil remain low. » Estimates point to 15-25% reduction in capital spending by oil sector. » Estimates of roughly $125-$150 billion effective tax cut to consumers. » Oil and Gas only created 280,000 direct jobs over last four years, a paltry total (for comparison, US
added 257,000 jobs in January alone).
Sources: IHS, Auction.com Research
2015 2016 2017 2018GDP multiplier 0.002 0.005 0.005 0.003Oil price decline/10$ bbl 4.3 4.3 4.3 4.3Baseline Growth Forecast 2.58% 2.76% 2.50% 3.70%
Oil Adjusted Growth Forecast 3.44% 4.91% 4.65% 4.99%
Estimated Updated Energy Multiplier2015 2016 2017 2018
GDP multiplier 0.0015 0.0035 0.0035 0.0020Oil price decline/10$ bbl 4.3 4.3 4.3 4.3Baseline Growth Forecast 2.58% 2.76% 2.50% 3.70%
Oil Adjusted Growth Forecast 3.22% 4.27% 4.01% 4.56%

Potential Financial Market Volatility from Oil Price Drop
9
» Biggest risk to overall US economy from oil is through financial markets » High-Yield Bond Market has highest exposure to energy sector in history » Energy Bond spreads have exploded wider » There will be defaults and consolidation within industry » Commodity Currencies getting hammered, risk of LTCM event or sovereign default rising » All contagion scenarios very unlikely due to low interest rates
Sources: JP Morgan, Reuters, Barclays, Auction.com Research

Consumer Confidence Improving and Retail Spending Healthy
10
Consumer Attitudes and Spending Emerging from Depths of Great Recession and Financial Crisis
Consumer Confidence Back to Healthy Historical Range
Recent Slip in Non-Auto Retail Sales Primarily from Lower Gasoline Prices – A Positive
Sources: Conference Board, Census, Auction.com Research

Business Indicators Strong
11
Underlying Industrial Demand Drivers Have Bounced Back
Trade Surprisingly Strong Given Weakness in Key Global Economies
New Capital Goods Orders High Despite Speed Bumps
Sources: Census, Federal Reserve, Auction.com Research
Industrial Production Is at a New Cyclical High
Government Drag on the Economy Resumed in the Fourth Quarter
12
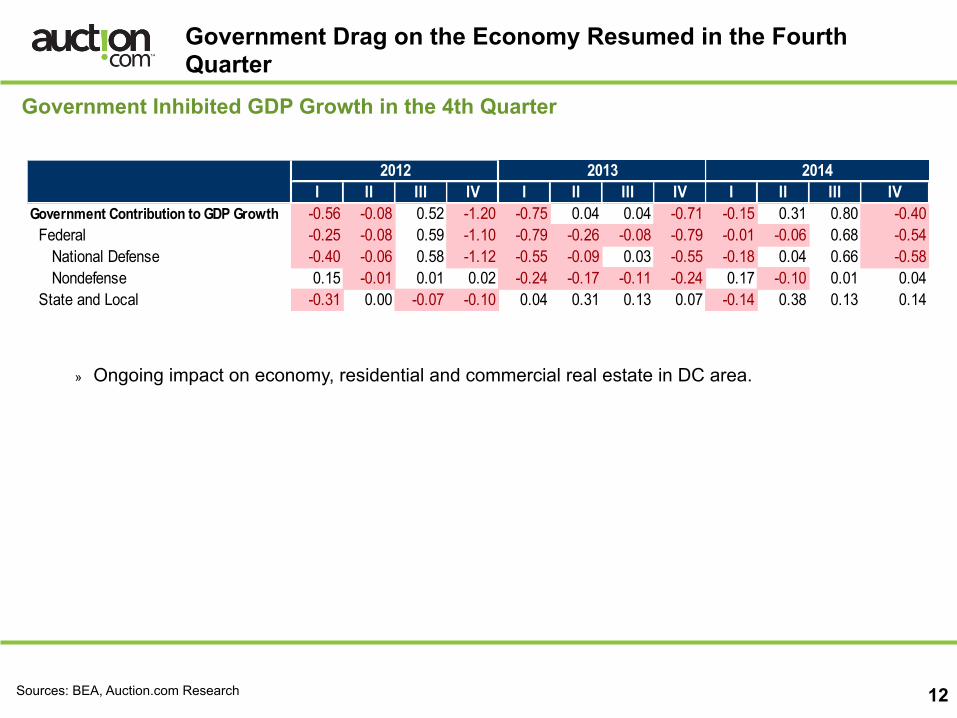
Government Inhibited GDP Growth in the 4th Quarter
Sources: BEA, Auction.com Research
I II III IV I II III IV I II III IVGovernment Contribution to GDP Growth -0.56 -0.08 0.52 -1.20 -0.75 0.04 0.04 -0.71 -0.15 0.31 0.80 -0.40 Federal -0.25 -0.08 0.59 -1.10 -0.79 -0.26 -0.08 -0.79 -0.01 -0.06 0.68 -0.54 National Defense -0.40 -0.06 0.58 -1.12 -0.55 -0.09 0.03 -0.55 -0.18 0.04 0.66 -0.58 Nondefense 0.15 -0.01 0.01 0.02 -0.24 -0.17 -0.11 -0.24 0.17 -0.10 0.01 0.04 State and Local -0.31 0.00 -0.07 -0.10 0.04 0.31 0.13 0.07 -0.14 0.38 0.13 0.14
20142012
2013
» Ongoing impact on economy, residential and commercial real estate in DC area.

Risks to Watch
13
Keep an eye on:
Sources: Auction.com
» Europe, China and Japan all decelerating
» Geopolitical risks intense: Syria/Iraq; Ukraine/Russia; Iran; Argentina/Venezuela
» Uncertain impact of plunging oil, on both geopolitics and financial markets

Capital Markets Overview

Real Estate Capital Markets Have Recovered Nicely from Financial Crisis
15
CRE Deal Volume at Healthy Level
» Deal volume is ahead of last year and back to pre-boom normal level. » More than $480 billion was transacted in 2014 across all asset classes, a 17% jump from 2013.
Deal Volume Topped $90 Billion Throughout 2014
Sources: RCA, Auction.com Research

Major and Non-Major Market All-Property Price Indices on the Rise
16
Dovetailing with Increased Deal Volume, Commercial Property Prices Are Increasing As Well
» Major market pricing has surpassed its pre-recession level, and the gap between major and non-major has expanded.
» Non-major price growth is decelerating, measuring 12.2% year-over-year most recently. » The broader all-property price index hit 185.24 by yearend 2014, surpassing it’s 2008 pre-recession
level.
The Moody’s/RCA All-Property Major vs. Non-Major Market Price Index
Sources: Moody’s, RCA, Auction.com Research
0 20 40 60 80 100 120 140 160 180 200 220 240 260
Dec'00
Ap
r'01
Aug'01
Dec'01
Ap
r'02
Aug'02
Dec'02
Ap
r'03
Aug'03
Dec'03
Ap
r'04
Aug'04
Dec'04
Ap
r'05
Aug'05
Dec'05
Ap
r'06
Aug'06
Dec'06
Ap
r'07
Aug'07
Dec'07
Ap
r'08
Aug'08
Dec'08
Ap
r'09
Aug'09
Dec'09
Ap
r'10
Aug'10
Dec'10
Ap
r'11
Aug'11
Dec'11
Ap
r'12
Aug'12
Dec'12
Ap
r'13
Aug'13
Dec'13
Ap
r'14
Aug'14
Dec'14
Moo
dy's/RCA
All Segm
ent P
rope
rty Va
lue
Inde
x, 12/2000=100
Major Markets Non-‐Major Markets

Apartment Segment

Apartment Segment Overview
18
» Demand drivers good: household formations strong and homeownership still declining.
» Development picking up but not at alarming level; construction varies significantly market-to-market, with low vacancy/high demand markets generally seeing most new development.
» Starts also vary significantly within metro markets.
» Cap rate spreads still wide but down from highs, making them more vulnerable to increasing interest rates.
» Moderate appreciation potential, very market-specific; healthy income growth.
» Transaction volume very strong, back to pre-recession level.

Residential Demand Dynamics Strong
19
Homeownership Continues to Decline; Household Formations at Healthy Rate
» Household formations are key to demand for both apartment and 1-family: stronger economy and stronger household formation rate drives demand for both residential segments.
» Stronger job growth, healthier labor market and improved confidence keys to sustained household formations.
Homeownership Still Falling Healthy Household Formation Rate Drives Residential Demand
Sources: Census, Auction.com Research

Apartment Fundamentals Very Healthy
20
Vacancies Have Fallen to Very Low Level, Generating Solid Rent Growth
Vacancies Sitting Near 4%
Apartment Effective Rent Growth Strong
Sources: Reis, Auction.com Research

Millennials: An Untapped Reservoir of Apartment Demand
21
Generation Y Numbers Over 85 Million People, Many of Whom Are Struggling to Get Jobs
Generation Y Comprises More Than 25% of Total US Population, More Than Baby Boomers…
…Young Adult Jobless Rate Remains High but Making Significant Headway
Sources: Census, BLS, Auction.com Research

Millennials Still Living at Home Represents Pent-Up Apartment Demand
22
This Cohort Has Faced Significant Headwinds
» Millennials will have a massive impact on the residential market, numbering about as large as the baby boom.
» High student debt load remains a key uncertainty in young adult household formations and will inhibit single-family demand.
» Urban focus may change ownership/rental and suburban/urban housing demand mix.
Student Loan Obligations Are Soaring, Inhibiting Ability to Form Independent Households…
…Contributing to the Nearly One-Third of 18-34 Year Olds Living With Their Parents
Sources: : National Vital Statistics Report, BLS, Auction.com Research

New Development Cycle Underway but Oversupply Is Not an Issue at this Time
23
Multifamily Starts Up from Modern Record Low but Not at Overbuilding Level
Multifamily Starts Up, Portending Future Supply
Multifamily Starts Likely to Continue Increasing in Near Term Amid Low Vacancies and High and Rising Rents
Sources: Census, Auction.com Research forecasts

Apartment Vacancies Low but Stabilizing as Supply Picks Up
24
Apartment Segment Is a Standout
Apartment Vacancies Will Remain Stable in Low-4% Range Through 2018
US Apartment Rents Will Continue to Rise As Vacancies Sit at Low Level
Sources: Reis, Auction.com forecasts
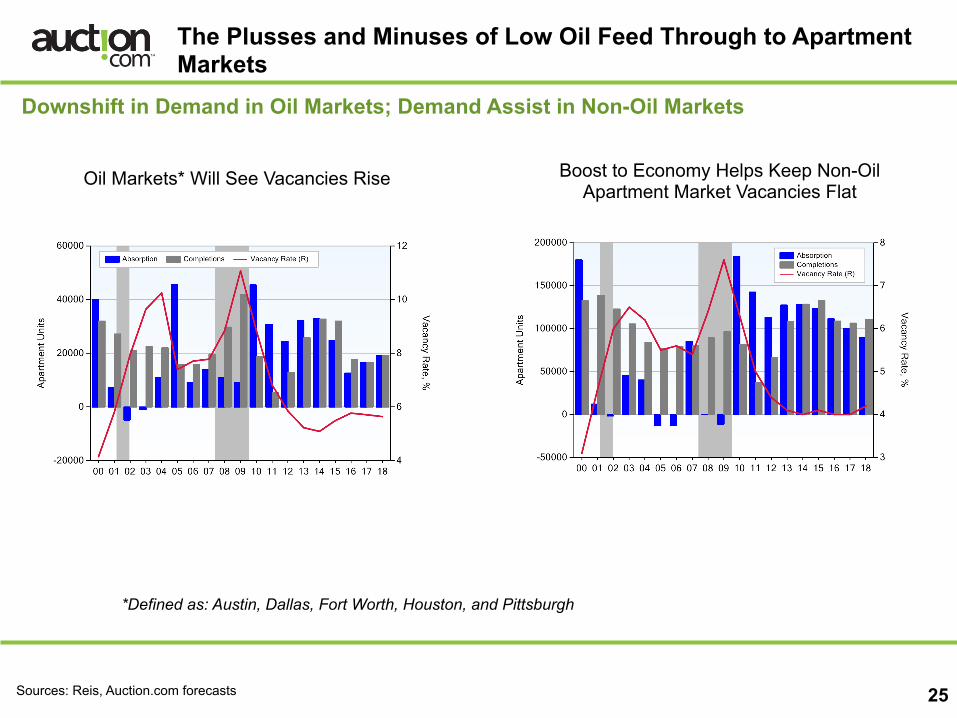
The Plusses and Minuses of Low Oil Feed Through to Apartment Markets
25
Downshift in Demand in Oil Markets; Demand Assist in Non-Oil Markets
Oil Markets* Will See Vacancies Rise
Boost to Economy Helps Keep Non-Oil Apartment Market Vacancies Flat
Sources: Reis, Auction.com forecasts
*Defined as: Austin, Dallas, Fort Worth, Houston, and Pittsburgh

Office Segment

Office Segment Overview
27
» Still early stage of recovery with limited vacancy and rent improvement so far.
» Cyclical economic acceleration should increase demand.
» Nationally, shadow inventory has been worked off so continued office employment growth will spark more leasing.
» Significant bifurcation between major CBDs and Suburban markets.
» Limited supply on horizon; development generally only in strongest markets.
» Space per worker is shrinking, muting the impact of cyclical recovery.
» Cap rate spreads high, providing buffer to rising interest rates.
» Good valuation growth potential from increasing NOI and compressing cap rates.
» Transaction volume at healthy level but still below boom pace, making stronger gains recently.
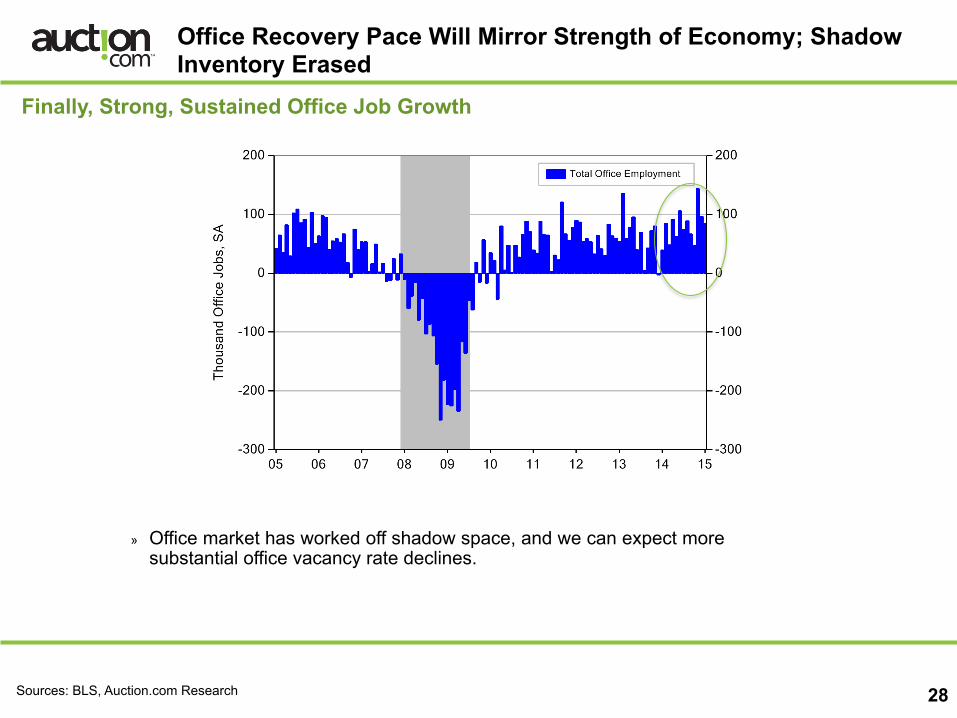
Office Recovery Pace Will Mirror Strength of Economy; Shadow Inventory Erased
28
Finally, Strong, Sustained Office Job Growth
» Office market has worked off shadow space, and we can expect more substantial office vacancy rate declines.
Sources: BLS, Auction.com Research

Office Space per Worker Declining
29
Technological Advances Reducing Space Needs per Employee, Muting Cyclical Tailwind
Sources: BLS, Reis, Auction.com Research

Office Recovery Has Been Tepid: Vacancies Mostly Flat in 2014
30
Vacancies Modestly Off Peak; Rent Growth Inching Up; Some Recent Improved Demand Momentum
Office Vacancies Just 90 bps Off Their Peak…. …Rent Growth Picking Up
Sources: Reis, Auction.com Research

Office Recovery Will Pick Up Steam with the Economy
31
Vacancies Have Peaked and Rents Have Troughed; Stage Set for Stronger Recovery
Office Recovery Should Start to Accelerate
Office Rents Will Grow Slowly Until Demand Picks Up and Brings Vacancies Down More Rapidly
Sources: Reis, Auction.com Research forecasts

Plusses and Minuses of Low Oil on Office Markets
32
Houston Is 4th Largest Office Market in US; Vacancies Set to Rise After Healthy Drop
Downshift in Demand and In-Place Construction Pipeline Push Oil Market* Vacancies Up
Non-Oil Market Office Demand Gets Boost from Stronger Economy
Sources: Reis, Auction.com Research forecasts
*Defined as: Austin, Dallas, Fort Worth, Houston, and Pittsburgh

Retail Segment

Retail Segment Overview
34
» Very limited recovery so far.
» Cyclical economic acceleration should help demand however bricks and mortar retail faces huge headwinds from e-retail.
» E-retail impact felt through disappearance of store types AND shrinking of space.
» Retail also inhibited by far lower housing market support than in previous cycles.
» Supply basically non-existent over next several years so any pick-up in demand will have strong impact on vacancies, though rent growth likely to be restrained.
» Cap rate spreads high but narrowed over past year, despite muddy fundamentals outlook.
» Valuations will be driven by occupancy improvement, modest rent growth and further cap rate compression, but improvement will be modest. Pricing has grown quickly over the past year, perhaps too far ahead of fundamentals.

Retail Segment Is Drifting
35
Limited Momentum
Retail Vacancies Remain Elevated Above 10%
Retail Effective Rents Creeping Up
Sources: Reis, Auction.com Research

Retail Recovery Also Awaits Stronger Macro Growth but Will Continue to Face Headwinds
36
Vacancies Will Decline Swiftly Once Demand Accelerates but Remain Above Previous Cycle Level
» Brick & mortar retail remains under intense pressure from e-retail. » Impact comes in form of store closings and changed footprint of stores.
Absence of Development Will Assist the Retail Recovery but Economy Must Cooperate
Rents Will Be Slow to Recover Amid High Availability
Sources: Reis, Auction.com Research forecasts

Plusses and Minuses of Low Oil on Retail Markets
37
More Difficult Road to Recovery for Oil Retail Markets; Boost to Consumer Gives Added Life to Retail Demand in Non-Oil Markets
Retail Recovery in Oil Markets* Looks to Nearly Stall
Multiplier Effect of Low Oil Increases Retail Demand in Non-Oil Markets
Sources: Reis, Auction.com Research forecasts
*Defined as: Austin, Dallas, Fort Worth, Houston, and Pittsburgh

Industrial Segment
Industrial Segment Overview
39
» Strong recovery underway, driven by trade and improved domestic production, orders and capacity utilization.
» Closely watching for any slippage in trade from weaker European, Chinese and Japanese economies.
» Segment benefitting from e-retail distribution and fulfillment demand.
» Supply not threatening but does tend to happen quickly in this segment; further vacancy and rent gains will spur healthy NOI increases.
» Cap rate spreads still on high end of range, providing interest rate buffer and enhancing valuation growth potential.
» Volume is gradually increasing, while pricing is getting close to its pre-downturn peak.
If Demand Holds Up, Industrial Vacancies Will Drop to a Very Low Level
40
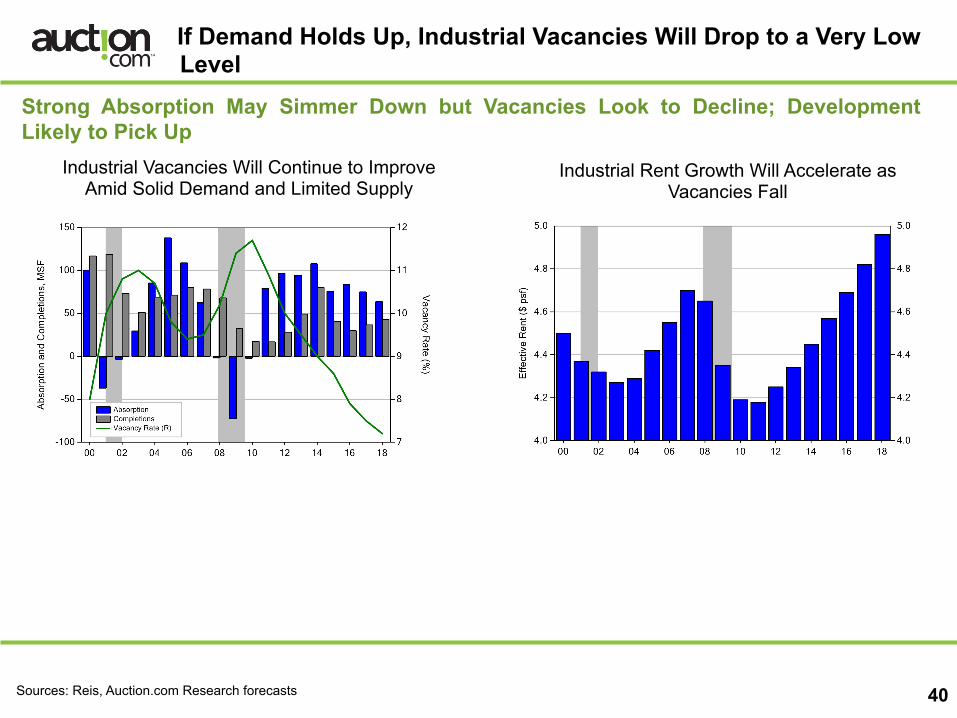
Strong Absorption May Simmer Down but Vacancies Look to Decline; Development Likely to Pick Up
Industrial Vacancies Will Continue to Improve Amid Solid Demand and Limited Supply
Industrial Rent Growth Will Accelerate as Vacancies Fall
Sources: Reis, Auction.com Research forecasts

Plusses and Minuses of Low Oil on Industrial Markets
41
Immediate Negative Impact on Industrial Demand in Oil Markets*
Industrial Vacancies Will Jump on Diminished Demand from Oil Related Companies
All Systems Go in Non-Oil Markets
Sources: Reis, Auction.com Research forecasts
*Defined as: Austin, Dallas, Fort Worth, Houston, and Pittsburgh

Hospitality Segment

Hospitality Segment Overview
43
» Amid a very strong expansion: high occupancies across segments, record levels on high end.
» Very strong room rate growth combining for robust RevPAR level and growth.
» Ebola risk has receded.
» Development still moderate on national level but some markets seeing very high room inventory increases.
» Cap rate spreads have been driven down amid the strength in operating conditions, raising more vulnerability to rising interest rates.
» While operating conditions look set to continue to grow, cap rates expansion could stall valuations.
» Transaction volume is gradually increasing, while pricing is getting close to its pre-downturn peak.
Key Drivers of Hospitality Demand Growing
44
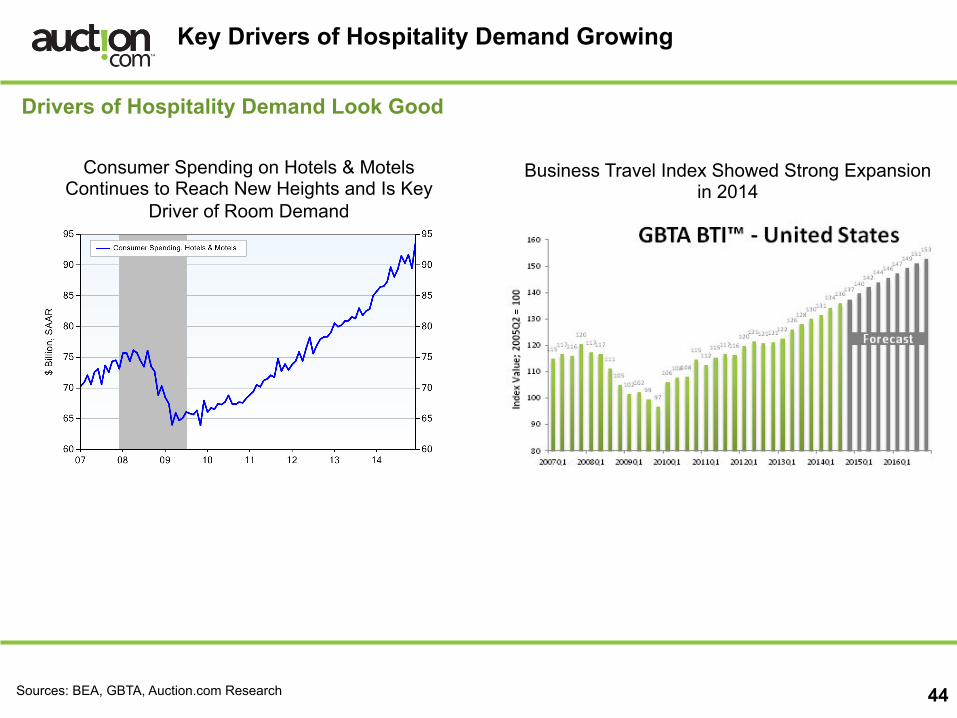
Drivers of Hospitality Demand Look Good
Consumer Spending on Hotels & Motels Continues to Reach New Heights and Is Key
Driver of Room Demand
Business Travel Index Showed Strong Expansion in 2014
Sources: BEA, GBTA, Auction.com Research
Key Drivers of Hospitality Demand Growing
45
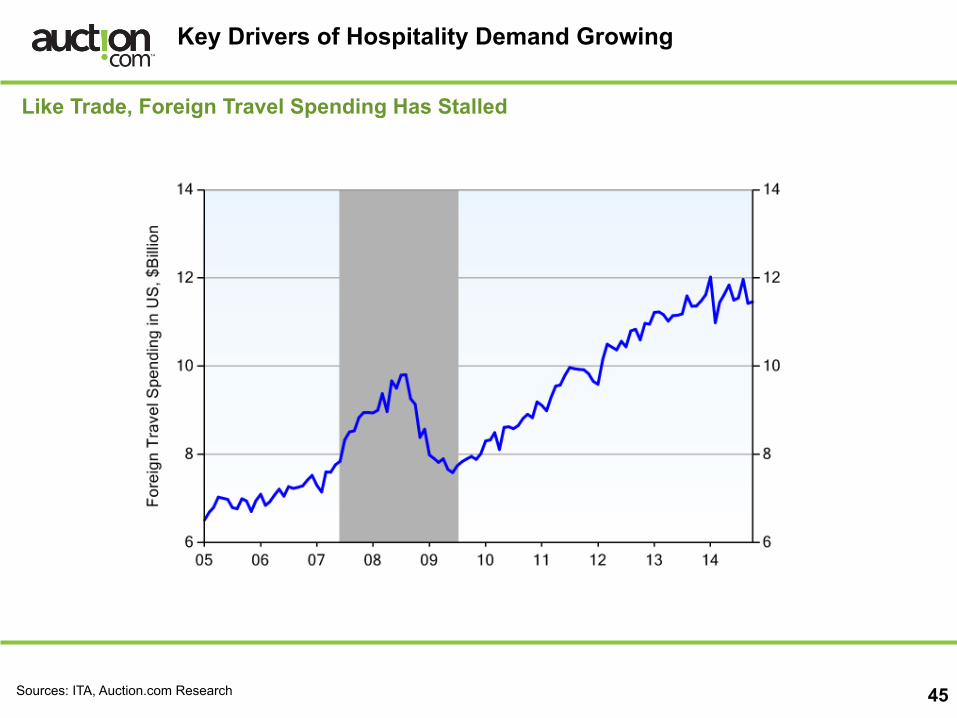
Like Trade, Foreign Travel Spending Has Stalled
Sources: ITA, Auction.com Research
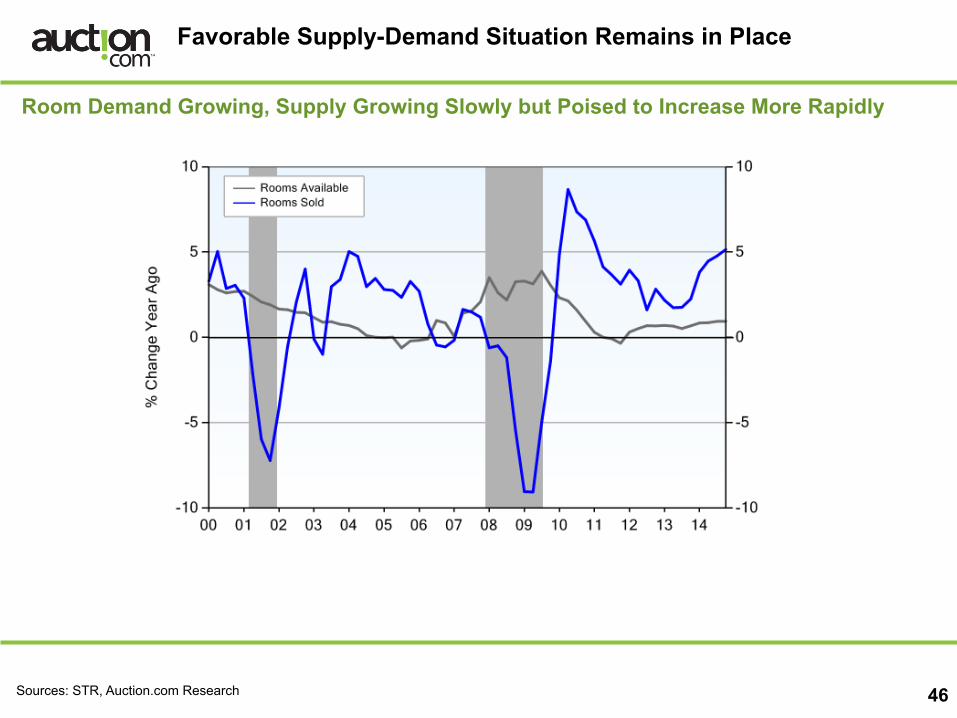
Favorable Supply-Demand Situation Remains in Place
46
Room Demand Growing, Supply Growing Slowly but Poised to Increase More Rapidly
Sources: STR, Auction.com Research

Occupancies Stand at Healthy Level, Enabling Hotel Operators to Raise Rates
47
Occupancies Healthy; ADRs & RevPAR Growing
US Occupancies Reach Record High Room Rate and RevPAR Maintain Healthy
Growth
Sources: STR, Auction.com Research

Outlook for Operating Conditions
48
Expansion Should Stay on Track but Slow as It Matures
Occupancies Will Continue Their Upward Trajectory
Room Rate and RevPAR Growth Will Cool to Still-Healthy Pace in Coming Years
Sources: STR, Auction.com Research forecasts

Most Hospitality Markets Have Strong Prospects but Impact of Low Oil Evident in Texas
49
» Our forward view of segment fundamentals on scale of 1/dark green (very strong) to 6/dark red (very weak).
» Individual box size based on market hotel inventory.
Source: Auction.com Research

Peter Muoio, Ph.D. 646-‐352-‐9510 [email protected]
For our latest insights follow us at: www.aucHon.com/blog TwiKer: @MaximusiQ Linkedin: MaximusiQ www.aucHon.com