![arXiv:2008.04921v1 [astro-ph.HE] 11 Aug 2020Draft version August 13, 2020 Typeset using LATEX twocolumn style in AASTeX62. SuperRAENN: A Semi-supervised Supernova Photometric Classi](https://static.fdocuments.net/doc/165x107/611cf8e6b33eb8542e21e125/arxiv200804921v1-astro-phhe-11-aug-2020-draft-version-august-13-2020-typeset.jpg)
Semi-Supervised Supernova Classification · PDF fileSemi-Supervised Supernova Classi cation...
31
Semi-Supervised Supernova Classification Joseph W. Richards UC Berkeley Department of Astronomy Department of Statistics j[email protected] KICP Supernova Hub workshop Photometric Identification of Supernovae March 16, 2012
Transcript of Semi-Supervised Supernova Classification · PDF fileSemi-Supervised Supernova Classi cation...

Semi-Supervised Supernova Classification
Joseph W. Richards
UC BerkeleyDepartment of AstronomyDepartment of Statistics
KICP Supernova Hub workshopPhotometric Identification of Supernovae
March 16, 2012

Center for Time-Domain Informatics
UC Berkeley (UCB):Faculty/StaffJosh Bloom, Dan Starr (Astro), John Rice, Noureddine El Karoui (Stats),Martin Wainwright, Masoud Nikravesh (CS)Post-DocsBrad Cenko, Berian James, JWR, Dovi Poznanski & Nat Butler (alumni)Grad StudentsAdam Miller, Adam Morgan, Chris Klein, James Long, Henrik Brink,Sharmo BhattacharyyaUndergradsPierre Christian, Tatyana Gavrilchenko, Stuart Gegenheimer, AnthonyParedes, Benjamin Gerard
Lawrence Berkeley National Laboratory (LBNL):Peter Nugent, Horst Simon
Visit our website: http://cftd.info/
J. Richards Semi-Supervised Classification 2

Approaches to PhotometricSupernova Typingfrom the results of the SN Photometric ClassificationChallenge: Kessler et al. (2010). arXiv:1008.1024
J. Richards Semi-Supervised Classification 3

Template Fitting
Template Fitting
(1) Light curve data are fitted to each template in a largedictionary via maximum likelihood (i.e. χ2 minimization) orBayesian fitting.(2) Either (a) the class of the best fitting template is chosen,or (b) a Type Ia likelihood ratio test is performed.
I Latent model parameters (z , t0, stretch, reddening) areusually optimized (or marginalized) over.
I This is similar to hypothesis testing in the presence ofnuisance parameters.
SN Challenge Entries: Belov+Glazov; Gonzalez;Portsmouth χ2; Poz2007; Rodney; Sako; SNANA Cuts
J. Richards Semi-Supervised Classification 4

Template Fitting
Pros 1 Easy to insert known physics (time dilation,K-corrections, reddening, etc.)
2 Simultaneously gives estimates of physical parameters3 If the physical model is correct, it can be used to
extrapolate to different populations.
Cons 1 Requires full time-varying SED template for each class ofsupernova (or at least for Type Ia’s)
2 Errors can arise due to incomplete basis and/or anoverly-restrictive model and/or degeneracies
3 Does not automatically learn from new data
J. Richards Semi-Supervised Classification 5

Supervised Learning
Supervised Learning
(1) Class-predictive summary statistics (features) areestimated from light curve data.(2) Flexible (non-parametric) classification models are used tomap from feature vector to SN type.
I Domain knowledge crucial in constructing features.
I Training set of SN data of known type is needed to learnthe appropriate classification model.
I Probabilistic classifiers are often used (easy to tunepurity/efficiency).
SN Challenge Entries: JEDI entries; MGU+DU-1, 2;Portsmouth-Hubble
J. Richards Semi-Supervised Classification 6

Supervised Learning
Pros 1 Automatically learns from new labeled data.2 No model or SED templates are necessary.3 Prediction is trivial; no model fitting needed.4 Can use dozens or even hundreds of features.
Cons 1 Classifier cannot extrapolate beyond the training set.2 Physics only enter through the features.
Difficult to inject known physics.3 Does not learn anything from the (abundant) data from
unlabeled supernovae.
J. Richards Semi-Supervised Classification 7

Semi-Supervised Learning
Semi-Supervised Learning
(1) Use data from all observed supernovae to learn anappropriate feature representation.(2) Learn best classification model in this feature space usinglabeled training set.
I Domain knowledge enters through a discrepancy measurebetween light curves
I Training set decides optimal feature representation andbest classifier.
I Probabilistic, non-parametric classifiers can be used (easyto tune purity/efficiency).
SN Challenge Entries: InCA (this work)
J. Richards Semi-Supervised Classification 8

Semi-Supervised Learning
Pros 1 Automatically learns from all labeled AND unlabeleddata.
2 No model or SED templates are necessary.3 No need to define a set of features.4 Prediction is trivial; no model fitting needed.
Cons 1 Classifier cannot extrapolate beyond the training set.But should outperform supervised learning if there isnatural clustering structure.
2 Need to define a discrepancy measure between lightcurves
3 Physics can possibly enter through discrepancymeasure...
J. Richards Semi-Supervised Classification 9

Supernova Typing withDiffusion MapWith Darren Homrighausen, Chad Schafer, Peter Freeman(CMU Statistics), and Dovi Poznanski (TAU)
Richards et al. (2012). arXiv:1103.6034
J. Richards Semi-Supervised Classification 10

Photometric Supernova Classification
Semi-supervised Approach:
1 Construct localdissimilarity measurebetween LCs
2 Use all data to find alow-dimensionalembedding for all SNevia diffusion map
3 Use labeled SNe totrain random forestclassifier on diffusionmap coordinates
4 Predict the class ofeach unlabeled SNe
J. Richards Semi-Supervised Classification 11

Diffusion Map
I Diffusion map – non-linear method to uncoverlow-dimensional structure in dataCoifman & Lafon 2006, Lafon & Lee 2006, Richards et al. 2009; ApJ 691, 32
I Idea – estimate the true discrepancy between data via afictive diffusion process (i.e., Markov random walk).
I Related spectral methods: LLE, Laplacian eigenmaps,Hessian eigenmaps, Isomap, etc.
I Other uses of diffusion map in Astrophysics:
1 Spectral basis for galaxy population synthesis modelingRichards et al. 2009; MNRAS 399, 1044
2 Adaptive regression for photometric redshift estimationFreeman et al. 2009; MNRAS 398, 2012
J. Richards Semi-Supervised Classification 12

Diffusion Map: Intuition
p1(xi , xj) RW transition prob.
Diffusion distance at t: D2t (xi , xj) =
∑k
(pt(xi ,xk )−pt(xj ,xk ))2
φ0(xk )
J. Richards Semi-Supervised Classification 13
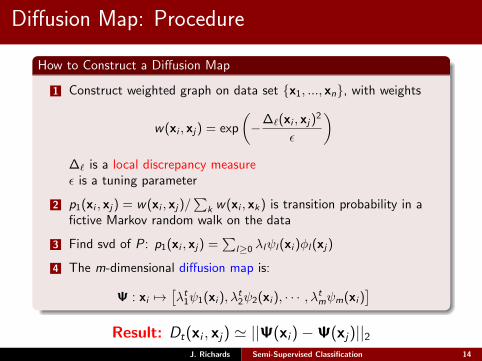
Diffusion Map: Procedure
How to Construct a Diffusion Map
1 Construct weighted graph on data set {x1, ..., xn}, with weights
w(xi , xj) = exp
(−∆`(xi , xj)2
ε
)∆` is a local discrepancy measureε is a tuning parameter
2 p1(xi , xj) = w(xi , xj)/∑
k w(xi , xk) is transition probability in afictive Markov random walk on the data
3 Find svd of P: p1(xi , xj) =∑
l≥0 λlψl(xi )φl(xj)
4 The m-dimensional diffusion map is:
Ψ : xi 7→[λt1ψ1(xi ), λ
t2ψ2(xi ), · · · , λtmψm(xi )
]Result: Dt(xi , xj) ' ||Ψ(xi)−Ψ(xj)||2
J. Richards Semi-Supervised Classification 14

Diffusion Map: Spiral Example
J. Richards Semi-Supervised Classification 15

Diffusion Map for SN Light Curves
0 20 40 60 80
010
2030
4050
DES_SN001292 Type: 22
0 20 40 60 80 1000
2040
60
DES_SN002542 Type: 1
−20 0 20 40 60 80
050
100
150
DES_SN003644 Type: 22
−40 −20 0 20 40 60 80
020
4060
80
DES_SN007355 Type: 1
−60 −40 −20 0 20 40 60
010
2030
40
DES_SN011670 Type: 1
−50 0 50 100
010
2030
4050
60
DES_SN012491 Type: 1
−60 −40 −20 0 20 40
010
2030
4050
60
DES_SN012720 Type: 22
−50 −40 −30 −20 −10 0 10
020
4060
80100
DES_SN013009 Type: 33
−50 0 50 100
010
2030
4050
60
DES_SN015154 Type: 1
−50 0 50 100
020
4060
80100
DES_SN016272 Type: 1
−50 −40 −30 −20 −10 0 10
020
4060
80
DES_SN017520 Type: 33
−50 0 50
050
100
150
200
250
DES_SN017894 Type: 22
−50 0 50 100
010
2030
4050
DES_SN021321 Type: 1
Thursday, March 15, 2012
Graphical Model on SN Light Curves
J. Richards Semi-Supervised Classification 16

SN Light Curves: Local Discrepancy Metric
Local distance measure:
∆`(xi , xj) =∑b
1
∆tij||x̃i,b − x̃j,b||2
b indexes band, x̃ denotes optimal(normalized) spline fit, found via GCV
I ∆` constructed to capturedifferences in light curve shapesand colors
I Pair-wise weights betweensupernovae:
w(xi , xj) = exp(−∆`(xi ,xj )
2
ε
)I Use m-dimensional diffusion space
representation {ψ1(x), ..., ψm(x)}to discriminate SN type
J. Richards Semi-Supervised Classification 17

SN Classification: Diffusion Map Coordinates
Diffusion map representation of the 1103 spectroscopic SNeRed: Ia, Blue: Ib+Ic+Ibc, Green: IIn+IIP+IIL
J. Richards Semi-Supervised Classification 18

SN Classification: Diffusion Map Coordinates
We can obtain physical intuition by visualizing how SNe varyacross the diffusion map coordinate space1.0 0.5 0.0 0.5 1.0 1.5
0.15
0.10
0.05
0.00
0.05
0.10
Diffusion Coordinate 3
Diff
usio
n C
oord
inat
e 7
B1
B2
B3
B4
IaIIn+IIP+IILIb+Ic+Ib/c
20 0 20 40 60Time since r band max
Nor
mal
ized
Flux
+ o
ffset
B1
B2
B3
B4
J. Richards Semi-Supervised Classification 19

SN Classification: Training Classifier
Using Random Forest classifier on the diffusion mapcoordinates, we optimize the Type Ia FoM:
f̂Ia =1
NTotalIa
(N trueIa )2
N trueIa + WN false
Ia
; W ≡ 3 (1)
over ε, m, and t Ia and RF parameters (Ntree, mtry) usingcross-validation on the training set of confirmed SNe
Table 6 in Richards et al. (2012), arXiv:1103.6034J. Richards Semi-Supervised Classification 20

SN Classification: Diffusion Map Coordinates
Diffusion map representation of all 21,000 SNe(confirmed+unconfirmed)
J. Richards Semi-Supervised Classification 21
Sample Selection Bias in LightCurve Classificationwith Dan Starr, Adam Miller, Nat Butler, James Long, JohnRice, Josh Bloom (UC Berkeley), Henrik Brink & BerianJames (DARK)
Richards et al. (2012), arXiv:1106.2832
J. Richards Semi-Supervised Classification 22

Sample Selection Bias
In astronomical problems, the training (labeled) and testing(unlabeled) sets are often drawn from different distributions.
Left: Training setRight: Testing set
This problem is referredto as Sample SelectionBias or Covariate Shift.
Also discussed inNewling et al. (2012)
SN Challenge DataKessler et al. (2010)
arXiv:1008.1024J. Richards Semi-Supervised Classification 23

Sample Selection Bias
For SN Ia typing, it isbetter to use deeperspectroscopic trainingsamples, even thoughthey produce data fromfewer SNe
Sm,25 - 25th mag-limitedspec survey is optimal(23.5th mag was used inSN Challenge)
Classifier evaluated overheld-out testing set
Figure: Type Ia SN Purity and Efficiencyof Random Forest classifier on SN
Challenge testing data
J. Richards Semi-Supervised Classification 24

Sample Selection Bias: SN Challenge Results
Red: Template FittingBlue: SupervisedGreen: Semi-Supervised
All methods appear tobe affected adversely bySample-Selection Bias
Template Fitting shouldbe more immune to thistype of bias
J. Richards Semi-Supervised Classification 25

Methods: Active Learning (AL)
Idea: Identify and manually label the unlabeleddata that would most help future iterations of theclassifier
Key: In astronomy, we often have the ability to selectivelyfollow up on sources:
I Spectroscopic study
I Higher cadence photometric monitoring
Pool-based, batch-mode Active Learning: On each ALiteration, select a batch of objects from the entire testing setfor manual labeling via a query function
J. Richards Semi-Supervised Classification 26

Methods: Active Learning (AL)
- P̂RF(y |x) is the estimated RF probability
- ρ(x′, x) is the RF proximity measure
RF AL query functions; Richards et al. (2012) arXiv:1106.2832
AL1. Select testing data point (x′ ∈ U) that is mostunder-sampled by the training data (L):
S1(x′) =
∑x∈U ρ(x′, x)/NTest∑z∈L ρ(x′, z)/NTrain
(2)
AL2. Select testing point that maximizes the totalexpected change in the RF probs. over the testing data:
S2(x′) =
∑x∈U ρ(x′, x)(1−maxy P̂RF(y |x))∑
z∈L ρ(x′, z) + 1(3)
J. Richards Semi-Supervised Classification 27

Results: AL for Variable Star Classification
Example: VarStar LCs
Active Learning appliedto 32-class variable starclassification problemusing photometric lightcurves from ASAS.
Training set of OGLEand Hipparcos lightcurves is heavily biased;classifier performancereaches optimal levelafter a few AL iterations.
!
!
!
!
!
!
!
!!
!
0 2 4 6 8
0.66
0.68
0.70
0.72
0.74
0.76
0.78
0.80
AL Iteration
Perc
ent A
gree
men
t with
AC
VS
!
!
!
!
!
!
!
!
!
!
0 2 4 6 8
0.15
0.20
0.25
0.30
0.35
0.40
AL Iteration
Perc
ent o
f Con
fiden
t ASA
S R
F La
bels
Off-the-shelf RFError Rate = 34.5%
RF w/ Active LearningError Rate = 20.5%
3-fold increase in classifier confidence
J. Richards Semi-Supervised Classification 28

Where do we go from here?
1 Which method(s) should we use?I Template modeling should work well if our physics are
correct and our templates are accurate and complete.I Machine-learning based methods automatically learn
from training data but can be ignorant of the physics.I Semi-supervised methods have the ability to bridge this
gap: Learning performed on all observed SN data &known physics can be incorporated thru distance metric
Typically, the more data we observe, the more wediscover how little we actually know!
2 How do we optimize follow-up resources?I Rigorous targeting algorithms can help overcome
debilitating sample selection biasesI Template fitting, supervised learning, and
semi-supervised learning all stand to improve
J. Richards Semi-Supervised Classification 29

An aside about Supernova Discovery
Work I am involved with for Transient Discovery &Classification with the Palomar Transient Factory:
1 Real/Bogus – Of 1.5M nightly detections (via imagesubtraction) which are the real time-varying astrophysicalobjects?
2 Oarical – Given that an object is Real, can we confidentlydeclare it a Transient or a Variable Star, given all of theinformation we know at the time of discovery?
3 ML Supernova Zoo – At time of discovery, predict howthe SN Zoo users would rate a subtraction image, giventhe ref & sub images plus any contextual information.
Bloom et al. (2011) arXiv:1106.5491; Brink et al. (2012) in prep.; Richards et al.
(2012) in prep.
J. Richards Semi-Supervised Classification 30

Center for Time-Domain Informatics Publications
Butler, Nathaniel R. & Bloom, Joshua S. Optimal Time-Series Selection of Quasars(2011, AJ, 147, 93)
Richards, Joseph W., et al. On Machine-Learned Classification of Variable Starswith Sparse and Noisy Time-Series Data (2011, ApJ, 733, 1)
Bloom, Joshua S. & Richards, Joseph W. Data Mining and Machine-Learning inTime-Domain Discovery & Classification (2011, Chapter in the forthcoming book“Advances in Machine Learning and Data Mining for Astronomy”)
Klein, Christopher R., Richards, Joseph W., Butler, Nathaniel R. & Bloom, Joshua S.Mid-infrared Period-luminosity Relations of RR Lyrae Stars Derived from the WISEPreliminary Data Release (2011, ApJ, 732, 2)
Richards, Joseph W., Homrighausen, Darren, Freeman, Peter E., Schafer, Chad M. &Poznanski, Dovi Semi-supervised Learning for Photometric Supernova Classification(2012, MNRAS, 419, 1121)
Richards, Joseph W. et al. Active Learning to Overcome Sample Selection Bias:Application to Photometric Variable Star Classification (2012, ApJ, 744, 192)
Bloom, Joshua S. et al. Automating Discovery and Classification of Transients andVariable Stars in the Synoptic Survey Era (2011, arXiv:1106.5491)
J. Richards Semi-Supervised Classification 31