SEMI Equipment and Materials Market Updatesemieurope.omnibooksonline.com/2015/semicon_europa... ·...
31
SEMI Equipment and Materials Market Update Clark Tseng, Sr. Manager SEMI Industry Research & Statistics October 2015
Transcript of SEMI Equipment and Materials Market Updatesemieurope.omnibooksonline.com/2015/semicon_europa... ·...

SEMI Equipment and Materials Market Update
Clark Tseng, Sr. ManagerSEMI Industry Research & Statistics
October 2015

Outline
• 2015 Year-to-Date Trends
• Equipment Market Outlook
• Materials Market Outlook
• Summary

Year-to-Date Trends

2015 Semiconductor Revenue Forecasts
2.3%
5.0%
3.4%
3.0%
2.0%
4.3%
0% 1% 2% 3% 4% 5% 6%
WSTS (Aug 15)
IDC (Sep 15)
Cowan LRA (Aug 15)
TSMC (Jul 15)
IC Insights (Aug 15)
Semico Research (Sep 15)
Source: Compiled by SEMI

Year to Date…
• Growing uncertainty in the global economic condition – Slower growth from emerging markets; mediocre
European market; Japan 2Q GDP contraction; China stock market…
• Semiconductor revenue forecasts lowered– Generally, from mid-single digit to low-single digit– Japan and Europe currency devaluation – Inventory issue, PC/tablet market down, high-end smart
phone market growth slowing…– Declining DRAM pricing
• Some companies reduced capex for 2015 Yet…

Unit Trends-Strong Year-over-Year growth for 1H
Source: SEMI and WSTS

Silicon Area Shipment Index
100
120
140
160
180
200
220
240
260
280
Jan-
12
Ap
r-12
Jul-
12
Oct
-12
Jan-
13
Ap
r-13
Jul-
13
Oct
-13
Jan-
14
Ap
r-14
Jul-
14
Oct
-14
Jan-
15
Ap
r-15
Jul-
15
Ind
ex V
alu
e
Worldwide Wafer Area Shipment Index(Three-month Moving Average)
Source: SEMI Silicon Manufacturers Group August 2015
Silicon shipments are up 7% year to date through July

0.90
0.95
1.00
1.05
1.10
1.15
Jan
-14
Feb
-14
Mar
-14
Ap
r-1
4
May
-14
Jun
-14
Jul-
14
Au
g-1
4
Sep
-14
Oct
-14
No
v-1
4
De
c-1
4
Jan
-15
Feb
-15
Mar
-15
Ap
r-1
5
May
-15
Jun
-15
Jul-
15
(f)
15
-Au
g (p
)
Bo
ok-
to-B
ill R
atio
$800$1,000$1,200$1,400$1,600$1,800
Jan
-14
Feb
-14
Mar
-14
Ap
r-1
4
May
-14
Jun
-14
Jul-
14
Au
g-1
4
Sep
-14
Oct
-14
No
v-1
4
De
c-1
4
Jan
-15
Feb
-15
Mar
-15
Ap
r-1
5
May
-15
Jun
-15
Jul-
15
(f)
Au
g-1
5…US$
Mil
lio
ns
North American Headquartered Manufacturers Global Capital Equipment Book-to-Bill
(based on three month averages)
Bookings Billings
SEMI North America Book-to-Bill-Steady booking and billings trends thru August
Source: SEMI August 2015
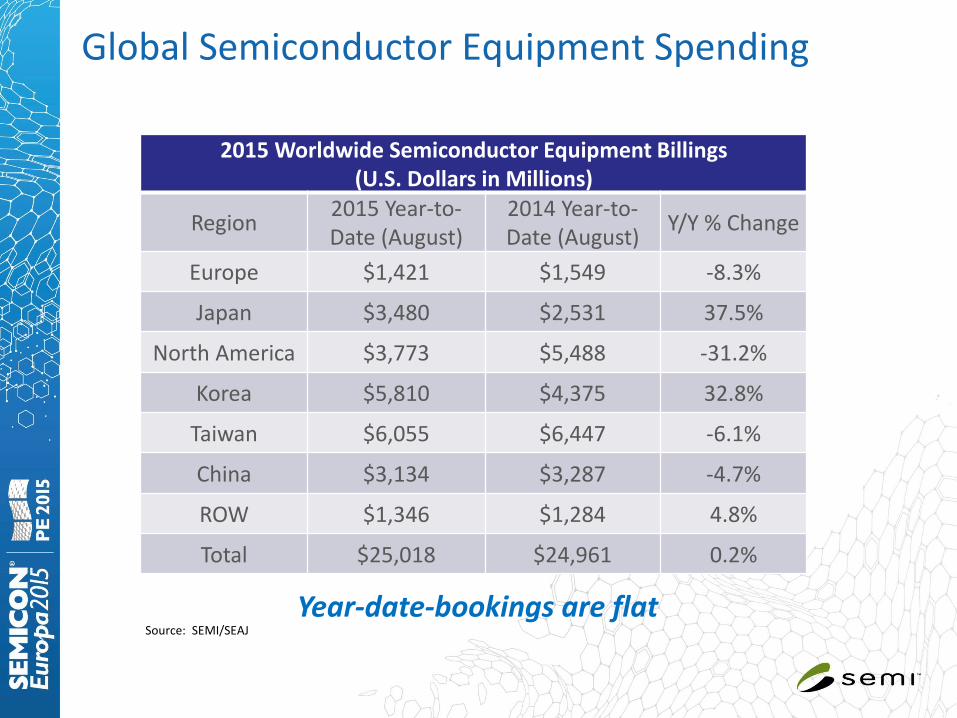
Global Semiconductor Equipment Spending
Source: SEMI/SEAJ
2015 Worldwide Semiconductor Equipment Billings(U.S. Dollars in Millions)
Region2015 Year-to-Date (August)
2014 Year-to-Date (August)
Y/Y % Change
Europe $1,421 $1,549 -8.3%
Japan $3,480 $2,531 37.5%
North America $3,773 $5,488 -31.2%
Korea $5,810 $4,375 32.8%
Taiwan $6,055 $6,447 -6.1%
China $3,134 $3,287 -4.7%
ROW $1,346 $1,284 4.8%
Total $25,018 $24,961 0.2%
Year-date-bookings are flat

Equipment Market Outlook

66%
14%
-7%5%
-9%
28%40%
66%
10%5%
-21%
17%
87%
-41%-30%
12%
67%
-11%
23%6%
-31%-46%
150%
9%
-15%-14%
18%3%
5%
-100%
-50%
0%
50%
100%
150%
200%
$0
$10
$20
$30
$40
$50
$60
1987
1988
1989
1990
1991
1992
1993
1994
1995
1996
1997
1998
1999
2000
2001
2002
2003
2004
2005
2006
2007
2008
2009
2010
2011
2012
2013
2014
2015
F20
16F
An
nu
al G
row
th(%
)
Ca
pit
al E
qu
ipm
en
t($
US
Bil
lio
n)
Capital Equipment Annual Growth
Capital Equipment Cycles
Source: SEMI/SEAJ. SEMI 2015 Mid-Year Forecast, August update

Regional Semiconductor Equipment Markets
China12% Europe
6%
Japan11%
Korea18%
North America
22%
ROW6%
Taiwan25%
2014 = $37.50 billion
Region 2014$US B
2015F$US B
%Change
China $4.37 $4.56 4%
Europe 2.38 2.50 5%
Japan 4.18 5.29 27%
Korea 6.84 8.13 19%
North America 8.16 6.26 -23%
SEA/ROW 2.15 2.14 -1%
Taiwan 9.41 9.56 2%
Total $37.50 $38.44 3%
Source: SEMI/SEAJ August 2015 update
Totals may not add due to rounding

Fab Equipment Spending-Driven by Memory and Foundry

The Return of 200mm Capacity

Foundries-Ramping 200mm capacity in 2015 and 2016
2010 2011 2012 2013 2014E 2015F 2016F
Foundry only- 200mm 2.12 2.19 2.27 2.29 2.28 2.37 2.43
1.95
2.00
2.05
2.10
2.15
2.20
2.25
2.30
2.35
2.40
2.45
2.50
2010 2011 2012 2013 2014E 2015F 2016F
Inst
alle
d C
apac
ity
(Mill
ion
s w
pm
)
Installed 200mm Foundry Capacity
Source: SEMI World Fab Forecast

Materials Market Outlook

Global Silicon Wafer Shipment Trends
Source: Rose Associates 1991to 1994; SEMI SMG 1995 to 2013; SEMI Forecast

Worldwide Wafer Fab Materials Forecast
Totals may not add due to roundingSource: SEMI August 2015
Actual Forecast
2013US$ M
2014US$ M
2015US$ M
2016US$ M
Silicon Wafers1 $7,932 $7,990 $7,954 $8,278
Photomasks2 3,136 3,220 3,342 3,442
Photoresist 1,220 1,374 1,354 1,413
Photoresist Ancillaries3 1,428 1,711 1,777 1,850
Wet Chemicals4 995 1,059 1,121 1,104
Gases 3,319 3,481 3,577 3,721
Sputter Targets4 598 629 653 696
CMP Slurry & Pads5 1,436 1,569 1,618 1,722
Other/New Materials 2,588 2,945 3,178 3,415
Total $22,652 $23,977 $24,574 $25,641
% Growth 6% 2% 4%

Wafer Fab Materials Forecast Notes
1. Silicon wafers include merchant sales value only; includes SOI wafers; no reclaim wafers
2. Includes captive market3. Includes resist removal chemicals, developers, anti-reflective coatings,
contrast enhancers, edge bead removers, adhesion promoters, etc.4. Source is Linx Consulting LLC, Sputter Targets includes precious metals5. Estimates for IC applications only6. Includes low k dielectrics, copper plating solutions, dielectric
precursors, organometallic precursors, etc.7. All forecasts in current dollars8. Source for all data is SEMI, unless otherwise indicated

Photomask Market
Source: SEMI March 2015$0
$500
$1,000
$1,500
$2,000
$2,500
$3,000
$3,500
$4,000
2005 2007 2010 2015F 2016F
US$
Mill
ion
Taiwan ROW North America Korea Japan Europe China
0%
20%
40%
60%
80%
100%
2005 2015F
Pe
rcen
t of
Mar
ket
Merchant Captive
Source: SEMI March 2015

Regional Fab Materials Markets
China7%
Europe10%
Japan18%
Korea19%
North America
18%
SEA/ROW 6%
Taiwan22%
2015F = $24.6 billion
Region 2015F$US B
2016F$US B
%Change
China $1.77 $1.89 6%
Europe 2.49 2.57 3%
Japan 4.39 4.50 2%
Korea 4.65 4.95 6%
North America 4.46 4.59 3%
Taiwan 5.47 5.73 5%
SEA/ROW 1.34 1.42 7%
Total $24.57 $25.64 4%
Source: SEMI August 2015
Totals may not add due to rounding

Worldwide Packaging Materials Forecast
Totals may not add due to roundingSource: SEMI August 2015
Actual Forecast
2013US$ M
2014US$ M
2015US$ M
2016US$ M
Leadframes $3,342 $3,461 $3,350 $3,346
Organic Substrates1 7,408 7,612 8,196 8,586
Ceramic Packages 2,006 2,075 2,157 2,174
Encapsulation Resins 2,451 2,712 2,922 3,187
Bonding Wire2 4,151 3,385 3,176 3,099
Die Attach Materials3 666 704 734 752
Others 374 409 451 500
Total $20,398 $20,358 $20,986 $21,644
% Growth -0.2% 3% 3%
Packaging Materials will be 46% of the 2015 Total Semiconductor
Materials Market
Major update coming in November

Semiconductor Packaging Materials Forecast Notes
1. Source is TechSearch International. Includes PBGA, PPGA, LGA, and CSP laminate substrates and flex BGA and CSP substrates
2. Assume gold value of $1,480/trz for 2013; $1,260/trz for 2014; $1,190/trz for 2015 - 2016
3. Includes die attach film (tape) materials4. Other includes solder balls and wafer level package
dielectrics5. Source for all data is SEMI, unless otherwise indicated6. All forecasts in current dollars

Packaging Material Market Trends
• CSP laminate substrates, CSP leadframes, and WLP are driven by explosive growth in mobile computing and communications
• Flip chip and copper pillar continue to expand the market for underfillmaterials.
• Need more development for WLP dielectrics used in multi-layer structures
• Mold compounds- warpage control/package reliability (MSL1); withstand high flexing for wearable applications
• QFN- cost optimization through design (including strip size) and reduced plating area (also improves MSL); higher lead counts (routable); improved power dissipation
• Transition from gold wire to copper and silver
Source: SEMI and TechSearch International- Global Semiconductor Packaging Materials Outlook

Regional Packaging Materials Markets
China21%
Europe3%
Japan13%
Korea13%
North America
3%
SEA/ROW26%
Taiwan21%
2015F = $21.0 billion
Region 2015F$US B
2016F$US B
%Change
China $4.34 $4.54 5%
Europe 0.72 0.75 3%
Japan 2.69 2.82 4%
Korea 2.66 2.72 2%
North America 0.66 0.66 0%
Taiwan 4.43 4.56 3%
SEA/ROW 5.50 5.60 2%
Total $20.99 $21.64 3%
Source: SEMI August 2015Totals may not add due to rounding

Regional Semiconductor Materials Markets
China13%
Europe7%
Japan16%
Korea16%
North America
11%
SEA/ROW15%
Taiwan22%
2015F = $45.5 billion
Region 2015F$US B
2016F$US B
%Change
China $6.11 $6.43 5%
Europe $3.21 $3.32 3%
Japan $7.08 $7.32 3%
Korea $7.31 $7.67 5%
North America $5.12 $5.25 3%
Taiwan $9.90 $10.29 4%
SEA/ROW $6.84 $7.02 3%
Total $45.56 $47.28 4%
Source: SEMI August 2015Totals may not add due to rounding

Summary

Europe Market Summary
2016 Outlook
Installed Fab Capacity 1.84 million 200mm-equiv. wafers/monthSEMI is tracking 180 front-end facilities in
Europe/Mideast Region
Packaging & Test >60 production facilities; including focus on wafer bumping, WLP, and 3D
Semiconductor Materials ~$2.5+ billion
Semiconductor Equipment Estimating $2.5 to $3.0 billion in spending
Source: SEMI World Fab Forecast, WWSEMS, & MMDS

Europe Manufacturers
• Intel: 14nm related investments at its Ireland & Israel fabs
• Infineon: Expansion of power IC at Dresden 300mm
• ST Microelectronics: Expansions and upgrades to Crolles 2 Fab lines (including investments related to Nano2017 and Horizon 2020 Vision)
• GlobalFoundries: On-going upgrades in Dresden, 22nm FD-SOI manufacturing to start in 2016.
• IMEC: Spending on Fab 3

Summary
• Uncertainty with the near-term outlook• Industry inventory correction shall come to an end in 4Q15.
• Year-to-Date Trends Silicon shipments are up through July Equipment bookings and billings are comparable to 2014 levels
• Memory and Foundry lead fab investment this year and next
• Semiconductor Equipment & Materials Outlook Materials market is expected to increase 3% in 2015 and 4% in 2016 Equipment market is expected to increase 3% in 2015 and 5% in 2016

Thank YouFor SEMI Market Data and Information, Please Visit:www.semi.org/marketinfowww.semi.org/fabswww.slideshare.net/ehallSEMIwww.youtube.com/user/SEMImktstats
Sign-up for the Monthly SEMI Global Update e-newsletter:www.semi.org/About/SEMIGlobalUpdate/