Semi-Annual Financial Statement– as at … business conduct. The CI Code of Ethics and Conduct...
27
Semi-Annual Financial Statement – as at September 30, 2011
Transcript of Semi-Annual Financial Statement– as at … business conduct. The CI Code of Ethics and Conduct...

Semi-Annual Financial Statement – as at September 30, 2011

A look inside
Overview ............................................................................................................................... 1
About the CI Funds Board of Governors and
Letter from the CI Funds Board of Governors .............................................................. 2
Equity Funds
Synergy American Fund ............................................................................................................ 3
Balanced Funds
Synergy Tactical Asset Allocation Fund ................................................................................... 9
Notes to the Financial Statements .................................................................................... 18
Legal Notice ......................................................................................................................... 24
CI Investments Inc., the Manager of the Funds, appoints independent auditors to audit the Funds’
Annual Financial Statements. Under Canadian securities laws (National Instrument 81-106), if an
auditor has not reviewed the Semi-Annual Financial Statements, this must be disclosed in an
accompanying notice.
The Funds’ independent auditors have not performed a review of these Semi-Annual Financial
Statements in accordance with standards established by the Canadian Institute of Chartered
Accountants.

– 1 –
Enclosed are the Financial Statements for your CI Investments
mutual funds for the six months ending September 30, 2011. Inside is
important information about each fund, including its financial
statements and a list of the portfolio holdings at the end of the period.
Additional information about your funds can be found on our website,
www.ci.com.
If you have any questions about your investments, please contact your
financial advisor. CI is proud to partner with advisors across Canada.
We believe investors are most successful when they follow an investment
plan developed with the assistance of a qualified advisor.
You may also contact CI Client Services at 1-800-792-9355.
Thank you for investing with us.
ABOUT CI INVESTMENTS
CI has been investing on behalf of Canadians since 1965 and has grown
to become one of Canada’s largest investment fund companies. We
manage over $67 billion on behalf of 1.7 million Canadians. CI is a
subsidiary of CI Financial Corp., a TSX-listed financial services firm
with $88.5 billion in fee-earning assets at September 30, 2011.
CI provides one of the industry’s widest selections of investment products
and services and a strong lineup of leading portfolio management teams.
Our portfolio management expertise is offered through several platforms,
including mutual funds, tax-efficient funds, segregated funds, and
managed solutions.
2 Queen Street East, Twentieth FloorToronto, Ontario M5C 3G7www.ci.com
Telephone: 416-364-1145Toll Free: 1-800-268-9374Facsimile: 416-364-6299

– 2 –
The CI Funds Board of Governors was voluntarily established by CI in 1998 making it one of the first
such fund governance bodies in Canada.
The Board of Governors acts as an independent governance body the Funds, providing impartial
judgment on conflicts of interest with a view to the best interests of the Funds and investors.
The Board of Governors recommends the best course of action to achieve a fair and reasonable result
on any conflict of interest issues, and CI takes into account its recommendation in accordance with
its fiduciary duty to the Funds. All of the members of the Board are independent of CI.
The Board of Governors mandate is set out in a separate charter and reviewed annually by the Board
to ensure its mandate conforms to the expectations and requirements of Canadian securities
regulators. Along with dealing with conflicts of interest, the mandate provides that the Board acts as
an audit committee for the Funds for the purpose of reviewing the financial statements of the Funds
with the auditors of the Funds and reviews holdings, purchases and sales by the Funds of securities
of The Bank of Nova Scotia and CI Financial Corp.
The Board also reviews and discusses on a regular basis matters including compliance of the Funds
with CI’s relevant policies and procedures, approval of the Funds’ auditors and the fees paid to those
auditors, and the performance of the Board and its members.
The Board of Governors adheres to the requirements set out by Canadian securities regulators in
National Instrument 81-107 Independent Review Committee for Investment Funds which requires all
mutual funds in Canada to have independent review committees.
The Board of Governors are compensated as recommended by the Canadian securities regulators
in their rule and as set out in its mandate. These expenses are paid by CI and charged to the Funds
as part of their administration fee.
The members of the Board of Governors are:
William Harding, Managing Partner, Alpine Asset Advisors AG
Governor since June 2005
Stuart P. Hensman, Corporate Director
Governor since December 2004
Christopher M. Hopper, President, KLQ Mechanical Ltd.
Governor since May 2007
Sharon M. Ranson, President, The Ranson Group
Governor since December 2004
James M. Werry, Corporate Director
Governor since September 2011
Further information regarding the Board is available at www.ci.com including the Board’s full mandate.
About the CI Funds Board of Governors
The Funds Board of Governors is pleased to report on its activities in respect of the semi-annual
period ended September 30, 2011 and to date. The Governors are appointed pursuant to the
Declarations of Trust governing the Funds.
The Governors have reviewed, commented on and approved the CI Code of Ethics and Conduct, which
establishes rules of conduct designed to ensure fair treatment of the Funds’ securityholders and that,
at all times, the interests of the Funds and their securityholders are placed above personal interests
of employees, officers and directors of the Manager and each of its subsidiaries and affiliates, the
subadvisers, and the Governors, through the application of the highest standards of integrity and
ethical business conduct. The CI Code of Ethics and Conduct requires the prior clearance of personal
trades and restricts the ability of staff to trade any securities held by the Funds. The objective is not
only to remove any potential for real conflict of interest but to avoid any perception of conflict. The
Manager's year 2011 report on compliance with the CI Code of Ethics and Conduct and other relevant
policies has been provided to the Governors in a timely and satisfactory manner.
The Governors report that management has been open and cooperative, permitting the Governors to
meet with subadvisers, to meet with individual department heads and personnel to review control
mechanisms and compliance procedures, including those relating to the personal securities trading
activity of employees, and to consider other matters that affect the Funds. During 2011, the Governors
also acted as the audit committee of the Funds. The audit committee reviewed, with the Funds’
auditors, the planning, scope and results of the audit of the financial statements of the Funds for the
year 2011. In November 2011, the Board of Governors received and accepted the Semi-Annual
Financial Statements of the Funds.
Stuart P. Hensman
Chair, Board of Governors
November, 2011
Letter from the CI Funds Board of Governors
Semi-Annual Financial Statements as at September 30, 2011

INDUSTRIALS (11.0%) 32,600 BE Aerospace Inc. 1,138,173 1,131,408 30,200 Chicago Bridge & Iron Co., NV 953,955 906,614 24,600 Corrections Corp. of America 592,053 585,334 7,100 Cummins Inc. 663,347 607,953
26,100 Eaton Corp. 1,066,090 971,480 5,900 FedEx Corp. 508,325 418,248
18,900 Honeywell International Inc. 1,002,311 870,293 17,700 Kansas City Southern de Mexico 677,574 926,540 8,300 Polypore International Inc. 515,299 491,378
18,800 Tyco International Ltd. 843,203 802,235 18,900 Union Pacific Corp. 1,084,755 1,618,947 18,100 WESCO International Inc.* 853,859 635,953
9,898,944 9,966,383 HEALTH CARE (10.9%)
9,800 Allergan Inc. 773,278 846,234 32,600 Allscripts Healthcare Solutions Inc. 603,851 615,765 17,300 Baxter International Inc. 985,859 1,018,394 33,100 Bristol-Myers Squibb Co. 892,460 1,088,044 9,500 Celgene Corp. 625,161 616,591
83,200 Dynavax Technologies Corp. 234,487 160,466 17,100 Humana Inc. 1,018,530 1,303,086 17,700 Sirona Dental Systems Inc. 779,537 785,351 14,400 Thermo Fisher Scientific Inc. 703,042 764,512 27,400 UnitedHealth Group Inc. 1,043,817 1,323,157 18,200 Watson Pharmaceuticals Inc. 975,191 1,302,208
8,635,213 9,823,808 CONSUMER STAPLES (10.4%)
42,200 Altria Group Inc. 931,414 1,185,468 33,700 Coca-Cola Enterprises Inc. 830,371 878,160 6,500 Colgate-Palmolive Co. 543,128 603,861
19,000 Corn Products International Inc. 978,446 781,294 40,300 CVS Corp. 1,381,910 1,418,919 19,000 Kellogg Co.* 1,010,814 1,059,118 14,500 McCormick & Co., Inc. 653,639 701,731 15,200 Mead Johnson Nutrition Co. 846,982 1,097,436 40,300 Sara Lee Corp. 747,516 690,239 15,500 The Hershey Co. 763,711 961,987
8,687,931 9,378,213 CONSUMER DISCRETIONARY (10.3%)
23,400 CBS Corp., Class B 386,475 499,876 13,400 Charter Communications Inc.* 689,416 656,923 15,200 Dollar Tree Stores Inc. 540,242 1,195,581 13,400 Harley-Davidson Inc. 479,947 481,631 15,100 Las Vegas Sands Corp. 684,259 606,678 23,700 Limited Brands Inc. 620,806 956,923 11,500 McDonald's Corp. 592,755 1,058,484 31,600 News Corp. 531,400 512,413 1,000 Priceline.com Inc. 373,086 471,688
22,600 Starbucks Corp. 807,200 883,135 8,500 Tempur-Pedic International Inc. 521,505 468,648
11,800 Tupperware Brands Corp. 713,473 664,942 30,300 Wyndham Worldwide Corp. 755,487 905,170
7,696,051 9,362,092
Synergy American FundStatement of Investment Portfolio as at September 30, 2011 (unaudited)
– 3 – CIG - 622
No. of Shares/ Average FairPar Value Cost ($) Value ($)
No. of Shares/ Average FairPar Value Cost ($) Value ($)
INFORMATION TECHNOLOGY (20.7%) 7,800 Apple Computer Inc. 1,661,846 3,116,746
23,900 Check Point Software Technologies Ltd. 1,093,622 1,321,737 8,500 Citrix Systems Inc. 507,642 485,844
75,400 EMC Corp. 1,530,008 1,659,714 15,700 IAC/InterActiveCorp. 594,442 650,368 8,300 International Business Machines Corp. 1,108,149 1,521,026
36,500 Microsoft Corp. 943,528 952,270 58,600 Oracle Corp. 1,706,081 1,765,334 42,600 QUALCOMM Inc. 1,962,209 2,171,483 18,200 SanDisk Corp. 763,129 769,764 16,600 Sensata Technologies Holdings NV 513,654 460,405 40,300 ServiceSource International Inc.* 694,797 557,598 18,900 SXC Health Solutions Corp. 1,128,675 1,103,467 13,700 Teradata Corp. 679,113 768,132 28,100 TIBCO Software Inc. 706,468 659,482 20,100 VeriFone Systems Inc. 922,945 738,038
16,516,308 18,701,408 FINANCIALS (12.3%)
8,900 ACE Ltd. 556,698 565,334 111,000 American Capital Ltd. 943,966 793,505 26,700 American Express Co. 1,315,192 1,256,329 34,300 Annaly Capital Management Inc. 592,348 597,900 27,200 Assurant Inc. 894,982 1,020,406 9,100 Camden Property Trust 566,074 527,388
25,700 DFC Global Corp. 609,006 588,070 33,900 First Republic Bank 995,427 821,543 6,200 Franklin Resources Inc. 708,981 620,767 6,500 IntercontinentalExchange Inc. 768,777 805,670
16,100 Signature Bank 756,905 804,646 5,000 SVB Financial Group* 291,214 193,759
28,400 The NASDAQ OMX Group Inc. 661,558 688,849 71,700 Wells Fargo & Co. 1,830,662 1,812,754
11,491,790 11,096,920 ENERGY (11.2%)
25,600 Atwood Oceanics Inc. 1,095,589 922,815 19,400 Baker Hughes Inc. 1,297,970 937,647 55,100 Canadian Oil Sands Ltd. 1,513,603 1,120,734 23,600 Carrizo Oil & Gas Inc.* 857,239 532,844 18,400 Chevron Corp. 1,577,855 1,784,801 13,500 Cooper Cameron Corp. 617,723 587,959 15,400 Ensco International PLC, ADR 689,894 652,307 18,400 HollyFrontier Corp. 622,783 505,507 24,500 Marathon Oil Corp. 746,981 554,192 5,700 Noble Energy Inc. 368,088 423,129
13,900 Occidental Petroleum Corp. 1,308,865 1,042,624 20,900 Tesoro Corp. 468,606 426,535 14,200 Vermilion Energy Inc.* 710,906 620,966
11,876,102 10,112,060
*Denotes all or part of securities on loan.Percentages shown in brackets relate investments at fair value to net assets of the Fund.The accompanying notes are an integral part of these financial statements.
Semi-Annual Financial Statements as at September 30, 2011

Synergy American FundStatement of Investment Portfolio as at September 30, 2011 (unaudited) (cont’d)
– 4 –
Percentages shown in brackets relate investments at fair value to net assets of the Fund.The accompanying notes are an integral part of these financial statements.
Schedule AForeign Currency Forward Contracts (-0.7%)
Credit Rating Settlement Contract UnrealizedContracts Counterparty of the Counterparty‡ Date Rate ($) Pay Receive Gain (Loss) ($)
1 Royal Bank of Canada A-1+ 19-Oct-11 1.01 (10,614,015) US $ 10,530,377 Canadian $ (599,858) Total Foreign Currency Forward Contracts Value (599,858)
‡Credit ratings are obtained from Standard & Poor’s, where available, otherwise ratings are obtained from: Moody's Investors Service, Dominion Bond Rating Services or Canadian Bond Rating Services.
Semi-Annual Financial Statements as at September 30, 2011
No. of Shares/ Average FairPar Value Cost ($) Value ($)
MATERIALS (4.7%) 7,500 Ashland Inc. 364,944 347,084 4,300 CF Industries Holdings Inc. 566,428 556,104 6,800 Domtar Corp. (USD) 610,661 485,541
24,800 MeadWestvaco Corp. 752,188 638,444 6,800 Randgold Resources Ltd., ADR 687,010 688,895
17,800 Silgan Holdings Inc. 642,360 685,491 5,400 SPDR Gold Trust 755,240 894,321
4,378,831 4,295,880 TELECOMMUNICATION SERVICES (3.1%)
28,700 American Tower Corp., Class A 1,477,354 1,617,575 33,500 CenturyTel Inc. 1,358,837 1,162,994
2,836,191 2,780,569 UTILITIES (1.7%)
20,000 Edison International 722,439 801,660 15,800 FirstEnergy Corp. 671,469 743,611
1,393,908 1,545,271
Commission and other portfolio transaction costs (90,656)
Total Equities (96.3%) 83,320,613 87,062,604
DERIVATIVE INSTRUMENTS
Foreign Currency Forward Contracts (-0.7%)(see Schedule A) (599,858)
Total Investments (95.6%) 83,320,613 86,462,746
Other Assets (net) (4.4%) 4,071,404
Net Assets (100.0%) 90,534,150

Synergy American FundFinancial Statements (unaudited)
– 5 –Semi-Annual Financial Statements as at September 30, 2011
AssetsInvestments at fair value*CashShort-term investmentsMargin for short salesIncome taxes recoverableDaily variation margin on derivative investmentsUnrealized gain on futures and forward currency contractsCash collateral received for securities on loan (Note 6)Swaps, swaptions and options at fair valueReceivable for unit subscriptionsReceivable for securities soldManagement fee rebate receivableReceivable for dividends and accrued interest
LiabilitiesBank overdraftManagement fees payableAccrued expensesUnrealized loss on futures and forward currency contractsSwaps, swaptions and options at fair valuePayable for securities purchasedPayable for unit redemptionsPayable for cash collateral under securities lending (Note 6)Investments sold short at fair value**Distributions payable
Net assets and unitholders' equity
**Investments at cost**Investments sold short at cost
Net assets per classClass AClass FClass I
Net assets per unit (see Schedule of Net Assets per Unit and Net Asset Value per Unit)
Class AClass FClass I
Number of units outstanding(see Schedule of Fund Unit Transactions)
Class AClass FClass I
IncomeDividendsInterest Securities lending (Note 6)Derivative income (loss)Income distribution from investmentsManagement fee rebateLess: Foreign withholding taxes
ExpensesManagement fees (Note 5)Administrative fees (Note 5)Interest expenseGoods and services tax/Harmonized sales tax
Net investment income (loss) for the period
Realized and unrealized gain (loss) on investments and commissions and other portfolio transaction costs
Realized gain (loss) on investmentsForeign exchange gain (loss)Commissions and other portfolio transaction costsCapital gain distribution from investmentsChange in unrealized appreciation (depreciation)
of investmentsNet gain (loss) on investmentsIncrease (decrease) in net assets from operations
Increase (decrease) in net assets from operations per classClass AClass FClass I
Increase (decrease) in net assets from operationsper unit (Note 2)
Class AClass FClass I
87,063 95,0074,286 5,794
- -- -- -- -- 63- -- -
56 1132,320 633
- -95 49
93,820 101,659
- -- -- -
600 -- -
2,569 1,303117 93
- -- -- -
3,286 1,39690,534 100,263
83,321 82,532- -
55,681 61,319800 925
34,053 38,019
9.94 11.406.01 6.85
11.83 13.40
5,602,014 5,379,439133,072 134,921
2,879,177 2,837,286
669 57514 11 3- -- -- -
(95) (73)589 506
602 55264 58
- -70 47
736 657(147) (151)
(2,775) (1,277)8 5
(154) (171)- -
(9,396) (744)(12,317) (2,187)(12,464) (2,338)
(8,018) (1,738)(114) (22)
(4,332) (578)
(1.45) (0.32)(0.84) (0.16)(1.53) (0.19)
Statements of Operations for the periods ended September 30(in $000’s except for per unit amounts)
2011 2010
Statements of Net Assets(in $000’s except for per unit amounts and units outstanding)
as at as atSeptember 30, 2011 March 31, 2011
The accompanying notes are an integral part of these financial statements.

Synergy American FundFinancial Statements (unaudited)
– 6 –
Class ANet assets, beginning of periodCapital transactions
Proceeds from units issued Reinvested distributions Amounts paid for units redeemed
Distributions to investorsFrom realized gainsFrom net incomeFrom return of capital
Increase (decrease) in net assets from operationsNet assets, end of period
Class FNet assets, beginning of periodCapital transactions
Proceeds from units issued Reinvested distributions Amounts paid for units redeemed
Distributions to investorsFrom realized gainsFrom net incomeFrom return of capital
Increase (decrease) in net assets from operationsNet assets, end of period
Class INet assets, beginning of periodCapital transactions
Proceeds from units issued Reinvested distributions Amounts paid for units redeemed
Distributions to investorsFrom realized gainsFrom net incomeFrom return of capital
Increase (decrease) in net assets from operationsNet assets, end of period
Total FundNet assets, beginning of periodCapital transactions
Proceeds from units issued Reinvested distributions Amounts paid for units redeemed
Distributions to investorsFrom realized gainsFrom net incomeFrom return of capital
Increase (decrease) in net assets from operationsNet assets, end of period
100,263 93,902
15,868 28,480- -
(13,133) (30,614)2,735 (2,134)
- -- -- -- -
(12,464) (2,338)90,534 89,430
61,319 59,105
12,105 6,458- -
(9,725) (9,324)2,380 (2,866)
- -- -- -- -
(8,018) (1,738)55,681 54,501
925 989
135 126- -
(146) (252)(11) (126)
- -- -- -- -
(114) (22)800 841
38,019 33,808
3,628 21,896- -
(3,262) (21,038)366 858
- -- -- -- -
(4,332) (578)34,053 34,088
Statements of Changes in Net Assets for the periods ended September 30 (in $000’s)
2011 2010
The accompanying notes are an integral part of these financial statements.
Statements of Changes in Net Assets (cont’d)for the periods ended September 30 (in $000’s)
2011 2010
Semi-Annual Financial Statements as at September 30, 2011

Synergy American FundFinancial Statements – Supplementary Schedules (unaudited)
– 7 –
Class ABalance, beginning of periodUnits issued for cash Units issued for reinvested distributions Units redeemedBalance, end of period
Class FBalance, beginning of periodUnits issued for cash Units issued for reinvested distributions Units redeemedBalance, end of period
Class IBalance, beginning of periodUnits issued for cash Units issued for reinvested distributions Units redeemedBalance, end of period
Schedule of Securities Lending (Note 6)as at September 30 (in $000’s)
2011 2010
LoanedCollateral (non-cash)
3,504 4,5463,679 4,636
Schedule of Commissionsfor the periods ended September 30 (in $000’s)
2011 2010
Brokerage commissionsSoft Dollar commissions†
154 17012 19
Schedule of Fund Unit Transactions for the periods ended September 30
2011 2010
5,379,439 5,711,8771,125,614 655,216
- -(903,039) (940,371)
5,602,014 5,426,722
134,921 160,74920,819 21,263
- -(22,668) (42,016)133,072 139,996
2,837,286 2,847,211295,956 1,973,289
- -(254,065) (1,897,633)
2,879,177 2,922,867
†A portion of brokerage commissions paid was used to cover research and market data services, termed soft dollar commissions. This amount has been estimated by the Manager of the Fund.The accompanying notes are an integral part of these financial statements.
Semi-Annual Financial Statements as at September 30, 2011
Class ANet assets per unitNet asset value per unit
Class FNet assets per unitNet asset value per unit
Class INet assets per unitNet asset value per unit
9.94 10.049.94 10.05
6.01 6.006.01 6.01
11.83 11.6611.83 11.67
Schedule of Net Assets per Unit and Net Asset Value per Unit (Note 2)as at September 30 (in $)
2011 2010
Annual management fee rateClass AClass FClass I
Annual fixed administration fee rateClass AClass FClass I
2.001.00
Paid directly by investor
0.210.21
-
Schedule of Fees (Note 5)as at September 30 (%)
2011

Synergy American FundFund Specific Financial Instruments Risks (Note 11) (unaudited)
The Fund’s investments were concentrated in the following segments:
as at March 31, 2011
Categories Net Assets (%)
Information Technology ........................................................................................................... 17.5Financials ................................................................................................................................. 15.5Energy ...................................................................................................................................... 14.4Industrials ................................................................................................................................ 12.2Consumer Discretionary........................................................................................................... 9.1Consumer Staples.................................................................................................................... 8.7Health Care .............................................................................................................................. 8.7Other Assets (net) .................................................................................................................... 5.1Materials.................................................................................................................................. 4.6Telecommunication Services ................................................................................................... 2.4Utilities..................................................................................................................................... 1.6Warrants .................................................................................................................................. 0.1Foreign Currency Forward Contracts ....................................................................................... 0.1
For details relating to other price risk, credit risk, currency risk, interest rate risk and fair valuehierarchy, refer to the audited annual financial statements as at March 31, 2011, as the Fund’sexposure to those risks remains unchanged.
– 8 –
The accompanying notes are an integral part of these financial statements.
Semi-Annual Financial Statements as at September 30, 2011

FINANCIALS (14.5%) (cont’d)290,000 Scotiabank Capital Trust, Series 2002-1,
Callable, 6.626% 06/30/2052†† 284,643 299,681 12,700 Sun Life Financial Inc. 382,078 316,484
200,000 Sun Life Financial Inc., 7.9% 03/31/2019 199,732 223,973 1,000,000 TD Capital Trust 10% 06/30/2108 1,393,810 1,387,550
355,000 TD Capital Trust 6.792% 12/31/2049 355,825 375,599 250,000 TD Capital Trust 7.243% 12/31/2018 257,500 300,654 23,574 The Bank of Nova Scotia†† 1,237,383 1,239,285
320,000 The Bank of Nova Scotia 6% 10/03/2018†† 320,602 344,704 6,625 TMX Group Inc. 189,175 269,638
38,500 Toronto-Dominion Bank 2,653,768 2,859,010 230,000 Wells Fargo Financial Canada Corp.,
3.97% 11/03/2014 229,991 239,831 19,224,529 19,570,383
ENERGY (12.1%) 21,150 Advantage Oil & Gas Ltd. 157,191 82,485
198,000 Advantage Oil & Gas Ltd., 5% 01/30/2015 188,589 177,309 141,771 Alliance Pipeline LP 7.181% 06/30/2023 169,334 177,426
USD 418,000 Allis-Chalmers Energy Inc., 9% 01/15/2014 418,110 435,955 1,200 AltaGas Ltd. 33,160 32,496
1,000,000 Anderson Energy Ltd., 7.25% 06/30/2017 1,000,000 750,500 9,500 Angle Energy Inc. 78,477 60,990 5,900 Artek Exploration Ltd. 12,784 9,440 5,250 Baytex Energy Corp.* 168,352 228,480 4,450 Bonavista Energy Corp. 113,894 104,041 1,200 Calfrac Well Services Ltd. 28,074 29,208 3,000 Canadian Energy Services &
Technology Corp. 28,768 31,320 37,812 Canadian Natural Resources Ltd. 1,390,171 1,159,316 13,500 Canadian Oil Sands Ltd. 400,394 274,590 12,011 Canyon Services Group Inc. 162,668 108,459 10,900 Celtic Exploration Ltd.* 202,903 245,359 3,300 Cenovus Energy Inc. 109,365 106,326
25,200 Cequence Energy Ltd. 89,666 85,176 2,230 Crescent Point Energy Corp.* 93,858 87,594 9,500 Enbridge Inc. 223,660 317,775
24,270 EnCana Corp. 781,265 487,827 1,400 Enerflex Ltd. 17,945 12,138
12,400 Fairborne Energy Ltd. 55,974 34,596 2,100 Flint Energy Services Ltd.* 30,218 20,727
1,000,000 Flint Energy Services Ltd.,7.5% 06/15/2019 990,000 975,000
1,700 GasFrac Energy Services Inc.* 17,708 12,631 7,600 Gibson Energy Inc.* 124,303 141,512
12,008 Imperial Oil Ltd. 486,272 451,981 8,900 Inter Pipeline Fund LP 98,672 142,489
2,000,000 Ivanhoe Energy Inc., 5.75% 06/30/2016 2,000,000 1,590,000 7,021 Keyera Corp. 145,135 318,753
11,600 Legacy Oil & Gas Inc. 134,625 93,264 24,675 Mullen Group Ltd. 394,656 463,150 20,900 Nexen Inc. 460,428 339,416 16,500 Open Range Energy Corp. 95,543 145,200
1,000,000 Paramount Resources Ltd., 8.25% 12/13/2017 1,007,500 1,000,000
Synergy Tactical Asset Allocation FundStatement of Investment Portfolio as at September 30, 2011 (unaudited)
– 9 – CIG - 6115
No. of Shares/ Average FairPar Value Cost ($) Value ($)
FUNDS (32.5%) 100 ETFS Palladium Trust 7,414 6,290 100 ETFS Platinum Trust 17,648 15,739
4,436,519 Synergy Global Corporate Class (Z Shares) 54,225,885 43,877,17154,250,947 43,899,200
FINANCIALS (14.5%) 1,700 Allied Properties REIT 38,711 39,406
USD 300,000 Bank of America Corp., Callable, 8% 01/30/2049 295,265 267,337
7,100 Bank of Montreal* 399,193 415,350 350,000 Brookfield Asset Management Inc.,
8.95% 06/02/2014 349,307 402,346 2,900 Canadian Apartment Properties REIT* 49,662 61,190 9,585 Canadian Imperial Bank of Commerce 691,193 700,855
380,000 Canadian Imperial Bank of Commerce 3.05% 06/03/2013 379,799 388,913
2,594 Canadian Western Bank* 49,683 66,484 1,000,000 Canadian Western Bank, FRN,
5.571% 03/22/2022 1,025,830 1,080,728 5,800 Chartwell Seniors Housing REIT 37,002 43,790 1,983 CIT Group Inc. 71,189 63,147
USD 19,274 CIT Group Inc., 7% 05/01/2014 23,958 20,607 USD 561 CIT Group Inc., 7% 05/01/2015 673 584 USD 602 CIT Group Inc., 7% 05/01/2016 694 612 USD 643 CIT Group Inc., 7% 05/01/2017 735 654 USD 57,000 CIT Group Inc., 7% 05/02/2016 65,220 57,955 USD 80,000 CIT Group Inc., 7% 05/02/2017 91,193 81,340 USD 34,000 CIT Group Inc., 7% 05/04/2015 40,485 35,371
345,000 Citigroup Finance Canada Inc., 6.75% 09/22/2014 344,696 370,782
500,000 Dundee International Real Estate Investment Trust 5.5% 01/31/2018 500,000 477,500
8,700 Endeavour Mining Corp.* 22,084 17,226 1,200 H&R REIT 20,119 25,152 3,600 Home Capital Group Inc. 133,781 156,276
14,025 IGM Financial Inc.* 597,450 622,570 13,175 Intact Financial Corp. 566,880 755,059
USD 175,000 JPMorgan Chase & Co., FRN, Callable, 7.9% 04/30/2049 167,249 188,939
350,000 Kimco North Trust III 5.18% 08/16/2013 349,044 364,232 200,000 Manulife Financial Capital Trust
6.7% 12/31/2051 207,075 206,400 63,050 Manulife Financial Corp. 1,066,256 750,295
545,000 Merrill Lynch & Co., Inc., 4.5% 01/30/2012 507,025 548,124 300,000 MI Developments Inc., 6.05% 12/22/2016^ 305,352 304,500
2,700 National Bank of Canada 175,663 188,271 24,868 Power Corporation of Canada 679,390 569,975
225,000 Power Corporation of Canada 7.57% 04/22/2019 224,874 276,491
1,800 Primaris Retail Real Estate Investment Trust 32,735 36,630 6,000 Pure Industrial Real Estate Trust 24,600 22,260
445,000 Royal Bank of Canada 3.27% 11/10/2014 444,938 463,347 210,000 Royal Bank of Canada 5.06% 07/17/2013 210,179 222,456 29,687 Royal Bank of Canada* 1,530,840 1,420,820
^Denotes illiquid securities.*Denotes all or part of securities on loan.
††CI Investments Inc., the Manager, is a corporation controlled by CI Financial Corp. The Bank of Nova Scotia has a significant interest in CI Financial Corp. Investments in The Bank of Nova Scotia are identified above.Percentages shown in brackets relate investments at fair value to net assets of the Fund.The accompanying notes are an integral part of these financial statements.
Semi-Annual Financial Statements as at September 30, 2011
No. of Shares/ Average FairPar Value Cost ($) Value ($)

– 10 –
MATERIALS (9.7%) (cont’d)1,800 Noranda Income Fund 10,836 8,964
10,900 Perseus Mining Ltd. 34,490 33,463 28,600 Potash Corp. of Saskatchewan Inc. 1,185,815 1,295,008 8,200 Quadra FNX Mining Ltd. 120,274 74,620 1,000 Russel Metals Inc. 22,326 20,750
25,000 Russel Metals Inc., Convertible, 7.75% 09/30/2016 27,512 27,000
7,600 Sandspring Resources Ltd. 21,638 11,172 29,000 SEMAFO Inc. 283,172 249,980
500,000 Sherritt International Corp., 7.75% 10/15/2015 509,295 530,792
5,400 Silver Wheaton Corp. 186,553 166,536 802 SPDR Gold Trust 122,313 132,823
26,050 Teck Resources Ltd., Class B 1,100,386 797,130 USD 500,000 Tembec Industries Inc., 11.25% 12/15/2018 485,519 500,514
2,000 Thompson Creek Metals Co., Inc.* 22,645 12,700 1,000,000 Trident Exploration Corp.,
8.25% 04/13/2018 1,000,000 932,500 4,800 Yamana Gold Inc. 68,152 68,784
13,433,226 13,097,002 CONSUMER DISCRETIONARY (7.9%)
USD 500,000 Asbury Automotive Group Inc., 7.625% 03/15/2017 508,587 500,514
USD 1,500,000 Brown Shoe Co., Inc., 7.125% 05/15/2019 1,432,232 1,328,588
1,000,000 Canadian Satellite Radio Holdings Inc., 9.75% 06/21/2018 1,020,000 1,016,250
10,400 Canadian Tire Corp., Ltd., Class A, Non-Voting Shares 588,122 592,696
USD 1,068,750 Cenage Learning Holdco Inc., 13.75% 07/15/2015 1,087,664 638,548
USD 200,000 Chrysler Group LLC 8% 06/15/2019 193,650 163,519 3,600 Cineplex Inc. 67,706 94,680 9,400 Corus Entertainment Inc., Class B 167,129 184,804 6,400 Dollarama Inc. 181,088 231,680
14,300 Gildan Activewear Inc.* 423,302 387,387 800 Las Vegas Sands Corp. 36,382 32,142
8,200 Linamar Corp. 142,236 111,028 26,785 Magna International Inc., Class A 874,926 925,154
USD 391,000 PEP Boys-Manny Moe & Jack 7.5% 12/15/2014 404,373 408,820
USD 900,000 Phillips-Van Heusen Corp., 7.75% 11/15/2023 1,024,497 996,621
1,500,000 Quebecor Media Inc., 7.375% 01/15/2021 1,500,000 1,468,750 3,000 Quebecor World Inc., Class B 79,204 99,450
300,000 Shaw Communications Inc.,5.65% 10/01/2019 299,049 320,176
16,825 Shaw Communications Inc., Class B 354,078 356,354 USD 255,000 Steinway Musical Instruments Inc.,
7% 03/01/2014 260,199 267,290 12,630 Thomson Corp. 457,067 358,187
215,000 Thomson Reuters Corp., 5.7% 07/15/2015 214,609 240,825 1,100 Torstar Corp., Class B 11,082 8,668
11,327,182 10,732,131
Synergy Tactical Asset Allocation FundStatement of Investment Portfolio as at September 30, 2011 (unaudited) (cont’d)
No. of Shares/ Average FairPar Value Cost ($) Value ($)
ENERGY (12.1%) (cont’d)700 Petrominerales Ltd. 24,289 14,371
5,400 Peyto Exploration & Development Corp. 95,494 107,298 1,600 PHX Energy Services Corp. 18,997 14,768
49,755 Precision Drilling Corp. 419,571 431,873 500,000 Precision Drilling Corp., 6.5% 03/15/2019 511,250 494,398
7,900 Progress Energy Resources Corp.* 104,685 101,515 20,275 Savanna Energy Services Corp. 138,545 147,399 1,100 ShawCor Ltd., Class A, Sub-Voting Shares 30,247 26,631 4,800 SouthGobi Energy Resources Ltd.* 69,630 31,632
56,776 Suncor Energy Inc. 1,874,180 1,514,216 290,000 Suncor Energy Inc. 5.8% 05/22/2018 249,646 334,067
4,900 Surge Energy Inc. 42,842 36,113 28,030 Talisman Energy Inc. 498,097 359,905
275,000 Terasen Gas Vancouver Island Inc., 6.05% 02/15/2038 274,810 342,068
16,082 Tourmaline Oil Corp. 362,263 493,235 27,241 Trican Well Service Ltd. 418,168 403,984 11,400 Trilogy Energy Corp. 171,666 306,546 17,300 Veresen Inc. 187,620 253,272 3,700 Vermilion Energy Inc.* 155,622 161,801 4,600 Wild Stream Exploration Inc. 33,104 39,560
17,590,388 16,347,581 MATERIALS (9.7%)
11,055 Agrium Inc. 787,794 771,086 8,500 Alamos Gold Inc. 120,195 133,195 3,800 Anvil Mining Ltd.* 19,391 29,070 6,600 AuRico Gold Inc.* 66,288 64,680 2,200 Aurizon Mines Ltd. 15,103 11,726
64,300 B2Gold Corp. 140,397 250,127 41,075 Barrick Gold Corp. 1,874,051 2,009,800 8,567 Cameco Corp. 232,477 164,572 2,700 Canam Manac Group Inc., Class A 18,954 10,422 2,400 Canfor Pulp Products Inc. 28,864 29,640 5,600 CCL Industries Inc., Class B 159,905 156,352 4,100 Chemtrade Logistics Income Fund 56,802 50,922
USD 500,000 Compass Minerals International Inc., 8% 06/01/2019 528,005 547,682
USD 500,000 Ferro Corp., 7.875% 08/15/2018 521,558 524,098 3,500 First Majestic Silver Corp. 51,864 55,720
17,150 Goldcorp Inc. 771,716 819,942 4,500 Harry Winston Diamond Corp.* 69,254 47,790 2,700 Imperial Metals Corp. 63,921 51,705
29,200 Intrepid Mines Ltd. 52,597 26,864 2,400 Kirkland Lake Gold Inc. 29,435 40,536
11,700 Labrador Iron Ore Royalty Corp. 300,608 386,802 11,100 Lundin Mining Corp. 67,908 40,515 12,900 Major Drilling Group International Inc. 143,493 130,650 2,800 Methanex Corp. 64,263 61,124 4,200 Minefinders Corp.* 60,594 60,774 2,500 Neo Material Technologies Inc. 15,242 15,950
USD 1,825,000 Neo Material Technologies Inc., 5% 12/31/2017 1,764,056 1,578,190
11,800 New Gold Inc.* 112,370 127,204 31,200 New Millenium Iron Corp. 95,195 37,128
*Denotes all or part of securities on loan.Percentages shown in brackets relate investments at fair value to net assets of the Fund.The accompanying notes are an integral part of these financial statements.
Semi-Annual Financial Statements as at September 30, 2011
No. of Shares/ Average FairPar Value Cost ($) Value ($)

– 11 –
ASSET BACKED SECURITIES (5.6%) (cont’d)214,000 Merrill Lynch Financial Assets Inc.,
5.843% 06/12/2035 193,820 222,581 924,000 Merrill Lynch Financial Assets Inc.,
6.45% 06/12/2035 867,618 938,880 2,824,000 Real Estate Asset Liquidity Trust
4.805% 10/12/2015 2,631,953 2,800,743 191,000 Schooner Trust 5.088% 04/12/2020 168,080 194,313
7,161,727 7,621,275 CONSUMER STAPLES (2.6%)
2,600 Alliance Grain Traders Inc. 54,530 57,252 USD 1,575,000 Central Garden and Pet Co.,
8.25% 03/01/2018 1,592,319 1,576,618 4,741 Empire Co., Ltd., Class A 237,281 271,754 2,767 George Weston Ltd. 193,431 191,310
300,000 Metro Inc., 5.97% 10/15/2035 285,885 315,038 4,100 Viterra Inc. 43,531 42,148
USD 900,000 Viterra Inc., 5.95% 08/01/2020 877,506 1,001,215 3,284,483 3,455,335
INFORMATION TECHNOLOGY (2.3%) 9,000 Alcatel-Lucent SA 43,967 26,603
35,918 CGI Group Inc. 524,403 707,944 1,000 Check Point Software Technologies Ltd. 53,773 55,303
USD 1,000,000 Earthlink Inc., 8.875% 05/15/2019 929,200 919,792 2,100 Exfo Electro-Optical Engineering Inc.* 14,532 13,314 3,600 MacDonald Dettwiler & Associates Ltd. 137,299 170,748 1,100 Mosaid Technologies Inc. 25,822 41,591
12,211 Open Text Corp.* 580,737 663,912 11,400 Research In Motion Ltd. 683,864 242,364 8,100 Sandvine Corp. 14,996 12,150 1,400 SXC Health Solutions Inc.* 75,037 81,662 1,100 VeriFone Systems Inc. 46,945 40,390
11,800 Wi-Lan Inc. 83,803 71,862 2,400 Zarlink Semiconductor Inc.* 4,516 9,504
3,218,894 3,057,139 TELECOMMUNICATION SERVICES (2.0%)
6,100 BCE Inc. 189,836 239,303 USD 1,000,000 Centel Capital Corp., 9% 10/15/2019 1,090,660 1,180,185 USD 1,000,000 ITC DeltaCom Inc., 10.5% 04/01/2016 1,007,520 1,069,160
1,900 Manitoba Telecom Services Inc. 62,309 61,598 3,600 TELUS Corp. 178,325 184,536
2,528,650 2,734,782 UTILITIES (1.3%)
500,000 Algonquin Power & Utilities Corp., 5.5% 07/25/2018 499,140 521,354
4,283 Atco Ltd., Class I 201,069 263,447 2,811 Brookfield Renewable Power Fund 44,814 72,355
200,000 Brookfield Renewable Power Inc., 5.84% 11/05/2036 200,791 188,502
200,000 Brookfield Renewable Power Inc., 6.132% 11/30/2016 200,000 221,854
2,200 Northland Inc. 31,916 35,266 285,000 Reliance LP 7.3% 04/03/2013 285,000 297,959
4,300 TransAlta Corp. 93,875 98,083 1,556,605 1,698,820
Synergy Tactical Asset Allocation FundStatement of Investment Portfolio as at September 30, 2011 (unaudited) (cont’d)
No. of Shares/ Average FairPar Value Cost ($) Value ($)
INDUSTRIALS (6.8%) 9,200 5N Plus Inc. 75,512 66,332
700,000 Air Canada 10.125% 08/01/2015 722,750 686,000 77,000 Air Canada, Class B 252,120 112,420
USD 500,000 Alliant Techsystems Inc., 6.75% 04/01/2016 502,373 525,408 170,000 AltaLink Investments LP 5.207% 12/16/2016 170,000 187,440
USD 500,000 Altra Holdings Inc., 8.125% 12/01/2016 537,600 534,580 9,800 ATS Automation Tooling Systems Inc. 66,819 59,780
186,655 Bombardier Inc., Class B, Sub-Voting Shares 1,026,869 679,424 9,755 CAE Inc. 92,002 95,892 1,100 Canadian Helicopters Group Inc. 25,600 24,420
15,197 Canadian National Railway Co. 827,648 1,059,991 6,425 Canadian Pacific Railway Ltd. 365,582 323,370
11,827 Celestica Inc. 109,548 89,530 2,800 Chorus Aviation Inc. 14,604 10,752
39,200 Eastern Platinum Ltd. 36,547 27,440 1,350 Exchange Income Corp. 27,117 25,677
14,200 Finning International Inc. 309,425 271,788 250,000 Finning International Inc., 5.16% 09/03/2013 249,985 265,851
USD 500,000 Gibraltar Industries Inc., 8% 12/01/2015 509,036 497,893 1 Greater Toronto Airports Authority
6.45% 07/30/2029 1 1 300,000 Holcim Finance Canada Inc.,
5.9% 06/21/2013 299,583 313,587 530,000 Iron Mountain Inc., 7.5% 03/15/2017 536,625 524,790 500,000 Livingston International Inc.,
10.125% 11/09/2015 520,833 520,278 4,400 Newalta Inc. 34,473 50,820 3,700 Onex Corp. 104,670 119,954 2,400 Progressive Waste Solutions Ltd. 47,463 51,768 4,100 Pure Technologies Ltd. 16,824 12,997 4,500 Rocky Mountain Dealership Inc. 45,388 39,600
1,250,000 Skylink Aviation Inc., 12.25% 03/15/2016 1,253,750 1,240,625 3,100 SNC-Lavalin Group Inc. 147,375 135,873
250,000 Superior Plus Corp., 6% 06/30/2018 234,688 179,375 2,100 The Churchill Corp., Class A* 40,855 27,321 2,600 TransForce Inc. 34,900 26,754 3,400 Wajax Corp. 114,232 108,222
19,475 WestJet Airlines Ltd. 256,975 250,448 2,100 Westshore Terminals Investment Corp. 48,721 45,948
9,658,493 9,192,349 ASSET BACKED SECURITIES (5.6%)
400,000 CCIC 2006-WEM, MBS, A2, 4.934% 01/15/2022 399,986 435,464
1,300,000 Ford Auto Securitization Trust 1.926% 06/15/2013 510,210 510,864
1,000,000 Ford Auto Securitization Trust 4.526% 03/15/2017 1,001,250 1,015,690
500,000 Merrill Lynch Financial Assets Inc., 4.715% 11/12/2037 487,750 517,703
1,000,000 Merrill Lynch Financial Assets Inc., 5.04% 03/12/2039 901,060 985,037
*Denotes all or part of securities on loan.Percentages shown in brackets relate investments at fair value to net assets of the Fund.The accompanying notes are an integral part of these financial statements.
Semi-Annual Financial Statements as at September 30, 2011
No. of Shares/ Average FairPar Value Cost ($) Value ($)

– 12 –
Synergy Tactical Asset Allocation FundStatement of Investment Portfolio as at September 30, 2011 (unaudited) (cont’d)
No. of Shares/ Average FairPar Value Cost ($) Value ($)
HEALTH CARE (0.7%) 850 Centric Health Corp. 1,020 1,300
1,900 Paladin Labs Inc. 44,239 69,122 USD 493,000 Patheon Inc., 8.625% 04/15/2017 529,170 439,247 USD 265,000 Select Medical Corp., 7.625% 02/01/2015 266,286 240,620
5,000 Valeant Pharmaceuticals International Inc. 187,270 194,400 1,027,985 944,689
CANADIAN GOVERNMENT BONDS (0.5%) 600,000 City of Toronto 5.05% 07/18/2017 598,368 684,453
WARRANTS (0.0%) 500 Catch the Wind Ltd., Warrants (21Apr12) – – 435 Franco-Nevada Corp., Warrants (08Jul13) – 154
1,086 Kinross Gold Corp., Warrants (17Sep14) – 2,650 800 Laramide Resources Ltd., Warrants (05Mar12) – –
3,000 Metalex Ventures Ltd., Warrants (06Oct11) – – 1,450 Wavefront Technology Solutions Inc.,
Warrants (26Apr12) – 11 – 2,815
Commission and other portfolio transaction costs (51,273)
Total Bonds & Equities (98.5%) 144,810,204 133,037,954
DERIVATIVE INSTRUMENTS
Foreign Currency Forward Contracts (-0.7%)(see Schedule A) (914,899)
Total Investments (97.8%) 144,810,204 132,123,055
Other Assets (net) (2.2%) 2,928,474
Net Assets (100.0%) 135,051,529
Principal amounts stated in:USD U.S. Dollar
Percentages shown in brackets relate investments at fair value to net assets of the Fund.The accompanying notes are an integral part of these financial statements.
Semi-Annual Financial Statements as at September 30, 2011
Schedule AForeign Currency Forward Contracts (-0.7%)
Credit Rating Settlement Contract UnrealizedContracts Counterparty of the Counterparty‡ Date Rate ($) Pay Receive Gain (Loss) ($)
1 Royal Bank of Canada A-1+ 19-Oct-11 1.01 (16,188,418) US $ 16,060,853 Canadian $ (914,899) Total Foreign Currency Forward Contracts Value (914,899)
‡Credit ratings are obtained from Standard & Poor’s, where available, otherwise ratings are obtained from: Moody's Investors Service, Dominion Bond Rating Services or Canadian Bond Rating Services.
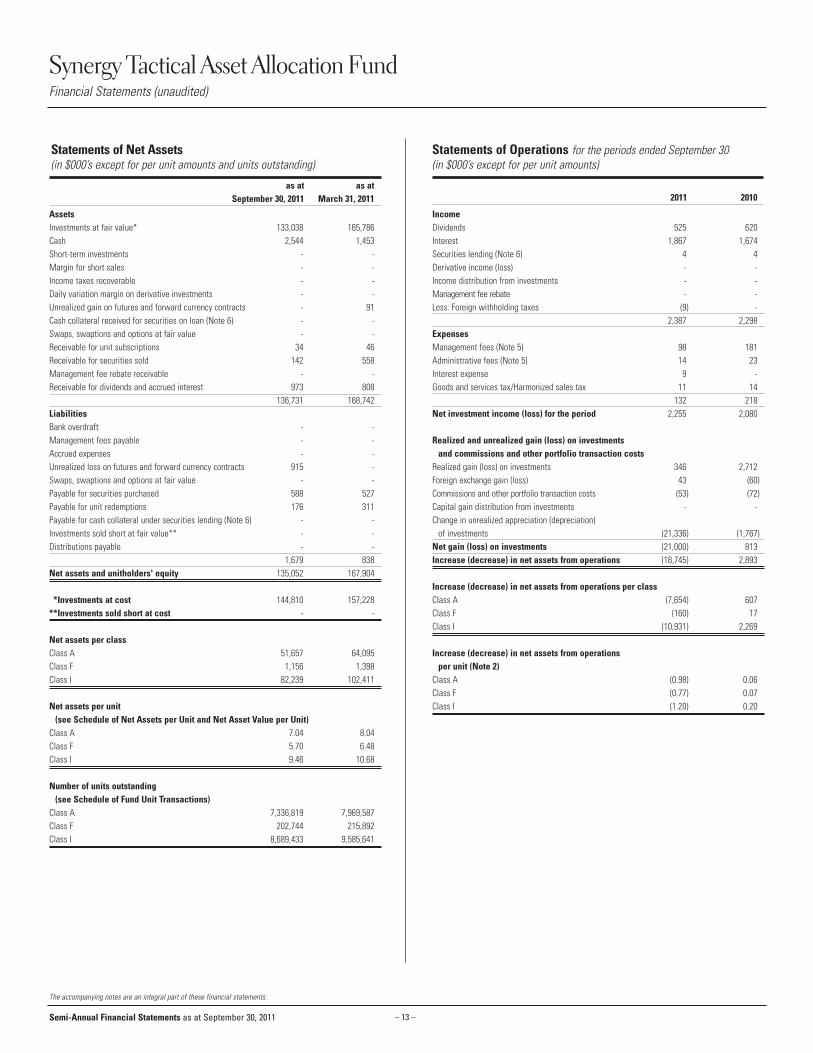
Synergy Tactical Asset Allocation FundFinancial Statements (unaudited)
– 13 –Semi-Annual Financial Statements as at September 30, 2011
AssetsInvestments at fair value*CashShort-term investmentsMargin for short salesIncome taxes recoverableDaily variation margin on derivative investmentsUnrealized gain on futures and forward currency contractsCash collateral received for securities on loan (Note 6)Swaps, swaptions and options at fair valueReceivable for unit subscriptionsReceivable for securities soldManagement fee rebate receivableReceivable for dividends and accrued interest
LiabilitiesBank overdraftManagement fees payableAccrued expensesUnrealized loss on futures and forward currency contractsSwaps, swaptions and options at fair valuePayable for securities purchasedPayable for unit redemptionsPayable for cash collateral under securities lending (Note 6)Investments sold short at fair value**Distributions payable
Net assets and unitholders' equity
**Investments at cost**Investments sold short at cost
Net assets per classClass AClass FClass I
Net assets per unit (see Schedule of Net Assets per Unit and Net Asset Value per Unit)
Class AClass FClass I
Number of units outstanding(see Schedule of Fund Unit Transactions)
Class AClass FClass I
IncomeDividendsInterest Securities lending (Note 6)Derivative income (loss)Income distribution from investmentsManagement fee rebateLess: Foreign withholding taxes
ExpensesManagement fees (Note 5)Administrative fees (Note 5)Interest expenseGoods and services tax/Harmonized sales tax
Net investment income (loss) for the period
Realized and unrealized gain (loss) on investments and commissions and other portfolio transaction costs
Realized gain (loss) on investmentsForeign exchange gain (loss)Commissions and other portfolio transaction costsCapital gain distribution from investmentsChange in unrealized appreciation (depreciation)
of investmentsNet gain (loss) on investmentsIncrease (decrease) in net assets from operations
Increase (decrease) in net assets from operations per classClass AClass FClass I
Increase (decrease) in net assets from operationsper unit (Note 2)
Class AClass FClass I
133,038 165,7862,544 1,453
- -- -- -- -- 91- -- -
34 46142 558
- -973 808
136,731 168,742
- -- -- -
915 -- -
588 527176 311
- -- -- -
1,679 838135,052 167,904
144,810 157,228- -
51,657 64,0951,156 1,398
82,239 102,411
7.04 8.045.70 6.489.46 10.68
7,336,819 7,969,587202,744 215,892
8,689,433 9,585,641
525 6201,867 1,674
4 4- -- -- -
(9) -2,387 2,298
98 18114 239 -
11 14132 218
2,255 2,080
346 2,71243 (60)(53) (72)
- -
(21,336) (1,767)(21,000) 813(18,745) 2,893
(7,654) 607(160) 17
(10,931) 2,269
(0.98) 0.06(0.77) 0.07(1.20) 0.20
Statements of Operations for the periods ended September 30(in $000’s except for per unit amounts)
2011 2010
Statements of Net Assets(in $000’s except for per unit amounts and units outstanding)
as at as atSeptember 30, 2011 March 31, 2011
The accompanying notes are an integral part of these financial statements.
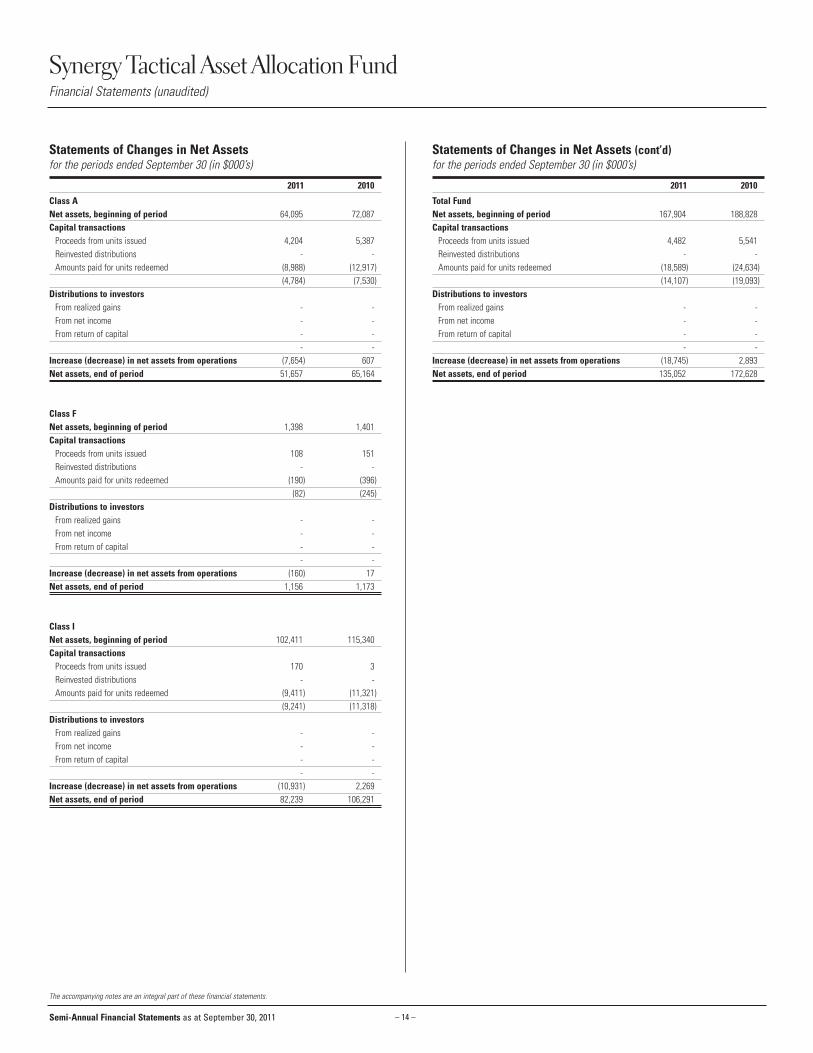
Synergy Tactical Asset Allocation FundFinancial Statements (unaudited)
– 14 –
Class ANet assets, beginning of periodCapital transactions
Proceeds from units issued Reinvested distributions Amounts paid for units redeemed
Distributions to investorsFrom realized gainsFrom net incomeFrom return of capital
Increase (decrease) in net assets from operationsNet assets, end of period
Class FNet assets, beginning of periodCapital transactions
Proceeds from units issued Reinvested distributions Amounts paid for units redeemed
Distributions to investorsFrom realized gainsFrom net incomeFrom return of capital
Increase (decrease) in net assets from operationsNet assets, end of period
Class INet assets, beginning of periodCapital transactions
Proceeds from units issued Reinvested distributions Amounts paid for units redeemed
Distributions to investorsFrom realized gainsFrom net incomeFrom return of capital
Increase (decrease) in net assets from operationsNet assets, end of period
Total FundNet assets, beginning of periodCapital transactions
Proceeds from units issued Reinvested distributions Amounts paid for units redeemed
Distributions to investorsFrom realized gainsFrom net incomeFrom return of capital
Increase (decrease) in net assets from operationsNet assets, end of period
167,904 188,828
4,482 5,541- -
(18,589) (24,634)(14,107) (19,093)
- -- -- -- -
(18,745) 2,893135,052 172,628
64,095 72,087
4,204 5,387- -
(8,988) (12,917)(4,784) (7,530)
- -- -- -- -
(7,654) 60751,657 65,164
1,398 1,401
108 151- -
(190) (396)(82) (245)
- -- -- -- -
(160) 171,156 1,173
102,411 115,340
170 3- -
(9,411) (11,321)(9,241) (11,318)
- -- -- -- -
(10,931) 2,26982,239 106,291
Statements of Changes in Net Assets for the periods ended September 30 (in $000’s)
2011 2010
The accompanying notes are an integral part of these financial statements.
Statements of Changes in Net Assets (cont’d)for the periods ended September 30 (in $000’s)
2011 2010
Semi-Annual Financial Statements as at September 30, 2011

Synergy Tactical Asset Allocation FundFinancial Statements – Supplementary Schedules (unaudited)
– 15 –
Class ABalance, beginning of periodUnits issued for cash Units issued for reinvested distributions Units redeemedBalance, end of period
Class FBalance, beginning of periodUnits issued for cash Units issued for reinvested distributions Units redeemedBalance, end of period
Class IBalance, beginning of periodUnits issued for cash Units issued for reinvested distributions Units redeemedBalance, end of period
Schedule of Securities Lending (Note 6)as at September 30 (in $000’s)
2011 2010
LoanedCollateral (non-cash)
3,597 9,4963,777 9,704
Schedule of Commissionsfor the periods ended September 30 (in $000’s)
2011 2010
Brokerage commissionsSoft Dollar commissions†
52 714 8
Schedule of Fund Unit Transactions for the periods ended September 30
2011 2010
7,969,587 9,839,450541,477 748,872
- -(1,174,245) (1,794,625)7,336,819 8,793,697
215,892 237,37916,938 26,123
- -(30,086) (68,026)202,744 195,476
9,585,641 11,846,98716,996 350
- -(913,204) (1,179,529)
8,689,433 10,667,808
†A portion of brokerage commissions paid was used to cover research and market data services, termed soft dollar commissions. This amount has been estimated by the Manager of the Fund.The accompanying notes are an integral part of these financial statements.
Semi-Annual Financial Statements as at September 30, 2011
Class ANet assets per unitNet asset value per unit
Class FNet assets per unitNet asset value per unit
Class INet assets per unitNet asset value per unit
7.04 7.417.06 7.41
5.70 6.005.71 6.00
9.46 9.969.48 9.97
Schedule of Net Assets per Unit and Net Asset Value per Unit (Note 2)as at September 30 (in $)
2011 2010
Annual management fee rateClass AClass FClass I
Annual fixed administration fee rateClass AClass FClass I
1.950.95
Paid directly by investor
0.220.22
-
Schedule of Fees (Note 5)as at September 30 (%)
2011

Synergy Tactical Asset Allocation FundFund Specific Financial Instruments Risks (Note 11) (unaudited)
The Fund’s investments were concentrated in the following segments:
as at March 31, 2011
Categories Net Assets (%)
Funds ........................................................................................................................................ 30.7Financials ................................................................................................................................. 15.0Energy ...................................................................................................................................... 10.5Consumer Discretionary........................................................................................................... 10.4Materials.................................................................................................................................. 10.3Industrials ................................................................................................................................ 8.5Asset Backed Securities .......................................................................................................... 5.5Information Technology ........................................................................................................... 2.3Consumer Staples.................................................................................................................... 1.7Canadian Government Bonds .................................................................................................. 1.3Health Care .............................................................................................................................. 1.3Other Assets (net) .................................................................................................................... 1.1Utilities..................................................................................................................................... 0.7Telecommunication Services ................................................................................................... 0.6Foreign Currency Forward Contracts ....................................................................................... 0.1
During the six-month period the Fund’s exposure to other price risk, credit risk, currency risk and fair value hierarchy changed significantly as disclosed in the section below. For details relating tointerest rate risk, refer to the audited annual financial statements as at March 31, 2011, as theFund’s exposure to interest rate risk remains unchanged.
Other Price RiskAs at September 30, 2011 and March 31, 2011, the Fund was invested in Canadian equities andtherefore was sensitive to changes in general economic conditions in Canada, however some of theFund's assets were invested in fixed income securities and their market risk exposure is describedbelow.
As at September 30, 2011, had the Canadian markets increased or decreased by 10% (March 31,2011 - 10%), with all other variables held constant, net assets of the Fund would have increased ordecreased, respectively, by approximately $8,409,000 (March 31, 2011 - $11,164,000). In practice,actual results may differ from this analysis and the difference may be material.
Credit RiskThe Fund was invested in fixed income securities, preferred securities and derivative instruments, asapplicable, with the following credit ratings:
as at September 30, 2011*Credit Rating^ Net Assets (%)AAA/Aaa/A++ 1.2 AA/Aa/A+ 1.2 A 7.2 BBB/Baa/B++ 7.3 BB/Ba/B+ 2.7 B 11.3 CCC/Caa/C++ 0.2 Not Rated 5.1 Total 36.2
– 16 –
The accompanying notes are an integral part of these financial statements.
Credit Risk (cont’d)
as at March 31, 2011*Credit Rating^ Net Assets (%)AAA/Aaa/A++ 2.3 AA/Aa/A+ 1.6 A 6.9 BBB/Baa/B++ 6.7 BB/Ba/B+ 3.4 B 9.9 CCC/Caa/C++ 0.3 Not Rated 1.2 Total 32.3
x*Credit ratings are obtained from Standard & Poor’s, where available, otherwise ratings areobtained from: Moody's Investors Service, Dominion Bond Rating Services or Canadian BondRating Services, respectively.
^Refer to Note 11 for Credit Rating cross reference.
Currency RiskThe tables below summarize the Fund's exposure to currency risk.
as at September 30, 2011Financial Instruments Derivatives Total Currency Net
Exposure Exposure Exposure AssetsCurrency (in $000’s) (in $000’s) (in $000’s) (%)US Dollar 17,790 (16,969) 821 0.6 Total 17,790 (16,969) 821 0.6
as at March 31, 2011Financial Instruments Derivatives Total Currency Net
Exposure Exposure Exposure AssetsCurrency (in $000’s) (in $000’s) (in $000’s) (%)Australian Dollar 911 - 911 0.5 US Dollar 17,024 (16,669) 355 0.2 Total 17,935 (16,669) 1,266 0.7
As at September 30, 2011, had the Canadian dollar strengthened or weakened by 10% (March 31,2011- 10%) in relation to all other foreign currencies held in the Fund, with all other variablesheld constant, net assets of the Fund would have decreased or increased, respectively, byapproximately $82,000 (March 31, 2011 - $127,000). In practice, actual results may differ from thisanalysis and the difference may be material.
Semi-Annual Financial Statements as at September 30, 2011

– 17 –
Synergy Tactical Asset Allocation FundFund Specific Financial Instruments Risks (Note 11) (unaudited) (cont’d)
Fair Value HierarchyThe tables below summarize the inputs used by the Fund in valuing the Fund’s investments andderivatives carried at fair value.
Long Positions at fair value as at September 30, 2011Level 1 Level 2 Level 3 Total
(in $000's) (in $000's) (in $000's) (in $000's)Equities 40,140 44 – 40,184 Bonds – 41,026 305 41,331 Asset-backed securities – 7,621 – 7,621 Funds 43,899 – – 43,899 Warrants 3 – – 3 Foreign currency forward contracts, net – (915) – (915)Total 84,042 47,776 305 132,123
The accompanying notes are an integral part of these financial statements.
Fair Value Hierarchy (cont’d)
Long Positions at fair value as at March 31, 2011Level 1 Level 2 Level 3 Total
(in $000's) (in $000's) (in $000's) (in $000's)
Equities 60,101 11 – 60,112 Bonds – 44,833 – 44,833 Asset-backed securities – 7,336 1,976 9,312 Funds 51,525 – – 51,525 Warrants 4 – – 4 Foreign currency forward contracts, net – 91 – 91 Total 111,630 52,271 1,976 165,877
There were no transfers between Level 1 and 2 and Level 1 and 3 during 2011 and 2010.
Semi-Annual Financial Statements as at September 30, 2011
The tables below summarize the movement in financial instruments classified as Level 3.
for the period ended September 30, 2011Change in
Balance at Net transfers Realized gain unrealized gain Balance atMarch 31, 2011 Purchases Sales in (out) (loss) (loss)* September 30, 2011
(in $000's) (in $000's) (in $000's) (in $000's) (in $000's) (in $000's) (in $000's) Long Positions/Assets:Bonds – – – 305 – – 305 Asset-backed securities 1,976 – (989) (1,001) (12) 26 – Total 1,976 – (989) (696) (12) 26 305
*Change in unrealized gain (loss) related to investments held at September 30, 2011 was ($852).
During the period, fixed income investments with a net fair value of $305,000 were transferred into Level 3 out of Level 2 as observable market inputs were no longer available for these investments and fixed incomeinvestments with a net fair value of $1,001,000 were transferred out of Level 3 into Level 2 as observable market inputs became available for these investments.
for the year ended March 31, 2011Change in
Balance at Net transfers Realized gain unrealized gain Balance atMarch 31, 2010 Purchases Sales in (out) (loss) (loss)* March 31, 2011
(in $000's) (in $000's) (in $000's) (in $000's) (in $000's) (in $000's) (in $000's) Long Positions/Assets:Equities 152 – (177) – 20 5 – Asset-backed securities – 2,003 – – – (27) 1,976 Total 152 2,003 (177) – 20 (22) 1,976
*Change in unrealized gain (loss) related to investments held at March 31, 2011 was ($26,100).
Investments classified as Level 3 are valued at fair value based on unobservable inputs and assumptions, which may include credit spreads, industry multipliers and discount rates. Management has assessed thatthe effect of changing these inputs to reasonably possible alternatives would not have a significant impact on the net assets of the Fund as at September 30, 2011 and March 31, 2011.

– 18 –
CI Mutual FundsNotes to the Financial Statements as at September 30, 2011 (unaudited)
Semi-Annual Financial Statements as at September 30, 2011
1. THE FUNDS
The following funds are open-ended mutual fund trusts created under the laws of Ontario by declarations of trust. “Inception Date” is the date upon which units of a class of a Fund were first sold to the public under prospectus.
Inception Date:
Class A Class C Class F Class I Insight Class Z
CI Funds
CI Alpine Growth Equity Fund May 1, 97 – Dec. 13, 99 – – –
Cambridge American Equity Fund May 25, 89 – Jul. 17, 00 Jul. 31, 01 – –
(formerly CI American Equity Fund)
CI American Small Companies Fund Sep. 9, 86 – Jul. 17, 00 Jul. 31, 01 – –
CI American Value Fund May 27, 57 – Aug. 30, 00 Nov. 1, 96 Jul. 15, 03 –
CI Canadian Investment Fund Nov. 16, 32 – Aug. 30, 00 Nov. 1, 96 Jul. 15, 03 –
CI Canadian Small/Mid Cap Fund Nov. 1, 92 – Dec. 13, 99 – Jun. 20, 05 –
CI Emerging Markets Fund Sep. 10, 91 – Jul. 17, 00 Jul. 31, 01 – –
CI European Fund Sep. 10, 91 – Jul. 31, 01 Jul. 23, 04 – –
CI Global Bond Fund Aug. 31, 92 – Jul. 17, 00 Jul. 31, 01 Jul. 15, 03 –
CI Global Fund Feb. 28, 86 – Jul. 17, 00 Jul. 31, 01 Jul. 15, 03 –
CI Global High Dividend Advantage Fund Jan. 23, 06 – Feb. 23, 06 Feb. 23, 06 – –
CI Global Small Companies Fund Apr. 7, 93 – Jul. 17, 00 Jul. 31, 01 Jul. 15, 03 –
CI Global Value Fund Jun. 12, 96 – Jul. 17, 00 Jul. 31, 01 – –
CI Income Advantage Fund Sep. 17, 10 Sep. 17, 10 Sep. 17, 10 Jul. 13, 10 – –
CI International Balanced Fund Sep. 29, 94 – Jul. 17, 00 Jul. 31, 01 – –
CI International Fund Aug. 5, 99 – Jul. 17, 00 Jul. 13, 03 Jul. 15, 03 –
CI International Value Fund Jun. 12, 96 – Jul. 31, 01 Jul. 31, 01 Jul. 15, 03 –
CI Money Market Fund Oct. 1, 90 – Jul. 31, 01 Jul. 31, 01 Jul. 15, 03 Jul. 14, 10
CI Pacific Fund Oct. 31, 81 – Jul. 17, 00 Jun. 20, 05 – –
CI US Money Market Fund Jan. 30, 95 – – – – –
Class A Class F Class I Class W
Portfolio Select Series
Select Canadian Equity Managed Fund – – Nov. 22, 06 –
Select International Equity Managed Fund – – Nov. 22, 06 –
Select Staging Fund Nov. 7, 05 Nov. 7, 05 Nov. 7, 05 Nov. 7, 05
Select U.S. Equity Managed Fund – – Nov. 22, 06 –
Class A Class F Class I Class Z
Harbour Funds
Harbour Fund Jun. 27, 97 Jul. 17, 00 Jul. 31, 01 –
Harbour Growth & Income Fund Jun. 27, 97 Jul. 31, 01 Jul. 31, 01 Jul. 15, 03
Class A Class F Class I Insight Class U Class X Class Y Class Z
Signature Funds
Signature Canadian Balanced Fund Jun. 25, 97 Jul. 17, 00 Jul. 15, 03 – Jul. 18, 09 – Jul. 18, 09 Jun. 20, 05
Signature Canadian Bond Fund Jan. 20, 93 Jul. 17, 00 Jul. 31, 01 Jul. 15, 03 – – – –
Signature Canadian Resource Fund Apr. 11, 97 Jul. 31, 01 – – – – – –
Signature Corporate Bond Fund Dec. 16, 01 Jul. 15, 03 Jul. 15, 03 Jul. 15, 03 – – – –
Signature Diversified Yield Fund Nov. 10, 09 Nov. 10, 09 Nov. 10, 09 – – – – –
Signature Dividend Fund Oct. 29, 96 Jul. 31, 01 Jul. 15, 03 – – Jul. 15, 03* Jul. 15, 03 Jul. 15, 03
Signature Global Income & Growth Fund Feb. 22, 07 Feb. 22, 07 Feb. 22, 07 – – – – –
Signature High Income Fund Dec. 18, 96 Jul. 31, 01 Aug. 28, 02 – – – – –
Signature Income & Growth Fund Nov. 13, 00 Nov. 13, 00 Jun. 20, 05 – – – – –
Signature Mortgage Fund May 1, 93 Dec. 13, 99 – – – – – –
Signature Select Canadian Fund May 13, 98 Jul. 17, 00 Jul. 31, 01 Jul. 15, 03 – – – Jun. 20, 05
Signature Select Global Fund Jul. 14, 10 Jul. 14, 10 Nov. 8, 06 – – – – –
Signature Short-Term Bond Fund May 31, 76 Nov. 17, 00 Nov. 1, 96 – – – – –
*These Classes are no longer available for purchase.

– 19 –
CI Mutual FundsNotes to the Financial Statements as at September 30, 2011 (unaudited)
Semi-Annual Financial Statements as at September 30, 2011
Inception Date:
Class A Class F Class I
Synergy Funds
Synergy American Fund Aug. 31, 92 Jul. 17, 00 Jul. 31, 01
Synergy Tactical Asset Allocation Fund Sep. 18, 98 Nov. 13, 00 Aug. 22, 02
Class A Class AT5 Class AT8 Class F Class FT5 Class FT8 Class I Class Y Class Z
Portfolio Series Funds
Portfolio Series Balanced Fund Nov. 9, 88 Sep. 17, 07 Sep. 17, 07 Aug. 30, 00 Sep. 17, 07 Sep. 17, 07 Oct. 31, 96 – –
Portfolio Series Balanced Growth Fund Dec. 17, 01 Sep. 17, 07 Sep. 17, 07 Dec. 17, 01 Sep. 17, 07 Sep. 17, 07 Jun. 20, 05 – –
Portfolio Series Conservative Balanced Fund Dec. 17, 01 – – Dec. 17, 01 – – Jun. 20, 05 – –
Portfolio Series Conservative Fund Dec. 1, 97 – – Aug. 30, 00 – – Dec. 1, 97 Jul. 14, 10 Jul. 14, 10
Portfolio Series Growth Fund Dec. 17, 01 Sep. 17, 07 Sep. 17, 07 Dec. 17, 01 Sep. 17, 07 Sep. 17, 07 Aug. 28, 02 – –
Portfolio Series Income Fund Dec. 1, 97 – – Aug. 30, 00 – – Dec. 1, 97 – –
Portfolio Series Maximum Growth Fund Dec. 17, 01 Sep. 17, 07 Sep. 17, 07 Dec. 17, 01 Sep. 17, 07 Sep. 17, 07 Jun. 20, 05 – –
Effective as of close of business on September 17, 2010, the following Funds were merged:
Terminating Funds Continuing Funds
Artisan Canadian T-Bill Portfolio CI Money Market
Artisan Moderate Portfolio Portfolio Series Balanced Fund
Artisan Growth Portfolio Portfolio Series Balanced Growth Fund
Artisan Conservative Portfolio Portfolio Series Conservative Balanced Fund
Artisan Most Conservative Portfolio Portfolio Series Conservative Fund
Artisan High Growth Portfolio Portfolio Series Growth Fund
Artisan Maximum Growth Portfolio Portfolio Series Maximum Growth Fund
Artisan New Economy Portfolio Portfolio Series Maximum Growth Fund
The Manager adopted the acquisition method of accounting for the merger of the Funds. Under this method
one of the Funds is identified as the acquiring Fund, and is referred to as the “Continuing Fund” and any other
Fund involved in the merger is referred to as the “Terminating Fund”. This identification is based on a
comparison of the relative net asset value of the Funds as well as consideration of the continuation of such
aspects of the Continuing Fund as: investment objectives and practices and type of portfolio securities.
Effective as of the close of business on September 17, 2010, the Continuing Funds acquired all of the assets
of the corresponding Terminating Funds in exchange for units in the Continuing Funds. The value of the units
of the Continuing Funds issued in connection with these mergers, were equal to the net assets transferred from
the respective Terminating Funds. The cost associated with the mergers was borne by the Manager.
Net Asset Units
Terminating Funds Continuing Funds Acquired ($) Issued
Artisan Canadian T-Bill Portfolio CI Money Market 4,806,765 480,677
Artisan Moderate Portfolio Portfolio Series Balanced Fund 102,856,243 4,762,080
Artisan Growth Portfolio Portfolio Series Balanced Growth Fund 78,637,729 6,755,819
Artisan Conservative Portfolio Portfolio Series Conservative Balanced Fund 25,645,788 2,138,931
Artisan Most Conservative Portfolio Portfolio Series Conservative Fund 11,405,702 1,140,570
Artisan High Growth Portfolio Portfolio Series Growth Fund 40,325,340 3,642,759
Artisan Maximum Growth Portfolio Portfolio Series Maximum Growth Fund 15,735,012 1,512,251
Artisan New Economy Portfolio Portfolio Series Maximum Growth Fund 1,996,078 191,109
As a result of the merger, the Terminating Funds (other than Artisan Canadian T-Bill Portfolio) were deemed to
have a taxation year-end on the merger date. In accordance with the Income Tax Act, all unrealized losses and
certain elected unrealized gains of the Funds' portfolio were deemed to be realized on the merger date. The
Artisan Canadian T-Bill Portfolio transfered all of its net asset to CI Money Market Fund.
The Terminating Funds’ results are not included in these financial statements.
The CI Global High Dividend Advantage Fund entered into a forward agreement (the "Forward Agreement") with
National Bank of Canada. Through the Forward Agreement, the Fund provides unitholders with exposure to the
performance of one managed account ("Underlying Account") of equity basket managed by Epoch Investment
Partners Inc., in exchange for the Canadian equity portfolio. The Underlying Account consists of dividend-
paying common and preferred shares, debentures, income trusts, equity-related securities and convertible
securities issued by issuers anywhere in the world. However, neither the Fund nor the unitholders will have any
ownership interest in the Underlying Account.
The Signature Diversified Yield Fund entered into a forward purchase agreement (the "Forward Purchase
Agreement") with Bank of Montreal. Under the Forward Purchase Agreement, the Fund agrees to buy securities
from Bank of Montreal in return for a purchase price of the Signature Diversified Yield Trust (“Underlying
Trust”). Through the forward agreement the Fund provides unitholders with exposure to the performance of the
Underlying Trust. The Underlying Trust consists of fixed income and high-yielding equity securities issued by
issuers anywhere in the world. However, neither the Fund nor the unitholders will have any ownership interest
in the Underlying Trust.
The Statement of Investment Portfolio and Schedule of Fees for each of the Funds are as at September 30,
2011. The Statements of Net Assets are as at September 30, 2011 and March 31, 2011. The Schedule of Net
Assets per Unit and Net Asset Value per Unit and Schedule of Securities Lending are as at September 30, 2011
and 2010, where applicable. The Statements of Operations, Statements of Changes in Net Assets, Schedule of
Fund Unit Transactions and Schedule of Commissions are for the periods ended September 30, 2011 and 2010,
except for Funds established during either period, in which case the information provided relates to the period
from inception to September 30, 2011 and 2010. The Fund Specific Financial Instruments Risks for each of the
Funds are as at September 30, 2011 and March 31, 2011, where applicable.

– 20 –
CI Mutual FundsNotes to the Financial Statements as at September 30, 2011 (unaudited)
Semi-Annual Financial Statements as at September 30, 2011
2. SIGNIFICANT ACCOUNTING POLICIES
These financial statements have been prepared in accordance with Canadian Generally Accepted
Accounting Principles (“Canadian GAAP”). Significant accounting policies used in preparing the semi-
annual financial statements are consistent with those used in preparing the annual financial
statements. The semi-annual financial statements should be read in conjunction with the Funds’
March 31, 2011 annual financial statements.
(a) Valuation of Investments
Canadian GAAP requires the fair value of financial instruments traded in an active market to be
measured based on an investment’s bid/ask price depending on the investment position (long/short).
For the purpose of processing unitholder transactions, net asset value is calculated based on the
closing market price of investments (referred to as “Net Asset Value”), while for financial statement
purposes net assets are calculated based on bid/ask price of investments (referred to as “Net Assets”).
In accordance with National Instrument 81-106, a comparison between the Net Asset Value per unit
and the Net Assets per unit is disclosed in the Schedule of Net Assets per Unit and Net Asset Value
per Unit.
At the financial reporting date, listed securities are valued based on the bid price for securities held
long and the ask price for securities held short. Unlisted securities are valued based on price quotations
from recognized investment dealers, or failing that, their fair value is determined by the Manager on
the basis of the latest reported information available. Fixed income securities, debentures, mortgage-
backed securities, asset-backed securities, money market investments and other debt instruments
including short-term investments, are valued at the bid quotation from recognized investment dealers.
Underlying Funds are valued on each business day at their net asset value as reported by the
Underlying Funds’ manager.
The fair value of private placements is determined by using valuation models that may be based, in
part, on assumptions that are not supported by observable market inputs. These methods and
procedures may include, but are not limited to, performing comparisons with prices of comparable or
similar securities, obtaining valuation related information from issuers and/or other analytical data
relating to the investment and using other available indications of value. These values are
independently assessed by the Manager to ensure that they are reasonable. However, because of the
inherent uncertainty of valuation, the estimated fair values for the aforementioned securities and
interests may be materially different from the values that would have been used had a ready market for
the investment existed. The fair values of private placements are affected by the perceived credit risks
of the issuer, predictability of cash flows and the length of time to maturity.
Mortgages are valued according to the present value of cash flows at interest rates for mortgages that
are similar in nature and duration.
(b) Forward Contracts
A Fund may enter into forward currency contracts. Forward currency contracts are valued on each valuation day
based on the difference between the value of the contract on the date the contract originated and the value of
the contract on the valuation day.
All unrealized gains (losses) arising from forward currency contracts are recorded as part of “Change in
unrealized appreciation (depreciation) of investments” in the Statements of Operations and “Unrealized gain
(loss) on futures and forward currency contracts” in the Statements of Net Assets until the contracts are closed
out or expire, at which time the gains (losses) are realized and reported as “Realized gain (loss) on investments”
in the Statements of Operations.
CI Global High Dividend Advantage Fund, Signature Diversified Yield Fund and CI Income Advantage Fund
entered into Forward Agreements with third parties and the value of these forward contracts on the valuation
date is equal to the gain or loss that would be realized if the contracts were closed out or expired. Investments
sold forward as part of the Forward Agreement are valued at the market close price, and the Underlying
Account/Trusts are valued at their net asset value as reported by the Underlying Account’s/Trusts’ manager on
the valuation date for purposes of determining the value of the forward contracts. All gains (losses) arising from
the forward agreements are recorded as part of “Unrealized gain (loss) on forward agreement”/ “Unrealized
gain (loss) on purchase forward agreement” in the Statements of Net Assets until the contract is closed out or
expires; at which time the gains (losses) are realized and reported as “Realized gain (loss) on investments” in
the Statements of Operations.
(c) Futures Contracts
Futures contracts are valued on each valuation day using the bid/ask price posted on the related public
exchange. All unrealized gains (losses) arising from futures contracts are recorded as part of “Change
in unrealized appreciation (depreciation) of investments” in the Statements of Operations and
“Unrealized gain (loss) on futures and forward currency contracts” in the Statements of Net Assets
until the contracts are closed out or expire, at which time the gains (losses) are realized and reported
as “Realized gain (loss) on investments” in the Statements of Operations.
(d) Options Contracts
Option contracts are valued each valuation day according to the gain or loss that would be realized if
the contracts were closed out. All unrealized gains (losses) arising from option contracts are recorded
as part of “Change in unrealized appreciation (depreciation) of investments” in the Statements of
Operations until the contracts are closed out or expire, at which time the gains (losses) are realized
and reflected in the Statements of Operations in “Realized gain (loss) on investments”.
Over-the-counter options are valued using the Black & Scholes model, whereas, exchange traded
options are valued at bid/ask price taken from the exchange.
(e) Equity Swaps
The fair value of equity swaps are determined using indicative bid values obtained from third-party
broker-dealers. The broker-dealers determine the fair value using valuation models that are based on
assumptions that are supported by observable market inputs, including the interest rates for that day.
The indicative bid values are independently assessed by the Manager to ensure that they are reasonable.
Any income received for equity swaps contracts is recorded as “Derivative income (loss)” in the
Statements of Operations. When the equity swaps contracts are closed out, any gains (losses) are
recorded as “Realized gain (loss) on investments” in the Statements of Operations.
(f) Bullion
Gold and platinum bullion are valued based on North America closing price of the spot price of the
underlying commodity. All unrealized gains (losses) arising from bullion holdings are recorded as part of
“Change in unrealized appreciation (depreciation) of investments” in the Statements of Operations until
the bullion holdings are sold, at which time the gains (losses) are realized and reflected in the
Statements of Operations in “Realized gain (loss) on investments”.
3. UNITHOLDERS’ EQUITY
Units issued and outstanding represent the capital of each Fund.
Each Fund is authorized to issue an unlimited number of redeemable, transferable units of each class.
Generally the Funds have no restrictions or specific capital requirements, except for the minimum subscription/
redemption amounts. The relevant changes pertaining to subscription and redemption of each Fund’s units are
disclosed in the Statements of Changes in Net Assets and the Schedule of Fund Unit Transactions.
In accordance with the objectives and risk management policies outlined in Note 11, the Funds endeavor to
invest subscriptions received in appropriate investments while maintaining sufficient liquidity to meet
redemptions through utilizing a short-term borrowing facility or disposal of investments when necessary.

– 21 –
CI Mutual FundsNotes to the Financial Statements as at September 30, 2011 (unaudited)
Semi-Annual Financial Statements as at September 30, 2011
4. INCOME TAXES
The Funds qualify as mutual fund trusts under the provisions of the Income Tax Act (Canada) and are not
subject to tax on net income, including net realized taxable capital gains for the taxation year, which is paid or
payable to unitholders at the end of the taxation year. However, such part of each Fund’s taxable income and
net realized capital gains that is not so paid or payable will be taxable to that Fund. Income tax on net realized
capital gains not paid or payable will generally be recoverable by virtue of refunding provisions contained in
the Income Tax Act (Canada) and provincial income tax legislation, as redemptions occur. It is the intention of
each Fund to distribute all net income and sufficient net realized capital gains so that the Fund will not
generally be liable for income tax thereon. Occasionally, a Fund may distribute more than it earns. This excess
distribution is a return of capital and is not taxable to unitholders.
Net capital losses may be carried forward indefinitely to reduce future net realized capital gains. Non-capital
losses arising in taxation years 2004 and 2005 may be carried forward ten years. Non-capital losses arising in
taxation years after 2005 may be carried forward twenty years. Non-capital losses carried forward may reduce
future net investment income.
5. MANAGEMENT FEES AND OTHER EXPENSES
CI Investments Inc. is the Manager of each Fund and in consideration for management fees provides
management services required in the day-to-day operations of the Funds, including management of the
investment portfolios of the Funds.
The management fee is calculated based on the net asset values of each class of a Fund (other than Class I)
at the end of each business day. Investors in Class I units are charged management fees directly as negotiated
between the investor and the Manager.
During the period ended September 30, 2011, the Manager of the Funds absorbed a total of $1,195,000
(2010 - $1,359,000) and US$170,000 (2010 – US$162,000) in management fees due to the declining yields
generated by the following funds: CI Money Market Fund and CI US Money Market Fund, respectively.
A Fund that invests in units of Underlying Funds will not pay a duplicate management and administration fee
on the portion of assets that are invested in units of Underlying Funds. During the reporting period, a Fund may
have received a management and/or administration fee rebates from an Underlying Funds. The management
fee rebates are included in “Management fee rebate receivable” and in “Management fee rebate” as reflected
in the Statements of Net Assets and Statements of Operations of each Fund, as applicable.
The Manager bears all of the operating expenses of the Funds (other than certain taxes, borrowing costs and
new governmental fees) in return for fixed annual administration fees (“Administration Fees”). Administration
Fees are calculated as a fixed annual percentage of the net asset value of each class of a Fund (other than
Class I) at the end of each business day.
Refer to fund specific schedules in the financial statements for management fee and administration fee rates
applicable to each class.
The CI Global High Dividend Advantage Fund and Signature Diversified Yield Fund will pay to the counterparties
under Forward Agreements a fee of no more than 0.50% per annum of the market value of notional exposure
to the Underlying Account/Trust under the Forward Agreements calculated and paid monthly.
As of July 1, 2010, Ontario combined the federal goods and services tax (“GST” - 5%) with the provincial retail
sales tax (“PST” - 8%). The combination resulted in a Harmonized sales tax (“HST”) rate of 13%.
6. SECURITIES LENDING
Certain Funds, except for CI Global High Dividend Advantage Fund, have entered into a securities lending program
with their custodian, RBC Dexia Investor Services Trust ("RBC Dexia"). The CI Global High Dividend Advantage Fund
has entered into a securities lending program with National Bank of Canada. The aggregate market value of all
securities loaned by a Fund cannot exceed 50% of the assets of the Fund, except for CI Global High Dividend
Advantage Fund as this Fund received permission from the Canadian securities regulatory authorities to deviate
from National Instrument 81-102 in order to lend up to 100% of its portfolio securities pursuant to securities lending
arrangements. The permission also allows the Fund to appoint a person, other than the Fund’s custodian, as the
agent of the Fund for arranging securities loans, and allows the Fund to pledge the collateral it receives for each
such loan. A Fund will receive collateral of at least 102% of the value of securities on loan. Collateral will generally
be comprised of cash and obligations of or guaranteed by the Government of Canada or a province thereof, or by
the United States government or its agencies, but may include obligations of other governments with appropriate
credit ratings. For those Funds participating in the program, amounts for securities loaned and the collateral
received, appear on the Fund specific schedules in the financial statements and income from securities lending is
included in "Securities lending" in the Statements of Operations and any cash collateral received or cash collateral
payable is included in the Statements of Net Assets in “Cash collateral received for securities on loan“ or ”Payable
for cash collateral under securities lending”.
7. REINVESTMENT OF DISTRIBUTIONS
When a Fund pays a distribution to a unitholder, it will be paid in the same currency in which the units are held.
Distributions are automatically reinvested without charge in the same Fund or paid out in cash to the Unitholder
(other than Signature Select Global Fund). Starting June 1, 2010, the Signature Select Global Fund paid
notional distributions. Notional distributions were automatically reinvested without charge in additional units
of the Signature Select Global Fund and the then outstanding units of the Signature Select Global Fund were
consolidated on such basis as was necessary to increase the net asset value per unit to that which prevailed
prior to the distribution and to ensure that the number of units outstanding immediately following such
reinvestment and consolidation are the same as the number of units outstanding immediately prior to the
reinvestment and consolidation. Accordingly, no payments are made or new units issued on a distribution. The
Manager may change the distribution policy at its discretion.
8. RELATED PARTY TRANSACTIONS
The Bank of Nova Scotia has a significant interest in CI Financial Corp., the parent company of the Manager.
The Funds may have direct or indirect holdings in The Bank of Nova Scotia and/or CI Financial Corp. as
identified in the Statement of Investment Portfolio of each Fund, if applicable.
The Funds paid the following broker commissions to The Bank of Nova Scotia during the periods ended
September 30:
2011 2010
Fund (in $) (in $)
CI Alpine Growth Equity Fund 2,287 2,713
CI Canadian Investment Fund 62,143 60,238
CI Canadian Small/Mid Cap Fund 54,570 43,293
CI Emerging Markets Fund 165 –
CI Income Advantage Fund – 6,996
Select Canadian Equity Managed Fund 4,182 10,633
Harbour Fund 49,535 –
Harbour Growth & Income Fund 72,032 –
Signature Canadian Balanced Fund 25,567 28,796
Signature Canadian Resource Fund 37,236 15,388
Signature Dividend Fund 18,866 21,252
Signature Global Income & Growth Fund 160 186
Signature High Income Fund 32,540 26,078
Signature Income & Growth Fund 51,230 42,021
Signature Select Canadian Fund 57,327 67,513
Synergy American Fund – 125
Synergy Tactical Asset Allocation Fund 2,588 4,201

– 22 –
CI Mutual FundsNotes to the Financial Statements as at September 30, 2011 (unaudited)
Semi-Annual Financial Statements as at September 30, 2011
9. INTERNATIONAL FINANCIAL REPORTING STANDARDS
On February 13, 2008, the Canadian Accounting Standards Board (“AcSB”) confirmed that the use of
International Financial Reporting Standards (“IFRS”) will be required for all publicly accountable profit-
oriented enterprises for interim and annual financial statements relating to fiscal years beginning on
or after January 1, 2011. On January 12, 2011, the AcSB confirmed deferral of the IFRS changeover
date for investment funds. Based on the AcSB decision IFRS will become effective for interim and
annual financial statements relating to fiscal years beginning on or after January 1, 2013 instead of
January 1, 2011.
Based on the Manager’s current evaluation of the differences between IFRS and Canadian GAAP, the
Manager currently does not expect any impact to net asset value or net asset value per unit, at this
time, as a result of the transition to IFRS, and expects that the main impact will be on the financial
statements, where additional disclosures or changes in presentation will be required. Further updates
on the progress in the implementation of the IFRS transition plan and any changes to reporting will be
provided during the implementation period leading up to the transition date.
10. FINANCIAL INSTRUMENTS
The categorization of financial instruments is as follows: investments and derivatives are classified as held for
trading and are stated at fair value. Receivable for unit subscriptions, receivable for dividends and accrued
interest, receivable for securities sold, management fee rebate receivable and other receivables are designated
as loans and receivables. They are recorded at amortized cost which approximates their fair value due to their
short-term nature. Similarly, payable for unit redemptions, payable for securities purchased, management fees
payable, accrued expenses and other payables are designated as financial liabilities and are carried at their
amortized cost which approximates their fair value, due to their short-term nature. Financial liabilities are
generally paid within three months.
11. FINANCIAL INSTRUMENTS RISK
Risk Management
The Funds are exposed to a variety of financial instruments risks: credit risk, liquidity risk and market risk
(including interest rate risk, currency risk and other price risk). The level of risk to which each Fund is exposed
depends on the investment objective and the type of investments the Fund holds. The value of investments
within a portfolio can fluctuate daily as a result of changes in prevailing interest rates, economic and market
conditions and company specific news related to investments held by the Fund. The Manager of the Funds may
minimize potential adverse effects of these risks on the Funds’ performance by, but not limited to, regular
monitoring of the Funds’ positions and market events, diversification of the investment portfolio by asset type,
country, sector, term to maturity within the constraints of the stated objectives, and through the usage of
derivatives to hedge certain risk exposures.
Credit Risk
Credit risk is the risk that a security issuer or counterparty to a financial instrument will fail to meet its financial
obligations. The fair value of a debt instrument includes consideration for the credit worthiness of the debt
issuer. The carrying amount of debt instruments as shown on the Statement of Investment Portfolio represents
the credit risk exposure of each Fund. Credit risk exposure for derivative instruments is based on each Fund’s
unrealized gain on the contractual obligations with the counterparty as at the reporting date. The credit rating
of counterparty to a derivative instrument is disclosed in the Statement of Investment Portfolio or in Fund
Specific Financial Instruments Risks section of the financial statements of each Fund, if applicable. The credit
risk exposure of the Fund’s other assets are represented by their carrying amount as disclosed in the
Statements of Net Assets.
The Portfolio Series Funds invest only in units of underlying funds and may be exposed to indirect credit risk in
the event that the underlying fund invests in debt instruments, preferred securities and derivatives.
Credit ratings for debt securities, preferred securities and derivative instruments are obtained from Standard
& Poor’s, where available, otherwise ratings are obtained from: Moody's Investors Service, Dominion Bond
Rating Services or Canadian Bond Rating Services.
Credit ratings can be either long-term or short-term. Short-term credit ratings are generally assigned to those
obligations and derivative instruments considered short-term in nature.
The table below provides a cross-reference between the long-term credit ratings disclosed in the Credit Rating
table inclusive of the short-term credit ratings disclosed in the Derivatives Schedules in the Statement of
Investment Portfolio.
Credit Rating as per Credit Risk table Credit Rating as per Derivative Schedules
AAA/Aaa/A++ A-1+
AA/Aa/A+ A-1, A-2, A-3
A B, B-1
BBB/Baa/B++ B-2
BB/Ba/B+ B-3
B C
CCC/Caa/C++ -
CC/Ca/C+ -
C and Lower D
Not Rated WR
Significant cash balances as disclosed in the Statements of Net Assets are maintained by the custodian,
RBC Dexia. The Manager monitors the credit worthiness of the custodian on a regular basis.
All transactions executed by a Fund in listed securities are settled / paid for upon delivery using approved
brokers. The risk of default is considered minimal, as delivery of securities sold is only made once the broker
has received payment. Payment is made on a purchase once the securities have been received by the broker.
The trade will fail if either party fails to meet its obligation.
Liquidity Risk
Liquidity risk is the risk that a Fund may not be able to settle or meet its obligations, on time or at a reasonable
price. The Funds are exposed to daily cash redemption of redeemable units. Therefore, the Funds invest the
majority of their assets in investments that are traded in active markets and can be readily disposed of.
In addition, the Funds retain sufficient cash and cash equivalents positions to maintain liquidity. From time to
time, the Funds may enter into derivative contracts or invest in unlisted securities that may not trade in an
organized market and may be illiquid. Illiquid securities are identified in the Statement of Investment Portfolio
of each Fund, as applicable.
Interest Rate Risk
Interest rate risk is the risk that the fair value of interest-bearing investments will fluctuate due to changes in
prevailing levels of market interest rates. As a result, the value of the Funds that invest in debt securities
and/or income trusts will be affected by changes in applicable interest rates. If interest rates fall, the fair value
of existing debt securities may increase due to the increase in yield. Alternatively, if interest rates rise, the yield
of existing debt securities may decrease which may then lead to a decrease in their fair value. The magnitude of
the decline will generally be greater for long-term debt securities than for short-term debt securities.
Interest rate risk also applies to Funds that invest in convertible securities. The fair value of these securities
varies inversely with interest rates, similar to other debt securities. However, since they may be converted into
common shares, convertible securities are generally less affected by interest rate fluctuations than other debt
securities.
The Portfolio Series Funds invest only in units of underlying funds and may be exposed to indirect interest rate
risk in the event that the underlying fund invests in interest bearing financial instruments.

– 23 –
CI Mutual FundsNotes to the Financial Statements as at September 30, 2011 (unaudited)
Semi-Annual Financial Statements as at September 30, 2011
Currency Risk
Currency risk arises from financial instruments that are denominated in a currency other than the functional
currency of the Funds. As a result, the Funds may be exposed to the risk that the value of securities
denominated in other currencies will fluctuate due to changes in exchange rates. The Statement of Investment
Portfolio identifies all bonds and derivative instruments denominated in foreign currencies. Equities traded in
foreign markets are also exposed to currency risk as the prices denominated in foreign currencies are converted
to the Funds’ functional currency to determine their fair value.
The Portfolio Series Funds invest only in units of underlying funds and may be exposed to indirect currency risk
in the event that the underlying fund invests in financial instruments that are denominated in a currency other
than the functional currency of the Fund.
Other Price Risk
Other price risk is the risk that the value of financial instruments will fluctuate as a result of changes in market
prices (other than those arising from interest rate risk or currency risk). The value of each investment is
influenced by the outlook of the issuer and by general economic and political conditions, as well as industry
and market trends. All securities present a risk of loss of capital.
Other assets and liabilities are monetary items that are short-term in nature and therefore are not subject to
significant other price risk.
Fair Value Hierarchy
The Funds are required to classify financial instruments measured at fair value using a fair value hierarchy.
Investments whose values are based on quoted market prices in active markets are classified as Level 1. This
level may include publicly traded equities, exchange traded and retail mutual funds, exchange traded warrants,
futures contracts, traded options, American depositary receipts (“ADRs”) and Global depositary receipts
(“GDRs”).
Financial instruments that trade in markets that are not considered to be active but are valued based on quoted
market prices, dealer quotations or alternative pricing sources supported by observable inputs are classified as
Level 2. These may include fixed income securities, mortgage backed securities (“MBS”), short-term
instruments, non-traded warrants, over-the-counter options, structured notes of indexed securities, foreign
currency forward contracts and swap instruments.
Investments classified as Level 3 have significant unobservable inputs. Level 3 instruments may include private
equities, private term loans, private equity funds and certain derivatives. As observable prices are not
available for these securities, the Funds may use a variety of valuation techniques to derive the fair value.
During the six-month period some Funds' exposure to financial instruments risks including fair value hierarchy
classification changed significantly as per details disclosed in the "Fund Specific Financial Instruments Risks"
section of the financial statements. For details relating to financial instruments risks exposure including fair
value hierarchy classification for remaining Funds refer to the audited annual financial statements as at
March 31, 2011, as these Funds’ exposure to financial instruments risks and fair value hierarchy classification
remained unchanged through the period.

– 24 –
Notice: Should you require additional copies of this Semi-Annual Report or have received more than one
copy, please contact CI Investments Inc. (the “Manager”) or your financial advisor.
Commissions, trailing commissions, management fees and expenses all maybe associated with mutual fund
investments. Please read the prospectus before investing. Unless otherwise indicated and except for
returns for periods less than one year, the indicated rates of return are the historical annual compounded
total returns including changes in security value. All performance data assume reinvestment of all
distributions or dividends and do not take into account sales, redemption, distribution or optional charges or
income taxes payable by any securityholder that would have reduced returns. Mutual funds are not
guaranteed, their values change frequently and past performance may not be repeated. Mutual fund
securities are not covered by the Canada Deposit Insurance Corporation or by any other government
deposit insurer.
The commentaries contained herein are provided as a general source of information and should not be
considered personal investment advice or an offer or solicitation to buy or sell securities. Every effort has
been made to ensure that the material contained in these commentaries is accurate at the time of
publication. However, the Manager cannot guarantee its accuracy or completeness and accepts no
responsibility for any loss arising from any use of or reliance on the information contained herein.
®CI Funds, CI Investments, CI Investments design, Harbour Funds, Global Managers and American
Managers are registered trademarks of CI Investments Inc. ™The Portfolio Select Series and Signature Funds are trademarks of CI Investments Inc.
Semi-Annual Financial Statements as at September 30, 2011
Legal Notice

SYNERGY_SA_11/11E
2 Queen Street East, Twentieth Floor, Toronto, Ontario M5C 3G7 I www.ci.comHead Office / Toronto416-364-1145 1-800-268-9374
Calgary 403-205-43961-800-776-9027
Montreal 514-875-00901-800-268-1602
Vancouver 604-681-33461-800-665-6994
Client Services English: 1-800-563-5181French: 1-800-668-3528