Seismic vulnerability assessment and fragility curves for ...
19
Vol.:(0123456789) SN Applied Sciences (2021) 3:662 | https://doi.org/10.1007/s42452-021-04652-y Research Article Seismic vulnerability assessment and fragility curves for a multistorey gallery arch bridge Vinay Shimpi 1 · Madappa V. R. Sivasubramanian 1 · S. B. Singh 2 · D. Kesavan Periyasamy 1 Received: 19 September 2020 / Accepted: 11 May 2021 © The Author(s) 2021 OPEN Abstract The masonry bridges on the Kalka Shimla Mountain Railway line, which have multiple arch galleries in the form of Roman aqueducts, are spectacular. The Kalka Shimla Mountain Railway line is situated in severe seismic zones (Indian Standard 1893:2016). This research assesses the seismic vulnerability of masonry arch Bridge No. 541 situated on the Kalka Shimla Mountain Railway line. This bridge is the tallest on the route. In particular, it assesses the seismic vulnerability of the bridge using finite element (FE) analysis. For this purpose, an FE model for the bridge is developed using the ABAQUS FE-based environment. The experimental field study conducted on the bridge using an ambient vibration test (AVT) and dynamic parameters (frequency and mode shapes) is evaluated by operational modal analysis (OMA). Further, the FE model is updated by modifying the elastic mechanical property of the stone masonry to match the analytical modal frequency with the results of the AVT and OMA. The updated model is then used to perform a pushover analysis and nonlinear dynamic analysis to estimate the seismic performance of the bridge. Furthermore, fragility curves are developed for the bridge to estimate the damage state for specific seismicity. The study shows that the bridge is vulnerable to Zone IV seismicity and needs some retrofitting in specific locations such as the pier–abutment joints. Keywords AVT · OMA · Masonry · Fragility curves · Arch · Bridge · Nonlinear · Seismic assessment 1 Introduction The Kalka Shimla Mountain Railway line was built during British rule in India to connect Shimla (the summer capi- tal of British India) to the rest of the country. The rail net- work holds the Guinness World Record for its 96 km steep rise at an altitude more than 2000 m on the Himalayas located in the state of Himachal Pradesh, India. The Kalka Shimla Mountain Railway line opened in 1903 for public traffic, making it 118 years old. In 2008, it was listed as one of the “Mountain Railways of India” and recognized by UNESCO as a World Heritage Site [1]. The key features of the Kalka Shimla Mountain Railway line are its masonry bridges with the absence of girders. This railway line has 864 small and large bridges [2] among which 42 are large bridges constructed as multi-arched galleries like ancient Roman aqueducts. Table 1 summarizes the most notable bridges of this railway line. 1.1 Motivation of the study Despite their magnificent monumental features, these bridges are at risk of earthquakes (they are located in Zone IV of the seismic zoning map of India) due to the presence of Indian and Eurasian plates [3, 4]. Because this area has previously experienced devastating earthquakes such as the Kangra Earthquake (Mw 7.8, 1905), Uttarkashi Earthquake (Mw 7, 1991), and Chamoli Earthquake (Mw * Madappa V. R. Sivasubramanian, [email protected] | 1 Department of Civil Engineering, NIT Puducherry, Karaikal, Puducherry 609609, India. 2 Department of Civil Engineering, BITS Pilani, Pilani, Rajasthan 333031, India.
Transcript of Seismic vulnerability assessment and fragility curves for ...

Vol.:(0123456789)
SN Applied Sciences (2021) 3:662 | https://doi.org/10.1007/s42452-021-04652-y
Research Article
Seismic vulnerability assessment and fragility curves for a multistorey gallery arch bridge
Vinay Shimpi1 · Madappa V. R. Sivasubramanian1 · S. B. Singh2 · D. Kesavan Periyasamy1
Received: 19 September 2020 / Accepted: 11 May 2021
© The Author(s) 2021 OPEN
AbstractThe masonry bridges on the Kalka Shimla Mountain Railway line, which have multiple arch galleries in the form of Roman aqueducts, are spectacular. The Kalka Shimla Mountain Railway line is situated in severe seismic zones (Indian Standard 1893:2016). This research assesses the seismic vulnerability of masonry arch Bridge No. 541 situated on the Kalka Shimla Mountain Railway line. This bridge is the tallest on the route. In particular, it assesses the seismic vulnerability of the bridge using finite element (FE) analysis. For this purpose, an FE model for the bridge is developed using the ABAQUS FE-based environment. The experimental field study conducted on the bridge using an ambient vibration test (AVT) and dynamic parameters (frequency and mode shapes) is evaluated by operational modal analysis (OMA). Further, the FE model is updated by modifying the elastic mechanical property of the stone masonry to match the analytical modal frequency with the results of the AVT and OMA. The updated model is then used to perform a pushover analysis and nonlinear dynamic analysis to estimate the seismic performance of the bridge. Furthermore, fragility curves are developed for the bridge to estimate the damage state for specific seismicity. The study shows that the bridge is vulnerable to Zone IV seismicity and needs some retrofitting in specific locations such as the pier–abutment joints.
Keywords AVT · OMA · Masonry · Fragility curves · Arch · Bridge · Nonlinear · Seismic assessment
1 Introduction
The Kalka Shimla Mountain Railway line was built during British rule in India to connect Shimla (the summer capi-tal of British India) to the rest of the country. The rail net-work holds the Guinness World Record for its 96 km steep rise at an altitude more than 2000 m on the Himalayas located in the state of Himachal Pradesh, India. The Kalka Shimla Mountain Railway line opened in 1903 for public traffic, making it 118 years old. In 2008, it was listed as one of the “Mountain Railways of India” and recognized by UNESCO as a World Heritage Site [1]. The key features of the Kalka Shimla Mountain Railway line are its masonry bridges with the absence of girders. This railway line has
864 small and large bridges [2] among which 42 are large bridges constructed as multi-arched galleries like ancient Roman aqueducts. Table 1 summarizes the most notable bridges of this railway line.
1.1 Motivation of the study
Despite their magnificent monumental features, these bridges are at risk of earthquakes (they are located in Zone IV of the seismic zoning map of India) due to the presence of Indian and Eurasian plates [3, 4]. Because this area has previously experienced devastating earthquakes such as the Kangra Earthquake (Mw 7.8, 1905), Uttarkashi Earthquake (Mw 7, 1991), and Chamoli Earthquake (Mw
* Madappa V. R. Sivasubramanian, [email protected] | 1Department of Civil Engineering, NIT Puducherry, Karaikal, Puducherry 609609, India. 2Department of Civil Engineering, BITS Pilani, Pilani, Rajasthan 333031, India.

Vol:.(1234567890)
Research Article SN Applied Sciences (2021) 3:662 | https://doi.org/10.1007/s42452-021-04652-y
6.8, 1999) [3], we aimed to assess the seismic vulnerability of the bridges on the Kalka Shimla Mountain Railway line.
1.2 Past studies
Neilson and DesRoches [5] developed a methodology for developing fragility curves for highway bridges that accounted for the fragility of the individual components of the bridge. The study concluded that the method is an effective means of decreasing the epistemic uncertainty in the analysis. Pela et al. [6] discussed a numerical modelling procedure for two masonry arch bridges and a nonlinear static analysis methodology for the seismic assessment of bridges. Pela et al. [7] compared the seismic assessment procedures used to analyse a heritage masonry arch bridge. The study concluded that the results of nonlinear static analyses are more conservative than time history analyses and can be used for seismic assessment. Pan et al. [8] developed the retrofit strategy for steel girder bridges in New York by adopting fragility analysis. The study con-cluded that retrofitting consisting with elastomeric bear-ing is more effective at reducing damage to piers. Zampieri et al. [9] proposed a new approach for the derivation of the fragility curves of clusters of masonry arch bridges. However, the methodology is only applicable to specific earthquake scenarios. Scozzese et al. [10] investigated the problem of flood-induced scour on Rubbianello Bridge. The authors performed an ambient vibration test (AVT) and operational modal analysis (OMA) as a field study and calibrated the developed numerical model for the analysis. The results showed the scour action effect on the bridge and need for OMA monitoring. Ayutulun et al. [11] carried out the seismic assessment of a railway bridge in Turkey using finite element (FE) analysis. The bridge was modelled using the macro-modelling approach and calibrated through system identification. Further, non-linear static analysis and nonlinear time history analyses were performed. The study concluded that the nonlinear static analysis provided the same results as the nonlinear time history analysis. Zampieri et al. [12] compared the modelling strategies of masonry arch bridges for seismic assessment. The study concluded that the fibre beam ele-ment approach underestimates the horizontal stiffness
of the bridge and that the nonlinear kinematic analysis shows different results from those of conventional seis-mic analysis. Further, a comprehensive literature review on the development of fragility curves was performed by Billah and Alam [13]. De Risi et al. [14] developed a strat-egy for the development of fragility curves for an old rein-forced concrete bridge in Italy, using cloud analysis and incremental dynamic analysis. The results from the each analysis were the same. However, using the pier-to-pier methodology for developing fragility curves was found to be more efficient. Lee and Nguyen [15] assessed the influ-ence of lead rubber bearing on the seismic vulnerability of a steel bridge by generating fragility curves. The study revealed that lead rubber bearing can be used to reduce the seismic vulnerability of a bridge. Further, seismic iso-lation-equipped bridges can mitigate major damage to bridge structures.
1.3 Past studies in India
Peña et al. [16] studied the Qutub Minar (a tall brick mina-ret structure) to assess seismic behaviour by performing nonlinear static and dynamic analyses and by developing analytical models based on the vibration testing results. The authors concluded that the developed models are reli-able for assessing seismic vulnerability. Shrestha et al. [17] investigated the seismic vulnerability of ancient masonry buildings in Nepal. Linear dynamic analysis and pushover analysis were performed. The results were compared with the damage observed during the 2015 Gorkha Earthquake. The study concluded by providing guidelines for repair and retrofit procedures for damage to ancient masonry structures. Tripathi and Rai [18] studied the seismic vulner-ability of monastic temples in Sikkim using FE analyses. As a part of the study, pushover analysis was performed and fragility curves were generated. Tomar et al. [19] investi-gated the efficiency of fibre-reinforced polymer-based ret-rofitting for an old masonry building in Dehradun that suf-fered extensive damage during the Uttarkashi Earthquake. Roland et al. [20] investigated the seismic vulnerability of the gopurams and mandapams of the Ekambareswarar Temple in Kancheepuram, southern India. Linear dynamic analysis, nonlinear static analysis, and nonlinear dynamic
Table 1 Masonry arch bridges of Kalka Shimla mountain railways
S. nos. Name of the bridge Special feature Location
1 Bridge No. 541 Four-storied arch gallery bridge of height about 23 m Near Kanoh railway station2 Bridge No. 493 Three-storied arch gallery bridge of height about 17 m Near Kandaghat railway
station3 Bridge No. 226 Longest arch gallery bridge of length 99 m Near Sonwara railway
station

Vol.:(0123456789)
SN Applied Sciences (2021) 3:662 | https://doi.org/10.1007/s42452-021-04652-y Research Article
analysis were performed in an FE-based model. The study concluded by suggesting some retrofit strategies for man-dapams and checking the safety of other structures. Other notable studies that include the structural analysis and evaluation of the condition of heritage structures in India have also been conducted [21–25].
1.4 Objective of the present study and structure of the paper
This research investigates the seismic vulnerability of Bridge No. 541 on the Kalka Shimla Mountain Railway line and delivers probabilistic-based damage levels for zone-specific seismic demand in terms of fragility curves. To accomplish this objective, a visual survey of the structure is first conducted, which is presented in Sect. 2. Next, the system identification of the bridge structure is performed using an AVT and OMA, as described in Sect. 3. Further, an FE model for the bridge structure is developed and updated using the results obtained from the AVT and OMA, which is discussed in Sect. 4. Furthermore, pushover analysis is performed on the updated FE model to assess the seismic capacity of the bridge structure, as elaborated on in Sect. 5. Section 6 discusses the nonlinear dynamic analysis of the bridge. The probabilistic-based fragility curves are derived for specified damage levels in Sect. 7. Finally, Sect. 8 discusses the conclusions of the study.
2 Visual survey and details of Bridge No. 541
Bridge No. 541 is located near Kanoh railway station at an altitude of 1650 m from the mean sea level. This bridge is the tallest among all the bridges on the Kalka Shimla Mountain Railway line, with a height of 23.8 m in four stages. The main load-carrying feature of the bridge is through the arches present in all the stages. The structural components (arches, piers, and walls) are constructed with cut stones joined with lime mortar. Since there is no docu-mentation available about the repair and retrofit of the bridge, a visual inspection was carried out to understand the current status of its structure, finding that the bridge has no sign of any major repair, retrofit, or modifications. Further, it has no damage. Moreover, all the structural ele-ments are intact and there is no soil erosion at the bottom of the piers or abutments. Thereafter, field measurements were taken and geometric drawings were prepared. The length of the bridge is 52 m situated at the reverse curve of 48°. The typical span of the major arches is 3 m in Stage 4, 2.6 m in Stage 3 and Stage 2, and 2.2 m in Stage 1. Pho-tographs and complete geometric details of the bridge are provided in Fig. 1.
3 System identification of the bridge
3.1 Ambient vibration testing (AVT)
AVT is a nondestructive test, generally performed to cap-ture the acceleration response of a structure for ambient vibrations [26]. AVT on the bridge is performed in Novem-ber 2019. The vibration test setup includes four uniaxial accelerometers (Meggitte Endevco 41A19), a six-channel data acquisition system (OROS 35), and four low-noise cables (approximate length 30 m each). The minimum frequency and sensitivity of the accelerometer are 1 Hz and 1 V/g, respectively. The frequency range chosen for each measurement is 0–50 Hz following the literature [27]. The ambient vibration measurement is carried out by deploying accelerometers in 37 sets. The data are recorded using OROS NVGATE software. While measuring, two accelerometers are kept as reference accelerometers and two are used as roving accelerometers. AVT is conducted under ambient vibrations and train-induced excitations. Accelerations at selected points (see Fig. 2) on the deck of the bridge are measured. The selected points are instru-mented to measure the accelerations in the horizontal and vertical planes.
3.2 Operational modal analysis
OMA procedures estimate the system identification (i.e., the estimation of the dynamic parameters) of a structure by exploiting the data acquired through AVTs. The AVT results show that the bridge is vibrating majorly due to train-induced excitations. Thus, the modal identification of the bridge structure is performed considering the accel-erations mainly induced by the vibrations of moving trains. The modal parameters are estimated from the acquired acceleration data in the frequency domain using the fre-quency spatial domain decomposition technique [28] and adopting OROS MODAL ANALYSIS software [29]. The analy-sis of the horizontal and vertical accelerations recorded on the bridge leads to the identification of three funda-mental modes in a frequency range between 0 and 24 Hz. The results of the OMA in terms of natural frequencies are summarized through the modal identification function (MIF) presented in Fig. 3. The modal identification func-tion represents the average trend of the first singular val-ues of the spectral matrices of the recorded horizontal and vertical accelerations. The peak values in the curve of the first singular value allow the identification of natural fre-quencies, in which the corresponding singular values rep-resent an estimate of the associated mode shapes. Further, Fig. 5 presents the identified mode shapes of the bridge through the OMA. The first three fundamental frequencies

Vol:.(1234567890)
Research Article SN Applied Sciences (2021) 3:662 | https://doi.org/10.1007/s42452-021-04652-y
Fig. 1 Photographs and geometric details of Bridge No. 541, Kalka Shimla mountain railways (all units are in meters)
Fig. 2 Placement of the accelerometers on the bridge during AVT

Vol.:(0123456789)
SN Applied Sciences (2021) 3:662 | https://doi.org/10.1007/s42452-021-04652-y Research Article
are estimated as 4.65 Hz, 11.38 Hz, and 23.87 Hz. The first two modes are out-of-plane modes along the longitudinal axis with bending characteristics, whereas the third mode is identified as a vertical mode. Moreover, the asymme-try in the first mode shape is due to the skewness of the bridge along the longitudinal axis.
4 FE modelling and model updating
4.1 Geometric modelling
The geometry of heritage masonry structures is complex. Hidden structural elements can be present in the structure, and these have to be determined. Numerical modelling becomes valuable only when the precise geometry of all the structural elements is integrated into the numerical model. In the present study, an FE model of the bridge is developed in commercial FE software (ABAQUS 6.21) [30], as presented in Fig. 4. To model the different elements of the selected bridge structure, a comprehensive visual sur-vey was performed, which was discussed in Sect. 2. Further,
the FE model considers different structural elements based on the geometry discussed in Sect. 2 and shown in Fig. 1. The bridge structure has different structural parts such as arches, walls, and piers with different dimensions. These structural parts are modelled with precise geometry sepa-rately and then merged by adopting TIE constraints to cre-ate a complete FE model of the bridge.
4.2 Boundary condition
The bridge is located in a valley between two hills that have solid rock strata (see Fig. 1). These hills are composed of hard and stiff limestone rocks, which provide hard strata for the bridge. Therefore, the fixed boundary condition is applied at the bottom of the piers. Further, the bridge consists of a rigid abutment at both ends. Thus, a fixed boundary condition is again applied on the side of the walls of the bridge.
4.3 Mesh generation
The selection of element and mesh size plays a vital role in the reliability of FE models. This study uses 3D continuum shell elements for the modelling, which discretizes all the three-dimensional bodies by determining the thickness from the element nodal geometry. Further, these elements include the effects of transverse shear deformation and thickness change. The arches are modelled using standard linear S4R (four-noded quadrilateral, with reduced inte-gration and large strain formulation), which is a three-dimensional, doubly curved, four-node shell element with six degrees of freedom per node that uses bilinear inter-polation. The piers and walls of the bridge are modelled as standard linear S3R (three-noded triangular, with reduced integration), which is three node shell element having six degrees of freedom per node.
Fig. 3 Modal identification function estimated by FSDD for bridge
0 5 10 15 20 25 30-200
-150
-100
-50
dB S
V
Frequency (Hz)
Modal Identification Function
Fig. 4 FE model of the Bridge No. 541, Kalka Shimla mountain rail-ways

Vol:.(1234567890)
Research Article SN Applied Sciences (2021) 3:662 | https://doi.org/10.1007/s42452-021-04652-y
The optimum mesh size is an important factor for esti-mating the accurate response of the numerical model. For our purpose, mesh sensitivity analysis is performed to adopt the optimum mesh size of the selected elements of the structure. In this study, multiple modal analyses are performed on the FE model with different mesh sizes of elements [31]. The results of the mesh sensitivity analysis show that mesh sizes of 100 mm for arch elements and 300 mm for wall and pier elements are optimum. Finally, the complete FE model consists of 8742 elements con-nected through 5583 nodes.
4.4 Modelling strategy
To analyse masonry arch bridges, the accuracy of the numerical prediction depends on the modelling strategy followed. Lourenço [32] provided a comprehensive review of the modelling strategy for masonry structures. While different strategies are available for the different complexi-ties of a structure, a simple strategy may suffer from the overestimation of the load-carrying capacity. Conversely, advanced strategies usually suffer from the high compu-tational cost incurred to provide the necessary details of the selected parameters [32]. This study follows the macro-modelling strategy for masonry bridges in which the isotropic material behaviour and continuum material response are assumed. This strategy is more convenient and reliable for analysing complex stone masonry struc-tures than strategies such as the micro-modelling strat-egy and homogenized model strategy [31]. The drawback of this strategy is that the assumption of isotropic and homogeneous material does not reflect the anisotropic behaviour of stone masonry. However, this strategy is com-putationally sufficient to predict accurate results [17, 19, 32–36].
4.5 Material modelling
In the case of heritage structures, the estimation of the accurate mechanical properties of the material becomes difficult because masonry structures exhibit a composite nature in bonding, joint behaviour, and true behaviour [31]. Further, in situ testing and destructive testing for the mechanical characterization of material are expensive and difficult, as there is large variability in the test results of masonry materials due to changes in sample core as well as the constitution of the structural elements [32].
In this study, preliminary data are first collected from the Northern Railway, showing that the whole bridge is constructed with limestone blocks joined with lime mor-tar. Moreover, due to the importance of heritage, no minor or major destructive testing is allowed on the bridge. To solve this difficulty, a comprehensive review is performed
to estimate the material mechanical characteristics of the limestone masonry. After the review, the initial values of Young’s modulus, density, and the Poisson ratio are adopted as 10,000 MPa, 2500 kg/m3, and 0.2, respectively for the bridge structure, as recommended by Fanning and Boothy [37].
4.6 Numerical modal analysis
In this study, a numerical modal analysis is performed on the developed FE model to estimate the dynamic properties of the bridge. In ABAQUS, the frequency step is selected and the Block Lanczos method is chosen for the modal extraction. The results of the numerical modal analysis are shown in Fig. 5. Further, the mode shape and associated natural frequency estimated from the initial FE model are compared with the experimental results in Fig. 5. The numerical modal analysis results show the good correlation of the initial FE model mode shapes with the experimental mode shapes, but differences in the associ-ated natural frequencies.
4.7 FE model updating
FE model updating is a procedure for calibrating the exist-ing numerical model by incorporating the results obtained from AVTs and OMA. An existing FE model can only account for the initial geometric and material properties. However, in the case of heritage structures, it becomes necessary to update the numerical model to account for the current conditions and provide an accurate struc-tural assessment. In general, FE model updating can be achieved by adjusting the physical properties, mechanical properties, boundary conditions, masses, restrained prop-erties, joint properties, and geometry of the elements in the numerical model to match the results obtained from the AVT and OMA [26].
In this study, to reduce the differences between the dynamic parameters in the FE model and experimental results, a manual model updating procedure is adopted based on engineering guidelines. Mechanical proper-ties such as Young’s modulus and density are modified in the developed FE model to match the natural frequen-cies obtained from the AVT and OMA. The model updat-ing shows an average difference in natural frequencies of 3–8%. The initial and updated material properties adopted for the bridge structure are presented in Table 2. Further, Table 3 compares the initial and updated frequencies with the experimental results for the bridge.

Vol.:(0123456789)
SN Applied Sciences (2021) 3:662 | https://doi.org/10.1007/s42452-021-04652-y Research Article
Experimental Mode Shape Initial Analytical Mode Shape
First Bending
Mode Shape
Natural
Frequency zH82.4zH56.4
Second Bending
Mode Shape
Natural
Frequency zH01.11zH83.11
First Vertical Mode Shape
Natural
Frequency zH36.22zH78.32
Fig. 5 Comparison of experimental mode shapes and initial analytical mode shapes
Table 2 Initial and updated material property
Material Parameter Initial value Updated value Difference (%)
Stone masonry Young’s modulus (MPa) 10,000 9600 4.0Density (kg/m3) 2500 2200 12.0
Table 3 Results of numerical modal updating
Modes Frequency (Hz)
Experimental Initial model Initial error (%) Updated model Final error (%)
Mode-1 4.65 4.28 8.10 4.60 1.02Mode-2 11.38 11.10 2.56 11.66 2.46Mode-3 23.87 22.63 5.24 23.84 3.33

Vol:.(1234567890)
Research Article SN Applied Sciences (2021) 3:662 | https://doi.org/10.1007/s42452-021-04652-y
5 Pushover analysis
5.1 Constitutive material model
The inelastic behaviour of stone masonry is examined by employing the concrete damaged plasticity model [38, 39] available in the ABAQUS FE environment. The constitutive model applied in the analysis simulates both the cracking and the crushing of the material by plastic rules. Although the model was developed for isotropic material such as concrete, several works show that it is reliable for the anal-ysis of stone masonry [34, 36]. The dilation angle value is kept at 20° assuming that the stone masonry has regular units of stones. The value adopted for the flow potential eccentricity is 0.1, which is the default value. The ratio between the biaxial and uniaxial compression strengths is considered as 1.16, the Drucker–Prager surface modifier is kept as 0.667, and the viscosity parameter is selected as 0.01 because the effect of these parameters is negligible on the global response of the structure.
The experimental study is conducted based on the lime-stone masonry samples of Veríssimo-Anacleto et al. [40], who proposed a stone masonry compression strength of 7.5 MPa, which is adopted in the present study. The tensile material strengths ft are assumed to be 1/10 [41] of the compression strengths fc suggested by previous research. The feasible values of fracture energy Gf are obtained by multiplying the tensile strengths by the ductility index Gf/ft = 0.064 mm proposed by Compán et al. [41] for stone masonry. In the compression, a compression damage parameter is avoided by assuming the fully plastic behav-iour of the material. Further, a nonlinear law (stress equal to 0.8·fc at a 0.5% plastic strain) is followed, as proposed by
Acito et al. [34]. Figure 6 shows the adopted behaviour of the stone masonry in compression and in tension.
5.2 Pushover analysis procedure
The seismic behaviour of the bridge structure is investi-gated using pushover analysis. The forces are applied in the transverse direction of the structure to determine its capacity. The selection of the load pattern in pusho-ver analysis plays a vital role in predicting the average response of the structure [42]. When performing a pusho-ver analysis of masonry structures, PERPETUATE guidelines [43] suggest that two or more load distribution patterns should be adopted to acquire an accurate response. Since the mass of masonry structures is distributed nonuni-formly, a mode shape proportional force distribution load pattern cannot be adopted for the seismic evaluation [25, 43]. Moreover, studies suggest that the mass-based force distribution load pattern provides more reliable results for seismic evaluation [6, 44]. In the present study, two load distribution patterns are followed to perform the pushover analysis. The first pattern is proportional to the masses of the structures (Uniform) and the second pattern is directly proportional to the product of the masses and height of the structures (Triangular) [43]. The lateral loads are applied to the structural model in the transverse direc-tion (Y direction). Thus, the load distribution provides the comprehensive seismic capacity and performance of the bridge structure for the given seismicity.
The control node is that selected for reading the dis-placement during analysis. Further, it represents the response of the whole structure during the analysis. The control node has been kept at the top of the bridge struc-ture in past studies [43, 45, 46]. In this study, the control
(a)Tensile stress-strain curve (b) Compressive stress-strain curve
0.000 0.001 0.002 0.003 0.004 0.005 0.0060
1
2
3
4
5
6
7
8
Co
mp
ress
ive
stre
ss(M
Pa)
Strain (-)0.0000 0.0005 0.0010 0.0015
0.0
0.2
0.4
0.6
0.8
Tensi
leS
tress
(MP
a)
Strain (-)
Gf
ft
Fig. 6 Stone masonry behavior (a) in tension (b) in compression

Vol.:(0123456789)
SN Applied Sciences (2021) 3:662 | https://doi.org/10.1007/s42452-021-04652-y Research Article
node is selected at the top of the middle arch (see Fig. 4), where the recorded vibrations are found to be higher than in other locations. Four analyses are performed with two load distribution patterns in the + ve Y and −ve Y direc-tions. The capacity spectrum method [47] is adopted to convert the pushover curve into a capacity curve to evalu-ate the seismic performance of the structure. The evalu-ation for spectral acceleration Sa is given in Eq. 1, where Vb is the base shear, W is the total weight of the bridge structure, Mk is the modal mass participation for the kth mode, M is the mass of the bridge structure, and g denotes acceleration due to gravity. Further, spectral displacement ( Sd ) is calculated as shown in Eq. 2, where Δ is the control node displacement, Pk is the modal participation factor for the kth mode, and ∅k is the modal amplitude for the kth mode. Further, the demand curve is derived from the response spectrum for Zone IV seismicity following IS 1893:2016 [4] for the rock soil profile adopting proce-dures given in FEMA 440 [48]. The performance point is
evaluated from the demand and capacity curve (point of intersection), which denotes the state of the structure in a representative earthquake event.
Figure 7 shows the pushover curve obtained for the bridge structure concerning the loading conditions in both the + ve Y direction and the − ve Y direction. This fig-ure shows that the structure has more capacity for a uni-form loading pattern than the triangular loading pattern in both directions. Further, the capacity of the bridge struc-ture is slightly more in the − ve Y direction than in the + ve Y direction for load patterns. This is as expected due to the skewness of the bridge, which provides more stiffness to the structure in the lateral direction.
Figure 8a shows seismic demand by plotting the response spectra of different seismic zones for the rock soil profile, and Fig. 8b plots the capacity curve obtained from
(1)Sa =Vb∕W
Mk∕Mg
(2)Sd =Δ
Pk�k
0.00 0.05 0.10 0.15 0.200
1x10⁶
2x10⁶
3x10⁶
4x10⁶
Bas
e S
hea
r (N
)
Displacement (m)
Uniform +Y
Uniform -Y
Triangular +Y
Triangular -Y
Fig. 7 Pushover curve for different load distribution
0 1 2 3 4
0.0
0.1
0.2
0.3
0.4
0.5
Spec
tral
Acc
eler
atio
n (
Sa/
g)
Time (Sec)
Zone-V
Zone-IV
Zone-III
Zone-II
0.00 0.05 0.10 0.15 0.20 0.25 0.300.0
0.1
0.2
0.3
Sp
ectr
al A
ccel
erat
ion
(g)
Spectral Displacement (m)
Uniform +Y
Uniform -Y
Triangular +Y
Triangular -Y
Demand Spectrum
(a) (b)
Fig. 8 a Design response spectra as per Indian code for different seismic zones, b performance of the bridge in Zone IV seismic demand
Table 4 Performance points obtained from the demand and capac-ity curve
S. nos. Load distribution Spectral accelera-tion (g)
Spectral displacement (m)
1 Uniform load + ve Y direction 0.18 0.0582 Uniform load −ve Y direction 0.20 0.0543 Triangular load + ve Y direc-
tion0.15 0.070
4 Triangular load −ve Y direc-tion
0.17 0.066

Vol:.(1234567890)
Research Article SN Applied Sciences (2021) 3:662 | https://doi.org/10.1007/s42452-021-04652-y
the pushover analysis along with the demand spectrum of Zone IV seismicity. The performance points in Fig. 8b for the different load distributions are also presented in Table 4. Further, Fig. 9 shows the tension damage of the bridge at the performance point for a uniform load distri-bution. The tension damage shows that the cracks origi-nated from the pier–abutment joints and propagated to the arch-to-pier joints. The most vulnerable parts are the pier-to-arch joints from which the cracks are expected to propagate. Moreover, Bridge No. 541 of the Kalka Shimla Mountain Railway line shows out-of-plane bending behav-iour of the pier–abutment joints for seismic forces.
6 Nonlinear dynamic analysis
The nonlinear dynamic analysis is performed to capture the response of the structure. The inelastic response of the heritage structure estimated through the nonlin-ear dynamic analyses is reliable [44]. Further, nonlinear dynamic analysis provides a more realistic response of the heritage structure for selected ground motions. Thus, nonlinear dynamic analysis should be performed for herit-age structures.
The nonlinear dynamic analyses are performed in ABAQUS software. In the first step, the gravity loads are applied to the model. Then, explicit analysis procedures are selected for the dynamic analysis to avoid large dis-tortions and localized strains. Further, the acceleration of the selected ground motion records is applied at the base of the model in the transverse direction. Additionally, the energy dissipation in the numerical model is incorporated using the hysteretic behaviour of the materials. Moreover, a structural viscous damping proportion of 5% is chosen for the analysis.
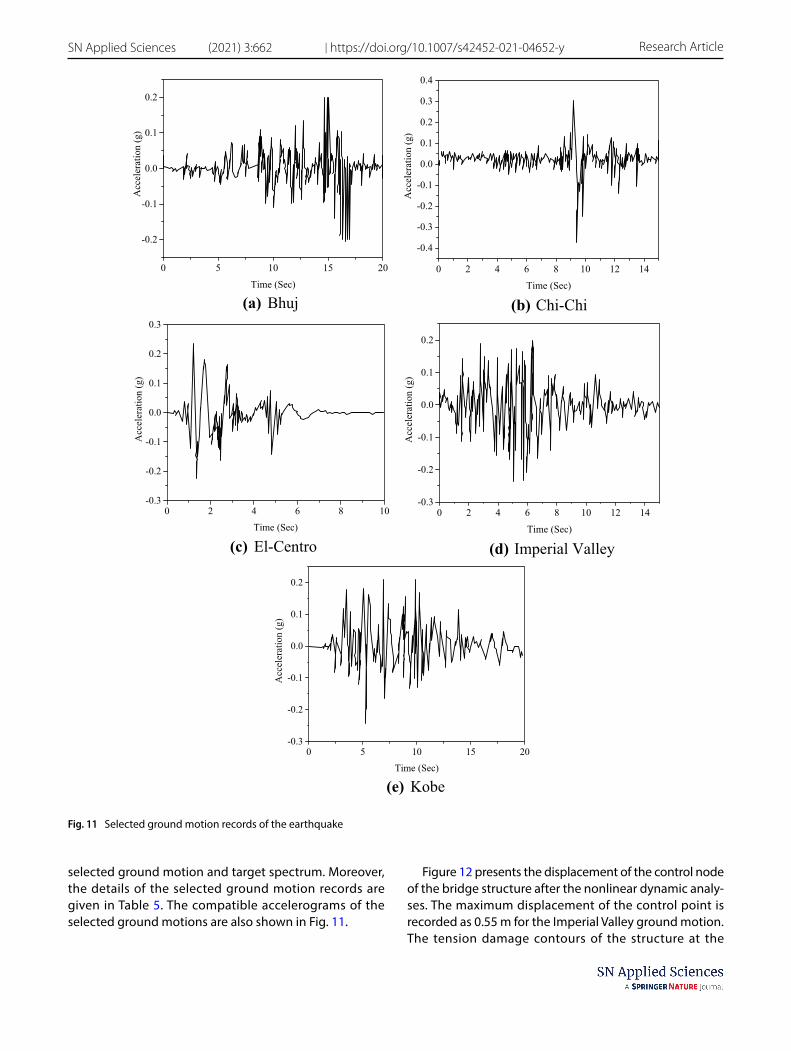
In this study, five ground motion records are adopted to simulate the seismic load on Bridge No. 541 of the Kalka Shimla Mountain Railway line. For this purpose, ground
motion records are selected from the PEER Strong Motion Database [43]. To scale the selected ground motion, the target spectrum is selected from IS 1893:2016. The fol-lowing scaling parameters are assumed: (1) the ground is selected as a rock profile and (2) the intensity of the records is selected as 0.24 g (for Zone IV seismicity). Fig-ure 10 shows the coherence between the square root of the sum of the squares of scaled response spectra of the
Fig. 9 Tension damage state of the Bridge No. 541, Kalka Shimla Mountain Railways at performance point (red—high-est tension damage, blue—lowest tension damage)
0 1 2 3 40.0
0.1
0.2
0.3
0.4
0.5
0.6
0.7
Sp
ectr
alA
ccel
erat
ion
(g)
Time Period (sec)
CHI-CHI
IMPERIAL VALLEY
KOBE
EL-CENTRO
BHUJ
IS-1893:2016, DESIGN SPECTRA
Fig. 10 Scaled response spectra of selected ground motions and target response spectrum for Zone IV seismicity
Table 5 Description of ground motions
S. no Name of the earth-quake
Year Recording station PGA (g)
1 Chi–chi 1999 Tcu045 0.3612 Imperial valley 1979 USGS station 5115 0.3153 Kobe 1995 Kakogawa (cue90) 0.3444 El Centro 1940 El Centro 0.3415 Bhuj 2001 Bhuj 0.303
Vol.:(0123456789)
SN Applied Sciences (2021) 3:662 | https://doi.org/10.1007/s42452-021-04652-y Research Article
selected ground motion and target spectrum. Moreover, the details of the selected ground motion records are given in Table 5. The compatible accelerograms of the selected ground motions are also shown in Fig. 11.
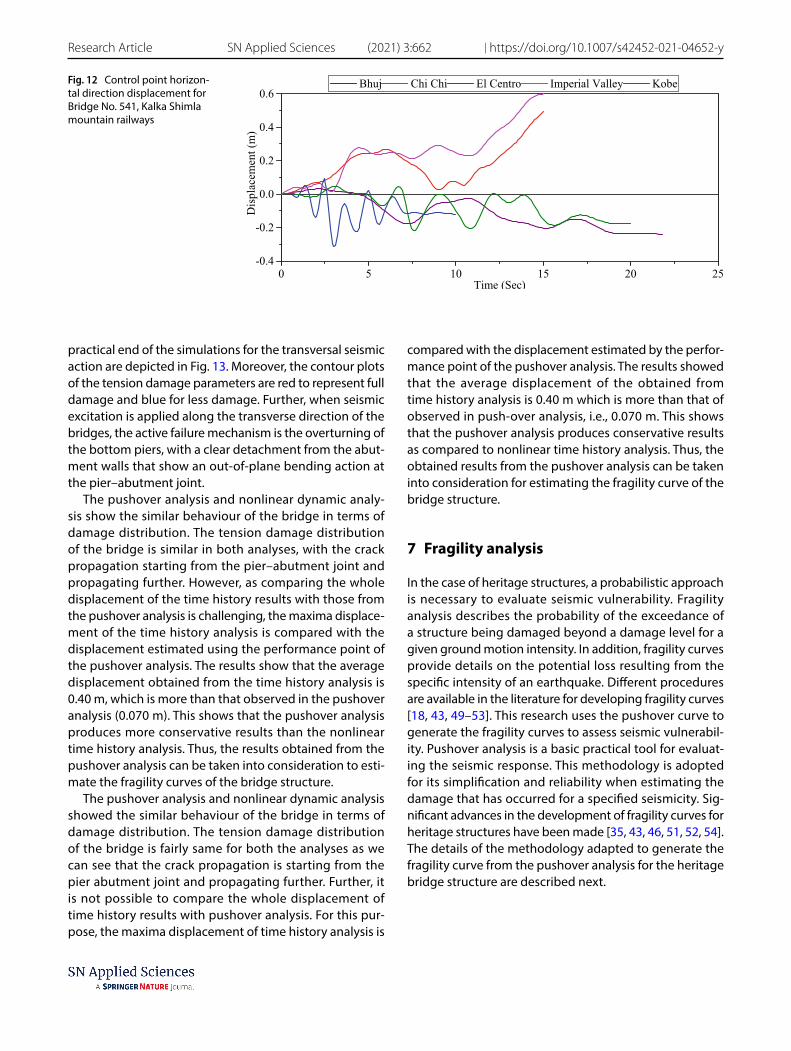
Figure 12 presents the displacement of the control node of the bridge structure after the nonlinear dynamic analy-ses. The maximum displacement of the control point is recorded as 0.55 m for the Imperial Valley ground motion. The tension damage contours of the structure at the
(a) Bhuj
0 5 10 15 20
-0.2
-0.1
0.0
0.1
0.2
Acc
eler
atio
n (
g)
Time (Sec)
(b) Chi-Chi
0 2 4 6 8 10 12 14
-0.4
-0.3
-0.2
-0.1
0.0
0.1
0.2
0.3
0.4
Acc
eler
atio
n(g
)
Time (Sec)
(c) El-Centro
0 2 4 6 8 10-0.3
-0.2
-0.1
0.0
0.1
0.2
0.3
Acc
eler
atio
n(g
)
Time (Sec)
(d) Imperial Valley
0 2 4 6 8 10 12 14-0.3
-0.2
-0.1
0.0
0.1
0.2
Acc
eler
atio
n(g
)
Time (Sec)
(e) Kobe
0 5 10 15 20-0.3
-0.2
-0.1
0.0
0.1
0.2
Acc
eler
atio
n(g
)
Time (Sec)
Fig. 11 Selected ground motion records of the earthquake
Vol:.(1234567890)
Research Article SN Applied Sciences (2021) 3:662 | https://doi.org/10.1007/s42452-021-04652-y
practical end of the simulations for the transversal seismic action are depicted in Fig. 13. Moreover, the contour plots of the tension damage parameters are red to represent full damage and blue for less damage. Further, when seismic excitation is applied along the transverse direction of the bridges, the active failure mechanism is the overturning of the bottom piers, with a clear detachment from the abut-ment walls that show an out-of-plane bending action at the pier–abutment joint.
The pushover analysis and nonlinear dynamic analy-sis show the similar behaviour of the bridge in terms of damage distribution. The tension damage distribution of the bridge is similar in both analyses, with the crack propagation starting from the pier–abutment joint and propagating further. However, as comparing the whole displacement of the time history results with those from the pushover analysis is challenging, the maxima displace-ment of the time history analysis is compared with the displacement estimated using the performance point of the pushover analysis. The results show that the average displacement obtained from the time history analysis is 0.40 m, which is more than that observed in the pushover analysis (0.070 m). This shows that the pushover analysis produces more conservative results than the nonlinear time history analysis. Thus, the results obtained from the pushover analysis can be taken into consideration to esti-mate the fragility curves of the bridge structure.
The pushover analysis and nonlinear dynamic analysis showed the similar behaviour of the bridge in terms of damage distribution. The tension damage distribution of the bridge is fairly same for both the analyses as we can see that the crack propagation is starting from the pier abutment joint and propagating further. Further, it is not possible to compare the whole displacement of time history results with pushover analysis. For this pur-pose, the maxima displacement of time history analysis is
compared with the displacement estimated by the perfor-mance point of the pushover analysis. The results showed that the average displacement of the obtained from time history analysis is 0.40 m which is more than that of observed in push-over analysis, i.e., 0.070 m. This shows that the pushover analysis produces conservative results as compared to nonlinear time history analysis. Thus, the obtained results from the pushover analysis can be taken into consideration for estimating the fragility curve of the bridge structure.
7 Fragility analysis
In the case of heritage structures, a probabilistic approach is necessary to evaluate seismic vulnerability. Fragility analysis describes the probability of the exceedance of a structure being damaged beyond a damage level for a given ground motion intensity. In addition, fragility curves provide details on the potential loss resulting from the specific intensity of an earthquake. Different procedures are available in the literature for developing fragility curves [18, 43, 49–53]. This research uses the pushover curve to generate the fragility curves to assess seismic vulnerabil-ity. Pushover analysis is a basic practical tool for evaluat-ing the seismic response. This methodology is adopted for its simplification and reliability when estimating the damage that has occurred for a specified seismicity. Sig-nificant advances in the development of fragility curves for heritage structures have been made [35, 43, 46, 51, 52, 54]. The details of the methodology adapted to generate the fragility curve from the pushover analysis for the heritage bridge structure are described next.
Fig. 12 Control point horizon-tal direction displacement for Bridge No. 541, Kalka Shimla mountain railways
0 5 10 15 20 25-0.4
-0.2
0.0
0.2
0.4
0.6
Dis
pla
cem
ent
(m)
Time (Sec)
Bhuj Chi Chi El Centro Imperial Valley Kobe

Vol.:(0123456789)
SN Applied Sciences (2021) 3:662 | https://doi.org/10.1007/s42452-021-04652-y Research Article
Fig. 13 Tension damage contours from different time histories for Bridge No. 541, Kalka Shimla mountain railway
Vol:.(1234567890)
Research Article SN Applied Sciences (2021) 3:662 | https://doi.org/10.1007/s42452-021-04652-y
d
DL-1
dDL-1
DL-2
dDL-2
dDL-3
dDL-4
DL-3
Bas
e S
hea
r
Displacement
DL-4
(a)
DL-1 DL-2
DL-3 DL-4
(b)
Fig. 14 a Pushover curve with different damage levels [43], b damage contours at different damage levels
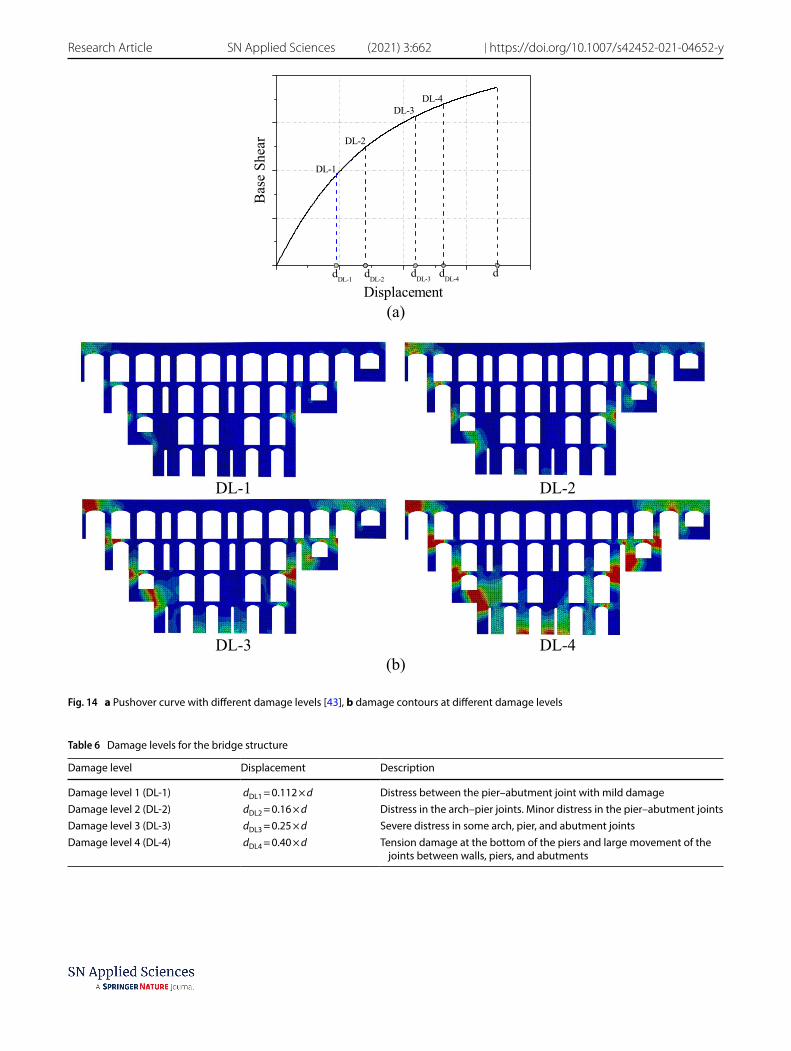
Table 6 Damage levels for the bridge structure
Damage level Displacement Description
Damage level 1 (DL-1) dDL1 = 0.112 × d Distress between the pier–abutment joint with mild damageDamage level 2 (DL-2) dDL2 = 0.16 × d Distress in the arch–pier joints. Minor distress in the pier–abutment jointsDamage level 3 (DL-3) dDL3 = 0.25 × d Severe distress in some arch, pier, and abutment jointsDamage level 4 (DL-4) dDL4 = 0.40 × d Tension damage at the bottom of the piers and large movement of the
joints between walls, piers, and abutments

Vol.:(0123456789)
SN Applied Sciences (2021) 3:662 | https://doi.org/10.1007/s42452-021-04652-y Research Article
7.1 Definition of damage levels
For the fragility analysis, it is necessary to establish the appropriate damage levels associated with different states of the structure from a service state to a collapse state. In this study, four damage levels for the bridge structure are considered following Lagomarsino and Cattari [43] based on the approach that damage levels can directly defined on the pushover curve using approximate limits. Figure 14 shows the damage level defined on the pusho-ver curve and different damage states, which are explained in Table 6.
7.2 Fragility curves for the bridge structure
The fragility curves for the bridge structure are developed following the procedure proposed by Shinozuka et al. [55] for different expected peak ground acceleration (PGA) val-ues in the state of Himachal Pradesh. The steps followed to develop the fragility curves are below:
Step 1 The average demand spectrum (m) and average demand spectrum ± standard deviation (σ) [37] are calcu-lated from the response spectra available in IS 1893:2016 (Part1) for the specific zone [4].
Step 2 The capacity curve of the bridge structure (calcu-lated from the pushover curve, as mentioned in Eqs. 1 and 2) intersects the three abovementioned demand spectra and yields the three performance points that determine the spectral displacement Sd(a) of the performance point, as shown in Fig. 15.
Step 3 The lognormal distribution parameters C(a) and �(a) of spectral displacement Sd(a) are calculated from Eqs. 3 and 4 as detailed by Shinozuka et al. [55]:
Once C(a) and �(a) are determined for the bridge, the probability of exceeding the said displacement of a par-ticular damage level dDL is
The abovementioned procedures are also followed to develop the fragility curves for different PGA values. In this study, the fragility curves are plotted for the probability of the exceedance of different specified damage levels against the PGA value of different seismic zones: a PGA value of 0.1 g for Zone II, PGA value of 0.16 g for Zone III, and PGA value of 0.24 g for Zone IV seismicity.
7.3 Results and discussion
Figure 16 shows the developed fragility curves for Bridge No. 541 of the Kalka Shimla Mountain Railway line for two load distributions (uniform and triangular) in the ± Y direc-tion. The fragility curves are plotted for different PGA val-ues of seismic Zone II to Zone IV against the defined dam-age levels (DL-1 to DL-4). The figure shows that for Zone II seismicity, the bridge structure is vulnerable only to the DL-1 damage level, which means it can withstand Zone II seismicity with mild damage. Further, the bridge structure is more susceptible to DL-2 against Zone III seismicity with considerable damage. On the other hand, the probability of exceeding DL-3 and DL-4 is relatively insignificant for
(1)Sa =Vb∕W
Mk∕Mg
(2)Sd =Δ
Pk�k
(3)Sd(a) = C(a) exp
[{�(a)}2
2
]
(4){�d(a)
}2={Sd(a)
}2[exp {�(a)}2 − 1
]
(5)P�Sd(a) > dDL
�= 1 − Φ
⎡⎢⎢⎢⎣
ln�
dDL
C(a)
�
𝜁(a)
⎤⎥⎥⎥⎦
where Φ
⎡⎢⎢⎢⎣
ln�
dDL
C(a)
�
𝜁(a)
⎤⎥⎥⎥⎦is the standard normal distribution function
Fig. 15 Performance point of the structure for specific demand

Vol:.(1234567890)
Research Article SN Applied Sciences (2021) 3:662 | https://doi.org/10.1007/s42452-021-04652-y
Zone II and Zone III seismicity. In addition, a significant rise in the probability of exceeding DL-3 for Zone IV seismicity is observed. Therefore, seismic retrofit strategies for the bridge structure are required to protect against Zone IV seismicity. Furthermore, the fragility curves show that the probability of the exceedance of DL-4 is insignificant for all seismic zones (below 0.3). Moreover, when the developed fragility curves are compared for the different load distri-butions, triangular loading shows a higher probability of exceedance for DL-1, Dl-2, and DL-3, whereas a negligible difference is observed for DL-4 in the fragility curves based on the different load distributions.
8 Conclusions
In this study, an FE model of Bridge No. 541 of the Kalka Shimla Mountain Railway line is prepared and updated using results from the AVT and OMA. Further, the capac-ity of the structure is evaluated by performing a pushover
analysis and the seismic vulnerability of the bridge is assessed against zone-specific seismicity by developing fragility curves. The following conclusions are drawn:
• A requirement for building a reliable FE model was sat-isfied by updating the initial FE model with the results of the AVT and OMA. The FE model updating procedure involved the modification of elastic material proper-ties such as Young’s modulus and density based on engineering guidelines, which proved to be accept-able to correlate the current condition of the bridge structure in terms of material degradation due to the operational condition of the bridge as well as environ-mental effects.
• The performance assessment of the bridge structure was carried out for Zone IV seismicity with a rock soil profile by comparing the demand and capacity of the bridge structure. It was observed that the bridge has adequate strength against Zone IV seismicity with light damage to arches and piers. Additionally, the
0.00 0.05 0.10 0.15 0.20 0.25 0.30 0.350.0
0.2
0.4
0.6
0.8
1.0Zone-IVZone-III
Pro
bab
ilit
y o
f ex
ceed
ing t
he
dam
age
level
s
PGA (g)
DL-1
DL-2
DL-3
DL-4
Zone-II
(a) +ve Y triangular load distribution
0.00 0.05 0.10 0.15 0.20 0.25 0.30 0.35
0.0
0.2
0.4
0.6
0.8
1.0Zone-IVZone-III
Pro
bab
ilit
y o
f ex
ceed
ing t
he
dam
age
level
s
PGA (g)
DL-1
DL-2
DL-3
DL-4
Zone-II
(b) -ve Y triangular load distribution
0.00 0.05 0.10 0.15 0.20 0.25 0.30 0.35
0.0
0.2
0.4
0.6
0.8
1.0Zone-IVZone-III
Pro
bab
ilit
y o
f ex
ceed
ing t
he
dam
age
level
s
PGA (g)
DL-1
DL-2
DL-3
DL-4
Zone-II
(c) +ve Y uniform load distribution
0.00 0.05 0.10 0.15 0.20 0.25 0.30 0.35
0.0
0.2
0.4
0.6
0.8
1.0Zone-IVZone-III
Pro
bab
ilit
y o
f ex
ceed
ing t
he
dam
age
level
s
PGA (g)
DL-1
DL-2
DL-3
DL-4
Zone-II
(d) -ve Y uniform load distribution
Fig. 16 Fragility curves for Bridge No. 541, Kalka Shimla mountain railways

Vol.:(0123456789)
SN Applied Sciences (2021) 3:662 | https://doi.org/10.1007/s42452-021-04652-y Research Article
bridge structure is susceptible to damage to the joints between piers and abutments. Further, the cracks originate from the abutment–pier joints and progress towards the arches.
• Nonlinear dynamic analysis provided more informa-tion on the seismic behaviour of the bridge structure. The displacement demand observed in the analysis was higher than that of pushover analysis. Further, the results showed good correlation with the pushover analysis results in terms of the tension damage con-tours.
• The fragility analysis provided the seismic performance of the bridge structure against different damage levels for different zone-specific seismicity. From the fragility analysis, the probability of a DL-3 damage level occur-ring during an earthquake of Zone IV seismicity was expected to be very high. Further, fragility curves were found to be more convenient for understanding the seismic vulnerability of the masonry bridge.
• The results of this study could be validated in future research by estimating the damage states using incre-mental dynamic analyses.
Acknowledgements This paper is an outcome of the author’s PhD work enrolled at National Institute of Technology Puduch-erry. Authors are thankful to the National Institute of Technology Puducherry for providing computational facilities. Further, authors acknowledge Northern Railways, Government of India for permit-ting to conduct the field study. Lastly, the authors are grateful to Shimla Division, Northern Railways, Government of India for provid-ing accommodations and manpower throughout the field study.
Funding This research study is sponsored by Seismology Division, Ministry of Earth Sciences, Government of India (Ref. No.: MoES/P.O.(Seismo)/1(296)/2016) sanctioned to Co-authors. The second author is the main supervisor of this study.
Declaration
Conflict of interest The authors declare that they have no competing interests.
Open Access This article is licensed under a Creative Commons Attri-bution 4.0 International License, which permits use, sharing, adap-tation, distribution and reproduction in any medium or format, as long as you give appropriate credit to the original author(s) and the source, provide a link to the Creative Commons licence, and indicate if changes were made. The images or other third party material in this article are included in the article’s Creative Commons licence, unless indicated otherwise in a credit line to the material. If material is not included in the article’s Creative Commons licence and your intended use is not permitted by statutory regulation or exceeds the permitted use, you will need to obtain permission directly from the copyright holder. To view a copy of this licence, visit http:// creat iveco mmons. org/ licen ses/ by/4. 0/.
References
1. ICOMOS (2008) Technical Evaluation Mission: 11-16 September 2008, 911:11–16, Paris, France
2. Mathur (2008) Bridges, buildings and black beauties of northern railway. Institute of Rail Transport in association with National Rail Museum, India
3. Chandra U (1992) Seismotectonics of Himalayas. Curr Sci 62:40–71
4. BIS (2016) IS 1893: 2016—Indian standard criteria for earth-quake resistant design of structures, part 1: general provisions and buildings, New Delhi, India
5. Nielson B, DesRoches R (2007) Seismic fragility methodology for highway bridges using a component level approach. Earthq Eng Struct Dynam 36:823–839. https:// doi. org/ 10. 1002/ eqe
6. Pelà L, Aprile A, Benedetti A (2009) Seismic assessment of masonry arch bridges. Eng Struct 31(8):1777–1788. https:// doi. org/ 10. 1016/j. engst ruct. 2009. 02. 012
7. Pelà L, Aprile A, Benedetti A (2013) Comparison of seismic assessment procedures for masonry arch bridges. Constr Build Mater 38:381–394. https:// doi. org/ 10. 1016/j. conbu ildmat. 2012. 08. 046
8. Pan Y, Agrawal AK, Ghosn M, Alampalli S (2010) Seismic fragility of multispan simply supported steel highway bridges in New York state. I: Bridge modeling, parametric analysis, and retrofit design. J Bridge Eng 15(5):448–461. https:// doi. org/ 10. 1061/ (asce) be. 1943- 5592. 00000 85
9. Zampieri P, Zanini MA, Faleschini F (2016) Derivation of ana-lytical seismic fragility functions for common masonry bridge types: methodology and application to real cases. Eng Fail Anal 68:275–291. https:// doi. org/ 10. 1016/j. engfa ilanal. 2016. 05. 031
10. Scozzese F, Ragni L, Tubaldi E, Gara F (2019) Modal properties variation and collapse assessment of masonry arch bridges under scour action. Eng Struct 199(September):109665. https:// doi. org/ 10. 1016/j. engst ruct. 2019. 109665
11. Aytulun E, Soyoz S, Karcioglu E (2019) System Identification and Seismic Performance Assessment of a Stone Arch Bridge. J Earthquake Eng 00(00):1–21. https:// doi. org/ 10. 1080/ 13632 469. 2019. 16927 40
12. Zampieri P, Perboni S, Denis Tetougueni C, Pellegrino C (2020) Different approaches to assess the seismic capacity of masonry bridges by non-linear static analysis. Front Built Environ. https:// doi. org/ 10. 3389/ fbuil. 2020. 00047
13. Muntasir Billah AHM, Shahria Alam M (2015) Seismic fragility assessment of highway bridges: a state-of-the-art review. Struct Infrastruct Eng 11(6):804–832. https:// doi. org/ 10. 1080/ 15732 479. 2014. 912243
14. De Risi R, Di Sarno L, Paolacci F (2017) Probabilistic seismic per-formance assessment of an existing RC bridge with portal-frame piers designed for gravity loads only. Eng Struct 145:348–367. https:// doi. org/ 10. 1016/j. engst ruct. 2017. 04. 053
15. Lee TH, Nguyen DD (2018) Seismic vulnerability assessment of a continuous steel box girder bridge considering influence of LRB properties. Sadhana Acad Proc Eng Sci. https:// doi. org/ 10. 1007/ s12046- 017- 0774-x
16. Peña F, Lourenço PB, Mendes N, Oliveira DV (2010) Numerical models for the seismic assessment of an old masonry tower. Eng Struct 32(5):1466–1478. https:// doi. org/ 10. 1016/j. engst ruct. 2010. 01. 027
17. Shrestha H, Dizhur D, Prajapati R et al (2017) Seismic vulner-ability assessment of two nepalese rana palaces. Earthq Spectra 33(1):345–362. https:// doi. org/ 10. 1193/ 01051 7EQS0 04M

Vol:.(1234567890)
Research Article SN Applied Sciences (2021) 3:662 | https://doi.org/10.1007/s42452-021-04652-y
18. Tripathi A, Rai DC (2019) Seismic vulnerability assessment and fragility analysis of stone masonry monastic temples in Sikkim Himalayas. Int J Archit Herit 13(2):257–272. https:// doi. org/ 10. 1080/ 15583 058. 2018. 14332 49
19. Tomar A, Paul DK, Agarwal P (2019) Seismic assessment and ret-rofitting of a heritage brick masonry building using FRP. J Earthq Tsunami. https:// doi. org/ 10. 1142/ S1793 43111 95000 15
20. Ronald JA, Menon A, Meher Prasad A et al (2019) Modelling and analysis of South Indian temple structures under earthquake loading. Sādhanā. https:// doi. org/ 10. 1007/ s12046- 018- 0831- 0S
21. Srinivas V, Sasmal S, Ramanjaneyulu K, Ravisankar K (2014) Per-formance evaluation of a stone masonry-arch railway bridge under increased axle loads. J Perform Constr Facil 28(2):363–375. https:// doi. org/ 10. 1061/ (ASCE) CF. 1943- 5509. 00004 07
22. Kishen JMC, Ramaswamy A, Manohar CS (2013) Safety assess-ment of a masonry arch bridge: field testing and simulations. J Bridg Eng 18(2):162–171. https:// doi. org/ 10. 1061/ (ASCE) BE. 1943- 5592. 00003 38
23. Ghosh D, Gupta H, Mittal AK, Shekhar R (2017) Inspection of heritage structure using infrared thermography. In: Conference and exhibition of the Indian Society for NDT (December), Chen-nai, Tamil Nadu, India
24. Aranha CA, Menon A, Sengupta AK (2019) Determination of the causative mechanism of structural distress in the presidential palace of India. Eng Fail Anal 95(September 2018):312–331. https:// doi. org/ 10. 1016/j. engfa ilanal. 2018. 09. 023
25. Banerji P, Chikermane S (2012) Condition assessment of a her-itage arch bridge using a novel model updation technique. J Civ Struct Heal Monit 2(1):1–16. https:// doi. org/ 10. 1007/ s13349- 011- 0013-9
26. Shimpi V, Sivasubramanian MVR, Singh SB (2019) System identi-fication of heritage structures through AVT and OMA: a review. SDHM Struct Durab Heal Monit. https:// doi. org/ 10. 32604/ sdhm. 2019. 05951
27. Bayraktar A, Altunişik AC, Birinci F et al (2010) Finite-element analysis and vibration testing of a two-span masonry arch bridge. J Perform Constr Facil 24(1):46–52. https:// doi. org/ 10. 1061/ (ASCE) CF. 1943- 5509. 00000 60
28. Wang T, Celik O, Catbas FN, Zhang LM (2016) A frequency and spatial domain decomposition method for operational strain modal analysis and its application. Eng Struct 114:104–112. https:// doi. org/ 10. 1016/j. engst ruct. 2016. 02. 011
29. OROS (2018) Modal Analysis Software Mannual. France 30. Dassault Systemes Simulia Corporation (2014) Abaqus V. 6.14
Documentation. providence Witham, USA 31. Shimpi V, Sivasubramanian MVR, Singh SB (2018) Review on
nonlinear seismic assessment of masonry structures. In: Inter-national Conference on Advances in Concrete, Structure and Geotechnocal Engineering, BITS Pilani, Pilani, India
32. Lourenço PB (2002) Computations of historical masonry con-structions. Prog Struct Mat Eng 4(3):301–319
33. Roca P, Cervera M, Gariup G, Pela L (2010) Structural analysis of masonry historical constructions. Classical and advanced approaches. Arch Comput Methods Eng 17(3):299–325. https:// doi. org/ 10. 1007/ s11831- 010- 9046-1
34. Acito M, Bocciarelli M, Chesi C, Milani G (2014) Collapse of the clock tower in Finale Emilia after the May 2012 Emilia Romagna earthquake sequence: Numerical insight. Eng Struct 72(May 2012):70–91. https:// doi. org/ 10. 1016/j. engst ruct. 2014. 04. 026
35. Asteris PG, Chronopoulos MP, Chrysostomou CZ et al (2014) Seis-mic vulnerability assessment of historical masonry structural systems. Eng Struct 62–63:118–134. https:// doi. org/ 10. 1016/j. engst ruct. 2014. 01. 031
36. Valente M, Milani G (2016) Seismic assessment of histori-cal masonry towers by means of simplified approaches and
standard FEM. Constr Build Mater 108:74–104. https:// doi. org/ 10. 1016/j. conbu ildmat. 2016. 01. 025
37. Fanning PJ, Boothby TE (2001) Three-dimensional modelling and full-scale testing of stone arch bridges. Comput Struct 79(29–30):2645–2662. https:// doi. org/ 10. 1016/ S0045- 7949(01) 00109-2
38. Lee J, Fenves GL (1998) Plastic-damage model for cyclic loading of concrete structures. J Eng Mech 124(8):892–900. https:// doi. org/ 10. 1061/ (ASCE) 0733- 9399(1998) 124: 8(892)
39. Lubliner J, Oliver J, Oller S, Onate E (1989) A plastic-damage model. Int J Solids Struct 25(3):299–326
40. Veríssimo-Anacleto J, Ludovico-Marques M, Neto P (2020) An empirical model for compressive strength of the limestone masonry based on number of courses: an experimental study. Constr Build Mater. https:// doi. org/ 10. 1016/j. conbu ildmat. 2020. 119508
41. Compán V, Pachón P, Cámara M et al (2017) Structural safety assessment of geometrically complex masonry vaults by non-linear analysis. The Chapel of the Würzburg Residence (Ger-many). Eng Struct 140(January 2020):1–13. https:// doi. org/ 10. 1016/j. engst ruct. 2017. 03. 002
42. Elnashai AS, Di Sarno L (2008) Fundamentals of earthquake engineering. Wiley, Hoboken. https:// doi. org/ 10. 5860/ choice. 32- 1551
43. Lagomarsino S, Cattari S (2015) PERPETUATE guidelines for seismic performance-based assessment of cultural heritage masonry structures. Bull Earthq Eng 13(1):13–47. https:// doi. org/ 10. 1007/ s10518- 014- 9674-1
44. Endo Y, Pelà L, Roca P (2017) Review of different pushover analy-sis methods applied to masonry buildings and comparison with nonlinear dynamic analysis. J Earthq Eng 21(8):1234–1255. https:// doi. org/ 10. 1080/ 13632 469. 2016. 12100 55
45. Bertolesi E, Milani G, Lopane FD, Acito M (2017) Augustus bridge in Narni (Italy): seismic vulnerability assessment of the still standing part, possible causes of collapse, and importance of the roman concrete infill in the seismic-resistant behavior. Int J Archit Herit 11(5):717–746. https:// doi. org/ 10. 1080/ 15583 058. 2017. 13007 12
46. Barbieri DM (2019) Two methodological approaches to assess the seismic vulnerability of masonry bridges. J Traffic Transp Eng (Engl Ed) 6(1):49–64. https:// doi. org/ 10. 1016/j. jtte. 2018. 09. 003
47. Comartin CD, Rojahn C (1996) ATC 40 Seismic Evaluation and Retrofit of Concrete Buildings Redwood City California. Appl Technol Counc 1(November 1996):334
48. FEMA 440 (2005) Improvement of nonlinear static seismic analy-sis procedures. Federal Emergency Management Agency, Wash-ington DC
49. Cescatti E, Salzano P, Casapulla C et al (2020) Damages to masonry churches after 2016–2017 Central Italy seismic sequence and definition of fragility curves. Bull Earthq Eng. https:// doi. org/ 10. 1007/ s10518- 019- 00729-7
50. Rosti A, Rota M, Penna A (2020) Empirical fragility curves for Italian URM buildings. Bull Earthq Eng. https:// doi. org/ 10. 1007/ s10518- 020- 00845-9
51. Choi E, DesRoches R, Nielson B (2004) Seismic fragility of typical bridges in moderate seismic zones. Eng Struct 26(2):187–199. https:// doi. org/ 10. 1016/j. engst ruct. 2003. 09. 006
52. Tecchio G, Donà M, da Porto F (2016) Seismic fragility curves of as-built single-span masonry arch bridges. Bull Earthq Eng 14(11):3099–3124. https:// doi. org/ 10. 1007/ s10518- 016- 9931-6
53. Fallah Tafti M, Amini Hosseini K, Mansouri B (2020) Generation of new fragility curves for common types of buildings in Iran. Bull Earthq Eng 18(7):3079–3099. https:// doi. org/ 10. 1007/ s10518- 020- 00811-5
54. Ronald JA, Menon A, Prasad AM et al (2018) Modelling and analysis of South Indian temple structures under earthquake

Vol.:(0123456789)
SN Applied Sciences (2021) 3:662 | https://doi.org/10.1007/s42452-021-04652-y Research Article
loading. Sadhana Acad Proc Eng Sci 43(5):1–20. https:// doi. org/ 10. 1007/ s12046- 018- 0831-0
55. Shinozuka M, Feng MQ, Kim H-K, Kim S-H (2000) Nonlinear static procedures for fragility curves development. J Eng Mech 126:1287–1295
Publisher’s Note Springer Nature remains neutral with regard to jurisdictional claims in published maps and institutional affiliations.