Developing Tsunami fragility curves using remote sensing and ...
9
Nat. Hazards Earth Syst. Sci., 12, 2689–2697, 2012 www.nat-hazards-earth-syst-sci.net/12/2689/2012/ doi:10.5194/nhess-12-2689-2012 © Author(s) 2012. CC Attribution 3.0 License. Natural Hazards and Earth System Sciences Developing Tsunami fragility curves using remote sensing and survey data of the 2010 Chilean Tsunami in Dichato E. Mas 1 , S. Koshimura 2 , A. Suppasri 3 , M. Matsuoka 4 , M. Matsuyama 5 , T. Yoshii 6 , C. Jimenez 7 , F. Yamazaki 8 , and F. Imamura 1 1 International Research Institute of Disaster Science (IRIDeS), Tsunami Engineering Laboratory, Tohoku University, Japan 2 IRIDeS, Laboratory of Remote Sensing and Geoinformatics for Disaster Management, Tohoku University, Japan 3 IRIDeS, Earthquake induced Tsunami Risk Evaluation (Tokio Marine), Tohoku University, Japan 4 Geoinformation Center, Geological Survey of Japan, National Institute of Advanced Industrial Science and Technology, Japan 5 Civil Engineering Laboratory, Central Research Institute of Electric Power Industry, Japan 6 Environmental Science Research Laboratory, Central Research Institute of Electric Power Industry, Japan 7 Universidad Nacional Mayor de San Marcos, FENLAB, Peru 8 Department of Urban Environment Systems, Graduate School of Engineering, Chiba University, Japan Correspondence to: E. Mas ([email protected]) Received: 8 February 2012 – Revised: 27 June 2012 – Accepted: 10 July 2012 – Published: 24 August 2012 Abstract. On 27 February 2010, a megathrust earthquake of M w = 8.8 generated a destructive tsunami in Chile. It struck not only Chilean coast but propagated all the way to Japan. After the event occurred, the post-tsunami survey team was assembled, funded by the Japan Science and Tech- nology Agency (JST), to survey the area severely affected by the tsunami. The tsunami damaged and destroyed numerous houses, especially in the town of Dichato. In order to estimate the structural fragility against tsunami hazard in this area, tsunami fragility curves were developed. Surveyed data of inundation depth and visual inspection of satellite images of Dichato were used to classify the damage to housing. A prac- tical method suitable when there are limitations on available data for numerical simulation or damage evaluation from sur- veys is presented here. This study is the first application of tsunami fragility curves on the South American Pacific coast and it might be of practical use for communities with simi- lar characteristics along the west Pacific coast. The proposed curve suggests that structures in Dichato will be severely damaged – with a 68 % probability – already at 2 m tsunami inundation depth. 1 Introduction The largest earthquake in history was the 1960 Chile earth- quake and tsunami. Following the north edge of this rup- ture area, on 27 February 2010 a megathrust earthquake of M w = 8.8 occurred. The earthquake generated a destructive tsunami in Chile and the whole Pacific. It is the third largest earthquake in the 21st century and eighth in the recorded his- tory; it is also known as the Maule Earthquake. The rup- tured area was of nearly 450 km, extending from south- ern Santiago in the north to the Arauco Peninsula in the southern area of the city of Concepci´ on. This earthquake was an inter-plate mega-subduction event with a pure re- verse mechanism (Pulido et al., 2010). The earthquake trig- gered a tsunami, and around thirty minutes after the first shock, several waves hit the coast. After the event occurred, the post-tsunami survey team was assembled, funded by the Japan Science and Technology Agency (JST), to survey the area severely affected by the tsunami. The tsunami damaged and destroyed numerous houses, especially in the town of Dichato. As in previous events, in order to estimate the struc- tural fragility against tsunami hazard in the area, tsunami fragility curves were developed. Tsunami fragility is a new measure for the estimation of structural damage and fatali- ties due to tsunami by integrating satellite remote sensing, Published by Copernicus Publications on behalf of the European Geosciences Union.
Transcript of Developing Tsunami fragility curves using remote sensing and ...
Nat. Hazards Earth Syst. Sci., 12, 2689–2697, 2012www.nat-hazards-earth-syst-sci.net/12/2689/2012/doi:10.5194/nhess-12-2689-2012© Author(s) 2012. CC Attribution 3.0 License.
Natural Hazardsand Earth
System Sciences
Developing Tsunami fragility curves using remote sensing andsurvey data of the 2010 Chilean Tsunami in Dichato
E. Mas1, S. Koshimura2, A. Suppasri3, M. Matsuoka4, M. Matsuyama5, T. Yoshii6, C. Jimenez7, F. Yamazaki8, andF. Imamura1
1International Research Institute of Disaster Science (IRIDeS), Tsunami Engineering Laboratory, Tohoku University, Japan2IRIDeS, Laboratory of Remote Sensing and Geoinformatics for Disaster Management, Tohoku University, Japan3IRIDeS, Earthquake induced Tsunami Risk Evaluation (Tokio Marine), Tohoku University, Japan4Geoinformation Center, Geological Survey of Japan, National Institute of Advanced Industrial Science and Technology,Japan5Civil Engineering Laboratory, Central Research Institute of Electric Power Industry, Japan6Environmental Science Research Laboratory, Central Research Institute of Electric Power Industry, Japan7Universidad Nacional Mayor de San Marcos, FENLAB, Peru8Department of Urban Environment Systems, Graduate School of Engineering, Chiba University, Japan
Correspondence to:E. Mas ([email protected])
Received: 8 February 2012 – Revised: 27 June 2012 – Accepted: 10 July 2012 – Published: 24 August 2012
Abstract. On 27 February 2010, a megathrust earthquakeof Mw = 8.8 generated a destructive tsunami in Chile. Itstruck not only Chilean coast but propagated all the wayto Japan. After the event occurred, the post-tsunami surveyteam was assembled, funded by the Japan Science and Tech-nology Agency (JST), to survey the area severely affected bythe tsunami. The tsunami damaged and destroyed numeroushouses, especially in the town of Dichato. In order to estimatethe structural fragility against tsunami hazard in this area,tsunami fragility curves were developed. Surveyed data ofinundation depth and visual inspection of satellite images ofDichato were used to classify the damage to housing. A prac-tical method suitable when there are limitations on availabledata for numerical simulation or damage evaluation from sur-veys is presented here. This study is the first application oftsunami fragility curves on the South American Pacific coastand it might be of practical use for communities with simi-lar characteristics along the west Pacific coast. The proposedcurve suggests that structures in Dichato will be severelydamaged – with a 68 % probability – already at 2 m tsunamiinundation depth.
1 Introduction
The largest earthquake in history was the 1960 Chile earth-quake and tsunami. Following the north edge of this rup-ture area, on 27 February 2010 a megathrust earthquake ofMw = 8.8 occurred. The earthquake generated a destructivetsunami in Chile and the whole Pacific. It is the third largestearthquake in the 21st century and eighth in the recorded his-tory; it is also known as the Maule Earthquake. The rup-tured area was of nearly 450 km, extending from south-ern Santiago in the north to the Arauco Peninsula in thesouthern area of the city of Concepcion. This earthquakewas an inter-plate mega-subduction event with a pure re-verse mechanism (Pulido et al., 2010). The earthquake trig-gered a tsunami, and around thirty minutes after the firstshock, several waves hit the coast. After the event occurred,the post-tsunami survey team was assembled, funded by theJapan Science and Technology Agency (JST), to survey thearea severely affected by the tsunami. The tsunami damagedand destroyed numerous houses, especially in the town ofDichato. As in previous events, in order to estimate the struc-tural fragility against tsunami hazard in the area, tsunamifragility curves were developed. Tsunami fragility is a newmeasure for the estimation of structural damage and fatali-ties due to tsunami by integrating satellite remote sensing,
Published by Copernicus Publications on behalf of the European Geosciences Union.
2690 E. Mas et al.: Tsunami fragility curves – Chile
Fig. 1.Dichato is located in the Coliumo Bay of the Bıo Bıo regionin Chile, around 80 km south of the epicenter.
field survey, numerical modeling, and historical data analysiswith the geographic information system (GIS) (Koshimuraet al., 2009b). The term “tsunami fragility” was introducedby Koshimura et al.(2009b), and so was its determinationby numerical method (Koshimura and Yanagisawa, 2007;Koshimura et al., 2009a). A fragility curve is developed herefor the area of Dichato in Chile. This town was reported tobe affected on more than 80 % of its built-up area (Yamazakiet al., 2010). A brief report of the post-tsunami survey anddamages to Dichato is presented. This paper describes sev-eral methodologies for developing tsunami fragility curves,including the method applied in the case of Dichato. Dam-age interpretation using remote sensing and satellite imagesis explained. Then, the main calculation and the proposedfragility curve are shown. Finally, we make a comparison anddiscussion of previous tsunami fragility curves developed inother areas.
2 Post-tsunami field survey
2.1 Dichato
Dichato is one of the largest towns in Coliumo Bay, locatedat the south end of the bay (Fig.1). It belongs to the munic-ipality of Tome and holds approximately 3000 inhabitants.Dichato was a very popular beach area, and in the past also acamping area suitable for water sports and recreation. It wasreported that more than 80 % of the built-up area sufferedfrom the tsunami.
2.1.1 Damages
The tsunami arrived in this area around one hour afterthe earthquake. Most of the resident population was al-ready evacuated to nearby highland areas, however touristsand some elders underestimated the sea because of their
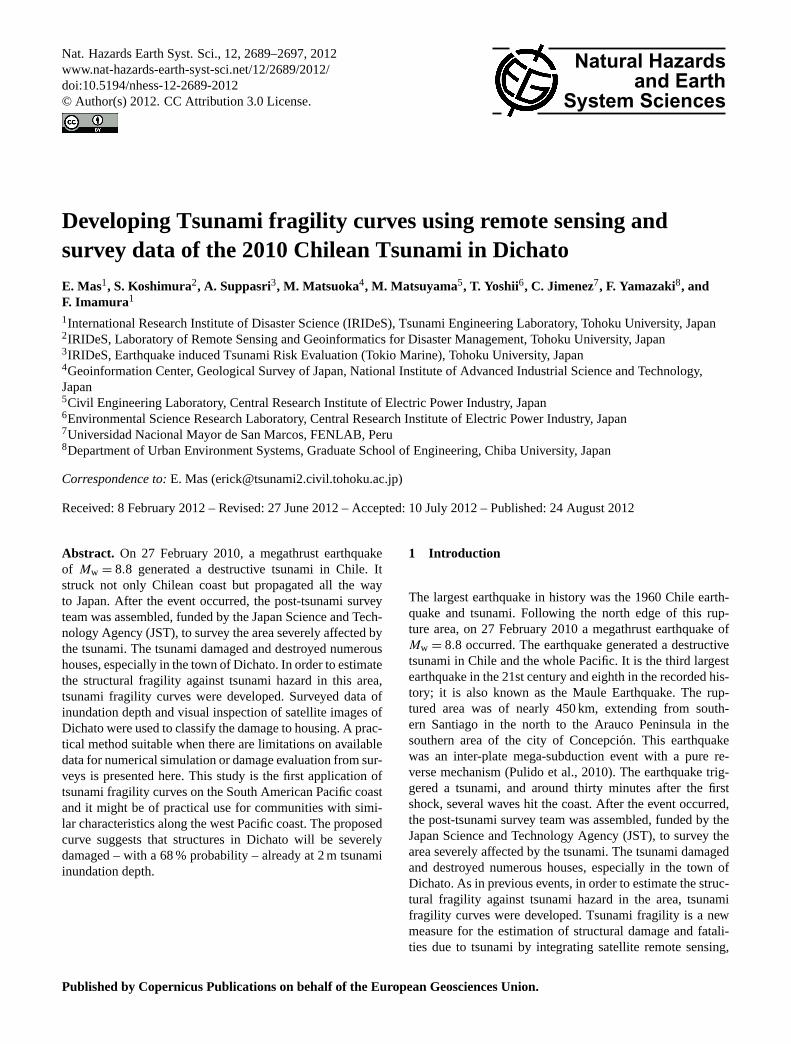
Fig. 2. Location of the ten-story apartment buildings andsurrounding houses.
lack of knowledge or previous experience of 1960 Chiletsunami, when almost no damage occurred in this area. Thenumbers of fatalities and missing persons were reported as66 persons. According to the Dichato-Tome emergency of-fice, 405 families were living in camps still after one monthfrom the earthquake. A total of 1223 families were affectedon their properties (Koshimura et al., 2011). The tsunamipenetrated as far as 800 m, and in some areas of ColiumoBay, measures were of approximately 2.2 km inundation andan estimated maximum water depth of 6 m in the town (Brayand Frost, 2010). According to witnesses, the first wave ar-rived within an hour after the earthquake, followed by a sec-ond and third set of waves in the next five hours. The mostdestructive wave was the second or third wave, dependingon the location in the bay. The characteristics of houses inDichato were mixed, some made of masonry in the first floorand wooden in the second floor, others of lightweight mate-rial such as wood and corrugated metal. Only two ten-storybuildings on the west side of the town and no more than150 m from the shoreline are reinforced concrete and engi-neered apartment buildings (Fig.2). There were no structuraldamages despite that the first floor and the basement wereinundated and submerged under waves of around 3 m height.Also behind these buildings several houses starting a shortslope to the hill were apparently protected from the waveforce by these two buildings and the slope.
3 Developing tsunami fragility curves
According toKoshimura et al.(2009a), “tsunami fragility”was introduced as a new measure for the estimation oftsunami damage to buildings. The probability of structuraldamage is estimated from the hydrodynamic features oftsunamis. Velocity, hydrodynamic force, inundation flowand inundation depth are some of the parameters used byprevious research studies to express the tsunami fragility
Nat. Hazards Earth Syst. Sci., 12, 2689–2697, 2012 www.nat-hazards-earth-syst-sci.net/12/2689/2012/
E. Mas et al.: Tsunami fragility curves – Chile 2691
or fatality ratio. Tsunami fragility curves have been devel-oped so far in response to the Indian Ocean tsunami of 2004(Koshimura and Yanagisawa, 2007; Suppasri et al., 2011;Murao and Nakazato, 2010), the Samoan tsunami of 2009(Gokon et al., 2011), the historic tsunami caused by the1993 Hokkaido Nansei-oki earthquake in Okushiri, Japan(Koshimura and Kayaba, 2010; Suppasri et al., 2012a), andrecently after the 2011 Great East Japan Earthquake (Sup-pasri et al., 2012b). However, architecture and engineering ofthese countries are of different characteristics from the onesapplied in the southwestern Pacific coast. From the field sur-vey of the great event of 2010 in Chile and the damage recog-nition through satellite images, a first proposal of a tsunamifragility curve for a high risk area such as the peruvian andchilean coasts is presented here. Three methods are originallydescribed byKoshimura et al.(2009a) and Suppasri et al.(2011). In this study we briefly describe the three originalmethods plus a fourth approach resulting from the practicalcombination of the last two methods.
3.1 Tsunami fragility from historical data
Koshimura et al.(2009a) developed tsunami fragility curvesbased on the historical data and records of building damagein Japan. Japan is one of the nations with a long history ofevent records, especially in the case of tsunamis. The dataused byKoshimura et al.(2009a) included post-tsunami sur-veys, documents and reports of tsunami height and inunda-tion depths for the 1896 Meiji-Sanriku, 1933 Showa-Sanriku,and 1960 Chile tsunamis. There are several approaches fordamage classification according to the quality of data avail-able. The structural damage classification used for this casein the Okushiri Island was: washed away, completely de-stroyed, moderately damaged, and only flooded.
3.2 Tsunami fragility determined from satellite remotesensing and numerical modeling
High-resolution satellite imagery is used for damage detec-tion through visual interpretation and classification. Then,the numerical simulation of the tsunami, using high-resolution bathymetry and topography data, is used as themethod to obtain the hydrodynamic features of the tsunami.The combination of these two steps defines the relationshipbetween damage probability and characteristics of tsunamiinundation. Due to difficulties in the accurate interpretationof damage during the visual inspection of roof condition, alimitation on the damage classification is observed in thismethod. Thus, the classification of structural damage is lim-ited to two levels, the washed away or collapsed level and theno damage or survived condition.
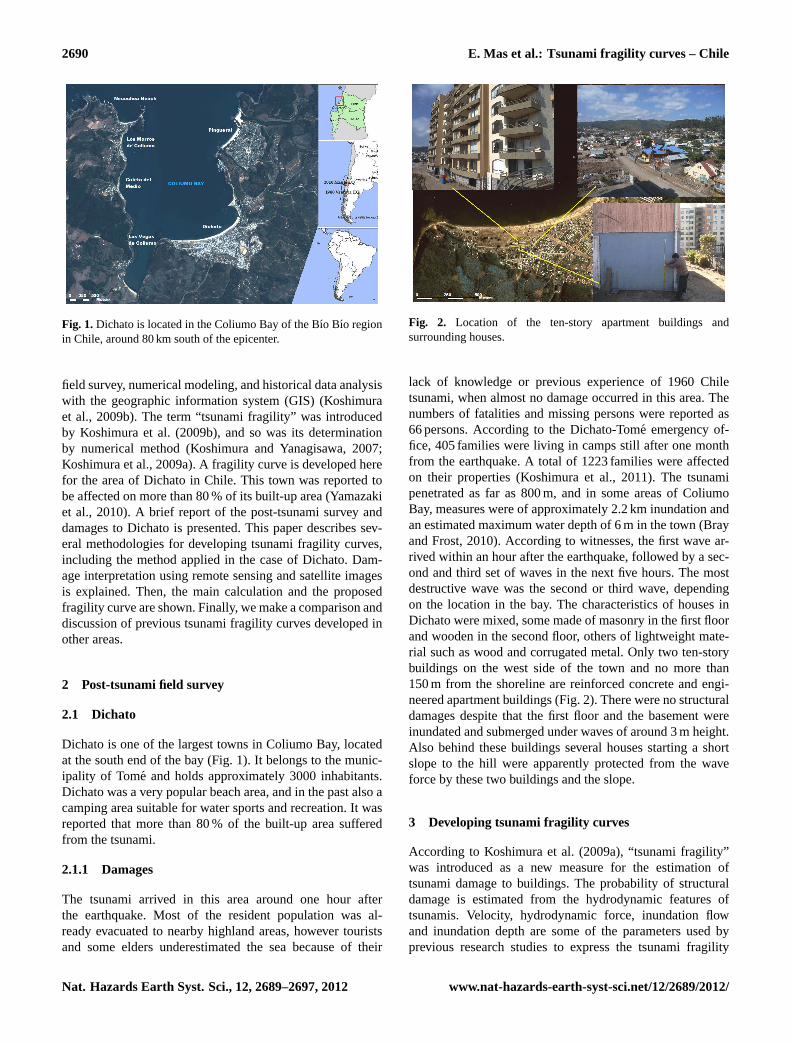
Fig. 3. Satellite image taken before the tsunami event inDichato (Chile) – 10 February 2010.
3.3 Tsunami fragility determined from damageinspection during field surveys
A survey database (Foytong, 2007; Ruangrassamee et al.,2006) is used to construct fragility curves. The levels forstructural damage classification can be more specific in thiscase. Classification according to the damage observed instructural members of the building is possible, instead of anoverall interpretation of the damage. For instance,Foytong(2007) andRuangrassamee et al.(2006) also evaluated theeffects of tsunamis on buildings categorized according to thenumber of stories. Their findings showed a strong relation-ship between fragility curves and the capacity of buildingsrelated to the number of stories.
3.4 Tsunami fragility determined from satellite remotesensing and field surveys
As a combination of the last two methods described above,this approach can be conducted when:
– the field survey data do not include building damage in-spection, or
– the available data for numerical modeling are not ofhigh-resolution accuracy.
For this case, the data of several points of inundation depthmeasured during the field survey are interpolated using geo-graphic information system (GIS) tools. The building dam-age classification is considered in two levels, the washedaway or collapsed level and the survived or non-damagedcondition. The resulting interpolated surface is combinedwith the damage interpretation to define the relationship be-tween inundation depth and damage probability.
www.nat-hazards-earth-syst-sci.net/12/2689/2012/ Nat. Hazards Earth Syst. Sci., 12, 2689–2697, 2012
2692 E. Mas et al.: Tsunami fragility curves – Chile
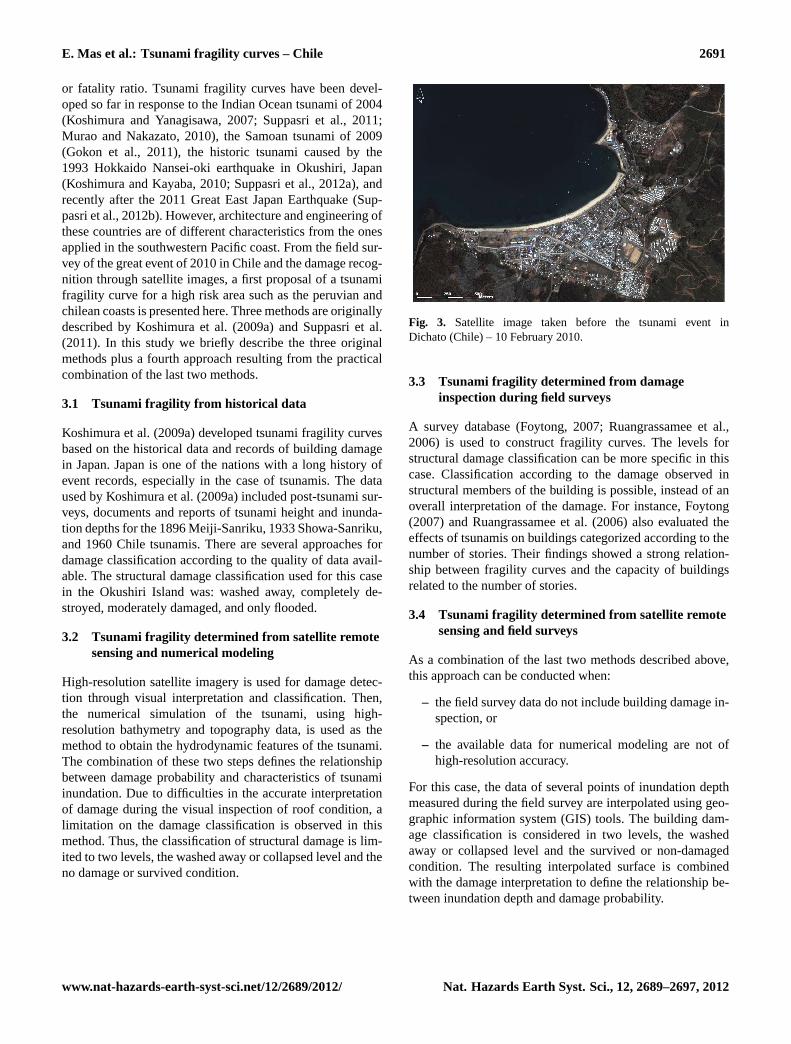
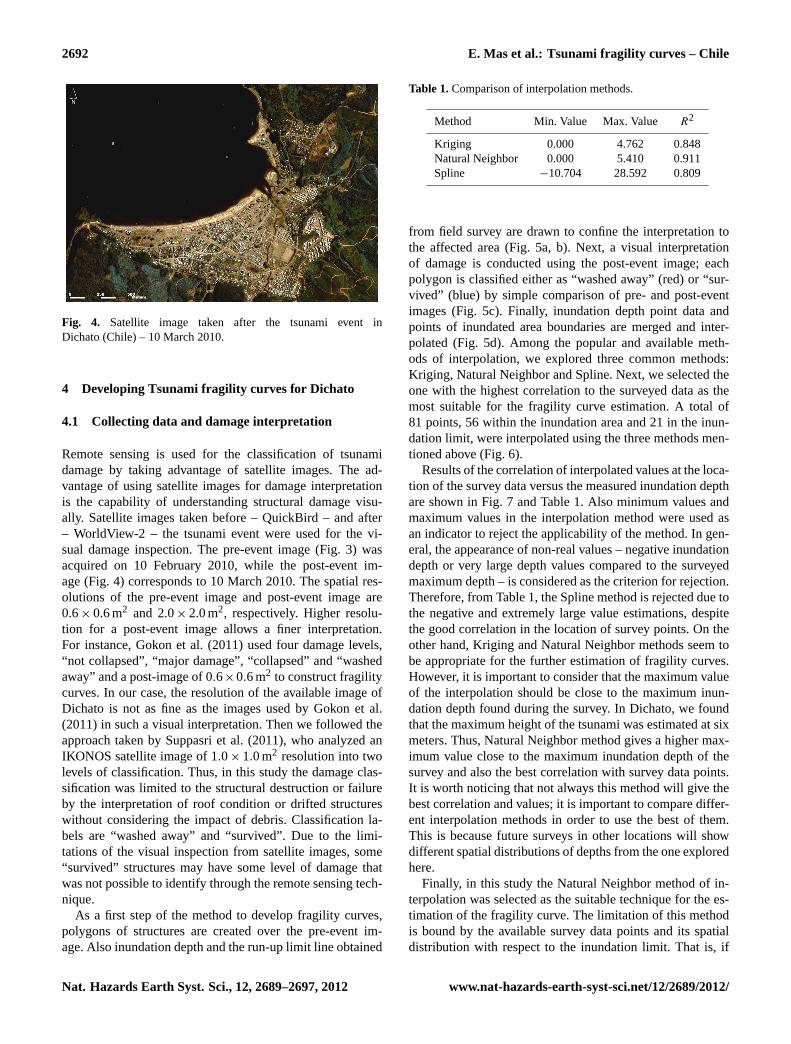
Fig. 4. Satellite image taken after the tsunami event inDichato (Chile) – 10 March 2010.
4 Developing Tsunami fragility curves for Dichato
4.1 Collecting data and damage interpretation
Remote sensing is used for the classification of tsunamidamage by taking advantage of satellite images. The ad-vantage of using satellite images for damage interpretationis the capability of understanding structural damage visu-ally. Satellite images taken before – QuickBird – and after– WorldView-2 – the tsunami event were used for the vi-sual damage inspection. The pre-event image (Fig.3) wasacquired on 10 February 2010, while the post-event im-age (Fig.4) corresponds to 10 March 2010. The spatial res-olutions of the pre-event image and post-event image are0.6× 0.6 m2 and 2.0× 2.0 m2, respectively. Higher resolu-tion for a post-event image allows a finer interpretation.For instance,Gokon et al.(2011) used four damage levels,“not collapsed”, “major damage”, “collapsed” and “washedaway” and a post-image of 0.6×0.6 m2 to construct fragilitycurves. In our case, the resolution of the available image ofDichato is not as fine as the images used byGokon et al.(2011) in such a visual interpretation. Then we followed theapproach taken bySuppasri et al.(2011), who analyzed anIKONOS satellite image of 1.0× 1.0 m2 resolution into twolevels of classification. Thus, in this study the damage clas-sification was limited to the structural destruction or failureby the interpretation of roof condition or drifted structureswithout considering the impact of debris. Classification la-bels are “washed away” and “survived”. Due to the limi-tations of the visual inspection from satellite images, some“survived” structures may have some level of damage thatwas not possible to identify through the remote sensing tech-nique.
As a first step of the method to develop fragility curves,polygons of structures are created over the pre-event im-age. Also inundation depth and the run-up limit line obtained
Table 1.Comparison of interpolation methods.
Method Min. Value Max. Value R2
Kriging 0.000 4.762 0.848Natural Neighbor 0.000 5.410 0.911Spline −10.704 28.592 0.809
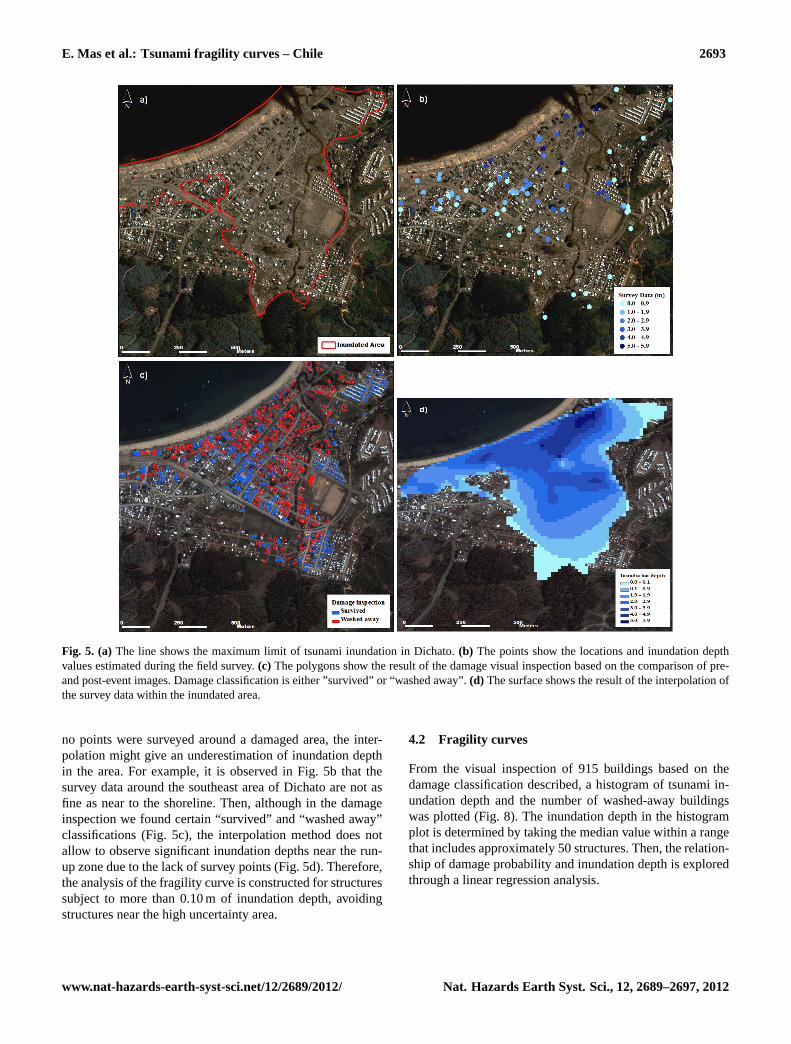
from field survey are drawn to confine the interpretation tothe affected area (Fig.5a, b). Next, a visual interpretationof damage is conducted using the post-event image; eachpolygon is classified either as “washed away” (red) or “sur-vived” (blue) by simple comparison of pre- and post-eventimages (Fig.5c). Finally, inundation depth point data andpoints of inundated area boundaries are merged and inter-polated (Fig.5d). Among the popular and available meth-ods of interpolation, we explored three common methods:Kriging, Natural Neighbor and Spline. Next, we selected theone with the highest correlation to the surveyed data as themost suitable for the fragility curve estimation. A total of81 points, 56 within the inundation area and 21 in the inun-dation limit, were interpolated using the three methods men-tioned above (Fig.6).
Results of the correlation of interpolated values at the loca-tion of the survey data versus the measured inundation depthare shown in Fig.7 and Table1. Also minimum values andmaximum values in the interpolation method were used asan indicator to reject the applicability of the method. In gen-eral, the appearance of non-real values – negative inundationdepth or very large depth values compared to the surveyedmaximum depth – is considered as the criterion for rejection.Therefore, from Table1, the Spline method is rejected due tothe negative and extremely large value estimations, despitethe good correlation in the location of survey points. On theother hand, Kriging and Natural Neighbor methods seem tobe appropriate for the further estimation of fragility curves.However, it is important to consider that the maximum valueof the interpolation should be close to the maximum inun-dation depth found during the survey. In Dichato, we foundthat the maximum height of the tsunami was estimated at sixmeters. Thus, Natural Neighbor method gives a higher max-imum value close to the maximum inundation depth of thesurvey and also the best correlation with survey data points.It is worth noticing that not always this method will give thebest correlation and values; it is important to compare differ-ent interpolation methods in order to use the best of them.This is because future surveys in other locations will showdifferent spatial distributions of depths from the one exploredhere.
Finally, in this study the Natural Neighbor method of in-terpolation was selected as the suitable technique for the es-timation of the fragility curve. The limitation of this methodis bound by the available survey data points and its spatialdistribution with respect to the inundation limit. That is, if
Nat. Hazards Earth Syst. Sci., 12, 2689–2697, 2012 www.nat-hazards-earth-syst-sci.net/12/2689/2012/
E. Mas et al.: Tsunami fragility curves – Chile 2693
Fig. 5. (a) The line shows the maximum limit of tsunami inundation in Dichato.(b) The points show the locations and inundation depthvalues estimated during the field survey.(c) The polygons show the result of the damage visual inspection based on the comparison of pre-and post-event images. Damage classification is either ”survived” or “washed away”.(d) The surface shows the result of the interpolation ofthe survey data within the inundated area.
no points were surveyed around a damaged area, the inter-polation might give an underestimation of inundation depthin the area. For example, it is observed in Fig.5b that thesurvey data around the southeast area of Dichato are not asfine as near to the shoreline. Then, although in the damageinspection we found certain “survived” and “washed away”classifications (Fig.5c), the interpolation method does notallow to observe significant inundation depths near the run-up zone due to the lack of survey points (Fig.5d). Therefore,the analysis of the fragility curve is constructed for structuressubject to more than 0.10 m of inundation depth, avoidingstructures near the high uncertainty area.
4.2 Fragility curves
From the visual inspection of 915 buildings based on thedamage classification described, a histogram of tsunami in-undation depth and the number of washed-away buildingswas plotted (Fig.8). The inundation depth in the histogramplot is determined by taking the median value within a rangethat includes approximately 50 structures. Then, the relation-ship of damage probability and inundation depth is exploredthrough a linear regression analysis.
www.nat-hazards-earth-syst-sci.net/12/2689/2012/ Nat. Hazards Earth Syst. Sci., 12, 2689–2697, 2012
2694 E. Mas et al.: Tsunami fragility curves – Chile
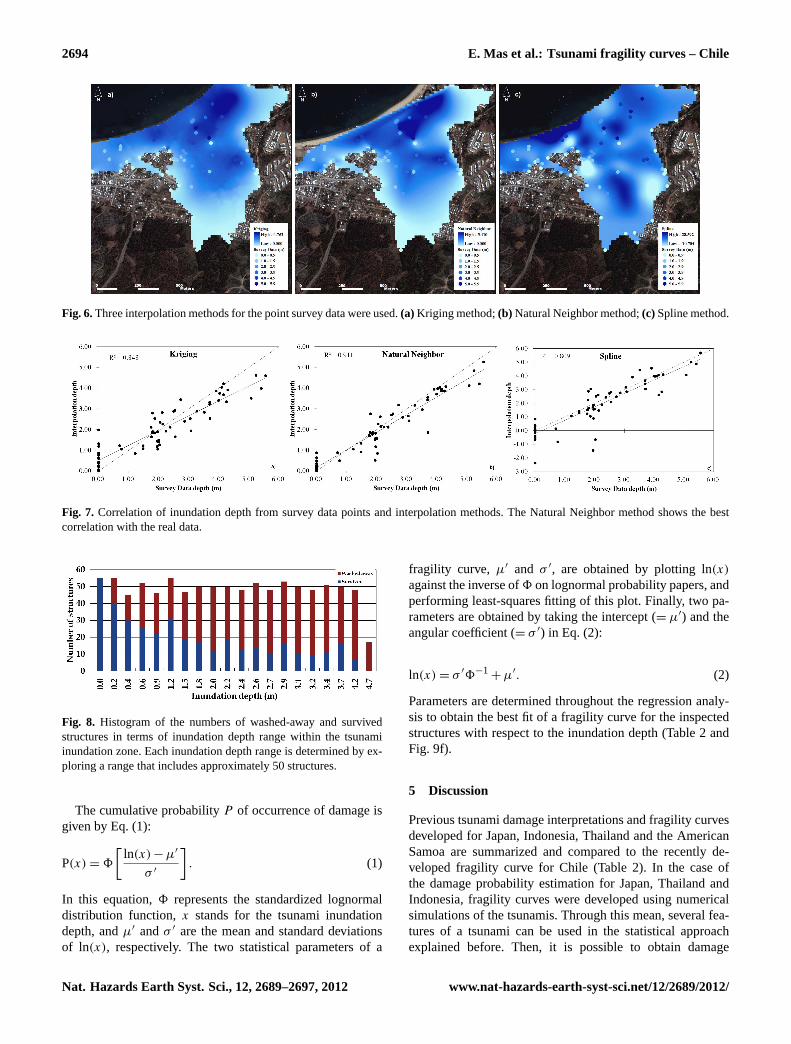
Fig. 6.Three interpolation methods for the point survey data were used.(a) Kriging method;(b) Natural Neighbor method;(c) Spline method.
Fig. 7. Correlation of inundation depth from survey data points and interpolation methods. The Natural Neighbor method shows the bestcorrelation with the real data.
Fig. 8. Histogram of the numbers of washed-away and survivedstructures in terms of inundation depth range within the tsunamiinundation zone. Each inundation depth range is determined by ex-ploring a range that includes approximately 50 structures.
The cumulative probabilityP of occurrence of damage isgiven by Eq. (1):
P(x) = 8
[ln(x) − µ′
σ ′
]. (1)
In this equation,8 represents the standardized lognormaldistribution function,x stands for the tsunami inundationdepth, andµ′ andσ ′ are the mean and standard deviationsof ln(x), respectively. The two statistical parameters of a
fragility curve, µ′ and σ ′, are obtained by plotting ln(x)
against the inverse of8 on lognormal probability papers, andperforming least-squares fitting of this plot. Finally, two pa-rameters are obtained by taking the intercept (= µ′) and theangular coefficient (= σ ′) in Eq. (2):
ln(x) = σ ′8−1+ µ′. (2)
Parameters are determined throughout the regression analy-sis to obtain the best fit of a fragility curve for the inspectedstructures with respect to the inundation depth (Table2 andFig. 9f).
5 Discussion
Previous tsunami damage interpretations and fragility curvesdeveloped for Japan, Indonesia, Thailand and the AmericanSamoa are summarized and compared to the recently de-veloped fragility curve for Chile (Table2). In the case ofthe damage probability estimation for Japan, Thailand andIndonesia, fragility curves were developed using numericalsimulations of the tsunamis. Through this mean, several fea-tures of a tsunami can be used in the statistical approachexplained before. Then, it is possible to obtain damage
Nat. Hazards Earth Syst. Sci., 12, 2689–2697, 2012 www.nat-hazards-earth-syst-sci.net/12/2689/2012/
E. Mas et al.: Tsunami fragility curves – Chile 2695
Table 2.Summary of statistical parameters for developed fragility curves (modified fromSuppasri et al., 2012a). The parametersµ andσ arethe mean and standard deviations of the normal distribution, whileµ′ andσ ′ are similar parameters in a standardized lognormal distribution.
Event (Year) Location Country Structure typeNo. of
structuresinspected
No. ofstructures in
rangeµ σ µ′ σ ′ R2 Fragility curve
(Fig. 9)
Nansei Hokkaido (1993) Okushiri Is. – Aonae Japan Wood 523 50 – – 0.216 0.736 0.82 a.
Indian Ocean (2004) Banda Aceh IndonesiaWood, timber,
RC48 910 1.000 2.985 1.117 – – 0.99 b.
Indian Ocean (2004) Phang Nga ThailandReinforced
Concrete (RC)3.007 100 – – 0.689 0.903 0.80 c.
Indian Ocean (2004) Phuket Thailand RC 1.589 50 – – 0.917 0.642 0.62 d.Samoa (2009) American Samoa USA RC 344 20 – – 1.170 0.691 0.89 e.
Chile (2010) Dichato ChileWood,
Masonry,mixed
915 50 – – 0.092 1.272 0.86 f.
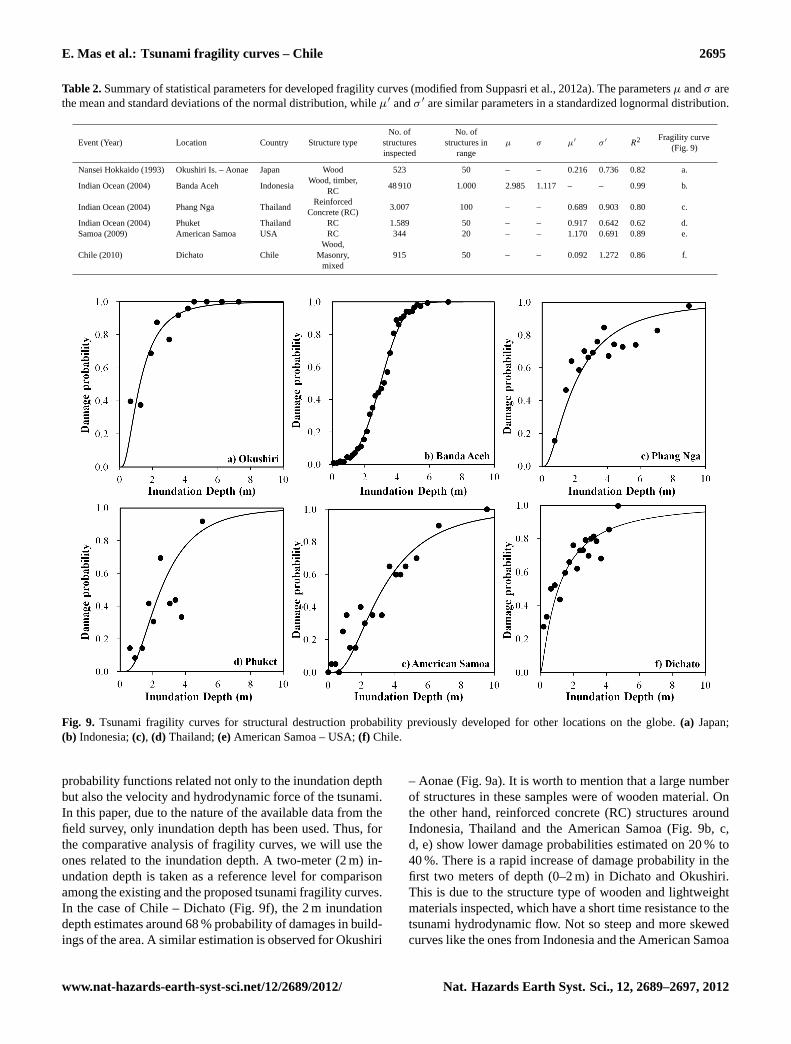
Fig. 9. Tsunami fragility curves for structural destruction probability previously developed for other locations on the globe.(a) Japan;(b) Indonesia;(c), (d) Thailand;(e)American Samoa – USA;(f) Chile.
probability functions related not only to the inundation depthbut also the velocity and hydrodynamic force of the tsunami.In this paper, due to the nature of the available data from thefield survey, only inundation depth has been used. Thus, forthe comparative analysis of fragility curves, we will use theones related to the inundation depth. A two-meter (2 m) in-undation depth is taken as a reference level for comparisonamong the existing and the proposed tsunami fragility curves.In the case of Chile – Dichato (Fig.9f), the 2 m inundationdepth estimates around 68 % probability of damages in build-ings of the area. A similar estimation is observed for Okushiri
– Aonae (Fig.9a). It is worth to mention that a large numberof structures in these samples were of wooden material. Onthe other hand, reinforced concrete (RC) structures aroundIndonesia, Thailand and the American Samoa (Fig.9b, c,d, e) show lower damage probabilities estimated on 20 % to40 %. There is a rapid increase of damage probability in thefirst two meters of depth (0–2 m) in Dichato and Okushiri.This is due to the structure type of wooden and lightweightmaterials inspected, which have a short time resistance to thetsunami hydrodynamic flow. Not so steep and more skewedcurves like the ones from Indonesia and the American Samoa
www.nat-hazards-earth-syst-sci.net/12/2689/2012/ Nat. Hazards Earth Syst. Sci., 12, 2689–2697, 2012
2696 E. Mas et al.: Tsunami fragility curves – Chile
show a comparatively higher strength of reinforced concretebuildings against tsunami characteristics. Fragility curves de-veloped so far by several authors have been estimated us-ing the same statistical approach. However, due to the natureof the available data, different methods were applied. In thisstudy, we presented a practical method to overcome limita-tions observed in areas without damage evaluation data fromfield surveys or topographic and bathymetric data for numer-ical simulation.
6 Conclusions
Tsunami fragility is implemented for an assessment of struc-tural damage within the exposed area from potential tsunamihazard scenarios. Using inundation depth from the post-tsunami field survey data of the 27 February 2010 Chileearthquake, and through the inspection of damage usingsatellite imagery of the pre- and post-event in Dichato,tsunami fragility curves were constructed for the first timein a southwestern Pacific country. Two-level classification ofstructural damage was used here – “survived” and “washedaway” – higher resolution of satellite images or damage eval-uation in situ may improve the results presented here. Themethodology applied in this paper overcomes data limitationof higher-resolution satellite imagery and high accuracy ofbathymetry and topography data for the application of nu-merical models. A comparison of three interpolation meth-ods was presented and the Natural Neighbor resulted in thebest approximation to the survey data and the overall dam-age evaluation. In future applications of this method to otherareas, it is possible that a different interpolation techniquemay give better results based on the spatial distribution ofsurvey data. The fragility curve expresses the damage proba-bility of structures in terms of inundation depth of a tsunami.This function of fragility can be used as a measure to assessthe damage due to potential tsunamis. Multiplying the num-ber of exposed structures by the damage probability from thefragility curves equivalent to the estimated tsunami hazardprovides the quantitative estimation of tsunami damage. Thefragility curve developed for the town of Dichato shows ahigh damage probability of 68 % at a relatively low inun-dation depth of 2 m. Application of this fragility curve inother areas should be carefully evaluated considering the un-certainties of local tsunami and structure characteristics thatmight be different from the ones inspected here.
Acknowledgements.This research was sponsored by JapanScience and Technology Agency (JST) through the project ofScience and Technology Research Partnership for SustainableDevelopment (SATREPS-PERU). The authors acknowledge thesupport from the Japan Ministry of Education, Culture, Sports,Science and Technology (MEXT). Also, we express our deepappreciation to the Willis Research Network (WRN) under thePan-Asian/Oceanian tsunami risk modeling and mapping project
and the Tokio Marine & Nichido Fire Insurance Co., Ltd. throughthe International Research Institute of Disaster Science (IRIDeS) atTohoku University.
Edited by: S. TintiReviewed by: two anonymous referees
References
Bray, J. and Frost, D.: Geo-engineering Reconnaissanceof the 2010 Maule, Chile Earthquake, Tech. rep., Re-port of the NSF Sponsored GEER Associaton Team,http://www.geerassociation.org/GEERPostEQReports/Maule Chile 2010/Ver2CoverChile 2010.html, 2010.
Foytong, P.: Fragility of buildings damaged in the 26 December2004 tsunami, Master thesis, Chulalongkorn University, 2007.
Gokon, H., Koshimura, S., Matsuoka, M., and Namegaya, Y.: De-veloping tsunami fragility curves due to the 2009 tsunami disas-ter in American Samoa, in: Proc. Coast. Eng. Conference (JSCE),Morioka, Japan, 2011.
Koshimura, S. and Kayaba, S.: Tsunami fragility inferred from the1993 Hokkaido Nansei-oki earthquake tsunami disaster, J. JapanAssoc. Earthq. Eng., 10, 87–101, 2010.
Koshimura, S. and Yanagisawa, H.: Developing fragility curves fortsunami damage estimation using numerical model and satelliteimagery, in: Proceedings of the 5th International Workshop onRemote Sensing for Disaster Response, Washington, USA, 2007.
Koshimura, S., Namegaya, Y., and Yanagisawa, H.: TsunamiFragility A New Measure to Identify Tsunami Damage, J. Disas-ter Res., 4, 479–488, 2009a.
Koshimura, S., Oie, T., Yanagisawa, H., and Imamura, F.:Developing Fragility Functions for Tsunami Damage Es-timation using Numerical Model and Post-Tsunami Datafrom Banda Aceh, Indonesia, Coast. Eng. J., 51, 243–273,doi:10.1142/S0578563409002004, 2009b.
Koshimura, S., Matsuoka, M., Matsuyama, M., Yoshii, T., Mas, E.,Jimenez, C., and Yamazaki, F.: Field Survey of the 2010 Tsunamiin Chile, in: 8th International Conference on Urban EarthquakeEngineering, April 2010, 1–13,http://ares.tu.chiba-u.jp/∼papers/paper/2011/2011CUEEKoshimura.pdf, 2011.
Murao, O. and Nakazato, H.: Vulnerability functions for Buildingbased on Damage Survey Data in Sri Lanka after the 2004 In-dian Ocean Tsunami, in: International Conference on SustainableBuilt Environment (ICSBE-2010), December, 371–378, Kandy,Sri Lanka, 2010.
Pulido, N., Yagi, Y., Nishimura, N., and Kumagai, H.: Source rup-ture process and strong motion simulation of the Mw8.8, 2010Chile Mega earthquake, in: Abstr. Fall meeting Seismol. Soc.Japan, 2010.
Ruangrassamee, A., Yanagisawa, H., Foytong, P., Lukkunaprasit,P., Koshimura, S., and Imamura, F.: Investigation of Tsunami-Induced Damage and Fragility of buildings in Thailand afterthe December 2004 Indian Ocean Tsunami, Earthq. Spectra, 22,377–401, 2006.
Suppasri, A., Koshimura, S., and Imamura, F.: Developing tsunamifragility curves based on the satellite remote sensing and the nu-merical modeling of the 2004 Indian Ocean tsunami in Thailand,Nat. Hazards Earth Syst. Sci., 11, 173–189,doi:10.5194/nhess-11-173-2011, 2011.
Nat. Hazards Earth Syst. Sci., 12, 2689–2697, 2012 www.nat-hazards-earth-syst-sci.net/12/2689/2012/
E. Mas et al.: Tsunami fragility curves – Chile 2697
Suppasri, A., Koshimura, S., Matsuoka, M., Gokon, H., andKamthonkiat, D.: Remote Sensing: Application of remote sens-ing for tsunami disaster, in: Remote Sens. Planet Earth, editedby: Chemin, Y., 143–168, InTech, 2012a.
Suppasri, A., Mas, E., Koshimura, S., Imai, K., Harada, K.,and Imamura, F.: Developing Tsunami Fragility Curves Fromthe Surveyed Data of the 2011 Great East Japan Tsunamiin Sendai and Ishinomaki Plains, Coastal Eng. J., 54, 1–16,doi:10.1142/S0578563412500088, 2012b.
Yamazaki, F., Maruyama, Y., Miura, H., Matsuzaki, S., andEstrada, M.: Development of Spatial Information Database ofBuilding Damage and Tsunami Inundation Areas followingthe 2010 Chile Earthquake, Tech. rep., 2010 Chile Earth-quake and Tsunami Technical Report – JST-JICA SATREPSPeru Project, http://ares.tu.chiba-u.jp/peru/pdf/output/tr/JST-JICA-CHILE-EARTHQUAKE-AND-TSUNAMI-REPORT.pdf, 2010.
www.nat-hazards-earth-syst-sci.net/12/2689/2012/ Nat. Hazards Earth Syst. Sci., 12, 2689–2697, 2012