
Segmenting Cruise Passengers Visiting Uruguay: a Factor-Cluster Analysis
14
Segmenting Cruise Passengers Visiting Uruguay: a Factor–Cluster Analysis JUAN GABRIEL BRIDA 1, *, RAFFAELE SCUDERI 1 and MARÍA NELA SEIJAS 2 1 Free University of Bolzano, School of Economics and Management, Bolzano, Italy 2 Universidad ORT – Uruguay, Montevideo, Uruguay ABSTRACT The study aims to provide a better understanding of cruise travel from passengers’ characteristics and experience in two ports of call in Uruguay. A multivariate market segmentation analysis was used, on the basis of 5151 survey data collected during the 2008–2009 and 2009–2010 seasons. A correspondence analysis revealed the underlying latent factors in the set of variables. A hierarchical clustering from correspondence analysis segmented the sample into homogeneous groups. Finally, a decision tree highlighted the most predictive variables for each cluster. The study identifies distinct segments by country of residence, occupation, locations visited in Uruguay, satisfaction and previous visits to the country. Copyright © 2012 John Wiley & Sons, Ltd. Received 14 March 2012; Revised 28 July 2012; Accepted 14 August 2012 Keywords: cruise tourism; CART; hierarchical clustering; market segmentation; Uruguay. INTRODUCTION Cruise tourism has been the fastest growing segment in the travel sector around the world with an average annual growth rate of passengers of 7.4% for the period 1990–2007 for a total of 940 million international tourist arrivals worldwide in 2010 (see Brida and Zapata Aguirre, 2010b; Cruise Lines International Association, 2010). The growth of cruise tourism is expected to continue into the future, as only a small proportion of the population owning the necessary resources opted for this kind of tourism (Chase and Alon, 2002; Chase and McKee, 2003; Brida and Risso, 2010). In particular, the increasing importance of this industry was led by emerging economies (+8%), whereas the advanced economies grew at a slower pace (+5%). The World Tourism Organization (UNWTO) also highlights the recovery of ‘The Americas’ (+8%) after the fall suffered in 2009 as a result of the financial crisis in North America and the impact of the swine flu epidemic (MINTUR, Ministry of Tourism and Sport of Uruguay, 2011a). This form of tourism accounts for only about 2% of the worldwide total leisure travel. Nevertheless, the number of domestic and international cruise passengers has increased very rapidly, from about 4 million in 1990 to more than 14 million in 2009 (Brida and Zapata Aguirre, 2010a). Cruises represent the paradigm of globalization: physical mobility, international capital that can be relocated anywhere and at any time, crews coming from different countries on the same ship, no national or international regulations and marine registrations optimally selected. A cruise ship repre- sents all four faces of the tourism industry: transportation, accommodation (including food and beverages), attractions and tour operators. Thirteen million people took a cruise in 2008, with the industry predicting that more than 30 million people will do so in 2015 (Cruise Lines International Associa- tion, 2010). Cruise tourism can benefit a destination by increas- ing or improving foreign exchange earnings, profit, taxes, em- ployment, positive externalities and economies of scale (Dwyer and Forsyth, 1998; Dwyer et al., 2004; Pratt and Blake, 2009; Brida et al., 2012a). On the other hand, cruise tourism requires less infrastructure than stopover tourism at a tourist destination (see McKee, 1998; Andriotis and Agiomirgianakis 2010; Brida et al., 2012b). The purpose of this research is to provide an in-depth investigation on passengers’ travel experience and behaviour when visiting the two main ports of Uruguay, i.e. Montevideo and Punta del Este, and to establish whether this profile of visitors evolved between the two tourist seasons 2008–2009 and 2009–2010. Uruguay is a very interesting case study for tourism. Although it is a small country, tourism represents a considerable sector, with about 0.8 tourists for every inhabitant in 2010, according to MINTUR (2011a), and a rapid growth in tourist flows (15%) compared with that in 2009. Uruguay’s performance in tourism was highlighted by the UNWTO (2008), which used it as a case study in the world, not only in view of the number of visitors and the foreign exchange earnings but also because this small country focused on constantly improving the quality of its tourist products. This study is based on a survey conducted by MINTUR (2011b). Descriptive statistics showed significant differences in the main socio-demographic indicators between the two years of survey. Further segmentation analyses were then performed to test whether the differences were related to a change in visitor profiles. The analysis regarded socio- demographic and travel-related characteristics. Three research objectives in particular were pursued, each corresponding to the use of a single statistical technique. First, a study on the set of variables was performed through a correspondence analysis, with the objective of extracting and describing the latent factors underlying the selected characteristics. Second, a hierarchical cluster analysis with appropriate stopping rules made it possible to identify a set of homogeneous groups of *Correspondence to: J. G. Brida, Free University of Bolzano, School of Economics and Management, Bolzano, Italy. E-mail: [email protected] Copyright © 2012 John Wiley & Sons, Ltd. International Journal of Tourism Research, Int. J. Tourism Res., 16: 209–222 (2014) Published online 27 September 2012 in Wiley Online Library (wileyonlinelibrary.com) DOI: 10.1002/jtr.1916
-
Upload
maria-nela -
Category
Documents
-
view
215 -
download
2
Transcript of Segmenting Cruise Passengers Visiting Uruguay: a Factor-Cluster Analysis

Segmenting Cruise Passengers Visiting Uruguay: a Factor–Cluster Analysis
JUAN GABRIEL BRIDA1,*, RAFFAELE SCUDERI1 and MARÍA NELA SEIJAS2
1Free University of Bolzano, School of Economics and Management, Bolzano, Italy2Universidad ORT – Uruguay, Montevideo, Uruguay
ABSTRACT
The study aims to provide a better understanding of cruise travel from passengers’ characteristics and experience in two ports of call in Uruguay.A multivariate market segmentation analysis was used, on the basis of 5151 survey data collected during the 2008–2009 and 2009–2010seasons. A correspondence analysis revealed the underlying latent factors in the set of variables. A hierarchical clustering from correspondenceanalysis segmented the sample into homogeneous groups. Finally, a decision tree highlighted the most predictive variables for each cluster. Thestudy identifies distinct segments by country of residence, occupation, locations visited in Uruguay, satisfaction and previous visits to thecountry. Copyright © 2012 John Wiley & Sons, Ltd.
Received 14 March 2012; Revised 28 July 2012; Accepted 14 August 2012
Keywords: cruise tourism; CART; hierarchical clustering; market segmentation; Uruguay.
INTRODUCTION
Cruise tourism has been the fastest growing segment in thetravel sector around the world with an average annual growthrate of passengers of 7.4% for the period 1990–2007 for atotal of 940 million international tourist arrivals worldwidein 2010 (see Brida and Zapata Aguirre, 2010b; Cruise LinesInternational Association, 2010). The growth of cruisetourism is expected to continue into the future, as only asmall proportion of the population owning the necessaryresources opted for this kind of tourism (Chase and Alon,2002; Chase and McKee, 2003; Brida and Risso, 2010). Inparticular, the increasing importance of this industry wasled by emerging economies (+8%), whereas the advancedeconomies grew at a slower pace (+5%). The World TourismOrganization (UNWTO) also highlights the recovery of ‘TheAmericas’ (+8%) after the fall suffered in 2009 as a resultof the financial crisis in North America and the impact ofthe swine flu epidemic (MINTUR, Ministry of Tourism andSport of Uruguay, 2011a).
This form of tourism accounts for only about 2% of theworldwide total leisure travel. Nevertheless, the number ofdomestic and international cruise passengers has increasedvery rapidly, from about 4 million in 1990 to more than14 million in 2009 (Brida and Zapata Aguirre, 2010a).Cruises represent the paradigm of globalization: physicalmobility, international capital that can be relocated anywhereand at any time, crews coming from different countries onthe same ship, no national or international regulations andmarine registrations optimally selected. A cruise ship repre-sents all four faces of the tourism industry: transportation,accommodation (including food and beverages), attractionsand tour operators. Thirteen million people took a cruise in2008, with the industry predicting that more than 30 million
people will do so in 2015 (Cruise Lines International Associa-tion, 2010). Cruise tourism can benefit a destination by increas-ing or improving foreign exchange earnings, profit, taxes, em-ployment, positive externalities and economies of scale(Dwyer and Forsyth, 1998; Dwyer et al., 2004; Pratt andBlake, 2009; Brida et al., 2012a). On the other hand,cruise tourism requires less infrastructure than stopovertourism at a tourist destination (see McKee, 1998; Andriotisand Agiomirgianakis 2010; Brida et al., 2012b).
The purpose of this research is to provide an in-depthinvestigation on passengers’ travel experience and behaviourwhen visiting the two main ports of Uruguay, i.e. Montevideoand Punta del Este, and to establish whether this profile ofvisitors evolved between the two tourist seasons 2008–2009and 2009–2010. Uruguay is a very interesting case study fortourism. Although it is a small country, tourism represents aconsiderable sector, with about 0.8 tourists for every inhabitantin 2010, according to MINTUR (2011a), and a rapid growth intourist flows (15%) compared with that in 2009. Uruguay’sperformance in tourism was highlighted by the UNWTO(2008), which used it as a case study in the world, not onlyin view of the number of visitors and the foreign exchangeearnings but also because this small country focused onconstantly improving the quality of its tourist products.
This study is based on a survey conducted by MINTUR(2011b). Descriptive statistics showed significant differencesin the main socio-demographic indicators between the twoyears of survey. Further segmentation analyses were thenperformed to test whether the differences were related to achange in visitor profiles. The analysis regarded socio-demographic and travel-related characteristics. Three researchobjectives in particular were pursued, each corresponding tothe use of a single statistical technique. First, a study on theset of variables was performed through a correspondenceanalysis, with the objective of extracting and describing thelatent factors underlying the selected characteristics. Second,a hierarchical cluster analysis with appropriate stopping rulesmade it possible to identify a set of homogeneous groups of
*Correspondence to: J. G. Brida, Free University of Bolzano, School ofEconomics and Management, Bolzano, Italy.E-mail: [email protected]
Copyright © 2012 John Wiley & Sons, Ltd.
International Journal of Tourism Research, Int. J. Tourism Res., 16: 209–222 (2014)Published online 27 September 2012 in Wiley Online Library (wileyonlinelibrary.com) DOI: 10.1002/jtr.1916

individuals, characterized by similar demographic features andoverall perception of their experience in Uruguay. Third, thetwo perspectives of the variables and individuals studies werecombined in a classification and regression tree (CART) anal-ysis, the purpose of which was to single out which variableswere the best predictors for classifying individuals in differentclusters.
CRUISE PASSENGERS AND THEIR EXPERIENCES INA PORT OF CALL: REVIEW OF THE LITERATURE
Research on cruise tourism has become more popular sincethe beginning of this decade (Braun et al., 2002; Klein,2005; Dowling, 2006; Silvestre et al., 2008; Andriotis andAgiomirgianakis, 2010; Brida et al., 2012a). This sectionprovides an overview of the main findings of the studiesaimed at profiling passengers’ travel experience as visitorsof a port of call as a tourist destination.
Return to port as a land visitorAn important stream of the literature focused on quality,motivation, satisfaction and intention to repurchase a cruisetrip (Marti, 1992; Qu and Ping, 1999; De la Viña and Ford,2001; Petrick, 2004, 2005; Duman and Mattila 2005; Petricket al., 2006, 2007). One important aspect concerns repurchasebehaviour, i.e. a repeat visit to a destination of land travel. Portsof call can be regarded as one of the main reasons why travel-lers choose specific cruises (Henthorne, 2000; Diedrich, 2010).This should encourage destination managers in identifyingtheir cruise passenger market and enhance factors that motivatevisitors to consider the same destination for a future landvacation. Profiling consumers’ characteristics has thus becomean important issue in the literature on cruise tourism. This hasbeen carried out by studying the determinants of the ‘declara-tion of intention’ to return to the place as land visitors. Withthis purpose, Gabe et al. (2006) carried out an analysis ofvisitors to the port of Bar Harbor, USA. Evidence indicateda positive effect of the total number of visits and the lengthof stay in the destination, whereas the distance betweenrespondents’ place of residence and Bar Harbor had a nega-tive effect. Similarly, Silvestre et al. (2008) analysed themain factors of the attractiveness of the Azores to cruisepassengers and determined which elements influenced theirintention to revisit and the likelihood of their recommendingthe cruise to friends and relatives. Their results showed thatthe city’s attractions and the overall visit experience wereimportant determinants of both elements. Miriela andLennie’s (2010) analysis reported that factors impactingpositively on cruise passengers’ willingness to return toCuraçao for a land-based vacation were the number of hoursspent in the destination, occupational status, being a repeatcruise tourist, having received information onshore andhaving a higher level of education.
The evidence on the real effect of simulating land revisitingis not conclusive and instead seems to indicate the absence ofany such loyalty. Although destination managers normallyassume that cruise passengers are likely to return on theirown, and the intention to return expressed by passengers
during surveys is in favour of revisiting, little research has beencarried out to determine whether their purpose became actual.In a recent study, Marusic et al. (2008) showed that less than3% of cruise passengers who visited Croatian destinationsduring 2000–2006 returned in 2006 as land-based visitors.Similar results are reported in Klein’s (2003) researchsponsored by American Express, who indicated that onaverage 4% of first-time land-based tourists visited a particularCaribbean island previously on a cruise. Also, Chesworth’s(2006) study on the cruise industry in Atlantic Canada affirmedthat few cruisers return to a destination by land and that theprobability of returning is surprisingly higher by another cruiseship than by land.
Impact of cruisesProfiling visitors and differentiating them from land touristswere the purposes also of the literature analysing the impactof cruises from economic, socio-cultural and environmentalperspectives. An extensive review can be found in Bridaand Zapata Aguirre (2010b). Dwyer and Forsyth (1996)investigated the economic impact of cruise tourism inAustralia and found, among the other things, that cruisetourists are higher yield tourists spending on average andper day much more than other categories of internationaltourists. The Center on Ecotourism and SustainableDevelopment (2006) studied cruise tourism in Belize, andtheir evidence was the opposite of that of Dwyer andForsyth, i.e. the average cruise passenger spent less thanhalf as much as the average stay over visitor. Gabe andMcConnon (2009) analysed the economic impact of cruisepassengers in Portland, Maine, and found that the averagepassenger took several cruises and came mainly from theUSA. More recently, Brida et al. (2012c) showed importantdifferences between cruise tourists in Cartagena de Indiasand land tourists, where the former were heavier spenders,younger and wealthier; stayed longer at the destination;and tended to travel in groups.
Segmentation of cruise passengersTo the best of the authors’ knowledge, few papers havebeen similar in their intent to the present work, i.e. tosegment cruise passengers by simultaneously taking intoconsideration characteristics, behaviours and onshore expe-rience while visiting a port of call. We are referring toauthors whose work was not intended to assess the determi-nants of specific characteristics. This kind of literaturetypically made use of a multivariate analysis to find latentand common factors to variables, and clustered visitors inrelation to common characteristics. The aim of these workswas to describe the ‘travel experience’ as a whole, asemerging from data. Among these studies, Thurau et al.(2007) applied a factor analysis to identify the travel prefer-ences of cruise passengers visiting an ecotourism area nearPanama Canal. They also used a cluster analysis with theaim of determining the different market segments of therespondents. They showed that the different clusters wererelated to different activities at the destination. Brida et al.(2012c) analysed travel experiences of passengers arrivingat Cartagena de Indias (Colombia), by applying a set of
210 J. G. Brida, R. Scuderi and M. N. Seijas
Copyright © 2012 John Wiley & Sons, Ltd. Int. J. Tourism Res., 16: 209–222 (2014)
DOI: 10.1002/jtr

factorial and classification techniques to identify groups ofcruise passengers. Six distinct clusters were identified:perception of safety and degree of satisfaction with thetrip were the most discriminating factors. Andriotis andAgiomirgianakis (2010) studied cruise ship passengers’motivation, satisfaction and likelihood of return to the port ofHeraklion (Crete, Greece). Findings of a factor analysissuggested that ‘exploration’ and ‘escape’were among the mainmotivations of visitors, and ‘product and services’ as well as‘tour pace’ are significant dimensions in shaping overallsatisfaction levels. Researchers also recommend that destina-tion managers extend the amount of time that passengers spendoffshore.
Main implications from the literature reviewOur review highlights some stylized facts. Whatever methodof approach was used, length of stay and overall experience,in terms of culture and attractions provided in the destination,were the main factors that positively influenced the cruisers’experience at destination and their intention to repeat theirvisit either as cruisers or land tourists. The present paper –via factor, cluster and classification tree analyses – intendsto expand this line of research, providing new evidence onthe main factors characterizing customers’ preferences andmotivations.
Unlike most of the papers in the mainstream of litera-ture, our research will not focus on the probability ofthe cruise passenger returning to the destination as a landvisitor. In particular, we will assess the different visitorprofiles using socio-demographic characteristics, the posi-tive or negative perceptions about visiting the country andthe expenditure pattern of cruise passengers arriving atUruguayan ports of call. Our aim is, in particular, toclassify cruise visitors into mutually exclusive groups, soas to get a better understanding of cruise passenger typol-ogies that could give helpful information to policy-makersand marketing organizations to promote cruising inUruguayan destinations.
The data consider cruise passengers arriving at differentports of call, which may prove a factor of relevance in thesegmentation of cruise visitors and which is seldom includedin cruise tourism research (Dwyer and Forsyth, 1996; Bridaet al. 2012c).
TOURISM AND CRUISES IN URUGUAY
Uruguay is a small country located in southern South America,next to Argentina and Brazil. As of 2010, it had a population of3.4 million inhabitants, and the gross domestic product (GDP)per capita was $14 277 (World Bank, 2011). With a very mildclimate, Uruguay’s best tourist season is summer, which goesfrom December to March, when thousands of tourists comeby land, sea or air to enjoy Uruguayan beaches, especiallyPunta del Este, considered the main summer resort in SouthAmerica. As seen in worldwide market trends, cruise tourismin Uruguay has been rapidly growing and has become a signif-icant element of the local economy. According to the 2010
Yearbook of MINTUR (see MINTUR, 2011a), in 2010, therewere 2 407 676 visitors, excluding cruise passengers (whichwere 299 699), to give a total of 2 707 375 visitors, whichrepresented a 15% growth compared with that in 2009. Thisfigure is more significant if we consider that the populationprojected by the National Institute of Statistics for the year2010 was 3 356 584, with which we would have a volume ofvisitors representing 80% of the estimated population.Eighty-five per cent of visitors were from Brazil, with Monte-video (34%) and Punta del Este (23.7%) being the most visiteddestinations. The total spending over the year 2010 was$1,500m, representing an increase of 14% over the previousyear (MINTUR, 2011a).
As already said, the UNWTO (2008) considers Uruguayan interesting case study because of the considerable touristflows. The major effects of tourism on growth were pointedout in a recent paper by Brida et al. (2010), who performeda co-integration analysis and found a cointegrated vectorbetween Uruguayan real per capita GDP and tourism expen-diture, and a positive causal relationship runs from tourismexpenditure to real per capita GDP of Uruguay. The paperconfirms the high impact of tourism on the economic growthof the country.
Arrivals of cruise ships at Uruguayan ports have expe-rienced an upsurge in the last seasons, according to datapublished by MINTUR (2010, 2011a), an institution thatis entitled by law to stimulate, promote, regulate, researchand control tourism and the activities and services directlyrelated to it. Since the 2004–2005 season, there have beenincreasingly more cruise ship arrivals at the Uruguayanports Montevideo and Punta del Este. While in the2004–2005 season, there were 63 ship arrivals at Montevideoand 12 at Punta del Este, totalling 75 ships; in the 2009–2010season, there were 179 arrivals, with 54% arriving atPunta del Este, which surpassed Montevideo arrivals in the2008–2009 season. In the season 2011–2012, 233 shipsarrivals are expected. The number of people who came toUruguayan shores during the 2009–2010 season was356 198, of whom 218 024 arrived in Punta del Este (61%)and the remainder 39% in Montevideo. The proportion ofpeople out of the total of passengers who landed at the twoports was around 82%, an 18.18% increase compared with thatin the previous year as a result of increased landings in Puntadel Este (MINTUR, 2011a, 2011b). While early cruise seasonscoincided with the Uruguayan summer, in more recent times,they are gradually getting more extended. The 2011–2012cruise season now runs for the first time from November toMay. Cruise ships originate from Argentina, Brazil, Europe,North America or Japan.
Up to now, there have been two main cruise ports of call inUruguay: Montevideo, the capital city, and Punta del Este, themost renowned beach resort in South America. According torecent statements by the authorities (Launching Cruise Season2011–2012, 2011), it is very likely that in the 2012–2013cruise season, Colonia (UNESCO World Heritage Site)and La Paloma (the Atlantic Ocean beach resort) will beincorporated as new ports of call. In the 2011–2012 season,Montevideo also became a homeport for a cruise line thattravels regularly to Brazil.
Segmenting Cruise Passengers Visiting Uruguay 211
Copyright © 2012 John Wiley & Sons, Ltd. Int. J. Tourism Res., 16: 209–222 (2014)
DOI: 10.1002/jtr

DATA AND METHODOLOGY
Two surveys on cruise tourism in UruguayThe data used in this research were taken from two surveysconducted by MINTUR (2011b) in the two cruise seasonsof 2008–2009 and 2009–2010. The Appendix reports thequestionnaire that was administered in 2009–2010, i.e. thelast one for which data are available. Questions concernedrespondents’ socio-demographic characteristics, past visits(i.e. first visit or number of visits to Uruguay), expenditure atthe place visited and elements of satisfaction/dissatisfactionwith the visit. The questionnaire in the previous 2008–2009survey differed from it only because it considered differentage classes. If on one side these differences might havenegative implications on the strict comparability of the twosurveys, on the other side, age classes do not differ too much(Table 1) and thus can be considered as referring to similarlife stages.
A preliminary survey was conducted to validate the ques-tionnaire. Two independent samples were obtained from eachof the two ports of calls of Punta del Este and Montevideo.The sampling strategy followed a two-step stratified approach.At first, cruise ships were selected randomly from a list of boatsexpected to stop at the two locations through systematicsampling. In the second stage, interviewees from travel groupswere chosen to ensure equiprobability. Trained pollsters
interviewed cruise visitors after the visit at the port of calland before they returned to the ship. Questions concernedsocio-demographic characteristics, features of the places vis-ited, characteristics and perception of the trip, and expenditurepattern. The first 2008–2009 wave consisted of 1803 surveys,whereas in the second 2009–2010 season, 3348 interviewswere collected.
Descriptive statisticsTable 1 reports descriptive statistics on socio-demographicvariables, as well as the results of t-tests on the differencebetween proportions. The distribution by nationalitypresented a concentration of Brazilians, Argentineans andUS citizens, who represented more than 70% of cruisepassengers in both seasons. From one season to the other,there was a significant increase in the proportion of peopleliving in Brazil and North America who chose a cruise toUruguay. Residents in North America and Europe reportedinstead the greatest changes in the proportions. Cruisevisitors were mostly women, middle-aged, retirees and pro-fessionals. Gender distributions showed a higher proportionof women and did not differ significantly from one year toanother, whereas the proportion of retirees decreased signifi-cantly and considerably. The share of tourists in the youngestage bracket decreased significantly in favour of middle-agedcruisers. About 70% of cruise passengers arriving inUruguay visited the country for the first time. Between thetwo years, there was a significant decrease in first timers,and, at the same time, the proportion of the most loyalvisitors increased. As with factors of satisfaction with thetrip, 70% or more declared they liked everything; about12% enjoyed local people; 6% were satisfied with thebeaches and boardwalk; and about 3% were interested inbuildings and architecture. The average amount tourists spentper capita in each season was $58 for 2008–2009, and $61for 2009–2010. Seventy-one per cent of expenditure wason shopping, 16% on food and 6% on tours. For comparativepurposes, the average expenditure per capita of a touristvisiting Uruguay, excluding cruise visitors, was $72 for2008 and $79 for 2009 (MINTUR, 2010, 2011a). It shouldbe noted the small difference between the cruise passengers’expenditure and land tourists’ expenditure. Similar studiesreported that expenditure of land tourists, on average, wasaround double the expenditure of cruise passengers (Marusicet al., 2008; Brida and Risso, 2010; Diedrich, 2010; Bridaet al., 2012a). This is probably because a large portion ofland tourists in Uruguay are Argentineans who are ownersof second homes and hence not purchasing accommodation.
Aggregate statistics for the two joint cruise seasons arereported in Table 2. It can be noted that the emerging distri-butions highlight a large proportion of guests from Brazil andArgentina. Cruise tourists were mostly women aged less than65 years who visited Uruguay for the first time. Professionalsand retirees were the most frequent statuses.
Table 3 reports the socio-demographic profiles emergingfrom comparing people visiting Punta del Este and Montevi-deo in cruise seasons 2008–2009 and 2009–2010. All theconsidered variables show significant differences between theproportions of people reporting the considered modalities.
Table 1. Socio-demographic characteristics of cruise visitors toUruguay, 2008–2009 and 2009–2010
2008–2009 (%) 2009–2010 (%) t
ResidenceBrazil 32.7 49.8 *North America 31.6 15.1 *Argentina 15.5 21.8 *Europe 10.0 6.2 *Other, South America 7.2 5.0 *Africa/Oceania 2.0 1.1 *Asia 1.0 1.0GenderMen 42.8 41.4Women 57.2 58.6Age (years)19–35 (18–29) 14.3 8.2 *36–64 (30–65) 64.8 70.5 *>64 (>65) 20.9 21.3Previous visits (excl. this)None 72.3 69.7 *1 10.7 12.02 6.4 5.83 2.5 3.04 1.2 0.7>4 6.9 8.8 *OccupationRetirees 33.5 25.1 *Professionals 31.9 33.8Owner 11.3 13.6 *Employee 7.8 8.3Other 15.8 19.2 *
Note: Age brackets in 2009–2010 were 18–29, 30–65 and>65years. Asteriskin the t column indicates significant differences between the proportions ata=0.05.
212 J. G. Brida, R. Scuderi and M. N. Seijas
Copyright © 2012 John Wiley & Sons, Ltd. Int. J. Tourism Res., 16: 209–222 (2014)
DOI: 10.1002/jtr

Punta del Este was more preferred by Brazilians andArgentinians. The distribution of people’s nationalitywas more heterogeneous for Montevideo inasmuch as peoplefrom Europe and the Americas also reported higher percen-tages than Punta del Este. Women and younger cruisersvisited Punta del Este more frequently than Montevideo.Repeat visiting was more frequent in Montevideo, which alsoreported a much higher proportion of retirees.
MethodologyThe earlier descriptive evidence of previous paragraphsshows that the profiles of visitors are heterogeneous if theinformation is compared between both the two cruiseseasons and the two ports of call. On the one hand, differentprofiles of customers in different ports of call can beexpected, and attributed to consumers’ travel preferences,while on the other hand, significant differences from oneyear to the following are quite unexpected and need to bestudied more in depth. Specifically, the next sections willpresent a segmentation analysis to assess whether beyondthe differences in socio-demographic attributes there canbe found similar segments of consumers in the two seasons.This requires extracting the latent traits in common to statis-tical units and finding clusters of visitors with similarcharacteristics.
A subset of variables were selected among the ones thatwere collected from the surveys. These were most closely
related to the experience of the visit. They concerned socio-demographic aspects (gender and age of the respondent,occupation and residence), trip-related (places visitedbetween Montevideo, Colonia, Punta del Este and others;elements of dissatisfaction with the visit) and past trip experi-ences (first time visit and number of past visits). As remarkedearlier, age classes differed from year to year, thus resultingin an imperfect comparability of the outputs.
Three techniques were applied to provide a segmentationof the cruise passengers according to the selected variables.The first aimed at finding common ‘latent’ factors underlyingthe visitors’ experience, starting from the ‘explicit’ informa-tion available from the original set of variables. Due to theexclusive presence of categorical variables, a multiplecorrespondence analysis (Benzécri, 1963, 1992) was used.It is an explorative technique that makes use of contingencytables to find new variables that (i) are the best linear com-binations of the original ones; (ii) are mutually independent;and (iii) as they are extracted, they concur in explaining adecreasing share of the total inertia, which is analogous tothe variability of the principal component analysis. Thetechnique makes it possible to perform the analysis for bothstatistical units and variables. In the present paper, it wasused from the variables side and thus to extract and analyselatent variables that concur in explaining the highestpercentage of inertia, which consequently reduces thenumerousness of the original set.
Table 2. Socio-demographic characteristics of cruise visitors toUruguay, 2008–2010
%
ResidenceBrazil 49.2North America 7.9Argentina 25.8Europe 8.4Other, South America 7.0Africa/Oceania 1.6Asia 1.0GenderMen 36.9Women 63.1Age≤64 (65) 78.8>64 (65) 21.2Previous visits (excl. this)None 69.81 11.72 6.63 2.44 0.9>4 8.6OccupationRetirees 27.5Professionals 33.6Owner 13.4Employee 7.9Other 17.6
Note: Theminimum age in 2008–2009 was 19 years, whereas it was 18 years in2009–2010. Age brackets in 2009–2010 were ≤65 and >65years. Asterisk inthe t column indicates significant differences between the proportions ata=0.05.
Table 3. Socio-demographic characteristics of cruise visitors toUruguay, 2008–2010: Montevideo and Punta del Este
Montevideo (%) Punta del Este (%) t
ResidenceBrazil 38.4 55.1 *North America 17.6 2.4 *Argentina 8.7 35.9 *Europe 17.8 2.7 *Other, South America 13.8 3.5 *Africa/Oceania 3.6 0.3 *Asia 0.1 0.1GenderMen 39.3 35.8 *Women 60.7 64.2 *Age (years)≤64 (or 65) 72.1 84.3 *>65 (or 66) 27.9 15.7 *Previous visits (excl. this)None 72.7 66.3 *1 11.4 12.02 5.8 7.4 *3 1.8 3.1 *4 0.8 0.9>4 7.5 10.3 *OccupationRetirees 35.6 20.5 *Professionals 30.5 36.1 *Owner 10.6 15.7 *Employee 6.3 9.3 *Other 17.0 18.4
Note: The minimum age in 2008–2009was 19years, whereas it was 18years in2009–2010. Age brackets in 2009–2010 were ≤65 and >65years. Asterisk inthe t column indicates significant differences between the proportions ata=0.05.
Segmenting Cruise Passengers Visiting Uruguay 213
Copyright © 2012 John Wiley & Sons, Ltd. Int. J. Tourism Res., 16: 209–222 (2014)
DOI: 10.1002/jtr
Once the dimension of the variables was reduced, a hier-archical cluster analysis was applied. This second step hadthe objective of classifying passengers according to the mostimportant latent factors that concur in explaining the overallvariability. Ward’s (1963) minimum variance algorithm onEuclidean distances was used, and the two stopping rulesof pseudo-F (Calinski and Harabasz, 1974) and pseudo-t(Duda and Hart, 1973) were adopted so as to decide the num-ber of clusters. Descriptive statistics then show how selectedand relevant modalities of the surveyed variables are distrib-uted within the clusters.
Finally, a classification and regression tree analysis(Breiman et al., 1984) was used to further characterize thegroups. It is a non-parametric and recursive technique thatallows representing the relationships between variablesthrough a hierarchical structure. In particular, it displayshow certain elements (‘parent’ nodes) originate others(‘child’ nodes) in such a way that the final child nodes repre-sent groups that are heterogeneous to each other, but unitspresent homogeneous characteristics within each of them.In this case, the objective was to identify the variablesthat best predicted the formation of the clusters that werefound in the previous step. The goal of the CART analysisis to obtain the most accurate prediction possible, and thishappens when the lowest misclassification rate betweenactual (i.e. the ones from cluster analysis) and CART-predictedgroups is reported.
MAIN FINDINGS
The empirical evidence was based on three subsamples.First, the two datasets in 2008–2009 and 2009–2010 wereanalysed separately. Findings were thus evaluated from thedatabase for the whole period 2008–2010, which wasobtained by opportunely merging the two with particular at-tention to the items that differed between the twoquestionnaires.
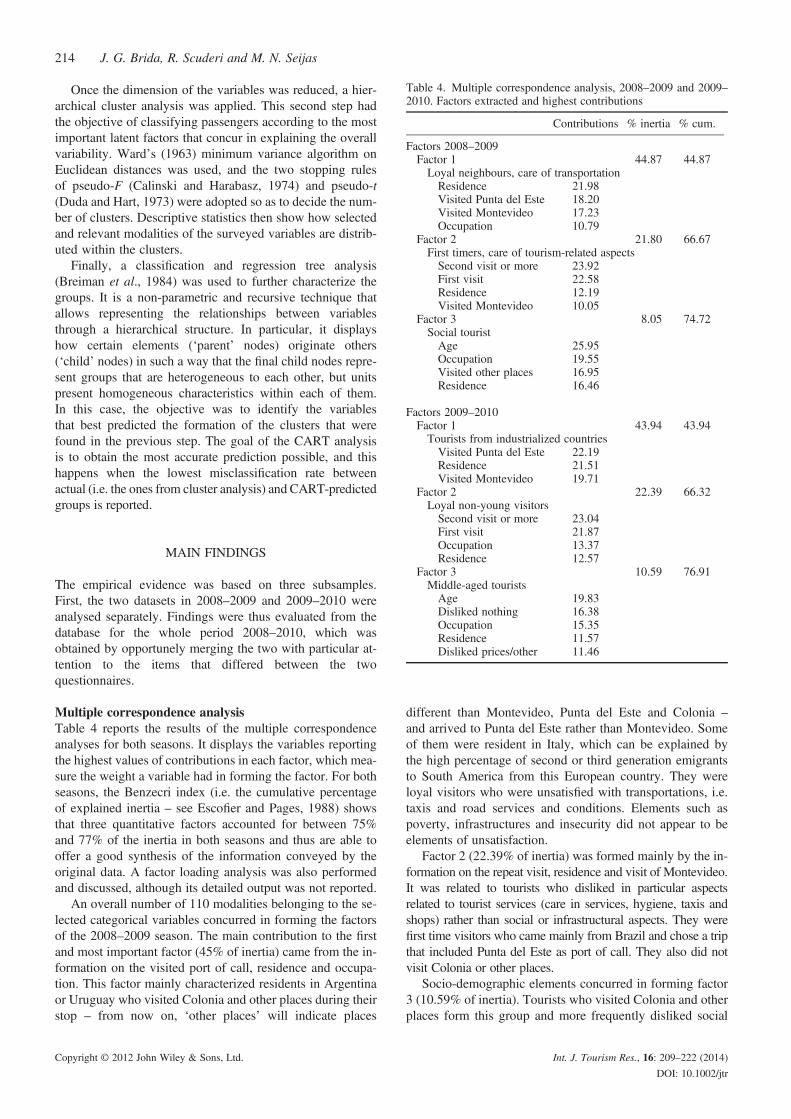
Multiple correspondence analysisTable 4 reports the results of the multiple correspondenceanalyses for both seasons. It displays the variables reportingthe highest values of contributions in each factor, which mea-sure the weight a variable had in forming the factor. For bothseasons, the Benzecri index (i.e. the cumulative percentageof explained inertia – see Escofier and Pages, 1988) showsthat three quantitative factors accounted for between 75%and 77% of the inertia in both seasons and thus are able tooffer a good synthesis of the information conveyed by theoriginal data. A factor loading analysis was also performedand discussed, although its detailed output was not reported.
An overall number of 110 modalities belonging to the se-lected categorical variables concurred in forming the factorsof the 2008–2009 season. The main contribution to the firstand most important factor (45% of inertia) came from the in-formation on the visited port of call, residence and occupa-tion. This factor mainly characterized residents in Argentinaor Uruguay who visited Colonia and other places during theirstop – from now on, ‘other places’ will indicate places
different than Montevideo, Punta del Este and Colonia –and arrived to Punta del Este rather than Montevideo. Someof them were resident in Italy, which can be explained bythe high percentage of second or third generation emigrantsto South America from this European country. They wereloyal visitors who were unsatisfied with transportations, i.e.taxis and road services and conditions. Elements such aspoverty, infrastructures and insecurity did not appear to beelements of unsatisfaction.
Factor 2 (22.39% of inertia) was formed mainly by the in-formation on the repeat visit, residence and visit of Montevideo.It was related to tourists who disliked in particular aspectsrelated to tourist services (care in services, hygiene, taxis andshops) rather than social or infrastructural aspects. They werefirst time visitors who came mainly from Brazil and chose a tripthat included Punta del Este as port of call. They also did notvisit Colonia or other places.
Socio-demographic elements concurred in forming factor3 (10.59% of inertia). Tourists who visited Colonia and otherplaces form this group and more frequently disliked social
Table 4. Multiple correspondence analysis, 2008–2009 and 2009–2010. Factors extracted and highest contributions
Contributions % inertia % cum.
Factors 2008–2009Factor 1 44.87 44.87Loyal neighbours, care of transportationResidence 21.98Visited Punta del Este 18.20Visited Montevideo 17.23Occupation 10.79
Factor 2 21.80 66.67First timers, care of tourism-related aspectsSecond visit or more 23.92First visit 22.58Residence 12.19Visited Montevideo 10.05
Factor 3 8.05 74.72Social touristAge 25.95Occupation 19.55Visited other places 16.95Residence 16.46
Factors 2009–2010Factor 1 43.94 43.94Tourists from industrialized countriesVisited Punta del Este 22.19Residence 21.51Visited Montevideo 19.71
Factor 2 22.39 66.32Loyal non-young visitorsSecond visit or more 23.04First visit 21.87Occupation 13.37Residence 12.57
Factor 3 10.59 76.91Middle-aged touristsAge 19.83Disliked nothing 16.38Occupation 15.35Residence 11.57Disliked prices/other 11.46
214 J. G. Brida, R. Scuderi and M. N. Seijas
Copyright © 2012 John Wiley & Sons, Ltd. Int. J. Tourism Res., 16: 209–222 (2014)
DOI: 10.1002/jtr

aspects such as insecurity and poverty. On the contrary, thesecruisers did not indicate the most tourist-related aspects aselements of dissatisfaction.
With regard to the second season, the first two factorsaccounted for more than 66% of the inertia, and in termsof contribution of the forming variables substantially coin-cided with those commented on for the first season.Different evidence derived instead from the analysis of thefactor loadings. Tourists living in industrialized countries(USA, Canada and Japan) formed factor 1 (43.94% ofinertia), i.e. the one where the contribution of the ports of calland residence to total information was prevalent. They didnot dislike the state of the routes and were mainly in occupa-tions that were different from being a skilled worker or in anunspecified situation of inactivity. They also did not visitColonia and other places than Montevideo and Punta delEste, whereas the latter destination is positively associatedto the factor.
The second factor is the one where the experience ofprevious visits, occupation and residence were importantvariables in determining it. It was mainly made of loyalnon-young visitors who mainly originated from countries ofSouth America different from Peru and Ecuador and didnot visit Colonia and other places.
The third factor was mainly contributed by variablesrelated to the degree of satisfaction with the trip (11% ofinertia), and specifically whether consumers appreciatedeverything, disliked prices or other things, as well as toage, occupation and residence. Middle-aged tourists fromArgentina, USA and Uruguay formed this segment. Theyare mainly skilled workers, craftsmen or retired, and didnot dislike the entertainment and fun during their vacation.They also visited different places than Colonia and otherdestinations.
Similar to that of season 2009–2010, the distinctivecriteria of residence and age emerged also from the jointanalysis of the two seasons (Table 5). Also here, the firstfactor was mainly contributed by the information on the
visit to the two ports of call, residence and former visits.As to the loadings, this factor presented the residents inJapan, China, Canada and other several industrializedcountries as related to the rightmost side of the factor(i.e. most extreme positive values), whereas the onesliving in Argentina, Uruguay and Italy who did not visitColonia and other places were in the leftmost side (i.e.negative ones). Instead, information on previous visits orfirst experience as tourist, as well as residence and occu-pation, concurred in forming factor 2. This latent variablewas mainly related to non-young interviewees, who didnot come from Uruguay and Peru, were not part of theclergy and did not visit Colonia and other places. Mainlysocio-demographic variables, as well as having visitedother places, contributed the third extracted factor. Thisis strongly related to not being in the last age bracket.
Cluster analysisThe cluster analysis was carried out from the quantitativeinformation of the factors extracted from the correspondenceanalysis. The stopping rules of pseudo-F and pseudo-t testsindicate that the optimal number of clusters is three. Resultswere reported in Table 6.
In 2008–2009, the biggest cluster was the first (739 visi-tors, 41% of the sample). It was mainly composed of firsttime visitors (99.7%) arriving at Punta del Este (96.5%),for the most part Brazilian (60.9%), women (68.2%) andprofessionals (37.9%), with the highest satisfaction with theirtrip (73.7%). From descriptive statistics of the sample, itemerged that this cluster included the second most importantspenders with a per capita amount of $59.
The second cluster accounted for 563 visitors. It wasmade up of first time visitors (99.5%) arriving at Montevideo(99.8%), mostly retirees (51.3%), North Americans (62.2%)and Europeans (17.2%), and in a relatively high percentageolder than 64 years (35.5%). This was the cluster of theheaviest spenders, with $64 per capita during their visit toUruguay.
The third cluster was the smallest one (501 visitors, 27.8%of the sample). It grouped the repeated visitors who havebeen to Montevideo and Punta del Este in significant percen-tages (49.7% and 60.5% respectively) and also visited otherlocations in Uruguay (6%). They were mainly professionals(31.9%), Brazilians (34.9%) and Argentineans (32.7%), thusbasically coming from neighbouring countries. It is impor-tant to note that it is more likely for a visitor from a neigh-bouring country to return to Uruguay as a land visitor,considering that it is easily – and cheaply – commuted byland, air or sea with Argentina and Brazil. Within this cluster,there can be found also the highest percentage of members ofcrews (8.2%). With respect to the expenditure behaviour ofthe cluster’s members, they were the lightest spenders withan average of $50 per capita.
Also in 2009–2010, three clusters of the same charac-teristics can be distinguished. Cluster 1 (1273 visitors,38% of the sample) included first time visitors, visitingPunta del Este (99.5%); mainly composed of Brazilians(68.3%) and Argentinians (29%), with professionals ac-counting for 39.4% with an average total expenditure of
Table 5. Multiple correspondence analysis, 2008–2010
Factors 2008–2010 Contributions % inertia % cum.
Factor 1 46.56 46.56Tourists from industrialized countriesVisited Punta del Este 20.10Visited Montevideo 17.72Residence 16.51Second visit or more 12.50
Factor 2 27.31 73.87Loyal non-young cruisersSecond visit or more 21.09First visit 20.01Occupation 12.88Residence 12.80
Factor 3 9.48 83.34Non old cruisersAge 37.93Occupation 30.26Residence 18.40Visited other places 4.39
Segmenting Cruise Passengers Visiting Uruguay 215
Copyright © 2012 John Wiley & Sons, Ltd. Int. J. Tourism Res., 16: 209–222 (2014)
DOI: 10.1002/jtr

$59 per capita; and with the highest satisfaction with thetrip (78.6%), although 11.2% dislike prices. The secondgroup (1124 visitors, 33.6% of the sample) is made upmainly of first time visitors arriving at Montevideo(99.3%), with the biggest representatives being NorthAmericans (35.9%), Europeans (14%) and Brazilians(39%); mostly retirees (40.9%) and professionals(31.4%); heaviest spenders (average total expenditure$64 per capita); highly satisfied with the trip (72.5%),with 3.8% disliking prices. The third cluster (951 mem-bers, 28.4%) is the one of repeat visitors; 72.6% visitedPunta del Este, 36.4% Montevideo and 6.7% other desti-nations; visitors were mainly residents in Argentina(50.8%) and Brazil (27.5%) and reported the highest per-centage of crew members (22%); and they were also thelightest spenders (average total expenditure per capita$50), and 72.9% declared a high satisfaction with the trip,with 12.3% disliking prices.
It is interesting to note that the ranking of clusters accordingto their size was the same in both seasons. Moreover, theresults are confirmed in Table 7, which reports the clusteranalysis obtained from merging the two databases. Overall,the ‘Brazilian professionals’ was the most representative clus-ter, followed by the ‘retirees’ group, to finish with the ‘repeatedvisitors’. However, the professionals’ cluster decreased inimportance in relative terms with respect to the other twoclusters, whereas the retirees and repeated visitor clusters wereproportionally more important in the second season. The levelof dissatisfaction also had an important role, assuming thehighest importance in the first season for visitors arriving atPunta del Este and being the second most important elementfor the members of this cluster in the second season. At thesame time, cluster 1 in both seasons showed the highest levelsof overall satisfaction with the trip. However, it is no noveltythat while Punta del Este is said to be ‘the Saint Tropez of
South America’, and usually land tourists complain about thelevel of prices, which are much higher during summer seasonthan in other locations in Uruguay. This is an important factorto consider, as it may constitute a deterrent of new arrivals ofcruise visitors in the future.
Classification and regression treeThe results of the CART technique in the three clusters obtainedfrom the previous analysis are reported in Figures 1–3.
Figure 1 reports that in 2008–2009, the best decisionrule to predict the membership of a cluster concerns theinformation on first time visiting Uruguay and whether
Table 7. Cluster analysis, 2008–2010
Cl. 1 (%) Cl. 2 (%) Cl. 3 (%)
Visited Montevideo 1.4 94.0 42.4Visited Punta del Este 99.9 14.0 66.3Visited Colonia/other 0.0 0.0 5.9First visit 100.0 100.0 1.0Second visit or more 0.1 0.2 99.0Brazil 68.3 41.2 34.4North America 1.3 19.7 5.5Europe 1.1 19.6 6.9Argentina 28.5 1.9 43.7Retiree 19.9 40.0 21.3Professional 39.0 30.6 31.0Owner 16.7 11.3 12.2Crew 0.2 4.2 15.3Disliked nothing 76.2 70.4 70.2Disliked prices 11.9 7.1 6.5Disliked other 9.6 8.9 10.6Women 69.1 61.9 57.4Age >64 16.2 28.7 17.8
Cl., cluster.
Table 6. Cluster analysis, 2008–2009 and 2009–2010
2008–2009 2009–2010
Cl. 1 (%) Cl. 2 (%) Cl. 3 (%) Cl. 1 (%) Cl. 2 (%) Cl. 3 (%)
Visited Montevideo 11.8 99.8 49.7 3.3 99.3 36.4Visited Punta del Este 96.5 9.2 60.5 99.5 2.8 72.6Visited Colonia/other 0.0 0.0 6.0 0.0 0.0 6.7First visit 99.7 99.5 1.2 95.3 93.9 3.2Second visit or more 0.3 0.5 98.8 4.7 6.1 96.8Brazil 60.9 3.4 34.9 68.3 39.0 27.5North America 13.3 62.2 12.2 1.0 35.9 4.8Europe 2.7 17.2 7.2 1.0 14.0 5.6Argentina 17.3 2.0 32.7 29.0 0.4 50.8Retiree 23.1 51.3 21.0 17.4 40.9 17.7Professional 37.9 25.9 31.9 39.4 31.4 30.5Owner 13.0 9.4 10.6 18.3 11.8 13.0Crew 1.8 1.6 8.2 0.5 2.8 22.0Disliked nothing 73.7 68.0 67.9 78.6 72.5 72.9Disliked prices 12.6 2.0 9.2 11.2 3.8 12.3Disliked other 10.4 8.3 10.6 8.7 10.7 9.5Women 68.2 51.2 60.9 64.6 63.8 50.6Age >64 12.9 35.5 15.0 14.7 34.3 15.2
Cl., cluster.
216 J. G. Brida, R. Scuderi and M. N. Seijas
Copyright © 2012 John Wiley & Sons, Ltd. Int. J. Tourism Res., 16: 209–222 (2014)
DOI: 10.1002/jtr

the tourist visited Punta del Este (Table 8). In particular,following the tree in Figure 1, repeated cruise visitorslead directly to a child (i.e. ‘terminal’) node that formscluster 3. First time visitors are instead discriminatedbetween those who arrived at Punta del Este (cluster 1)and those who arrived at Montevideo’s (cluster 2). Thismeans that only these two questions are needed to dis-criminate cruise visitors in each of the three clusters iden-tified. This of course may simplify the information neededfor tourism policy-makers to tailor marketing programmesto specific cruise visitor segments. Finally, as reported inTable 4, the overall predictive power of the model is veryhigh, for it classifies cruise visitors in the correct clusterin 95.1% of cases.
In the 2009–2010 season (Figure 2), the tree structure is alittle more complex. The most discriminating variables arethe visit to Punta del Este, first visit to Uruguay and occupa-tion. At the beginning of the tree, cruise passengers whovisited Punta del Este are discriminated between first-timevisitors (cluster 1) and repeat travellers (cluster 3). Cruisevisitors who did not visit Punta del Este form two furthergroups. The first is made up of first time visitors who areincluded in cluster 2. Loyal visitors are divided accordingto occupation into clusters 2 and 3 (respectively includingretirees and a set of other occupations). Also here, the overallpredictive power of the CART model is very high (Table 9),since 95.5% of cruise passengers are classified in the correctcluster, with cluster 2 having the highest prediction rate(97.7%).
The decision rule that best predicts clusters for the merged2008–2010 database (Figure 3) partially recalls the one thatwas found in 2008–2009. Also here, the best predictor ofgroups was first time visiting, which nevertheless ends inthe child node of cluster 3 for those who answered ‘yes’.Repeat visitors who did not and did visit Montevideo origi-nate the node that best predicts respectively clusters 1 and2. This tree reports the highest index of predictive power(97.1% – Table 10).
Figure 1. Classification and regression tree analysis, 2008–2009.
Figure 2. Classification and regression tree analysis, 2009–2010.
Figure 3. Classification and regression tree analysis, 2008–2010.
Table 8. Misclassification table, 2008–2009
Predicted
Observed Cluster 1 Cluster 2 Cluster 3 Total % correct
Cluster 1 711 51 3 765 92.9Cluster 2 26 509 3 538 94.6Cluster 3 2 3 495 500 99.0Total 739 563 501 1803 95.1
Table 9. Misclassification table, 2009–2010
Predicted
Observed Cluster 1 Cluster 2 Cluster 3 Total % correct
Cluster 1 1207 30 25 1262 95.6Cluster 2 5 1085 20 1111 97.7Cluster 3 60 9 906 975 92.9Total 1273 1124 951 3348 95.5
Segmenting Cruise Passengers Visiting Uruguay 217
Copyright © 2012 John Wiley & Sons, Ltd. Int. J. Tourism Res., 16: 209–222 (2014)
DOI: 10.1002/jtr

The predictive power of the CART model is unusuallyhigh in all three datasets, evidencing that only two questions(or three at the most in the 2009–2010 season) are reallyneeded to correctly segment the cruise passenger populationinto the pre-defined clusters. In other surveyed papers, thedifferences in the predictive power of clusters are not signif-icant at all (tests not reported). It is therefore possible to trustthe accuracy of the CART model to predict the rightmembership in all cases.
CONCLUSIONS
Although the cruise sector has been experiencing a remark-able growth in recent years (Brida and Zapata Aguirre,2010b; Cruise Lines International Association, 2010), to thebest of the authors’ knowledge, only a few papers haveinvestigated cruise passengers’ experience within a port ofcall. The present study contributed to this strand of the liter-ature by analysing cruisers’ characteristics, preferences andperceptions. Empirical evidence was based on a high-qualityoriginal database, as the paper used microeconomic datafrom a survey by MINTUR (2011b) on cruise ship passen-gers who stopped in Uruguay during the cruise seasons2008–2009 and 2009–2010. In addition to the two separateanalyses of the two databases, one further subset of unitswas considered from aggregating the information of bothcruise seasons.
In all subsets, the three latent dimensions that explainedan important part of the inertia according to the multiple cor-respondence analysis were extracted. Descriptive statisticsalready indicated significant differences between socio-demographic indicators of the two surveys. Such differenceswere reflected by different subsets of latent dimensions in thetwo years. Nevertheless, the residence of cruisers and theirloyalty played an important role in both seasons.
The most important dimension extracted in 2008–2009related to being resident in Argentina or Uruguay, whereasalso loyalty and elements of dissatisfaction with the trip con-curred in explaining a high percentage of variability. Thesevariables thus created a group of loyal ‘neighbours’ whowere interested in aspects related to transportation, a factorof first time visitors who were more interested in their touristexperience and a third latent variable of visitors who cared onthe social aspects of the visited place.
On the other side, age concurred with place of residenceand loyalty in composing the three main factors extracted
in 2009–2010. This gave rise to different latent behavioursdepending on residing in industrialized countries (excludingItaly due to the already mentioned phenomena of migration),on loyalty of visitors in the highest age classes and onmiddle-aged bracket. The merged 2008–2010 database ledto dimensions that are very similar to the ones of season2009–2010. If on one side this can be ascribed to thehigher sample size of the more recent survey, on the otherside, it confirms the importance of the mentioned variables.This indicates the presence of stabile latent elements overthe time.
Surprisingly, the two ports of call did not appear asstrongly relevant in characterizing the behaviour of thelatent factors, although the information related to disem-barking in one or the other always gave a relevant contribu-tion. On the contrary, having visited Colonia and otherplaces than Montevideo and Punta del Este frequentlycharacterized the behaviour of the cruisers. Jointly withwhat emerged previously from descriptive statistics, if onone side Montevideo and Punta del Este reported visitorswith different characteristics, on the other side, they canbe thought as ‘generalist’ destinations. On the contrary,Colonia and other places appear as ‘niches’ that are preferredby ‘neighbours’ and ‘social tourists’. Although having visitedMontevideo and Punta del Este did not take part in describingthe factors in such a relevant way as their contribution was,they played an important role in the methodologies thatfollowed.
A hierarchical cluster analysis was then performed fromthe extracted factors to identify a set of clusters of cruisers.Inside each group, individuals were characterized by simi-lar demographic features, expenditure pattern and overallperception of their holiday experience in Uruguay. Thecluster analysis highlighted three segments of cruise visi-tors with different trip profiles, i.e. retirees, professionalsand repeat visitors. Each group reported approximatelythe same characteristic between the two seasons, whichpersisted also in the merged dataset. The professionals’cluster is the largest one although its relative importancediminished in the second season. It comprises first timevisitors arriving at Punta del Este, mostly Brazilian womenand professionals, with the highest satisfaction with theirtrip. The cluster of retirees is composed of first time visi-tors arriving at Montevideo’s port, basically retirees whosecountry of residence is located in North America andEurope, with the highest percentage of visitors older than64 years. Retirees and professionals are the groups withthe heaviest spenders. Hence, as long as they are correctlyidentified, there are high chances of enhancing theireconomic impact in the country, by designing marketingstrategies tailored to their needs. This recalls a similarinvestigation of Brida et al. (2012a), who concluded thatthe heaviest spenders in Cartagena were cruise visitorscoming mainly from North America and belonging to theoldest age bracket.
The repeat visitors group consists of persons inMontevideoor Punta del Este, in significant percentages, as well as otherlocations in Uruguay, mostly coming from neighbouringcountries (Brazil and Argentina).
Table 10. Misclassification table, 2008–2010
Predicted
Observed Cluster 1 Cluster 2 Cluster 3 Total % correct
Cluster 1 1738 109 6 1853 93.8Cluster 2 24 1714 10 1748 98.1Cluster 3 0 0 1550 1550 100Total 1762 1823 1566 5151 97.1
218 J. G. Brida, R. Scuderi and M. N. Seijas
Copyright © 2012 John Wiley & Sons, Ltd. Int. J. Tourism Res., 16: 209–222 (2014)
DOI: 10.1002/jtr

The professionals’ cluster showed the highest levelsof satisfaction with their trip, although they were alsomost dissatisfied with prices. This phenomenon is notnew for land tourists in Punta del Este, which is themost frequent destination of the cluster’s members – theyoften complain about the level of prices, which are muchhigher during summer season than in other locations inUruguay. This should be an important factor to be consid-ered by private investors, as well as by local controlauthorities.
Finally, a CART analysis was used to identify whichvariables best predicted the classification of individuals intothe different clusters. In all the three subsamples, the bestprediction rules included whether the visit to Uruguay wasthe first. In both seasons, the fact of having visited Puntadel Este emerged, whereas in the merged dataset, specularinformation of having visited Montevideo was the rule.Occupation and information about repeat visit alsoconcurred in determining the more complex decision struc-ture of the season 2009–2010. The strong predictive powerof the model in both seasons (95.1% and 95.5% on averagerespectively in 2008–2009 and 2009–2010 seasons, and97.1% in 2008–2010) is remarkable, with only two tothree questions needed to assign cruise visitors to theright cluster.
Practical implicationsThe findings of the present investigation reveal that inorder to enhance cruise travel’s economic impact inUruguay, it is necessary to design marketing strategiesthat would differ according to the place of residence ofpotential cruisers, past experience of the visited countryand visited port of call.
Promoting first time visits to Punta del Este is themarket strategy that is most likely to be related to thehighest levels of spending. Also, retirees visiting Monte-video constitute a market segment that is likely to spendsimilar amounts. Tourists coming from specific places ofresidence and with particular occupations, such asBrazilian professionals or North Americans or Europeansand mostly retirees, are also categories that can enhancethe economic impact of cruises. Repeat visits seem tobe related to a low level of expenditure. According to thisevidence, improving the economic impact would then berelated to encouraging first time visits to the country,from specific countries and to specific destinations.
If on the one hand Montevideo and Punta del Este arethe most famous places visited by cruisers, on the otherhand, local authorities should pay particular attention topromoting visits to other places during stops of cruises atports of call. The latter in fact appear to be preferredmostly by ‘neighbours’ and ‘social’ visitors, rather than‘mass’ tourists. Of course, this comes with the need for atourist place to supply facilities that are compatible withsame-day visiting. Moreover, the promotion of specificterritories and places by local stakeholders has to beconsistent with the opportunity cost for cruise companiesin proposing new routes for tourists at a port of call. If
on the hand the most famous destinations attract masstourism, on the other hand, niches of tourists may be insearch of a cruise experience that would offer chances ofparticular experiences.
Special policies should also serve age-specific segmentsof the market, in particular, the needs of the youngest andthe elderly. Tourist satisfaction also needs to be improvedby acting on infrastructure and services improvements.
Limitations of the studyLimitations concern two aspects. The first is regarding theexplorative statistical techniques adopted. Although theyare widely acknowledged and provide intuitive interpreta-tions of the results, these remain at a descriptive level.The second is regarding the dataset itself. Although thisstudy uses high-quality datasets and with a great numberof observations, other supplementary information such astastes, opinions and attitudes would provide further usefuland precious information for a better segmentation of theUruguayan cruise visitor market.
Future researchFuture research may adopt inferential techniques to take fulladvantage of the high-quality datasets and the high numberof observations. One aspect worth investigating throughmore or less complex statistical techniques concerns theexpenditure of cruise visitors arriving in Uruguay, in termsof determinants and economic effect. Studying the factorsexplaining the previous travel experience might be of greatsupport for policy-makers and provide complementaryevidence to this paper.
Moreover, future surveys could be extended to other shipsdocked at ports, which of course are part of a different sort oftourism from cruises. The opinion of residents can be alsoinvestigated to assess the social impact of cruise tourism. Inparticular, the residents in Montevideo’s Old Town areworth investigating in view of the area’s particular andsomehow contradictory characteristics. The Old Town is atone and the same time the financial heart of the city,possesses its own historical heritage and has a low-incomepopulation. Finally, additional items of the questionnairecan assess the probability of a cruise passenger’s return toUruguay to compare these results with other similar studiesin other destinations.
ACKNOWLEDGEMENT
Our research was supported by the Autonomous Provinceof Bolzano, project “Le attrazioni culturali e naturalicome motore dello sviluppo turistico. Un’analisi del loroimpatto economico, sociale e culturale” and by the FreeUniversity of Bolzano, projects “L’impatto del turismodi crociere. Analisi empiricche per il caso del CaraibiColombiano” and “Determinants of tourist expenditure:theory and microeconometric models”.
Segmenting Cruise Passengers Visiting Uruguay 219
Copyright © 2012 John Wiley & Sons, Ltd. Int. J. Tourism Res., 16: 209–222 (2014)
DOI: 10.1002/jtr

APPENDIX
Cruises Survey Questionnaire 2009-2010
1
NationalityUruguay Argentina Bolivia BrazilParaguay Colombia Ecuador PeruVenezuela Chile Canada MexicoCuba U.S.A Other, America Spain Italy France United KingdomGermany Sweden Switzerland Other, EuropeIsrael China Japan Other, AsiaAfrica and OceaniaNA
2
Place of residenceUruguay Argentina Bolivia BrazilParaguay Colombia Ecuador PeruVenezuela Chile Canada MexicoCuba U.S.A Other, America Spain Italy France United KingdomGermany Sweden Switzerland Other, EuropeIsrael China Japan Other, AsiaAfrica and OceaniaNA
3
How many people are travelling with you?Men Women
Less than 18
18 - 29 years old
30 - 65 years old
More than 65 years old
4
Which places did you visit in Uruguay?
Montevideo
Punta del Este
Colonia
Other
5
Is this your first visit to Uruguay?Yes (go to question 7)
No6
How many times have you visited Uruguay, including this visit?
2 5
3 More than 5
4
7
OccupationRetired or pensioner Housewife
Student Rentier, annuitor
Other situation of inactivity Unoccupied
Other Employer, merchant, industrialist, farmer, businessman
Director, manager, diplomat Professional, technical, teacher, artist, journalist, customs broker
Boss, foreman, manager Skilled worker, vehicle driver, craftsman
Administrative employee, cashier, salesperson, banking, public employee
Waiters, porters, domestic service and other service workers
Workers in agriculture or fishing Unskilled workers
Athlete, coach, sports court Military, police, customs inspector, fireman, sailor
Religious (no ranking) Crew member
8
What is the total amount of money you and your group spent in Uruguay?
____________
220 J. G. Brida, R. Scuderi and M. N. Seijas
Copyright © 2012 John Wiley & Sons, Ltd. Int. J. Tourism Res., 16: 209–222 (2014)
DOI: 10.1002/jtr

9
What is the amount of money you spent on the following items?
Tour _______________ Shopping _______________
Food _______________ Other _______________
Transportation _______________
10
What did you like of Uruguay most?Everything State of the routes, signageLeather, wool, handicrafts Architecture, buildings and monumentsLandscape, plazas and green spaces HygienePrices MontevideoMercado del puerto WinesPeople warmth and care Tranquillity, securityBeach, boardwalk, coast FoodCasinos Punta del EsteOther tourist areas OtherDo not know, no data
11
There was something you disliked of Uruguay?Nothing PricesLack of booths Theft, lack of securityTaxi services Slow transitPoor care in services PovertyPublic services, procedures, abuses Shops closedSignage InfrastructuresLack of entertainment and fun HygieneState of the routes Lack of services in routesTolls OtherDo not know, no data
12
Date
__________ 13
Port
Montevideo
Punta del Este
14
Name of the cruiserAida Cara Albatros Alexander Von Humboldt Amadea AmsterdamArmonía Aurora Black Watch Bremen Carnival SplendourCelebration Celebrity Infinity Clelia II Columbus Costa Fortuna Costa Mágica Costa Mediterránea Costa Romántica Costa Victoria Crystal SerenityCrystal Simphony Delfhin Delphin Voyager Discovery DeutschlandEmpress Europa Explorer Grand Celebration Grand MistralGrand Voyager Infinity Insignia Le Boreal MarcopoloMariner of The Seas Minerva MSC Armonía MSC Lírica MúsicaÓpera Orchestra Norwegian Sun Prince Albert II PrinsendamQueen Mary II Radiance of The Seas Seabourn Odyssey Seabourne Pride Seabourn SpiritSeven Seas Mariner Silver Cloud Silver Spirit Silver Whisper SinfoníaSpirit of Adventure Splendour of The Seas SS Oceanic Star Princess The WorldVeendam Vistamar Zenith Other
15
Age and gender of the intervieweeMan Woman
Less than 18
18 - 29 years old
30 - 65 years old
More than 65 years old
16
Notes
Segmenting Cruise Passengers Visiting Uruguay 221
Copyright © 2012 John Wiley & Sons, Ltd. Int. J. Tourism Res., 16: 209–222 (2014)
DOI: 10.1002/jtr

REFERENCES
Andriotis K, Agiomirgianakis, G. 2010. Cruise visitors’ experiencein a Mediterranean port of call. International Journal of TourismResearch 12(4): 390–404.
Benzécri JP. 1963. Cours de Linguistique Mathématique. Universitéde Rennes: Rennes.
Benzécri JP. 1992. Correspondence Analysis, Handbook. Dekker:New York.
Braun BM, Xander JA, White KR. 2002. The impact of the cruiseindustry on a region’s economy: a case study of Port CanaveralFlorida. Tourism Economics 8(3): 281–288.
Breiman L, Friedman JH, Olshen RA, Stone CJ. 1984. ClassificationRegression Trees. Wadsworth International Group: Belmont,California.
Brida JG, Risso WA. 2010. Cruise passengers expenditure analysisand probability of repeat visit to Costa Rica: a cross-section dataanalysis. Tourism Analysis 15(4): 425–434.
Brida JG, Zapata Aguirre S. 2010a. Economic impacts of cruisetourism: the case of Costa Rica.Anatolia: an International Journalof Tourism and Hospitality Research 21(2):322–338.
Brida JG, Zapata Aguirre S. 2010b. Cruise tourism: economic,socio-cultural and environmental impacts. International Journalof Leisure and Tourism Marketing 1(3): 205–226.
Brida JG, Lanzilotta B, Lionetti S, Risso WA. 2010. The tourism-led-growth hypothesis for Uruguay. Tourism Economics 16(3):765–771.
Brida JG, Bukstein D, Garrido N, Tealde E. 2012a. Cruise passen-gers’ expenditure in the Caribbean port of call of Cartagena deIndias: a cross-section data analysis. Tourism Economics 18(2):431–447.
Brida JG, Pulina M, Riaño E, Zapata Aguirre S. 2012b. Cruisepassenger’s experience embarking in a Caribbean homeport.Ocean & Coastal Management 55(January): 135–145.
Brida JG, Pulina M, Riaño E, Zapata Aguirre S. 2012c. A marketsegmentation analysis of cruise passengers visiting the port ofCartagena de Indias. Tourism Geographies. DOI: 10.1080/14616688.2012.675510
Calinski RB, Harabasz JA. 1974. Dendrite method for clusteranalysis. Communications in Statistics - Theory and Methods3(1): 1–27.
Center on Ecotourism and Sustainable Development. 2006. Cruisetourism in Belize: perceptions of economic, social & environ-mental impact. Available at http://www.responsibletravel.org/projects/documents/Belize%20Executive%20Summary.pdf.(accessed 15 December 2011).
Chase G, Alon I. 2002. Evaluating the economic impact of cruisetourism: a case study of Barbados. Anatolia: An internationaljournal of tourism and hospitality research 13(1): 5–18.
Chase GL, McKee DL. 2003. The economic impact of cruise tourismon Jamaica. Journal of Tourism Studies 14(2): 16–22.
Chesworth N. 2006. The cruise industry and Atlantic Canada: a casestudy. In Cruise Ship Tourism, Dowling RK (ed.). CAB Interna-tional: Oxfordshire; 160–169.
Cruise Lines International Association. 2010. 2008 CLIA cruisemarket overview. Statistical cruise industry data through 2007.Available at http://www.docstoc.com/docs/17337714/ 2008-CLIACruise-Market-Overview-Statistical-Cruise-Industry-Data(accessed 15 December 2011).
De la Viña L, Ford J. 2001. Logistic regression analysis ofcruise vacation market potential: demographic and trip attri-bute perception factors. Journal of Travel Research 39(4):406–410.
Diedrich A. 2010. Cruise ship tourism in Belize: the implications ofdeveloping cruise ship tourism in an ecotourism destination.Ocean & Coastal Management 3(5–6): 234–244.
Dowling RK. 2006. Cruise Ship Tourism. CABI Publishing:London.
Duda RO, Hart PE. 1973. Pattern Classification and Scene Analysis.Wiley: London.
Duman T, Mattila AS. 2005. The role of affective factors onperceived cruise vacation value. Tourism Management 26(3):311–323.
Dwyer L, Forsyth P. 1996. Economic impacts of cruise tourism inAustralia. Journal of Tourism Studies 7(2): 36–43.
Dwyer L, Forsyth P. 1998. Economic significance of cruise tourism.Annals of Tourism Research 25(2): 393–415.
Dwyer L, Douglas N, Livaic Z. 2004. Estimating the economic con-tribution of a cruise ship visit. Tourism in Marine Environments1(1): 5–16.
Escofier B, Pages J. 1988. Analyses factorielles simples et multiples.Dunod: Paris.
Gabe T, McConnon J. 2009. Economic impact of cruise shippassengers in Portland, Maine. SOE Staff Paper 578. School ofEconomics. University of Main.
Gabe T, Collen L, McConnon J. 2006. Likelihood of cruise shippassenger return to a visited port: the case of Bar Harbor, Maine.Journal of Travel Research 44(3): 281–287.
Henthorne TL. 2000. An analysis of expenditures by cruiseship passengers in Jamaica. Journal of Travel Research 38(3):246–250.
Klein R. 2003. Charting a Course: The Cruise Industry, theGovernment of Canada, and Purposeful Development. CanadianCenter for Policy Alternatives: Halifax.
Klein R. 2005. Cruise Ship Squeeze: The New Pirates of the SevenSeas. New Society Publisher: Canada.
Marti BE. 1992. Passenger perceptions of cruise itineraries: a royalViking line case study. Marine Policy 16 (5):360–370.
Marusic Z, Horak S, Tomljenovic R. 2008. The socioeconomicimpacts of cruise tourism: a case study of Croatian destinations.Tourism in Marine Environments 5(2/3): 131–144.
McKee DL. 1998. Cruise tourism: assessing its structural and envi-ronmental costs. Caribbean Affairs 8(1): 135–147.
MINTUR, Ministerio de Turismo y Deporte. 2010. Anuario 2009.MINTUR, Ministerio de Turismo y Deporte. 2011a. Bases de datos.
Encuestas de cruceros. http://www.turismo.gub.uy/estadisticas/item/385-bases-de-datos (accessed 15 December 2011).
MINTUR, Ministerio de Turismo y Deporte. 2011b. Anuario 2010.Miriela CGL, Lennie P. 2010. Cruise tourists returning to Curaçao
for a land-based vacation: a logit model. Research Departmentof the Central Bank of the Netherlands Antilles, Working PaperNo.BNA.WP/10/1.
Petrick JF. 2004. First timers’ and repeaters’ perceived value. Journalof Travel Research 43(1): 29–38.
Petrick JF. 2005. Segmenting cruise passengers with price sensitivity.Tourism Management 26(5): 753–762.
Petrick JF, Tonner C, Quinn C. 2006. The utilization of criticalincident technique to examine cruise passengers’ repurchaseintentions. Journal of Travel Research 44(3): 273–280.
Petrick JF, Li X, Park SY. 2007. Cruise passengers’ decision-making processes. Journal of Travel & Tourism Marketing 23(1):1–14.
Pratt S, Blake A. 2009. The economic impact of Hawaii’s cruiseindustry. Tourism Analysis 14(3): 337–352.
Qu H, Ping EWY. 1999. A service performance model of HongKong cruise travelers’motivation factors and satisfaction. TourismManagement 20(2): 237–244.
Silvestre A, Santos CM, Ramalho C. 2008. Satisfaction and behav-ioral intentions of cruise passengers visiting the Azores. TourismEconomics 14(1): 169–184.
Thurau B, Carver A, Mangun J, Basman C, Bauer G. 2007. Amarket segmentation analysis of cruise ship tourists visiting thePanama Canal watershed: opportunities for ecotourism develop-ment. Journal of Ecotourism 6(1): 1–18.
UNWTO. 2008. Turismo de cruceros. Situación actual y tendencias,1st edn. Author: Madrid.
Ward JH. 1963. Hierarchical grouping to optimize an objectivefunction. Journal of the American Statistical Association 58(301):236–244.
World Bank. 2011. World development indicators. http://databank.worldbank.org/ddp/home.do (accessed 15 December 2011).
222 J. G. Brida, R. Scuderi and M. N. Seijas
Copyright © 2012 John Wiley & Sons, Ltd. Int. J. Tourism Res., 16: 209–222 (2014)
DOI: 10.1002/jtr