See also full report on the Bloomberg rankings (the league table for ...
46
GLOBAL LEGAL ADVISORY MERGERS & ACQUISITIONS RANKINGS 2013
Transcript of See also full report on the Bloomberg rankings (the league table for ...
GLOBAL LEGAL ADVISORY MERGERS & ACQUISITIONS RANKINGS 2013

Bloomberg
Bloomberg 2013 Annual
12/31/2013
1. Introduction
Table of Contents Mergers & Acquisitions Legal Advisory Rankings 2. 4. 5. 6. 9.
10. 14. 15. 16. 22. 23.
35. 36. 45.
Global Market Commentary Global Regional Volume Global Aggregate Deal Statistics Global Top Deals Global M&A Activity
Global Announced Deals
Cross Border Announced Deals
Global Private Equity Announced Deals
North America Announced Deals
Brazil Announced Deals
Western Europe Announced Deals
Eastern Europe Announced Deals
Asia Pacific Ex-Japan Announced Deals
Disclaimer
The Bloomberg M&A Advisory League Tables are the definitive publication of M&A advisory rankings. The tables represent the top financial and legal advisors across a broad array of deal types, regions, and industry sectors. The
rankings data is comprised of mergers, acquisitions, divestitures, spin-offs, debt-for-equity-swaps, joint ventures,
private placements of common equity and convertible securities, and the cash injection component of
recapitalizations according to Bloomberg standards.
Bloomberg M&A delivers real-time coverage of the M&A market from nine countries around the world. We provide a
global perspective and local insight into unique deal structures in various markets through a network of over 800
financial and legal advisory firms, ensuring an accurate reflection of key market trends. Our quarterly league table
rankings are a leading benchmark for legal and financial advisory performance, and DealSpace & DealBrief
newsletters provide summary highlights of weekly M&A activity and top deal trends. Visit {NI LEAG CRL <GO>} to download copies of the final release and a full range of market specific league table
results. Type MA <GO> 96 <GO> 82 <GO> to view live rankings.
For data submissions or queries, please contact:
Contact Phone Fax Email
North America
EMEA
Asia Pacific
LATAM
Eshani Gupte
Paula Cook-Dinan
Devanshi Desai
Fernando Simon
+1-212-617-5969
+44-20-3525-8104
+61-2-9777-8661
+55-11-3048-4619
+1-917-369-3965
+44-20-7942-1792
+61-2-9770-8561
+55-11-3048-4669
[email protected] General M&A queries may be submitted to: [email protected] For 24 hour global customer support call
+1 212 318 2000 +44 20 7330 7500 +65 6212 1000 +81 3 3201 8900
or press the HELP key twice on the BLOOMBERG PROFESSIONAL(R) service.
1

Global Review Bloomberg
MA <GO> LEAG <GO> NI DEALSPACE <GO> MARB <GO>
Total Annual Deal Volume by Industry
2
Annual Regional Deal Volume (as a share of total)
Regional Deal Activity
Industry Sector Deal Activity
• Global M&A volume in the fourth quarter fell 27.8% to $576.75B compared to the same period last year. Deal count also decreased by 2.8% compared to the same period last year, contributing to the overall drop. Despite this, overall volume for the year increased 4% to $2.33T from $2.24T in 2012 (excluding terminated deals).
• Aggregate M&A volume in the US was nearly 32% greater than the activity of the remaining top five acquirers combined in the fourth quarter. Annual volume in the region rose 8% in 2013 to $1.22T from $1.15T in 2012.
• Deal volume in EMEA increased by 8.5% from the previous year as its most active acquirer, the U.K., saw a 2.2% increase in deal making in the fourth quarter.
• Asia-based companies experienced overall declines in deal volume in 2013, though China saw a jump of 32.7% in M&A volume to $216.47B from $163.09B in 2012.
• Financials was the most active industry in terms of M&A in 2013, driven in the fourth quarter by American Realty Capital’s $9.85B acquisition of Cole Real Estate Investment in late October – the second largest deal of the quarter. Despite having the largest deal of the quarter – Oi SA’s pending acquisition of Portugal Telecom – activity in the Communications industry in the last 3 months of the year declined to only 11% of total volume, down from 35% in the third quarter.
• The Communications industry exhibited the largest growth by deal volume year over year, up nearly 42% from 2012. This was due primarily to Verizon Communications Inc’s $130.1B agreement to buy Vodafone Group’s stake in its wireless joint venture business.
• The top target industry for Private Equity by volume was Consumer, Non-Cyclical. Investment in the industry rose by $26.2B YoY, and was largely attributable to 3G Capital and Berkshire Hathaway’s $27.4B takeover of HJ Heinz.
• Despite a 48% year over year drop in total deal volume, targets in the Basic Materials industry earned the highest premiums with an annual average of 54.4% compared to 28.4% in 2012.
Basic Materials 4%
Communications 17%
Consumer, Non-cyclical
17%
Consumer, Cyclical
10% Diversified
1%
Energy 10%
Financial 22%
Industrial 10%
Technology 5%
Utilities 4%

Global Review Bloomberg
MA <GO> LEAG <GO> NI DEALSPACE <GO> MARB <GO>
A Year in Review: Largest M&A Deals
Jan Feb Mar Apr May Jun Jul Aug Sep Oct Nov Dec
Takeovers Fail to Thrive As CEO Scepticism Defeats Stock Gains
•Acquirer: OCI •TV: USD 10.5 B
•Acquirers: Berkshire Hathaway , 3G Capital •TV: USD 27.4 B •Key Dealmakers: A. O’Brien (JP), A. Weiss (Lazard)
•Acquirer: Midea Group Co Ltd •Country: China •TV: USD 4.9 B
•Acquirer: Thermo Fisher Scientific •TV: USD 15.9 B •Key Dealmakers: J. Styne (DB), C. Pritchard (JP)
•Acquirer: Berkshire Hathaway •TV: USD 10.4 B
•Acquirer: Vodafone Group •TV: USD 8.5 B •Key Dealmakers: S. Warshaw (UBS)
•Acquirer: Publicis Groupe •TV: 19.4 B •Key Dealmakers: K. Moelis (Moelis & Co), T. Whayne (Rothschild)
•Acquirer: GSW Immobilien •TV: USD 4.5 B
•Acquirer: Verizon Communications •TV: USD 130.1 B •Key Dealmakers: K Cook (GS), R. Friedsam (MS)
•Acquirer: Oi SA •TV: USD 14.3 B
•Target: Galaeo Airport Concession •TV: USD 8.3 B
•Acquirer: Sysco Corp •TV: USD 8.4 B
By Mohammad Hadi and Elizabeth Wollman
The value of global takeovers remained relatively subdued in 2013, as chief executive officers continued to worry about the viability of the global economic recovery, even as stock markets rose and the U.S. economy showed signs of strength. About $2.33 trillion of acquisitions were announced last year, compared with $2.24 trillion a year earlier, data compiled by Bloomberg show. That is still well below the $4.1 trillion announced in 2007.* Last year was marked by some large takeovers, including Verizon Communication Inc.'s $130 billion purchase of its wireless business from Vodafone Group Plc, the largest M&A transaction in a decade, and Publicis SA and Omnicom Group Inc.'s $35 billion merger creating the world's largest advertising company. The final three months of 2013 saw announced takeovers slide by more than 20 percent from a year earlier, according to data compiled by Bloomberg, even as the outlook improved in Europe and North America. A dearth of deals in banking and natural resources is partly to blame for the lack of a rebound. For energy and mining firms, weaker prices for oil, gas and metals and a long list of failed transactions from the 2002-2012 commodity boom are keeping chief executives from pulling the trigger.
*Figures include pending and completed deals only
3

Global Review Bloomberg
MA <GO> LEAG <GO> NI DEALSPACE <GO> MARB <GO>
Global M&A Quarterly Volume
Regional Volume : Notable Highlights • Global M&A activity totalled $2.33T in annual volume, a slight increase from 2012 levels. Deal count fell, however, from 27,965 to 27,830 as average deal size rose by
4.5% in 2013. • The Americas accounted for $1.42T of global volume – representing 61% of the total global volume in 2013. This is comparable to the activity seen in the region in
2012. Deal volume in EMEA reached $1.02T, increasing by 8.9% from last year. • Asia saw a 3.4% decline in annual volume, with the deal count decreasing by the same amount.
Deal Count
4
EMEA M&A Quarterly Volume
Americas M&A Quarterly Volume
APAC M&A Quarterly Volume
Tota
l Vol
ume
(USD
Mln
) Deal Count
Tota
l Vol
ume
(USD
Mln
) Deal Count
Tota
l Vol
ume
(USD
Mln
) Deal Count
Tota
l Vol
ume
(USD
Mln
)
e
0
1,000
2,000
3,000
4,000
5,000
6,000
7,000
8,000
0.00
100,000.00
200,000.00
300,000.00
400,000.00
500,000.00
600,000.00
700,000.00
800,000.00
2009
Q1
2009
Q2
2009
Q3
2009
Q4
2010
Q1
2010
Q2
2010
Q3
2010
Q4
2011
Q1
2011
Q2
2011
Q3
2011
Q4
2012
Q1
2012
Q2
2012
Q3
2012
Q4
2013
Q1
2013
Q2
2013
Q3
2013
Q4
Volume $(mil.) Deal Count
05001,0001,5002,0002,5003,0003,5004,0004,500
0.00
100,000.00
200,000.00
300,000.00
400,000.00
500,000.00
600,000.00
2009
Q1
2009
Q2
2009
Q3
2009
Q4
2010
Q1
2010
Q2
2010
Q3
2010
Q4
2011
Q1
2011
Q2
2011
Q3
2011
Q4
2012
Q1
2012
Q2
2012
Q3
2012
Q4
2013
Q1
2013
Q2
2013
Q3
2013
Q4
Volume $(mil.) Deal Count
0
500
1,000
1,500
2,000
2,500
3,000
0.00
50,000.00
100,000.00
150,000.00
200,000.00
250,000.00
300,000.00
350,000.00
400,000.00
2009
Q1
2009
Q2
2009
Q3
2009
Q4
2010
Q1
2010
Q2
2010
Q3
2010
Q4
2011
Q1
2011
Q2
2011
Q3
2011
Q4
2012
Q1
2012
Q2
2012
Q3
2012
Q4
2013
Q1
2013
Q2
2013
Q3
2013
Q4
Volume $(mil.) Deal Count
0
500
1,000
1,500
2,000
2,500
3,000
3,500
0.00
50,000.00
100,000.00
150,000.00
200,000.00
250,000.00
2009
Q1
2009
Q2
2009
Q3
2009
Q4
2010
Q1
2010
Q2
2010
Q3
2010
Q4
2011
Q1
2011
Q2
2011
Q3
2011
Q4
2012
Q1
2012
Q2
2012
Q3
2012
Q4
2013
Q1
2013
Q2
2013
Q3
2013
Q4
Volume $(mil.) Deal Count

Global Review Bloomberg
MA <GO> LEAG <GO> NI DEALSPACE <GO> MARB <GO>
Deal Breakdown : Notable Highlights
5
Global M&A Annual Aggregate Statistics
• The majority of deal making in 2013 (97% of deal count) occurred in the mid-market range (below $500M). There was a decrease in the number of deals valued between $1B-$5B as compared to the previous year, with 353 deals being brokered against 390 in 2012.
• Payments with the cash or stock option increased by 83% as a share of total deals compared to 2012, being used in 2.28% of all transactions. • The number of deals with announced premiums greater than 100% represented 0.62% of total volume this year, as compared 1.83% of total volume last year.
Terminated deals also increased significantly this year, representing 7.36% of total deals as compared to only 3.34% in 2012.
Deal Type Summary # Deals Volume Percent Company Takeover 11196 1.27T 54.68
Cross Border 9307 1.05T 45.2
Asset sale 6220 517.78B 22.24 Additional Stake Purchase 3472 412.89B 17.73
Private Equity 5798 369.67B 15.88
Majority purchase 2205 246.04B 10.57
Minority purchase 6580 216.94B 9.32
Tender Offer 437 146.39B 6.29
PE Buyout 667 134.76B 5.79
Joint Venture 895 43.75B 1.88
Secondary Transaction 262 41.31B 1.77
Recapitalization 31 40.46B 1.74
Venture Capital 3707 40.21B 1.73
Private Placement 618 37.51B 1.61
Going Private 36 28.59B 1.23
Management Buyout 187 25.13B 1.08
Other 1158 164.61 7.05
Payment Type Summary # Deals Volume Percent Cash 17146 1.52T 67.68
Stock 1048 220.67B 9.81
Cash & Stock 657 193.43B 8.6
Cash, Stock & Debt 29 136.85B 6.08
Undisclosed 7457 100.43B 4.46
Cash or Stock 55 51.4B 2.28
Cash & Debt 85 13.25B 0.59
Debt 109 8.41B 0.37
Stock & Debt 29 3B 0.13
Deal Size Breakdown # Deals Volume Percent > 10,000M 16 365.41B 0.06
5000.01-10,000M 35 240.49B 0.13
1000.01-5000M 353 711.75B 1.27
500.01-1000M 432 301.6B 1.55
0-500M 26994 709.09B 97
Announced Premiums # Deals Volume Percent >100% 46 6.54B 0.62
75.01-100% 32 3.55B 0.34
50.01-75% 88 26.3B 2.49
25.01-50% 229 132.88B 12.58
10.01-25% 214 226.05B 21.39
0-10% 185 96.47B 9.13
Current Status # Deals Volume Percent Pending 8947 1.11T 44.15
Completed 18883 1.22T 48.49
Terminated 223 184.99B 7.36
Public Target Multiples # Deals Min - Max Median Net Income 1214 .00 - 3601.22 18.71 EBIT 1152 .00 - 3690.48 13.14 EBITDA 1032 .01 - 3014.93 8.06 Book Value 1839 .00 - 3288.83 1.78 Stockholder Eqty 1852 .00 - 3288.83 1.75 Revenue 1811 .00 - 1421.51 1.27 Market Cap 1590 .00 - 205.94 1.27 Enterprise Value 1474 .00 - 175.52 1.04 Total Assets 1985 .00 - 305.05 0.79
Global Review Bloomberg
MA <GO> LEAG <GO> NI DEALSPACE <GO> MARB <GO>
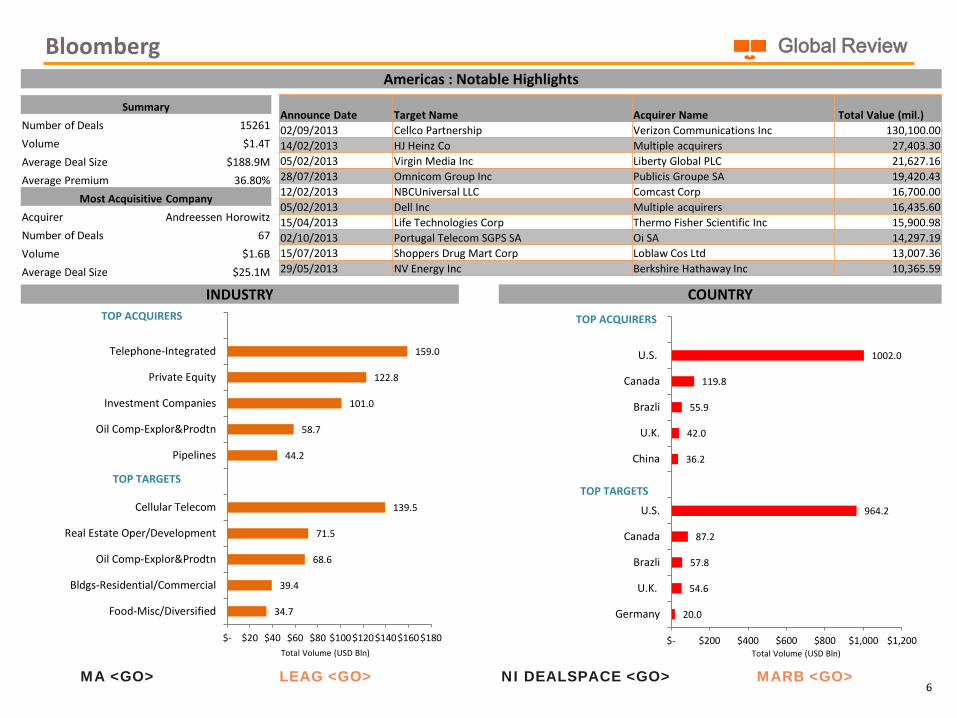
INDUSTRY
Americas : Notable Highlights
6
COUNTRY
Total Volume (USD Bln) Total Volume (USD Bln)
TOP TARGETS TOP TARGETS
TOP ACQUIRERS TOP ACQUIRERS
34.7
39.4
68.6
71.5
139.5
44.2
58.7
101.0
122.8
159.0
$- $20 $40 $60 $80 $100 $120 $140 $160 $180
Food-Misc/Diversified
Bldgs-Residential/Commercial
Oil Comp-Explor&Prodtn
Real Estate Oper/Development
Cellular Telecom
Pipelines
Oil Comp-Explor&Prodtn
Investment Companies
Private Equity
Telephone-Integrated
20.0
54.6
57.8
87.2
964.2
36.2
42.0
55.9
119.8
1002.0
$- $200 $400 $600 $800 $1,000 $1,200
Germany
U.K.
Brazli
Canada
U.S.
China
U.K.
Brazli
Canada
U.S.
Summary Number of Deals 15261 Volume $1.4T Average Deal Size $188.9M Average Premium 36.80%
Most Acquisitive Company Acquirer Andreessen Horowitz Number of Deals 67 Volume $1.6B Average Deal Size $25.1M
Announce Date Target Name Acquirer Name Total Value (mil.) 02/09/2013 Cellco Partnership Verizon Communications Inc 130,100.00 14/02/2013 HJ Heinz Co Multiple acquirers 27,403.30 05/02/2013 Virgin Media Inc Liberty Global PLC 21,627.16 28/07/2013 Omnicom Group Inc Publicis Groupe SA 19,420.43 12/02/2013 NBCUniversal LLC Comcast Corp 16,700.00 05/02/2013 Dell Inc Multiple acquirers 16,435.60 15/04/2013 Life Technologies Corp Thermo Fisher Scientific Inc 15,900.98 02/10/2013 Portugal Telecom SGPS SA Oi SA 14,297.19 15/07/2013 Shoppers Drug Mart Corp Loblaw Cos Ltd 13,007.36 29/05/2013 NV Energy Inc Berkshire Hathaway Inc 10,365.59

Global Review Bloomberg
MA <GO> LEAG <GO> NI DEALSPACE <GO> MARB <GO>
INDUSTRY
EMEA : Notable Highlights
7
COUNTRY
Total Volume (USD Bln) Total Volume (USD Bln)
TOP TARGETS
TOP ACQUIRERS TOP ACQUIRERS
TOP TARGETS
33.7
37.5
43.9
58.6
140.1
37.9
42.4
48.1
77.1
160.4
$- $50 $100 $150 $200
Oil Comp-Explor & Prodtn
Real Estate Oper/Development
Telecom Services
Commer Banks Non-US
Cellular Telecom
Finance-Investment Fund
Sovereign
Private Equity
Investment Companies
Telephone-Integrated
44.5
57.9
87.3
128.0
250.0
47.9
61.7
99.0
118.0
308.6
$- $50 $100 $150 $200 $250 $300 $350
Russia
France
Germany
U.K.
U.S.
Russia
Germany
France
U.K.
U.S.
Summary Number of Deals 9022 Volume $1T Average Deal Size $237M Average Premium 25.00%
Most Acquisitive Company Acquirer Index Ventures Number of Deals 48 Volume $1.1B Average Deal Size $22.2M
Announce Date Target Name Acquirer Name Total Value (mil.) 02/09/2013 Cellco Partnership Verizon Communications Inc 130,100.00 15/07/2013 French Republic Caisse des Depots et Consignations 23,361.29 05/02/2013 Virgin Media Inc Liberty Global PLC 21,627.16 28/07/2013 Omnicom Group Inc Publicis Groupe SA 19,420.43 02/10/2013 Portugal Telecom SGPS SA Oi SA 14,297.19 16/04/2013 National Bank of Greece SA Hellenic Financial Stability Fund 12,852.55 23/07/2013 E-Plus Mobilfunk GmbH & Co KG Telefonica Deutschland Holding AG 11,296.26 24/06/2013 Kabel Deutschland Holding AG Vodafone Group PLC 11,185.66 23/04/2013 Piraeus Bank SA Hellenic Financial Stability Fund 10,966.97 18/01/2013 Orascom Construction Industries OCI 10,488.09

Global Review Bloomberg
MA <GO> LEAG <GO> NI DEALSPACE <GO> MARB <GO>
TOP ACQUIRERS
INDUSTRY
APAC : Notable Highlights
8
COUNTRY
Total Volume (USD Bln) Total Volume (USD Bln)
TOP TARGETS
TOP ACQUIRERS
TOP TARGETS
16.5
22.9
23.1
23.2
60.5
29.7
30.3
36.5
39.2
78.3
$- $20 $40 $60 $80 $100
Oil Comp-Explor&Prodtn
Bldg-Residential/Commer
Investment Companies
Commer Banks Non-US
Real Estate Oper/Development
Invest Mgmnt/Advis Serv
Oil Comp-Explor&Prodtn
Diversified Operations
Real Estate Oper/Development
Investment Companies
49.5
58.4
60.3
66.2
182.9
53.8
58.2
61.1
91.0
215.9
$- $50 $100 $150 $200 $250
South Korea
Japan
U.S.
Australia
China
Singapore
U.S.
Australia
Japan
China
Summary Number of Deals 9397 Volume $668.3B Average Deal Size $98.1M Average Premium 23.47%
Most Acquisitive Company Acquirer Mitsui & Co Ltd Number of Deals 23 Volume $4.4B Average Deal Size $340M
Announce Date Target Name Acquirer Name Total Value (mil.) 14/06/2013 PetroChina United Pipelines Co Ltd Multiple acquirers 9,786.65 22/11/2013 Galeao airport concession Multiple acquirers 8,308.09 31/05/2013 SM Land Inc SM Prime Holdings Inc 7,329.99 29/05/2013 Smithfield Foods Inc Shuanghui International Holdings Ltd 6,955.21 24/09/2013 Tokyo Electron Ltd Applied Materials Inc 6,794.36 06/05/2013 BMC Software Inc Multiple acquirers 6,735.72 16/12/2013 LSI Corp Avago Technologies Ltd 5,595.53 02/07/2013 Bank of Ayudhya PCL Mitsubishi UFJ Financial Group Inc 5,505.43 02/07/2013 Kashagan caspian oil project KazMunayGas National Co JSC 5,400.00 12/04/2013 Port Kembla & Port Botany Australia Multiple acquirers 5,324.51

Bloomberg
9
- 20122013
Global M&A Activity
1/1/13 12/31/13
CHANGEFIRM
VOLUME DEAL
COUNT
Regional Breakdown by Target Region/Country
USD (Mln)
VOLUME
USD (Mln)
DEAL
COUNT
VOLUME
Americas 12,688 1.67%$1,153,060 $1,134,137 13,144
900 -15.89%$94,738 $112,642 1,055 Latin America
11,924 1.84%$1,070,138 $1,050,844 12,200 North America
1,539 -30.97%$87,180 $126,289 1,554 Canada
10,157 8.72%$963,945 $886,671 10,460 United States
EMEA 7,001 5.57%$672,146 $636,683 6,726
1,174 -36.01%$82,569 $129,026 952 Eastern Europe
5,196 15.83%$532,852 $460,029 5,173 Western Europe
1,862 -28.66%$128,083 $179,541 1,874 UK
758 36.87%$87,255 $63,750 744 Germany
487 72.29%$57,934 $33,627 512 France
Asia-Pacific ex-Japan 6,420 19.53%$445,771 $372,927 6,333
910 20.97%$66,388 $54,880 860 Australia
109 -30.18%$3,064 $4,388 132 New Zealand
2,310 37.23%$183,387 $133,634 2,382 China
421 63.53%$28,366 $17,346 349 Hong Kong
1,070 -6.71%$70,177 $75,222 982 South East Asia
602 -35.63%$20,949 $32,545 704 India
Japan 1,543 -35.24%$58,368 $90,129 1,597
*Includes Mergers, Acquisitions, Divestitures, Self-tenders and Spinoffs. Excludes Open Market Transactions.
$2,332,850 27,882 $2,235,357 27,966 4.36%Global

Bloomberg
10
- 20122013
Global Announced Deals
1/1/13 12/31/13
CHANGEFIRM
RANK MKT
SHARE
VOLUME DEAL
COUNT
RANK MKT
SHARE
Ranked by Volume
MKT SHARE
USD (Mln)
M&A Legal Advisory League Tables
6.7Simpson Thacher & Bartlett LLP 157 1 6.3 302,132 13.0 11
6.8Davis Polk & Wardwell 108 2 6.1 299,759 12.9 9
7.6Wachtell Lipton Rosen & Katz 69 3 5.2 299,103 12.8 7
8.5Weil Gotshal & Manges LLP 171 4 3.2 272,263 11.7 5
4.7Jones Day LP 412 5 5.2 230,679 9.9 18
7.1Latham & Watkins LLP 259 6 2.1 214,664 9.2 8
3.1Slaughter & May 58 7 5.8 207,618 8.9 28
2.5Osler Hoskin & Harcourt LLP 101 8 5.6 189,311 8.1 35
2.0Debevoise & Plimpton LLP 51 9 5.8 182,570 7.8 45
2.3Hogan Lovells 125 10 5.4 179,790 7.7 38
13.9Skadden Arps Slate Meagher & Flom LLP 200 11 (6.7) 168,919 7.2 1
7.7Sullivan & Cromwell LLP 91 12 (1.2) 151,458 6.5 6
1.9Allens 59 13 4.4 147,187 6.3 46
9.1Freshfields Bruckhaus Deringer LLP 247 14 (2.9) 143,616 6.2 3
9.3Linklaters LLP 230 15 (3.6) 132,201 5.7 2
0.1MacFarlanes Ltd 16 16 5.5 130,910 5.6 190
5.8Kirkland & Ellis LLP 308 17 (0.3) 127,916 5.5 15
6.7Cravath Swaine & Moore LLP 56 18 (1.4) 123,066 5.3 10
5.9White & Case LLP 183 19 (0.6) 122,723 5.3 14
4.1Allen & Overy LLP 266 20 1.1 121,833 5.2 20
*Includes Mergers, Acquisitions, Divestitures, Self-tenders and Spinoffs. Excludes Open Market Transactions.
$2,332,850 27,882 $2,235,357
*Total Volume represents all announced transactions in US$ millions.
TOTAL

Bloomberg
11
- 20122013
Global Announced Deals
1/1/13 12/31/13
CHANGEFIRM
RANK MKT
SHARE
VOLUME DEAL
COUNT
RANK MKT
SHARE
Ranked by Deal Count
MKT SHARE
USD (Mln)
M&A Legal Advisory League Tables
4.7Jones Day LP 412 1 5.2 230,679 9.9 1
5.8Kirkland & Ellis LLP 308 2 (0.3) 127,916 5.5 3
2.4DLA Piper LLP 292 3 (1.3) 24,524 1.1 2
4.1Allen & Overy LLP 266 4 1.1 121,833 5.2 5
7.1Latham & Watkins LLP 259 5 2.1 214,664 9.2 4
3.3Baker & McKenzie LLP 253 6 (0.5) 64,823 2.8 8
9.1Freshfields Bruckhaus Deringer LLP 247 7 (2.9) 143,616 6.2 9
9.3Linklaters LLP 230 8 (3.6) 132,201 5.7 7
0.9CMS 229 9 0.1 23,754 1.0 16
13.9Skadden Arps Slate Meagher & Flom LLP 200 10 (6.7) 168,919 7.2 6
5.9White & Case LLP 183 11 (0.6) 122,723 5.3 15
5.9Clifford Chance LLP 177 12 (2.4) 81,238 3.5 10
8.5Weil Gotshal & Manges LLP 171 13 3.2 272,263 11.7 11
1.7O'Melveny & Myers LLP 158 14 2.0 86,003 3.7 33
6.7Simpson Thacher & Bartlett LLP 157 15 6.3 302,132 13.0 17
4.5Mori Hamada & Matsumoto 155 16 (3.4) 25,883 1.1 14
2.1Nagashima Ohno & Tsunematsu 155 16 (1.5) 14,998 0.6 13
5.4Blake Cassels & Graydon LLP 148 18 (0.3) 118,647 5.1 12
3.2Stikeman Elliott LLP 144 19 1.5 109,984 4.7 23
8.8Shearman & Sterling LLP 141 20 (4.4) 101,397 4.4 21
*Includes Mergers, Acquisitions, Divestitures, Self-tenders and Spinoffs. Excludes Open Market Transactions.
$2,332,850 27,882 $2,235,357
*Total Volume represents all announced transactions in US$ millions.
*Tables based on deal count, then volume. Market share based on deal volume.
TOTAL

Bloomberg
12
- 20122013
Global Announced Deals - Counsel to Principals
1/1/13 12/31/13
CHANGEFIRM
RANK MKT
SHARE
VOLUME DEAL
COUNT
RANK MKT
SHARE
Ranked by Volume
MKT SHARE
USD (Mln)
M&A Legal Advisory League Tables
7.6Wachtell Lipton Rosen & Katz 68 1 5.2 297,425 12.8 4
5.2Simpson Thacher & Bartlett LLP 143 2 5.5 248,631 10.7 10
3.0Slaughter & May 58 3 5.9 207,618 8.9 26
4.3Jones Day LP 406 4 4.1 196,379 8.4 12
1.6Osler Hoskin & Harcourt LLP 97 5 6.5 187,830 8.1 46
1.8Debevoise & Plimpton LLP 51 6 6.0 182,570 7.8 41
2.3Hogan Lovells 122 7 5.3 177,919 7.6 34
11.9Skadden Arps Slate Meagher & Flom LLP 190 8 (5.3) 154,595 6.6 1
1.9Allens 59 9 4.4 147,187 6.3 40
5.8Latham & Watkins LLP 239 10 0.2 140,138 6.0 6
8.9Freshfields Bruckhaus Deringer LLP 240 11 (2.9) 138,855 6.0 3
0.1MacFarlanes Ltd 16 12 5.5 130,910 5.6 189
9.2Linklaters LLP 222 13 (3.7) 128,379 5.5 2
4.0Allen & Overy LLP 262 14 1.1 119,526 5.1 17
4.2Kirkland & Ellis LLP 299 15 0.9 117,718 5.1 13
5.4Blake Cassels & Graydon LLP 143 16 (0.4) 116,825 5.0 8
3.2Stikeman Elliott LLP 142 17 1.5 108,605 4.7 25
4.9Davis Polk & Wardwell 81 18 (0.3) 106,502 4.6 11
5.6Sullivan & Cromwell LLP 77 19 (1.3) 101,027 4.3 7
7.5Weil Gotshal & Manges LLP 152 20 (3.2) 99,636 4.3 5
*Includes Mergers, Acquisitions, Divestitures, Self-tenders and Spinoffs. Excludes Open Market Transactions.
$2,332,850 27,882 $2,235,357
*Total Volume represents all announced transactions in US$ millions.
TOTAL

Bloomberg
13
- 20122013
Global Announced Deals - Counsel to Principals
1/1/13 12/31/13
CHANGEFIRM
RANK MKT
SHARE
VOLUME DEAL
COUNT
RANK MKT
SHARE
Ranked by Deal Count
MKT SHARE
USD (Mln)
M&A Legal Advisory League Tables
4.3Jones Day LP 406 1 4.1 196,379 8.4 1
4.2Kirkland & Ellis LLP 299 2 0.9 117,718 5.1 3
2.4DLA Piper LLP 292 3 (1.3) 24,524 1.1 2
4.0Allen & Overy LLP 262 4 1.1 119,526 5.1 5
3.2Baker & McKenzie LLP 252 5 (0.4) 64,633 2.8 6
8.9Freshfields Bruckhaus Deringer LLP 240 6 (2.9) 138,855 6.0 9
5.8Latham & Watkins LLP 239 7 0.2 140,138 6.0 4
0.9CMS 228 8 0.1 23,754 1.0 15
9.2Linklaters LLP 222 9 (3.7) 128,379 5.5 6
11.9Skadden Arps Slate Meagher & Flom LLP 190 10 (5.3) 154,595 6.6 8
3.6Clifford Chance LLP 174 11 (0.3) 77,428 3.3 10
2.1Nagashima Ohno & Tsunematsu 155 12 (1.5) 14,998 0.6 13
3.9Mori Hamada & Matsumoto 153 13 (2.8) 25,081 1.1 14
7.5Weil Gotshal & Manges LLP 152 14 (3.2) 99,636 4.3 11
1.1O'Melveny & Myers LLP 145 15 - 26,240 1.1 38
5.2Simpson Thacher & Bartlett LLP 143 16 5.5 248,631 10.7 21
5.4Blake Cassels & Graydon LLP 143 16 (0.4) 116,825 5.0 12
3.2Stikeman Elliott LLP 142 18 1.5 108,605 4.7 18
4.1White & Case LLP 137 19 (2.1) 47,385 2.0 23
0.9Herbert Smith Freehills LLP 125 20 1.7 60,705 2.6 66
*Includes Mergers, Acquisitions, Divestitures, Self-tenders and Spinoffs. Excludes Open Market Transactions.
$2,332,850 27,882 $2,235,357
*Total Volume represents all announced transactions in US$ millions.
*Tables based on deal count, then volume. Market share based on deal volume.
TOTAL

Bloomberg
14
- 20122013
Cross Border Announced Deals
1/1/13 12/31/13
CHANGEFIRM
RANK MKT
SHARE
VOLUME DEAL
COUNT
RANK MKT
SHARE
Ranked by Volume
MKT SHARE
USD (Mln)
M&A Legal Advisory League Tables
3.9Simpson Thacher & Bartlett LLP 78 1 15.6 205,788 19.5 31
4.9Jones Day LP 172 2 13.5 194,030 18.4 24
4.7Davis Polk & Wardwell 58 3 12.8 184,053 17.5 26
5.6Wachtell Lipton Rosen & Katz 12 4 11.0 174,352 16.6 18
3.5Slaughter & May 39 5 12.7 170,311 16.2 37
8.4Weil Gotshal & Manges LLP 83 6 7.3 165,529 15.7 9
3.7Osler Hoskin & Harcourt LLP 50 7 11.6 160,876 15.3 33
1.5Debevoise & Plimpton LLP 27 8 12.6 148,565 14.1 59
1.8Hogan Lovells 60 9 11.5 140,357 13.3 53
2.5Allens 38 10 10.8 139,691 13.3 44
0.0MacFarlanes Ltd 11 11 12.4 130,226 12.4 246
17.3Linklaters LLP 171 12 (7.0) 108,051 10.3 2
7.0Allen & Overy LLP 197 13 2.2 97,299 9.2 12
18.0Skadden Arps Slate Meagher & Flom LLP 96 14 (9.4) 90,033 8.6 1
15.8Freshfields Bruckhaus Deringer LLP 191 15 (7.6) 85,888 8.2 3
6.4Latham & Watkins LLP 97 16 0.6 73,842 7.0 16
12.3Shearman & Sterling LLP 73 17 (6.5) 60,823 5.8 4
1.2De Brauw Blackstone Westbroek NV 28 18 4.3 58,139 5.5 68
4.1Stikeman Elliott LLP 83 19 1.2 55,627 5.3 29
11.6Cravath Swaine & Moore LLP 18 20 (6.7) 51,066 4.9 5
*Includes Mergers, Acquisitions, Divestitures, Self-tenders and Spinoffs. Excludes Open Market Transactions.
$1,053,554 9,332 $1,101,149
*Total Volume represents all announced transactions in US$ millions.
TOTAL

Bloomberg
15
- 20122013
Global Private Equity Announced Deals
1/1/13 12/31/13
CHANGEFIRM
RANK MKT
SHARE
VOLUME DEAL
COUNT
RANK MKT
SHARE
Ranked by Volume
MKT SHARE
USD (Mln)
M&A Legal Advisory League Tables
13.6Kirkland & Ellis LLP 161 1 6.8 75,528 20.4 3
7.9Davis Polk & Wardwell 30 2 10.6 68,677 18.5 6
5.9Wachtell Lipton Rosen & Katz 16 3 12.4 67,966 18.3 17
13.8Simpson Thacher & Bartlett LLP 87 4 4.1 66,354 17.9 2
4.0Stikeman Elliott LLP 30 5 11.9 58,858 15.9 21
4.5Blake Cassels & Graydon LLP 21 6 9.8 53,069 14.3 20
18.9Weil Gotshal & Manges LLP 76 7 (6.2) 46,978 12.7 1
7.2Freshfields Bruckhaus Deringer LLP 56 8 5.2 45,823 12.4 8
12.4Latham & Watkins LLP 72 9 (0.8) 43,008 11.6 5
2.9Willkie Farr & Gallagher LLP 37 10 8.6 42,686 11.5 31
7.0Sullivan & Cromwell LLP 20 11 4.0 40,640 11.0 11
13.3Skadden Arps Slate Meagher & Flom LLP 45 12 (2.4) 40,229 10.9 4
6.7Clifford Chance LLP 43 13 3.0 35,774 9.7 13
3.4O'Melveny & Myers LLP 57 14 5.9 34,589 9.3 28
6.3Debevoise & Plimpton LLP 17 15 2.9 33,963 9.2 16
-Munger Tolles & Olson 3 16 7.5 27,633 7.5 -
0.1Anderson Mori & Tomotsune 4 17 7.4 27,621 7.5 155
2.2White & Case LLP 35 18 4.9 26,419 7.1 38
0.8Cleary Gottlieb Steen & Hamilton LLP 21 19 6.3 26,309 7.1 75
7.5Linklaters LLP 71 20 (0.8) 24,957 6.7 7
*Includes Mergers, Acquisitions, Divestitures, Self-tenders and Spinoffs. Excludes Open Market Transactions.
$370,741 5,809 $453,109
*Total Volume represents all announced transactions in US$ millions.
TOTAL

Bloomberg
16
- 20122013
United States Announced Deals
1/1/13 12/31/13
CHANGEFIRM
RANK MKT
SHARE
VOLUME DEAL
COUNT
RANK MKT
SHARE
Any Involvement, Ranked by Volume
MKT SHARE
USD (Mln)
M&A Legal Advisory League Tables
14.6Wachtell Lipton Rosen & Katz 68 1 9.8 298,652 24.4 2
10.7Simpson Thacher & Bartlett LLP 141 2 12.7 286,008 23.4 8
10.9Davis Polk & Wardwell 84 3 11.5 274,258 22.4 6
14.6Weil Gotshal & Manges LLP 132 4 6.7 261,470 21.3 3
11.1Latham & Watkins LLP 218 5 5.6 204,200 16.7 5
7.3Jones Day LP 301 6 9.4 204,095 16.7 13
2.7Slaughter & May 16 7 12.7 188,608 15.4 43
3.2Debevoise & Plimpton LLP 42 8 11.3 177,840 14.5 36
3.0Hogan Lovells 74 9 11.1 172,585 14.1 38
2.1Osler Hoskin & Harcourt LLP 50 10 10.9 159,369 13.0 48
21.0Skadden Arps Slate Meagher & Flom LLP 151 11 (9.8) 137,205 11.2 1
1.2Allens 19 12 9.6 132,425 10.8 62
0.0MacFarlanes Ltd 9 13 10.6 130,226 10.6 313
9.3Sullivan & Cromwell LLP 69 14 1.1 127,049 10.4 9
10.9Kirkland & Ellis LLP 287 15 (1.0) 120,795 9.9 7
9.1Cravath Swaine & Moore LLP 51 16 (0.2) 108,591 8.9 10
4.5Blake Cassels & Graydon LLP 69 17 4.1 105,510 8.6 19
8.5White & Case LLP 109 18 (0.4) 98,636 8.1 11
2.9O'Melveny & Myers LLP 134 19 4.0 84,344 6.9 40
3.3Stikeman Elliott LLP 66 20 3.6 84,212 6.9 35
*Includes Mergers, Acquisitions, Divestitures, Self-tenders and Spinoffs. Excludes Open Market Transactions.
$1,225,037 12,907 $1,149,075
*Total Volume represents all announced transactions in US$ millions.
TOTAL

Bloomberg
17
- 20122013
United States Announced Deals
1/1/13 12/31/13
CHANGEFIRM
RANK MKT
SHARE
VOLUME DEAL
COUNT
RANK MKT
SHARE
Any Involvement, Ranked by Deal Count
MKT SHARE
USD (Mln)
M&A Legal Advisory League Tables
7.3Jones Day LP 301 1 9.4 204,095 16.7 1
10.9Kirkland & Ellis LLP 287 2 (1.0) 120,795 9.9 2
11.1Latham & Watkins LLP 218 3 5.6 204,200 16.7 3
3.7DLA Piper LLP 166 4 (2.3) 17,026 1.4 4
21.0Skadden Arps Slate Meagher & Flom LLP 151 5 (9.8) 137,205 11.2 5
10.7Simpson Thacher & Bartlett LLP 141 6 12.7 286,008 23.4 7
2.9O'Melveny & Myers LLP 134 7 4.0 84,344 6.9 14
14.6Weil Gotshal & Manges LLP 132 8 6.7 261,470 21.3 6
8.5White & Case LLP 109 9 (0.4) 98,636 8.1 18
2.0Morgan Lewis & Bockius LLP 106 10 (0.6) 16,973 1.4 22
12.6Shearman & Sterling LLP 98 11 (7.1) 66,886 5.5 13
3.2Baker & McKenzie LLP 96 12 (0.9) 27,971 2.3 9
1.5Wilson Sonsini Goodrich & Rosati PC 93 13 (0.6) 10,491 0.9 8
7.0Gibson Dunn & Crutcher LLP 91 14 (0.3) 81,492 6.7 11
2.9Fenwick & West LLP 88 15 (1.8) 13,162 1.1 18
1.1Paul Hastings LLP 87 16 1.2 27,710 2.3 17
10.9Davis Polk & Wardwell 84 17 11.5 274,258 22.4 18
3.8Allen & Overy LLP 82 18 (1.6) 27,068 2.2 25
4.2Vinson & Elkins LLP 77 19 0.1 52,822 4.3 10
3.0Hogan Lovells 74 20 11.1 172,585 14.1 14
*Includes Mergers, Acquisitions, Divestitures, Self-tenders and Spinoffs. Excludes Open Market Transactions.
$1,225,037 12,907 $1,149,075
*Total Volume represents all announced transactions in US$ millions.
*Tables based on deal count, then volume. Market share based on deal volume.
TOTAL

Bloomberg
18
- 20122013
US Announced Deals - Counsel to Principals
1/1/13 12/31/13
CHANGEFIRM
RANK MKT
SHARE
VOLUME DEAL
COUNT
RANK MKT
SHARE
Any Involvement, Ranked by Volume
MKT SHARE
USD (Mln)
M&A Legal Advisory League Tables
14.6Wachtell Lipton Rosen & Katz 67 1 9.6 296,974 24.2 2
8.6Simpson Thacher & Bartlett LLP 129 2 10.6 235,231 19.2 5
2.7Slaughter & May 16 3 12.7 188,608 15.4 37
7.2Jones Day LP 297 4 7.5 180,283 14.7 8
2.9Debevoise & Plimpton LLP 42 5 11.6 177,840 14.5 36
3.0Hogan Lovells 74 6 11.1 172,585 14.1 33
2.1Osler Hoskin & Harcourt LLP 47 7 10.9 159,051 13.0 44
1.2Allens 19 8 9.6 132,425 10.8 59
18.9Skadden Arps Slate Meagher & Flom LLP 145 9 (8.2) 130,479 10.7 1
0.0MacFarlanes Ltd 9 10 10.6 130,226 10.6 312
8.8Latham & Watkins LLP 198 11 1.8 129,674 10.6 4
7.9Kirkland & Ellis LLP 280 12 1.1 110,720 9.0 6
4.5Blake Cassels & Graydon LLP 67 13 4.0 103,910 8.5 16
12.7Weil Gotshal & Manges LLP 113 14 (5.4) 88,842 7.3 3
7.5Davis Polk & Wardwell 61 15 (0.5) 85,760 7.0 7
3.3Stikeman Elliott LLP 66 16 3.6 84,212 6.9 30
6.1Sullivan & Cromwell LLP 56 17 0.3 78,120 6.4 12
2.3Cravath Swaine & Moore LLP 38 18 2.4 57,208 4.7 40
4.1Freshfields Bruckhaus Deringer LLP 68 19 0.5 56,439 4.6 20
4.2Vinson & Elkins LLP 76 20 (0.2) 48,490 4.0 19
*Includes Mergers, Acquisitions, Divestitures, Self-tenders and Spinoffs. Excludes Open Market Transactions.
$1,225,037 12,907 $1,149,075
*Total Volume represents all announced transactions in US$ millions.
TOTAL

Bloomberg
19
- 20122013
US Announced Deals - Counsel to Principals
1/1/13 12/31/13
CHANGEFIRM
RANK MKT
SHARE
VOLUME DEAL
COUNT
RANK MKT
SHARE
Any Involvement, Ranked by Deal Count
MKT SHARE
USD (Mln)
M&A Legal Advisory League Tables
7.2Jones Day LP 297 1 7.5 180,283 14.7 1
7.9Kirkland & Ellis LLP 280 2 1.1 110,720 9.0 2
8.8Latham & Watkins LLP 198 3 1.8 129,674 10.6 3
3.7DLA Piper LLP 166 4 (2.3) 17,026 1.4 4
18.9Skadden Arps Slate Meagher & Flom LLP 145 5 (8.2) 130,479 10.7 5
8.6Simpson Thacher & Bartlett LLP 129 6 10.6 235,231 19.2 8
1.8O'Melveny & Myers LLP 121 7 0.2 24,581 2.0 18
12.7Weil Gotshal & Manges LLP 113 8 (5.4) 88,842 7.3 6
2.0Morgan Lewis & Bockius LLP 106 9 (0.6) 16,973 1.4 14
3.1Baker & McKenzie LLP 95 10 (0.8) 27,781 2.3 9
1.4Wilson Sonsini Goodrich & Rosati PC 93 11 (0.5) 10,491 0.9 7
2.9Fenwick & West LLP 87 12 (2.1) 9,752 0.8 13
1.1Paul Hastings LLP 85 13 0.9 23,860 2.0 12
5.1Gibson Dunn & Crutcher LLP 81 14 (1.2) 47,437 3.9 14
3.8Allen & Overy LLP 81 14 (1.6) 27,068 2.2 21
6.3Shearman & Sterling LLP 80 16 (3.1) 38,979 3.2 24
4.2Vinson & Elkins LLP 76 17 (0.2) 48,490 4.0 10
3.0Hogan Lovells 74 18 11.1 172,585 14.1 11
0.9Dechert LLP 70 19 0.4 15,377 1.3 19
4.5Paul Weiss Rifkind Wharton & Garrison LLP 69 20 (3.1) 17,418 1.4 16
*Includes Mergers, Acquisitions, Divestitures, Self-tenders and Spinoffs. Excludes Open Market Transactions.
$1,225,037 12,907 $1,149,075
*Total Volume represents all announced transactions in US$ millions.
*Tables based on deal count, then volume. Market share based on deal volume.
TOTAL

Bloomberg
20
- 20122013
Canada Announced Deals
1/1/13 12/31/13
CHANGEFIRM
RANK MKT
SHARE
VOLUME DEAL
COUNT
RANK MKT
SHARE
Any Involvement, Ranked by Volume
MKT SHARE
USD (Mln)
M&A Legal Advisory League Tables
17.5Torys LLP 49 1 9.5 42,602 27.0 4
19.6Osler Hoskin & Harcourt LLP 80 2 2.7 35,205 22.3 2
19.2Stikeman Elliott LLP 114 3 (1.0) 28,717 18.2 3
7.6Davies Ward Phillips & Vineberg LLP 42 4 9.0 26,150 16.6 18
23.1Blake Cassels & Graydon LLP 124 5 (7.8) 24,125 15.3 1
3.1Borden Ladner Gervais LLP 37 6 9.6 20,086 12.7 34
15.0McCarthy Tetrault LLP 67 7 (2.3) 20,075 12.7 5
6.8Latham & Watkins LLP 14 8 2.6 14,865 9.4 21
1.9White & Case LLP 7 9 5.6 11,763 7.5 45
7.9Cleary Gottlieb Steen & Hamilton LLP 6 10 (1.3) 10,349 6.6 14
6.5Skadden Arps Slate Meagher & Flom LLP 15 11 (0.3) 9,788 6.2 22
10.6Fasken Martineau DuMoulin LLP 31 12 (4.7) 9,301 5.9 9
4.6Norton Rose Fulbright LLP 32 13 1.3 9,259 5.9 26
4.1Ashurst LLP 8 14 1.2 8,396 5.3 27
5.4King & Wood Mallesons 5 15 (0.1) 8,337 5.3 23
2.6Cassels Brock & Blackwell LLP 30 16 2.5 7,971 5.1 36
10.7Sullivan & Cromwell LLP 7 17 (5.7) 7,844 5.0 8
11.2Paul Weiss Rifkind Wharton & Garrison LLP 13 18 (6.4) 7,500 4.8 7
0.0Morgan Lewis & Bockius LLP 8 19 4.7 7,468 4.7 132
8.2Davis Polk & Wardwell 8 20 (3.5) 7,425 4.7 12
*Includes Mergers, Acquisitions, Divestitures, Self-tenders and Spinoffs. Excludes Open Market Transactions.
$157,655 2,327 $219,499
*Total Volume represents all announced transactions in US$ millions.
TOTAL

Bloomberg
21
- 20122013
Canada Announced Deals
1/1/13 12/31/13
CHANGEFIRM
RANK MKT
SHARE
VOLUME DEAL
COUNT
RANK MKT
SHARE
Any Involvement, Ranked by Deal Count
MKT SHARE
USD (Mln)
M&A Legal Advisory League Tables
23.1Blake Cassels & Graydon LLP 124 1 (7.8) 24,125 15.3 1
19.2Stikeman Elliott LLP 114 2 (1.0) 28,717 18.2 3
2.9Gowling Lafleur Henderson LLP 113 3 0.8 5,814 3.7 2
19.6Osler Hoskin & Harcourt LLP 80 4 2.7 35,205 22.3 4
15.0McCarthy Tetrault LLP 67 5 (2.3) 20,075 12.7 5
17.5Torys LLP 49 6 9.5 42,602 27.0 6
7.6Davies Ward Phillips & Vineberg LLP 42 7 9.0 26,150 16.6 8
3.1Borden Ladner Gervais LLP 37 8 9.6 20,086 12.7 9
4.6Norton Rose Fulbright LLP 32 9 1.3 9,259 5.9 42
10.6Fasken Martineau DuMoulin LLP 31 10 (4.7) 9,301 5.9 7
2.6Cassels Brock & Blackwell LLP 30 11 2.5 7,971 5.1 10
1.0Heenan Blaikie LLP 26 12 (0.3) 1,080 0.7 16
6.8Goodmans LLP 24 13 (2.8) 6,373 4.0 12
0.3Dentons US LLP 21 14 1.5 2,791 1.8 28
3.7Dorsey & Whitney LLP 20 15 (2.8) 1,400 0.9 19
8.1Bennett Jones LLP 18 16 (7.4) 1,033 0.7 13
2.1Jones Day LP 17 17 0.1 3,415 2.2 22
6.5Skadden Arps Slate Meagher & Flom LLP 15 18 (0.3) 9,788 6.2 14
6.8Latham & Watkins LLP 14 19 2.6 14,865 9.4 23
2.4Allen & Overy LLP 14 19 1.7 6,409 4.1 32
*Includes Mergers, Acquisitions, Divestitures, Self-tenders and Spinoffs. Excludes Open Market Transactions.
$157,655 2,327 $219,499
*Total Volume represents all announced transactions in US$ millions.
*Tables based on deal count, then volume. Market share based on deal volume.
TOTAL

Bloomberg
22
- 20122013
Brazil Announced Deals
1/1/13 12/31/13
CHANGEFIRM
RANK MKT
SHARE
VOLUME DEAL
COUNT
RANK MKT
SHARE
Any Involvement, Ranked by Volume
MKT SHARE
USD (Mln)
M&A Legal Advisory League Tables
22.0Souza Cescon Barrieu & Flesch Advogados 34 1 18.4 31,817 40.4 3
5.9Barbosa Mussnich & Aragao 37 2 23.7 23,340 29.6 13
30.0Mattos Filho Veiga Filho Marrey Jr e Quiroga Advogados 41 3 (17.3) 10,021 12.7 1
24.6Pinheiro Neto Advogados 33 4 (16.1) 6,670 8.5 2
13.8Lefosse Advogados 20 5 (5.8) 6,311 8.0 7
5.3Tozzini Freire Teixeira E Silva 29 6 0.9 4,866 6.2 14
0.4Stocche Forbes Padis Filizzola e Clapis Advogados 31 7 5.8 4,850 6.2 37
10.8Jones Day LP 5 8 (6.6) 3,286 4.2 8
4.4Davis Polk & Wardwell 3 9 (0.7) 2,949 3.7 15
0.0Vinson & Elkins LLP 3 10 3.5 2,735 3.5 63
15.9Skadden Arps Slate Meagher & Flom LLP 3 11 (12.5) 2,716 3.4 6
15.9Shearman & Sterling LLP 2 12 (13.0) 2,295 2.9 4
6.9Machado Meyer Sendacz e Opice Advogados 30 13 (4.2) 2,097 2.7 12
1.0Veirano Advogados 38 14 1.4 1,915 2.4 30
0.0Houthoff Buruma 2 15 2.4 1,905 2.4 63
-Cravath Swaine & Moore LLP 1 16 2.4 1,855 2.4 -
1.8Linklaters LLP 6 17 0.2 1,536 2.0 23
-Stibbe 1 18 1.9 1,525 1.9 -
1.3Cleary Gottlieb Steen & Hamilton LLP 1 19 0.5 1,378 1.8 25
3.7Ulhoa Canto Rezende e Guerra Advogados 7 20 (1.9) 1,376 1.8 17
*Includes Mergers, Acquisitions, Divestitures, Self-tenders and Spinoffs. Excludes Open Market Transactions.
$78,844 592 $64,918
*Total Volume represents all announced transactions in US$ millions.
TOTAL

Bloomberg
23
- 20122013
Europe Announced Deals
1/1/13 12/31/13
CHANGEFIRM
RANK MKT
SHARE
VOLUME DEAL
COUNT
RANK MKT
SHARE
Any Involvement, Ranked by Volume
MKT SHARE
USD (Mln)
M&A Legal Advisory League Tables
4.1Jones Day LP 172 1 14.6 181,613 18.7 24
3.5Simpson Thacher & Bartlett LLP 46 2 14.8 177,009 18.3 29
2.3Davis Polk & Wardwell 43 3 15.7 174,535 18.0 37
4.5Slaughter & May 47 4 13.2 171,795 17.7 23
6.4Wachtell Lipton Rosen & Katz 8 5 10.3 162,046 16.7 16
8.9Weil Gotshal & Manges LLP 72 6 6.5 149,215 15.4 8
0.9Osler Hoskin & Harcourt LLP 22 7 13.9 143,984 14.8 64
2.7Hogan Lovells 71 8 11.7 139,766 14.4 35
1.1Debevoise & Plimpton LLP 19 9 13.0 136,709 14.1 57
2.7Allens 17 10 11.2 134,467 13.9 34
0.2MacFarlanes Ltd 15 11 13.3 130,910 13.5 122
22.3Linklaters LLP 191 12 (11.1) 108,435 11.2 1
19.0Freshfields Bruckhaus Deringer LLP 198 13 (9.1) 96,074 9.9 2
8.3Allen & Overy LLP 203 14 0.9 89,225 9.2 10
7.1Latham & Watkins LLP 76 15 (0.7) 61,897 6.4 14
1.5De Brauw Blackstone Westbroek NV 36 16 4.3 56,636 5.8 47
9.1Shearman & Sterling LLP 53 17 (3.4) 55,711 5.7 7
13.6Skadden Arps Slate Meagher & Flom LLP 51 18 (8.2) 52,180 5.4 3
13.6Clifford Chance LLP 137 19 (8.4) 50,586 5.2 4
3.2Hengeler Mueller 32 20 1.3 43,148 4.5 32
*Includes Mergers, Acquisitions, Divestitures, Self-tenders and Spinoffs. Excludes Open Market Transactions.
$970,083 8,383 $891,403
*Total Volume represents all announced transactions in US$ millions.
TOTAL

Bloomberg
24
- 20122013
Europe Announced Deals
1/1/13 12/31/13
CHANGEFIRM
RANK MKT
SHARE
VOLUME DEAL
COUNT
RANK MKT
SHARE
Any Involvement, Ranked by Deal Count
MKT SHARE
USD (Mln)
M&A Legal Advisory League Tables
2.1CMS 222 1 0.3 23,536 2.4 7
8.3Allen & Overy LLP 203 2 0.9 89,225 9.2 2
19.0Freshfields Bruckhaus Deringer LLP 198 3 (9.1) 96,074 9.9 3
22.3Linklaters LLP 191 4 (11.1) 108,435 11.2 1
4.1Jones Day LP 172 5 14.6 181,613 18.7 5
3.9DLA Piper LLP 148 6 (3.1) 7,835 0.8 6
13.6Clifford Chance LLP 137 7 (8.4) 50,586 5.2 4
5.0Baker & McKenzie LLP 137 7 (1.1) 37,812 3.9 8
8.3White & Case LLP 100 9 (3.9) 42,838 4.4 10
7.1Latham & Watkins LLP 76 10 (0.7) 61,897 6.4 9
8.9Weil Gotshal & Manges LLP 72 11 6.5 149,215 15.4 16
2.7Hogan Lovells 71 12 11.7 139,766 14.4 12
5.4Kirkland & Ellis LLP 64 13 (2.1) 32,156 3.3 17
1.1Herbert Smith Freehills LLP 55 14 2.7 37,194 3.8 64
0.2Olswang 54 15 - 2,329 0.2 18
9.1Shearman & Sterling LLP 53 16 (3.4) 55,711 5.7 22
13.6Skadden Arps Slate Meagher & Flom LLP 51 17 (8.2) 52,180 5.4 10
0.5Advokatfirman Vinge KB 50 18 (0.2) 2,449 0.3 45
0.3Dentons US LLP 48 19 0.5 8,080 0.8 82
4.5Slaughter & May 47 20 13.2 171,795 17.7 20
*Includes Mergers, Acquisitions, Divestitures, Self-tenders and Spinoffs. Excludes Open Market Transactions.
$970,083 8,383 $891,403
*Total Volume represents all announced transactions in US$ millions.
*Tables based on deal count, then volume. Market share based on deal volume.
TOTAL

Bloomberg
25
- 20122013
Europe Announced Deals - Counsel to Principals
1/1/13 12/31/13
CHANGEFIRM
RANK MKT
SHARE
VOLUME DEAL
COUNT
RANK MKT
SHARE
Any Involvement, Ranked by Volume
MKT SHARE
USD (Mln)
M&A Legal Advisory League Tables
4.2Slaughter & May 47 1 13.5 171,795 17.7 19
3.4Simpson Thacher & Bartlett LLP 43 2 13.7 166,044 17.1 28
6.4Wachtell Lipton Rosen & Katz 8 3 10.3 162,046 16.7 13
4.1Jones Day LP 169 4 11.5 151,704 15.6 20
0.6Osler Hoskin & Harcourt LLP 22 5 14.2 143,984 14.8 75
2.7Hogan Lovells 70 6 11.7 139,637 14.4 33
1.1Debevoise & Plimpton LLP 19 7 13.0 136,709 14.1 55
2.7Allens 17 8 11.2 134,467 13.9 32
0.2MacFarlanes Ltd 15 9 13.3 130,910 13.5 120
21.9Linklaters LLP 183 10 (11.1) 104,614 10.8 1
18.6Freshfields Bruckhaus Deringer LLP 195 11 (8.8) 94,578 9.8 2
8.3Allen & Overy LLP 202 12 0.7 86,997 9.0 6
1.5De Brauw Blackstone Westbroek NV 36 13 4.3 56,636 5.8 43
7.9Clifford Chance LLP 135 14 (3.1) 46,970 4.8 8
13.5Skadden Arps Slate Meagher & Flom LLP 47 15 (8.8) 45,328 4.7 3
3.2Hengeler Mueller 32 16 1.3 43,148 4.5 30
2.4Shearman & Sterling LLP 48 17 1.9 41,794 4.3 34
1.0Bredin Prat 21 18 3.2 40,504 4.2 59
6.4Latham & Watkins LLP 74 19 (2.3) 40,190 4.1 14
5.0Baker & McKenzie LLP 137 20 (1.1) 37,812 3.9 17
*Includes Mergers, Acquisitions, Divestitures, Self-tenders and Spinoffs. Excludes Open Market Transactions.
$970,083 8,383 $891,403
*Total Volume represents all announced transactions in US$ millions.
TOTAL

Bloomberg
26
- 20122013
Europe Announced Deals - Counsel to Principals
1/1/13 12/31/13
CHANGEFIRM
RANK MKT
SHARE
VOLUME DEAL
COUNT
RANK MKT
SHARE
Any Involvement, Ranked by Deal Count
MKT SHARE
USD (Mln)
M&A Legal Advisory League Tables
2.1CMS 221 1 0.3 23,536 2.4 7
8.3Allen & Overy LLP 202 2 0.7 86,997 9.0 2
18.6Freshfields Bruckhaus Deringer LLP 195 3 (8.8) 94,578 9.8 3
21.9Linklaters LLP 183 4 (11.1) 104,614 10.8 1
4.1Jones Day LP 169 5 11.5 151,704 15.6 5
3.9DLA Piper LLP 148 6 (3.1) 7,835 0.8 6
5.0Baker & McKenzie LLP 137 7 (1.1) 37,812 3.9 8
7.9Clifford Chance LLP 135 8 (3.1) 46,970 4.8 4
8.2White & Case LLP 93 9 (4.7) 33,701 3.5 10
6.4Latham & Watkins LLP 74 10 (2.3) 40,190 4.1 9
2.7Hogan Lovells 70 11 11.7 139,637 14.4 12
8.5Weil Gotshal & Manges LLP 68 12 (6.6) 18,180 1.9 16
3.5Kirkland & Ellis LLP 62 13 (1.0) 23,986 2.5 17
1.1Herbert Smith Freehills LLP 55 14 2.7 37,194 3.8 63
0.2Olswang 54 15 - 2,329 0.2 18
0.5Advokatfirman Vinge KB 50 16 (0.2) 2,449 0.3 44
2.4Shearman & Sterling LLP 48 17 1.9 41,794 4.3 21
0.3Dentons US LLP 48 17 0.5 8,080 0.8 82
4.2Slaughter & May 47 19 13.5 171,795 17.7 20
13.5Skadden Arps Slate Meagher & Flom LLP 47 19 (8.8) 45,328 4.7 10
*Includes Mergers, Acquisitions, Divestitures, Self-tenders and Spinoffs. Excludes Open Market Transactions.
$970,083 8,383 $891,403
*Total Volume represents all announced transactions in US$ millions.
*Tables based on deal count, then volume. Market share based on deal volume.
TOTAL

Bloomberg
27
- 20122013
United Kingdom Announced Deals
1/1/13 12/31/13
CHANGEFIRM
RANK MKT
SHARE
VOLUME DEAL
COUNT
RANK MKT
SHARE
Any Involvement, Ranked by Volume
MKT SHARE
USD (Mln)
M&A Legal Advisory League Tables
7.0Simpson Thacher & Bartlett LLP 23 1 30.4 141,465 37.4 17
0.9Davis Polk & Wardwell 15 2 36.4 141,140 37.3 62
6.0Slaughter & May 34 3 31.1 140,412 37.1 18
10.3Weil Gotshal & Manges LLP 31 4 25.7 135,916 36.0 11
2.5Jones Day LP 64 5 33.3 135,444 35.8 31
1.6Hogan Lovells 36 6 34.2 135,402 35.8 43
3.6Allens 12 7 32.0 134,467 35.6 24
1.5Osler Hoskin & Harcourt LLP 9 8 33.8 133,620 35.3 46
1.6Debevoise & Plimpton LLP 7 9 33.3 131,816 34.9 44
0.5MacFarlanes Ltd 15 10 34.1 130,910 34.6 81
5.9Wachtell Lipton Rosen & Katz 2 11 28.5 130,100 34.4 19
26.6Freshfields Bruckhaus Deringer LLP 71 12 (17.6) 33,968 9.0 2
34.3Linklaters LLP 78 13 (25.5) 33,245 8.8 1
7.4Cravath Swaine & Moore LLP 4 14 0.4 29,330 7.8 16
10.5Shearman & Sterling LLP 14 15 (3.0) 28,438 7.5 10
11.7Latham & Watkins LLP 32 16 (4.7) 26,291 7.0 8
0.4O'Melveny & Myers LLP 11 17 6.0 24,187 6.4 86
4.0Fried Frank Harris Shriver & Jacobson LLP 7 18 2.2 23,542 6.2 23
19.5Clifford Chance LLP 48 19 (13.3) 23,405 6.2 3
10.8Allen & Overy LLP 65 20 (4.8) 22,832 6.0 9
*Includes Mergers, Acquisitions, Divestitures, Self-tenders and Spinoffs. Excludes Open Market Transactions.
$378,105 3,036 $373,322
*Total Volume represents all announced transactions in US$ millions.
TOTAL

Bloomberg
28
- 20122013
United Kingdom Announced Deals
1/1/13 12/31/13
CHANGEFIRM
RANK MKT
SHARE
VOLUME DEAL
COUNT
RANK MKT
SHARE
Any Involvement, Ranked by Deal Count
MKT SHARE
USD (Mln)
M&A Legal Advisory League Tables
34.3Linklaters LLP 78 1 (25.5) 33,245 8.8 1
26.6Freshfields Bruckhaus Deringer LLP 71 2 (17.6) 33,968 9.0 3
4.4DLA Piper LLP 70 3 (3.2) 4,504 1.2 2
10.8Allen & Overy LLP 65 4 (4.8) 22,832 6.0 5
2.5Jones Day LP 64 5 33.3 135,444 35.8 6
1.3CMS 58 6 0.6 7,048 1.9 9
19.5Clifford Chance LLP 48 7 (13.3) 23,405 6.2 4
0.5Olswang 44 8 (0.2) 1,135 0.3 7
5.5Kirkland & Ellis LLP 37 9 0.1 21,180 5.6 13
0.0Travers Smith 37 9 1.2 4,460 1.2 52
1.6Hogan Lovells 36 11 34.2 135,402 35.8 16
6.0Slaughter & May 34 12 31.1 140,412 37.1 8
3.0Eversheds LLP 33 13 (2.5) 1,827 0.5 18
11.7Latham & Watkins LLP 32 14 (4.7) 26,291 7.0 9
10.3Weil Gotshal & Manges LLP 31 15 25.7 135,916 36.0 15
3.3Baker & McKenzie LLP 26 16 (0.6) 10,044 2.7 13
2.0Herbert Smith Freehills LLP 26 16 0.5 9,392 2.5 37
0.9A&L Goodbody Solicitors 26 16 (0.1) 3,184 0.8 19
1.8Ashurst LLP 24 19 0.5 8,677 2.3 12
7.0Simpson Thacher & Bartlett LLP 23 20 30.4 141,465 37.4 20
*Includes Mergers, Acquisitions, Divestitures, Self-tenders and Spinoffs. Excludes Open Market Transactions.
$378,105 3,036 $373,322
*Total Volume represents all announced transactions in US$ millions.
*Tables based on deal count, then volume. Market share based on deal volume.
TOTAL

Bloomberg
29
- 20122013
Germany Announced Deals
1/1/13 12/31/13
CHANGEFIRM
RANK MKT
SHARE
VOLUME DEAL
COUNT
RANK MKT
SHARE
Any Involvement, Ranked by Deal Count
MKT SHARE
USD (Mln)
M&A Legal Advisory League Tables
6.8CMS 93 1 2.9 12,200 9.7 2
27.3Freshfields Bruckhaus Deringer LLP 75 2 (9.4) 22,644 17.9 1
15.1Linklaters LLP 43 3 20.6 45,071 35.7 5
5.3Jones Day LP 42 4 (2.8) 3,140 2.5 7
9.1Clifford Chance LLP 40 5 (0.1) 11,366 9.0 3
11.1Allen & Overy LLP 39 6 8.0 24,106 19.1 6
19.6Hengeler Mueller 29 7 13.5 41,785 33.1 4
1.3Noerr LLP 24 8 3.9 6,627 5.2 18
9.7White & Case LLP 19 9 (6.1) 4,563 3.6 12
5.0Baker & McKenzie LLP 18 10 (1.1) 4,972 3.9 9
1.7DLA Piper LLP 16 11 (0.7) 1,261 1.0 11
0.0Kirkland & Ellis LLP 15 12 3.3 4,122 3.3 38
0.0Dentons US LLP 15 12 0.8 980 0.8 38
12.1Hogan Lovells 14 14 (11.7) 511 0.4 10
5.5Latham & Watkins LLP 12 15 (0.4) 6,469 5.1 8
24.2Shearman & Sterling LLP 10 16 (11.4) 16,181 12.8 12
5.7Skadden Arps Slate Meagher & Flom LLP 10 16 (2.7) 3,740 3.0 12
3.4Willkie Farr & Gallagher LLP 9 18 0.4 4,769 3.8 21
-O'Melveny & Myers LLP 8 19 1.9 2,427 1.9 -
6.4Weil Gotshal & Manges LLP 8 19 (5.5) 1,179 0.9 26
*Includes Mergers, Acquisitions, Divestitures, Self-tenders and Spinoffs. Excludes Open Market Transactions.
$126,401 1,297 $134,752
*Total Volume represents all announced transactions in US$ millions.
*Tables based on deal count, then volume. Market share based on deal volume.
TOTAL

Bloomberg
30
- 20122013
France Announced Deals
1/1/13 12/31/13
CHANGEFIRM
RANK MKT
SHARE
VOLUME DEAL
COUNT
RANK MKT
SHARE
Any Involvement, Ranked by Deal Count
MKT SHARE
USD (Mln)
M&A Legal Advisory League Tables
6.8Jones Day LP 39 1 12.2 27,384 19.0 1
4.7CMS 39 1 (2.9) 2,536 1.8 7
13.5Linklaters LLP 34 3 (6.8) 9,626 6.7 5
15.4Allen & Overy LLP 32 4 (11.3) 5,900 4.1 4
6.4Freshfields Bruckhaus Deringer LLP 31 5 2.7 13,059 9.1 11
12.1Latham & Watkins LLP 21 6 6.8 27,270 18.9 5
1.3De Pardieu Brocas Maffei 21 6 1.5 3,975 2.8 3
4.9Baker & McKenzie LLP 20 8 (0.4) 6,553 4.5 7
1.1Mayer Brown LLP 20 8 - 1,598 1.1 9
7.3Bredin Prat 19 10 20.8 40,504 28.1 10
7.1Clifford Chance LLP 19 10 (4.6) 3,580 2.5 2
0.2Paul Hastings LLP 18 12 2.0 3,218 2.2 13
0.6White & Case LLP 16 13 3.4 5,786 4.0 17
1.5DLA Piper LLP 15 14 - 2,162 1.5 15
0.0Shearman & Sterling LLP 13 15 6.5 9,344 6.5 34
16.5Weil Gotshal & Manges LLP 13 15 (13.4) 4,483 3.1 11
0.0Willkie Farr & Gallagher LLP 13 15 2.3 3,345 2.3 19
4.2Cleary Gottlieb Steen & Hamilton LLP 12 18 1.4 8,145 5.6 19
6.5Gibson Dunn & Crutcher LLP 11 19 4.7 16,156 11.2 22
4.2Skadden Arps Slate Meagher & Flom LLP 10 20 3.6 11,200 7.8 16
*Includes Mergers, Acquisitions, Divestitures, Self-tenders and Spinoffs. Excludes Open Market Transactions.
$144,283 1,001 $103,576
*Total Volume represents all announced transactions in US$ millions.
*Tables based on deal count, then volume. Market share based on deal volume.
TOTAL

Bloomberg
31
- 20122013
Italy Announced Deals
1/1/13 12/31/13
CHANGEFIRM
RANK MKT
SHARE
VOLUME DEAL
COUNT
RANK MKT
SHARE
Any Involvement, Ranked by Deal Count
MKT SHARE
USD (Mln)
M&A Legal Advisory League Tables
18.0Freshfields Bruckhaus Deringer LLP 15 1 (8.5) 4,954 9.5 10
4.3Clifford Chance LLP 13 2 (2.8) 775 1.5 2
4.4Chiomenti Studio Legale 12 3 13.1 9,132 17.5 1
11.9Shearman & Sterling LLP 12 3 (8.8) 1,637 3.1 15
1.8Allen & Overy LLP 11 5 (1.6) 123 0.2 7
0.1CMS 10 6 2.8 1,536 2.9 7
3.7Jones Day LP 9 7 6.2 5,166 9.9 2
3.7Latham & Watkins LLP 8 8 (2.9) 432 0.8 11
3.9White & Case LLP 7 9 6.1 5,243 10.0 11
13.0Linklaters LLP 7 9 (4.2) 4,571 8.8 2
1.3Cleary Gottlieb Steen & Hamilton LLP 7 9 3.4 2,447 4.7 33
0.5Baker & McKenzie LLP 6 12 6.3 3,548 6.8 18
0.0Hogan Lovells 6 12 2.1 1,080 2.1 23
18.5Skadden Arps Slate Meagher & Flom LLP 5 14 (5.3) 6,912 13.2 11
15.5DLA Piper LLP 5 14 (15.3) 124 0.2 2
1.3Ashurst LLP 5 14 (1.3) 18 0.0 18
0.0Portolano Cavallo Studio Legale 5 14 - 14 0.0 2
5.4Bonelli Erede Pappalardo 4 18 11.1 8,642 16.5 7
3.1De Brauw Blackstone Westbroek NV 3 19 3.4 3,399 6.5 33
-Dentons US LLP 3 19 3.8 1,974 3.8 -
*Includes Mergers, Acquisitions, Divestitures, Self-tenders and Spinoffs. Excludes Open Market Transactions.
$52,257 398 $36,664
*Total Volume represents all announced transactions in US$ millions.
*Tables based on deal count, then volume. Market share based on deal volume.
TOTAL

Bloomberg
32
- 20122013
Benelux Announced Deals
1/1/13 12/31/13
CHANGEFIRM
RANK MKT
SHARE
VOLUME DEAL
COUNT
RANK MKT
SHARE
Any Involvement, Ranked by Deal Count
MKT SHARE
USD (Mln)
M&A Legal Advisory League Tables
12.0Allen & Overy LLP 61 1 21.5 51,321 33.5 1
10.8Linklaters LLP 39 2 16.2 41,409 27.0 2
22.0Freshfields Bruckhaus Deringer LLP 33 3 (9.2) 19,684 12.8 3
0.1CMS 33 3 8.4 13,009 8.5 4
0.8DLA Piper LLP 32 5 (0.3) 751 0.5 7
5.9De Brauw Blackstone Westbroek NV 30 6 12.1 27,558 18.0 5
0.0Loyens & Loeff NV 28 7 2.4 3,613 2.4 41
1.3Houthoff Buruma 27 8 2.5 5,782 3.8 5
5.6Clifford Chance LLP 21 9 7.8 20,499 13.4 10
5.3Baker & McKenzie LLP 18 10 3.0 12,789 8.3 8
1.9Jones Day LP 18 10 6.2 12,457 8.1 9
2.0NautaDutilh NV 16 12 (1.3) 1,100 0.7 13
21.3White & Case LLP 15 13 (19.6) 2,587 1.7 19
1.7Shearman & Sterling LLP 14 14 12.5 21,816 14.2 16
1.4Simpson Thacher & Bartlett LLP 9 15 12.1 20,730 13.5 33
2.3Latham & Watkins LLP 9 15 (0.4) 2,847 1.9 15
38.8Skadden Arps Slate Meagher & Flom LLP 8 17 (25.9) 19,781 12.9 14
22.0Cleary Gottlieb Steen & Hamilton LLP 8 17 (12.2) 15,039 9.8 24
0.7Davis Polk & Wardwell 7 19 6.6 11,111 7.3 77
22.1Weil Gotshal & Manges LLP 7 19 (18.1) 6,074 4.0 19
*Includes Mergers, Acquisitions, Divestitures, Self-tenders and Spinoffs. Excludes Open Market Transactions.
$153,324 884 $148,744
*Total Volume represents all announced transactions in US$ millions.
*Tables based on deal count, then volume. Market share based on deal volume.
TOTAL

Bloomberg
33
- 20122013
Iberia Announced Deals
1/1/13 12/31/13
CHANGEFIRM
RANK MKT
SHARE
VOLUME DEAL
COUNT
RANK MKT
SHARE
Any Involvement, Ranked by Deal Count
MKT SHARE
USD (Mln)
M&A Legal Advisory League Tables
20.7Uria Menendez Abogados SLP 44 1 (7.5) 7,719 13.2 1
2.0Gomez-Acebo & Pombo Abogados SLP 38 2 0.2 1,294 2.2 2
19.3Linklaters LLP 23 3 - 11,313 19.3 4
0.0Garrigues Abogados 21 4 4.0 2,334 4.0 23
11.6Freshfields Bruckhaus Deringer LLP 19 5 4.9 9,655 16.5 6
4.0Clifford Chance LLP 18 6 14.3 10,700 18.3 10
1.3Cuatrecasas Goncalves Pereira 14 7 0.9 1,272 2.2 6
13.9Baker & McKenzie LLP 14 7 (13.1) 492 0.8 6
1.3DLA Piper LLP 13 9 1.6 1,724 2.9 3
3.4Jones Day LP 10 10 (0.7) 1,562 2.7 6
12.5Allen & Overy LLP 8 11 (10.7) 1,058 1.8 5
3.3Hogan Lovells 7 12 0.6 2,265 3.9 15
7.5CMS 6 13 (6.8) 397 0.7 11
-Perez-Llorca 6 13 0.4 238 0.4 -
0.0Skadden Arps Slate Meagher & Flom LLP 4 15 9.7 5,663 9.7 23
6.9Sullivan & Cromwell LLP 4 15 (2.8) 2,420 4.1 12
0.0Latham & Watkins LLP 4 15 1.1 670 1.1 12
3.5Souza Cescon Barrieu & Flesch Advogados 3 18 21.1 14,387 24.6 18
-Barbosa Mussnich & Aragao 3 18 24.4 14,303 24.4 -
-A&L Goodbody Solicitors 3 18 2.0 1,198 2.0 -
*Includes Mergers, Acquisitions, Divestitures, Self-tenders and Spinoffs. Excludes Open Market Transactions.
$58,598 446 $54,440
*Total Volume represents all announced transactions in US$ millions.
*Tables based on deal count, then volume. Market share based on deal volume.
TOTAL

Bloomberg
34
- 20122013
Nordic Announced Deals
1/1/13 12/31/13
CHANGEFIRM
RANK MKT
SHARE
VOLUME DEAL
COUNT
RANK MKT
SHARE
Any Involvement, Ranked by Deal Count
MKT SHARE
USD (Mln)
M&A Legal Advisory League Tables
5.5Advokatfirman Vinge KB 48 1 (2.9) 2,057 2.6 3
1.1Mannheimer Swartling Advokatbyra AB 44 2 13.4 11,637 14.5 6
7.5Hannes Snellman Advokatbyra Ab/FI 42 3 12.0 15,657 19.5 2
2.5Advokatfirmaet Thommessen AS 26 4 2.9 4,311 5.4 9
2.6Baker & McKenzie LLP 24 5 (0.9) 1,338 1.7 15
1.1Advokatfirmaet Schjodt AS 23 6 0.1 982 1.2 1
6.5White & Case LLP 20 7 15.2 17,413 21.7 12
4.0Roschier Attorneys Ltd 19 8 2.0 4,827 6.0 10
16.1Linklaters LLP 19 8 (13.7) 1,919 2.4 6
0.1CMS 12 10 5.2 4,204 5.3 20
18.2Freshfields Bruckhaus Deringer LLP 11 11 (10.6) 6,067 7.6 3
3.4Allen & Overy LLP 11 11 (2.6) 614 0.8 3
0.4LAWIN 10 13 0.2 497 0.6 13
0.0Weil Gotshal & Manges LLP 9 14 4.9 3,945 4.9 46
19.5Clifford Chance LLP 8 15 (12.5) 5,596 7.0 8
13.8Latham & Watkins LLP 8 15 (11.2) 2,106 2.6 25
5.3Jones Day LP 8 15 (4.2) 863 1.1 20
2.0DLA Piper LLP 8 15 (1.7) 220 0.3 25
5.8Davis Polk & Wardwell 7 19 10.2 12,834 16.0 46
0.0O'Melveny & Myers LLP 6 20 0.3 210 0.3 46
*Includes Mergers, Acquisitions, Divestitures, Self-tenders and Spinoffs. Excludes Open Market Transactions.
$80,154 1,083 $87,271
*Total Volume represents all announced transactions in US$ millions.
*Tables based on deal count, then volume. Market share based on deal volume.
TOTAL

Bloomberg
35
- 20122013
Eastern Europe Announced Deals
1/1/13 12/31/13
CHANGEFIRM
RANK MKT
SHARE
VOLUME DEAL
COUNT
RANK MKT
SHARE
Any Involvement, Ranked by Deal Count
MKT SHARE
USD (Mln)
M&A Legal Advisory League Tables
0.7CMS 56 1 1.4 2,117 2.1 2
2.6Allen & Overy LLP 30 2 5.1 7,677 7.7 1
25.2White & Case LLP 28 3 (13.3) 11,907 11.9 4
0.8Baker & McKenzie LLP 26 4 8.4 9,220 9.2 13
5.3Clifford Chance LLP 23 5 4.1 9,462 9.4 4
2.0Dentons US LLP 22 6 3.7 5,707 5.7 11
20.8Weil Gotshal & Manges LLP 18 7 (18.2) 2,617 2.6 18
0.5Freshfields Bruckhaus Deringer LLP 17 8 15.2 15,779 15.7 15
0.1SORAINEN 17 8 1.0 1,138 1.1 6
0.0LAWIN 17 8 0.2 151 0.2 8
1.2Herbert Smith Freehills LLP 16 11 0.7 1,948 1.9 26
27.1Linklaters LLP 13 12 (21.3) 5,856 5.8 3
0.9Hogan Lovells 11 13 0.6 1,482 1.5 15
0.3YukselKarkinKucuk Attorney Partnership 10 14 0.2 526 0.5 11
0.2Raidla Lejins & Norcous 9 15 0.9 1,057 1.1 7
0.1Greenberg Traurig LLP 7 16 4.5 4,584 4.6 26
2.7DLA Piper LLP 7 16 (2.6) 134 0.1 10
0.0Morgan Lewis & Bockius LLP 6 18 4.4 4,367 4.4 43
0.4Jones Day LP 6 18 1.0 1,416 1.4 22
29.5Skadden Arps Slate Meagher & Flom LLP 5 20 (26.1) 3,421 3.4 9
*Includes Mergers, Acquisitions, Divestitures, Self-tenders and Spinoffs. Excludes Open Market Transactions.
$100,273 1,369 $137,594
*Total Volume represents all announced transactions in US$ millions.
*Tables based on deal count, then volume. Market share based on deal volume.
TOTAL

Bloomberg
36
- 20122013
Asia Pacific Ex-Japan Announced Deals
1/1/13 12/31/13
CHANGEFIRM
RANK MKT
SHARE
VOLUME DEAL
COUNT
RANK MKT
SHARE
Any Involvement, Ranked by Volume
MKT SHARE
USD (Mln)
M&A Legal Advisory League Tables
7.9Skadden Arps Slate Meagher & Flom LLP 49 1 (1.7) 36,036 6.2 3
6.0Linklaters LLP 52 2 (0.7) 30,500 5.3 4
4.0Allen & Overy LLP 64 3 1.2 29,866 5.2 14
3.4King & Wood Mallesons 84 4 1.7 29,413 5.1 21
5.6Davis Polk & Wardwell 20 5 (1.1) 25,760 4.5 6
4.7Baker & McKenzie LLP 96 6 (0.3) 25,538 4.4 10
10.2Freshfields Bruckhaus Deringer LLP 45 7 (5.8) 25,422 4.4 1
2.4Herbert Smith Freehills LLP 74 8 1.7 23,959 4.1 28
2.6Clifford Chance LLP 47 9 1.4 22,962 4.0 26
3.9Kim & Chang 100 10 (0.9) 17,515 3.0 18
2.4Allens 54 11 0.6 17,088 3.0 29
2.7Sullivan & Cromwell LLP 16 12 0.1 16,065 2.8 24
1.7Kirkland & Ellis LLP 21 13 0.9 14,863 2.6 40
0.6Paul Hastings LLP 12 14 1.8 14,127 2.4 68
2.8Ashurst LLP 61 15 (0.5) 13,306 2.3 23
5.7Weil Gotshal & Manges LLP 12 16 (3.4) 13,067 2.3 5
1.2Shin & Kim 81 17 1.0 12,503 2.2 56
1.7Shearman & Sterling LLP 24 18 0.4 12,344 2.1 39
1.4Wachtell Lipton Rosen & Katz 4 19 0.7 12,295 2.1 51
2.1Lee & Ko 84 20 - 12,141 2.1 33
*Includes Mergers, Acquisitions, Divestitures, Self-tenders and Spinoffs. Excludes Open Market Transactions.
$578,887 7,541 $504,879
*Total Volume represents all announced transactions in US$ millions.
TOTAL

Bloomberg
37
- 20122013
Asia Pacific Ex-Japan Announced Deals
1/1/13 12/31/13
CHANGEFIRM
RANK MKT
SHARE
VOLUME DEAL
COUNT
RANK MKT
SHARE
Any Involvement, Ranked by Deal Count
MKT SHARE
USD (Mln)
M&A Legal Advisory League Tables
3.9Kim & Chang 100 1 (0.9) 17,515 3.0 1
4.7Baker & McKenzie LLP 96 2 (0.3) 25,538 4.4 2
3.4King & Wood Mallesons 84 3 1.7 29,413 5.1 4
2.1Lee & Ko 84 3 - 12,141 2.1 3
1.2Shin & Kim 81 5 1.0 12,503 2.2 12
2.4Herbert Smith Freehills LLP 74 6 1.7 23,959 4.1 21
1.3Amarchand Mangaldas & Suresh A Shroff & Co 68 7 (0.1) 6,918 1.2 8
4.0Allen & Overy LLP 64 8 1.2 29,866 5.2 8
2.8Ashurst LLP 61 9 (0.5) 13,306 2.3 21
1.3Bae Kim & Lee 61 9 0.3 9,458 1.6 11
2.6Minter Ellison 60 11 (1.0) 9,401 1.6 6
0.5DLA Piper LLP 58 12 0.2 3,878 0.7 15
2.4Allens 54 13 0.6 17,088 3.0 18
3.9WongPartnership LLP 53 14 (2.8) 6,290 1.1 7
6.0Linklaters LLP 52 15 (0.7) 30,500 5.3 17
5.2Allen & Gledhill 52 15 (3.3) 10,826 1.9 5
7.9Skadden Arps Slate Meagher & Flom LLP 49 17 (1.7) 36,036 6.2 16
1.5Clayton Utz 49 17 (0.9) 3,268 0.6 23
1.4AZB & Partners 48 19 0.3 10,050 1.7 10
2.6Clifford Chance LLP 47 20 1.4 22,962 4.0 14
*Includes Mergers, Acquisitions, Divestitures, Self-tenders and Spinoffs. Excludes Open Market Transactions.
$578,887 7,541 $504,879
*Total Volume represents all announced transactions in US$ millions.
*Tables based on deal count, then volume. Market share based on deal volume.
TOTAL
Bloomberg
38
- 20122013
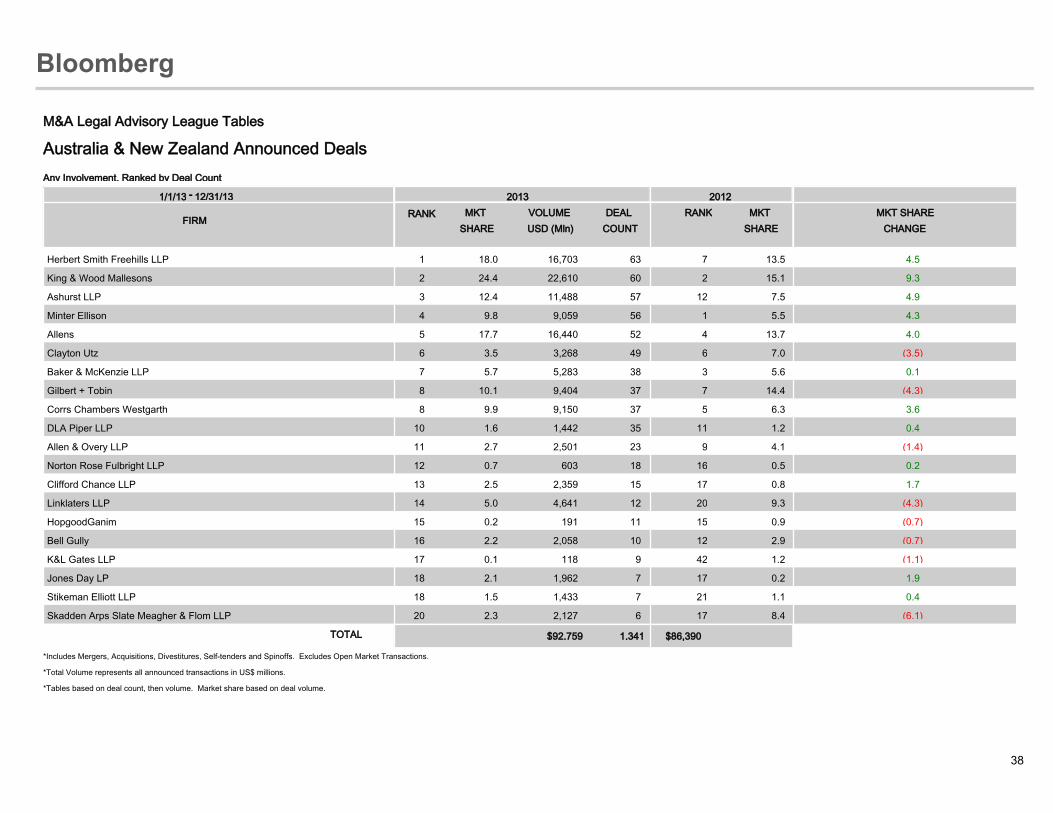
Australia & New Zealand Announced Deals
1/1/13 12/31/13
CHANGEFIRM
RANK MKT
SHARE
VOLUME DEAL
COUNT
RANK MKT
SHARE
Any Involvement, Ranked by Deal Count
MKT SHARE
USD (Mln)
M&A Legal Advisory League Tables
13.5Herbert Smith Freehills LLP 63 1 4.5 16,703 18.0 7
15.1King & Wood Mallesons 60 2 9.3 22,610 24.4 2
7.5Ashurst LLP 57 3 4.9 11,488 12.4 12
5.5Minter Ellison 56 4 4.3 9,059 9.8 1
13.7Allens 52 5 4.0 16,440 17.7 4
7.0Clayton Utz 49 6 (3.5) 3,268 3.5 6
5.6Baker & McKenzie LLP 38 7 0.1 5,283 5.7 3
14.4Gilbert + Tobin 37 8 (4.3) 9,404 10.1 7
6.3Corrs Chambers Westgarth 37 8 3.6 9,150 9.9 5
1.2DLA Piper LLP 35 10 0.4 1,442 1.6 11
4.1Allen & Overy LLP 23 11 (1.4) 2,501 2.7 9
0.5Norton Rose Fulbright LLP 18 12 0.2 603 0.7 16
0.8Clifford Chance LLP 15 13 1.7 2,359 2.5 17
9.3Linklaters LLP 12 14 (4.3) 4,641 5.0 20
0.9HopgoodGanim 11 15 (0.7) 191 0.2 15
2.9Bell Gully 10 16 (0.7) 2,058 2.2 12
1.2K&L Gates LLP 9 17 (1.1) 118 0.1 42
0.2Jones Day LP 7 18 1.9 1,962 2.1 17
1.1Stikeman Elliott LLP 7 18 0.4 1,433 1.5 21
8.4Skadden Arps Slate Meagher & Flom LLP 6 20 (6.1) 2,127 2.3 17
*Includes Mergers, Acquisitions, Divestitures, Self-tenders and Spinoffs. Excludes Open Market Transactions.
$92,759 1,341 $86,390
*Total Volume represents all announced transactions in US$ millions.
*Tables based on deal count, then volume. Market share based on deal volume.
TOTAL

Bloomberg
39
- 20122013
Japan Announced Deals
1/1/13 12/31/13
CHANGEFIRM
RANK MKT
SHARE
VOLUME DEAL
COUNT
RANK MKT
SHARE
Any Involvement, Ranked by Deal Count
MKT SHARE
USD (Mln)
M&A Legal Advisory League Tables
49.7Mori Hamada & Matsumoto 155 1 (26.6) 25,883 23.1 2
23.4Nagashima Ohno & Tsunematsu 155 1 (10.0) 14,998 13.4 1
21.3Nishimura & Asahi 96 3 12.2 37,534 33.5 3
16.2Anderson Mori & Tomotsune 54 4 (11.6) 5,124 4.6 4
5.2Freshfields Bruckhaus Deringer LLP 31 5 - 5,835 5.2 7
3.9Baker & McKenzie LLP 28 6 (1.7) 2,460 2.2 5
2.5Oh-Ebashi LPC & Partners 25 7 (1.2) 1,468 1.3 9
26.4Morrison & Foerster LLP 21 8 (22.7) 4,154 3.7 8
1.2Allen & Overy LLP 18 9 10.7 13,283 11.9 16
27.1Shearman & Sterling LLP 18 9 (19.8) 8,164 7.3 15
24.9Skadden Arps Slate Meagher & Flom LLP 18 9 (21.0) 4,399 3.9 9
3.0White & Case LLP 16 12 1.6 5,098 4.6 13
4.9Jones Day LP 14 13 2.4 8,178 7.3 11
2.6Linklaters LLP 12 14 11.1 15,376 13.7 20
1.3Latham & Watkins LLP 11 15 5.0 7,027 6.3 21
0.8Herbert Smith Freehills LLP 11 15 3.1 4,421 3.9 63
0.6Ashurst LLP 10 17 1.0 1,812 1.6 21
2.0Clifford Chance LLP 10 17 (0.8) 1,388 1.2 11
1.8Kim & Chang 10 17 (0.7) 1,237 1.1 6
9.7Simpson Thacher & Bartlett LLP 9 20 2.4 13,572 12.1 17
*Includes Mergers, Acquisitions, Divestitures, Self-tenders and Spinoffs. Excludes Open Market Transactions.
$112,122 2,329 $202,392
*Total Volume represents all announced transactions in US$ millions.
*Tables based on deal count, then volume. Market share based on deal volume.
TOTAL

Bloomberg
40
- 20122013
China Announced Deals
1/1/13 12/31/13
CHANGEFIRM
RANK MKT
SHARE
VOLUME DEAL
COUNT
RANK MKT
SHARE
Any Involvement, Ranked by Volume
MKT SHARE
USD (Mln)
M&A Legal Advisory League Tables
8.5Skadden Arps Slate Meagher & Flom LLP 24 1 (1.2) 17,859 7.3 12
7.3Linklaters LLP 17 2 (1.9) 13,217 5.4 14
14.4Freshfields Bruckhaus Deringer LLP 20 3 (10.7) 8,980 3.7 2
0.4Jia Yuan Law Firm 9 4 3.2 8,873 3.6 59
7.0O'Melveny & Myers LLP 21 5 (3.5) 8,583 3.5 15
1.8Allen & Overy LLP 8 6 1.7 8,495 3.5 33
2.1Simpson Thacher & Bartlett LLP 5 7 1.2 8,168 3.3 29
4.2King & Wood Mallesons 26 8 (1.0) 7,838 3.2 19
-Uria Menendez Abogados SLP 3 9 3.0 7,392 3.0 -
1.2Paul Hastings LLP 2 10 1.7 7,033 2.9 37
-Troutman Sanders LLP 2 11 2.8 6,955 2.8 -
-McGuireWoods LLP 1 11 2.8 6,955 2.8 -
6.2Sullivan & Cromwell LLP 8 13 (3.4) 6,849 2.8 16
8.0Weil Gotshal & Manges LLP 7 14 (5.4) 6,288 2.6 13
1.5Vinson & Elkins LLP 4 15 1.0 6,200 2.5 35
3.6Kirkland & Ellis LLP 12 16 (1.3) 5,748 2.3 24
1.1Herbert Smith Freehills LLP 7 17 1.0 5,067 2.1 40
-Zhongxin Xiecheng Law Firm 2 18 2.0 4,948 2.0 -
3.4Shearman & Sterling LLP 14 19 (1.4) 4,921 2.0 25
1.6Clifford Chance LLP 17 20 0.3 4,718 1.9 34
*Includes Mergers, Acquisitions, Divestitures, Self-tenders and Spinoffs. Excludes Open Market Transactions.
$246,197 2,739 $190,366
*Total Volume represents all announced transactions in US$ millions.
TOTAL

Bloomberg
41
- 20122013
Hong Kong Announced Deals
1/1/13 12/31/13
CHANGEFIRM
RANK MKT
SHARE
VOLUME DEAL
COUNT
RANK MKT
SHARE
Any Involvement, Ranked by Volume
MKT SHARE
USD (Mln)
M&A Legal Advisory League Tables
12.1Linklaters LLP 12 1 (1.7) 6,543 10.4 3
13.2Freshfields Bruckhaus Deringer LLP 6 2 (3.5) 6,078 9.7 2
10.0Baker & McKenzie LLP 18 3 (0.6) 5,884 9.4 5
0.2King & Wood Mallesons 8 4 6.4 4,114 6.6 52
0.0Gibson Dunn & Crutcher LLP 1 5 3.9 2,425 3.9 69
0.7Slaughter & May 8 6 2.9 2,241 3.6 38
10.0Clifford Chance LLP 8 7 (6.5) 2,207 3.5 6
8.0Sullivan & Cromwell LLP 4 8 (4.8) 2,008 3.2 11
1.5Norton Rose Fulbright LLP 2 9 1.7 2,007 3.2 26
2.6Allen & Gledhill 6 10 0.4 1,857 3.0 22
9.8O'Melveny & Myers LLP 7 11 (7.2) 1,618 2.6 7
9.3Weil Gotshal & Manges LLP 4 12 (7.0) 1,452 2.3 8
6.9Shearman & Sterling LLP 6 13 (4.7) 1,369 2.2 16
6.0CMS 2 14 (3.9) 1,293 2.1 19
0.3Mayer Brown LLP 4 15 1.7 1,232 2.0 47
15.8Allen & Overy LLP 11 16 (13.9) 1,220 1.9 1
8.4Kirkland & Ellis LLP 9 17 (6.5) 1,219 1.9 9
8.1Skadden Arps Slate Meagher & Flom LLP 10 18 (6.2) 1,195 1.9 10
-Stamford Law Corp 2 19 1.7 1,042 1.7 -
-A&L Goodbody Solicitors 1 20 1.6 1,021 1.6 -
*Includes Mergers, Acquisitions, Divestitures, Self-tenders and Spinoffs. Excludes Open Market Transactions.
$62,754 885 $50,525
*Total Volume represents all announced transactions in US$ millions.
TOTAL

Bloomberg
42
- 20122013
South Korea Announced Deals
1/1/13 12/31/13
CHANGEFIRM
RANK MKT
SHARE
VOLUME DEAL
COUNT
RANK MKT
SHARE
Any Involvement, Ranked by Volume
MKT SHARE
USD (Mln)
M&A Legal Advisory League Tables
33.7Kim & Chang 99 1 (3.8) 17,474 29.9 1
10.7Shin & Kim 81 2 10.7 12,503 21.4 14
18.2Lee & Ko 83 3 2.6 12,138 20.8 2
11.5Bae Kim & Lee 61 4 4.7 9,458 16.2 13
0.5Paul Hastings LLP 4 5 3.5 2,351 4.0 31
-Wachtell Lipton Rosen & Katz 1 6 3.8 2,200 3.8 -
0.6Allen & Overy LLP 3 7 2.8 2,007 3.4 26
3.0Linklaters LLP 4 8 0.3 1,896 3.3 19
7.6Yulchon LLC 16 9 (4.6) 1,745 3.0 15
0.6Ashurst LLP 2 10 2.2 1,620 2.8 28
-Pinheiro Neto Advogados 1 11 2.8 1,611 2.8 -
1.8Ropes & Gray LLP 1 11 1.0 1,611 2.8 20
0.4Norton Rose Fulbright LLP 1 13 1.5 1,100 1.9 36
-Osler Hoskin & Harcourt LLP 1 13 1.9 1,100 1.9 -
0.0Shearman & Sterling LLP 1 13 1.9 1,100 1.9 48
0.2Nishimura & Asahi 4 16 1.5 975 1.7 39
3.9Yoon & Yang LLC 15 17 (2.6) 767 1.3 16
12.3Baker Botts LLP 2 18 (11.1) 687 1.2 6
0.0Skadden Arps Slate Meagher & Flom LLP 4 19 1.0 593 1.0 48
0.2HYUN Law 5 20 0.8 553 1.0 40
*Includes Mergers, Acquisitions, Divestitures, Self-tenders and Spinoffs. Excludes Open Market Transactions.
$58,365 946 $58,378
*Total Volume represents all announced transactions in US$ millions.
TOTAL

Bloomberg
43
- 20122013
India Announced Deals
1/1/13 12/31/13
CHANGEFIRM
RANK MKT
SHARE
VOLUME DEAL
COUNT
RANK MKT
SHARE
Any Involvement, Ranked by Volume
MKT SHARE
USD (Mln)
M&A Legal Advisory League Tables
14.5Amarchand Mangaldas & Suresh A Shroff & Co 67 1 5.8 6,508 20.3 3
-Simmons & Simmons LLP 2 2 16.0 5,140 16.0 -
1.2Davis Polk & Wardwell 6 3 11.1 3,944 12.3 30
4.1Slaughter & May 5 4 6.2 3,296 10.3 10
16.4AZB & Partners 45 5 (7.0) 3,013 9.4 2
4.7Khaitan & Co 35 6 1.9 2,130 6.6 7
-Barbosa Mussnich & Aragao 2 7 5.9 1,906 5.9 -
30.9Skadden Arps Slate Meagher & Flom LLP 3 8 (25.4) 1,764 5.5 1
1.5Herbert Smith Freehills LLP 3 9 3.9 1,722 5.4 20
4.2Jones Day LP 5 10 1.0 1,678 5.2 9
-DSK Legal 2 11 5.1 1,624 5.1 -
-Haynes & Boone LLP 1 12 5.0 1,600 5.0 -
1.2Morgan Lewis & Bockius LLP 1 12 3.8 1,600 5.0 22
-Osler Hoskin & Harcourt LLP 1 12 5.0 1,600 5.0 -
-Pinheiro Neto Advogados 1 12 5.0 1,600 5.0 -
-Platinum Partners 1 12 5.0 1,600 5.0 -
0.6S&R Associates 7 17 3.4 1,297 4.0 38
0.7DLA Piper LLP 9 18 1.8 791 2.5 35
1.2White & Case LLP 5 19 1.3 789 2.5 22
1.5Allen & Gledhill 2 20 0.5 631 2.0 21
*Includes Mergers, Acquisitions, Divestitures, Self-tenders and Spinoffs. Excludes Open Market Transactions.
$32,090 728 $44,225
*Total Volume represents all announced transactions in US$ millions.
TOTAL

Bloomberg
44
- 20122013
South East Asia Announced Deals
1/1/13 12/31/13
CHANGEFIRM
RANK MKT
SHARE
VOLUME DEAL
COUNT
RANK MKT
SHARE
Any Involvement, Ranked by Deal Count
MKT SHARE
USD (Mln)
M&A Legal Advisory League Tables
19.9Allen & Gledhill 51 1 (12.4) 9,804 7.5 1
15.4WongPartnership LLP 46 2 (12.2) 4,204 3.2 2
6.7Baker & McKenzie LLP 37 3 3.6 13,430 10.3 3
6.8Shook Lin & Bok LLP 30 4 (5.1) 2,159 1.7 5
7.1Allen & Overy LLP 24 5 4.2 14,645 11.3 7
3.5Rajah & Tann 22 6 (1.0) 3,275 2.5 6
4.8Clifford Chance LLP 19 7 7.2 15,593 12.0 9
10.3Linklaters LLP 19 7 (1.7) 11,131 8.6 9
9.0Stamford Law Corp 16 9 (7.0) 2,532 2.0 4
22.1Freshfields Bruckhaus Deringer LLP 15 10 (14.5) 9,884 7.6 8
0.2O'Melveny & Myers LLP 13 11 0.1 327 0.3 22
0.4Herbert Smith Freehills LLP 12 12 2.1 3,279 2.5 28
0.1Nagashima Ohno & Tsunematsu 12 12 0.3 463 0.4 43
1.2Mori Hamada & Matsumoto 12 12 (1.1) 136 0.1 12
0.7Jones Day LP 9 15 2.0 3,470 2.7 14
1.0Skadden Arps Slate Meagher & Flom LLP 7 16 9.3 13,448 10.3 28
0.4Simpson Thacher & Bartlett LLP 7 16 2.1 3,223 2.5 28
0.2Drew & Napier LLC 7 16 0.2 523 0.4 14
1.5Rahmat Lim & Partners 7 16 (1.2) 372 0.3 12
0.1AZB & Partners 6 20 5.6 7,400 5.7 28
*Includes Mergers, Acquisitions, Divestitures, Self-tenders and Spinoffs. Excludes Open Market Transactions.
$130,020 1,500 $120,332
*Total Volume represents all announced transactions in US$ millions.
*Tables based on deal count, then volume. Market share based on deal volume.
TOTAL

Bloomberg
45
For data submissions or queries,
please contact:
Eshani Gupte
North America +1-212-617-5969 +1-917-369-3965 [email protected]
Paula Cook-Dinan
EMEA +44-20-3525-8104 +44-20-7942-1792 [email protected]
Devanshi Desai
Asia Pacific +61-2-9777-8661 +61-2-9770-8561 [email protected]
Bloomberg 2013 Annual
Mergers & Acquisitions Legal Advisory Rankings Bloomberg M&A league tables represent transactions that are either pending or completed, and for which Bloomberg
has been notified. Bloomberg M&A league tables include mergers, acquisitions, divestitures, self-tenders, spinoffs, debt-for-equity swaps,
private placements of common equity and convertible securities, and purchases of convertible securities and cash
injection components of recapitalizations according to Bloomberg standards. Excludes open market transactions. All
deals except additional stake purchases are subjected to a minimum threshold of 5% equity or USD 50 million total
value. League table credit is based on announced total value of a deal. Bloomberg LP and its suppliers believe the information herein was obtained from reliable sources, but they do not
guarantee its accuracy. Neither the information nor the opinion expressed constitutes a solicitation of the purchase or
sale of securities or commodities.
12/31/2013
Fernando Simon LATAM +55-11-3048-4619 +55-11-3048-4669
For 24 hour global customer support call
+1 212 318 2000 +44 20 7330 7500 +65 6212 1000 +81 3 3201 8900 or press the HELP key twice on the BLOOMBERG PROFESSIONAL(R) service.
MA <GO> MA <GO> MA <GO>