Factor Structure in Commodity Futures Returns and Volatility
Harnessing volatility to enhance returns
General enquiries [email protected]
Telephone Address
+44 (0) 20 7429 0600
Mulvaney Capital Management 5th Floor, Cannongate House
62-64 Cannon Street London EC4N 6AE
Performance data effective as at 30th April 2013
2 2
KEY FACTS
• Managed futures fund / CTA
• 100% systematic long-term trend follower
• 13 year track record
• Average annualised return: 14.40%
• AUM: $187 million (May 2013)
• Non-correlation to equities and most alternative asset classes.
• Investment via Fund or Managed Account
• Recognized in top CTA rankings by Bloomberg and ManagedFutures.com*
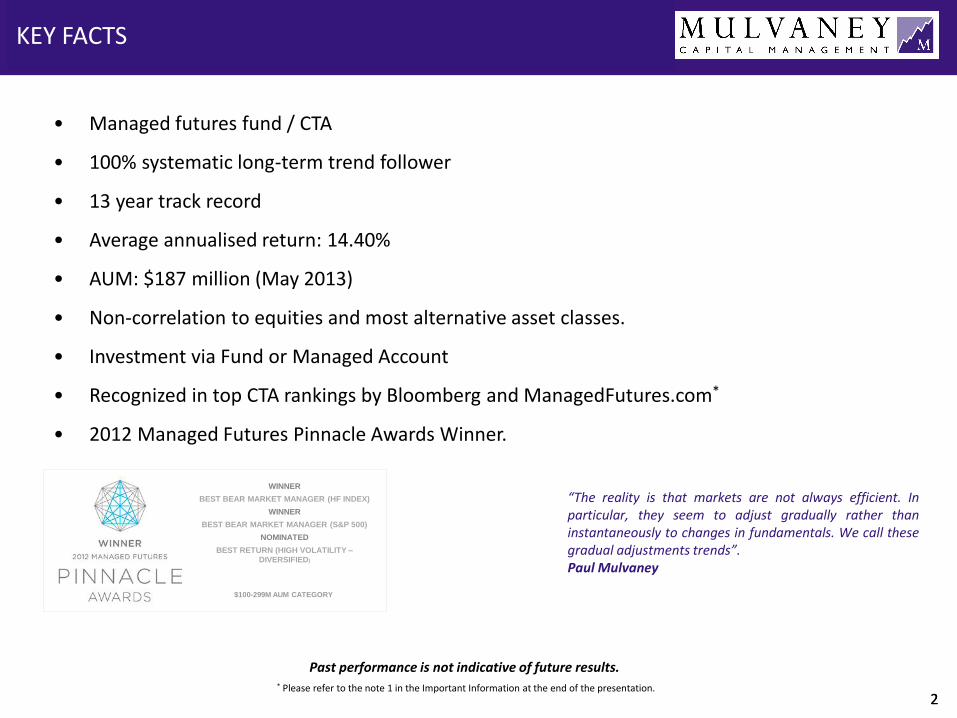
• 2012 Managed Futures Pinnacle Awards Winner.
* Please refer to the note 1 in the Important Information at the end of the presentation.
Past performance is not indicative of future results.
“The reality is that markets are not always efficient. In particular, they seem to adjust gradually rather than instantaneously to changes in fundamentals. We call these gradual adjustments trends”.
Paul Mulvaney
WINNER
BEST BEAR MARKET MANAGER (HF INDEX)
WINNER
BEST BEAR MARKET MANAGER (S&P 500)
NOMINATED
BEST RETURN (HIGH VOLATILITY –
DIVERSIFIED)
$100-299M AUM CATEGORY
3
OUR EDGE
• We expect the unexpected. Our program was built to be robust and general, and seeks to capture and exploit
‘black swan’ (or ‘fat tail’) events.
• We do not set any targets for price, profit or standard deviation so we can harness upside volatility to maximise
potential returns.
• We provide effective diversification by being more heavily weighted towards commodities than most competitors,
and gaining full exposure to some of the smaller agricultural futures markets.
• Our program is non-correlated to traditional asset classes and most alternative strategies, which can enhance
portfolio returns and reduce portfolio volatility.
• We can profit from rising or falling markets. Performance is not dependent on the strength of global economies.
• We are fully systematic and never override the program, thus retaining objectivity at all times.

4
GOVERNANCE AND ORGANISATIONAL STRUCTURE
Board of Directors
Dudley Fishburn – Chairman Paul Mulvaney – CEO
Mary Jo Jacobi – Non-Executive
Executive Management
Department Heads
Portfolio Management & Research
Paul Mulvaney - CIO
Phil Duke
Chris Cracknell
• Execute and maintain program • Research • Trade execution
Legal, Compliance & Administration
Alistair Macnaughton - CLO
Hugh Moxon
• Ensure administrative, legal and regulatory compliance
• Oversight of service providers • Performance monitoring
Finance, IT & Office Management
Richard Harris - CFO
Karen Turgut
Ellyn Ompoc
• Financial control and regulatory reporting
• Treasury function • IT and office management
• Sales and investor relations • Marketing and communications
Sales & Marketing
Richard Harris - CFO
Hina Zia
Paul McFarlane-Fruthiot
Nick Cotton
5 5
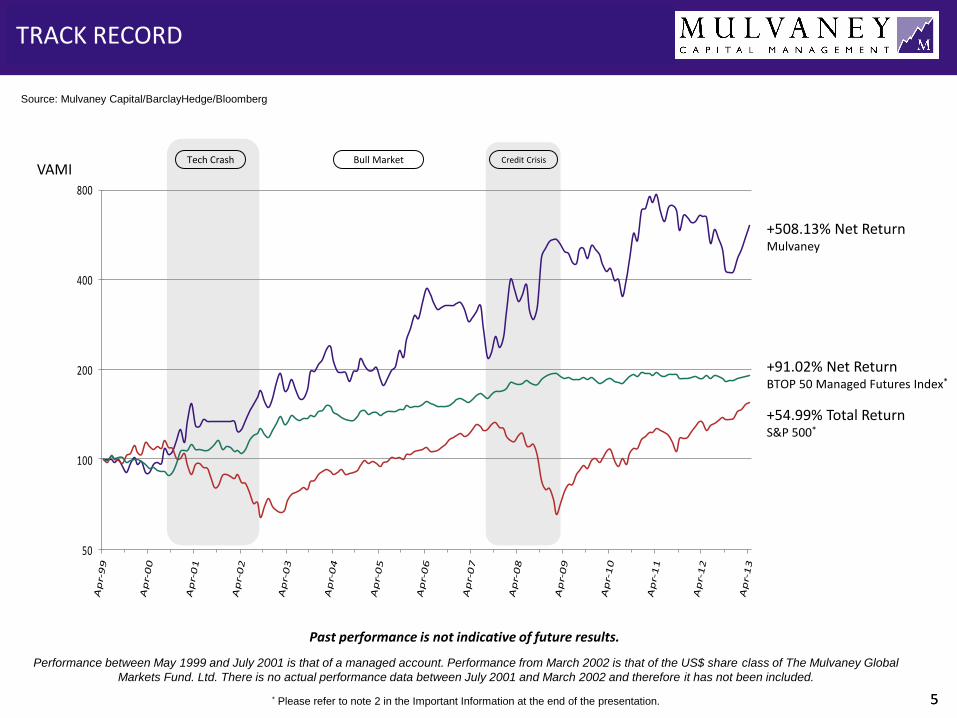
TRACK RECORD
Tech Crash Bull Market Credit Crisis
+508.13% Net Return Mulvaney
+91.02% Net Return BTOP 50 Managed Futures Index*
+54.99% Total Return S&P 500*
VAMI
Performance between May 1999 and July 2001 is that of a managed account. Performance from March 2002 is that of the US$ share class of The Mulvaney Global
Markets Fund. Ltd. There is no actual performance data between July 2001 and March 2002 and therefore it has not been included.
Past performance is not indicative of future results.
Source: Mulvaney Capital/BarclayHedge/Bloomberg
50
100
200
400
800
* Please refer to note 2 in the Important Information at the end of the presentation.
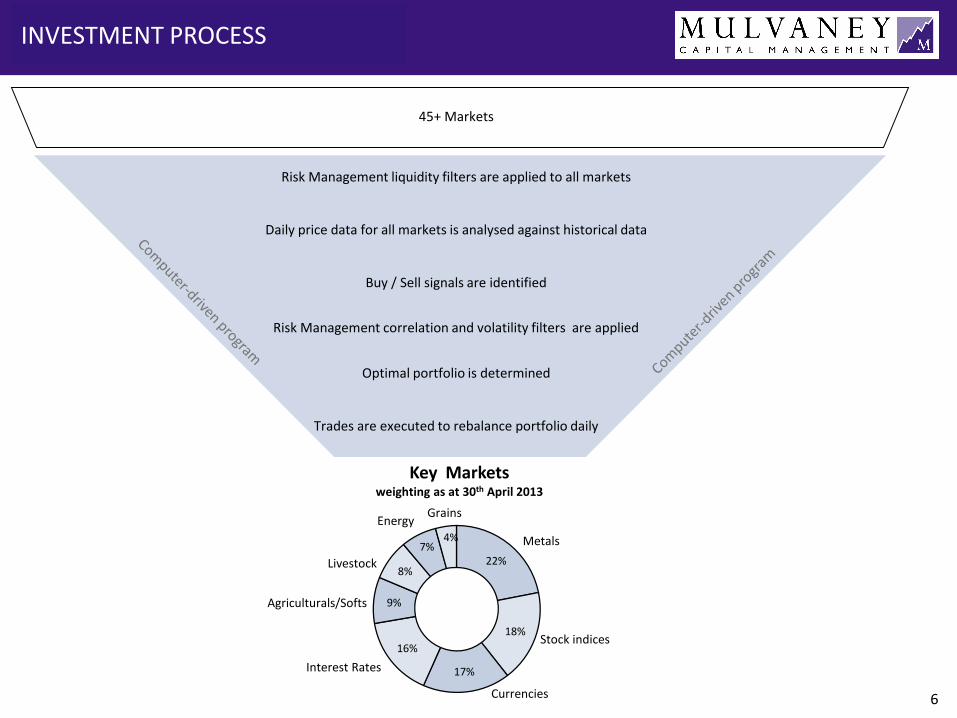
22%
18%
17%
16%
9%
8%
7% 4%
Agriculturals/Softs
Metals
Energy Grains
Stock indices
Interest Rates
Currencies 6
INVESTMENT PROCESS
Daily price data for all markets is analysed against historical data
Buy / Sell signals are identified
Risk Management correlation and volatility filters are applied
Optimal portfolio is determined
Trades are executed to rebalance portfolio daily
Risk Management liquidity filters are applied to all markets
45+ Markets
Key Markets weighting as at 30th April 2013
Livestock
7
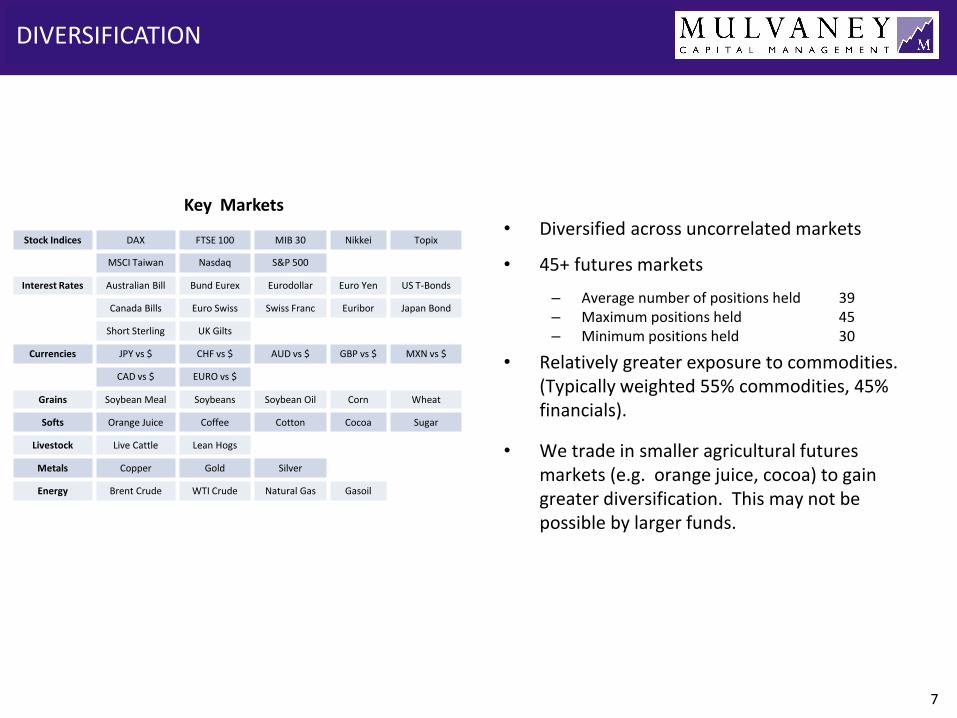
DIVERSIFICATION
• Diversified across uncorrelated markets
• 45+ futures markets
– Average number of positions held 39 – Maximum positions held 45 – Minimum positions held 30
• Relatively greater exposure to commodities. (Typically weighted 55% commodities, 45% financials).
• We trade in smaller agricultural futures markets (e.g. orange juice, cocoa) to gain greater diversification. This may not be possible by larger funds.
Key Markets
Stock Indices DAX FTSE 100 MIB 30 Nikkei Topix
MSCI Taiwan Nasdaq S&P 500
Interest Rates Australian Bill Bund Eurex Eurodollar Euro Yen US T-Bonds
Canada Bills Euro Swiss Swiss Franc Euribor Japan Bond
Short Sterling UK Gilts
Currencies JPY vs $ CHF vs $ AUD vs $ GBP vs $ MXN vs $
CAD vs $ EURO vs $
Grains Soybean Meal Soybeans Soybean Oil Corn Wheat
Softs Orange Juice Coffee Cotton Cocoa Sugar
Livestock Live Cattle Lean Hogs
Metals Copper Gold Silver
Energy Brent Crude WTI Crude Natural Gas Gasoil
8
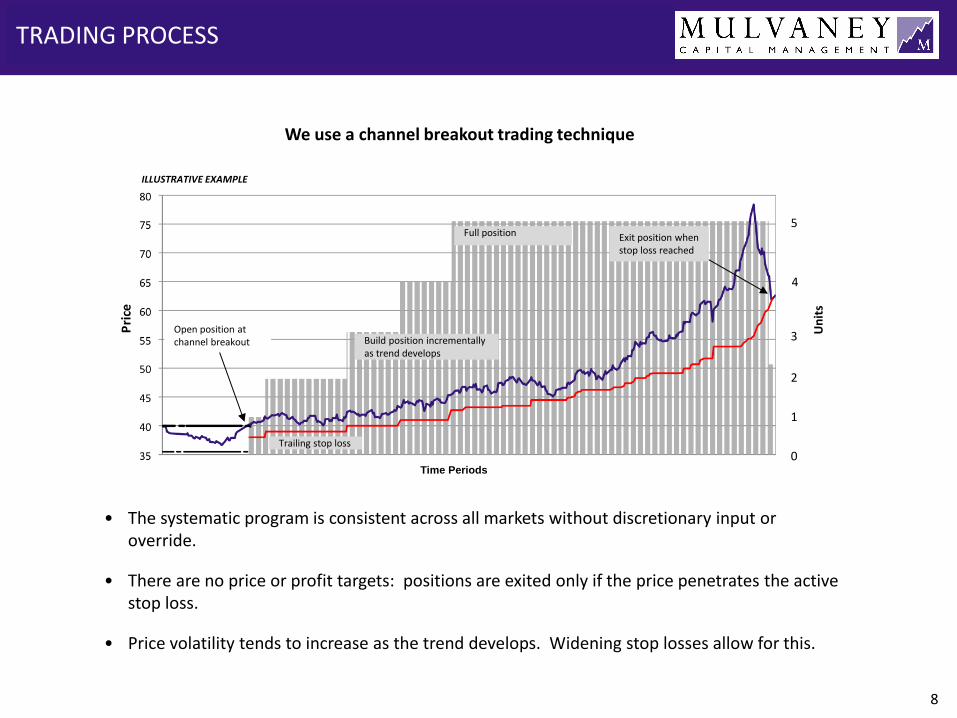
ILLUSTRATIVE EXAMPLE
Open position at channel breakout
Trailing stop loss
Exit position when stop loss reached
Full position
Time Periods
Build position incrementally as trend develops
• The systematic program is consistent across all markets without discretionary input or override.
• There are no price or profit targets: positions are exited only if the price penetrates the active stop loss.
• Price volatility tends to increase as the trend develops. Widening stop losses allow for this.
We use a channel breakout trading technique
TRADING PROCESS
Un
its
0
1
2
3
4
5
9
DISTRIBUTION OF RETURNS
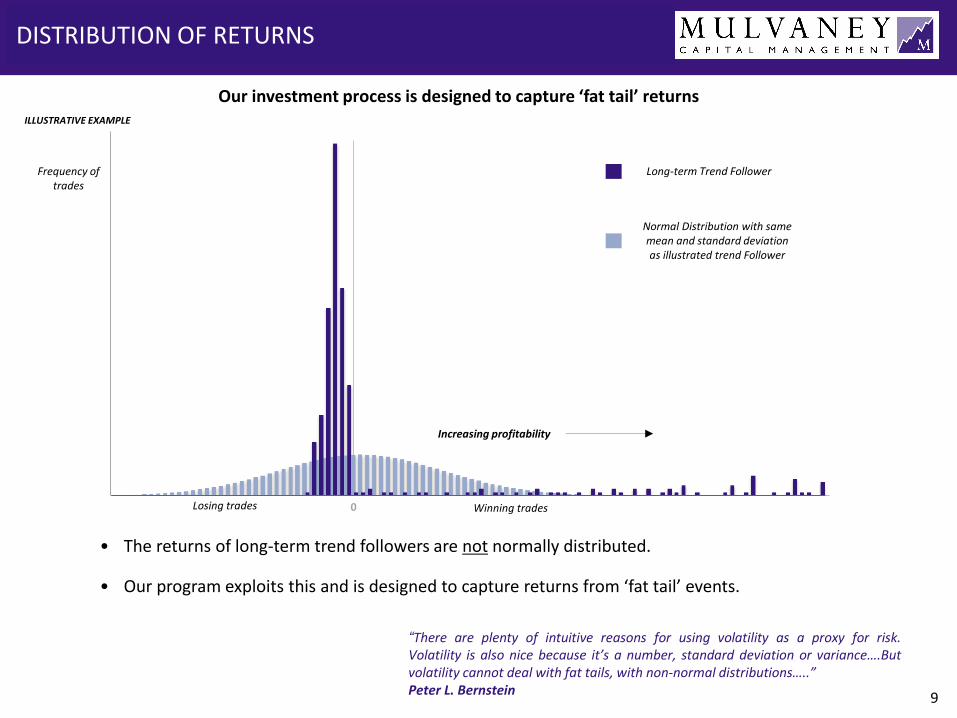
• The returns of long-term trend followers are not normally distributed.
• Our program exploits this and is designed to capture returns from ‘fat tail’ events.
Our investment process is designed to capture ‘fat tail’ returns
“There are plenty of intuitive reasons for using volatility as a proxy for risk. Volatility is also nice because it’s a number, standard deviation or variance….But volatility cannot deal with fat tails, with non-normal distributions…..”
Peter L. Bernstein
Frequency of trades
Losing trades Winning trades 0
Increasing profitability
ILLUSTRATIVE EXAMPLE
Long-term Trend Follower
Normal Distribution with same mean and standard deviation as illustrated trend Follower
10
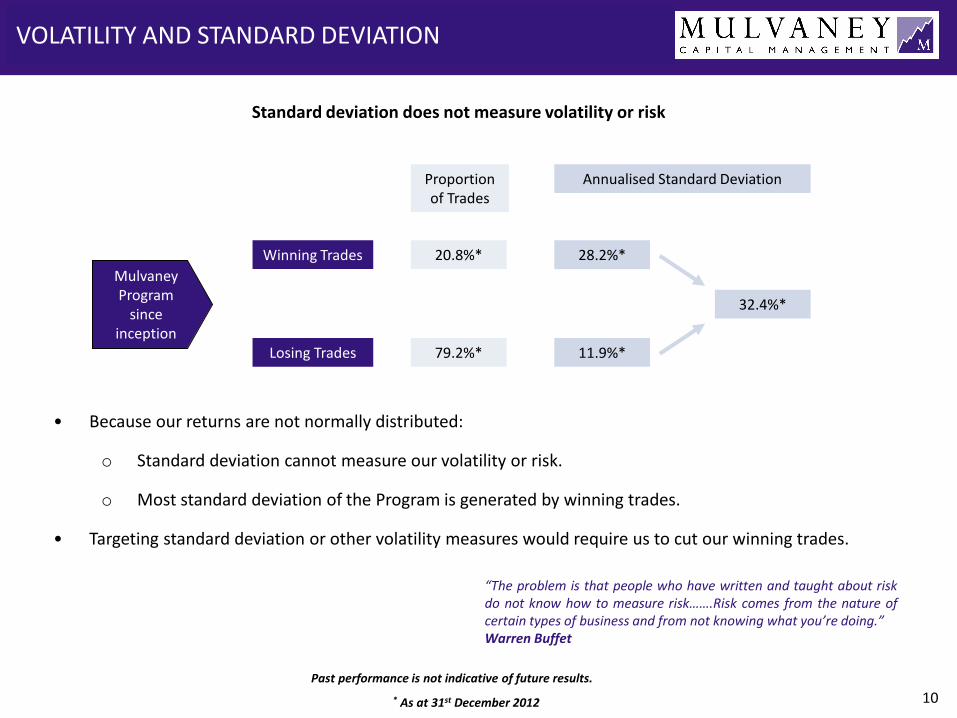
VOLATILITY AND STANDARD DEVIATION
Winning Trades 20.8%*
Proportion of Trades
79.2%*
28.2%*
Annualised Standard Deviation
11.9%*
32.4%*
Mulvaney Program
since inception
Losing Trades
Past performance is not indicative of future results.
* As at 31st December 2012
• Because our returns are not normally distributed:
o Standard deviation cannot measure our volatility or risk.
o Most standard deviation of the Program is generated by winning trades.
• Targeting standard deviation or other volatility measures would require us to cut our winning trades.
“The problem is that people who have written and taught about risk do not know how to measure risk…….Risk comes from the nature of certain types of business and from not knowing what you’re doing.”
Warren Buffet
Standard deviation does not measure volatility or risk
11
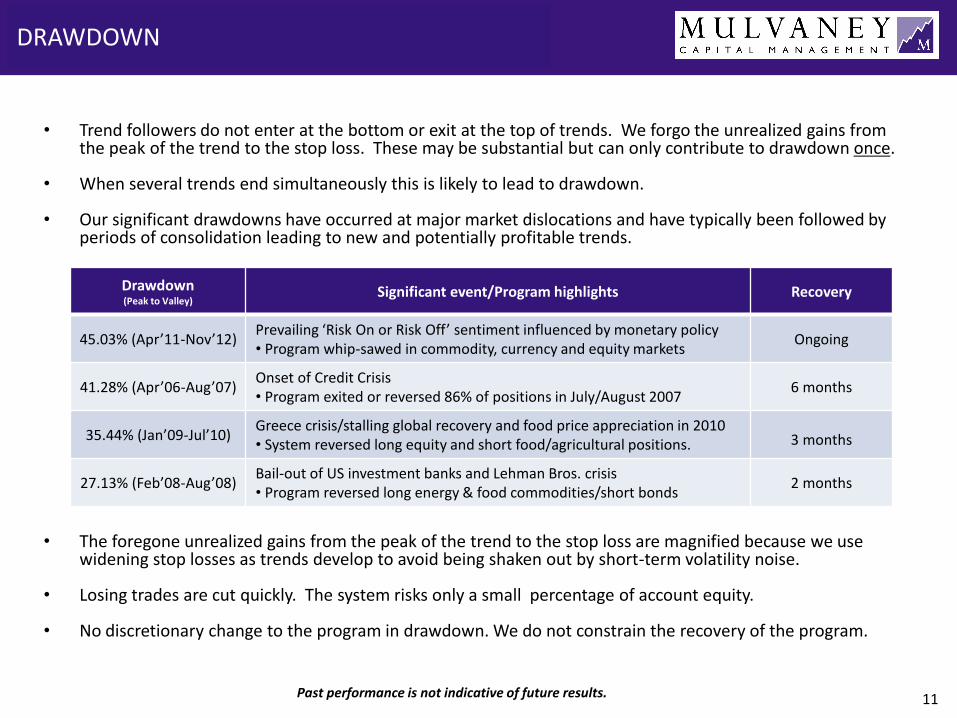
DRAWDOWN
Past performance is not indicative of future results.
• Trend followers do not enter at the bottom or exit at the top of trends. We forgo the unrealized gains from the peak of the trend to the stop loss. These may be substantial but can only contribute to drawdown once.
• When several trends end simultaneously this is likely to lead to drawdown.
• Our significant drawdowns have occurred at major market dislocations and have typically been followed by periods of consolidation leading to new and potentially profitable trends.
• The foregone unrealized gains from the peak of the trend to the stop loss are magnified because we use
widening stop losses as trends develop to avoid being shaken out by short-term volatility noise. • Losing trades are cut quickly. The system risks only a small percentage of account equity.
• No discretionary change to the program in drawdown. We do not constrain the recovery of the program.
Drawdown (Peak to Valley)
Significant event/Program highlights Recovery
45.03% (Apr’11-Nov’12) Prevailing ‘Risk On or Risk Off’ sentiment influenced by monetary policy • Program whip-sawed in commodity, currency and equity markets
Ongoing
41.28% (Apr’06-Aug’07) Onset of Credit Crisis • Program exited or reversed 86% of positions in July/August 2007
6 months
35.44% (Jan’09-Jul’10) Greece crisis/stalling global recovery and food price appreciation in 2010 • System reversed long equity and short food/agricultural positions. 3 months
27.13% (Feb’08-Aug’08) Bail-out of US investment banks and Lehman Bros. crisis • Program reversed long energy & food commodities/short bonds
2 months
12
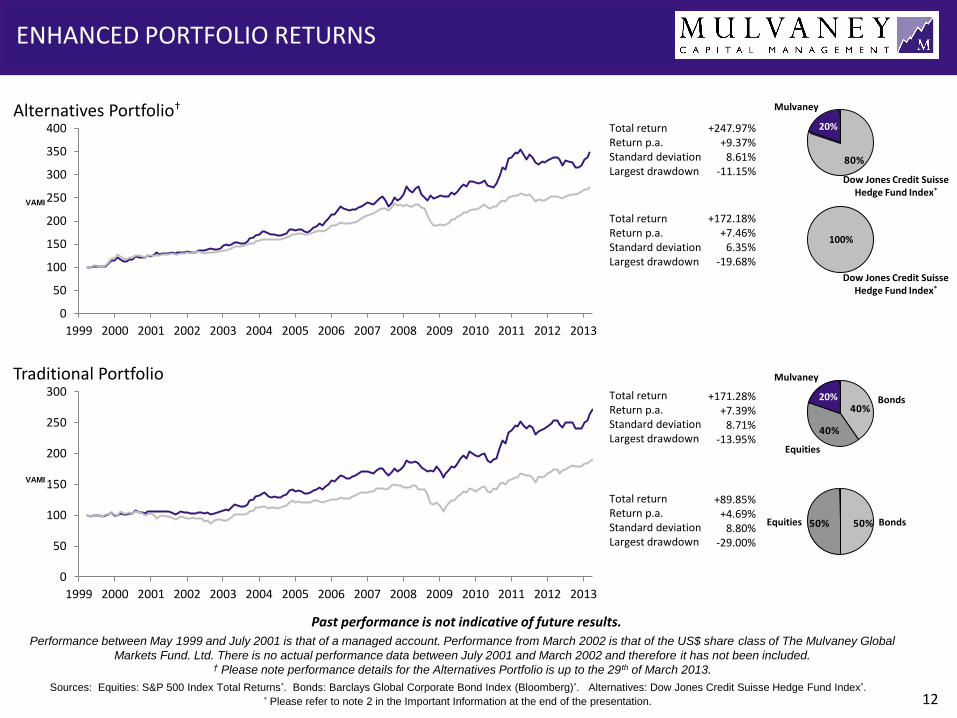
ENHANCED PORTFOLIO RETURNS
Total return Return p.a. Standard deviation Largest drawdown
+172.18% +7.46% 6.35%
-19.68%
+171.28% +7.39%
8.71% -13.95%
+89.85% +4.69%
8.80% -29.00%
Traditional Portfolio
Alternatives Portfolio†
40%
40%
Mulvaney
20%
Equities
Bonds
50% 50%Equities Bonds
100%
80%
Mulvaney
20%
Dow Jones Credit Suisse Hedge Fund Index*
Dow Jones Credit Suisse Hedge Fund Index*
+247.97% +9.37%
8.61% -11.15%
Total return Return p.a. Standard deviation Largest drawdown
Total return Return p.a. Standard deviation Largest drawdown
Total return Return p.a. Standard deviation Largest drawdown
Performance between May 1999 and July 2001 is that of a managed account. Performance from March 2002 is that of the US$ share class of The Mulvaney Global
Markets Fund. Ltd. There is no actual performance data between July 2001 and March 2002 and therefore it has not been included. † Please note performance details for the Alternatives Portfolio is up to the 29th of March 2013.
Past performance is not indicative of future results.
Sources: Equities: S&P 500 Index Total Returns*. Bonds: Barclays Global Corporate Bond Index (Bloomberg)*. Alternatives: Dow Jones Credit Suisse Hedge Fund Index*. * Please refer to note 2 in the Important Information at the end of the presentation.
VAMI
VAMI
0
50
100
150
200
250
300
1999 2000 2001 2002 2003 2004 2005 2006 2007 2008 2009 2010 2011 2012 2013
0
50
100
150
200
250
300
350
400
1999 2000 2001 2002 2003 2004 2005 2006 2007 2008 2009 2010 2011 2012 2013
13 13
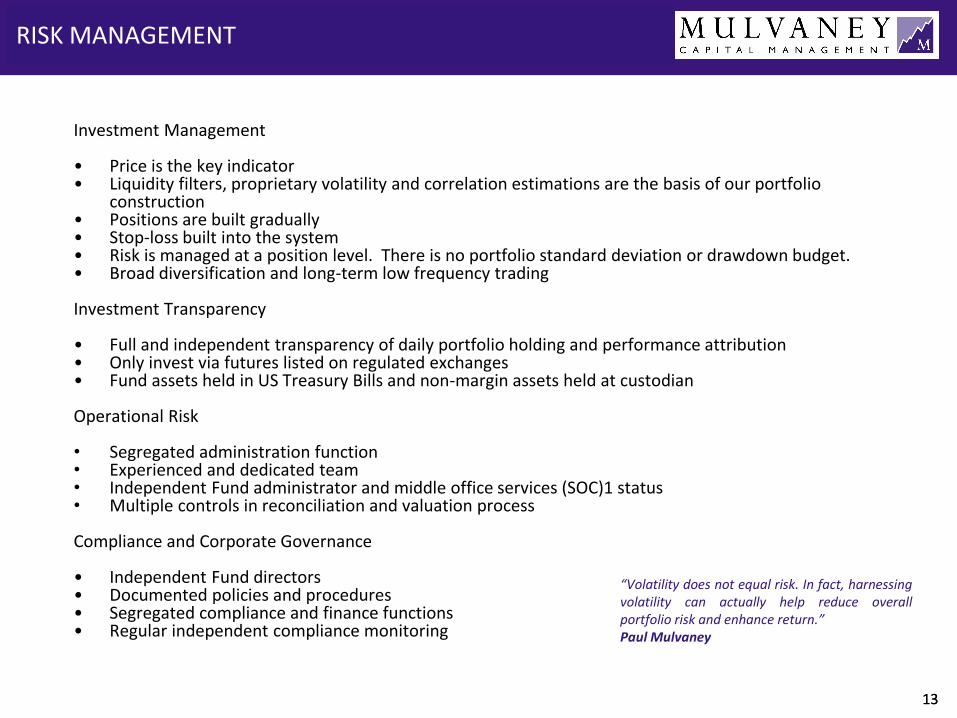
RISK MANAGEMENT
Investment Management • Price is the key indicator • Liquidity filters, proprietary volatility and correlation estimations are the basis of our portfolio
construction • Positions are built gradually • Stop-loss built into the system • Risk is managed at a position level. There is no portfolio standard deviation or drawdown budget. • Broad diversification and long-term low frequency trading Investment Transparency • Full and independent transparency of daily portfolio holding and performance attribution • Only invest via futures listed on regulated exchanges • Fund assets held in US Treasury Bills and non-margin assets held at custodian Operational Risk • Segregated administration function • Experienced and dedicated team • Independent Fund administrator and middle office services (SOC)1 status • Multiple controls in reconciliation and valuation process Compliance and Corporate Governance • Independent Fund directors • Documented policies and procedures • Segregated compliance and finance functions • Regular independent compliance monitoring
“Volatility does not equal risk. In fact, harnessing volatility can actually help reduce overall portfolio risk and enhance return.”
Paul Mulvaney
14 14
TRACK RECORD & KEY DATA
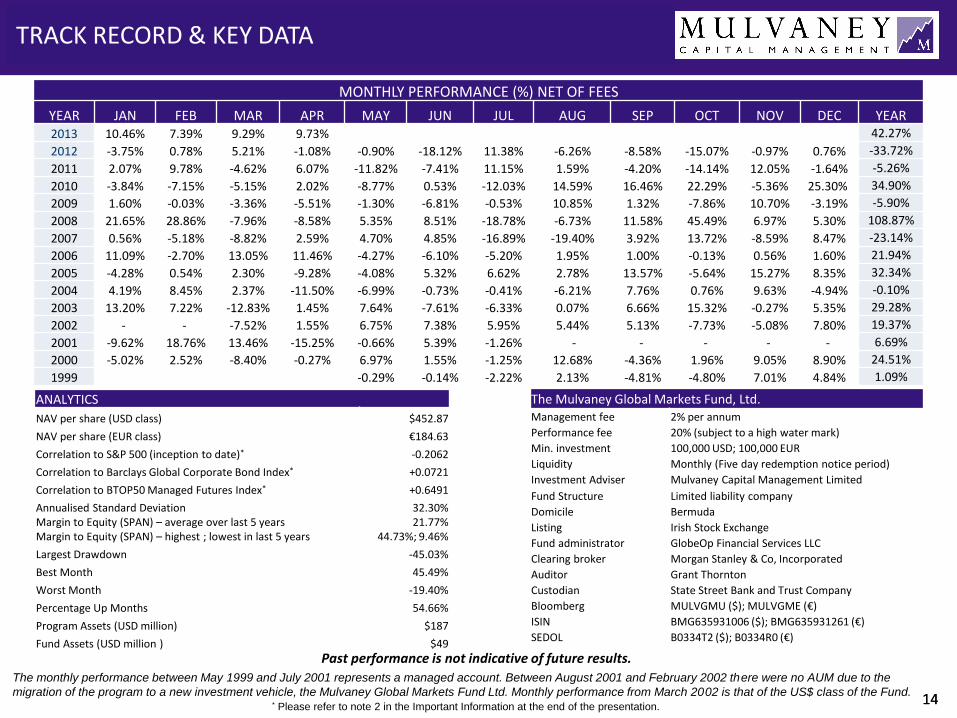
MONTHLY PERFORMANCE (%) NET OF FEES
YEAR JAN FEB MAR APR MAY JUN JUL AUG SEP OCT NOV DEC YEAR
2013 10.46% 7.39% 9.29% 9.73% 42.27%
2012 -3.75% 0.78% 5.21% -1.08% -0.90% -18.12% 11.38% -6.26% -8.58% -15.07% -0.97% 0.76% -33.72%
2011 2.07% 9.78% -4.62% 6.07% -11.82% -7.41% 11.15% 1.59% -4.20% -14.14% 12.05% -1.64% -5.26%
2010 -3.84% -7.15% -5.15% 2.02% -8.77% 0.53% -12.03% 14.59% 16.46% 22.29% -5.36% 25.30% 34.90%
2009 1.60% -0.03% -3.36% -5.51% -1.30% -6.81% -0.53% 10.85% 1.32% -7.86% 10.70% -3.19% -5.90%
2008 21.65% 28.86% -7.96% -8.58% 5.35% 8.51% -18.78% -6.73% 11.58% 45.49% 6.97% 5.30% 108.87%
2007 0.56% -5.18% -8.82% 2.59% 4.70% 4.85% -16.89% -19.40% 3.92% 13.72% -8.59% 8.47% -23.14%
2006 11.09% -2.70% 13.05% 11.46% -4.27% -6.10% -5.20% 1.95% 1.00% -0.13% 0.56% 1.60% 21.94%
2005 -4.28% 0.54% 2.30% -9.28% -4.08% 5.32% 6.62% 2.78% 13.57% -5.64% 15.27% 8.35% 32.34%
2004 4.19% 8.45% 2.37% -11.50% -6.99% -0.73% -0.41% -6.21% 7.76% 0.76% 9.63% -4.94% -0.10%
2003 13.20% 7.22% -12.83% 1.45% 7.64% -7.61% -6.33% 0.07% 6.66% 15.32% -0.27% 5.35% 29.28%
2002 - - -7.52% 1.55% 6.75% 7.38% 5.95% 5.44% 5.13% -7.73% -5.08% 7.80% 19.37%
2001 -9.62% 18.76% 13.46% -15.25% -0.66% 5.39% -1.26% - - - - - 6.69%
2000 -5.02% 2.52% -8.40% -0.27% 6.97% 1.55% -1.25% 12.68% -4.36% 1.96% 9.05% 8.90% 24.51%
1999 -0.29% -0.14% -2.22% 2.13% -4.81% -4.80% 7.01% 4.84% 1.09%
ANALYTICS
NAV per share (USD class) $452.87
NAV per share (EUR class) €184.63
Correlation to S&P 500 (inception to date)* -0.2062
Correlation to Barclays Global Corporate Bond Index* +0.0721
Correlation to BTOP50 Managed Futures Index* +0.6491
Annualised Standard Deviation Margin to Equity (SPAN) – average over last 5 years Margin to Equity (SPAN) – highest ; lowest in last 5 years
32.30% 21.77%
44.73%; 9.46%
Largest Drawdown -45.03%
Best Month 45.49%
Worst Month -19.40%
Percentage Up Months 54.66%
Program Assets (USD million) $187
Fund Assets (USD million ) $49
The monthly performance between May 1999 and July 2001 represents a managed account. Between August 2001 and February 2002 there were no AUM due to the
migration of the program to a new investment vehicle, the Mulvaney Global Markets Fund Ltd. Monthly performance from March 2002 is that of the US$ class of the Fund.
Past performance is not indicative of future results.
The Mulvaney Global Markets Fund, Ltd. Management fee 2% per annum
Performance fee 20% (subject to a high water mark)
Min. investment 100,000 USD; 100,000 EUR
Liquidity Monthly (Five day redemption notice period)
Investment Adviser Mulvaney Capital Management Limited
Fund Structure Limited liability company
Domicile Bermuda
Listing Irish Stock Exchange
Fund administrator GlobeOp Financial Services LLC
Clearing broker Morgan Stanley & Co, Incorporated
Auditor Grant Thornton
Custodian State Street Bank and Trust Company
Bloomberg MULVGMU ($); MULVGME (€)
ISIN BMG635931006 ($); BMG635931261 (€)
SEDOL B0334T2 ($); B0334R0 (€)
* Please refer to note 2 in the Important Information at the end of the presentation.
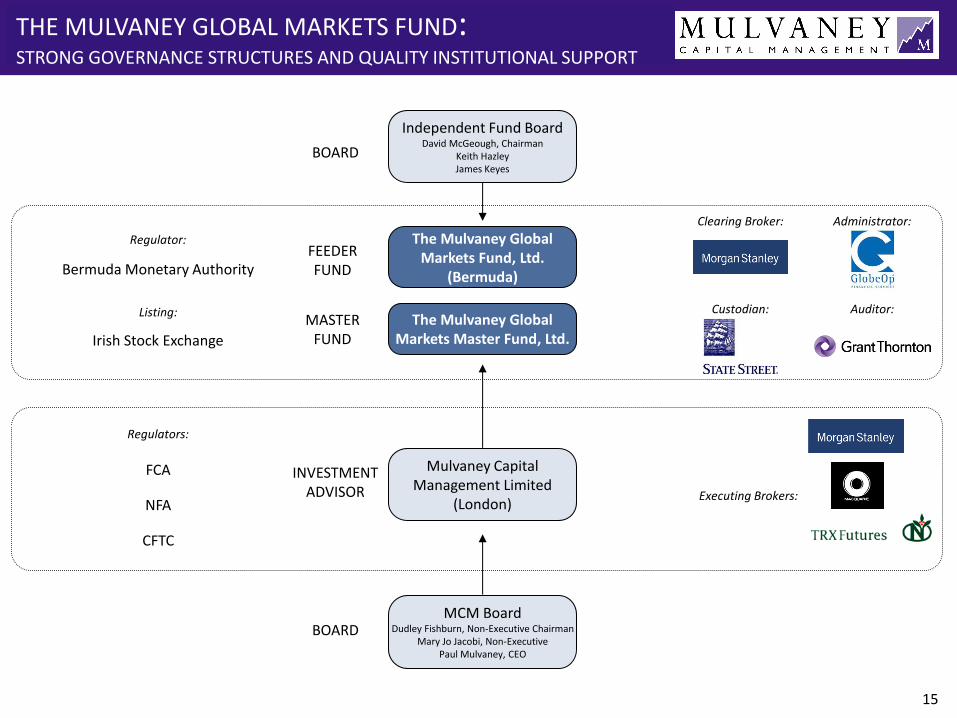
Independent Fund Board David McGeough, Chairman
Keith Hazley James Keyes
The Mulvaney Global Markets Fund, Ltd.
(Bermuda)
Mulvaney Capital Management Limited
(London)
BOARD
FEEDER FUND
INVESTMENT ADVISOR
MCM Board Dudley Fishburn, Non-Executive Chairman
Mary Jo Jacobi, Non-Executive Paul Mulvaney, CEO
BOARD
Clearing Broker:
Custodian:
Administrator:
Auditor:
Executing Brokers:
Regulator:
Regulators:
Irish Stock Exchange
FCA
Bermuda Monetary Authority
NFA
CFTC
Listing:
THE MULVANEY GLOBAL MARKETS FUND: STRONG GOVERNANCE STRUCTURES AND QUALITY INSTITUTIONAL SUPPORT
15
The Mulvaney Global Markets Master Fund, Ltd.
MASTER FUND
16 16
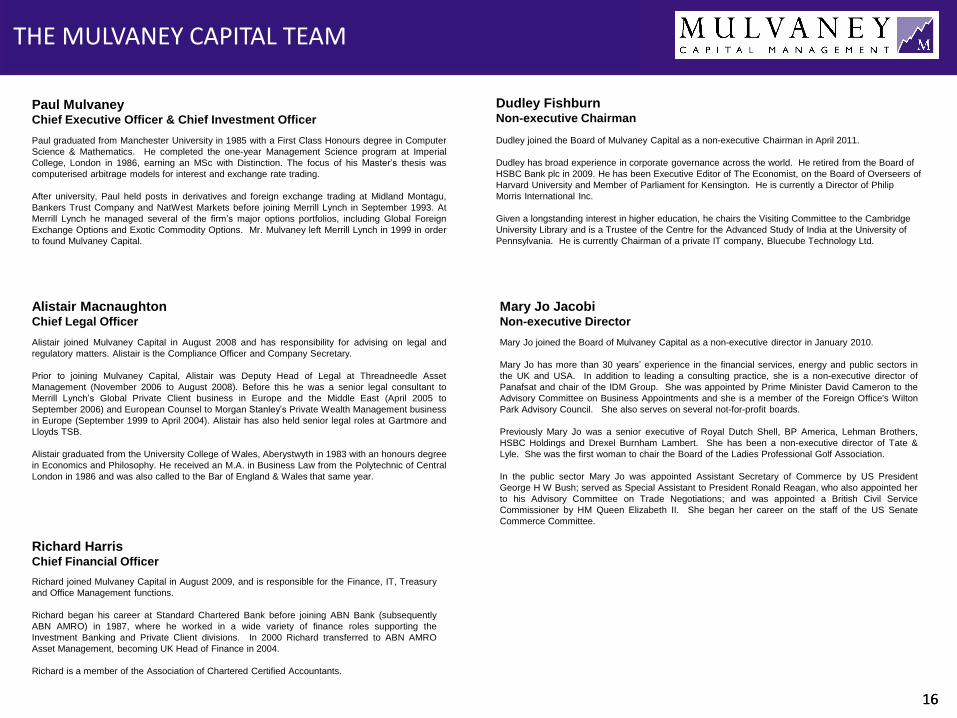
Paul graduated from Manchester University in 1985 with a First Class Honours degree in Computer
Science & Mathematics. He completed the one-year Management Science program at Imperial
College, London in 1986, earning an MSc with Distinction. The focus of his Master’s thesis was
computerised arbitrage models for interest and exchange rate trading.
After university, Paul held posts in derivatives and foreign exchange trading at Midland Montagu,
Bankers Trust Company and NatWest Markets before joining Merrill Lynch in September 1993. At
Merrill Lynch he managed several of the firm’s major options portfolios, including Global Foreign
Exchange Options and Exotic Commodity Options. Mr. Mulvaney left Merrill Lynch in 1999 in order
to found Mulvaney Capital.
Alistair joined Mulvaney Capital in August 2008 and has responsibility for advising on legal and
regulatory matters. Alistair is the Compliance Officer and Company Secretary.
Prior to joining Mulvaney Capital, Alistair was Deputy Head of Legal at Threadneedle Asset
Management (November 2006 to August 2008). Before this he was a senior legal consultant to
Merrill Lynch’s Global Private Client business in Europe and the Middle East (April 2005 to
September 2006) and European Counsel to Morgan Stanley’s Private Wealth Management business
in Europe (September 1999 to April 2004). Alistair has also held senior legal roles at Gartmore and
Lloyds TSB.
Alistair graduated from the University College of Wales, Aberystwyth in 1983 with an honours degree
in Economics and Philosophy. He received an M.A. in Business Law from the Polytechnic of Central
London in 1986 and was also called to the Bar of England & Wales that same year.
Paul Mulvaney Chief Executive Officer & Chief Investment Officer
Alistair Macnaughton Chief Legal Officer
Richard joined Mulvaney Capital in August 2009, and is responsible for the Finance, IT, Treasury
and Office Management functions.
Richard began his career at Standard Chartered Bank before joining ABN Bank (subsequently
ABN AMRO) in 1987, where he worked in a wide variety of finance roles supporting the
Investment Banking and Private Client divisions. In 2000 Richard transferred to ABN AMRO
Asset Management, becoming UK Head of Finance in 2004.
Richard is a member of the Association of Chartered Certified Accountants.
Richard Harris Chief Financial Officer
Mary Jo Jacobi Non-executive Director
Mary Jo joined the Board of Mulvaney Capital as a non-executive director in January 2010.
Mary Jo has more than 30 years’ experience in the financial services, energy and public sectors in
the UK and USA. In addition to leading a consulting practice, she is a non-executive director of
Panafsat and chair of the IDM Group. She was appointed by Prime Minister David Cameron to the
Advisory Committee on Business Appointments and she is a member of the Foreign Office's Wilton
Park Advisory Council. She also serves on several not-for-profit boards.
Previously Mary Jo was a senior executive of Royal Dutch Shell, BP America, Lehman Brothers,
HSBC Holdings and Drexel Burnham Lambert. She has been a non-executive director of Tate &
Lyle. She was the first woman to chair the Board of the Ladies Professional Golf Association.
In the public sector Mary Jo was appointed Assistant Secretary of Commerce by US President
George H W Bush; served as Special Assistant to President Ronald Reagan, who also appointed her
to his Advisory Committee on Trade Negotiations; and was appointed a British Civil Service
Commissioner by HM Queen Elizabeth II. She began her career on the staff of the US Senate
Commerce Committee.
THE MULVANEY CAPITAL TEAM
Dudley joined the Board of Mulvaney Capital as a non-executive Chairman in April 2011.
Dudley has broad experience in corporate governance across the world. He retired from the Board of
HSBC Bank plc in 2009. He has been Executive Editor of The Economist, on the Board of Overseers of
Harvard University and Member of Parliament for Kensington. He is currently a Director of Philip
Morris International Inc.
Given a longstanding interest in higher education, he chairs the Visiting Committee to the Cambridge
University Library and is a Trustee of the Centre for the Advanced Study of India at the University of
Pennsylvania. He is currently Chairman of a private IT company, Bluecube Technology Ltd.
Dudley Fishburn Non-executive Chairman
Harnessing volatility to enhance returns
Mulvaney Capital Management Limited
5th Floor, Cannongate House Telephone: +44 20 7429 0600
62-64 Cannon Street Fax: +44 20 7429 0606
London EC4N 6AE Email: [email protected]

18 18
This document is issued by Mulvaney Capital Management Limited (“Mulvaney Capital”) which is authorised and regulated in the United Kingdom by the Financial Conduct Authority
(“FCA”). The Mulvaney Global Markets Fund, Ltd (the “Fund”) is defined as a “Unregulated Collective Investment Scheme” (“UCIS”) and the promotion of a UCIS either within the UK or
from the UK is severely restricted by statute. Consequently, this document is only made available to persons falling within the Financial Services and Markets Act 2000 (Promotion of
Collective Investment Schemes) (Exemptions) Order 2001 and or to persons falling within one of the categories of persons described in COBS 4.12 of the FCA Rules.
Mulvaney Capital is a member of the National Futures Association and registered with the Commodity Futures Trading Commission in the USA.
PURSUANT TO AN EXEMPTION FROM THE COMMODITY FUTURES TRADING COMMISSION IN CONNECTION WITH ACCOUNTS OF QUALIFIED ELIGIBLE PERSONS, THE
BROCHURES AND ACCOUNT DOCUMENTATION ARE NOT REQUIRED TO BE, AND HAVE NOT BEEN, FILED WITH THE COMMISSION. THE COMMODITY FUTURES
TRADING COMMISSION DOES NOT PASS UPON THE MERITS OF PARTICIPATING IN A TRADING PROGRAM OR UPON THE ADEQUACY OR ACCURACY OF COMMODITY
TRADING ADVISOR DISCLOSURE. CONSEQUENTLY THE COMMODITY FUTURES TRADING COMMISSION HAS NOT REVIEWED OR APPROVED THIS TRADING PROGRAM
OR THIS BROCHURE OR ACCOUNT DOCUMENT.
The information in this presentation does not constitute an offer to sell or the solicitation of any offer to buy subscribe for any securities and/or derivatives. Further, the information
provided is not intended to be a recommendation to buy or subscribe for any securities or derivatives.
The information in this presentation is not targeted at the residents of any particular country and it is not intended for distribution to or use by any person in any country or jurisdiction
where such distribution or use would be contrary to local law or regulatory requirements. Prospective investors should seek appropriate investment, legal and or tax advice and inform
themselves as to applicable legal requirements, exchange control regulations and taxes.
All information in this presentation, unless otherwise stated, is sourced from Mulvaney Capital and is subject to updating and may be amended without notice. Mulvaney Capital
Management Limited makes no warranty as to the correctness of performance and index data provided by third party sources.
The information in this presentation is presented in outline form only and is qualified in its entirety by the information included in the current Disclosure Document of Mulvaney Capital
and the offering documents of the Fund which contain important information concerning risk factors and other material aspects of Mulvaney Capital’s trading program and must be read
carefully before any decision to invest is made.
Along with the potential for profit, trading in futures, options, forwards and currencies and the use of leverage can involve substantial risk and may not be suitable for every investor.
There can be no assurance that Mulvaney Capital will achieve profits or avoid incurring substantial losses. Investors should be aware that they may lose more than their entire
investment and be able to bear such loss.
Prospective investors should particularly note that past performance is not necessarily indicative of future results.
For further information and detailed monthly performance analysis, please contact us at [email protected] or visit our website at: www.mulvaneycapital.com.
Notes
1. The statistical data on www.managedfutures.com and www.bloomberg.com is provided by, respectively, Altegris and Bloomberg. However, no part of this presentation contains the
opinion of or analysis by Altegris or Bloomberg or their affiliates, nor any recommendation or endorsement by them as to any firm or investment product. Altegris and Bloomberg do not
make any representation or warranty of, or assume any liability for, the accuracy or completeness of the information in this presentation.
2. The indices, which have been selected by Mulvaney Capital, are provided solely as an indication of the performance of capital markets and managed futures investment strategies in
general. Investors should not consider any index to be a performance benchmark for the Fund, nor should investors conclude that the Fund will or will not be correlated with an index.
The Fund may invest in financial instruments and strategies not included or represented in the index, and the performance and tax consequences of an investment in the securities,
bonds or hedge funds represented by an index and an investment in the Fund may be, and in many cases are likely to be, materially different.
Performance represented by a hedge fund index is subject to a variety of material distortions, and investments in individual hedge funds involve material risks that are not typically
reflected by an index, including the “risk of ruin.” The hedge fund universe from which the components of a hedge fund-based index are selected is based on funds which have
continued to report results for a minimum period of time. This prerequisite for fund selection interjects a significant element of “survivor bias” into the reported levels of an index, as
generally only successful funds will continue to report for the required period. Accordingly, indexation of hedge funds tends to overstate the beneficial aspects of these strategies while
obscuring the attendant risks. Numerous hedge funds have suffered sudden and dramatic losses, and this “risk of ruin” is not reflected in an index combining a large number of self-reporting funds. There can be no assurance that the Fund will not suffer substantial or total losses.
IMPORTANT INFORMATION