Sedimentation and sustainability of western American ... · Sedimentation and sustainability of...
13
Sedimentation and sustainability of western American reservoirs William L. Graf, 1 Ellen Wohl, 2 Tushar Sinha, 3 and John L. Sabo 4 Received 28 October 2009; revised 11 August 2010; accepted 23 August 2010; published 14 December 2010. [1] Reservoirs are sustainable only as long as they offer sufficient water storage space to achieve their design objectives. Life expectancy related to sedimentation is a measure of reservoir sustainability. We used data from the Army Corps of Engineers, U.S. Bureau of Reclamation, and U.S. Geological Survey (Reservoir Sedimentation Survey Information System II (RESIS II)) to explore the sustainability of American reservoirs. Sustainability varied by region, with the longest life expectancies in New England and the Tennessee Valley and the shortest in the interior west. In the Missouri and Colorado River basins, sedimentation and rates of loss of reservoir storage capacity were highly variable in time and space. In the Missouri River Basin, the larger reservoirs had the longest life expectancies, with some exceeding 1000 years, while smaller reservoirs in the basin had the shortest life expectancies. In the Colorado River Basin at the site of Glen Canyon Dam, sediment inflow varied with time, declining by half beginning in 1942 because of hydroclimate and upstream geomorphic changes. Because of these changes, the estimated life expectancy of Lake Powell increased from 300 to 700 years. Future surprise changes in sedimentation delivery and reservoir filling area are expected. Even though large western reservoirs were built within a limited period, their demise will not be synchronous because of varying sedimentation rates. Popular literature has incorrectly emphasized the possibility of rapid, synchronous loss of reservoir storage capacity and underestimated the sustainability of the water control infrastructure. Citation: Graf, W. L., E. Wohl, T. Sinha, and J. L. Sabo (2010), Sedimentation and sustainability of western American reservoirs, Water Resour. Res., 46, W12535, doi:10.1029/2009WR008836. 1. Introduction [2] Reservoirs are sustainable only as long as they offer sufficient water storage space to achieve their design objec- tives. A major threat to reservoir sustainability is sedimen- tation that reduces storage capacity, so that life expectancy related to sedimentation is a measure of reservoir sustain- ability [Morris and Fan, 1998]. In the interior western United States, human use of water resources depends on an exten- sive system of dams and large reservoirs for water storage. John Wesley Powell [Powell, 1878] defined this area of the western United States west of the 100th meridian exclud- ing the moist west coastal areas as the “arid lands” region. The twentieth century popular writer Marc Reisner [Reisner, 1986] dubbed the region the “Cadillac Desert” in recogni- tion of the large investments in its water control infrastruc- ture. The sustainability of these reservoirs has been a concern for water managers and planners from their inception, focusing largely on the continued availability of water during shorter‐ term droughts and longer‐term climate changes. This paper explores an additional threat to sustainability of these west- ern American reservoirs: sedimentation that reduces storage capacity, negatively impacts recreation, changes wildlife hab- itat, and blocks intake works for hydropower generation. [3] The life expectancy of a reservoir is a useful param- eter for assessing its sustainability as a useful component of a water resource system. The rate of sediment infilling directly translates to life expectancy of a reservoir, a mea- sure that can be determined by repeated surveys of the capacity of the reservoir or by assessments of sediment flow- ing into the reservoir from contributing rivers. During the late 20th century two perspectives emerged concerning the sus- tainability of reservoirs. The first perspective was that sedi- mentation was a process entailing at least several hundred years, making reservoirs a sustainable part of the regional water control infrastructure on a human scale. Scientific research on sediment transport in interior western rivers was discontinuous in time and space, but its preliminary results suggested that reservoirs were likely to be viable for several centuries (reviewed by Schmidt and Wilcock [2008]). [4] The second perception, common in literature readily accessible to the public and decision makers, was that the reservoirs of Powell’s arid region and Reisner’s Cadillac Desert were doomed to early senescence by sedimenta- tion, with management problems becoming apparent within 50 years [Reisner, 1986, p. 492], a time period short enough to enter analyses of sustainability. In a prominent case that caused concern, investigators found that in its first 13 years, Lake Mead behind Hoover Dam had lost about 0.4% of its storage capacity, with a resulting life expectancy of about 250 years [Smith et al., 1960]. Also, because most of the 1 Department of Geography, University of South Carolina, Columbia, South Carolina, USA. 2 Department of Geosciences, Colorado State University, Fort Collins, Colorado, USA. 3 Department of Civil, Construction, and Environmental Engineering, North Carolina State University, Raleigh, North Carolina, USA. 4 School of Life Sciences, Arizona State University, Tempe, Arizona, USA. Copyright 2010 by the American Geophysical Union. 0043‐1397/10/2009WR008836 WATER RESOURCES RESEARCH, VOL. 46, W12535, doi:10.1029/2009WR008836, 2010 W12535 1 of 13
Transcript of Sedimentation and sustainability of western American ... · Sedimentation and sustainability of...

Sedimentation and sustainability of western American reservoirs
William L. Graf,1 Ellen Wohl,2 Tushar Sinha,3 and John L. Sabo4
Received 28 October 2009; revised 11 August 2010; accepted 23 August 2010; published 14 December 2010.
[1] Reservoirs are sustainable only as long as they offer sufficient water storage space toachieve their design objectives. Life expectancy related to sedimentation is a measureof reservoir sustainability. We used data from the Army Corps of Engineers, U.S. Bureauof Reclamation, and U.S. Geological Survey (Reservoir Sedimentation Survey InformationSystem II (RESIS II)) to explore the sustainability of American reservoirs. Sustainabilityvaried by region, with the longest life expectancies in New England and the TennesseeValley and the shortest in the interior west. In the Missouri and Colorado River basins,sedimentation and rates of loss of reservoir storage capacity were highly variable intime and space. In the Missouri River Basin, the larger reservoirs had the longest lifeexpectancies, with some exceeding 1000 years, while smaller reservoirs in the basinhad the shortest life expectancies. In the Colorado River Basin at the site of Glen CanyonDam, sediment inflow varied with time, declining by half beginning in 1942 becauseof hydroclimate and upstream geomorphic changes. Because of these changes, theestimated life expectancy of Lake Powell increased from 300 to 700 years. Future surprisechanges in sedimentation delivery and reservoir filling area are expected. Even thoughlarge western reservoirs were built within a limited period, their demise will not besynchronous because of varying sedimentation rates. Popular literature has incorrectlyemphasized the possibility of rapid, synchronous loss of reservoir storage capacityand underestimated the sustainability of the water control infrastructure.
Citation: Graf, W. L., E. Wohl, T. Sinha, and J. L. Sabo (2010), Sedimentation and sustainability of western Americanreservoirs, Water Resour. Res., 46, W12535, doi:10.1029/2009WR008836.
1. Introduction
[2] Reservoirs are sustainable only as long as they offersufficient water storage space to achieve their design objec-tives. A major threat to reservoir sustainability is sedimen-tation that reduces storage capacity, so that life expectancyrelated to sedimentation is a measure of reservoir sustain-ability [Morris and Fan, 1998]. In the interior western UnitedStates, human use of water resources depends on an exten-sive system of dams and large reservoirs for water storage.John Wesley Powell [Powell, 1878] defined this area of thewestern United States west of the 100th meridian exclud-ing the moist west coastal areas as the “arid lands” region.The twentieth century popular writer Marc Reisner [Reisner,1986] dubbed the region the “Cadillac Desert” in recogni-tion of the large investments in its water control infrastruc-ture. The sustainability of these reservoirs has been a concernfor water managers and planners from their inception, focusinglargely on the continued availability of water during shorter‐term droughts and longer‐term climate changes. This paper
explores an additional threat to sustainability of these west-ern American reservoirs: sedimentation that reduces storagecapacity, negatively impacts recreation, changes wildlife hab-itat, and blocks intake works for hydropower generation.[3] The life expectancy of a reservoir is a useful param-
eter for assessing its sustainability as a useful componentof a water resource system. The rate of sediment infillingdirectly translates to life expectancy of a reservoir, a mea-sure that can be determined by repeated surveys of thecapacity of the reservoir or by assessments of sediment flow-ing into the reservoir from contributing rivers. During the late20th century two perspectives emerged concerning the sus-tainability of reservoirs. The first perspective was that sedi-mentation was a process entailing at least several hundredyears, making reservoirs a sustainable part of the regionalwater control infrastructure on a human scale. Scientificresearch on sediment transport in interior western rivers wasdiscontinuous in time and space, but its preliminary resultssuggested that reservoirs were likely to be viable for severalcenturies (reviewed by Schmidt and Wilcock [2008]).[4] The second perception, common in literature readily
accessible to the public and decision makers, was that thereservoirs of Powell’s arid region and Reisner’s CadillacDesert were doomed to early senescence by sedimenta-tion, with management problems becoming apparent within50 years [Reisner, 1986, p. 492], a time period short enoughto enter analyses of sustainability. In a prominent case thatcaused concern, investigators found that in its first 13 years,Lake Mead behind Hoover Dam had lost about 0.4% of itsstorage capacity, with a resulting life expectancy of about250 years [Smith et al., 1960]. Also, because most of the
1Department of Geography, University of South Carolina, Columbia,South Carolina, USA.
2Department of Geosciences, Colorado State University, Fort Collins,Colorado, USA.
3Department of Civil, Construction, and Environmental Engineering,North Carolina State University, Raleigh, North Carolina, USA.
4School of Life Sciences, Arizona State University, Tempe, Arizona,USA.
Copyright 2010 by the American Geophysical Union.0043‐1397/10/2009WR008836
WATER RESOURCES RESEARCH, VOL. 46, W12535, doi:10.1029/2009WR008836, 2010
W12535 1 of 13

very large reservoirs had been constructed during the samerestricted period of the 1950s and 1960s, they might alsohave similar life expectancies and cease to be useful all atabout the same time [Powell, 2009]. The importance of thisperspective was highlighted by some well‐known examplesof sediment‐related loss of reservoir function such as thecomplete filling and subsequent removal of Sweasy Dam onthe Mad River of northern California [Mount, 1995].[5] The resolution of the difference between these two per-
spectives was in the acquisition of additional data, but mea-sures of reservoir sedimentation became increasingly scarce.The number of reservoir sedimentation surveys peaked inthe 1960s and 1970s, and thereafter declined to negligiblenumbers by the 1990s [Ackerman et al., 2009]. At the sametime, federal agencies greatly reduced support for expensivesediment transport studies. When the hydropower industryconducted a survey of privately owned dams and theirreservoirs licensed by the Federal Energy Regulatory Agencyin the late 1990s, it found that only 25% of the respondentsreported concerns about reservoir sedimentation, and only 6%reported continuing surveys [Dixon, 2000, pp. 2–3]. Possiblereasons for the lack of surveys included cost, observed slowrates of sedimentation in some cases, and management time
frames geared to licensing (about every 50 years or less)rather than longer time frames of centuries related to sedi-mentation. However, climatic extremes have potentially sig-nificant implications for sedimentation and reservoir storage.The prospect of warmer, drier climatic conditions for largesections of the interior western United States [Overpeck andUdall, 2010] gives renewed importance to the life expectan-cies of the region’s reservoirs. Also, more data are availablenow than were available to researchers and commentatorsin the mid‐20th century.[6] In this paper we address three questions about sedi-
ment infilling in reservoirs of the United States: (1) Generally,how rapidly are American reservoirs filling with sediment andhow do interior western reservoirs compare with those inother regions in the United States? (2) On the basis of recentinformation and longer records than were previously avail-able, what are reasonable life expectancies specifically forreservoirs in the interior west? (3) What are the temporaland spatial variations in loss of storage capacity in westernreservoirs, and what are the primary drivers of this varia-tion? In addressing question 3 we focused on two primaryexamples from the interior west, the Missouri River andColorado River basins (Figure 1). We examined only large
Figure 1. Map of the Missouri River Basin and Colorado River Basin showing the locations of large damsanalyzed in this paper. GCD indicates Glen Canyon Dam; see Table 1 for serial numbers and correspondingnames with data for the USACE dams in the Missouri River Basin. The larger map extends from longitude89°W on the right to 115°W on the left and from latitude 28°N at the bottom to 49°N at the top.
GRAF ET AL.: SEDIMENTATION AND SUSTAINABILITY W12535W12535
2 of 13

dams and reservoirs because of their centrality in federalpolicy related to regional water resources and ecosystemhealth. In the following paragraphs, we use a newly avail-able database that describes results from repeat sedimentsurveys to address regional rates of sedimentation. To assessgeographic and historical variability of sedimentation ratesin the Missouri and Colorado basins, we explore data col-lected by federal agencies. Finally, we close with a brief dis-cussion of the perceptions of managers and the public aboutthe sustainability of these reservoir‐based water resources.[7] In these discussions we note that there is substantial
uncertainty associated with determinations of sediment trans-port in rivers [Gomez and Church, 1989] and of the volumesof sediment stored in reservoirs. Variation in field conditions,changing geomorphology at measurement sites, instrumen-tation changes, and choices of values for constants in esti-mating equations introduce uncertainty in sediment transportequations. Most sediment transport calculations are estimatesof suspended load which depend on direct sampling in thefield, while bed load is usually estimated rather than mea-sured. Estimates of sediment transport for the same riverand time period under the best conditions vary by more than15% from each other [Topping et al., 2000; Grams andSchmidt, 2005]. Estimation of the amount of sediment storedin reservoirs is the product of complex bathymetry, uncertainknowledge of prereservoir topography, and uncertain esti-mates of the density of the stored sediments.
2. Western American Dams and Reservoirsin a National Context
[8] A recently completed U.S. Geological Survey projecthas produced a revised and updated Reservoir Sedimenta-tion Survey Information System (RESIS II) [Ackerman et al.,2009]. The agency continues to expand the database through
RESSED, a newly activated online database that acceptsinput from users [Gray, 2009]. TheWeb‐accessible RESIS IIdatabase used in this paper contains 6617 sedimentationsurveys at 1823 impoundments and provides a new view,albeit imperfect, of the loss of storage capacity in Ameri-can reservoirs. The data in RESIS II are highly valuable inassessing the sedimentation in individual reservoirs, and use-ful long‐term records are available for some cases. The datahave limited utility for higher‐order analysis or for a fineassessment of their geographic characteristics for at least threereasons. First, investigators conducted reservoir sedimenta-tion surveys unevenly throughout the period of record from1755 to 1993. Themajority of surveys date from 1950 to 1980,with a dramatic decline in surveys after 1980. The represen-tativeness of the data for other periods outside this narrowtemporal window is suspect given known hydroclimate vari-ation. Second, the database grew out of earlier work by theSoil Conservation Service (now the Natural Resource Con-servation Service), an agency that focused on small dams. Asa result, only a few of the reservoirs in the database havestorage capacities of 123 million m3 (100,000 acre‐feet (ac ft))or more. Thus, the data mainly relate to upland cases ratherthan main stem rivers. Finally, the data represent reservoirsdistributed unequally across the nation (Figure 2), with anemphasis on those regions where federal and state agencieswere particularly interested in reservoir sedimentation becauseof soil erosion (as in the Great Plains) or in management ofwetlands (as in Ohio).[9] Although the RESIS II data have significant limita-
tions for general analysis, they do suggest the importance ofthe interior west as a geographic singularity in the distribu-tion of annual rates of loss for storage capacity in reservoirs.A distinct national pattern emerged from the RESIS II for themean annual loss of reservoir capacity through sedimenta-tion when we mapped the values according to the U.S. Geo-
Figure 2. Distribution of reservoirs with sedimentation surveys in the RESIS II data series, shown withcircles sized according to original reservoir capacity and mapped by HUC‐2 units, with water resourceregions broadly defined by large river basins. Data from the U.S. Geological Survey (see Ackermanet al. [2009] for a description of the data and Gray [2009] for a brief discussion).
GRAF ET AL.: SEDIMENTATION AND SUSTAINABILITY W12535W12535
3 of 13

logical Survey’s water resource regions (hydrologic unit codesat the two‐digit level). Five of the six regions or basins withthe highest annual loss of storage capacity are in the interiorwest: dryland portions of the Columbia River, Basin andRange, Lower Colorado River, Missouri River, and RioGrande (Figure 3). This distribution suggests that Reisner[1986] and other popular writers were correct to point outthat reservoir sedimentation is a national‐scale issue that ismost problematic in the Arid Region or Cadillac Desert. Forthe reservoirs in the RESIS II database (a group biasedtoward smaller reservoirs), the average life expectancy inmuch of the interior west was less than 100 years, while insome eastern regions the average life expectancy was morethan 300 years.
3. Spatial Variation
3.1. General Regional Spatial Variation in ReservoirSedimentation
[10] It is likely that life expectancies for reservoirs varyaccording to their locations because there is a common geog-raphy of sediment yield from watersheds. Upstream locationsthat are the outlets of small drainage basins have differentsediment yields than downstream locations that are the out-lets of large river basins. The sediment yield ratio connectsdrainage area with the sediment yield and addresses thesescale‐dependent aspects of the process. The sediment deliv-ery ratio is the ratio between the amount of sediment pro-duced from the surfaces in a basin and the amount yieldedat its outflow point [Neuendorf et al., 2005], and this deliveryratio becomes progressively smaller for increasingly largewatersheds. Generally, with all other factors being equal, thelarger the basin, the greater the internal storage of sediment. Astandard relationship for the United States is
Dr ¼ k Adð Þ�0:125; ð1Þ
where Dr is the sediment delivery ratio, k is a constant, and Adis drainage basin area [American Society of Civil Engineers,1975]. Many more sophisticated expressions of the relation-ship between sediment delivery ratios and other control vari-ables have been established [Springer et al., 2001; Verstraetenet al., 2003; Lu et al., 2005], but contributing drainage arearemains the most important variable. In aggregate, manyevaluations of the constants in equation (1) have confirmedthat the relationship is nonlinear and have shown that theexponent, connected to the rate of change, is different fordifferent regions [Lu et al., 2005].[11] The relationship in equation (1) has important implica-
tions for the geographic variability of reservoir sedimenta-tion because it specifies the influence of scale in sedimentyield, and thus, the sediment delivered to reservoirs at par-ticular locations. The equation, with constants specified byempirical data, indicates that if all other influences are equal,downstream reservoirs receive proportionally less sedimentwith respect to their drainage areas. The larger downstreamreservoirs are therefore likely to have the longest expectedlife spans, a situation observed on the Missouri River. Thisgeneralization does not hold true, however, if all othercontrols are not equal. For example, if major sediment‐producing areas with highly erodible geologic materials arelocated in midbasin areas, reservoirs in midbasin areasreceive larger amounts of sediment and have correspond-ingly shorter life expectancies, a situation observed in theColorado River system. Variability in sediment contributions todownstream reservoirs is likely to result from regional cli-matic change, internal basin changes that result in increasedor decreased storage, floodplain management practices thatresult in erosion or sedimentation along the channel, andchannel engineering works that alter the mobility of sediment.[12] Because sediment delivery ratios decline in the down-
stream direction (with the noted exceptions), it is reasonableto expect that reservoir filling rates and the percentage of totalstorage area lost to sedimentation also decline in the down-
Figure 3. Distribution of mean annual loss of reservoir capacity in the continental United States mappedby HUC‐2 units, water resource regions broadly defined by large river basins. Data from U.S. GeologicalSurvey, Data Series 434, Reservoir Sedimentation Information System II; see Ackerman et al. [2009] for adescription of the data.
GRAF ET AL.: SEDIMENTATION AND SUSTAINABILITY W12535W12535
4 of 13

stream direction. In such a case, reservoir sedimentationvolumes would be negatively related to drainage area andwould be best approximated by a power function because ofthe dimensions involved: filling rates are measured in volume(L3) (they might also be measured as a percent of storagevolume lost through sedimentation), while drainage basinsizes are measured in area (L2), resulting in an allometric orpower function relationship [Church and Mark, 1980] such as
Lr ¼ a Adð Þ�b; ð2Þ
where Lr is an annual rate of reservoir storage loss (or per-cent of total reservoir volume), a is a constant related to thescale of the system and is related to a minimum rate of storageloss (for a hypothetical drainage where Ad = 1), Ad is thedrainage basin area upstream from the reservoir, and b is therelative rate of change between the two variables (any unitsof measure apply to the variables). When Ad and Lr are knownfrom empirical data, standard regression techniques usingthe linear form of equation (2) can assess the strength of thestatistical relationship between Lr and Ad and can estimate aand b:
log Lrð Þ ¼ log að Þ � b log Adð Þ; ð3Þ
with symbols as in equation (2). Additional variables suchas the number of large dams upstream (Du) and a binaryvariable (Tr) to indicate if the reservoir has major tributariesin addition to the main stem river (=1) or not (=0) mightstrengthen the statistical explanation. The linear form for sucha regression analysis might take several forms, including
log Lrð Þ ¼ log að Þ � b1 log Adð Þ þ b2Du þ b3Tr; ð4Þ
where b1…b3 are empirically defined coefficients, and othervariables are as defined in equations (1) and (2). The expectedlife of a reservoir (El) is inversely related to its annual rate ofits storage loss (Lr):
El ¼ 100=Lr: ð5Þ
3.2. Spatial Variation of Sedimentation in the MissouriRiver Basin
[13] Data for rates of sedimentation in reservoirs of theMissouri River system exemplify the influence of scale andlocation through the variable of drainage basin area andprovide empirical definition of the value of the exponent bin equation (2) for a large interior western river basin andits major reservoirs. The Missouri River Basin is a usefulexemplar because it has relatively high quality data on res-ervoir filling for a substantial number of reservoirs of acrossa wide range of reservoir sizes. The U.S. Army Corps ofEngineers (USACE) has constructed 6 main stem reser-voirs and 16 additional reservoirs on tributaries, with accu-rate sediment surveys to define annual rates of storage lossthrough sedimentation for all the reservoirs (Table 1). All ofthe reservoirs are located in the Great Plains and CentralLowland geomorphic provinces. The reservoirs range incapacity from 0.080 to 30.21 km3 (65,000 to 24,500,000 ac ft)and have drainage areas from about 180 to 725,000 km2
(70 to 280,000 mi2). The completion of the major projectsby the 1970s provided the Missouri River Basin with morestorage than in any other major river basin in the country.The Missouri River Basin is rich in sediment transportstudies that have focused on selected reaches or limitedperiods [e.g., Keown et al., 1981; Macek‐Rowland, 2000;
Table 1. USCOE Dams in the Missouri River Basina
Dam Number andReservoir
RiverSubbasin
Drainage AreaUpstreamb
(km2)
Total StorageCapacityc
(km3)YearClosed
Year of LastSedimentation
Survey
Total LostCapacity
(%)
MeanAnnualCapacityLoss (%)
Likely Life(years)
EndDate
1. Gavins Point main stem 723,825 (279,480) 0.6664 (576,036) 1955 2007 21.7 0.4 240 21952. Fort Randall main stem 682,387 (263,480) 7.7742 (6,220,472) 1952 1996 1.27 0.3 346 22983. Big Bend main stem 645,740 (249,330) 2.3446 (1989,011) 1963 1997 9.1 0.3 374 23374. Oahe main stem 630,615 (243,490) 29.1224 (23,615,385) 1958 1989 2.6 0.1 1192 31505. Garrison main stem 468,617 (180,940) 30.2330 (24,513,514) 1953 1988 3.7 0.1 946 28996. Fort Peck main stem 149,502 (57,725) 23.5694 (19,535,714) 1937 2007 5.6 0.1 1250 31877. Perry Kansas 2,893 (1,117) 0.8910 (135,100) 1969 2001 31.8 1.0 100 20698. Tuttle Creek Kansas 24,936 (9,628) 2.6542 (366,017) 1962 2000 5.9 0.2 644 26069 Milford Lake Kansas 9,831 (3,796) 1.3885 (173,098) 1967 1994 27.7 1.0 97 206410. Harlan County Kansas 19,776 (7,636) 1.0046 (51,353) 1952 2000 15.4 0.3 311 226311. Wilson Kansas 181 (70) 0.9421 (42,545) 1964 1995 35.5 1.1 87 205112. Kanopolis Kansas 20,357 (7,860) 0.5517 418,387) 1948 1993 6.9 0.2 652 260013. Clinton Kansas 950 (367) 0.4906 (28,838) 1977 1991 11.9 0.8 118 209514. Pomona Osage 834 (322) 0.3053 (29,376) 1963 1989 24.0 0.9 108 207115. Melvern Osage 904 (349) 0.4477 (25,814) 1972 1985 15.7 1.2 83 205516. Hillsdale Osage 373 (144) 0.1972 (10,840) 1981 1993 17.8 1.5 67 204817. Stockton Osage 3,004 (1,160) 2.0567 (22,659) 1969 1987 39.5 2.2 46 201518. Pomme de Terre Osage 1,582 (611) 0.8005 (11,692) 1961 1974 37.3 2.9 35 199619. Harry S Truman Osage 29,784 (11,500) 6.4283 (251,353) 1979 1992 8.9 0.7 146 212520. Long Branch L. Chariton 282 (109) 0.0802 (3,999) 1978 1988 12.1 1.2 83 206121. Rathbun Chariton 1,422 (549) 0.6807 (23,656) 1969 1999 ND ND 100 206922. Smithville L. Platte 552 (213) 0.3041 (52,240) 1979 1993 9.5 0.7 147 212623. Blue Springs L. Blue 85 (33) 0.0328 (300) 1988 ND ND ND 100 208824. Longview L. Blue 129 (50) 0.0579 (2,044) 1985 ND ND ND 100 2085
aND indicates no data. Serial numbers correspond to locations shown in Figure 1. Data are from U.S. Army Corps of Engineers [1996] and calculationsare by authors.
bValues in parentheses are in square miles.cValues in parentheses are in acre‐feet.
GRAF ET AL.: SEDIMENTATION AND SUSTAINABILITY W12535W12535
5 of 13
Berkas, 1995; Blevins, 2006], but a basin‐wide picture isonly now coming into focus [Meade and Moody, 2010].[14] For the purposes of this analysis, the annual percent
capacity lost to sedimentation was
Lr ¼ 100 Vi=C0ð Þ=TiÞ; ð6Þ
where Lr is the annual rate of storage loss expressed aspercent of the total capacity lost per year, Vi is the mostrecently measured volume of sediment in the reservoir inyear i, C0 is the original storage capacity of the reservoirwhen its dam was closed, and Ti is the number of yearsbetween the closure of the dam and the date of the mostrecent measurement of sediment volume. In our analysis weused data reported by the USACE (K. Stark and D. Pridal,Missouri River sediment, public presentation toMissouri RiverRecovery and Sediment Management Committee, NationalResearch Council, 22 January 2009, Omaha, Nebraska), butwe imposed our own organization of the data and correlationanalysis. In our approach, the volume available for sedimentstorage defined the capacity for each reservoir. The designof the dams determined this volume because if sedimentaccumulations rise to a level that interferes with the outletworks or with hydropower intakes, the dam loses func-tionality. For large structures, the storage capacity did notinclude the flood pool, a volume equal to the maximumvolume behind the dam minus the volume reserved for allother purposes except flood mitigation. For these reasons,some of the USACE reservoir volumes are less than thestorage capacity as indicated in the National Inventory ofDams [U.S. Army Corps of Engineers, 1996]. The calcula-tions relied only on the most recent sediment survey in eachcase, producing a long‐term average.
[15] While researchers, managers, and commentators aregenerally aware of the potentially damaging loss of storagecapacity, the Missouri River Basin data showed that forthat basin reasonable expectations for the useful lives of thebasin’s reservoirs range from ∼100 to ∼1000 years (Figure 4).Although these major dams in the Missouri River Basinwere all constructed in the mid‐20th century, the widelyvariable dates of the end of their useful lives showed thattheir demise will not be likely to be synchronous (applyingequation (5); see last column of Table 1).[16] There was a significant relationship between drainage
area and annual loss of storage space for 21 major USACEreservoirs in the Missouri Basin (Table 2); two dams hadincomplete data. Regression analysis of equations (3) and (4)showed that drainage area alone explained more than halfof the variation in rates of storage loss. With the number ofdams upstream and reservoir tributary data included in theanalysis, it was possible to explain two thirds of the varia-tion in storage loss rate. In larger data sets further expla-nation might be available through additional variables todescribe geologic materials and climatic factors.[17] Generally, small reservoirs had shorter expected lives
than large ones, so that the exponent in equation (2) is neg-ative. In the Missouri River system, the reservoirs with theshortest life expectancies are smaller ones on tributarystreams, particularly in the Kansas and Osage River basins,where they receive runoff from drainage areas with highsediment yields. There are exceptions to this generalization,including the case of Lewis and Clark Lake (a large reser-voir formed by the main stem Gavins Point Dam) whichnow has already lost more than 20% of its storage capacityto sedimentation. The lake is at the downstream end of aseries of six large dams and reservoirs, so that it receiveslittle sediment influx from the Missouri River, but its pri-
Figure 4. Mean annual loss of capacity and life expectancies for 22 major U.S. Army Corps of Engi-neers dams in the Missouri River Basin. Data from U.S. Army Corps of Engineers.
GRAF ET AL.: SEDIMENTATION AND SUSTAINABILITY W12535W12535
6 of 13

mary source of the sediment is the Niobrara River, a directtributary of the lake. Another example is Elephant Buttereservoir on the Rio Grande in New Mexico. Although it ison the main stem river downstream from several other others,it has a very high sedimentation rate because it collects sedi-ment from highly erodible basins drained by the Rio Puercoand Rio Salado [Scurlock, 1998].
4. Temporal Variation
4.1. General Temporal Variation in ReservoirSedimentation
[18] The amount of sediment delivered to reservoirsresponds to controlling factors that change over time as wellas space. The primary controls on temporal change in res-ervoir sedimentation rates include climate, land use or landcover, geologic materials, internal fluvial system operation,and minor influences that may be locally or temporarilyimportant. Climate variation (as opposed to longer‐scale cli-mate change) is especially important in the interior westernUnited States. On the Great Plains, Tucker et al. [2006] dem-onstrated that the episodic timing of erosion and sediment yieldwere caused by climate oscillations between drought andcopious convective rainfall. The 3,650 km2 (1,410 mi2) PariaRiver Basin of southern Utah provides another example,where channels incised during 1883–1940 and then partiallyrefilled 1940–1980. The incision was associated with higherflood peaks and the aggradation, with reduced flood peaks[Hereford, 1986; Graf et al., 1991]. The larger 44,000 km2
(17,000 mi2) Little Colorado River Basin of Arizona andNew Mexico has a similar history [Hereford, 1984].[19] Regardless of other controls such as land use or land
cover and climatic variation, the internal operations of riverbasins cause variability in their delivery of sediment to res-ervoirs at rates that may change rapidly, within a few years[Graf, 1986; Hereford, 2002]. Gradual changes in hydro-climatic controls such as rainfall frequency and intensity maynot produce substantial watershed responses until a majorthreshold of resistance is exceeded. As the resistance thresh-old is surpassed, a rapid response of the erosion and sedimen-tation processes occurs. Because of these complex responsesand threshold‐oriented behaviors, a step function often isthe best description of the rate of sediment yield to a site
[Patton and Schumm, 1975, 1981]. Because of complexi-ties and thresholds of sediment delivery processes, reservoirsediment inputs may have periods of very different rates ofdelivery separated by short periods of rapid change.
4.2. Temporal Variation of Sedimentation in LakePowell on the Colorado River
[20] The Colorado River Basin provides a useful test casefor temporal variation in sedimentation because of its excep-tionally long record of sediment transport describing sedi-ment yields from all of its major subbasins. The earliestcollections of suspended sediment on the Colorado Riverwere in 1892 [Collingwood, 1892] and during the 1900–1904 period [Forbes, 1906] in the Colorado River at Yuma,Arizona. Investigators collected a series of limited samplesfrom the river during the first decade of the 20th century,but the sampling and analysis techniques were not stan-dardized [Howard, 1929]. The U.S. Bureau of Reclamationbegan continuous sampling at Yuma in 1909, and prelimi-nary analysis of the record from 1912 to 1921 inauguratedattempts to understand sediment yields on monthly and yearlytime scales [Rothery, 1923]. Thus, the early investigators ofsediment flows in the Colorado River Basin produced short‐term and inconsistent records.[21] An understanding of the sediment processes in the
river system was important to planners of the Colorado RiverStorage Project because they envisioned a series of largedams in the basin. As a result from the 1920s to the closureof several large dams in the early 1960s, a few gage sitesproduced continuous records of sediment yield at variousplaces in the basin. After the early 1960s, a unified system‐wide picture of the temporal variation of sediment transport(and thus potential reservoir sedimentation) in the ColoradoRiver system became impossible because the sediment flowswere interrupted by unsurveyed reservoirs and water flowswere highly regulated by the dams. Smith et al. [1960] com-piled many of the predam records. In more recent investiga-tions, substantial research has been accomplished on varioussegments and for some periods in the river system, exem-plified by thework of Thompson [1982, 1984a, 1984b],Gramsand Schmidt [2005], and Topping et al. [2000, 2003].[22] One of the most instructive cases in the gaged sedi-
ment transport history of the Colorado River system is the
Table 2. Results of Regression Analysis for Equations (3) and (4) Using Data From the Missouri River Basin
Component Equation (3) Equation (4)
Dependent variable annual capacity loss (%) annual capacity loss (%)Independent variables drainage area (km2) drainage area (km2),
number dams upstream,major reservoir tributaries
(1 or 0)Number of cases 21 21Intercept or coefficient, log a −1.18 0.69Coefficient or exponent, b or b1 −0.74 −1.20Coefficient b2 NAa 0.52Coefficient b3 NA 0.13Correlation coefficient, R 0.74 0.84Coefficient of determination, R2 0.55 0.67F statistic 22.81 14.22Degrees of freedom 1,19 3,17Significance level, p 0.000131 0.000069Standard error of estimate, SEE 0.32 0.27
aNA means not applicable.
GRAF ET AL.: SEDIMENTATION AND SUSTAINABILITY W12535W12535
7 of 13

set of records associated with sediment flows in the UpperColorado River Basin. U.S. Geological Survey sedimentdischarge records for 1926 through 1960 are available fromLee’s Ferry on the Colorado River, a short distance down-stream from the site of Glen Canyon Dam and its reservoir,Lake Powell. Companion records for 1930 through 1959 arealso available for the primary contributing areas upstream:the Green, Colorado, and San Juan rivers. The early datemarked the beginning of coordinated and standardized datacollection, and the ending date marked the closure of largedams upstream.[23] This limited sediment record was the best basin‐wide
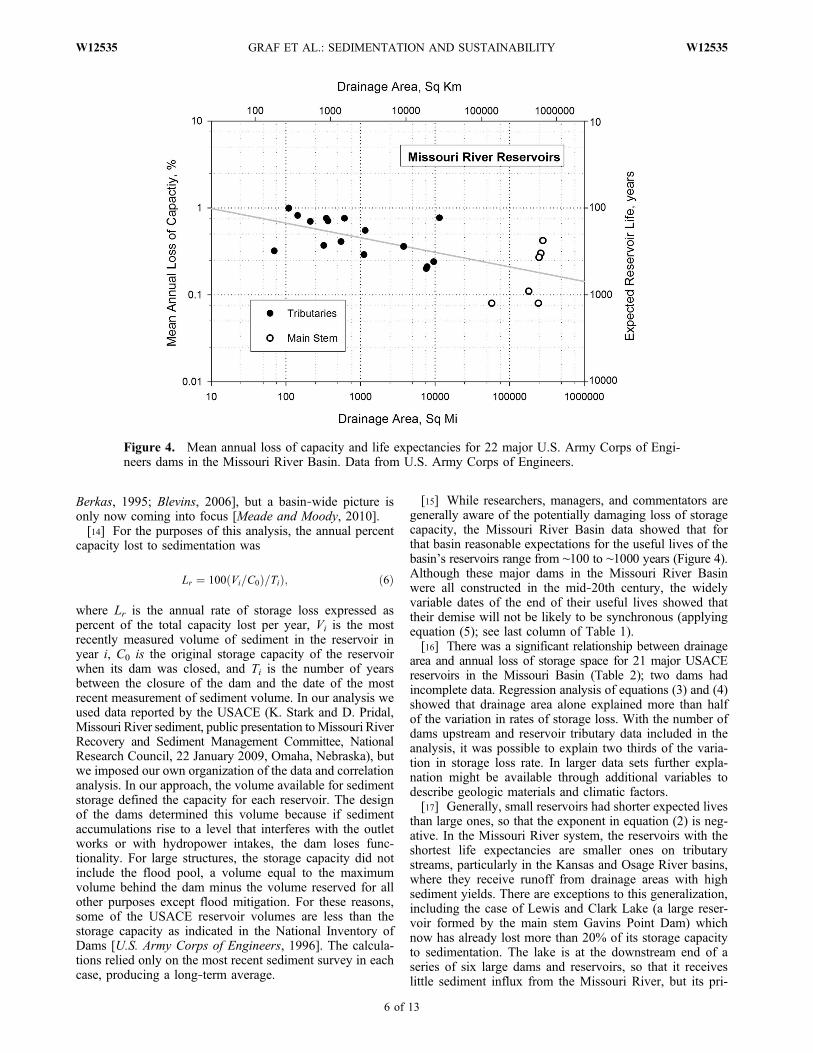
data available to planners in the 1960s, and it remains thebest record of sediment transport in the system without theinfluence of large dams. Data collection sites included Col-orado River at Lee’s Ferry, a short distance downstream fromthe Glen Canyon Dam site, with data collection sites defin-ing the four upstream contributing subbasins, all of roughlysimilar size. Green River at Green River, Colorado River atCisco, and San Juan River at Bluff had direct sediment mea-surements during 1930–1959. Canyonlands, an ungaged Col-orado Plateau region and the remaining upstream “interbasin”area not included in the other three subbasins, was an impor-tant contributor of sediment because of erodible geologicmaterials and a semiarid climate. Its contribution was calcu-lated as the sediment yield measured at Colorado River atLee’s Ferry (the total from the Upper Basin) minus the yieldsfrom the other three subbasins.[24] Published compilations of water and sediment data for
the upper Colorado River Basin include work by Iorns et al.[1965], but an unpublished document stored in the files ofthe U.S. Bureau of Reclamation in Salt Lake City contains ahighly consistent summary of sediment yield data from theupper basin, 1930–1959. In this set of working papers, Oka[1962] collated the sediment yield data that we then analyzedusing a difference of means test and an analysis of variance(Table 3 and Figure 5). The sediment discharge records hadtwo remarkably different periods, 1930–1942 and 1943–1959.Sediment discharge declined by about one half in the recordat Lee’s Ferry, with the largest decline in the contributionof the San Juan River [Graf, 1987]. The difference in sedi-ment discharge annual means and variances between the twoperiods was statistically significant (p values in Table 3) atthe 0.05 level or greater with only one exception, variance of
the Canyonlands values. The decline in the later period ofrecord occurred in all of the subbasins draining to Lee’sFerry and by extension to the site of Lake Powell. About45% of the decline was due to the decline in the San JuanRiver contribution.[25] After compiling a sediment discharge database in the
early 1960s in his unpublished work, Oka [1962] pointedout that predicting the likely time to filling of Lake Powellwith sediment was complicated by the nature of the sedi-ment record at Lee’s Ferry. Between 1926 and 1960, withoutthe effects of large upstream dams, the sediment dischargerecord appeared to have three distinct periods: a high sedi-ment discharge period from 1926 to 1929, an intermediateperiod between 1930 and 1942, and a low sediment dischargeperiod between 1943 and the end of the record in 1960. Okaand his associates at the U.S. Bureau of Reclamation werefaced with making future predictions based on the mean sed-iment discharge from the entire record or predictions basedonly on one or two periods in the record. They proposed twohypotheses as explanations for the fragmented record: changesin collecting the data and changes in upstream land use.[26] Changes in sampling equipment and procedures for
determining sediment concentrations in the Colorado Riverconstituted a potentially reasonable explanation of the threedistinct periods of sediment yield from the basin. Earlyinvestigators had used a variety of sediment samplers, includ-ing bottles and tubes that captured river water as it flowedthrough the length of the device [Fortier and Blaney, 1928].By 1926 the U.S. Geological Survey standardized its equip-ment, settling on a design by Carl H. Au, a hydraulic engi-neer. The Au Sampler trapped water and sediment in a pintbottle when it was lowered into the water, and a movableknife punctured its paper cap (Figure 6, top left) [Howard,1929, p. 18]. Data for calculating sediment concentrationscame from three separate samples: one collected at the bot-tom of the stream with the sampler on the bed, a secondsample collected by drawing the open bottle from the bed tothe surface, and a third sample taking water only from nearthe surface. In 1930, the Colorado River Sampler entereduse: a stopper attached to a control line replaced the papercap and knife, and samples were collected by taking in waterthroughout the water column (Figure 6, top right) [Howard,1947, p 4]. In 1940, the U.S. Geological Survey began col-lecting sediment samples from the Colorado River using a
Table 3. Statistical Comparisons of Two Periods of Record for Mean Annual Sediment Discharge at Gage Stations Defining the MajorSubbasins of the Colorado River Above Lee’s Ferry and the Site of Glen Canyon Dam With Lake Powella
StatisticColorado River at
Lee’s Ferry, ArizonaGreen River at
Green River, UtahColorado River NearCisco, Colorado
San Juan River atBluff, Utah Canyon‐lands, Utah
Mean, 1930–1942b (Mg/yr) 118,701 (130,846) 22,294 (24,575) 17482 (19,271) 42063 (46,366) 36,863 (40,634)Mean, 1943–1959b (Mg/yr) 62,660 (69,071) 15,005 (16,540) 8,998 (9,919) 16,796 (18,514) 24,054 (26,515)t value mean 3.425 2.064 3.206 3.781 1.790Degrees of freedom 29 28 28 28 28p mean 0.002 0.048 0.003 0.001 0.084Standard deviation,
1930–1942b (Mg/yr)60,093 (66,241) 12,291 (13,548) 9,518 (10,492) 25,268 (27,853) 26,243 (28,928)
Standard deviation,1943–1960b (Mg/yr)
29,967 (33,033) 6,890 (7,595) 4,728 (5,212) 9,838 (10,844) 11,977 (13,202)
F ratio variances 4.021 3.182 4.053 6.597 4.801p variances 0.009 0.033 0.011 0.001 0.004
aAll the subbasins have the same periods of record except for Colorado River at Lee’s Ferry, Arizona, which has a second period extending to 1960. SeeFigure 5. Data are from Oka [1962], and calculations are by authors.
bValues in parentheses are in 106 t/yr.
GRAF ET AL.: SEDIMENTATION AND SUSTAINABILITY W12535W12535
8 of 13
completely different design, the D‐43 Sampler that was oper-ated in a depth‐integrating fashion (Figure 6, bottom) [Edwardsand Glysson, 1982, pp. 6–7].[27] Equipment and procedural changes were tempting
explanations for the changes in the sediment discharge recordsbecause the dates of equipment and/or methods changeswere close in time to the major changes in the record. Forthe early adjustment in the record, about 1930, the samplersseem highly similar, but the change in methods to a depth‐integrating approach may explain the change to lower sed-
iment discharges. In early years, taking a sample partly fromthe bottom of the channel may have included large amountsof saltating sediment near the bed that produced higherestimated concentrations. Although the D‐43 sampler has aradically different appearance from its predecessors, sub-sequent paired, controlled evaluations showed no significantdifferences in results [Oka, 1962, p. 5]. Later, Gellis et al.[1991] explained the 1943 decline as a function of geomor-phic and hydrologic factors rather than as an artifact of sam-pling. Thus, equipment and its use could explain the 1930
Figure 5. Sediment yield record on the Colorado River at Lee’s Ferry that was the basis for predictingthe expected useful life of Glen Canyon Dam and Lake Powell. Vertical bars show suspended sedimentdischarge, and horizontal bars represent mean values for each of three time periods: 1926–1929 (ColoradoRiver at Lee’s Ferry only), 1930–1942, and 1943–1960. Records terminated when dam closures affectedsediment discharges on major rivers upstream. Note the various scales for the y axes. For statistical anal-ysis, see Table 3. Plots are based on U.S. Bureau of Reclamation data compiled by Oka [1962].
GRAF ET AL.: SEDIMENTATION AND SUSTAINABILITY W12535W12535
9 of 13

decline in sediment discharge at the gage at Lee’s Ferry butnot the major change about 1943.[28] During the 1930s the federal government instituted
sweeping changes in the management of grazing on westernlands, including those in the Colorado River Basin, perhapsproviding some explanation for changes in sediment trans-port in the basin. The Tailor Grazing Act of 1934 and thecreation of the Bureau of Land Management in 1947 brought
about reductions in numbers of grazing animals in manybasins, including in the Colorado River Basin. However,these dates were not coincidental with changes in sedimentdischarges in the river, and land use changes were gradualwhile changes in the sediment discharge record were abrupt[Oka, 1962, p. 5].[29] Subsequent research has shown that the sharp decline
in about 1942–1943 in the sediment discharge record ofthe Colorado River corresponds to the time when tributaryprocesses changed from erosion to deposition [e.g.,Hereford,1984; Graf, 1987; Gellis et al., 1991]. Sediment eroded fromupstream subbasins fueled the high sediment dischargesobserved prior to about 1943, but after that date many trib-utary streams began storing large amounts of sediment,building up their floodplains and filling their arroyo‐boundchannels, a common process in river systems [Schumm, 2005].As shown in Figure 5, the post‐1940 decline was accompaniedby a similar decline in year‐to‐year variability, generally pro-portional to mean values in these data. There was remarkableconsistency in sediment yield records from one subbasin toanother: each one experienced declines in sediment yieldafter the early 1940s of 30%–50%. This widespread phe-nomenon suggests a large‐scale driver such as climatic vari-ation that affected the entire Upper Colorado River Basin.[30] Although the exact climatic explanation for this pro-
cess reversal in subbasins from generally erosive to gener-ally depositional is not entirely clear, it apparently is partlyrelated to changes in storm frequency and major atmosphericcirculation patterns that drive the system, particularly sincethose changes occurred abruptly in the early 1940s [Reitan,1979; Zishka and Smith, 1980]. Schumm [1998] reviewedthis and other combinations of explanations for temporalvariation of Upper Basin sediment yield as an exploration ofthe application of scientific methods in earth and water sci-ence. He pointed out that after several decades of research,no one single explanation is satisfactory. Our conclusionssupported his perspective. It seemed logical that land usechanges to improve management of grazing may have aidedthe long‐term reduction of sediment yield, but the storage ofsediment within tributary watersheds triggered by climaticchanges was a primary explanation of the lower sedimentyields in the post‐1943 record.
5. Discussion and Conclusions
[31] Dealing with the sustainability of large reservoirs asmeasured by the length of their expected lifetimes is a dif-ficult point of communication between scientists and pop-ular writers who influence decision makers. Some popularwriters have suggested that reservoirs in the Arid Regionor Cadillac Desert would meet swift demises as a result ofsedimentation. These authors used comments by researchersthat (by one interpretation) cast doubt on the multicenturyviability of the reservoirs. For example, Reisner [1986,p. 492] quoted Robert Strand, a U.S. Bureau of Reclamationresearcher and administrator, as saying that the “payoutlifetime” of the largest reservoirs was 50–100 years, afterwhich sedimentation would begin to reduce financial returnsfrom the structures. Popular writers changed this concept,however, so that Palmer [1986, p. 230] wrote that LakePowell was likely to “fill up with sediment in a hundredyears.” Also, Reisner [1986] expressed concern that becausemany of the large reservoirs of the west were completed
Figure 6. Sediment samplers used by the U.S. GeologicalSurvey for the Colorado River during the period before theclosure of Glen Canyon Dam in 1963.
GRAF ET AL.: SEDIMENTATION AND SUSTAINABILITY W12535W12535
10 of 13

during a 10–20 year period in the mid‐20th century, so (inhis interpretation) many of the large reservoirs wouldencounter the ends of their useful lifetimes at roughly thesame time. Powell [2009, p. 209] opined that many westernreservoirs “are going to silt up within the same time period.”These outcomes would be disastrous for a western Americaneconomic system dependent on large water projects, par-ticularly in view of long‐term population growth in a chang-ing climate.[32] The new data reviewed and analyzed in this paper do
not support these concerns. Eventually, the reservoirs arelikely to fill with sediment, and it is true that interior westernreservoirs are losing capacity more rapidly than in otherregions of the country. However, although some small res-ervoirs are likely to fill in the next century, most large res-ervoirs have life expectancies of 200–1000 years or more,and they appear to be sustainable parts of a regional watermanagement system. Without further dam and reservoirconstruction, however, it is also clear that managers will befaced with a gradual long‐term decline in total storagecapacity, a metric of sustainability that has already passed itsmaximum (Figure 7). A very few reservoirs, such as Lewisand Clark Lake associated with Gavins Point Dam on theMissouri River, appear likely to become problem cases withina few decades. Our analysis showed that the rate of filling orcapacity loss varied spatially, with the most long‐lived res-ervoirs being those lowest in the basin, with some notableexceptions such as the Colorado River and Rio Grande. Therate of sedimentation and loss of capacity also varied withtime, depending on controls that were partly external andpartly internal to the drainage basins. Temporal changes haveoccurred abruptly, within a few years.[33] In summary, the message that science should be send-
ing to popular writers and managers is that the data indicate
that sustainability related to sedimentation is soon to be aproblem for a readily identifiable subset of reservoirs thatincludes Gavins Point Dam on the Missouri River. Themessage should also be that for reservoirs in the interiorwestern United States in general the end is not near, andwhen the end does arrive, it will not be at the same timethroughout the region. Monitoring of sediment transport andreservoir sedimentation should continue because watershedprocesses may reverse themselves and change rates of res-ervoir sedimentation downstream, with the exact timingturning out to be a surprise. Surprises particularly may be instore for sedimentation rate in Lake Powell, since suddenchanges in sediment yield have occurred there in the periodof record. The rate might double if the present period ofstorage along streams in its subbasins ends in another pro-cess reversal with a period of renewed rapid erosion andhigh sediment yields similar to the 1930–1942 period.Whether or not similar reversals occur in the Missouri RiverBasin and streams on the Great Plains is little studied, but itseems reasonable to expect similar surprises there as well.
[34] Acknowledgments. John Sabo (School of Life Sciences, ArizonaState University) originated the idea of assessing Marc Reisner’s generali-zations concerning water resources in the Cadillac Desert. A workshopfunded by the National Science Foundation (grant EF‐0553768) and hostedby the National Center for Ecological Analysis and Synthesis initiated theresearch supporting this paper. We also appreciate support from the State ofCalifornia, University of California, Santa Barbara, and the Global Instituteof Sustainability at Arizona State University. Robert Webb (U.S. GeologicalSurvey, Tucson, Arizona) and Stanley W. Trimble (Department of Geogra-phy, University of California, Los Angeles) provided important insightsinto the data and theory concerning sediment yields, reservoir, and sedi-mentation. Tushar Sinha (Department of Civil, Construction, and Environ-mental Engineering, North Carolina State University) masterfully managedthe GIS data for this project, with the support of a postdoctoral fellowshipfunded by the School of Life Sciences, Global Instituted of Sustainability,
Figure 7. Total reservoir storage capacity in the 21 largest dams of the Missouri River Basin calculatedfor each year from 1937 to 3159 under the following assumptions: no new dams will be built, presentlyknown average rates of filling will continue, and there will be no efforts to flush sediments through oraround existing structures. Year of maximum storage was 1979. The first reservoir, created by Fort PeckDam, was the first large one in the system, and it will likely also be the last. Data are from U.S. ArmyCorps of Engineers, summarized in Table 1.
GRAF ET AL.: SEDIMENTATION AND SUSTAINABILITY W12535W12535
11 of 13

Decision Center for a Desert City, and the Office of Vice‐Provost forResearch and Economic Affairs at Arizona State University. John Gray(U.S. Geological Survey) helped us obtain valuable data and assisted uswith the RESIS II database. We thank Jack Schmidt (Utah State University)for his extensive and helpful review. We also thank Kimberly Meitzen(University of South Carolina) and other anonymous reviewers for theirthoughtful suggestions.
ReferencesAckerman, K. V., D. M. Mixon, E. T. Sundquist, R. F. Stallard, G. E.
Schwarz, and D. W. Stewart (2009), RESIS—An updated version ofthe original Reservoir Sedimentation Survey Information System (RESIS)database, U.S. Geol. Surv. Data Ser., 434. (Available at http://pubs.usgs.gov/ds/ds434)
American Society of Civil Engineers (1975), Sedimentation engineering,Manuals Rep. Eng. Practice 54, New York.
Berkas, W. R. (1995), Transport and sources of sediment in the MissouriRiver between Garrison Dam and the headwaters of Lake Oahe, NorthDakota, May 1988 through April 1991, U.S. Geol. Surv. Water Resour.Invest. Rep., 95‐4087, 26 pp.
Blevins, D. W. (2006), The response of suspended sediment, turbidity, andvelocity to historical alterations of the Missouri River, U.S. Geol. Surv.Circ., 1301.
Church, M., and D. M. Mark (1980), On size and scale in geomorphology,Prog. Phys. Geogr.4342390, doi:10.1177/030913338000400302.
Collingwood, C. B. (1892), Soil and waters, Ariz. Agric. Exp. Stn. Bull., 6,4–8.
Dixon, D. A. (2000), Scoping study on sedimentation issues at hydroelec-tric projects, Final Rep. TR 114008, Electr. Power Res. Ins., Palo Alto,Calif.
Forbes, R. H. (1906), Irrigating sediments and their effects upon crops,Ariz. Agric. Exp. Stn. Bull., 53, 1–6.
Fortier, S., and H. F. Blaney (1928), Silt in the Colorado River and its rela-tion to irrigation, U.S. Dep. of Agric. Tech. Bull., 67, 1–27.
Gellis, A., R. Hereford, S. A. Schumm, and B. R. Hayes (1991), Channelevolution and hydrologic variations in the Colorado River basin: Factorsinfluencing sediment and salt loads, J. Hydrol., 124, 317–344,doi:10.1016/0022-1694(91)90022-A.
Gomez, B., and M. Church (1989), An assessment of bed load sedimenttransport formulae for gravel bed rivers, Water Resour. Res., 25(6),1161–1186, doi:10.1029/WR025i006p01161.
Graf, W. L. (1986), Fluvial erosion and federal public policy in the Navajonation, Phys. Geogr., 7, 97–115.
Graf, W. L. (1987), Late Holocene sediment storage in canyons of the Col-orado Plateau, Geol. Soc. Am. Bull., 99, 261–271, doi:10.1130/0016-7606(1987)99<261:LHSSIC>2.0.CO;2.
Graf, J. B., R. H. Webb, and R. Hereford (1991), Relation of sedimentload and flood‐plain formation to climatic variability, Paria River drain-age basin, Utah and Arizona, Geol. Soc. Am. Bull., 103, 1405–1415,doi:10.1130/0016-7606(1991)103<1405:ROSLAF>2.3.CO;2.
Grams, J. C., and J. Schmidt (2005), Equilibrium or indeterminant? Wheresediment budgets fail: Sediment mass balance and adjustment of chan-nel form, Green River downstream from Flaming Gorge Dam, Utah andColorado, Geomorphology, 71, 156–181, doi:10.1016/j.geomorph.2004.10.012.
Gray, J. R. (2009), Online interactive U.S. reservoir sedimentation surveydatabase, Eos Trans. AGU, 90(23), 199, doi:10.1029/2009EO230003.
Edwards, T. K., and G. D. Glysson (1982), Field methods for measure-ment of fluvial sediment, U.S. Geol. Surv. Tech. Water Resour. Invest.,Chap. C2, Book 3, 59 pp.
Hereford, R. (1984), Climate and ephemeral‐stream processes: Twentieth‐century geomorphology and alluvial stratigraphy of the Little ColoradoRiver, Arizona, Geol. Soc. Am. Bull., 95, 654–668, doi:10.1130/0016-7606(1984)95<654:CAEPTG>2.0.CO;2.
Hereford, R. (1986), Modern alluvial history of the Paria River drainagebasin, southern Utah, Quat. Res., 25, 293–311, doi:10.1016/0033-5894(86)90003-7.
Hereford, R. (2002), Valley‐fill alluviation during the Little Ice Age(ca. A.D. 1400–1880), Paria River basin and southern Colorado Plateau,United States, Geol. Soc. Am. Bull., 114, 1550–1563, doi:10.1130/0016-7606(2002)114<1550:VFADTL>2.0.CO;2.
Howard, C. S. (1929), Suspended matter in the Colorado River in 1925–1928, U.S. Geol. Surv. Water Supply Pap., 636‐B, 29 pp.
Howard, C. S. (1947), Suspended sediment in the Colorado River 1925–41,U.S. Geol. Surv. Water Supply Pap., 998, 165 pp.
Iorns, W. V., C. H. Hembree, and G. L. Oakland (1965), Water resources ofthe Upper Colorado River basin—Technical report, U.S. Geol. Surv.Prof. Pap., 441.
Keown, M. P., E. A. Dardeau, and E. M. Cousey (1981), Characterizationof the suspended‐sediment regime and bed‐material gradation of theMississippi River Basin, Rep. 1, vol. 1, 494 pp., Potamol. Program,Waterways Exp. Stn., U.S. Army Corps of Eng., Vicksburg, Miss.
Lu, H., C. J. Moran, and M. Sivapalan (2005), A theoretical explanation ofcatchment‐scale sediment delivery, Water Resour. Res., 41, W09415,doi:10.1029/2005WR004018.
Macek‐Rowland, K. M. (2000), Suspended‐sediment loads from majortributaries to the Missouri River between Garrison Dam and Lake Oahe,North Dakota, 1954–98, U.S. Geol. Surv. Water Resour. Invest. Rep.,00‐4072, 24 pp.
Meade, R. H., and J. A. Moody (2010), Causes for the decline of suspended‐sediment discharge in the Mississippi River system, 1949–2007, Hydrol.Processes, 24, 35–49.
Morris, G. L., and J. Fan (1998), Reservoir Sedimentation Handbook:Design, and Management of Dams, Reservoirs, and Watersheds for Sus-tainable Use, McGraw‐Hill, New York.
Mount, J. F. (1995), California Rivers and Streams: The Conflict BetweenFluvial Process and Land Use, 359 pp., Univ. of Calif. Press, Berkeley.
Neuendorf, K. K. E., J. P. Mehl Jr., and J. A. Jackson (2005), Glossary ofGeology, Am. Geol. Inst., Alexandria, Va.
Oka, J. N. (1962), Sedimentation study: Glen Canyon Dam, Colorado RiverStorage Project, 23 pp., U.S. Bur. of Reclam., Salt Lake City, Utah.
Overpeck, J., and B. Udall (2010), Dry times ahead, Science, 328,1642–1643, doi:10.1126/science.1186591.
Palmer, T. (1986), Endangered Rivers and the Conservation Movement,316 pp., Univ. of Calif. Press, Berkeley.
Patton, P. C., and S. A. Schumm (1975), Gully erosion, northwestern Col-orado: A threshold phenomenon, Geology, 3, 88–90, doi:10.1130/0091-7613(1975)3<88:GENCAT>2.0.CO;2.
Patton, P. C., and S. A. Schumm (1981), Ephemeral‐stream processes: Impli-cations for studies of Quaternary valley fills, Quat. Res., 15, 24–43,doi:10.1016/0033-5894(81)90112-5.
Powell, J. W. (1878), Report on the Arid Lands of the United States: With aMore Detailed Account of the Lands of Utah, Geogr. and Geol. Surv. ofthe Rocky Mt., U.S. Gov. Print. Off., Washington, D. C.
Powell, L. (2009), Dead Pool: Lake Powell, Global Warming, and theFuture of Water in the West, Univ. of Calif. Press, Berkeley.
Reisner, M. (1986), Cadillac Desert: The American West and Its Disap-pearing Water, 608 pp., Viking, New York.
Reitan, C. H. (1979), Trends in the frequencies of cyclone activity overNorth America, Mon. Weather Rev., 107, 1684–1688, doi:10.1175/1520-0493(1979)107<1684:TITFOC>2.0.CO;2.
Rothery, S. L. (1923), A river diversion of Colorado River in relation toImperial Valley, Calif, Proc. Am. Soc. Civ. Eng., 49, 677–678.
Schmidt, J. C., and P. R. Wilcock (2008), Metrics for assessing the down-stream effects of dams, Water Resour. Res., 44, W04404, doi:10.1029/2006WR005092.
Schumm, S. A. (1998), To Interpret the Earth: Ten Ways to be Wrong,Cambridge Univ. Press, Cambridge, U. K.
Schumm, S. A. (2005), River Variability and Complexity, 220 pp.,Cambridge Univ. Press, Cambridge, U. K.
Scurlock, D. (1998), From the rio to the sierra: An environmental historyof the middle Rio Grande basin, Rep. RMRS‐GTR‐5, 440 pp., RockyMt. Res. Stn., For. Serv., U.S. Dep. of Agric., Fort Collins, Colo.
Smith, W. O., C. P. Vetter, and G. B. Cummings (1960), Comprehensivesurvey of sedimentation in Lake Mead, 1948–49, U.S. Geol. Surv. Prof.Pap., 295, 254 pp.
Springer, G. S., H. S. Dowdy, and L. S. Eaton (2001), Sediment budgets fortwo mountainous basins affected by a catastrophic storm: Blue RidgeMountains, Virginia, Geomorphology, 37, 135–148, doi:10.1016/S0169-555X(00)00066-0.
Thompson, K. R. (1982), Characteristics of suspended sediment in theSan Juan River near Bluff, U.S. Geol. Surv. Water Resour. Invest. Rep.,82‐4104.
Thompson, K. R. (1984a), Annual suspended‐sediment loads in the GreenRiver at Green River, Utah, 1930–82, U.S. Geol. Surv. Water Resour.Invest. Rep., 84‐4169.
Thompson, K. R. (1984b), Annual suspended‐sediment loads in the Col-orado River near Cisco, U.S. Geol. Surv. Water Resour. Invest. Rep.,85‐4011.
Topping, D. J., D. M. Rubin, and L. E. Vierra Jr. (2000), Colorado River sed-iment transport: 1. Natural sediment supply limitation and the influence of
GRAF ET AL.: SEDIMENTATION AND SUSTAINABILITY W12535W12535
12 of 13

Glen Canyon Dam, Water Resour. Res., 36, 515–542, doi:10.1029/1999WR900285.
Topping, D. J., J. C. Schmidt, and L. E. Vierra Jr. (2003), Discharge of theColorado River at Lees Ferry, Arizona, during the 1884 flood andbetween May 8, 1921, and September 30, 2000: Construction and anal-ysis of a continuous record of instantaneous discharge, U.S. Geol. Surv.Prof. Pap., 1677.
Tucker, G. E., L. Arnold, R. L. Bras, H. Flores, E. Istanbulluoglu, andP. Sólyom (2006), Headwater channel dynamics in semiarid rangelands,Colorado high plains, USA, Geol. Soc. Am. Bull., 118, 959–974,doi:10.1130/B25928.1.
U.S. Army Corps of Engineers (1996), National Inventory of Dams.National water control infrastructure [CD ROM], U.S. Army Corps ofEng., Washington, D. C.
Verstraeten, G., J. Poesen, J. de Vente, and X. Koninckx (2003), Sedimentyield variability in Spain: A quantitative and semiqualitative analysis
using reservoir sedimentation rates, Geomorphology, 50, 327–348,doi:10.1016/S0169-555X(02)00220-9.
Zishka, K. M., and P. J. Smith (1980), The climatology of cyclones and anti-cyclones over North America and surrounding ocean environs for Januaryand July, 1950–77,Mon. Weather Rev. 108, 387–401, doi:10.1175/1520-0493(1980)108<0387:TCOCAA>2.0.CO;2.
W. L. Graf, Department of Geography, University of South Carolina,709 Bull St., Columbia, SC 29208, USA. ([email protected])J. L. Sabo, School of Life Sciences, Arizona State University, Tempe,
AZ 85287‐4501, USA.T. Sinha, Department of Civil, Construction, and Environmental
Engineering, North Carolina State University, Raleigh, NC 27695‐7908,USA.E. Wohl, Department of Geosciences, Colorado State University, Fort
Collins, CO 80523, USA.
GRAF ET AL.: SEDIMENTATION AND SUSTAINABILITY W12535W12535
13 of 13