Section 8.3 Graphing General Rational Functions. Steps to graphing rational functions 1. 1.Find the...
13
Section 8.3 Graphing General Rational Functions
-
Upload
tracy-mcdaniel -
Category
Documents
-
view
225 -
download
1
Transcript of Section 8.3 Graphing General Rational Functions. Steps to graphing rational functions 1. 1.Find the...

Section 8.3 Graphing General Rational
Functions

Steps to graphing rational functionsSteps to graphing rational functions1. Find the y-intercept.
2. Find the x-intercepts.
3. Find vertical asymptote(s).
4. Find horizontal asymptote.
5. Find any holes in the function.
6. Make a T-chart: choose x-values on either side & between all vertical asymptotes.
7. Graph asymptotes, pts., and connect with curves.
8. Check your graph with the calculator.

How to find the intercepts:How to find the intercepts:
y-intercept:
–Set the y-value equal to zero and solve
x-intercept:
–Set the x-value equal to zero and solve

How to find the vertical How to find the vertical asymptotes:asymptotes:
A vertical asymptote is vertical line that the graph can not pass through. Therefore, it is the value of x that the graph can not equal. The vertical asymptote is the restriction of the denominator!
Set the denominator equal to zero and solve
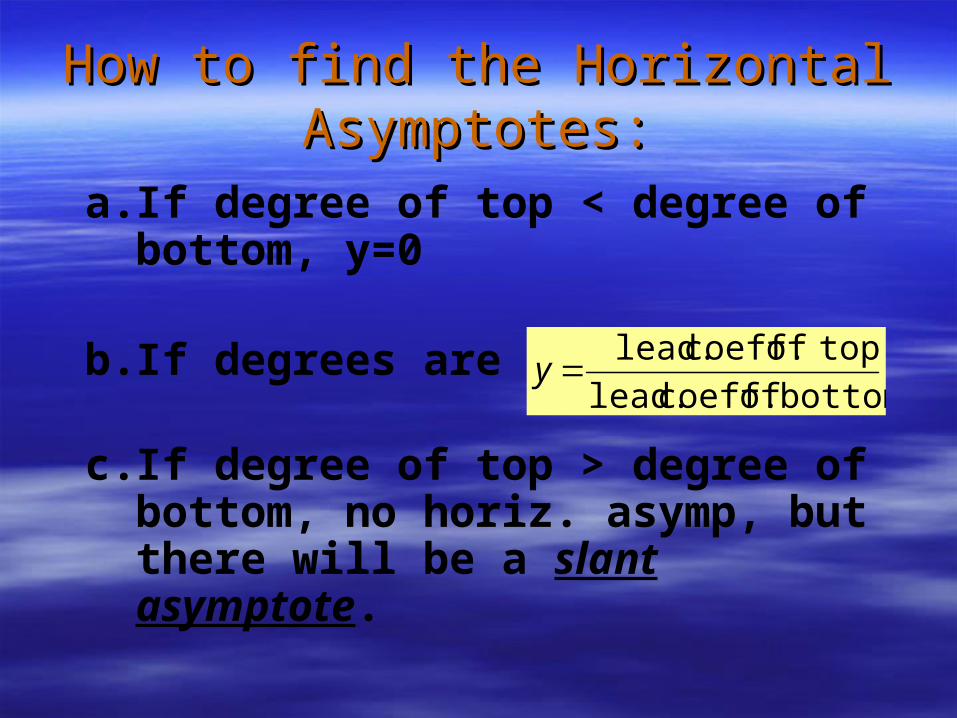
How to find the Horizontal How to find the Horizontal Asymptotes:Asymptotes:
a. If degree of top < degree of bottom, y=0
b. If degrees are =,
c. If degree of top > degree of bottom, no horiz. asymp, but there will be a slant asymptote.
bottom of coeff. lead.
topof coeff. lead.y

How to find the points of How to find the points of discontinuity (holes):discontinuity (holes):
When simplifying the function, if you cancel a polynomial from the numerator and denominator, then you have a hole!
Set the cancelled factor equal to zero and solve.

Steps to graphing rational functionsSteps to graphing rational functions1. Find the y-intercept.
2. Find the x-intercepts.
3. Find vertical asymptote(s).
4. Find horizontal asymptote.
5. Find any holes in the function.
6. Make a T-chart: choose x-values on either side & between all vertical asymptotes.
7. Graph asymptotes, pts., and connect with curves.
8. Check your graph with the calculator.

Ex: Graph. State domain Ex: Graph. State domain & range.& range.
2. x-intercepts: x=0
3. vert. asymp.: x2+1=0
x2= -1
No vert asymp
4. horiz. asymp:
1<2 (deg. top < deg. bottom)
y=0
12 x
xy
1x
6. x y
-2 -.4
-1 -.5
0 0
1 .5
2 .4
(No real solutions.)
2
0 01. y-intercept: y= 0
0 1 1
5. Function doesn’t simplify so NO HOLES!

Domain: all real numbers
Range: 2
1
2
1
y

Ex: Graph then state the Ex: Graph then state the domain and range. domain and range.
2. x-intercepts: 3x2=0x2=0x=0
3. Vert asymp:x2-4=0x2=4x=2 & x=-2
4. Horiz asymp:(degrees are =)y=3/1 or y=3
4
32
2
x
xy
6. x y
4 4
3 5.4
1 -1
0 0
-1 -1
-3 5.4
-4 4
On left of x=-2 asymp.
Between the 2 asymp.
On right of x=2 asymp.
2
2
3(0) 01. y-intercept: y= 0
0 4 4
5. Nothing cancels so NO HOLES!

Domain: all real #’s except -2 & 2
Range: all real #’s except 0<y<3

Ex: Graph, then state the domain & range.Ex: Graph, then state the domain & range.
1. y-intercept: -22. x-intercepts:
x2-3x-4=0(x-4)(x+1)=0
x-4=0 x+1=0 x=4 x=-12. Vert asymp:
x-2=0 x=2
3. Horiz asymp: 2>1 (deg. of top > deg. of bottom)
no horizontal asymptotes, but there is a slant!
2
432
x
xxy
6. x y
-1 0
0 2
1 6
3 -4
4 0
Left of x=2 Left of x=2 asymp.asymp.
Right of Right of x=2 x=2
asymp.asymp.
5. Nothing cancels so no holes.