Second Quarter 2019 Monitoring Report LRI Landfill Graham ...
163
Second Quarter 2019 Monitoring Report LRI Landfill Graham, Washington Pierce County Recycling, Composting & Disposal, LLC dba LRI 17925 Meridian Street East Puyallup, Washington 98375 2405 140 th Avenue NE, Suite 107 Bellevue, WA 98005 425-746-4600 04219001.02 | September 18, 2019
Transcript of Second Quarter 2019 Monitoring Report LRI Landfill Graham ...

Second Quarter 2019 Monitoring Report
LRI Landfill Graham, Washington
Pierce County Recycling, Composting & Disposal, LLC dba LRI 17925 Meridian Street East Puyallup, Washington 98375
2405 140th Avenue NE, Suite 107 Bellevue, WA 98005
425-746-4600
04219001.02 | September 18, 2019

This Quarterly Monitoring Report for the LRI Landfill located in Graham, Washington, was prepared by Sam Graber and Kevin Lakey of SCS Engineers.
September 18, 2019
_________________________________ Kevin Lakey, PE, LHG, Project Director SSCS ENGINEERS
_________________________________ Sam Graber Staff Scientist SCS ENGINEERS

LRI Landfill Second Quarter 2019 Report www.scsengineers.com 1
GROUNDWATER MONITORING Second Quarter 2019 groundwater samples were collected from June 17 through June 19, 2019. Water level elevations were measured on June 18, 2019. Nine monitoring wells (MW-1A, MW-2A, MW-3, MW-4, MW-5A, MW-6, MW-7, MW-9, and MW-10) were sampled this monitoring period. Field quality control samples consisted of one field blank and one duplicate sample collected at MW-5A. Sampling procedures followed the LRI Landfill Groundwater Monitoring Plan (GWMP), dated March 10, 2014.
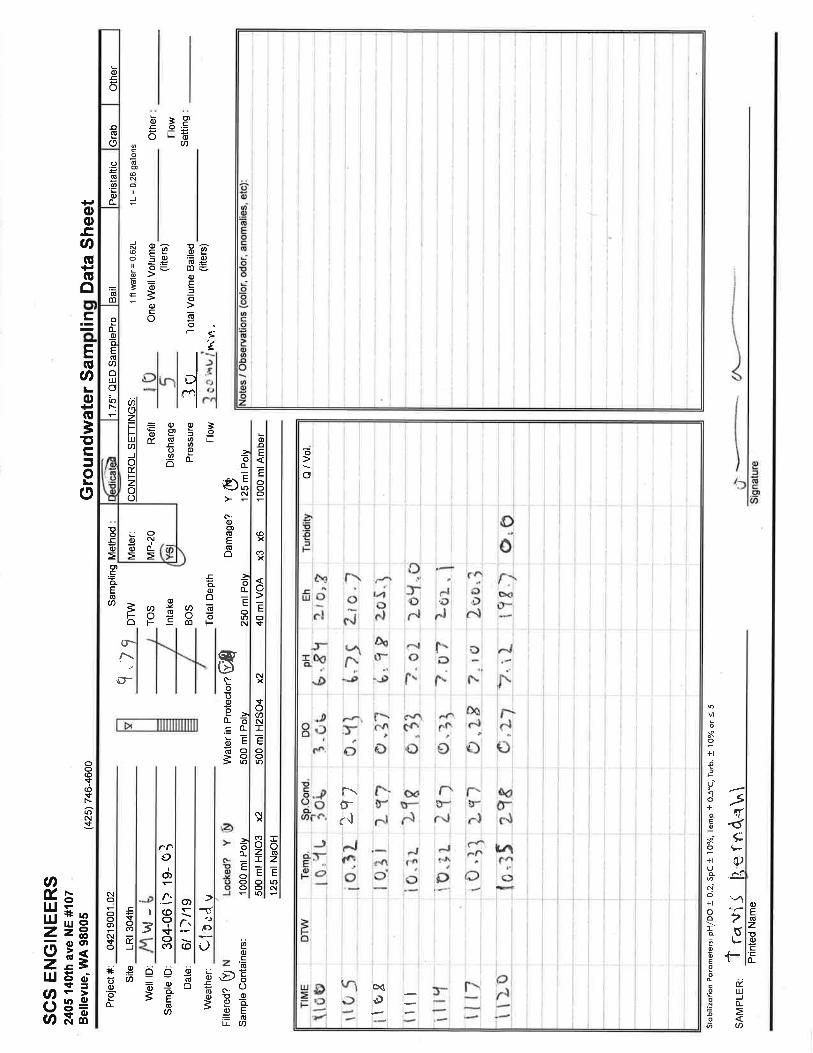
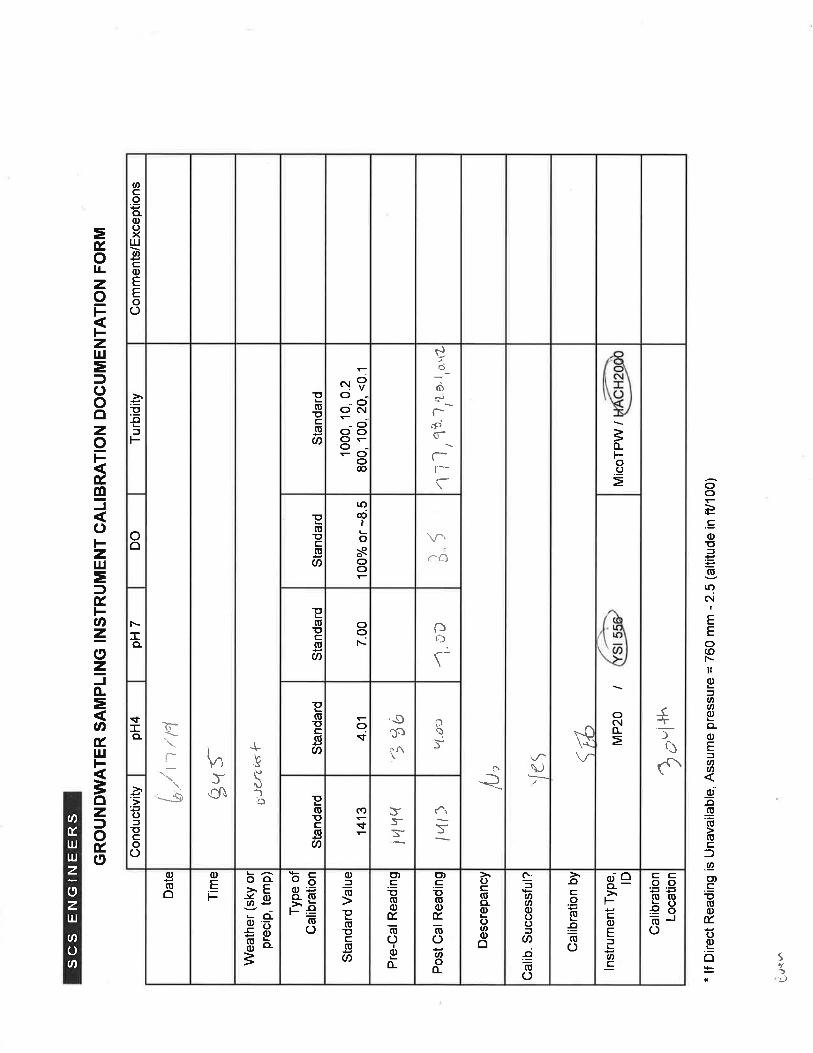
Groundwater samples were obtained using low-flow purging and sampling techniques with dedicated pumps at all monitoring wells with the exception of MW-4, where a non-dedicated QED Sample Pro pump was deployed. Samples for laboratory analyses were submitted to TestAmerica, Inc. of Denver, Colorado for the parameters listed in Appendix I and II of WAC 173-351-990. The groundwater sampling locations are shown on Figure 1.
A groundwater surface elevation map for the Second Quarter monitoring event is included as Figure 1 in Attachment A. The average groundwater gradients and flow directions calculated for the quarter remain similar to those previously reported at the facility, with a flow rate of about 45 feet per year towards the northwest for horizontal groundwater movement within the uppermost aquifer (assuming a horizontal hydraulic conductivity of 1 x 10⁻³ centimeters per second and an effective porosity of 30 percent).
Field measurements and analytical results for groundwater, leak detection/collection system (LDCS), and quality control samples are summarized on the following tables included in Attachment B: Groundwater Level Elevations, Field Parameters, Inorganic Parameters, Appendix I Metals, Appendix II Metals, Volatile Organic Compounds, Cation-Anion Balance, and Duplicate Sample Results.
Copies of the Field Sampling Data Sheets are included in Attachment C. Statistical calculations, including summary tables for indicator parameters, are included in Attachment D. Trilinear (Piper) plots of groundwater and LDCS sample results are included in Attachment E. Data validation results are summarized in Attachment F. Copies of the laboratory reports were submitted to the TPCHD under separate cover.
A nonparametric inter-well prediction limit approach was used to evaluate the water quality results for Appendix I parameters listed in WAC 173-351-990 (15 total metals and nitrate). Prediction limits were generated using background data for nitrate and eight rounds of quarterly sampling conducted in 2014 and 2015 for the fifteen total metals. Using this procedure, the highest concentration of each parameter in the data set was selected as the prediction limit for that parameter. In addition, the prediction limit data set includes ongoing water quality results from background (upgradient) wells MW-9 and MW-10. Appendix I total metal and nitrate concentrations measured at the downgradient monitoring wells were less than or equal to prediction limit values at all of the wells monitored this quarter.

LRI Landfill Second Quarter 2019 Report www.scsengineers.com 2
Groundwater time-trend plots for inorganic parameters and metals are included in Attachment G. The following four plots are provided for each monitoring well:
• Plot 1 ─ ammonia, nitrate, chloride, TOC
• Plot 2 ─ alkalinity, sulfate, TDS
• Plot 3 ─ calcium, magnesium, sodium, potassium
• Plot 4 ─ iron, manganese, zinc, arsenic
Time trend plots show that concentrations of metals and inorganic parameters remained generally consistent with previously measured values during the Second Quarter. The total dissolved solids (TDS) concentration at MW-3 that was previously elevated during the First Quarter monitoring event, decreased to a level consistent with historic trends (220 mg/L).
Reported detections of inorganic parameters and metals measured at downgradient monitoring wells were less than or equal to the groundwater quality criteria listed in WAC 173-200-040, with the exceptions shown in Table 1. The highest concentrations of chloride and nitrate in the uppermost aquifer continue to be observed in background well MW-10.
Table 1. Groundwater Results Greater Than WAC 173-200-040 Criteria
Parameter Groundwater Quality Criteria MW-1A
MW-2A
MW-3
MW-4
MW-5A
MW-6
MW-7
Arsenic, Total 0.00005 ** ** ** 0.0091 0.0055 0.0070 0.0052
Iron, Dissolved 0.30 1.6 0.67 * * * * * Manganese,
Dissolved 0.05 0.27 0.29 0.31 0.24 0.21 0.20 0.25
Notes: Concentrations listed as mg/L = milligrams per liter ** = Not detected above the method reporting limit (MRL), but the MRL exceeded WAC 173-200-040 GW Quality Criteria * = Reported value was less than WAC 173-200-040 Groundwater Quality Criteria
The values listed in Table 1 are typical of previous results (see time-trend plots in Appendix G), are interpreted to be within natural background variation, and in the case of total arsenic, are less than or equal to the background level used to establish the prediction limit (prediction limits are not applicable for dissolved iron and manganese). The method reporting limit (MRL) for arsenic is 0.005 milligrams per liter (mg/L), which is greater than the WAC 173-200-040 criteria of 0.00005 mg/L. Therefore, arsenic results reported as non-detect are considered to be greater than the WAC 173-200-040 criterion.
The measured value for pH at background well MW-9 (6.42 SU) was below the WAC 173-200-040 criteria of 6.5 during the Second Quarter monitoring event. Since MW-9 is a background (upgradient) monitoring well, the low pH value is interpreted to be representative of natural groundwater quality.
Low-level detections of ammonia (<0.25 mg/L) were reported at all downgradient monitoring wells during this monitoring event. Similar low-level ammonia detections have been reported during the previous several quarters, including at background well MW-10 during the Second Quarter 2018

LRI Landfill Second Quarter 2019 Report www.scsengineers.com 3
monitoring event. Therefore, the low-level ammonia concentrations appear to be due to site-wide aquifer chemistry.
The cation-anion balance evaluates the difference in the sum of cations and anions (in milliequivalents per liter [meq/L]) within a water sample to determine if it is electroneutral (balanced cation and anion charges). Consistent with WAC 173-350-430(5), a threshold of ten percent difference is used if the total cation-anion sum is less than 5.0 meq/L, and a threshold of five percent difference is used if the total cation-anion sum is greater than or equal to 5.0 meq/L. Cation-anion balance evaluations were below the appropriate threshold for all of the monitoring wells during this monitoring event.
Graphical plots of the monitoring well water quality results are presented on trilinear (piper) diagrams in Attachment E. These plots demonstrate the inherent water quality differences between groundwater from the monitoring wells, shallow groundwater from the LDCS, and leachate (collected annually in December).
Trichloroethene (TCE) was reported in the sample from MW-4 at a concentration of 0.94 µg/L during the Second Quarter monitoring event. However, TCE was also detected in the Field Blank quality control sample at a concentration of 0.50 µg/L. The field blank sample is collected by pouring lab grade deionized water (provided by TestAmerica) over a water level meter and into the sample containers. Since TCE was detected in the field blank, the concentration reported in MW-4 is likely the result of a laboratory artifact. No other volatile organic compounds (VOCs) were detected in groundwater samples collected from monitoring wells this quarter.
LEAK DETECTION/COLLECTION SYSTEM (LDCS) MONITORING LDCS Daily Monitoring. Daily monitoring of the LDCS sumps for volume of water pumped, liquid level, and specific conductance (conductivity) was performed by using a programmable logic controller (PLC) and through direct measurements by LRI site personnel. Rainfall data were recorded manually using an on-site rain gauge. The combined field and PLC data, as well as time series plots of the data, are included in Attachment H.
Conductivity probes at LDCS-2B and LDCS-6 were recalibrated by LRI staff on May 23, 2019. Following recalibration, recorded conductivity values more closely reflected readings taken in the field. In early June, conductivity values at LDCS-4B displayed an increase, which occurred following a three-day rain event. Since then, conductivity values have decreased to levels more consistent with historic trends. In May, conductivity values at LDCS-5 displayed fluctuations, followed by readings at the upper range limit of the conductivity probe of 996 µS/cm. The conductivity probe at LDCS-5 was re-calibrated on June 7, 2019 to expand the range of recorded values. See below for additional discussion regarding water quality at LDCS-5.
Conductivity data from the remaining LDCS sumps trended within typical historical levels during the Second Quarter of 2019.
LDCS Quarterly Monitoring. LDCS samples were collected from the leak detection sumps with disposable bailers at LDCS-1, LDCS-2A, and LDCS-2B, and with dedicated QED Sleeper Pumps at LDCS-3A, LDCS-4A, LDCS-4B, LDCS-5, and LDCS-6. Samples for laboratory testing were submitted to TestAmerica of Denver, Colorado. Field and laboratory data results are included on the groundwater summary tables in Attachment B.

LRI Landfill Second Quarter 2019 Report www.scsengineers.com 4
LDCS time trend plots for inorganic parameters and dissolved metals are included in Attachment G. The following four plots are provided for each leak detection sump:
• Plot 1 ─ ammonia, nitrate, chloride, TOC
• Plot 2 ─ alkalinity, sulfate, TDS
• Plot 3 ─ calcium, magnesium, sodium, potassium
• Plot 4 ─ iron, manganese, zinc, arsenic
The sample collected from LDCS-2B displayed an elevated concentration of dissolved iron during the Second Quarter monitoring event (1.2 mg/L). However, all leachate indicator parameters were non-detect or remained low. Therefore, the elevated iron concentration does not appear to be the result of leachate.
The sample collected from LDCS-4B displayed an elevated concentration of iron (4.0 mg/L) and slight increases in ammonia (1.0 mg/L), chloride (32 mg/L), and total organic carbon (9.9 mg/L). The primary leachate indicator parameters acetone and 2-butanone were non-detect. However, as a precautionary measure, groundwater from LDCS-4B was directed to the leachate collection system, beginning on July 26, and is not being discharged through the concrete channel. LRI plans to clean the concrete vault as well as the riser pipe and sump using a vactor truck prior to the Third Quarter monitoring event.
The sample collected from LDCS-5 displayed elevated concentrations of secondary leachate indicator parameters ammonia (13.0 mg/L) and chloride (70 mg/L), as well as alkalinity, iron, manganese, sodium, potassium, TDS, and TOC (see summary tables in Attachment B and time trend plots in Attachment G). Although the primary leachate indicator parameters acetone and 2-butanone were not detected, elevated concentrations of the inorganic parameters and metals listed above are indicative of a potential leachate leak. Therefore, LDCS-5 was re-sampled on July 12 and again on August 23, 2019, and an investigation of the leachate forcemain was begun. The results of the July sample were similar to the results of the June sample (secondary leachate indicator parameters were elevated and primary leachate indicator parameters were not detected; see attached summary tables). Results for the August sample are not yet available.
To date, the leachate forcemain has been exposed at four locations. Liquids, with a conductivity range from 920 µS/cm to 4,400 µS/cm, were observed near the concrete vaults located just south of the leachate riser pipes. Therefore, exposure of the leachate force main in this area is planned. Groundwater withdrawn from LDCS-5 continues to be directed to the leachate collection system, as it has been since May, 2016, and is not being discharged through the concrete channel.
No VOC detections were reported present in the LDCS samples this quarter.
Graphical plots of the LDCS water quality results are presented on trilinear (piper) diagrams in Attachment E. These plots demonstrate the inherent water quality differences between groundwater from the monitoring wells, shallow groundwater from the LDCS, and leachate (collected annually in December).
SURFACE WATER MONITORING Surface water monitoring was performed consistent with NPDES Construction Stormwater General Permit WAR 002603C and NPDES Industrial Stormwater General Permit WAR 002557. A surface

LRI Landfill Second Quarter 2019 Report www.scsengineers.com 5
water sample was collected on April 10, 2019 consistent with NPDES Industrial Stormwater General Permit WAR-002557. Surface water Discharge Monitoring Reports (DMR’s) were submitted to Ecology on a monthly (Construction Permit) and quarterly (Industrial Permit) basis. Copies of the Second Quarter DMR’s are included in Attachment I. No benchmark values or effluent limits were exceeded during the second quarter.
LEACHATE MONITORING A leachate sample was collected from Cell 4B during Second Quarter monitoring event. The analytical results from this sample were consistent with previous leachate sampling at the LRI landfill. A full round of leachate sampling will take place during the annual monitoring event in December.
Leachate volumes were monitored using the automated PLC system and through direct measurements by LRI site personnel. Collected leachate was truck-hauled to the pretreatment facility at the Hidden Valley Landfill where it was discharged to the Pierce County sewer system in accordance with Pierce County Utilities Department Industrial Discharge Permit Number PC03096, and to the City of Tacoma and City of Salem Wastewater Treatment Plants for proper disposal. A summary of year to date leachate volume data based on volumes truck-hauled off site is provided on Table 2.
Table 2. 2019 Leachate Volume Data
Month Leachate Trucked Offsite for Proper Disposal (gallons) Monthly Rainfall (inches)
January 2,352,863 2.89 February 2,293,109 3.44
March 2,366,050 1.78 April 2,321,189 1.37 May 2,152,277 1.05 June 2,185,958 1.15 Totals 13,671,446 11.68
Notes: Leachate was trucked off-site for proper disposal. Leachate volumes were determined by trucking records kept on a daily basis.
LANDFILL GAS MONITORING Monthly monitoring of the landfill gas performance probes was conducted on April 25, May 29, and June 12 using a Landtec GEM2000 portable gas monitor. Methane measurements were less than the lower explosive limit (LEL) of five percent by volume during the Second Quarter except at performance probes GP-2, GP-10, GP-10P, and GP-12 (see Table 3). Previous barhole monitoring surveys have shown that similar methane levels at these probes does not result in the migration of landfill gas to the property line.
Indoor air was tested for the presence of methane on June 12. The office, maintenance building, scale house, and work shed located next to the stormwater treatment ponds were tested with a portable flame ionization detector (MicroFID). No detectible methane was recorded.

LRI Landfill Second Quarter 2019 Report www.scsengineers.com 6
Field records for gas probe and indoor air monitoring are included in Attachment J.
Table 3. 2019 Landfill Gas Probe Monitoring Summary (Percent Methane)
Monitoring Date GP-1 GP-2 GP-3 GP-4 GP-9 GP-10 GP-10P GP-11 GP-12 GP-13 GP-14 GP-15
January 18 6.6 18.2 0.0 0.0 0.0 0.1 27.1 0.0 23.1 1.2 0.0 0.0
February 20 6.1 16.9 0.0 0.0 0.0 19.8 14.8 0.3 23.8 1.1 0.0 0.0
March 26 1.8 17.0 0.0 0.0 0.0 1.9 19.6 0.0 26.0 1.3 0.0 0.0
April 25 1.7 16.1 0.0 0.0 0.0 16.1 20.4 0.0 28.6 1.5 0.0 0.0
May 29 1.5 15.9 0.0 0.0 0.0 13.7 23.2 0.0 29.9 0.4 0.0 0.0
June 12 2.4 16.0 0.0 0.0 0.0 23.5 15.4 0.0 29.4 0.0 0.0 0.0
Notes: All values are reported as percent methane by volume. Methane measurements at or above the lower explosive limit of 5.0% by volume are shown in bold.
LANDFILL GAS EXTRACTION WELL CONSTRUCTION No new landfill gas extraction wells were installed during the second quarter.
GROUNDWATER MONITORING WELL CONSTRUCTION AND MAINTENANCE No well construction or significant well maintenance activities were performed this quarter.

LRI Landfill Second Quarter 2019 Report www.scsengineers.com
Appendix A
Groundwater Flow Map

GROUNDWATER ELEVATION (IN FEET ABOVE MSL)
W87-2ACHARACTERIZATION WELL/ PIEZOMETER
INFERRED GROUNDWATER FLOW DIRECTION
MW-1A
MONITORING WELL
LEGEND:
NOTES:
AREA A
WETLAND
WETLAND AREA D
ELEVATION 660.29 NGVD29
PIERCE COUNTY BENCH NO. 112-28,
VERTICAL DATUM - BASED ON
SITE ENTRANCE
WETLAND AREA B
WETLAND AREA C
PIP
E
BR
US
H
GA
TE
GA
TE
W88-7A
(691.71)
(697.56)
(652.46)
MW-5A
MW-3
(607.49)
W90-12A
P95-8a
MW-9
MW-10
(630.07)
MW-1A
(NM)
MW-4
(629.85)
(643.62)
W87-2A
(643.62)
(634.20)
(633.63)
MW-2A
(628.22)
(625.87)
MW-6
MW-7
(632.87)
(684.99)
W87-4A
P90-12a/12b
W88-3M
W88-8A
P88-2a/2b
P88-3a/3b
P90-13a/13b
WS-2
WATER LEVEL ELEVATION NOT USED IN CONTOURING
*
6
1
0
6
1
5
6
2
0
6
2
5
6
3
0
6
3
5
6
4
0
6
9
5
6
9
0
6
8
5
6
8
0
6
7
5
6
7
0
6
6
5
6
6
0
6
5
5
6
5
0
6
4
5
(678.15)
W95-14A
30919 MERIDIAN STREET E.
GRAHAM, WASHINGTON
1
FIGURE
DATE
AUGUST 2019
PROJECT NO.
SCALE
CAD FILE
DES BY
CHK BY
APP BY
JUNE 18, 2019
04219001.02
AS SHOWN
FIGURE 1
SG
KGL
KGL
Environmental Consultants and Contractors
(425) 746-4600 FAX: (425) 746-6747
2405 140th Avenue NE, Suite 107
Bellevue, Washington 98005
LRI LANDFILL
POTENTIOMETRIC SURFACE CONTOUR MAP
AutoCAD SHX Text
663.5
AutoCAD SHX Text
661.7
AutoCAD SHX Text
661.8
AutoCAD SHX Text
661.2
AutoCAD SHX Text
640.9
AutoCAD SHX Text
W.E.
AutoCAD SHX Text
SCALE
AutoCAD SHX Text
STORAGE
AutoCAD SHX Text
SCALE
AutoCAD SHX Text
SCALE
AutoCAD SHX Text
SCALE
AutoCAD SHX Text
SCALE
AutoCAD SHX Text
W.E.
AutoCAD SHX Text
W.E.
AutoCAD SHX Text
W.E.
AutoCAD SHX Text
W.E.
AutoCAD SHX Text
S
AutoCAD SHX Text
TANK
AutoCAD SHX Text
TANKS
AutoCAD SHX Text
STORAGE
AutoCAD SHX Text
W.E.
AutoCAD SHX Text
661.3
AutoCAD SHX Text
W.E.
AutoCAD SHX Text
662.6
AutoCAD SHX Text
W.E.
AutoCAD SHX Text
663.0
AutoCAD SHX Text
W.E.
AutoCAD SHX Text
669.6
AutoCAD SHX Text
W.E.
AutoCAD SHX Text
668.7
AutoCAD SHX Text
STORAGE
AutoCAD SHX Text
S
AutoCAD SHX Text
S
AutoCAD SHX Text
S
AutoCAD SHX Text
S
AutoCAD SHX Text
S
AutoCAD SHX Text
S
AutoCAD SHX Text
S
AutoCAD SHX Text
657.9
AutoCAD SHX Text
W.E.
AutoCAD SHX Text
670
AutoCAD SHX Text
680
AutoCAD SHX Text
680
AutoCAD SHX Text
710
AutoCAD SHX Text
700
AutoCAD SHX Text
690
AutoCAD SHX Text
680
AutoCAD SHX Text
730
AutoCAD SHX Text
720
AutoCAD SHX Text
710
AutoCAD SHX Text
700
AutoCAD SHX Text
690
AutoCAD SHX Text
680
AutoCAD SHX Text
670
AutoCAD SHX Text
660
AutoCAD SHX Text
660
AutoCAD SHX Text
670
AutoCAD SHX Text
680
AutoCAD SHX Text
690
AutoCAD SHX Text
700
AutoCAD SHX Text
710
AutoCAD SHX Text
720
AutoCAD SHX Text
730
AutoCAD SHX Text
740
AutoCAD SHX Text
750
AutoCAD SHX Text
760
AutoCAD SHX Text
770
AutoCAD SHX Text
780
AutoCAD SHX Text
670
AutoCAD SHX Text
660
AutoCAD SHX Text
670
AutoCAD SHX Text
680
AutoCAD SHX Text
690
AutoCAD SHX Text
700
AutoCAD SHX Text
710
AutoCAD SHX Text
720
AutoCAD SHX Text
730
AutoCAD SHX Text
740
AutoCAD SHX Text
750
AutoCAD SHX Text
760
AutoCAD SHX Text
770
AutoCAD SHX Text
780
AutoCAD SHX Text
790
AutoCAD SHX Text
800
AutoCAD SHX Text
680
AutoCAD SHX Text
690
AutoCAD SHX Text
670
AutoCAD SHX Text
680
AutoCAD SHX Text
690
AutoCAD SHX Text
700
AutoCAD SHX Text
710
AutoCAD SHX Text
720
AutoCAD SHX Text
670
AutoCAD SHX Text
680
AutoCAD SHX Text
690
AutoCAD SHX Text
700
AutoCAD SHX Text
710
AutoCAD SHX Text
700
AutoCAD SHX Text
690
AutoCAD SHX Text
680
AutoCAD SHX Text
670
AutoCAD SHX Text
690
AutoCAD SHX Text
680
AutoCAD SHX Text
690
AutoCAD SHX Text
670
AutoCAD SHX Text
670
AutoCAD SHX Text
660
AutoCAD SHX Text
670
AutoCAD SHX Text
680
AutoCAD SHX Text
690
AutoCAD SHX Text
700
AutoCAD SHX Text
710
AutoCAD SHX Text
720
AutoCAD SHX Text
720
AutoCAD SHX Text
710
AutoCAD SHX Text
700
AutoCAD SHX Text
690
AutoCAD SHX Text
680
AutoCAD SHX Text
670
AutoCAD SHX Text
660
AutoCAD SHX Text
670
AutoCAD SHX Text
680
AutoCAD SHX Text
690
AutoCAD SHX Text
700
AutoCAD SHX Text
710
AutoCAD SHX Text
720
AutoCAD SHX Text
730
AutoCAD SHX Text
740
AutoCAD SHX Text
750
AutoCAD SHX Text
760
AutoCAD SHX Text
770
AutoCAD SHX Text
780
AutoCAD SHX Text
790
AutoCAD SHX Text
800
AutoCAD SHX Text
810
AutoCAD SHX Text
820
AutoCAD SHX Text
830
AutoCAD SHX Text
840
AutoCAD SHX Text
810
AutoCAD SHX Text
820
AutoCAD SHX Text
830
AutoCAD SHX Text
840
AutoCAD SHX Text
670
AutoCAD SHX Text
680
AutoCAD SHX Text
690
AutoCAD SHX Text
700
AutoCAD SHX Text
710
AutoCAD SHX Text
720
AutoCAD SHX Text
730
AutoCAD SHX Text
740
AutoCAD SHX Text
750
AutoCAD SHX Text
760
AutoCAD SHX Text
770
AutoCAD SHX Text
780
AutoCAD SHX Text
790
AutoCAD SHX Text
800
AutoCAD SHX Text
810
AutoCAD SHX Text
820
AutoCAD SHX Text
830
AutoCAD SHX Text
840
AutoCAD SHX Text
850
AutoCAD SHX Text
840
AutoCAD SHX Text
830
AutoCAD SHX Text
820
AutoCAD SHX Text
810
AutoCAD SHX Text
800
AutoCAD SHX Text
790
AutoCAD SHX Text
780
AutoCAD SHX Text
770
AutoCAD SHX Text
760
AutoCAD SHX Text
750
AutoCAD SHX Text
740
AutoCAD SHX Text
730
AutoCAD SHX Text
720
AutoCAD SHX Text
710
AutoCAD SHX Text
700
AutoCAD SHX Text
690
AutoCAD SHX Text
680
AutoCAD SHX Text
670
AutoCAD SHX Text
660
AutoCAD SHX Text
650
AutoCAD SHX Text
650
AutoCAD SHX Text
640
AutoCAD SHX Text
640
AutoCAD SHX Text
640
AutoCAD SHX Text
640
AutoCAD SHX Text
780
AutoCAD SHX Text
770
AutoCAD SHX Text
760
AutoCAD SHX Text
750
AutoCAD SHX Text
740
AutoCAD SHX Text
730
AutoCAD SHX Text
720
AutoCAD SHX Text
710
AutoCAD SHX Text
700
AutoCAD SHX Text
690
AutoCAD SHX Text
680
AutoCAD SHX Text
670
AutoCAD SHX Text
660
AutoCAD SHX Text
650
AutoCAD SHX Text
640
AutoCAD SHX Text
660
AutoCAD SHX Text
670
AutoCAD SHX Text
680
AutoCAD SHX Text
690
AutoCAD SHX Text
700
AutoCAD SHX Text
710
AutoCAD SHX Text
720
AutoCAD SHX Text
730
AutoCAD SHX Text
740
AutoCAD SHX Text
750
AutoCAD SHX Text
760
AutoCAD SHX Text
770
AutoCAD SHX Text
780
AutoCAD SHX Text
790
AutoCAD SHX Text
800
AutoCAD SHX Text
810
AutoCAD SHX Text
820
AutoCAD SHX Text
830
AutoCAD SHX Text
650
AutoCAD SHX Text
640
AutoCAD SHX Text
640
AutoCAD SHX Text
640
AutoCAD SHX Text
660
AutoCAD SHX Text
650
AutoCAD SHX Text
660
AutoCAD SHX Text
660
AutoCAD SHX Text
670
AutoCAD SHX Text
660
AutoCAD SHX Text
660
AutoCAD SHX Text
630
AutoCAD SHX Text
630
AutoCAD SHX Text
630
AutoCAD SHX Text
630
AutoCAD SHX Text
640
AutoCAD SHX Text
640
AutoCAD SHX Text
640
AutoCAD SHX Text
640
AutoCAD SHX Text
650
AutoCAD SHX Text
304TH STREET
AutoCAD SHX Text
POND
AutoCAD SHX Text
STORMWATER
AutoCAD SHX Text
TRIBU
AutoCAD SHX Text
TARY
AutoCAD SHX Text
EAST
AutoCAD SHX Text
SOUTH FORK MUCK CREEK
AutoCAD SHX Text
SCALE (ft)
AutoCAD SHX Text
0
AutoCAD SHX Text
400
AutoCAD SHX Text
800


LRI Landfill Second Quarter 2019 Report www.scsengineers.com
Appendix B
Groundwater Data Summary Tables

Table 1. Groundwater Level ElevationsJune 18, 2019
LRI Landfill, Pierce County, Washington
LRILF 2Q 2019 Report Tables_v1.0, T1 Water Levels.xls8/28/2019 SCS ENGINEERS
WellsW87-2A 664.01 20.39 643.62W87-4A 693.29 8.30 684.99W88-3M 658.11 13.34 644.77W88-7A 632.51 NM --W88-8M 721.05 40.42 680.63W90-12A 640.84 33.35 607.49W95-14A 680.49 2.34 678.15MW-1A 652.57 18.37 634.20MW-2A 651.93 18.30 633.63MW-3 637.41 7.34 630.07MW-4 652.37 22.52 629.85
MW-5A 655.55 27.33 628.22MW-6 635.71 9.84 625.87MW-7 656.03 23.16 632.87MW-9 701.77 10.06 691.71
MW-10 673.87 21.41 652.46Piezometers
P13-14A 665.96 22.04 643.92P88-2A 663.96 NM --P88-2B 663.48 NM --P88-3A 656.20 16.03 640.17P88-3B 655.98 18.01 637.97P95-8A 722.07 24.51 697.56
P90-12A 640.79 4.23 636.56P90-12B 640.73 5.75 634.98P90-13A 645.19 NM --P90-13B 643.63 NM --GP-1Pa
652.00 17.10 634.90GP-2Pa
658.61 16.35 642.26GP-3Pa
658.51 11.47 647.04GP-4Pa
662.01 9.76 652.25GP-9Pa
674.03 12.35 661.68South Creek
SWSC-1 632.68 2.34 630.34SWSC-2 629.98 6.35 623.63
Leak Detection SystemLDCS-1b
657.26 26.70 630.56LDCS-2Ab
659.24 29.31 629.93LDCS-2Bb
661.70 26.61 635.09Notes:NM= not measured-- = not applicableMeasurements taken on 6/18/2019 unless otherwise noteda = Measurement taken on 6/12/2019b = Measurement taken on 6/17/2019
Location Well Casing Elevation (ft)
Depth to Water (ft)
Water Level Elevation (ft, NGVD29)

Table 2. Field ParametersSecond Quarter 2019
LRI Landfill, Pierce County, Washington
LRILF 2Q 2019 Report Tables_v1.08/28/2019 SCS ENGINEERS
Location Sample Number
Sample Date
Sampling Method pH Conductivity Temperature
Units (SU) (µS/cm) (°C)WAC 173-200 Criteria 6.5-8.5 700b —Monitoring Wells
MW-1A 304-061819-13 6/18/2019 DP 6.63 173 13.4MW-2A 304-061919-18 6/19/2019 DP 6.69 243 12.9MW-3 304-061719-01 6/17/2019 DP 6.65 344 10.2MW-4 304-061819-14 6/18/2019 SP 7.49 297 13.3
MW-5A 304-061719-05 6/17/2019 DP 7.20 359 12.0MW-6 304-061719-03 6/17/2019 DP 7.12 298 10.4MW-7 304-061719-09 6/17/2019 DP 7.22 379 10.3MW-9 304-061919-19 6/19/2019 DP 6.42 137 10.5
MW-10 304-061719-11 6/17/2019 DP 6.98 258 10.8Leak Detection System
LDCS-1 304-061719-08 6/17/2019 DB 6.35 425 24.5LDCS-2A 304-061719-06 6/17/2019 DB 7.20 776 23.3LDCS-2B 304-061719-04 6/17/2019 DB 7.08 693 21.6LDCS-3A 304-061719-02 6/17/2019 DP 6.45 806 21.8LDCS-4A 304-061719-10 6/17/2019 DP 6.36 938 25.2LDCS-4B 304-061719-12 6/17/2019 DP 6.47 1,095 25.5LDCS-5 304-061819-17 6/18/2019 DP 6.84 1,329 26.3
LDCS-5 (Resample) 304-071219-01 7/12/2019 DP 6.68 1,389 28.3LDCS-6 304-061919-20 6/19/2019 DP 6.98 1,037 20.7
Leachate Collection SystemLeachate, Cell 4B 304-061819-15 6/18/2019 GB 8.04 30,050 23.0
Notes:WAC 173-200 GW Quality Criteria Exceedances are shown in bold.b = Secondary Drinking Water StandardDB = disposable bailerDP = dedicated pumpGB = grab sampleSP = submersible pumpμS/cm = microsiemens per centimeter°C = degrees celcius

Table 3. Inorganic ParametersSecond Quarter 2019
LRI Landfill, Pierce County, Washington
LRILF 2Q 2019 Report Tables_v1.08/28/2019 SCS ENGINEERS
Parameter Alkalinity, Total Ammonia Chloride Nitrate Sulfate
Total Dissolved
Solids
Total Organic Carbon
Total Suspended
SolidsMRL 10 0.1-22 0.2-120 0.5-0.84 0.2-2.5 10-470 1-7.8 4.0
WAC 173-200 Criteria — — 250 10 250 500 — —Prediction Limit — — — 6.4 — — — —
Monitoring Wells MW-1A 92 0.12 2.0 * 3.0 160 B * *MW-2A 120 0.10 3.0 * 5.2 170 * 11MW-3 140 0.15 3.7 * 29 220 * *MW-4 150 0.18 3.0 * 9.6 210 B * *
MW-5A 170 0.17 3.1 * 14 220 * *MW-6 140 0.14 5.4 * 6.9 190 * *MW-7 200 0.24 3.2 * 3.2 220 * *MW-9 68 * 1.6 * 1.8 140 * *MW-10 100 * 8.0 4.7 7.1 200 * *
Leak Detection SystemLDCS-1 200 0.12 4.4 * 6.1 260 2.5 —
LDCS-2A 410 * 4.0 * 21 470 2.5 —LDCS-2B 310 * 4.0 * 58 430 2.4 —LDCS-3A 350 * 4.7 * 75 490 1.6 —LDCS-4A 380 0.15 20 * 56 520 5.0 —LDCS-4B 470 1.0 32 * 60 630 9.9 —LDCS-5 640 13.0 70 * 19 780 28 —
LDCS-5 (Resample) 510 16.0 48 * 20 610 16 —LDCS-6 440 * 8.8 * 160 710 3.7 —
Leachate Collection SystemLeachate, Cell 4B 14000 H B 1,700 3,700 4.9 5.4 18,000 1800 H —
Notes:All sample units are milligrams per liter (mg/L)Groundwater (monitoring well) concentrations greater than prediction limits or WAC 173-200 criteria are shown in boldAnalyses performed by TestAmerica of Denver, ColoradoMethod Reporting Limit (MRL) is typical and may be elevated for some samples* indicates the sample result was not reported at or above the MRL— = not applicable or not performedB = Compound found in the blank and the sampleH = Sample was prepped or analyzed beyond the specified holding timeJ = Result is less than the RL but greater than or equal to the MDL and the concentration is an approximate value

Table 4. WAC 173-351 Appendix I MetalsSecond Quarter 2019
LRI Landfill, Pierce County, Washington
LRILF 2Q 2019 Report Tables_v1.08/28/2019 SCS ENGINEERS
Ant
imon
y-D
Ant
imon
y-T
Ars
enic
-D
Ars
enic
-T
Bariu
m-D
Bariu
m-T
Bery
llium
-D
Bery
llium
-T
Cad
miu
m-D
Cad
miu
m-T
Chr
omiu
m-D
Chr
omiu
m-T
Cob
alt-D
Cob
alt-T
Cop
per-
D
Cop
per-
T
Lead
-D
Lead
-T
Nic
kel-D
Nic
kel-T
Sele
nium
-D
Sele
nium
-T
Silv
er-D
Silv
er-T
Thal
lium
-D
Thal
lium
-T
Vana
dium
-D
Vana
dium
-T
Zinc
-D
Zinc
-T
mg/L mg/L mg/L mg/L mg/L mg/L mg/L mg/L mg/L mg/L mg/L mg/L mg/L mg/L mg/L mg/L mg/L mg/L mg/L mg/L mg/L mg/L mg/L mg/L mg/L mg/L mg/L mg/L mg/L mg/L0.05 0.05 0.005 0.005 0.005 0.005 0.001 0.001 0.001 0.001 0.005 0.005 0.001 0.001 0.01 0.01 0.002 0.002 0.02 0.02 0.005 0.005 0.005 0.005 0.005 0.005 0.005 0.005 0.01 0.01
─ ─ ─ 0.00005 ─ 1.0 ─ ─ ─ 0.01 ─ 0.05 ─ ─ ─ 1.0 ─ 0.05 ─ ─ ─ 0.01 ─ 0.05 ─ ─ ─ ─ ─ 5.0─ 0.05 ─ 0.011 ─ 0.091 ─ 0.005 ─ 0.005 ─ 0.011 ─ 0.01 ─ 0.063 ─ 0.042 ─ 0.020 ─ 0.005 ─ 0.01 ─ 0.005 ─ 0.016 ─ 0.290
MW-1A — * — * — 0.021 — * — * — * — * — * — * — * — * — * — * — * — *MW-2A — * — * — 0.013 — * — * — * — * — * — * — * — * — * — * — * — *MW-3 — * — * — 0.012 — * — * — * — * — * — * — * — * — * — * — * — *MW-4 — * — 0.0091 — 0.016 — * — * — * — * — * — * — * — * — * — * — * — 0.026MW-5A — * — 0.0055 — 0.012 — * — * — * — * — * — * — * — * — * — * — * — *MW-6 — * — 0.0070 — 0.011 — * — * — * — * — * — * — * — * — * — * — * — *MW-7 — * — 0.0052 — 0.015 — * — * — * — * — * — * — * — * — * — * — * — *
(BG) MW-9 — * — * — 0.0051 — * — * — * — * — * — * — * — * — * — * — 0.013 — *(BG) MW-10 — * — * — 0.015 — * — * — * — * — * — * — * — * — * — * — * — *
LDCS-1 * — 0.0094 — 0.024 — — — — — * — * — * — * — * — — — — — — — * — * —LDCS-2A * — 0.0072 — 0.017 — — — — — * — * — * — * — * — — — — — — — * — * —LDCS-2B * — * — 0.015 — — — — — * — * — * — * — * — — — — — — — * — * —LDCS-3A * — * — 0.019 — — — — — * — * — * — * — * — — — — — — — * — * —LDCS-4A * — 0.016 — 0.045 — — — — — * — 0.0050 — * — * — * — — — — — — — * — * —LDCS-4B * — 0.034 — 0.059 — — — — — * — 0.0015 — * — * — * — — — — — — — * — * —LDCS-5 * — 0.014 — 0.120 — * — * — * — 0.0018 — * — * — * — * — * — * — * — * —LDCS-5 (Resample) * — 0.015 — 0.110 — * — * — * — 0.0014 — * — * — * — * — * — * — * — * —LDCS-6 * — * — 0.032 — * — * — * — * — * — * — * — * — * — * — * — 0.016 —
Leachate, Cell 4B — * — 0.11 — 1.3 — * — * — 0.58 — 0.038 — 0.074 — 0.019 — 0.62 — 0.012 — * — * — 0.13 — 0.14Notes:All sample units are milligrams per liter (mg/L).WAC 173-200-040 Table 1 Groundwater Quality Criteria are for total metals.Groundwater (monitoring well) concentrations greater than prediction limits or WAC 173-200 criteria are shown in bold.Parameter concentrations for monitoring wells are total (T) metals.Parameter concentrations for LDCS sumps are dissolved (D) metals.Analyses performed by TestAmerica of Denver, Colorado.Method Reporting Limit (MRL) is typical and may be elevated for some samples.* indicates result was not reported at or above the MRL— = not applicable or not performedBG = BackgroundJ = Result is less than the RL but greater than or equal to the MDL and the concentration is an approximate value.
Leachate Collection System
Monitoring Wells
Leak Detection System
Prediction Limit
Parameter
UnitsMRL
WAC 173-200 Criteria

Table 5. WAC 173-351 Appendix II Metals (Dissolved)Second Quarter 2019
LRI Landfill, Pierce County, Washington
LRILF 2Q 2019 Report Tables_v1.08/28/2019 SCS ENGINEERS
Calcium Iron Magnesium Manganese Potassium Sodiummg/L mg/L mg/L mg/L mg/L mg/L0.20 0.10 0.10 0.005 2.0 1.0
─ 0.30 ─ 0.050 ─ ─
MW-1A 14 1.6 8.8 0.27 3.6 11MW-2A 18 0.67 10 0.29 2.8 14MW-3 35 0.11 15 0.31 3.7 13MW-4 29 * 16 0.24 5.4 12MW-5A 28 0.14 11 0.21 4.2 31MW-6 31 * 14 0.20 4.7 9.9MW-7 33 0.19 22 0.25 5.4 13
(BG) MW-9 9.5 * 6.5 * * 7.1(BG) MW-10 24 * 10 * 2.1 13Leak Detection System
LDCS-1 42 0.35 17 1.6 5.3 18LDCS-2A 88 * 33 0.031 9.3 29LDCS-2B 87 1.2 30 0.25 6.7 19LDCS-3A 90 * 40 0.63 6.2 21LDCS-4A 86 2.5 46 1.9 6.6 23LDCS-4B 110 4.0 55 2.0 9.4 40LDCS-5 100 0.81 57 2.3 16 90LDCS-5 (Resample) 80 1.4 44 1.7 17 73LDCS-6 110 * 58 1.2 4.4 34
Leachate Collection System ^Leachate, Cell 4B 41 6.5 58 0.23 1,200 5,100
Notes:All sample units are milligrams per liter (mg/L).WAC 173-200-040 Table 1 Groundwater Quality Criteria are for total metals.Groundwater (monitoring well) concentrations greater than WAC 173-200 criteria are shown in bold.Analyses performed by TestAmerica of Denver, Colorado.Method Reporting Limit (MRL) is typical and may be elevated for some samples.^ Leachate reported concentraions are total metals.* indicates result was not reported at or above the MRL.— = not applicable or not performedBG = Background
Monitoring Wells
UnitsMRL
Parameter
WAC 173-200 Criteria

Table 6. Volatile Organic Compounds (µg/L)Second Quarter 2019
LRI Landfill, Pierce County, Washington
LRILF 2Q 2019 Report Tables_v1.08/28/2019 SCS ENGINEERS
1,4-Dichlorobenzene 2-Butanone (MEK) 2-Hexanone 4-Methyl-2-
pentanone (MIBK) Acetone Benzene Chlorobenzene Chloroform cis-1,2-Dichloroethene Ethylbenzene Methylene Chloride m-Xylene & p-
Xylene o-Xylene Styrene Toluene Trichloroethene
μg/L μg/L μg/L μg/L μg/L μg/L μg/L μg/L μg/L μg/L μg/L μg/L μg/L μg/L μg/L μg/L0.5 6.0 5.0 5.0 10.0 0.5 0.5 0.5 0.5 1.0 2.0 0.5 0.5 0.5 0.5 0.54.0 — — — — 1.0 — 7.0 — — 5.0 — — — — 3.0
MW-1A * * * * * * * * * * * * * * * *MW-2A * * * * * * * * * * * * * * * *MW-3 * * * * * * * * * * * * * * * *MW-4 * * * * * * * * * * * * * * * 0.94MW-5A * * * * * * * * * * * * * * * *MW-6 * * * * * * * * * * * * * * * *MW-7 * * * * * * * * * * * * * * * *
(BG) MW-9 * * * * * * * * * * * * * * * *(BG) MW-10 * * * * * * * * * * * * * * * *
LDCS-1 * * * * * * * * * * * * * * * *LDCS-2A * * * * * * * * * * * * * * * *LDCS-2B * * * * * * * * * * * * * * * *LDCS-3A * * * * * * * * * * * * * * * *LDCS-4A * * * * * * * * * * * * * * * *LDCS-4B * * * * * * * * * * * * * * * *LDCS-5 * * * * * * * * * * * * * * * *LDCS-5 (Resample) * * * * * * * * * * * * * * * *LDCS-6 * * * * * * * * * * * * * * * *
Leachate, Cell 4B 8.8 660 380 14 910 37 1.4 * 3 33 * 52 27 2.6 59 5.1
Field Blank * * * * * * * 0.63 * * 11.0 * * * * 0.5Notes:Analyses performed by TestAmerica of Denver, Colorado.* = not reported at or above the MRL— = not applicable or not performedBG = Background
Leachate Collection System
Quality Control Sample
Leak Detection System
Monitoring Wells
Parameter
UnitsMRL
WAC 173-200 Criteria

Tabl
e 7.
Cat
ion-
Ani
on B
alan
ceSe
cond
Qua
rter 2
019
LRI L
andf
ill, P
ierc
e C
ount
y, W
ashi
ngto
n
LRIL
F 2Q
201
9 Re
port
Tab
les_
v1.0
8/28
/201
9SC
S EN
GIN
EER
S
MW
-1A
148.
83.
611
37.4
0.70
0.72
0.08
0.48
1.98
2835
37M
W-2
A18
10.0
2.8
1444
.80.
900.
820.
060.
612.
3928
3834
MW
-335
153.
713
66.7
1.75
1.23
0.08
0.57
3.63
1848
34M
W-4
2916
5.4
1262
.41.
451.
320.
120.
523.
4119
4239
MW
-5A
2811
4.2
3174
.21.
400.
910.
091.
353.
7539
3724
MW
-631
144.
79.
959
.61.
551.
150.
110.
433.
2417
4836
MW
-733
225.
413
73.4
1.65
1.81
0.12
0.57
4.14
1740
44M
W-9
9.5
6.5
2.0
7.1
25.1
0.47
0.53
0.05
0.31
1.36
2635
39M
W-1
024
102.
113
49.1
1.20
0.82
0.05
0.57
2.63
2345
31LD
CS-
142
175.
318
82.3
2.10
1.40
0.12
0.78
4.40
2148
32LD
CS-
2A88
339.
329
159.
34.
392.
720.
211.
268.
5817
5132
LDC
S-2B
8730
6.7
1914
2.7
4.34
2.47
0.15
0.83
7.79
1356
32LD
CS-
3A90
406.
221
157.
24.
493.
290.
140.
918.
8412
5137
LDC
S-4A
8646
6.6
2316
1.6
4.29
3.79
0.15
1.00
9.23
1247
41LD
CS-
4B11
055
9.4
4021
4.4
5.49
4.53
0.21
1.74
11.9
716
4638
LDC
S-5
100
5716
9026
3.0
4.99
4.69
0.36
3.92
13.9
631
3634
LDC
S-5
(Res
ampl
e)80
4417
7321
4.0
3.99
3.62
0.38
3.18
11.1
732
3632
LDC
S-6
110
584.
434
206.
45.
494.
770.
101.
4811
.84
1346
40Le
acha
te, C
ell 4
B41
5812
0051
0063
992.
054.
7727
.10
221.
8525
5.77
971
2
MW
-1A
110.
42.
00.
53.
011
5.9
1.81
0.06
0.00
80.
061.
943
933
3.92
1.2
10O
MW
-2A
144
3.0
0.5
5.2
152.
72.
360.
080.
008
0.11
2.56
392
44.
963.
410
OM
W-3
168
3.7
0.5
2920
1.2
2.76
0.10
0.00
80.
603.
473
7917
7.10
2.2
5O
MW
-418
03.
00.
59.
619
3.1
2.95
0.08
0.00
80.
203.
243
916
6.65
2.5
5O
MW
-5A
204
3.1
0.5
1422
1.6
3.35
0.09
0.00
80.
293.
732
908
7.48
0.2
5O
MW
-616
85.
40.
56.
918
0.8
2.76
0.15
0.00
80.
143.
065
905
6.29
2.8
5O
MW
-724
03.
20.
53.
224
6.9
3.94
0.09
0.00
80.
074.
102
962
8.25
0.5
5O
MW
-981
.61.
60.
51.
885
.51.
340.
050.
008
0.04
1.43
394
32.
792.
410
OM
W-1
012
08.
04.
77.
113
9.8
1.97
0.23
0.07
60.
152.
429
816
5.05
4.3
5O
LDC
S-1
240
4.4
0.5
6.1
251
3.94
0.12
0.00
80.
134.
203
943
8.59
2.4
5O
LDC
S-2A
492
4.0
0.5
2151
7.5
8.07
0.11
0.00
80.
448.
631
945
17.2
10.
35
OLD
CS-
2B37
24.
00.
558
434.
56.
100.
110.
008
1.21
7.43
282
1615
.22
2.4
5O
LDC
S-3A
420
4.7
0.5
7550
0.2
6.89
0.13
0.00
81.
568.
592
8018
17.4
31.
45
OLD
CS-
4A45
620
0.5
5653
2.5
7.48
0.56
0.00
81.
169.
226
8113
18.4
40.
15
OLD
CS-
4B56
432
0.5
6065
6.5
9.25
0.90
0.00
81.
2511
.41
881
1123
.38
2.4
5O
LDC
S-5
768
700.
519
857.
512
.60
1.97
0.00
80.
4014
.97
1384
328
.93
3.5
5O
LDC
S-5
(Res
ampl
e)61
248
0.5
2068
110
.04
1.35
0.00
80.
4211
.81
1185
422
.99
2.8
5O
LDC
S-6
528
8.8
0.5
160
697
8.66
0.25
0.00
83.
3312
.24
271
2724
.08
1.7
5O
Leac
hate
, Cel
l 4B
1680
037
004.
95.
420
510
275.
5210
4.34
0.07
90.
1138
0.05
2772
063
5.82
19.5
5Ex
ceed
sN
otes
:m
g/L
= m
illigr
ams p
er li
ter
meq
/L =
milli
equi
vale
nts p
er li
ter
Tota
l alk
alin
ity c
once
ntra
tion,
repo
rted
as c
alci
um c
arbo
nate
(CaC
O3)
, is c
onve
rted
to th
e bi
carb
onat
e (H
CO
3- ) ion
by
mul
tiply
ing
by a
fact
or o
f 1.2
.—
= n
ot a
pplic
able
or n
ot p
erfo
rmed
The
MRL
was
use
d fo
r ana
lyte
s tha
t wer
e no
n-de
tect
A
10%
diff
eren
ce th
resh
old
is us
ed if
the
tota
l cat
ion-
anio
n su
ms a
re <
5.0
meq
/lite
r.A
5%
diff
eren
ce th
resh
old
is us
ed if
the
tota
l cat
ion-
anio
n su
ms a
re >
or =
to 5
.0 m
eq/li
ter.
App
licab
le
Ratio
(%)
Ratio
Ex
ceed
ance
Mg
Ani
ons
meq
/L%
of T
otal
Ca
Mg
Tota
lN
a+K
Ca
Ca
Mg
Tota
lC
atio
nsN
am
g/L
Alk
meq
/L%
of T
otal
mg/
L
Na
KK
Cl
Tota
lN
O3
SO4
Cat
ion
- Ani
on
Bala
nce
Tota
l Ion
s (m
eq/L
)SO
4A
lkC
lTo
tal
NO
3SO
4A
lkC
l

Table 8. Duplicate Sample ResultsSecond Quarter 2019 Monitoring ReportLRI Landfill, Pierce County, Washington
LRILF 2Q 2019 Report Tables_v1.08/28/2019 SCS ENGINEERS
MRL MW-5A MW-5A (Duplicate) RPD (%)
Volatile Organic Compunds (µg/L)No Detections - - - -
Inorganic Parameters (mg/L)Alkalinity, Bicarbonate (as CaCO3) 10 170 170 0.0Ammonia 0.1 0.17 0.17 0.0Chloride 0.2 3.1 3.1 0.0Sulfate 0.2 14 14 0.0Total Dissolved Solids 10 220 230 4.4
Dissolved Metals (mg/L)Calcium 0.2 28 28 0.0Iron 0.1 0.14 0.11 24.0Magnesium 0.1 11 11 0.0Manganese 0.005 0.21 0.2 4.9Potassium 2.0 4.2 4.3 2.4Sodium 1.0 31 31 0.0
Total Metals (mg/L)Arsenic 0.005 0.0055 0.0052 5.6Barium 0.005 0.012 0.012 0.0Notes:Analyses performed by TestAmerica of Denver, Colorado.VOCs not listed were not present at concentrations exceeding the Method Reporting Limit (MRL).RPD = relative percent difference.µg/L = micrograms per liter.mg/L = milligrams per liter.* = the sample results were not reported at or above the MRLThe MRL was used to calculate the RPD for analytes where one sample was non-detect.
Parameter

LRI Landfill Second Quarter 2019 Report www.scsengineers.com
Appendix C
Field Sampling Documentation

Page 1 of 2
Environmental Consultants & Contractors
June 20, 2019 File No. 04219001.02
Subject: Second Quarter 2019 Groundwater Monitoring Event LRI Landfill, Pierce County, Washington
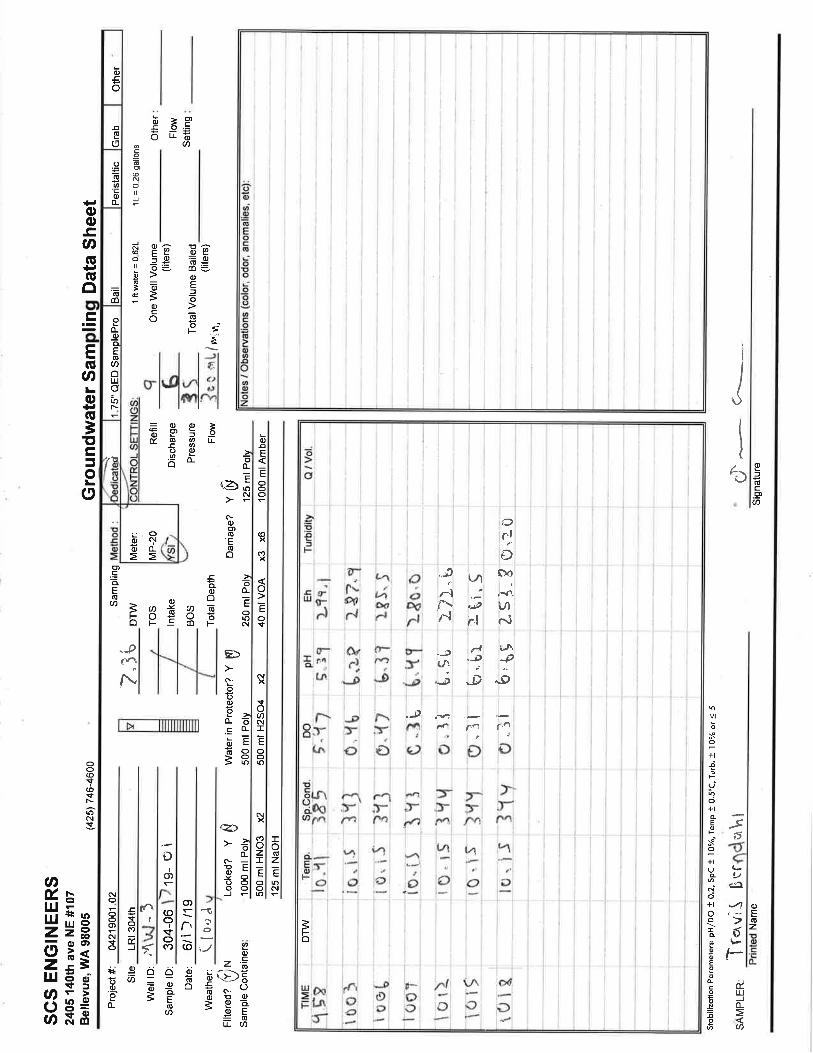
NOTES/SAMPLE DECODING: Event Dates: June 17-19 & July 12, 2019 Field Staff: Sam Graber and Travis Berndahl
• Dedicated pumps were used for purging and sampling wells MW-1A, MW-2A, MW-3, MW-5A, MW-6, MW-7, MW-9, MW-10, and leak detection/collection system points LDCS-3A, LDCS-4A, LDCS-4B, LDCS-5, and LDCS-6.
• Disposable bailers were used to sample leak detection/collection system points LDCS-1, LDCS-2A, and LDCS-2B.
• A non-dedicated Sample Pro pump was used for purging and sampling well MW-4.
• LDCS-5 was resampled on 7/12/19.
• The ORP meter for samples “-02”, “-.04”, “-06”, “-08”, “-10”, “-12”, and “-14” was not functioning properly; therefore that data is omitted from the reports.
• A round of water level measurements was completed on June 18, 2019.
• Multiparameter field meters were calibrated daily, prior to sampling.
• Source water for the field blank was lab-grade deionized water (VOC-free) provided by TestAmerica in Tacoma, Washington.
Sample Number Well Number
304-061719-01 MW-3 304-061719-02 LDCS-3 304-061719-03 MW-6 304-061719-04 LDCS-2B 304-061719-05 MW-5A 304-061719-06 LDCS-2A 304-061719-07 MW-5A (Duplicate) 304-061719-08 LDCS-1 304-061719-09 MW-7 304-061719-10 LDCS-4A 304-061719-11 MW-10 304-061719-12 LDCS-4B 304-061819-13 MW-1 304-061819-14 MW-4 304-061819-15 Leachate Cell 4B 304-061819-16 Field Blank 304-061819-17 LDCS-5 304-061919-18 MW-2 304-061919-19 MW-9

Page 2 of 2
304-061919-20 LDCS-6 304-071219-01 LDCS-5 (Resample)


LRI Landfill Second Quarter 2019 Report www.scsengineers.com
Appendix D
Statistical Calculations

Gro
undw
ater
Pre
dict
ion
Limits
(mg/
L)A
ppen
dix
I Par
amet
ers,
Sec
ond
Qua
rter 2
019
LRI L
andf
ill, P
ierc
e C
ount
y, W
ashi
ngto
n
Page
1 o
f 1
MRL
(ty
pica
l)An
timon
y0.
050
0.05
0L
0.05
0L
0.05
0L
0.05
0L
0.05
0L
0.05
0L
0.05
0L
0.05
0L
0.05
0L
0.05
0L
Arse
nic
0.00
50.
011
0.00
5L
0.00
5L
0.00
5L
0.01
10.
008
0.00
80.
006
0.00
5L
0.00
5L
Bariu
m0.
005
0.09
10.
030
0.01
80.
015
0.09
10.
036
0.01
40.
016
0.00
570.
016
Bery
llium
0.00
50.
005
L0.
005
L0.
005
L0.
005
L0.
005
L0.
005
L0.
001
L0.
005
L0.
001
L0.
005
LC
adm
ium
0.00
50.
005
L0.
005
L0.
005
L0.
005
L0.
005
L0.
005
L0.
005
L0.
005
L0.
005
L0.
005
LC
hrom
ium
0.00
50.
011
0.00
5L
0.00
5L
0.00
5L
0.01
10.
005
0.00
5L
0.00
5L
0.00
5L
0.00
5L
Cob
alt
0.01
00.
010
L0.
010
L0.
010
L0.
010
L0.
004
0.01
0L
0.01
0L
0.01
0L
0.01
0L
0.01
0L
Cop
per
0.01
00.
063
0.01
0L
0.01
0L
0.01
0L
0.06
30.
010
L0.
010
L0.
010
L0.
010
L0.
010
LLe
ad0.
002
0.04
20.
002
L0.
002
L0.
002
L0.
042
0.00
2L
0.00
2L
0.00
2L
0.00
2L
0.00
2L
Nic
kel
0.02
00.
020
L0.
020
L0.
020
L0.
020
L0.
020
L0.
020
L0.
020
L0.
020
L0.
020
L0.
020
LSe
leni
um0.
005
0.00
5L
0.00
5L
0.00
5L
0.00
5L
0.00
5L
0.00
5L
0.00
5L
0.00
5L
0.00
5L
0.00
5L
Silv
er0.
010
0.01
0L
0.01
0L
0.01
0L
0.01
0L
0.01
0L
0.01
0L
0.01
0L
0.01
0L
0.01
0L
0.01
0L
Thal
lium
0.00
50.
005
L0.
005
L0.
005
L0.
005
L0.
005
L0.
005
L0.
005
L0.
005
L0.
005
L0.
005
LVa
nadi
um0.
010
0.01
60.
010
L0.
010
L0.
010
L0.
014
0.01
0L
0.01
0L
0.01
0L
0.01
60.
010
LZi
nc0.
010.
290
0.03
20.
010
L0.
010
L0.
290
0.01
00.
010
L0.
010
L0.
043
0.01
1N
itrat
e as
Nitr
ogen
0.50
6.40
0.50
0L
0.50
0L
0.50
0L
0.50
0L
0.50
0L
0.50
0L
0.50
0L
0.50
0L
6.40
Not
es:
Pred
ictio
n Lim
its a
re sh
own
in b
old.
Pred
ictio
n Lim
its fo
r met
als a
re fo
r tot
al m
etal
s.
L =
not r
epor
ted
at o
r abo
ve th
e M
RL (M
etho
d Re
porti
ng L
imit)
.
mg/
L =
milli
gram
s per
lite
r.
MW
-6M
W-7
MW
-9M
W-1
0Pr
edic
tion
Limit
MW
-1/
M
W-1
AM
W-2
/
MW
-2A
MW
-3M
W-4
MW
-5/
MW
-5A


Statistical Summary of Total Metals Groundwater Data Appendix I Parameters, Second Quarter 2019
LRI Landfill, Pierce County, Washington
LRILF 2Q19 Prediction Limits 8/14/2019 Page 1 of 3 SCS ENGINEERS
Location IDMonitoring Date Result Conc. Result Conc. Result Conc. Result Conc. Result Conc. Result Conc. Result Conc. Result Conc. Result Conc. Result Conc. Result Conc. Result Conc. Result Conc. Result Conc. Result Conc. Result Conc.
MW-13/24/2014 0.002 L 0.001 0.005 L 0.0025 0.022 0.022 0.001 L 0.0005 0.005 L 0.0025 0.002 L 0.001 0.01 L 0.005 0.002 L 0.001 0.001 L 0.0005 0.002 L 0.001 0.005 L 0.0025 0.01 L 0.005 0.001 L 0.0005 0.01 L 0.005 0.01 L 0.005 0.5 L 0.256/24/2014 0.002 L 0.001 0.005 L 0.0025 0.02 0.02 0.001 L 0.0005 0.005 L 0.0025 0.002 L 0.001 0.01 L 0.005 0.002 L 0.001 0.001 L 0.0005 0.002 L 0.001 0.005 L 0.0025 0.01 L 0.005 0.001 L 0.0005 0.01 L 0.005 0.01 L 0.005 0.5 L 0.259/17/2014 0.05 L 0.025 0.005 L 0.0025 0.024 0.024 0.005 L 0.0025 0.005 L 0.0025 0.005 L 0.0025 0.01 L 0.005 0.01 L 0.005 0.002 L 0.001 0.02 L 0.01 0.005 L 0.0025 0.01 L 0.005 0.005 L 0.0025 0.01 L 0.005 0.02 0.02 0.5 L 0.2512/16/2014 0.05 L 0.025 0.005 L 0.0025 0.03 0.03 0.001 L 0.0005 0.001 L 0.0005 0.005 L 0.0025 0.001 L 0.0005 0.01 L 0.005 0.002 L 0.001 0.02 L 0.01 0.005 L 0.0025 0.005 L 0.0025 0.005 L 0.0025 0.005 L 0.0025 0.032 0.032 0.5 L 0.253/23/2015 0.05 L 0.025 0.005 L 0.0025 0.02 0.02 0.001 L 0.0005 0.001 L 0.0005 0.005 L 0.0025 0.001 L 0.0005 0.01 L 0.005 0.002 L 0.001 0.02 L 0.01 0.005 L 0.0025 0.005 L 0.0025 0.005 L 0.0025 0.005 L 0.0025 0.01 L 0.005 0.5 L 0.256/8/2015 0.05 L 0.025 0.005 L 0.0025 0.022 0.022 0.001 L 0.0005 0.001 L 0.0005 0.005 L 0.0025 0.001 L 0.0005 0.01 L 0.005 0.002 L 0.001 0.02 L 0.01 0.005 L 0.0025 0.005 L 0.0025 0.005 L 0.0025 0.005 L 0.0025 0.01 L 0.005 0.5 L 0.259/16/2015 0.05 L 0.025 0.005 L 0.0025 0.021 0.021 0.001 L 0.0005 0.001 L 0.0005 0.005 L 0.0025 0.001 L 0.0005 0.01 L 0.005 0.002 L 0.001 0.02 L 0.01 0.005 L 0.0025 0.005 L 0.0025 0.005 L 0.0025 0.005 L 0.0025 0.01 L 0.005 0.5 L 0.2512/14/2015 0.05 L 0.025 0.005 L 0.0025 0.024 0.024 0.001 L 0.0005 0.001 L 0.0005 0.005 L 0.0025 0.001 L 0.0005 0.01 L 0.005 0.002 L 0.001 0.02 L 0.01 0.005 L 0.0025 0.005 L 0.0025 0.005 L 0.0025 0.005 L 0.0025 0.01 L 0.005 0.5 L 0.25Number Analyzed 8 8 8 8 8 8 8 8 8 8 8 8 8 8 8 8Number Detected 0 0 8 0 0 0 0 0 0 0 0 0 0 0 2 0
Minimum Concentration 0.001 0.0025 0.02 0.0005 0.0005 0.001 0.0005 0.001 0.0005 0.001 0.0025 0.0025 0.0005 0.0025 0.005 0.25Maximum Concentration 0.025 0.0025 0.03 0.0025 0.0025 0.0025 0.005 0.005 0.001 0.01 0.0025 0.005 0.0025 0.005 0.032 0.25Average Concentration NC NC 0.02288 NC NC NC NC NC NC NC NC NC NC NC NC NC
Variance NC NC 1.1E-05 NC NC NC NC NC NC NC NC NC NC NC NC NCStandard Deviation NC NC 0.0033 NC NC NC NC NC NC NC NC NC NC NC NC NC
oefficient of Variation (%) NC NC 14.2974 NC NC NC NC NC NC NC NC NC NC NC NC NCStandard Error NC NC 0.00116 NC NC NC NC NC NC NC NC NC NC NC NC NC
MW-23/24/2014 0.002 L 0.001 0.005 L 0.0025 0.014 0.014 0.001 L 0.0005 0.005 L 0.0025 0.002 L 0.001 0.01 L 0.005 0.002 L 0.001 0.001 L 0.0005 0.002 L 0.001 0.005 L 0.0025 0.01 L 0.005 0.001 L 0.0005 0.01 L 0.005 0.01 L 0.005 0.5 L 0.256/26/2014 0.002 L 0.001 0.005 L 0.0025 0.015 0.015 0.001 L 0.0005 0.005 L 0.0025 0.002 L 0.001 0.01 L 0.005 0.002 L 0.001 0.001 L 0.0005 0.002 L 0.001 0.005 L 0.0025 0.01 L 0.005 0.001 L 0.0005 0.01 L 0.005 0.01 L 0.005 0.5 L 0.259/16/2014 0.05 L 0.025 0.005 L 0.0025 0.018 0.018 0.005 L 0.0025 0.005 L 0.0025 0.005 L 0.0025 0.01 L 0.005 0.01 L 0.005 0.002 L 0.001 0.02 L 0.01 0.005 L 0.0025 0.01 L 0.005 0.005 L 0.0025 0.01 L 0.005 0.01 L 0.005 0.5 L 0.2512/16/2014 0.05 L 0.025 0.005 L 0.0025 0.014 0.014 0.001 L 0.0005 0.001 L 0.0005 0.005 L 0.0025 0.001 L 0.0005 0.01 L 0.005 0.002 L 0.001 0.02 L 0.01 0.005 L 0.0025 0.005 L 0.0025 0.005 L 0.0025 0.005 L 0.0025 0.01 L 0.005 0.5 L 0.253/23/2015 0.05 L 0.025 0.005 L 0.0025 0.012 0.012 0.001 L 0.0005 0.001 L 0.0005 0.005 L 0.0025 0.001 L 0.0005 0.01 L 0.005 0.002 L 0.001 0.02 L 0.01 0.005 L 0.0025 0.005 L 0.0025 0.005 L 0.0025 0.005 L 0.0025 0.01 L 0.005 0.5 L 0.256/8/2015 0.05 L 0.025 0.005 L 0.0025 0.013 0.013 0.001 L 0.0005 0.001 L 0.0005 0.005 L 0.0025 0.001 L 0.0005 0.01 L 0.005 0.002 L 0.001 0.02 L 0.01 0.005 L 0.0025 0.005 L 0.0025 0.005 L 0.0025 0.005 L 0.0025 0.01 L 0.005 0.5 L 0.259/16/2015 0.05 L 0.025 0.005 L 0.0025 0.013 0.013 0.001 L 0.0005 0.001 L 0.0005 0.005 L 0.0025 0.001 L 0.0005 0.01 L 0.005 0.002 L 0.001 0.02 L 0.01 0.005 L 0.0025 0.005 L 0.0025 0.005 L 0.0025 0.005 L 0.0025 0.01 L 0.005 0.5 L 0.2512/14/2015 0.05 L 0.025 0.005 L 0.0025 0.014 0.014 0.001 L 0.0005 0.001 L 0.0005 0.005 L 0.0025 0.001 L 0.0005 0.01 L 0.005 0.002 L 0.001 0.02 L 0.01 0.005 L 0.0025 0.005 L 0.0025 0.005 L 0.0025 0.005 L 0.0025 0.01 L 0.005 0.5 L 0.25Number Analyzed 8 8 8 8 8 8 8 8 8 8 8 8 8 8 8 8Number Detected 0 0 8 0 0 0 0 0 0 0 0 0 0 0 0 0
Minimum Concentration 0.001 0.0025 0.012 0.0005 0.0005 0.001 0.0005 0.001 0.0005 0.001 0.0025 0.0025 0.0005 0.0025 0.005 0.25Maximum Concentration 0.025 0.0025 0.018 0.0025 0.0025 0.0025 0.005 0.005 0.001 0.01 0.0025 0.005 0.0025 0.005 0.005 0.25Average Concentration NC NC 0.01413 NC NC NC NC NC NC NC NC NC NC NC NC NC
Variance NC NC 3.3E-06 NC NC NC NC NC NC NC NC NC NC NC NC NCStandard Deviation NC NC 0.00181 NC NC NC NC NC NC NC NC NC NC NC NC NC
oefficient of Variation (%) NC NC 12.798 NC NC NC NC NC NC NC NC NC NC NC NC NCStandard Error NC NC 0.00064 NC NC NC NC NC NC NC NC NC NC NC NC NC
MW-33/26/2014 0.002 L 0.001 0.005 L 0.0025 0.014 0.014 0.001 L 0.0005 0.005 L 0.0025 0.002 L 0.001 0.01 L 0.005 0.002 L 0.001 0.001 L 0.0005 0.002 L 0.001 0.005 L 0.0025 0.01 L 0.005 0.001 L 0.0005 0.01 L 0.005 0.01 L 0.005 0.5 L 0.256/25/2014 0.002 L 0.001 0.005 L 0.0025 0.011 0.011 0.001 L 0.0005 0.005 L 0.0025 0.002 L 0.001 0.01 L 0.005 0.002 L 0.001 0.001 L 0.0005 0.002 L 0.001 0.005 L 0.0025 0.01 L 0.005 0.001 L 0.0005 0.01 L 0.005 0.01 L 0.005 0.5 L 0.259/17/2014 0.05 L 0.025 0.005 L 0.0025 0.01 0.01 0.005 L 0.0025 0.005 L 0.0025 0.005 L 0.0025 0.01 L 0.005 0.01 L 0.005 0.002 L 0.001 0.02 L 0.01 0.005 L 0.0025 0.01 L 0.005 0.005 L 0.0025 0.01 L 0.005 0.01 L 0.005 0.5 L 0.2512/16/2014 0.05 L 0.025 0.005 L 0.0025 0.012 0.012 0.001 L 0.0005 0.001 L 0.0005 0.005 L 0.0025 0.001 L 0.0005 0.01 L 0.005 0.002 L 0.001 0.02 L 0.01 0.005 L 0.0025 0.005 L 0.0025 0.005 L 0.0025 0.005 L 0.0025 0.01 L 0.005 0.5 L 0.253/26/2015 0.05 L 0.025 0.005 L 0.0025 0.013 0.013 0.001 L 0.0005 0.001 L 0.0005 0.005 L 0.0025 0.001 L 0.0005 0.01 L 0.005 0.002 L 0.001 0.02 L 0.01 0.005 L 0.0025 0.005 L 0.0025 0.005 L 0.0025 0.005 L 0.0025 0.01 L 0.005 0.5 L 0.256/9/2015 0.05 L 0.025 0.005 L 0.0025 0.011 0.011 0.001 L 0.0005 0.001 L 0.0005 0.005 L 0.0025 0.001 L 0.0005 0.01 L 0.005 0.002 L 0.001 0.02 L 0.01 0.005 L 0.0025 0.005 L 0.0025 0.005 L 0.0025 0.005 L 0.0025 0.01 L 0.005 0.5 L 0.259/16/2015 0.05 L 0.025 0.005 L 0.0025 0.01 0.01 0.001 L 0.0005 0.001 L 0.0005 0.005 L 0.0025 0.001 L 0.0005 0.01 L 0.005 0.002 L 0.001 0.02 L 0.01 0.005 L 0.0025 0.005 L 0.0025 0.005 L 0.0025 0.005 L 0.0025 0.01 L 0.005 0.5 L 0.2512/14/2015 0.05 L 0.025 0.005 L 0.0025 0.015 0.015 0.001 L 0.0005 0.001 L 0.0005 0.005 L 0.0025 0.001 L 0.0005 0.01 L 0.005 0.002 L 0.001 0.02 L 0.01 0.005 L 0.0025 0.005 L 0.0025 0.005 L 0.0025 0.005 L 0.0025 0.01 L 0.005 0.5 L 0.25Number Analyzed 8 8 8 8 8 8 8 8 8 8 8 8 8 8 8 8Number Detected 0 0 8 0 0 0 0 0 0 0 0 0 0 0 0 0
Minimum Concentration 0.001 0.0025 0.01 0.0005 0.0005 0.001 0.0005 0.001 0.0005 0.001 0.0025 0.0025 0.0005 0.0025 0.005 0.25Maximum Concentration 0.025 0.0025 0.015 0.0025 0.0025 0.0025 0.005 0.005 0.001 0.01 0.0025 0.005 0.0025 0.005 0.005 0.25Average Concentration NC NC 0.012 NC NC NC NC NC NC NC NC NC NC NC NC NC
Variance NC NC 3.4E-06 NC NC NC NC NC NC NC NC NC NC NC NC NCStandard Deviation NC NC 0.00185 NC NC NC NC NC NC NC NC NC NC NC NC NC
oefficient of Variation (%) NC NC 15.4303 NC NC NC NC NC NC NC NC NC NC NC NC NCStandard Error NC NC 0.00065 NC NC NC NC NC NC NC NC NC NC NC NC NC
Nitrate (NO3)Zinc (Zn)Vanadium (V)Thallium (Tl)Silver (Ag)Antimony (Sb) Selenium (Se)Cadmium (Cd)Beryllium (Be)Barium (Ba)Arsenic (As) Nickel (Ni)Lead (Pb)Copper (Cu)Cobalt (Co)Chromium (Cr)

Statistical Summary of Total Metals Groundwater Data Appendix I Parameters, Second Quarter 2019
LRI Landfill, Pierce County, Washington
LRILF 2Q19 Prediction Limits 8/14/2019 Page 2 of 3 SCS ENGINEERS
Location IDMonitoring Date Result Conc. Result Conc. Result Conc. Result Conc. Result Conc. Result Conc. Result Conc. Result Conc. Result Conc. Result Conc. Result Conc. Result Conc. Result Conc. Result Conc. Result Conc. Result Conc.
Nitrate (NO3)Zinc (Zn)Vanadium (V)Thallium (Tl)Silver (Ag)Antimony (Sb) Selenium (Se)Cadmium (Cd)Beryllium (Be)Barium (Ba)Arsenic (As) Nickel (Ni)Lead (Pb)Copper (Cu)Cobalt (Co)Chromium (Cr)
MW-43/24/2014 0.002 L 0.001 0.0074 0.0074 0.012 0.012 0.001 L 0.0005 0.005 L 0.0025 0.002 L 0.001 0.01 L 0.005 0.002 L 0.001 0.001 L 0.0005 0.002 L 0.001 0.005 L 0.0025 0.01 L 0.005 0.001 L 0.0005 0.01 L 0.005 0.01 L 0.005 0.5 L 0.256/25/2014 0.002 L 0.001 0.0086 0.0086 0.012 0.012 0.001 L 0.0005 0.005 L 0.0025 0.002 L 0.001 0.01 L 0.005 0.002 L 0.001 0.001 L 0.0005 0.002 L 0.001 0.005 L 0.0025 0.01 L 0.005 0.001 L 0.0005 0.01 L 0.005 0.01 L 0.005 0.5 L 0.259/17/2014 0.05 L 0.025 0.0099 0.0099 0.013 0.013 0.005 L 0.0025 0.005 L 0.0025 0.005 L 0.0025 0.01 L 0.005 0.01 L 0.005 0.002 L 0.001 0.02 L 0.01 0.005 L 0.0025 0.01 L 0.005 0.005 L 0.0025 0.01 L 0.005 0.01 L 0.005 0.5 L 0.2512/16/2014 0.05 L 0.025 0.0076 0.0076 0.011 0.011 0.001 L 0.0005 0.001 L 0.0005 0.005 L 0.0025 0.001 L 0.0005 0.01 L 0.005 0.002 L 0.001 0.02 L 0.01 0.005 L 0.0025 0.005 L 0.0025 0.005 L 0.0025 0.005 L 0.0025 0.01 L 0.005 0.5 L 0.253/24/2015 0.05 L 0.025 0.0079 0.0079 0.013 0.013 0.001 L 0.0005 0.001 L 0.0005 0.005 L 0.0025 0.001 L 0.0005 0.01 L 0.005 0.002 L 0.001 0.02 L 0.01 0.005 L 0.0025 0.005 L 0.0025 0.005 L 0.0025 0.005 L 0.0025 0.01 L 0.005 0.5 L 0.256/9/2015 0.05 L 0.025 0.0094 0.0094 0.013 0.013 0.001 L 0.0005 0.001 L 0.0005 0.005 L 0.0025 0.001 L 0.0005 0.01 L 0.005 0.002 L 0.001 0.02 L 0.01 0.005 L 0.0025 0.005 L 0.0025 0.005 L 0.0025 0.005 L 0.0025 0.01 L 0.005 0.5 L 0.259/18/2015 0.05 L 0.025 0.0094 0.0094 0.017 0.017 0.001 L 0.0005 0.001 L 0.0005 0.005 L 0.0025 0.001 L 0.0005 0.01 L 0.005 0.002 L 0.001 0.02 L 0.01 0.005 L 0.0025 0.005 L 0.0025 0.005 L 0.0025 0.005 L 0.0025 0.014 0.014 0.5 L 0.2512/15/2015 0.05 L 0.025 0.011 0.011 0.091 0.091 0.001 L 0.0005 0.001 L 0.0005 0.011 0.011 0.0039 0.0039 0.063 0.063 0.042 0.042 0.02 L 0.01 0.005 L 0.0025 0.005 L 0.0025 0.005 L 0.0025 0.014 0.014 0.29 0.29 0.5 L 0.25Number Analyzed 8 8 8 8 8 8 8 8 8 8 8 8 8 8 8 8Number Detected 0 8 8 0 0 1 1 1 1 0 0 0 0 1 2 0
Minimum Concentration 0.001 0.0074 0.011 0.0005 0.0005 0.001 0.0005 0.001 0.0005 0.001 0.0025 0.0025 0.0005 0.0025 0.005 0.25Maximum Concentration 0.025 0.011 0.091 0.0025 0.0025 0.011 0.005 0.063 0.042 0.01 0.0025 0.005 0.0025 0.014 0.29 0.25Average Concentration NC 0.0089 0.02275 NC NC NC NC NC NC NC NC NC NC NC NC NC
Variance NC 1.6E-06 0.00076 NC NC NC NC NC NC NC NC NC NC NC NC NCStandard Deviation NC 0.00125 0.02763 NC NC NC NC NC NC NC NC NC NC NC NC NC
oefficient of Variation (%) NC 14.0465 121.469 NC NC NC NC NC NC NC NC NC NC NC NC NCStandard Error NC 0.00044 0.00977 NC NC NC NC NC NC NC NC NC NC NC NC NC
MW-53/24/2014 0.002 L 0.001 0.0072 0.0072 0.032 0.032 0.001 L 0.0005 0.005 L 0.0025 0.002 L 0.001 0.01 L 0.005 0.002 L 0.001 0.001 L 0.0005 0.002 L 0.001 0.005 L 0.0025 0.01 L 0.005 0.001 L 0.0005 0.01 L 0.005 0.01 L 0.005 0.5 L 0.256/25/2014 0.002 L 0.001 0.0067 0.0067 0.033 0.033 0.001 L 0.0005 0.005 L 0.0025 0.0036 0.0036 0.01 L 0.005 0.0061 0.0061 0.001 L 0.0005 0.0043 0.0043 0.005 L 0.0025 0.01 L 0.005 0.001 L 0.0005 0.01 L 0.005 0.01 L 0.005 0.5 L 0.259/16/2014 0.05 L 0.025 0.0059 0.0059 0.036 0.036 0.005 L 0.0025 0.005 L 0.0025 0.0051 0.0051 0.01 L 0.005 0.01 L 0.005 0.002 L 0.001 0.02 L 0.01 0.005 L 0.0025 0.01 L 0.005 0.005 L 0.0025 0.01 L 0.005 0.01 0.01 0.5 L 0.2512/16/2014 0.05 L 0.025 0.0055 0.0055 0.022 0.022 0.001 L 0.0005 0.001 L 0.0005 0.005 L 0.0025 0.001 L 0.0005 0.01 L 0.005 0.002 L 0.001 0.02 L 0.01 0.005 L 0.0025 0.005 L 0.0025 0.005 L 0.0025 0.005 L 0.0025 0.01 L 0.005 0.5 L 0.253/23/2015 0.05 L 0.025 0.008 0.008 0.03 0.03 0.001 L 0.0005 0.001 L 0.0005 0.005 L 0.0025 0.001 L 0.0005 0.01 L 0.005 0.002 L 0.001 0.02 L 0.01 0.005 L 0.0025 0.005 L 0.0025 0.005 L 0.0025 0.005 L 0.0025 0.01 L 0.005 0.5 L 0.256/8/2015 0.05 L 0.025 0.0075 0.0075 0.02 0.02 0.001 L 0.0005 0.001 L 0.0005 0.005 L 0.0025 0.001 L 0.0005 0.01 L 0.005 0.002 L 0.001 0.02 L 0.01 0.005 L 0.0025 0.005 L 0.0025 0.005 L 0.0025 0.005 L 0.0025 0.01 L 0.005 0.5 L 0.259/18/2015 0.05 L 0.025 0.005 L 0.0025 0.014 0.014 0.001 L 0.0005 0.001 L 0.0005 0.005 L 0.0025 0.001 L 0.0005 0.01 L 0.005 0.002 L 0.001 0.02 L 0.01 0.005 L 0.0025 0.005 L 0.0025 0.005 L 0.0025 0.005 L 0.0025 0.01 L 0.005 0.5 L 0.2512/14/2015 0.05 L 0.025 0.0072 0.0072 0.021 0.021 0.001 L 0.0005 0.001 L 0.0005 0.005 L 0.0025 0.001 L 0.0005 0.01 L 0.005 0.002 L 0.001 0.02 L 0.01 0.005 L 0.0025 0.005 L 0.0025 0.005 L 0.0025 0.005 L 0.0025 0.01 L 0.005 0.5 L 0.25Number Analyzed 8 8 8 8 8 8 8 8 8 8 8 8 8 8 8 8Number Detected 0 7 8 0 0 2 0 1 0 1 0 0 0 0 1 0
Minimum Concentration 0.001 0.0025 0.014 0.0005 0.0005 0.001 0.0005 0.001 0.0005 0.001 0.0025 0.0025 0.0005 0.0025 0.005 0.25Maximum Concentration 0.025 0.008 0.036 0.0025 0.0025 0.0051 0.005 0.0061 0.001 0.01 0.0025 0.005 0.0025 0.005 0.01 0.25Average Concentration NC 0.00631 0.026 NC NC NC NC NC NC NC NC NC NC NC NC NC
Variance NC 3E-06 6E-05 NC NC NC NC NC NC NC NC NC NC NC NC NCStandard Deviation NC 0.00175 0.00776 NC NC NC NC NC NC NC NC NC NC NC NC NC
oefficient of Variation (%) NC 27.6653 29.863 NC NC NC NC NC NC NC NC NC NC NC NC NCStandard Error NC 0.00062 0.00275 NC NC NC NC NC NC NC NC NC NC NC NC NC
MW-63/26/2014 0.002 L 0.001 0.0075 0.0075 0.014 0.014 0.001 L 0.0005 0.005 L 0.0025 0.002 L 0.001 0.01 L 0.005 0.002 L 0.001 0.001 L 0.0005 0.002 L 0.001 0.005 L 0.0025 0.01 L 0.005 0.001 L 0.0005 0.01 L 0.005 0.01 L 0.005 0.5 L 0.256/25/2014 0.002 L 0.001 0.0065 0.0065 0.011 0.011 0.001 L 0.0005 0.005 L 0.0025 0.002 L 0.001 0.01 L 0.005 0.002 L 0.001 0.001 L 0.0005 0.002 L 0.001 0.005 L 0.0025 0.01 L 0.005 0.001 L 0.0005 0.01 L 0.005 0.01 L 0.005 0.5 L 0.259/18/2014 0.002 L 0.001 0.0078 0.0078 0.01 0.01 0.001 L 0.0005 0.005 L 0.0025 0.002 L 0.001 0.01 L 0.005 0.002 L 0.001 0.001 L 0.0005 0.002 L 0.001 0.005 L 0.0025 0.01 L 0.005 0.001 L 0.0005 0.01 L 0.005 0.01 L 0.005 0.5 L 0.2512/17/2014 0.05 L 0.025 0.0068 0.0068 0.012 0.012 0.001 L 0.0005 0.001 L 0.0005 0.005 L 0.0025 0.001 L 0.0005 0.01 L 0.005 0.002 L 0.001 0.02 L 0.01 0.005 L 0.0025 0.005 L 0.0025 0.005 L 0.0025 0.005 L 0.0025 0.01 L 0.005 0.5 L 0.253/26/2015 0.05 L 0.025 0.0068 0.0068 0.01 0.01 0.001 L 0.0005 0.001 L 0.0005 0.005 L 0.0025 0.001 L 0.0005 0.01 L 0.005 0.002 L 0.001 0.02 L 0.01 0.005 L 0.0025 0.005 L 0.0025 0.005 L 0.0025 0.005 L 0.0025 0.01 L 0.005 0.5 L 0.256/8/2015 0.05 L 0.025 0.0075 0.0075 0.01 0.01 0.001 L 0.0005 0.001 L 0.0005 0.005 L 0.0025 0.001 L 0.0005 0.01 L 0.005 0.002 L 0.001 0.02 L 0.01 0.005 L 0.0025 0.005 L 0.0025 0.005 L 0.0025 0.005 L 0.0025 0.01 L 0.005 0.5 L 0.259/17/2015 0.05 L 0.025 0.0069 0.0069 0.011 0.011 0.001 L 0.0005 0.001 L 0.0005 0.005 L 0.0025 0.001 L 0.0005 0.01 L 0.005 0.002 L 0.001 0.02 L 0.01 0.005 L 0.0025 0.005 L 0.0025 0.005 L 0.0025 0.005 L 0.0025 0.01 L 0.005 0.5 L 0.2512/14/2015 0.05 L 0.025 0.0074 0.0074 0.011 0.011 0.001 L 0.0005 0.001 L 0.0005 0.005 L 0.0025 0.001 L 0.0005 0.01 L 0.005 0.002 L 0.001 0.02 L 0.01 0.005 L 0.0025 0.005 L 0.0025 0.005 L 0.0025 0.005 L 0.0025 0.01 L 0.005 0.5 L 0.25Number Analyzed 8 8 8 8 8 8 8 8 8 8 8 8 8 8 8 8Number Detected 0 8 8 0 0 0 0 0 0 0 0 0 0 0 0 0
Minimum Concentration 0.001 0.0065 0.01 0.0005 0.0005 0.001 0.0005 0.001 0.0005 0.001 0.0025 0.0025 0.0005 0.0025 0.005 0.25Maximum Concentration 0.025 0.0078 0.014 0.0005 0.0025 0.0025 0.005 0.005 0.001 0.01 0.0025 0.005 0.0025 0.005 0.005 0.25Average Concentration NC 0.00715 0.01113 NC NC NC NC NC NC NC NC NC NC NC NC NC
Variance NC 2.1E-07 1.8E-06 NC NC NC NC NC NC NC NC NC NC NC NC NCStandard Deviation NC 0.00046 0.00136 NC NC NC NC NC NC NC NC NC NC NC NC NC
oefficient of Variation (%) NC 6.38736 12.1906 NC NC NC NC NC NC NC NC NC NC NC NC NCStandard Error NC 0.00016 0.00048 NC NC NC NC NC NC NC NC NC NC NC NC NC
MW-73/26/2014 0.002 L 0.001 0.0054 0.0054 0.016 0.016 0.001 L 0.0005 0.005 L 0.0025 0.002 L 0.001 0.01 L 0.005 0.002 L 0.001 0.001 L 0.0005 0.002 L 0.001 0.005 L 0.0025 0.01 L 0.005 0.001 L 0.0005 0.01 L 0.005 0.01 L 0.005 0.5 L 0.256/26/2014 0.002 L 0.001 0.0053 0.0053 0.016 0.016 0.001 L 0.0005 0.005 L 0.0025 0.002 L 0.001 0.01 L 0.005 0.002 L 0.001 0.001 L 0.0005 0.002 L 0.001 0.005 L 0.0025 0.01 L 0.005 0.001 L 0.0005 0.01 L 0.005 0.01 L 0.005 0.5 L 0.259/17/2014 0.05 L 0.025 0.0052 0.0052 0.015 0.015 0.005 L 0.0025 0.005 L 0.0025 0.005 L 0.0025 0.01 L 0.005 0.01 L 0.005 0.002 L 0.001 0.02 L 0.01 0.005 L 0.0025 0.01 L 0.005 0.005 L 0.0025 0.01 L 0.005 0.01 L 0.005 0.5 L 0.2512/16/2014 0.05 L 0.025 0.005 0.005 0.014 0.014 0.001 L 0.0005 0.001 L 0.0005 0.005 L 0.0025 0.001 L 0.0005 0.01 L 0.005 0.002 L 0.001 0.02 L 0.01 0.005 L 0.0025 0.005 L 0.0025 0.005 L 0.0025 0.005 L 0.0025 0.01 L 0.005 0.5 L 0.253/24/2015 0.05 L 0.025 0.005 L 0.0025 0.015 0.015 0.001 L 0.0005 0.001 L 0.0005 0.005 L 0.0025 0.001 L 0.0005 0.01 L 0.005 0.002 L 0.001 0.02 L 0.01 0.005 L 0.0025 0.005 L 0.0025 0.005 L 0.0025 0.005 L 0.0025 0.01 L 0.005 0.5 L 0.256/9/2015 0.05 L 0.025 0.0054 0.0054 0.015 0.015 0.001 L 0.0005 0.001 L 0.0005 0.005 L 0.0025 0.001 L 0.0005 0.01 L 0.005 0.002 L 0.001 0.02 L 0.01 0.005 L 0.0025 0.005 L 0.0025 0.005 L 0.0025 0.005 L 0.0025 0.01 L 0.005 0.5 L 0.259/17/2015 0.05 L 0.025 0.005 L 0.0025 0.012 0.012 0.001 L 0.0005 0.001 L 0.0005 0.005 L 0.0025 0.001 L 0.0005 0.01 L 0.005 0.002 L 0.001 0.02 L 0.01 0.005 L 0.0025 0.005 L 0.0025 0.005 L 0.0025 0.005 L 0.0025 0.01 L 0.005 0.5 L 0.2512/15/2015 0.05 L 0.025 0.0055 0.0055 0.016 0.016 0.001 L 0.0005 0.001 L 0.0005 0.005 L 0.0025 0.001 L 0.0005 0.01 L 0.005 0.002 L 0.001 0.02 L 0.01 0.005 L 0.0025 0.005 L 0.0025 0.005 L 0.0025 0.005 L 0.0025 0.01 L 0.005 0.5 L 0.25Number Analyzed 8 8 8 8 8 8 8 8 8 8 8 8 8 8 8 8Number Detected 0 6 8 0 0 0 0 0 0 0 0 0 0 0 0 0
Minimum Concentration 0.001 0.0025 0.012 0.0005 0.0005 0.001 0.0005 0.001 0.0005 0.001 0.0025 0.0025 0.0005 0.0025 0.005 0.25Maximum Concentration 0.025 0.0055 0.016 0.0025 0.0025 0.0025 0.005 0.005 0.001 0.01 0.0025 0.005 0.0025 0.005 0.005 0.25Average Concentration NC 0.0046 0.01488 NC NC NC NC NC NC NC NC NC NC NC NC NC
Variance NC 1.7E-06 1.8E-06 NC NC NC NC NC NC NC NC NC NC NC NC NCStandard Deviation NC 0.0013 0.00136 NC NC NC NC NC NC NC NC NC NC NC NC NC
oefficient of Variation (%) NC 28.3682 9.11733 NC NC NC NC NC NC NC NC NC NC NC NC NCStandard Error NC 0.00046 0.00048 NC NC NC NC NC NC NC NC NC NC NC NC NC

Statistical Summary of Total Metals Groundwater Data Appendix I Parameters, Second Quarter 2019
LRI Landfill, Pierce County, Washington
LRILF 2Q19 Prediction Limits 8/14/2019 Page 3 of 3 SCS ENGINEERS
Location IDMonitoring Date Result Conc. Result Conc. Result Conc. Result Conc. Result Conc. Result Conc. Result Conc. Result Conc. Result Conc. Result Conc. Result Conc. Result Conc. Result Conc. Result Conc. Result Conc. Result Conc.
Nitrate (NO3)Zinc (Zn)Vanadium (V)Thallium (Tl)Silver (Ag)Antimony (Sb) Selenium (Se)Cadmium (Cd)Beryllium (Be)Barium (Ba)Arsenic (As) Nickel (Ni)Lead (Pb)Copper (Cu)Cobalt (Co)Chromium (Cr)
MW-93/25/2014 0.002 L 0.001 0.005 L 0.0025 0.0047 0.0047 0.001 L 0.0005 0.005 L 0.0025 0.002 L 0.001 0.01 L 0.005 0.002 L 0.001 0.001 L 0.0005 0.002 L 0.001 0.005 L 0.0025 0.01 L 0.005 0.001 L 0.0005 0.016 0.016 0.01 0.01 0.5 L 0.256/24/2014 0.002 L 0.001 0.005 L 0.0025 0.0045 0.0045 0.001 L 0.0005 0.005 L 0.0025 0.002 L 0.001 0.01 L 0.005 0.002 L 0.001 0.001 L 0.0005 0.002 L 0.001 0.005 L 0.0025 0.01 L 0.005 0.001 L 0.0005 0.016 0.016 0.01 L 0.005 0.5 L 0.259/18/2014 0.002 L 0.001 0.005 L 0.0025 0.0057 0.0057 0.001 L 0.0005 0.005 L 0.0025 0.002 L 0.001 0.01 L 0.005 0.002 L 0.001 0.001 L 0.0005 0.002 L 0.001 0.005 L 0.0025 0.01 L 0.005 0.001 L 0.0005 0.014 0.014 0.014 0.014 0.5 L 0.2512/17/2014 0.05 L 0.025 0.005 L 0.0025 0.005 L 0.0025 0.001 L 0.0005 0.001 L 0.0005 0.005 L 0.0025 0.001 L 0.0005 0.01 L 0.005 0.002 L 0.001 0.02 L 0.01 0.005 L 0.0025 0.005 L 0.0025 0.005 L 0.0025 0.014 0.014 0.01 L 0.005 0.5 L 0.253/24/2015 0.05 L 0.025 0.005 L 0.0025 0.005 L 0.0025 0.001 L 0.0005 0.001 L 0.0005 0.005 L 0.0025 0.001 L 0.0005 0.01 L 0.005 0.002 L 0.001 0.02 L 0.01 0.005 L 0.0025 0.005 L 0.0025 0.005 L 0.0025 0.013 0.013 0.01 L 0.005 0.5 L 0.256/9/2015 0.05 L 0.025 0.005 L 0.0025 0.005 L 0.0025 0.001 L 0.0005 0.001 L 0.0005 0.005 L 0.0025 0.001 L 0.0005 0.01 L 0.005 0.002 L 0.001 0.02 L 0.01 0.005 L 0.0025 0.005 L 0.0025 0.005 L 0.0025 0.014 0.014 0.01 L 0.005 0.5 L 0.259/18/2015 0.05 L 0.025 0.005 L 0.0025 0.005 0.005 0.001 L 0.0005 0.001 L 0.0005 0.005 L 0.0025 0.001 L 0.0005 0.01 L 0.005 0.002 L 0.001 0.02 L 0.01 0.005 L 0.0025 0.005 L 0.0025 0.005 L 0.0025 0.014 0.014 0.01 L 0.005 0.5 L 0.2512/16/2015 0.05 L 0.025 0.005 L 0.0025 0.005 L 0.0025 0.001 L 0.0005 0.001 L 0.0005 0.005 L 0.0025 0.001 L 0.0005 0.01 L 0.005 0.002 L 0.001 0.02 L 0.01 0.005 L 0.0025 0.005 L 0.0025 0.005 L 0.0025 0.014 0.014 0.042 0.042 0.5 L 0.253/22/2016 0.05 L 0.025 0.005 L 0.0025 0.005 L 0.0025 0.001 L 0.0005 0.001 L 0.0005 0.005 L 0.0025 0.001 L 0.0005 0.01 L 0.005 0.002 L 0.001 0.02 L 0.01 0.005 L 0.0025 0.005 L 0.0025 0.005 L 0.0025 0.014 0.014 0.028 0.028 0.5 L 0.256/8/2016 0.05 L 0.025 0.005 L 0.0025 0.005 0.005 0.001 L 0.0005 0.001 L 0.0005 0.005 L 0.0025 0.001 L 0.0005 0.01 L 0.005 0.002 L 0.001 0.02 L 0.01 0.005 L 0.0025 0.005 L 0.0025 0.005 L 0.0025 0.014 0.014 0.023 0.023 0.5 L 0.259/16/2016 0.05 L 0.025 0.005 L 0.0025 0.005 L 0.0025 0.001 L 0.0005 0.001 L 0.0005 0.005 L 0.0025 0.001 L 0.0005 0.01 L 0.005 0.002 L 0.001 0.02 L 0.01 0.005 L 0.0025 0.005 L 0.0025 0.005 L 0.0025 0.015 0.015 0.043 0.043 0.5 L 0.2512/6/2016 0.05 L 0.025 0.005 L 0.0025 0.005 L 0.0025 0.001 L 0.0005 0.001 L 0.0005 0.005 L 0.0025 0.001 L 0.0005 0.01 L 0.005 0.002 L 0.001 0.02 L 0.01 0.005 L 0.0025 0.005 L 0.0025 0.005 L 0.0025 0.014 0.014 0.01 L 0.005 0.5 L 0.253/29/2017 0.05 L 0.025 0.005 L 0.0025 0.0056 0.0056 0.001 L 0.0005 0.001 L 0.0005 0.005 L 0.0025 0.001 L 0.0005 0.01 L 0.005 0.002 L 0.001 0.02 L 0.01 0.005 L 0.0025 0.005 L 0.0025 0.005 L 0.0025 0.014 0.014 0.01 L 0.005 0.5 L 0.256/22/2017 0.05 L 0.025 0.005 L 0.0025 0.005 L 0.0025 0.001 L 0.0005 0.001 L 0.0005 0.005 L 0.0025 0.001 L 0.0005 0.01 L 0.005 0.002 L 0.001 0.02 L 0.01 0.005 L 0.0025 0.005 L 0.0025 0.005 L 0.0025 0.014 0.014 0.01 L 0.005 0.5 L 0.259/26/2017 0.05 L 0.025 0.005 L 0.0025 0.005 L 0.0025 0.001 L 0.0005 0.001 L 0.0005 0.005 L 0.0025 0.001 L 0.0005 0.01 L 0.005 0.002 L 0.001 0.02 L 0.01 0.005 L 0.0025 0.005 L 0.0025 0.005 L 0.0025 0.012 0.012 0.01 L 0.005 0.5 L 0.2512/13/2017 0.05 L 0.025 0.005 L 0.0025 0.005 L 0.0025 0.001 L 0.0005 0.001 L 0.0005 0.005 L 0.0025 0.001 L 0.0005 0.01 L 0.005 0.002 L 0.001 0.02 L 0.01 0.005 L 0.0025 0.005 L 0.0025 0.005 L 0.0025 0.013 0.013 0.01 L 0.005 0.5 L 0.253/21/2018 0.05 L 0.025 0.005 L 0.0025 0.005 L 0.0025 0.001 L 0.0005 0.001 L 0.0005 0.005 L 0.0025 0.001 L 0.0005 0.01 L 0.005 0.002 L 0.001 0.02 L 0.01 0.005 L 0.0025 0.005 L 0.0025 0.005 L 0.0025 0.016 0.016 0.01 L 0.005 0.5 L 0.256/19/2018 0.05 L 0.025 0.005 L 0.0025 0.005 L 0.0025 0.001 L 0.0005 0.001 L 0.0005 0.005 L 0.0025 0.001 L 0.0005 0.01 L 0.005 0.002 L 0.001 0.02 L 0.01 0.005 L 0.0025 0.005 L 0.0025 0.005 L 0.0025 0.013 0.013 0.01 L 0.005 0.5 L 0.259/19/2018 0.05 L 0.025 0.005 L 0.0025 0.005 L 0.0025 0.001 L 0.0005 0.001 L 0.0005 0.005 L 0.0025 0.001 L 0.0005 0.01 L 0.005 0.002 L 0.001 0.02 L 0.01 0.005 L 0.0025 0.005 L 0.0025 0.005 L 0.0025 0.013 0.013 0.01 L 0.005 0.5 L 0.2512/4/2018 0.05 L 0.025 0.005 L 0.0025 0.0051 0.0051 0.001 L 0.0005 0.001 L 0.0005 0.005 L 0.0025 0.001 L 0.0005 0.01 L 0.005 0.002 L 0.001 0.02 L 0.01 0.005 L 0.0025 0.005 L 0.0025 0.005 L 0.0025 0.014 0.014 0.01 L 0.005 0.5 L 0.253/11/2019 0.05 L 0.025 0.005 L 0.0025 0.005 L 0.0025 0.001 L 0.0005 0.001 L 0.0005 0.005 L 0.0025 0.001 L 0.0005 0.01 L 0.005 0.002 L 0.001 0.02 L 0.01 0.005 L 0.0025 0.005 L 0.0025 0.005 L 0.0025 0.014 0.014 0.01 L 0.005 0.5 L 0.256/19/2019 0.05 L 0.025 0.005 L 0.0025 0.0051 0.0051 0.001 L 0.0005 0.001 L 0.0005 0.005 L 0.0025 0.001 L 0.0005 0.01 L 0.005 0.002 L 0.001 0.02 L 0.01 0.005 L 0.0025 0.005 L 0.0025 0.005 L 0.0025 0.013 0.013 0.01 L 0.005 0.5 L 0.25Number Analyzed 22 22 22 22 22 22 22 22 22 22 22 22 22 22 22 22Number Detected 0 0 8 0 0 0 0 0 0 0 0 0 0 22 6 0
Minimum Concentration 0.001 0.0025 0.0025 0.0005 0.0005 0.001 0.0005 0.001 0.0005 0.001 0.0025 0.0025 0.0005 0.012 0.005 0.25Maximum Concentration 0.025 0.0025 0.0057 0.0005 0.0025 0.0025 0.005 0.005 0.001 0.01 0.0025 0.005 0.0025 0.016 0.043 0.25Average Concentration NC NC NC NC NC NC NC NC NC NC NC NC NC 0.014 NC NC
Variance NC NC NC NC NC NC NC NC NC NC NC NC NC 1E-06 NC NCStandard Deviation NC NC NC NC NC NC NC NC NC NC NC NC NC 0.00102 NC NC
oefficient of Variation (%) NC NC NC NC NC NC NC NC NC NC NC NC NC 7.31095 NC NCStandard Error NC NC NC NC NC NC NC NC NC NC NC NC NC 0.00022 NC NC
MW-103/25/2014 0.002 L 0.001 0.005 L 0.0025 0.014 0.014 0.001 L 0.0005 0.005 L 0.0025 0.002 L 0.001 0.01 L 0.005 0.002 L 0.001 0.001 L 0.0005 0.002 L 0.001 0.005 L 0.0025 0.01 L 0.005 0.001 L 0.0005 0.01 L 0.005 0.01 L 0.005 6.4 6.46/25/2014 0.002 L 0.001 0.005 L 0.0025 0.014 0.014 0.001 L 0.0005 0.005 L 0.0025 0.002 L 0.001 0.01 L 0.005 0.002 L 0.001 0.001 L 0.0005 0.002 L 0.001 0.005 L 0.0025 0.01 L 0.005 0.001 L 0.0005 0.01 L 0.005 0.01 0.01 5.8 5.89/16/2014 0.05 L 0.025 0.005 L 0.0025 0.015 0.015 0.005 L 0.0025 0.005 L 0.0025 0.005 L 0.0025 0.01 L 0.005 0.01 L 0.005 0.002 L 0.001 0.02 L 0.01 0.005 L 0.0025 0.01 L 0.005 0.005 L 0.0025 0.01 L 0.005 0.011 0.011 5.4 5.412/17/2014 0.05 L 0.025 0.005 L 0.0025 0.013 0.013 0.001 L 0.0005 0.001 L 0.0005 0.005 L 0.0025 0.001 L 0.0005 0.01 L 0.005 0.002 L 0.001 0.02 L 0.01 0.005 L 0.0025 0.005 L 0.0025 0.005 L 0.0025 0.005 L 0.0025 0.01 L 0.005 5.3 5.33/25/2015 0.05 L 0.025 0.005 L 0.0025 0.013 0.013 0.001 L 0.0005 0.001 L 0.0005 0.005 L 0.0025 0.001 L 0.0005 0.01 L 0.005 0.002 L 0.001 0.02 L 0.01 0.005 L 0.0025 0.005 L 0.0025 0.005 L 0.0025 0.005 L 0.0025 0.01 L 0.005 5.9 5.96/8/2015 0.05 L 0.025 0.005 L 0.0025 0.014 0.014 0.001 L 0.0005 0.001 L 0.0005 0.005 L 0.0025 0.001 L 0.0005 0.01 L 0.005 0.002 L 0.001 0.02 L 0.01 0.005 L 0.0025 0.005 L 0.0025 0.005 L 0.0025 0.005 L 0.0025 0.01 L 0.005 5.7 5.79/15/2015 0.05 L 0.025 0.005 L 0.0025 0.013 0.013 0.001 L 0.0005 0.001 L 0.0005 0.005 L 0.0025 0.001 L 0.0005 0.01 L 0.005 0.002 L 0.001 0.02 L 0.01 0.005 L 0.0025 0.005 L 0.0025 0.005 L 0.0025 0.005 L 0.0025 0.01 L 0.005 5.1 5.112/16/2015 0.05 L 0.025 0.005 L 0.0025 0.013 0.013 0.001 L 0.0005 0.001 L 0.0005 0.005 L 0.0025 0.001 L 0.0005 0.01 L 0.005 0.002 L 0.001 0.02 L 0.01 0.005 L 0.0025 0.005 L 0.0025 0.005 L 0.0025 0.005 L 0.0025 0.01 L 0.005 4.9 4.93/21/2016 0.05 L 0.025 0.005 L 0.0025 0.013 0.013 0.001 L 0.0005 0.001 L 0.0005 0.005 L 0.0025 0.001 L 0.0005 0.01 L 0.005 0.002 L 0.001 0.02 L 0.01 0.005 L 0.0025 0.005 L 0.0025 0.005 L 0.0025 0.005 L 0.0025 0.01 L 0.005 5.9 5.96/6/2016 0.05 L 0.025 0.005 L 0.0025 0.012 0.012 0.001 L 0.0005 0.001 L 0.0005 0.005 L 0.0025 0.001 L 0.0005 0.01 L 0.005 0.002 L 0.001 0.02 L 0.01 0.005 L 0.0025 0.005 L 0.0025 0.005 L 0.0025 0.005 L 0.0025 0.01 L 0.005 5.9 5.99/15/2016 0.05 L 0.025 0.005 L 0.0025 0.014 0.014 0.001 L 0.0005 0.001 L 0.0005 0.005 L 0.0025 0.001 L 0.0005 0.01 L 0.005 0.002 L 0.001 0.02 L 0.01 0.005 L 0.0025 0.005 L 0.0025 0.005 L 0.0025 0.005 L 0.0025 0.01 L 0.005 5.4 5.412/6/2016 0.05 L 0.025 0.005 L 0.0025 0.013 0.013 0.001 L 0.0005 0.001 L 0.0005 0.005 L 0.0025 0.001 L 0.0005 0.01 L 0.005 0.002 L 0.001 0.02 L 0.01 0.005 L 0.0025 0.005 L 0.0025 0.005 L 0.0025 0.005 L 0.0025 0.01 L 0.005 5.2 5.23/29/2017 0.05 L 0.025 0.005 L 0.0025 0.013 0.013 0.001 L 0.0005 0.001 L 0.0005 0.005 L 0.0025 0.001 L 0.0005 0.01 L 0.005 0.002 L 0.001 0.02 L 0.01 0.005 L 0.0025 0.005 L 0.0025 0.005 L 0.0025 0.005 L 0.0025 0.01 L 0.005 5.8 5.86/19/2017 0.05 L 0.025 0.005 L 0.0025 0.013 0.013 0.001 L 0.0005 0.001 L 0.0005 0.005 L 0.0025 0.001 L 0.0005 0.01 L 0.005 0.002 L 0.001 0.02 L 0.01 0.005 L 0.0025 0.005 L 0.0025 0.005 L 0.0025 0.005 L 0.0025 0.01 L 0.005 5.5 5.59/26/2017 0.05 L 0.025 0.005 L 0.0025 0.012 0.012 0.001 L 0.0005 0.001 L 0.0005 0.005 L 0.0025 0.001 L 0.0005 0.01 L 0.005 0.002 L 0.001 0.02 L 0.01 0.005 L 0.0025 0.005 L 0.0025 0.005 L 0.0025 0.005 L 0.0025 0.01 L 0.005 5.2 5.212/12/2017 0.05 L 0.025 0.005 L 0.0025 0.013 0.013 0.001 L 0.0005 0.001 L 0.0005 0.005 L 0.0025 0.001 L 0.0005 0.01 L 0.005 0.002 L 0.001 0.02 L 0.01 0.005 L 0.0025 0.005 L 0.0025 0.005 L 0.0025 0.005 L 0.0025 0.01 L 0.005 4.9 4.93/20/2018 0.05 L 0.025 0.005 L 0.0025 0.013 0.013 0.001 L 0.0005 0.001 L 0.0005 0.005 L 0.0025 0.001 L 0.0005 0.01 L 0.005 0.002 L 0.001 0.02 L 0.01 0.005 L 0.0025 0.005 L 0.0025 0.005 L 0.0025 0.005 L 0.0025 0.01 L 0.005 5.3 5.36/18/2018 0.05 L 0.025 0.005 L 0.0025 0.013 0.013 0.001 L 0.0005 0.001 L 0.0005 0.005 L 0.0025 0.001 L 0.0005 0.01 L 0.005 0.002 L 0.001 0.02 L 0.01 0.005 L 0.0025 0.005 L 0.0025 0.005 L 0.0025 0.005 L 0.0025 0.01 L 0.005 5.0 5.09/18/2018 0.05 L 0.025 0.005 L 0.0025 0.016 0.016 0.001 L 0.0005 0.001 L 0.0005 0.005 L 0.0025 0.001 L 0.0005 0.01 L 0.005 0.002 L 0.001 0.02 L 0.01 0.005 L 0.0025 0.005 L 0.0025 0.005 L 0.0025 0.005 L 0.0025 0.01 L 0.005 4.7 4.712/4/2018 0.05 L 0.025 0.005 L 0.0025 0.013 0.013 0.001 L 0.0005 0.001 L 0.0005 0.005 L 0.0025 0.001 L 0.0005 0.01 L 0.005 0.002 L 0.001 0.02 L 0.01 0.005 L 0.0025 0.005 L 0.0025 0.005 L 0.0025 0.005 L 0.0025 0.01 L 0.005 4.3 4.33/12/2019 0.05 L 0.025 0.005 L 0.0025 0.013 0.013 0.001 L 0.0005 0.001 L 0.0005 0.005 L 0.0025 0.001 L 0.0005 0.01 L 0.005 0.002 L 0.001 0.02 L 0.01 0.005 L 0.0025 0.005 L 0.0025 0.005 L 0.0025 0.005 L 0.0025 0.01 L 0.005 4.4 4.46/17/2019 0.05 L 0.025 0.005 L 0.0025 0.015 0.015 0.001 L 0.0005 0.001 L 0.0005 0.005 L 0.0025 0.001 L 0.0005 0.01 L 0.005 0.002 L 0.001 0.02 L 0.01 0.005 L 0.0025 0.005 L 0.0025 0.005 L 0.0025 0.005 L 0.0025 0.01 L 0.005 4.7 4.7Number Analyzed 22 22 22 22 22 22 22 22 22 22 22 22 22 22 22 22Number Detected 0 0 22 0 0 0 0 0 0 0 0 0 0 0 2 22
Minimum Concentration 0.001 0.0025 0.012 0.0005 0.0005 0.001 0.0005 0.001 0.0005 0.001 0.0025 0.0025 0.0005 0.0025 0.005 4.3Maximum Concentration 0.025 0.0025 0.016 0.0025 0.0025 0.0025 0.005 0.005 0.001 0.01 0.0025 0.005 0.0025 0.005 0.011 6.4Average Concentration NC NC 0.01341 NC NC NC NC NC NC NC NC NC NC NC NC 5.304545
Variance NC NC 9.2E-07 NC NC NC NC NC NC NC NC NC NC NC NC 0.286169Standard Deviation NC NC 0.00096 NC NC NC NC NC NC NC NC NC NC NC NC 0.534948
oefficient of Variation (%) NC NC 7.15277 NC NC NC NC NC NC NC NC NC NC NC NC 10.0847Standard Error NC NC 0.0002 NC NC NC NC NC NC NC NC NC NC NC NC 0.114051
Notes: Metals results are for total metals.mg/L = milligrams per liter.L = not reported at or above the MRL (Method Reporting Limit).One-half the MRL value used for statistical calculations when concentrations not reported at or above the MRL.NC = not calculated due to insufficient number of reported detections.


LRI Landfill Second Quarter 2019 Report www.scsengineers.com
Appendix E
Trilinear Diagrams

LRI LF 2Q19 Groundwater Piper DiagramDESCRIPTION:
PROJECT: PROJECT NO:LRI Landfill 04219001.02
CLIENT: DATE:LRI, Inc. August 2019
80 60 40 20 20 40 60 80
20
40
60
80
20
40
60
80
20
40
60
80
20
40
60
80
Ca Na+K HCO3+CO3 Cl
Mg SO4
<=HCO3+CO3
Na+K=>
<=Ca + MgCl
+ SO4=>
Second Quarter 2019, Groundwater Monitoring Wells
MW-1
MW-10
MW-2A
MW-3
MW-4
MW-5A
MW-6
MW-7
MW-9
MW-1
MW-10
MW-2A
MW-3
MW-4
MW-5A
MW-6
MW-7
MW-9

LRI LF 2Q19 LDCRS Piper DiagramDESCRIPTION:
PROJECT: PROJECT NO:LRI Landfill 04219001.02
CLIENT: DATE:LRI, Inc. August 2019
80 60 40 20 20 40 60 80
20
40
60
80
20
40
60
80
20
40
60
80
20
40
60
80
Ca Na+K HCO3+CO3 Cl
Mg SO4
<=HCO3+CO3
Na+K=>
<=Ca + MgCl
+ SO4=>
Second Quarter 2019, Leak Detection Collection Recovery System
LDCS-1
LDCS-2A
LDCS-2B
LDCS-3A
LDCS-4A
LDCS-4B
LDCS-5
LDCS-6
LDCS-5 Resample
LDCS-1
LDCS-2A
LDCS-2B
LDCS-3A
LDCS-4A
LDCS-4B
LDCS-5
LDCS-6
LDCS-5 Resample

LRILF Leachate 4Q18 Piper PlotDESCRIPTION:
PROJECT: PROJECT NO:LRI Landfill 04219001.02
CLIENT: DATE:LRI, Inc. March 2019
80 60 40 20 20 40 60 80
20
40
60
80
20
40
60
80
20
40
60
80
20
40
60
80
Ca Na+K HCO3+CO3 Cl
Mg SO4
<=HCO3+CO3
Na+K=>
<=Ca + MgCl
+ SO4=>
LRI Landfill Fourth Quarter 2018, Leachate
Leachate, Cell 1
Leachate, Cell 2A
Leachate, Cell 2B
Leachate, Cell 3A
Leachate, Cell 4A
Leachate, Cell 4B
Leachate, Cell 5
Leachate, Cell 6
Leachate, Cell 1
Leachate, Cell 2A
Leachate, Cell 2B
Leachate, Cell 3A
Leachate, Cell 4A
Leachate, Cell 4B
Leachate, Cell 5
Leachate, Cell 6


LRI Landfill Second Quarter 2019 Report www.scsengineers.com
Appendix F
Analytical Data Validation Report
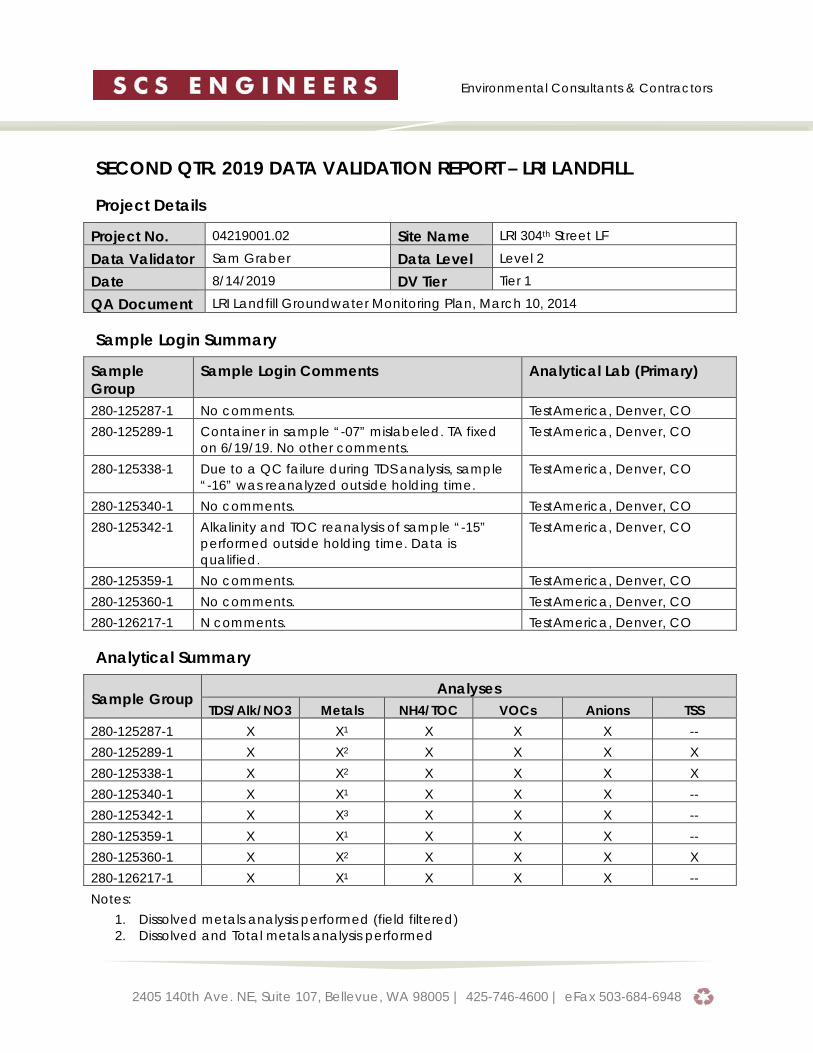
2405 140th Ave. NE, Suite 107, Bellevue, WA 98005 | 425-746-4600 | eFax 503-684-6948
Environmental Consultants & Contractors
SECOND QTR. 2019 DATA VALIDATION REPORT – LRI LANDFILL
Project Details
Project No. 04219001.02 Site Name LRI 304th Street LF
Data Validator Sam Graber Data Level Level 2
Date 8/14/2019 DV Tier Tier 1
QA Document LRI Landfill Groundwater Monitoring Plan, March 10, 2014
Sample Login Summary
Sample Group
Sample Login Comments Analytical Lab (Primary)
280-125287-1 No comments. TestAmerica, Denver, CO 280-125289-1 Container in sample “-07” mislabeled. TA fixed
on 6/19/19. No other comments. TestAmerica, Denver, CO
280-125338-1 Due to a QC failure during TDS analysis, sample “-16” was reanalyzed outside holding time.
TestAmerica, Denver, CO
280-125340-1 No comments. TestAmerica, Denver, CO 280-125342-1 Alkalinity and TOC reanalysis of sample “-15”
performed outside holding time. Data is qualified.
TestAmerica, Denver, CO
280-125359-1 No comments. TestAmerica, Denver, CO 280-125360-1 No comments. TestAmerica, Denver, CO 280-126217-1 N comments. TestAmerica, Denver, CO
Analytical Summary
Sample Group Analyses
TDS/Alk/NO3 Metals NH4/TOC VOCs Anions TSS 280-125287-1 X X1 X X X -- 280-125289-1 X X2 X X X X 280-125338-1 X X2 X X X X 280-125340-1 X X1 X X X -- 280-125342-1 X X3 X X X -- 280-125359-1 X X1 X X X -- 280-125360-1 X X2 X X X X 280-126217-1 X X1 X X X -- Notes:
1. Dissolved metals analysis performed (field filtered) 2. Dissolved and Total metals analysis performed
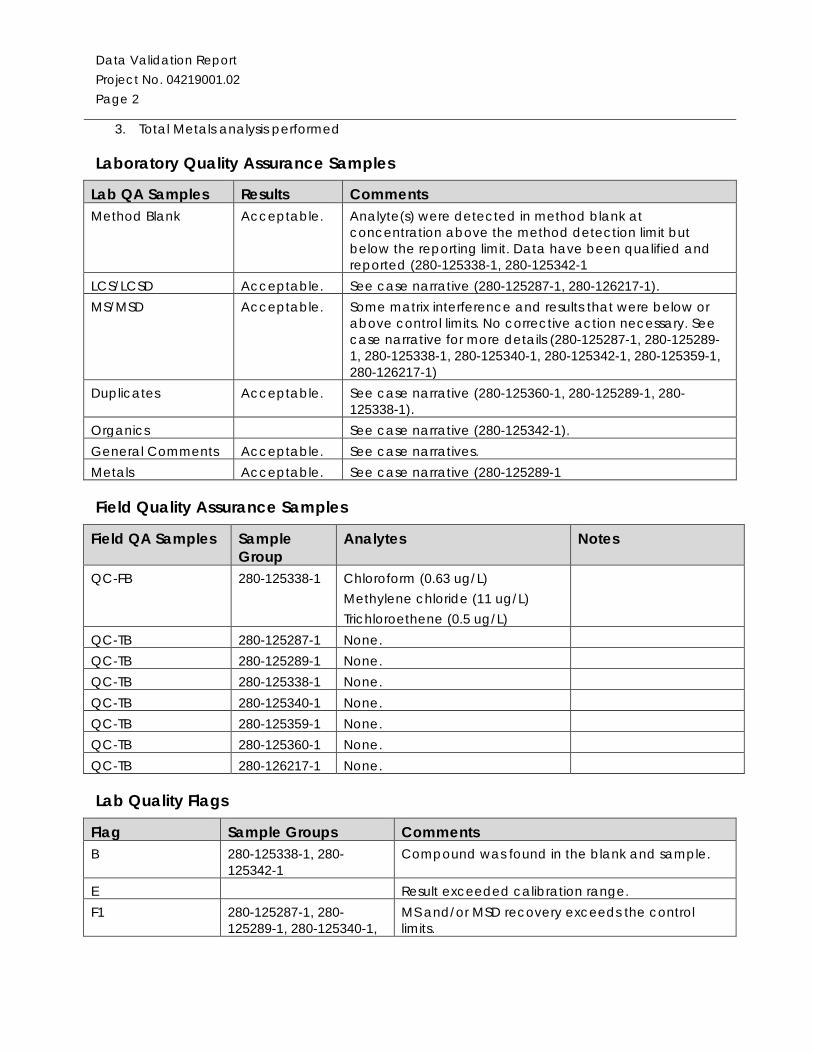
Data Validation Report Project No. 04219001.02 Page 2
3. Total Metals analysis performed
Laboratory Quality Assurance Samples
Lab QA Samples Results Comments Method Blank Acceptable. Analyte(s) were detected in method blank at
concentration above the method detection limit but below the reporting limit. Data have been qualified and reported (280-125338-1, 280-125342-1
LCS/LCSD Acceptable. See case narrative (280-125287-1, 280-126217-1). MS/MSD Acceptable. Some matrix interference and results that were below or
above control limits. No corrective action necessary. See case narrative for more details (280-125287-1, 280-125289-1, 280-125338-1, 280-125340-1, 280-125342-1, 280-125359-1, 280-126217-1)
Duplicates Acceptable. See case narrative (280-125360-1, 280-125289-1, 280-125338-1).
Organics See case narrative (280-125342-1). General Comments Acceptable. See case narratives. Metals Acceptable. See case narrative (280-125289-1
Field Quality Assurance Samples
Lab Quality Flags
Field QA Samples Sample Group
Analytes Notes
QC-FB 280-125338-1 Chloroform (0.63 ug/L) Methylene chloride (11 ug/L) Trichloroethene (0.5 ug/L)
QC-TB 280-125287-1 None. QC-TB 280-125289-1 None. QC-TB 280-125338-1 None. QC-TB 280-125340-1 None. QC-TB 280-125359-1 None. QC-TB 280-125360-1 None. QC-TB 280-126217-1 None.
Flag Sample Groups Comments B 280-125338-1, 280-
125342-1 Compound was found in the blank and sample.
E Result exceeded calibration range. F1 280-125287-1, 280-
125289-1, 280-125340-1, MS and/or MSD recovery exceeds the control limits.
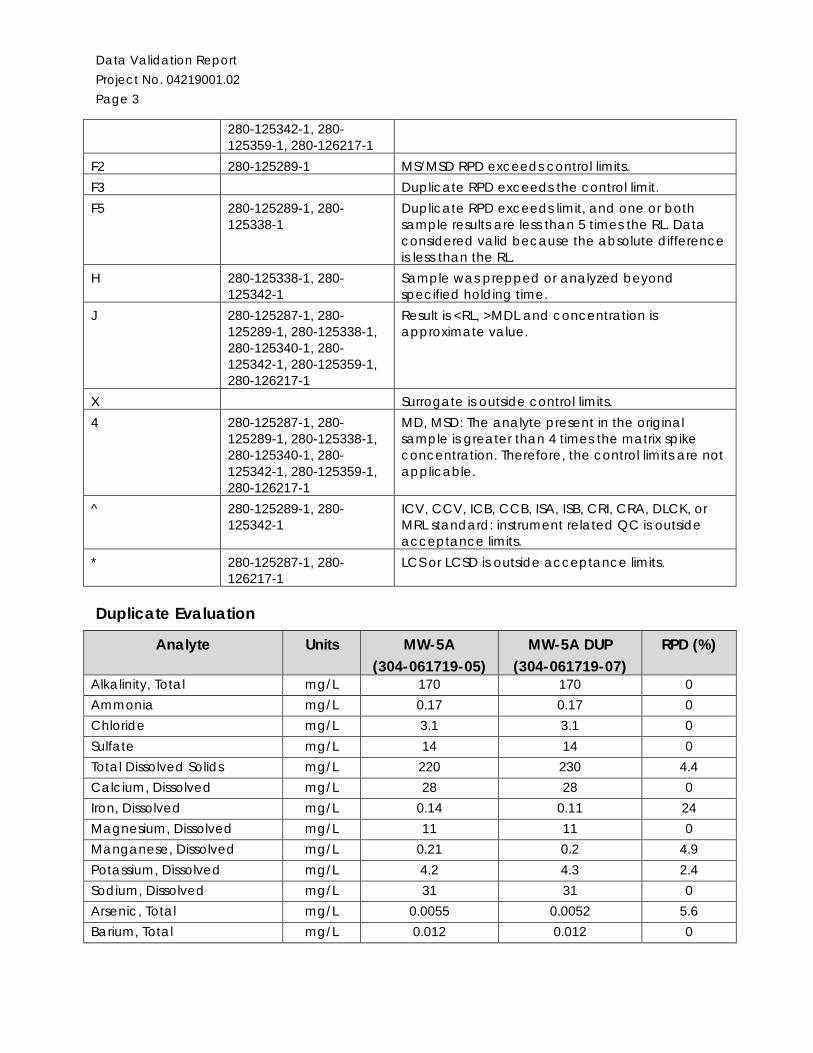
Data Validation Report Project No. 04219001.02 Page 3
Duplicate Evaluation
Analyte Units MW-5A (304-061719-05)
MW-5A DUP (304-061719-07)
RPD (%)
Alkalinity, Total mg/L 170 170 0 Ammonia mg/L 0.17 0.17 0 Chloride mg/L 3.1 3.1 0 Sulfate mg/L 14 14 0 Total Dissolved Solids mg/L 220 230 4.4 Calcium, Dissolved mg/L 28 28 0 Iron, Dissolved mg/L 0.14 0.11 24 Magnesium, Dissolved mg/L 11 11 0 Manganese, Dissolved mg/L 0.21 0.2 4.9 Potassium, Dissolved mg/L 4.2 4.3 2.4 Sodium, Dissolved mg/L 31 31 0 Arsenic, Total mg/L 0.0055 0.0052 5.6 Barium, Total mg/L 0.012 0.012 0
280-125342-1, 280-125359-1, 280-126217-1
F2 280-125289-1 MS/MSD RPD exceeds control limits. F3 Duplicate RPD exceeds the control limit. F5 280-125289-1, 280-
125338-1 Duplicate RPD exceeds limit, and one or both sample results are less than 5 times the RL. Data considered valid because the absolute difference is less than the RL.
H 280-125338-1, 280-125342-1
Sample was prepped or analyzed beyond specified holding time.
J 280-125287-1, 280-125289-1, 280-125338-1, 280-125340-1, 280-125342-1, 280-125359-1, 280-126217-1
Result is <RL, >MDL and concentration is approximate value.
X Surrogate is outside control limits. 4 280-125287-1, 280-
125289-1, 280-125338-1, 280-125340-1, 280-125342-1, 280-125359-1, 280-126217-1
MD, MSD: The analyte present in the original sample is greater than 4 times the matrix spike concentration. Therefore, the control limits are not applicable.
^ 280-125289-1, 280-125342-1
ICV, CCV, ICB, CCB, ISA, ISB, CRI, CRA, DLCK, or MRL standard: instrument related QC is outside acceptance limits.
* 280-125287-1, 280-126217-1
LCS or LCSD is outside acceptance limits.

Data Validation Report Project No. 04219001.02 Page 4
Analyte Units MW-5A (304-061719-05)
MW-5A DUP (304-061719-07)
RPD (%)
U = Non-detection. Reporting limit (RL) used for calculation of RPD.
Additional Data Flags
Qualified Data and Usability Lab qualifiers are noted. All data, as qualified, are acceptable for use.
Flag Description U Not detected above the method reporting limit.

LRI Landfill Second Quarter 2019 Report www.scsengineers.com
Appendix G
Groundwater and LDCS Time Trend Plots

0
2
4
6
8
10
12
14
16
18
20
Con
cent
ratio
n (m
g/L)
MW-1ALRI Landfill, Pierce County, Washington
NitrateAmmoniaChlorideTOC

0
2
4
6
8
10
12
14
16
18
20
Con
cent
ratio
n (m
g/L)
MW-2ALRI Landfill, Pierce County, Washington
NitrateAmmoniaChlorideTOC

0
2
4
6
8
10
12
14
16
18
20
Con
cent
ratio
n (m
g/L)
MW-3LRI Landfill, Pierce County, Washington
NitrateAmmoniaChlorideTOC
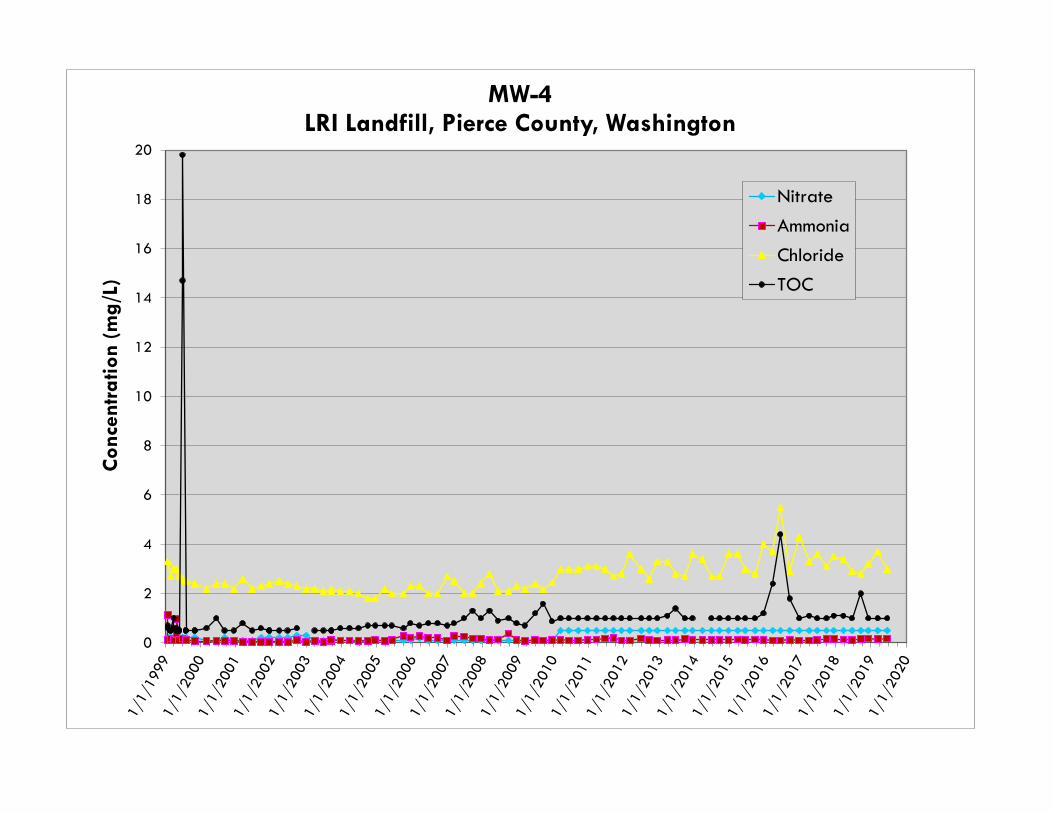
0
2
4
6
8
10
12
14
16
18
20
Con
cent
ratio
n (m
g/L)
MW-4LRI Landfill, Pierce County, Washington
NitrateAmmoniaChlorideTOC

0
2
4
6
8
10
12
14
16
18
20
Con
cent
ratio
n (m
g/L)
MW-5ALRI Landfill, Pierce County, Washington
NitrateAmmoniaChlorideTOC

0
2
4
6
8
10
12
14
16
18
20
Con
cent
ratio
n (m
g/L)
MW-6LRI Landfill, Pierce County, Washington
NitrateAmmoniaChlorideTOC

0
2
4
6
8
10
12
14
16
18
20
Con
cent
ratio
n (m
g/L)
MW-7LRI Landfill, Pierce County, Washington
NitrateAmmoniaChlorideTOC

0
2
4
6
8
10
12
14
16
18
20
Con
cent
ratio
n (m
g/L)
MW-9 (Background)LRI Landfill, Pierce County, Washington
NitrateAmmoniaChlorideTOC

0
2
4
6
8
10
12
14
16
18
20
Con
cent
ratio
n (m
g/L)
MW-10 (Background)LRI Landfill, Pierce County, Washington
NitrateAmmoniaChlorideTOC

0
100
200
300
400
500
600
700
800
900
1000
Con
cent
ratio
n (m
g/L)
MW-1ALRI Landfill, Pierce County, Washington
AlkalinityTDSSulfate

0
100
200
300
400
500
600
700
800
900
1000
Con
cent
ratio
n (m
g/L)
MW-2ALRI Landfill, Pierce County, Washington
AlkalinityTDSSulfate

0
100
200
300
400
500
600
700
800
900
1000
Con
cent
ratio
n (m
g/L)
MW-3LRI Landfill, Pierce County, Washington
AlkalinityTDSSulfate

0
100
200
300
400
500
600
700
800
900
1000
Con
cent
ratio
n (m
g/L)
MW-4LRI Landfill, Pierce County, Washington
AlkalinityTDSSulfate

0
100
200
300
400
500
600
700
800
900
1000
Con
cent
ratio
n (m
g/L)
MW-5ALRI Landfill, Pierce County, Washington
AlkalinityTDSSulfate

0
100
200
300
400
500
600
700
800
900
1000
Con
cent
ratio
n (m
g/L)
MW-6LRI Landfill, Pierce County, Washington
AlkalinityTDSSulfate

0
100
200
300
400
500
600
700
800
900
1000
Con
cent
ratio
n (m
g/L)
MW-7LRI Landfill, Pierce County, Washington
AlkalinityTDSSulfate

0
100
200
300
400
500
600
700
800
900
1000
Con
cent
ratio
n (m
g/L)
MW-9 (Background)LRI Landfill, Pierce County, Washington
AlkalinityTDSSulfate

0
100
200
300
400
500
600
700
800
900
1000
Con
cent
ratio
n (m
g/L)
MW-10 (Background)LRI Landfill, Pierce County, Washington
AlkalinityTDSSulfate
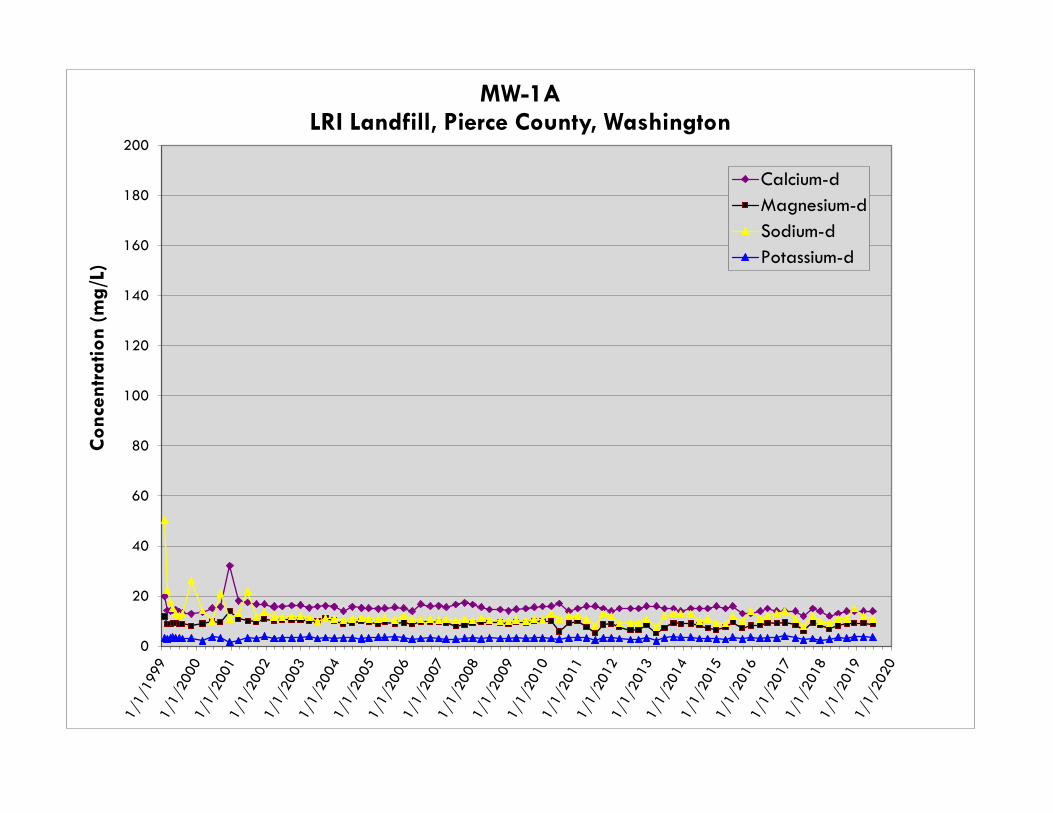
0
20
40
60
80
100
120
140
160
180
200
Con
cent
ratio
n (m
g/L)
MW-1ALRI Landfill, Pierce County, Washington
Calcium-dMagnesium-dSodium-dPotassium-d

0
20
40
60
80
100
120
140
160
180
200
Con
cent
ratio
n (m
g/L)
MW-2ALRI Landfill, Pierce County, Washington
Calcium-dMagnesium-dSodium-dPotassium-d

0
20
40
60
80
100
120
140
160
180
200
Con
cent
ratio
n (m
g/L)
MW-3LRI Landfill, Pierce County, Washington
Calcium-dMagnesium-dSodium-dPotassium-d

0
20
40
60
80
100
120
140
160
180
200
Con
cent
ratio
n (m
g/L)
MW-4LRI Landfill, Pierce County, Washington
Calcium-dMagnesium-dSodium-dPotassium-d

0
20
40
60
80
100
120
140
160
180
200
Con
cent
ratio
n (m
g/L)
MW-5ALRI Landfill, Pierce County, Washington
Calcium-dMagnesium-dSodium-dPotassium-d

0
20
40
60
80
100
120
140
160
180
200
Con
cent
ratio
n (m
g/L)
MW-6LRI Landfill, Pierce County, Washington
Calcium-dMagnesium-dSodium-dPotassium-d

0
20
40
60
80
100
120
140
160
180
200
Con
cent
ratio
n (m
g/L)
MW-7LRI Landfill, Pierce County, Washington
Calcium-dMagnesium-dSodium-dPotassium-d

0
20
40
60
80
100
120
140
160
180
200
Con
cent
ratio
n (m
g/L)
MW-9 (Background)LRI Landfill, Pierce County, Washington
Calcium-dMagnesium-dSodium-dPotassium-d

0
20
40
60
80
100
120
140
160
180
200
Con
cent
ratio
n (m
g/L)
MW-10 (Background)LRI Landfill, Pierce County, Washington
Calcium-dMagnesium-dSodium-dPotassium-d

0
1
2
3
4
5
6
7
8
9
10
Con
cent
ratio
n (m
g/L)
MW-1ALRI Landfill, Pierce County, Washington
Iron-dManganese-dZinc-dArsenic-dArsenic-tZinc-t

0
1
2
3
4
5
6
7
8
9
10
Con
cent
ratio
n (m
g/L)
MW-2ALRI Landfill, Pierce County, Washington
Iron-dManganese-dZinc-dArsenic-dArsenic-tZinc-t

0
1
2
3
4
5
6
7
8
9
10
Con
cent
ratio
n (m
g/L)
MW-3LRI Landfill, Pierce County, Washington
Iron-dManganese-dZinc-dArsenic-dArsenic-tZinc-t

0
1
2
3
4
5
6
7
8
9
10
Con
cent
ratio
n (m
g/L)
MW-4LRI Landfill, Pierce County, Washington
Iron-dManganese-dZinc-dArsenic-dArsenic-tZinc-t

0
1
2
3
4
5
6
7
8
9
10
Con
cent
ratio
n (m
g/L)
MW-5ALRI Landfill, Pierce County, Washington
Iron-dManganese-dZinc-dArsenic-dArsenic-tZinc-t

0
1
2
3
4
5
6
7
8
9
10
Con
cent
ratio
n (m
g/L)
MW-6LRI Landfill, Pierce County, Washington
Iron-dManganese-dZinc-dArsenic-dArsenic-tZinc-t

0
1
2
3
4
5
6
7
8
9
10
Con
cent
ratio
n (m
g/L)
MW-7LRI Landfill, Pierce County, Washington
Iron-dManganese-dZinc-dArsenic-dArsenic-tZinc-t

0
1
2
3
4
5
6
7
8
9
10
Con
cent
ratio
n (m
g/L)
MW-9 (Background)LRI Landfill, Pierce County, Washington
Iron-dManganese-dZinc-dArsenic-dArsenic-tZinc-t

0
1
2
3
4
5
6
7
8
9
10
Con
cent
ratio
n (m
g/L)
MW-10 (Background)LRI Landfill, Pierce County, Washington
Iron-dManganese-dZinc-dArsenic-dArsenic-tZinc-t

LRILF 3Q19 LDCS WQ trends-1_Inorg. 18/14/2019 SCS ENGINEERS
0
10
20
30
40
50
60
70
80
90
100
110
120
Con
cent
ratio
n (m
g/L)
LDCS-1LRI Landfill, Pierce County, Washington
Nitrate
Ammonia
Chloride
TOC

0
10
20
30
40
50
60
70
80
90
100
110
120
Con
cent
ratio
n (m
g/L)
LDCS-2ALRI Landfill, Pierce County, Washington
Nitrate
Ammonia
Chloride
TOC

0
10
20
30
40
50
60
70
80
90
100
110
120
Con
cent
ratio
n (m
g/L)
LDCS-2BLRI Landfill, Pierce County, Washington
Nitrate
Ammonia
Chloride
TOC

0
10
20
30
40
50
60
70
80
90
100
110
120
Con
cent
ratio
n (m
g/L)
LDCS-3ALRI Landfill, Pierce County, Washington
Nitrate
Ammonia
Chloride
TOC

0
10
20
30
40
50
60
70
80
90
100
110
120
Con
cent
ratio
n (m
g/L)
LDCS-4ALRI Landfill, Pierce County, Washington
Nitrate
Ammonia
Chloride
TOC
LDCS 4A, TOC 207.0 mg/L 3/6/2007

0
10
20
30
40
50
60
70
80
90
100
110
120
Con
cent
ratio
n (m
g/L)
LDCS-4BLRI Landfill, Pierce County, Washington
Nitrate
Ammonia
Chloride
TOC

0
10
20
30
40
50
60
70
80
90
100
110
120
Con
cent
ratio
n (m
g/L)
LDCS-5LRI Landfill, Pierce County, Washington
Nitrate
Ammonia
Chloride
TOC

0
10
20
30
40
50
60
70
80
90
100
110
120
Con
cent
ratio
n (m
g/L)
LDCS-6ALRI Landfill, Pierce County, Washington
Nitrate
Ammonia
Chloride
TOC
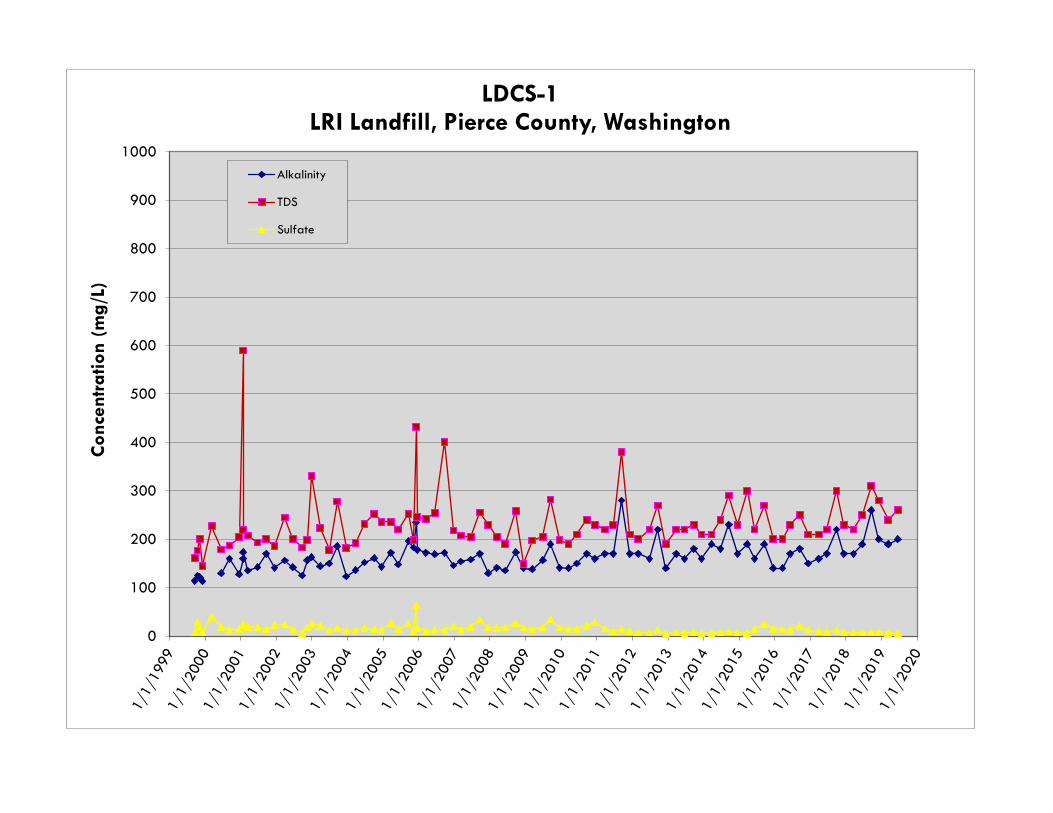
0
100
200
300
400
500
600
700
800
900
1000
Con
cent
ratio
n (m
g/L)
LDCS-1LRI Landfill, Pierce County, Washington
Alkalinity
TDS
Sulfate

0
100
200
300
400
500
600
700
800
900
1000
Con
cent
ratio
n (m
g/L)
LDCS-2ALRI Landfill, Pierce County, Washington
Alkalinity
TDS
Sulfate

0
100
200
300
400
500
600
700
800
900
1000
Con
cent
ratio
n (m
g/L)
LDCS-2BLRI Landfill, Pierce County, Washington
Alkalinity
TDS
Sulfate
LDCS 2B, TDS 2,600 mg/L 9/22/2006

0
100
200
300
400
500
600
700
800
900
1000
Con
cent
ratio
n (m
g/L)
LDCS-3ALRI Landfill, Pierce County, Washington
Alkalinity
TDS
Sulfate

0
100
200
300
400
500
600
700
800
900
1000
Con
cent
ratio
n (m
g/L)
LDCS-4ALRI Landfill, Pierce County, Washington
Alkalinity
TDS
Sulfate

0
100
200
300
400
500
600
700
800
900
1000
Con
cent
ratio
n (m
g/L)
LDCS-4BLRI Landfill, Pierce County, Washington
Alkalinity
TDS
Sulfate

0
100
200
300
400
500
600
700
800
900
1000
Con
cent
ratio
n (m
g/L)
LDCS-5LRI Landfill, Pierce County, Washington
Alkalinity
TDS
Sulfate

0
100
200
300
400
500
600
700
800
900
1000
Con
cent
ratio
n (m
g/L)
LDCS-6ALRI Landfill, Pierce County, Washington
Alkalinity
TDS
Sulfate

0
20
40
60
80
100
120
140
160
180
200
Con
cent
ratio
n (m
g/L)LDCS-1
LRI Landfill, Pierce County, Washington
Calcium
Magnesium
Sodium
Potassium

0
20
40
60
80
100
120
140
160
180
200
Con
cent
ratio
n (m
g/L)LDCS-2A
LRI Landfill, Pierce County, Washington
Calcium
Magnesium
Sodium
Potassium

0
20
40
60
80
100
120
140
160
180
200
Con
cent
ratio
n (m
g/L)LDCS-2B
LRI Landfill, Pierce County, Washington
Calcium
Magnesium
Sodium
Potassium

0
20
40
60
80
100
120
140
160
180
200
Con
cent
ratio
n (m
g/L)LDCS-3A
LRI Landfill, Pierce County, Washington
Calcium
Magnesium
Sodium
Potassium

0
20
40
60
80
100
120
140
160
180
200
Con
cent
ratio
n (m
g/L)LDCS-4A
LRI Landfill, Pierce County, Washington
Calcium
Magnesium
Sodium
Potassium

0
20
40
60
80
100
120
140
160
180
200
Con
cent
ratio
n (m
g/L)LDCS-4B
LRI Landfill, Pierce County, Washington
Calcium
Magnesium
Sodium
Potassium

0
20
40
60
80
100
120
140
160
180
200
Con
cent
ratio
n (m
g/L)LDCS-5
LRI Landfill, Pierce County, Washington
Calcium
Magnesium
Sodium
Potassium

0
20
40
60
80
100
120
140
160
180
200
Con
cent
ratio
n (m
g/L)LDCS-6A
LRI Landfill, Pierce County, Washington
Calcium
Magnesium
Sodium
Potassium

0
1
2
3
4
5
6
7
8
9
10
11
12
13
14
Con
cent
ratio
n (m
g/L)
LDCS-1LRI Landfill, Pierce County, Washington
Iron
Manganese
Zinc
Arsenic

0
1
2
3
4
5
6
7
8
9
10
11
12
13
14
Con
cent
ratio
n (m
g/L)
LDCS-2ALRI Landfill, Pierce County, Washington
Iron
Manganese
Zinc
Arsenic

0
1
2
3
4
5
6
7
8
9
10
11
12
13
14
Con
cent
ratio
n (m
g/L)
LDCS-2BLRI Landfill, Pierce County, Washington
Iron
Manganese
Zinc
Arsenic

0
1
2
3
4
5
6
7
8
9
10
11
12
13
14
Con
cent
ratio
n (m
g/L)
LDCS-3ALRI Landfill, Pierce County, Washington
Iron
Manganese
Zinc
Arsenic

0
1
2
3
4
5
6
7
8
9
10
11
12
13
14
Con
cent
ratio
n (m
g/L)
LDCS-4ALRI Landfill, Pierce County, Washington
Iron
Manganese
Zinc
Arsenic

0
1
2
3
4
5
6
7
8
9
10
11
12
13
14
Con
cent
ratio
n (m
g/L)
LDCS-4BLRI Landfill, Pierce County, Washington
Iron
Manganese
Zinc
Arsenic

0
1
2
3
4
5
6
7
8
9
10
11
12
13
14
Con
cent
ratio
n (m
g/L)
LDCS-5LRI Landfill, Pierce County, Washington
Iron
Manganese
Zinc
Arsenic

0
1
2
3
4
5
6
7
8
9
10
11
12
13
14
Con
cent
ratio
n (m
g/L)
LDCS-6ALRI Landfill, Pierce County, Washington
Iron
Manganese
Zinc
Arsenic

LRI Landfill Second Quarter 2019 Report www.scsengineers.com
Appendix H
LDCS Pumping Records and Conductivity Measurements

Summary of Leachate Volume and Depth DataSecond Quarter 2019
LRI Landfill, Pierce County, Washington
Page 1 of 2
Date
Cell 1 Leachate Volume (GPD)
Cell 1 Leachate Level (in.)
Cell 2A Leachate Volume (GPD)
Cell 2A Leachate Level (in.)
Cell 2B Leachate Volume (GPD)
Cell 2B Leachate Level (in.)
Cell 3A Leachate Volume (GPD)
Cell 3A Leachate Level (in.)
Cell 4A Leachate Volume (GPD)
Cell 4A Leachate Level (in.)
Cell 4B Leachate Volume (GPD)
Cell 4B Leachate Level (in.)
Cell 5 Leachate Volume (GPD)
Cell 5 Leachate Level (in.)
Cell 6 Leachate Volume (GPD)
Cell 6 Leachate Level (in.)
4/1/2019 3,134 10.5 5 7.1 3,516 8.5 5,278 10.1 21,824 12.5 15,474 10.5 13,161 5.1 10,964 11.94/2/2019 2,265 10.9 0 8.5 3,291 8.4 6,379 10.3 15,794 7.8 12,256 8.9 38,354 4.1 11,370 11.04/3/2019 2,054 11.0 0 9.7 3,707 9.0 5,617 9.5 11,931 7.3 15,868 10.7 25,864 4.2 10,779 11.34/4/2019 4,505 10.4 7,902 9.7 3,354 8.4 4,967 9.4 18,289 9.6 10,296 9.0 21,904 4.2 10,860 11.44/5/2019 3,015 10.7 0 6.9 3,292 8.3 5,619 9.7 13,087 7.4 27,628 9.7 20,566 4.1 13,546 11.14/6/2019 2,193 10.7 0 7.9 3,341 8.5 7,376 9.1 14,566 7.5 20,502 9.6 13,513 4.3 11,582 11.34/7/2019 1,184 11.4 1 9.0 3,277 8.6 5,448 9.1 11,843 6.9 23,848 9.8 13,513 7.1 15,553 10.84/8/2019 3,082 10.8 0 10.5 3,280 8.7 5,897 9.4 11,841 7.1 7,032 9.1 13,513 8.5 12,699 11.34/9/2019 2,285 10.9 0 11.1 2,263 8.6 5,130 9.3 10,962 6.6 32,886 10.1 20,110 9.0 16,151 11.54/10/2019 2,504 10.8 8,018 7.5 2,734 8.7 5,039 9.4 11,151 7.0 13,532 8.6 20,890 9.3 12,086 11.04/11/2019 2,674 10.9 0 8.5 3,175 8.5 9,881 9.3 7,151 7.6 27,108 10.3 16,804 9.9 15,872 10.94/12/2019 2,719 10.9 0 9.6 3,137 8.6 6,027 9.1 12,639 9.3 15,774 9.4 15,510 10.4 11,896 11.24/13/2019 3,461 10.8 1 11.1 3,946 9.1 8,680 9.7 17,409 9.7 9,852 9.6 26,511 11.0 15,171 10.94/14/2019 2,892 10.6 7,837 8.0 3,078 8.4 4,758 9.3 14,129 8.8 13,338 9.3 26,511 11.7 13,031 10.94/15/2019 3,891 10.6 0 8.6 3,271 8.4 7,332 9.5 13,260 7.8 17,338 9.8 26,511 12.0 12,005 12.14/16/2019 2,774 10.8 0 9.3 3,925 8.9 9,658 9.2 10,528 8.9 19,336 8.3 -- 12.0 12,622 11.14/17/2019 2,775 11.4 0 10.1 3,941 8.6 4,576 9.6 14,200 9.3 13,572 8.0 24,088 12.2 11,723 11.84/18/2019 1,568 11.6 6,781 6.6 3,140 9.5 5,968 9.8 14,216 8.0 10,318 10.0 28,304 12.0 11,723 8.54/19/2019 2,850 11.9 0 8.1 3,111 11.4 5,956 10.2 15,272 6.2 11,832 11.0 27,744 11.6 11,035 11.64/20/2019 2,605 11.9 0 8.1 3,532 11.4 7,134 10.2 13,949 6.2 19,446 11.0 14,615 11.6 12,966 11.64/21/2019 2,605 11.9 0 8.1 3,532 11.4 7,134 10.2 13,949 6.2 19,446 11.0 14,615 11.6 12,966 11.64/22/2019 2,605 11.1 7,854 6.9 3,532 8.3 7,134 10.4 13,949 7.5 19,446 8.0 14,615 12.7 12,966 8.64/23/2019 2,208 11.5 19 8.5 3,622 7.1 4,894 9.7 13,652 11.8 12,068 8.0 32,822 12.4 13,436 11.84/24/2019 2,208 11.8 0 9.5 2,544 11.7 5,382 10.1 21,376 11.2 5,816 11.0 35,574 11.5 11,557 11.94/25/2019 2,851 10.8 0 11.7 3,061 8.6 5,590 9.7 12,991 8.7 714 10.4 28,488 10.2 10,046 11.94/26/2019 2,647 10.8 5,230 6.9 3,480 8.6 6,290 9.2 8,898 9.3 17,170 9.2 23,636 10.5 9,845 11.44/27/2019 3,718 10.6 1 8.2 3,163 8.5 6,339 9.6 11,836 9.4 20,082 10.1 16,969 10.0 9,687 11.24/28/2019 2,096 10.7 0 9.5 2,830 9.0 4,835 9.2 11,724 8.9 11,720 9.8 16,969 10.3 9,746 11.14/29/2019 2,849 10.7 7,393 10.3 3,049 8.7 5,422 9.7 8,794 9.9 1,552 9.2 16,969 10.7 9,490 11.44/30/2019 3,268 -- 7,394 -- 3,050 -- 7,306 -- 17,112 -- 8,872 9.0 21,452 11.1 9,427 8.85/1/2019 2,979 11.7 0 8.0 4,276 6.4 7,306 8.8 14,024 7.2 9,212 11.0 23,478 11.0 88 9.05/2/2019 2,347 10.9 0 9.9 3,479 8.8 7,472 9.5 11,672 7.2 13,288 8.8 34,394 11.0 9,181 11.45/3/2019 3,472 10.5 6,082 7.8 3,276 8.7 5,788 9.0 12,244 8.2 35,554 9.1 18,388 10.9 9,394 11.55/4/2019 2,141 11.1 0 7.6 3,830 9.2 5,024 9.5 14,781 9.7 19,377 9.5 22,417 10.5 9,471 11.45/5/2019 4,937 11.0 0 9.1 3,830 8.7 5,024 9.2 14,781 9.4 19,377 9.7 22,417 10.7 9,297 11.25/6/2019 2,736 10.9 6,060 10.5 3,830 9.0 5,024 9.1 14,781 10.7 19,377 9.3 22,417 10.5 9,153 11.35/7/2019 2,074 11.1 0 9.7 3,680 8.9 5,168 9.2 13,624 10.1 16,910 9.6 28,642 10.4 8,846 11.65/8/2019 4,251 11.1 7,985 7.2 3,758 8.6 5,865 9.1 14,084 9.7 17,516 9.4 21,340 10.2 9,075 11.45/9/2019 2,140 11.4 0 8.6 3,226 8.6 4,659 9.3 12,164 9.5 4,738 9.5 5,956 10.5 8,961 11.65/10/2019 3,037 11.0 0 10.0 4,380 10.1 5,539 9.6 13,909 9.6 16,588 9.3 30,228 10.3 9,186 11.55/11/2019 2,229 11.2 0 11.4 2,922 8.9 5,327 9.1 11,450 9.9 11,870 10.3 17,754 10.0 9,169 11.25/12/2019 2,891 10.9 7,608 7.7 4,351 8.7 5,144 9.1 15,201 9.3 17,056 9.2 17,754 11.0 8,910 11.15/13/2019 3,122 10.9 16 8.6 3,867 8.6 5,185 9.4 30,821 10.0 34,482 9.9 17,754 11.4 8,918 11.45/14/2019 2,953 11.0 0 9.7 2,849 8.7 6,477 9.3 17,524 9.8 12,306 9.8 28,160 11.0 9,450 11.35/15/2019 4,302 10.6 7,523 9.5 4,055 8.6 4,964 9.4 10,278 9.7 8,270 9.5 18,272 11.1 10,123 11.45/16/2019 2,026 11.5 0 7.5 3,467 8.3 5,968 9.4 11,831 9.6 11,436 9.3 21,304 11.1 12,796 11.05/17/2019 1,713 11.1 1 8.3 3,847 8.8 9,836 9.1 16,802 9.9 17,810 9.4 25,760 11.6 12,291 11.45/18/2019 2,478 11.1 0 10.2 2,956 8.5 5,162 9.1 13,383 9.8 14,388 9.9 17,833 11.9 9,559 11.25/19/2019 2,977 10.9 0 11.3 3,056 8.7 6,355 9.2 8,137 10.5 21,026 9.5 17,833 12.2 10,620 11.65/20/2019 4,817 10.3 9,081 9.0 3,177 9.7 9,601 11.8 13,718 12.2 12,126 11.1 17,833 12.8 15,393 13.45/21/2019 3,181 10.6 0 7.4 3,245 10.0 7,422 9.1 9,694 10.1 28,444 11.1 23,048 12.9 11,555 12.25/22/2019 1,356 11.2 0 8.7 4,191 8.8 8,531 9.4 12,257 10.1 14,674 9.4 17,608 13.0 9,252 11.35/23/2019 1,716 11.5 1 10.4 4,015 8.7 5,217 9.5 13,222 9.4 14,672 9.7 37,500 13.0 9,050 11.25/24/2019 2,510 11.3 0 11.4 3,924 7.0 10,882 8.6 12,824 8.8 12,162 8.0 25,478 13.1 9,453 11.75/25/2019 3,245 11.3 0 11.4 3,089 7.0 7,727 8.6 14,151 8.8 13,675 8.0 15,158 13.1 10,954 11.75/26/2019 3,245 11.3 0 11.4 3,089 7.0 7,727 8.6 14,151 8.8 13,675 8.0 15,158 13.1 10,954 11.75/27/2019 3,245 11.3 7,762 9.7 3,089 10.5 7,727 10.4 14,151 10.9 13,675 9.0 15,158 13.7 10,954 11.85/28/2019 2,703 11.0 0 11.0 2,923 11.6 10,028 8.7 16,572 9.2 14,930 9.0 21,552 13.8 9,208 11.85/29/2019 2,004 11.7 7,672 6.8 3,220 11.8 8,348 9.5 16,248 9.0 9,550 9.0 17,930 14.0 3,595 15.85/30/2019 3,377 11.0 0 8.3 4,217 7.0 7,758 9.2 14,360 6.1 6,748 11.0 16,336 14.1 14,751 10.75/31/2019 1,820 11.7 0 9.5 3,815 8.2 6,194 9.6 11,640 10.3 19,104 9.0 33,040 14.1 9,653 11.9

Summary of Leachate Volume and Depth DataSecond Quarter 2019
LRI Landfill, Pierce County, Washington
Page 2 of 2
Date
Cell 1 Leachate Volume (GPD)
Cell 1 Leachate Level (in.)
Cell 2A Leachate Volume (GPD)
Cell 2A Leachate Level (in.)
Cell 2B Leachate Volume (GPD)
Cell 2B Leachate Level (in.)
Cell 3A Leachate Volume (GPD)
Cell 3A Leachate Level (in.)
Cell 4A Leachate Volume (GPD)
Cell 4A Leachate Level (in.)
Cell 4B Leachate Volume (GPD)
Cell 4B Leachate Level (in.)
Cell 5 Leachate Volume (GPD)
Cell 5 Leachate Level (in.)
Cell 6 Leachate Volume (GPD)
Cell 6 Leachate Level (in.)
6/1/2019 3,432 11.3 0 11.1 3,058 11.7 6,008 10.5 15,172 9.9 15,984 7.0 17,754 14.2 9,619 11.96/2/2019 2,358 11.3 0 11.1 3,377 11.7 6,446 10.5 13,684 9.9 9,955 7.0 13,086 14.2 8,546 11.96/3/2019 2,358 11.6 7,399 10.5 3,377 9.0 6,446 9.8 13,684 11.9 9,955 7.0 13,086 14.9 8,546 11.36/4/2019 3,792 8.1 1 9.5 2,958 10.6 6,012 9.8 12,032 8.8 15,698 11.0 22,736 14.6 8,916 11.46/5/2019 3,097 8.1 3,191 9.5 2,931 10.6 6,206 9.8 16,396 8.8 250 11.0 29,572 14.6 9,062 11.46/6/2019 3,480 11.8 4,325 7.5 3,162 11.1 5,884 9.8 10,708 9.2 19,278 9.0 30,774 14.3 9,530 12.26/7/2019 1,907 11.8 0 8.9 4,391 12.0 6,464 10.0 6,952 12.0 16,848 8.0 59,498 14.8 13,152 11.86/8/2019 2,588 11.8 0 8.9 3,303 12.0 13,737 10.0 14,117 12.0 14,184 8.0 44,211 14.8 11,285 11.86/9/2019 2,588 11.8 0 8.9 3,303 12.0 13,737 10.0 14,117 12.0 14,184 8.0 44,211 14.8 11,285 11.86/10/2019 2,588 11.6 7,365 7.8 3,303 11.1 13,737 8.7 14,117 7.6 14,184 8.0 44,211 12.4 11,285 11.86/11/2019 2,897 11.6 0 8.7 3,041 11.0 5,542 10.8 13,192 7.5 4,044 11.0 25,354 12.2 9,234 11.76/12/2019 2,794 11.9 0 10.6 3,145 10.9 7,940 11.0 18,160 8.0 20,342 8.0 54,470 10.8 9,329 8.76/13/2019 5,181 11.8 0 11.7 3,361 9.1 8,218 10.4 16,620 8.0 6,204 10.0 36,042 10.4 9,340 11.96/14/2019 4,680 11.3 7,879 6.9 2,637 11.9 7,862 10.4 12,560 7.6 19,860 8.0 36,842 10.1 9,178 11.96/15/2019 2,713 11.3 0 6.9 3,528 11.9 8,609 10.4 12,588 7.6 10,654 8.0 20,285 10.1 9,178 11.96/16/2019 2,713 11.3 0 6.9 3,528 11.9 8,609 10.4 12,588 7.6 10,654 8.0 20,285 10.1 9,178 11.96/17/2019 2,713 7.3 1 11.0 3,528 6.5 8,609 11.5 12,588 8.1 10,354 10.0 20,285 10.5 9,178 12.36/18/2019 3,045 6.7 7,294 6.3 2,785 11.5 12,344 7.2 15,116 7.4 11,202 9.0 15,984 10.9 8,312 11.96/19/2019 2,692 11.4 0 7.3 3,196 11.3 4,294 10.0 15,256 7.5 4,830 11.0 57,366 10.5 8,682 11.96/20/2019 3,333 11.5 0 8.8 3,268 11.5 8,890 10.3 15,184 7.6 24,360 8.0 40,932 9.5 9,133 12.06/21/2019 2,446 11.6 0 10.1 3,296 11.4 6,872 11.4 15,880 7.6 3,780 10.0 36,704 8.2 9,426 11.86/22/2019 1,414 11.6 0 10.1 2,897 11.4 6,398 11.4 11,195 7.6 13,860 10.0 15,375 8.2 9,093 11.86/23/2019 1,414 11.6 0 10.1 2,897 11.4 6,398 11.4 11,195 7.6 13,860 10.0 15,375 8.2 9,093 11.86/24/2019 1,414 12.6 8,074 9.6 2,897 11.5 6,398 8.6 11,195 6.0 13,860 8.0 15,375 9.7 9,093 11.86/25/2019 2,844 12.8 8 10.1 4,087 6.7 4,038 11.2 13,092 7.7 5,040 11.0 36,626 10.0 9,497 9.66/26/2019 2,844 11.4 1 11.3 2,478 9.8 6,450 9.9 13,196 7.7 24,990 9.0 30,376 9.2 9,114 11.86/27/2019 3,823 11.9 8,446 7.0 4,170 7.0 7,182 8.9 18,244 7.8 22,260 8.0 60,344 7.1 11,969 9.56/28/2019 1,091 11.6 0 7.7 2,454 10.8 5,608 9.0 15,760 7.6 18,360 9.0 34,402 5.3 12,448 7.76/29/2019 4,537 11.6 0 7.7 3,337 10.8 5,916 9.0 11,667 7.6 17,820 9.0 24,026 5.3 9,166 7.76/30/2019 4,537 11.6 0 7.7 3,337 10.8 5,916 9.0 11,667 7.6 17,820 9.0 24,026 5.3 9,166 7.7
-- = No data collected, meter not functioning properly

LRI Landfill Second Quarter 2019 Report www.scsengineers.com
Appendix I
Surface Water Monitoring Data

Monitoring Period:04/01/2019 - 04/30/2019
Facility County: Pierce
WAR002603Permit Number: Permittee:Receiving Waterbody:
Outfall: 001 - NEWB 2
LRI 304th Street Landfill
MonitoringPointWeek 001 001 001
1-Th 4/4/19 12 7.0
2-Th 4/11/19 10 6.9
3-Th 4/18/19 11 6.9
4-M 4/22/19 8 7.0
Minimum6.9
BM: >= 33 (RO)
BM: >= 6.5 (RO)
Maximum12 7
BM: <= 25 (RO)
BM: <= 8.5 (RO)
Overall DMR Notes/CommentListed BMP's were in operation for the entire month.
Version: 1
Monitoring Point Week BMP
001 Check Dams
001 Other
001 Sediment Trap
001 Silt Fence
001 Straw Wattles
BMPs
I certify under penalty of law, that this document and all attachments were prepared under my direction or supervision in accordance with a system designed to assure that qualified personnel properly gather and evaluate the information submitted. Based on my inquiry of the person or persons who manage the system or those persons directly responsible for gathering information, the information submitted is, to the best of my knowledge and belief, true, accurate, and complete. I am aware that there are significant penalties for submitting false information, including the possibility of fine and imprisonment for knowing violations.
George DuvendackSignature Date
5/14/2019 4:35:12 PM
Washington State Department of Ecology Discharge Monitoring Report (DMR) Page: 1 of 1
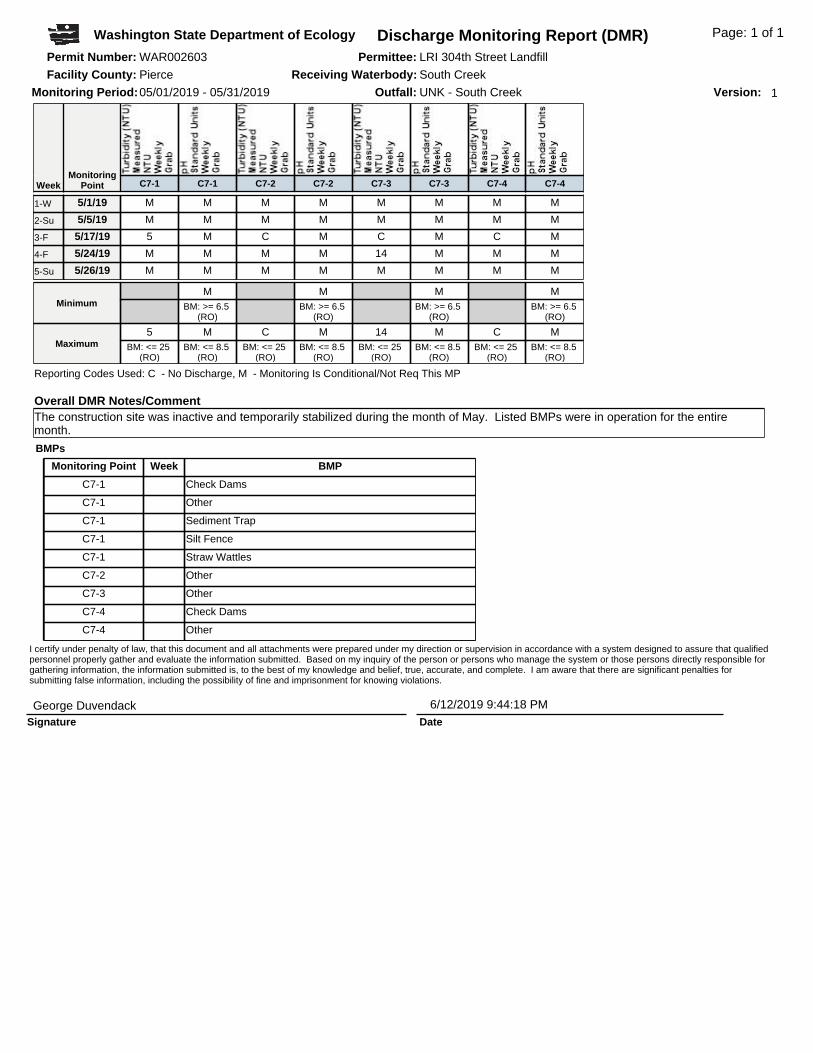
Monitoring Period:05/01/2019 - 05/31/2019
Facility County: Pierce
WAR002603Permit Number: Permittee:Receiving Waterbody:
Outfall: UNK - South Creek
South Creek
LRI 304th Street Landfill
MonitoringPointWeek C7-1 C7-1 C7-2 C7-2 C7-3 C7-3 C7-4 C7-4
1-W 5/1/19 M M M M M M M M
2-Su 5/5/19 M M M M M M M M
3-F 5/17/19 5 M C M C M C M
4-F 5/24/19 M M M M 14 M M M
5-Su 5/26/19 M M M M M M M M
MinimumM M M M
BM: >= 6.5 (RO)
BM: >= 6.5 (RO)
BM: >= 6.5 (RO)
BM: >= 6.5 (RO)
Maximum5 M C M 14 M C M
BM: <= 25 (RO)
BM: <= 8.5 (RO)
BM: <= 25 (RO)
BM: <= 8.5 (RO)
BM: <= 25 (RO)
BM: <= 8.5 (RO)
BM: <= 25 (RO)
BM: <= 8.5 (RO)
Reporting Codes Used: C - No Discharge, M - Monitoring Is Conditional/Not Req This MP
Overall DMR Notes/CommentThe construction site was inactive and temporarily stabilized during the month of May. Listed BMPs were in operation for the entire month.
Version: 1
Monitoring Point Week BMP
C7-1 Check Dams
C7-1 Other
C7-1 Sediment Trap
C7-1 Silt Fence
C7-1 Straw Wattles
C7-2 Other
C7-3 Other
C7-4 Check Dams
C7-4 Other
BMPs
I certify under penalty of law, that this document and all attachments were prepared under my direction or supervision in accordance with a system designed to assure that qualified personnel properly gather and evaluate the information submitted. Based on my inquiry of the person or persons who manage the system or those persons directly responsible for gathering information, the information submitted is, to the best of my knowledge and belief, true, accurate, and complete. I am aware that there are significant penalties for submitting false information, including the possibility of fine and imprisonment for knowing violations.
George DuvendackSignature Date
6/12/2019 9:44:18 PM
Washington State Department of Ecology Discharge Monitoring Report (DMR) Page: 1 of 1

Monitoring Period:06/01/2019 - 06/30/2019
Facility County: Pierce
WAR002603Permit Number: Permittee:Receiving Waterbody:
Outfall: UNK - South Creek
South Creek
LRI 304th Street Landfill
MonitoringPointWeek C7-1 C7-1 C7-2 C7-2 C7-3 C7-3 C7-4 C7-4
2-T 6/4/19 C M C M 16 M C M
3-M 6/10/19 C M C M 11 M C M
4-Th 6/20/19 C M C M C M C M
5-Th 6/27/19 C M C M C M C M
MinimumM M M M
BM: >= 6.5 (RO)
BM: >= 6.5 (RO)
BM: >= 6.5 (RO)
BM: >= 6.5 (RO)
MaximumC M C M 16 M C M
BM: <= 25 (RO)
BM: <= 8.5 (RO)
BM: <= 25 (RO)
BM: <= 8.5 (RO)
BM: <= 25 (RO)
BM: <= 8.5 (RO)
BM: <= 25 (RO)
BM: <= 8.5 (RO)
Reporting Codes Used: C - No Discharge, M - Monitoring Is Conditional/Not Req This MP
Version: 1
Monitoring Point Week BMP
C7-1 Check Dams
C7-1 Other
C7-1 Sediment Trap
C7-1 Silt Fence
C7-1 Straw Wattles
C7-2 Other
C7-3 Other
C7-4 Check Dams
C7-4 Other
C7-4 Silt Fence
BMPs
I certify under penalty of law, that this document and all attachments were prepared under my direction or supervision in accordance with a system designed to assure that qualified personnel properly gather and evaluate the information submitted. Based on my inquiry of the person or persons who manage the system or those persons directly responsible for gathering information, the information submitted is, to the best of my knowledge and belief, true, accurate, and complete. I am aware that there are significant penalties for submitting false information, including the possibility of fine and imprisonment for knowing violations.
George DuvendackSignature Date
7/15/2019 7:20:10 AM
Washington State Department of Ecology Discharge Monitoring Report (DMR) Page: 1 of 1

Monitoring Period:04/01/2019 - 06/30/2019
Facility County: Pierce
WAR002557Permit Number: Permittee:Receiving Waterbody:
Outfall: NEWB - NEWB 2
South Creek
Pierce County Recycling - 304th Street L
MonitoringPointWeek NEWB NEWB NEWB NEWB NEWB NEWB NEWB NEWB NEWB NEWB NEWB
Limit Set
ISGP Western WA
- 2015 Permit
ISGP Western WA
- 2015 Permit
ISGP Western WA
- 2015 Permit
ISGP Western WA
- 2015 Permit
ISGP Western WA
- 2015 Permit
ISGP Non-Haz Waste
Landfill (40CFR part 445 subpart
B)- 2015 permit
ISGP Non-Haz Waste
Landfill (40CFR part 445 subpart
B)- 2015 permit
ISGP Non-Haz Waste
Landfill (40CFR part 445 subpart
B)- 2015 permit
ISGP Non-Haz Waste
Landfill (40CFR part 445 subpart
B)- 2015 permit
ISGP Non-Haz Waste
Landfill (40CFR part 445 subpart
B)- 2015 permit
ISGP Non-Haz Waste
Landfill (40CFR part 445 subpart
B)- 2015 permit
1-Th 4/4/19 12 7.0
2-W 4/10/19 10 No 2.1 J|3.7 2.1 3.4 0.11 B|9.8 B|59 B|9.8
2-Th 4/11/19 10 6.9
3-Th 4/18/19 11 6.9
4-M 4/22/19 8 7.0
7-F 5/17/19 17
8-T 5/21/19 12
Minimum6.9
BM: >= 5.0 (RO)
Average11.7 2.1 J|3.7
BM: <= 25 BM: <= 14 BM: <= 117
Maximum7.0
BM: <= 9.0 (RO)
Month 1 Average2.1 3.4 0.11 B|9.8 B|59 B|9.8
<= 37 <= 27 <= 4.9 <= 16 <= 71 <= 14
Month 2 Average2.1 3.4 0.11 B|9.8 B|59 B|9.8
<= 37 <= 27 <= 4.9 <= 16 <= 71 <= 14
Month 3 Average2.1 3.4 0.11 B|9.8 B|59 B|9.8
<= 37 <= 27 <= 4.9 <= 16 <= 71 <= 14
Reporting Codes Used: B - Below Detection Limit/No Detection, J - Estimated Value/Below Quantitation Limit
Version: 1
I certify under penalty of law, that this document and all attachments were prepared under my direction or supervision in accordance with a system designed to assure that qualified personnel properly gather and evaluate the information submitted. Based on my inquiry of the person or persons who manage the system or those persons directly responsible for gathering information, the information submitted is, to the best of my knowledge and belief, true, accurate, and complete. I am aware that there are significant penalties for submitting false information, including the possibility of fine and imprisonment for knowing violations.
George DuvendackSignature Date
8/12/2019 9:11:34 AM
Washington State Department of Ecology Discharge Monitoring Report (DMR) Page: 1 of 2

MonitoringPointWeek NEWB NEWB NEWB
Limit Set
ISGP Non-Haz Waste
Landfill (40CFR part 445 subpart
B)- 2015 permit
ISGP Non-Haz Waste
Landfill (40CFR part 445 subpart
B)- 2015 permit
ISGP Non-Haz Waste
Landfill (40CFR part 445 subpart
B)- 2015 permit
1-Th 4/4/19 7.0
2-W 4/10/19 B|9.8 J|3.7
2-Th 4/11/19 6.9
3-Th 4/18/19 6.9
4-M 4/22/19 7.0
7-F 5/17/19
8-T 5/21/19
Minimum6.9
>= 6.0 (RO)
Average
Maximum7.0
<= 9.0 (RO)
Month 1 AverageB|9.8 J|3.7
<= 15 <= 110
Month 2 AverageB|9.8 J|3.7
<= 15 <= 110
Month 3 AverageB|9.8 J|3.7
<= 15 <= 110
Washington State Department of Ecology Discharge Monitoring Report (DMR) Page: 2 of 2


LRI Landfill Second Quarter 2019 Report www.scsengineers.com
Appendix J
Landfill Gas Monitoring Data

Exhibit 3 - Results of Landfill Gas Probe Monitoring SCS EngineersLandfill Gas Control System 04219001.04LRI Landfill
April-19Depth to
Location Balance WaterRefer Date Time P (well) CH4 Spike CH4 CO2 O2 (N2 & H2O) Note 2 Comments
Design. (in W.C.) (% by vol.) (% by vol.) (% by vol.) (% by vol.) (% by vol.) (ft-TOC) (ft) (%)
Normal Operating Rage:(min) - 0.3 0.3 - 20.0(max) 5.00 5.0 5.0 20.3 90.0
Perimter Gas ProbesGP-1 4/25/2019 7:49 0.1 3.0 1.7 3.0 15.5 79.8 16.5 9.5 100.0GP-2 4/25/2019 7:56 0.2 17.1 16.1 17.7 0.0 66.2 15.8 8.8 100.0GP-3 4/25/2019 8:02 0.1 -- 0.0 9.4 8.6 82.0 11.5 7.5 100.0GP-4 4/25/2019 8:10 0.1 -- 0.0 2.0 18.6 79.4 9.0 5.0 99.4GP-9 4/25/2019 8:17 0.1 -- 0.0 7.9 7.6 84.5 11.5 0.0 0.0GP-10 4/25/2019 7:41 0.1 7.1 16.1 25.6 1.4 56.9 NMGP-10P 4/25/2019 7:37 0.1 20.8 20.4 26.2 2.9 50.5 NMGP-11 4/25/2019 7:31 0.1 -- 0.0 10.5 11.1 78.4 NMGP-12 4/25/2019 7:24 0.0 31.9 28.6 56.9 0.1 14.4 NMGP-13 4/25/2019 7:15 0.1 1.6 1.5 24.0 0.1 74.4 NMGP-14 4/25/2019 8:44 0.1 -- 0.0 0.1 20.7 79.2 10.6 0.0 0.0GP-15 4/25/2019 8:37 0.2 -- 0.0 0.2 20.8 79.0 9.2 0.0 0.0General Data:
Beginning Ending Average Starting Date: 4/25/2019Weather: Sunny Sunny Sunny Starting Time: 7:15
Temperature, T (deg F): 42 52 47 Finishing Date: 4/25/2019Wind Speed (mph): 2 2 2 Finishing Time: 8:44
Wind Direction: 120 120 120 Monitored by: T. BerndahlBarometric Pressure, P (in Hg): 30.44 30.44 30.44 Instruments: GEM 2000
24hr Baro.Trend (rising / falling / steady / unsteady) Calibration Date: 4/25/2019
Headings: Notes:P(well) Relitive Pressure 1. Measurement for spike concentrations of CH4 and CO2 are recorded as a comment if observed during sampling.
CH4 Methane 2.CO2 Carbon Dioxide
O2 Oxygen 3. Exposed Perforation = perforated pipe section not submerged by liquid.
H2O Water Vapor 4. GP-10P added in January 2018. Monitoring performed at water level piezometer installed in the same boringN2 Nitrogen as GP-10.TOC Top of Casing
Water level measurements made where gas probe monitoring port allows for measurement, or where there is an adjacent measurement piezometer.
Exposed Portion of Perforations - Note 3
-
Gas Composition - Note 1

Barometric Pressure Trend - April 2019LRI Landfill, Pierce County, Washington
Project No. 04219001.04 SCS ENGINEERS
Source: Pierce County - Thun Field StationLat: 47.1 Long: 122.29 Elev: 538 ft-AMSL
Data Source: https://www.wunderground.com/history/daily/us/wa/puyallup/KPLU/date/2019-4-25
29.00
29.10
29.20
29.30
29.40
29.50
29.60
29.70
29.80
29.90
30.00
12:00:00 AM 3:00:00 AM 6:00:00 AM 9:00:00 AM 12:00:00 PM 3:00:00 PM 6:00:00 PM 9:00:00 PM 12:00:00 AM
Hg
Barometric Pressure Trend for April 25, 2019
Sampling Interval
29.8
29.9
30
30.1
30.2
30.3
30.4
30.5
1 2 3 4 5 6 7 8 9 10 11 12 13 14 15 16 17 18 19 20 21 22 23 24 25 26 27 28 29 30
Hg
April
Barometric Pressure Trend for April 2019
April 25, 2019

Exhibit 3 - Results of Landfill Gas Probe Monitoring SCS EngineersLandfill Gas Control System 04219001.04LRI Landfill
May-19Depth to
Location Balance WaterRefer Date Time P (well) CH4 Spike CH4 CO2 O2 (N2 & H2O) Note 2 Comments
Design. (in W.C.) (% by vol.) (% by vol.) (% by vol.) (% by vol.) (% by vol.) (ft-TOC) (ft) (%)
Normal Operating Rage:(min) - 0.3 0.3 - 20.0(max) 5.00 5.0 5.0 20.3 90.0
Perimter Gas ProbesGP-1 5/29/2019 8:21 0.1 2.4 1.5 2.7 16.3 79.5 NMGP-2 5/29/2019 8:26 2.1 17.0 15.9 18.5 0.0 65.6 NMGP-3 5/29/2019 8:33 0.0 -- 0.0 6.7 12.7 80.6 NMGP-4 5/29/2019 8:37 0.0 -- 0.0 3.4 16.8 79.8 NMGP-9 5/29/2019 8:41 0.0 -- 0.0 8.7 6.5 84.8 NMGP-10 5/29/2019 8:13 0.0 13.8 13.7 25.8 0.4 60.1 NMGP-10P 5/29/2019 8:11 0.0 19.2 23.2 29.4 0.0 47.4 NMGP-11 5/29/2019 8:04 0.0 -- 0.0 7.7 12.5 79.8 NMGP-12 5/29/2019 7:59 0.1 31.8 29.9 61.8 0.0 8.3 NMGP-13 5/29/2019 7:54 0.0 0.3 0.4 24.6 0.4 74.6 NMGP-14 5/29/2019 8:54 0.1 -- 0.0 0.1 20.5 79.4 NMGP-15 5/29/2019 8:49 0.1 -- 0.0 0.1 20.4 79.5 NMGeneral Data:
Beginning Ending Average Starting Date: 5/29/2019Weather: Overcast Overcast Overcast Starting Time: 7:54
Temperature, T (deg F): 53 62 57.5 Finishing Date: 5/29/2019Wind Speed (mph): 2 2 2 Finishing Time: 8:54
Wind Direction: 210 210 210 Monitored by: T. BerndahlBarometric Pressure, P (in Hg): 30.21 30.21 30.21 Instruments: GEM 2000
24hr Baro.Trend (rising / falling / steady / unsteady) Calibration Date: 5/29/2019
Headings: Notes:P(well) Relitive Pressure 1. Measurement for spike concentrations of CH4 and CO2 are recorded as a comment if observed during sampling.
CH4 Methane 2.CO2 Carbon Dioxide
O2 Oxygen 3. Exposed Perforation = perforated pipe section not submerged by liquid.
H2O Water Vapor 4. GP-10P added in January 2018. Monitoring performed at water level piezometer installed in the same boringN2 Nitrogen as GP-10.TOC Top of Casing
Water level measurements made where gas probe monitoring port allows for measurement, or where there is an adjacent measurement piezometer.
Exposed Portion of Perforations - Note 3
-
Gas Composition - Note 1

Barometric Pressure Trend - May 2019LRI Landfill, Pierce County, Washington
Project No. 04219001.04 SCS ENGINEERS
Source: Puyallup WALat: 47.12 Long: 122.26 Elev: 591 ft-AMSL
Data Source: https://www.wunderground.com/dashboard/pws/KWAPUYAL125/table/2019-05-29/2019-05-29/monthly
29.50
29.60
29.70
29.80
29.90
30.00
30.10
30.20
30.30
30.40
30.50
12:00:00 AM 3:00:00 AM 6:00:00 AM 9:00:00 AM 12:00:00 PM 3:00:00 PM 6:00:00 PM 9:00:00 PM 12:00:00 AM
Hg
Barometric Pressure Trend for May 29, 2019
Sampling Interval
29.5
29.6
29.7
29.8
29.9
30
30.1
30.2
1 2 3 4 5 6 7 8 9 10 11 12 13 14 15 16 17 18 19 20 21 22 23 24 25 26 27 28 29 30 31
Hg
May
Barometric Pressure Trend for May 2019
May 29, 2019

Exhibit 3 - Results of Landfill Gas Probe Monitoring SCS EngineersLandfill Gas Control System 04219001.04LRI Landfill
June-19Depth to
Location Balance WaterRefer Date Time P (well) CH4 Spike CH4 CO2 O2 (N2 & H2O) Note 2 Comments
Design. (in W.C.) (% by vol.) (% by vol.) (% by vol.) (% by vol.) (% by vol.) (ft-TOC) (ft) (%)
Normal Operating Rage:(min) - 0.3 0.3 - 20.0(max) 5.00 5.0 5.0 20.3 90.0
Perimeter Gas ProbesGP-1 6/12/2019 9:04 0.0 6.0 2.4 2.5 14.6 80.5 17.1 10.1 100.0GP-2 6/12/2019 9:10 0.0 17.8 16.0 18.9 0.0 65.1 16.4 9.4 100.0GP-3 6/12/2019 9:14 0.0 -- 0.0 10.0 8.7 81.3 11.5 7.5 100.0GP-4 6/12/2019 9:19 0.0 -- 0.0 3.0 14.7 82.3 9.8 5.8 100.0GP-9 6/12/2019 9:24 0.0 -- 0.0 8.6 6.3 85.1 12.4 0.0 0.0GP-10 6/12/2019 8:05 0.0 23.4 23.5 27.8 0.8 47.9 NMGP-10P 6/12/2019 8:01 0.0 11.1 15.4 22.0 3.8 58.8 NMGP-11 6/12/2019 7:55 0.0 -- 0.0 19.7 3.5 76.8 NMGP-12 6/12/2019 7:48 0.0 36.0 29.4 61.4 0.4 8.8 NMGP-13 6/12/2019 7:43 0.0 0.1 0.0 24.5 0.8 74.7 NMGP-14 6/12/2019 9:45 0.0 -- 0.0 0.1 19.4 80.5 13.3 0.0 0.0GP-15 6/12/2019 9:40 0.1 -- 0.0 0.2 19.6 80.2 10.0 0.0 0.0General Data:
Beginning Ending Average Starting Date: 6/12/2019Weather: Overcast Overcast Overcast Starting Time: 7:43
Temperature, T (deg F): 70 83 76.5 Finishing Date: 6/12/2019Wind Speed (mph): 9 2 5.5 Finishing Time: 9:45
Wind Direction: 70 300 185 Monitored by: T. BerndahlBarometric Pressure, P (in Hg): 29.60 29.50 29.55 Instruments: GEM 2000
24hr Baro.Trend (rising / falling / steady / unsteady) Calibration Date: 6/12/2019
Headings: Notes:P(well) Relative Pressure 1. Measurement for spike concentrations of CH4 and CO2 are recorded as a comment if observed during sampling.
CH4 Methane 2.CO2 Carbon Dioxide
O2 Oxygen 3. Exposed Perforation = perforated pipe section not submerged by liquid.
H2O Water Vapor 4. GP-10P added in January 2018. Monitoring performed at water level piezometer installed in the same boringN2 Nitrogen as GP-10.TOC Top of Casing
Water level measurements made where gas probe monitoring port allows for measurement, or where there is an adjacent measurement piezometer.
Exposed Portion of Perforations - Note 3
-
Gas Composition - Note 1

Barometric Pressure Trend - June 2019LRI Landfill, Pierce County, Washington
Project No. 04219001.04 SCS ENGINEERS
Source: Puyallup WALat: 47.12 Long: 122.26 Elev: 591 ft-AMSL
Data Source: https://www.wunderground.com/dashboard/pws/KWAPUYAL125/table/2019-06-12/2019-06-12/monthly
29.50
29.60
29.70
29.80
29.90
30.00
30.10
30.20
30.30
30.40
30.50
12:00:00 AM 3:00:00 AM 6:00:00 AM 9:00:00 AM 12:00:00 PM 3:00:00 PM 6:00:00 PM 9:00:00 PM 12:00:00 AM
Hg
Barometric Pressure Trend for June 12, 2019
Sampling Interval
29.8
29.9
30
30.1
30.2
30.3
30.4
30.5
1 2 3 4 5 6 7 8 9 10 11 12 13 14 15 16 17 18 19 20 21 22 23 24 25 26 27 28 29 30
Hg
June
Barometric Pressure Trend for June 2019
June 12, 2019