Calculations of the second virial coefficients of protein solutions with
JOURNAL O F RESEARCH of the National Bureau of Standards- A. Physics and Chemistry Vol. 68A, No. 1, January- February 1964
Second and Third Virial Coefficients for Hydrogen R. D. Goodwin, D. E. Diller, H. M. Roder, and L. A. Weber
C ryogenic Engineering Laboratory, National Bureau of Sta ndards, Boulder, Colo .
(August 15, 1963)
Second and t hird vi rial coeffi cie nts for para hydroge n ha ve been derived fr om closelv spaced PVT data from 24 t o 100 OK . They are in good agreemen t at J 00 oK wi t h publis hed data for normal hydrogen . An aly t ical represe nta t io ns of t he co mbined data fr om. a bout 20 t o 423 OK are presented whi ch may be usefu l in co mpu tat io n of t hermody na mi c fun ctio ns of the gas . These formu las a re rela ted t o th ose res ult ing f ro m. t he usc of t he Len na rd-J ones pote nt ial.
1. Introduction
As p art of an extensiv e progra m for determ ining th e thermodyn amIC and transport prop er ties of fluid parahy drogen, we have r ecently publish ed new da ta on the P - V- T surface from 15 to 100 OK [1 ]1 E arlier , we gave prelim inary v~tl u es of th e second and third v irial coefficients, B ( T ) and ('( 1') , in a paper describing the apparat us [2].
In this paper we presenL final v alues of the v iri a,} coeffi.cien ts derived from Lh e smooth ed compressibili~y .data [1]. These di ll er but sligh tly from th e preluumary v alues. Also we presen t and examine analytical r epresentations of B (T ) and OC T ) wh ich m ay b e useful for computing thermodyn amic fun ctions of th e gas .
In a for thcom ing paper [3] we h ave used th e rollowing arbitrary representat ions [4] to fi t our closely spaced da ta in order to facilita te computa tions of thermo fun ct ions below 100 OK:
4
('= 2: Ci T -i . i = l
On the other hand, in this paper use is made of oth er published virial coefficients as well as those from this la boratory to provide a more extensive tabula tion f~·om a bou.t 20 to 423 OK to which are fitted expresSlons h avmg forms sugges ted by the use of th e L enn ard-Jones potentia1. All coefficien ts were determined by th e m ethod of l east squares .
2 . Derivation of the Virial Coefficients
The virial expansion [5] m ay b e rearrang·ed to a form which, wh en trunca ted, is linear in density on isoth erms, conven ieo t for graphical or nnaly ticai d e-
I F igures in brackets indi cate t he literature references at the end of th is paper.
termination of lh e second ami t hi rd coefficients,
<P = (Pv- RT)v= RTB+ RTC/v+ (1)
Parameters R TB and H TO of eq (J ) as tr uncnted have been determined on isotherms by le3st-squar es using th e r eported compressibility da tn [1] and the orthobaric d ensiti es [6]. The number of da tum pairs, n, on each isotherm is given in column ea) of table 1. It was found by trial that data for densit ies above 0.007 g mol/cm3 diverge from the linear b ehavior of eq (1 ). These data were omit ted , with t he resul t that a m aximum o /" eig ht poin ts per isoth erm were applicable above 29 OK. (Th e above m aximum density for validity of eq (1) wi th only two terms is less t han half t he cri t ical density of 0.01 56 g mol/cm3
[6].) D erived values of B and C' are given in tables 2 and 3, resp ecLively, a t integral temperatures from 24 thro ugh 100 OK.
Equation (1) also was used fo r smoothing and interpolation of compressibility da t~L to th e high est densities by admitting as many terms as r equired by th e experim en tal precision [1 ] . At tempera tures below cri tical (32.98 OK), a single isotherm of eq (1) was used to represen t both vapor and compressed liquid . Th e number of da tum p airs, n ' , and number of terms, N , in polynomial (1) are given in column (b) of table 1 which includes also th e m aximum d ensity mul tiplied by 103 for each isotherm. With incr easing number of terms, th e m ean deviation decr eases more a t an odd numb er than at an even number of terms. Since coefficients of th e high er-order t erms of these divergent, al ternating polYIlOmials show no regular tempera ture-depend ence, t he expans ions canno t b e in terpreted as v irial equations [7]. N evertheless, values of Band 0 ob tained in this way are presen ted in appendix, t able 1, to m eet the commonplace ques tion of th e efrec t upon them of an incr eased number of terms in eq (1) . It may be seen th a t values of B ar e essentially the same as in table 2. Valu es of 0, while of similar magnitude to those in tab le 3, scntter badly .
121
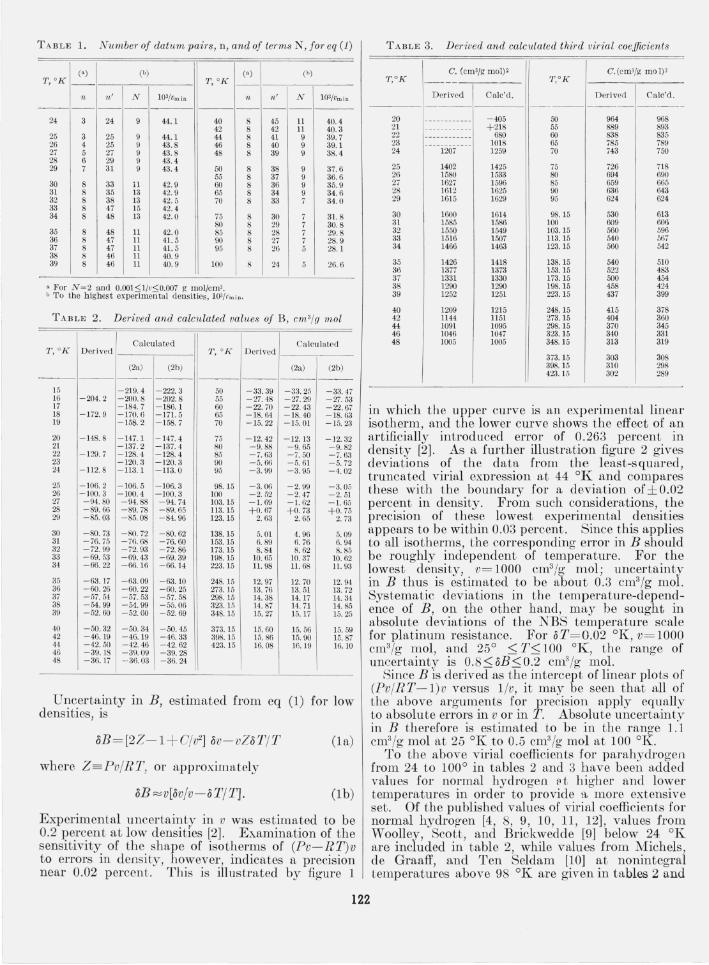
TABLE 1. N1l1nber of datum pairs, n, and of te1'1ns N, f Ol' eq (1 )
I (a) (b) (a) (b)
T, OK T, °1,(
n n' N I03/Vrn in n n' N lO3jvmin
----- - ----- - - -----
24 3 24 9 44. 1 40 8 45 11 40.4 42 8 42 11 40. 3
25 3 25 9 44.1 44 8 41 9 39.7 26 4 25 9 43.8 46 8 40 9 39.1 27 5 27 9 43.8 48 8 39 9 38. 4 28 6 29 9 43.4 29 7 31 9 43. 4 50 8 38 9 37.6
55 8 37 9 36.6 30 8 33 11 42. 9 60 8 36 9 35. 9 31 8 35 13 42.9 65 8 34 9 34.0 32 8 38 13 42. 5 70 8 33 7 34.0 33 8 47 15 42. 4 34 8 48 13 42.0 75 8 30 7 31. 8
80 8 29 7 30.8 35 8 48 11 42.0 85 8 28 7 29.8 36 8 47 11 41. 5 9() 8 27 7 28.9 37 8 47 11 41. 5 95 8 26 5 28. 1 38 8 46 11 40.9 39 8 46 11 40. 9 100 8 24 5 26. 6
a For N=2 and 0.001:0; 1/,, :0;0.007 g mol/em'. b To the highest experimen tal densities, 10'/l'm;n.
TABLE 2. Derived and calculated values of B, cm'/y mol
Calculated Calculated T, oJ( Derived ------ T, oJ( Derived
(2a) (2b) (2a) (2b) - ----------- ------------
15 - 219.4 - 222.3 50 - 33.39 - 33.25 -3a.47 16 -204.2 - 200.8 -202. 8 55 -27.48 - 27.29 -27.53 17 -184.7 - 186. 1 GO - 22. 70 -22.43 -22.67 18 - 172.9 - 170.6 -171. 5 65 - 18.64 - 18.40 -18.6:l 19 - 158.2 -158. 7 70 - 15.22 - 15. 01 -15. 23
20 -148.8 -147. 1 -147. 4 75 - 12.42 - 12. 13 - 12.32 21 - 137. 2 - 137.4 80 - 9.88 - 9.65 - 9.82 22 - 129.7 - 128.4 - 128. 4 8.\ -7.63 - 7.50 -7.63 23 -120.3 - 120.3 90 -5.66 -5. 61 -5.72 24 - 112.8 - 113.1 - U3.0 95 -3. 99 -3.95 -4.02
25 - 106.2 - 106.5 - 106.3 98. 15 - 3.06 - 2.99 -3. 05 26 - 100. 3 -100.4 - 100.3 100 -2.52 -2. 47 -2.51 27 -94. 80 -94.88 - 94.74 103. 15 - 1.69 -1.62 - 1. 65 28 -89.66 -89. 78 -89.65 113. 15 + 0.67 + 0.73 + 0. 75 29 -85.03 -85. 08 -84.96 123. 15 2.63 2. 65 2. 73
30 -80.73 -RO.72 -80.62 138.15 5. 01 4.96 5. 09 31 - 76.75 - ifi. 68 -76.60 153. 15 6.89 6.76 6. 94 32 - 72. 99 - 72.93 -72.86 173.15 8.84 8.62 8.85 33 -69.53 -69.43 -69.39 198. 15 10. 65 10.37 10. 62 34 -66. 22 - 66.16 -66. 14 223. 15 11. 98 11. 68 11. 93
35 -63. 17 -63. 09 -63.10 248.15 12. 97 12. 70 12. 94 36 -60.26 - 60.22 -60.25 273. 15 13. 76 13.51 13. 72 37 -57.54 -57.53 -57.58 298. 15 14.38 14.17 14.34 38 -54.99 -54.99 -55.06 323. 15 14.87 14.71 14.85 39 -52. 60 -52. 60 -52.69 348. 15 15.27 15.17 15. 25
40 -50.32 -50. 34 -50. 45 373. 15 15.50 15.56 15. 59 42 -46.19 -46.19 -46.33 398. 15 15.86 15.90 15.87 44 -42. 50 - 42.46 -42.62 423. 15 16. 08 16.19 16. 10 46 - 39.18 -3R 09 -39.28 48 - 36.17 - 36.03 -36. 24
Uncertainty III B, estimated from eq (1) for low densities, is
oB= [2 Z- 1+ 0 /v2) ov-vZoT/T (I a)
where Z -==Pv/RT, or approximately
oB ~v[ov/v-DT/ T]. (lb)
Experimental uncertainty in v was estimated to be 0.2 percent at low densities [2). E.\.amination of the sensitivity of the shape of isotherms of (Pv-RT)v to errors in density, however, indicates a precision near 0.02 percent. TJlis is illustrated by figure 1
TABLE 3. D erived and calculated third virial coeJficients
C. (em'/g mol)' C. (c m'/g mo I), 'f,oK ---------- T,oK
Derived Calc'd. Derived Calc'd . --------- ------ ----._---
20 -------- ---- -405 50 964 968 21 ---------- -- +218 55 889 893 22 ---------- -- 680 60 838 835 23 ------------ 1018 65 785 789 24 1207 1259 70 743 750
25 1402 1425 75 726 718 26 1580 1533 80 694 69() 27 1627 1596 85 659 665 28 1612 1625 9() 636 643 29 1615 1629 95 624 624
30 1600 1614 98. 15 530 613 31 1585 1586 100 609 606 32 1550 1549 103. 15 560 596 33 1516 1507 113. 15 540 567 34 1466 1463 123. 15 560 542
35 1426 1418 138.15 540 510 36 1377 1373 153.15 522 483 37 1331 1330 173. 15 500 454 38 129() 129() 198.15 458 424 39 1252 1251 223. 15 437 399
40 1209 1215 248.15 415 378 42 1144 1151 273. 15 404 360 44 1091 1095 298.15 370 345 46 1046 1047 323. 15 340 331 48 1005 1005 348. 15 313 319
373. 15 303 308 398. 15 310 298 423. 15 302 289
in which the upper curve is an experimental linear isotherm, and the lower curve shows the effect of an artificially introduced error of 0.263 percent in density [2). As a further illustration figure 2 gives deviations of the data from the least-squared , truncated vil'ial eXDl'ession at 44 01{ and compares these with the boundary for a deviation of ± 0.02 percent in density. From such considerations, the precision of these lowest experimental densities appears to be within 0.03 percent. Since this applies to all isotherms, the corresponding error in B should be roughly independent of temperature. For the lowest density, V= 1000 cm3 jg mol; uncertainty in B thus is estimated to be fl,bout 0.3 cm3/g mol. Systematic deviations in the temperature-dependence of B , on the other hand, may be sought in absolute deviations of the NBS temperature scale for platinum resistance. For oT= O.02 OK, V= 1000 cm3/g mol, and 25 0 ~ T~ 100 OK , the range of uneertainty is 0.8~oB~0.2 cm3/g mol.
Since B is derived as the intercept of linear plots of (Pv /RT- 1)v versus l /v, it may be seen that all of the above arguments for precision apply equally to absolu te errors in V Ol' in T. Absolute uncertaintv in B therefore is estimated to be in the range l.'1 cm3/g mol at 25 OK to 0.5 cm3/g mol at 100 OK.
To the above virial coefficients for parahydrogefl from 24 to 100° in tables 2 and 3 have been added values for normal hydrogen ~t higher and lower temperatures in order to provide a more extensive set. Of the published values of virial coefficients for normal hydro~'en [4 , 8, 9, 10, 11, 12), values from Woolley, Scott, and Brickwedde [9) below 24 OK are included in table 2, while values from Michels, de Gl'aaff, and Ten Seldam [10) at nonintegral temperatures above 98 OK are given in tables 2 and
122

PRE SSURE (atm) o 2.7 5 .0 7.0 8 .0 1i0
-150 ,---,--,---,---,-------.,.--------,
-160
, 2
~- 170 o ,
<0 E o
> Ia:
, ~- 1 80
-190
33 oK
Effect of a 0 .2 63 % systemat ic error in den s ity
P (m ol e Icm 3 )( 10 3)
FIG tJ RE 1. EfJect of systematic e1'7'OI' in density [2] u pon the linear behavior of eq. (1), f or the 33 Of( isotherm.
'r ho notation is Z=. PvjR'P . Circles: experimental linear isotherHl . 'l'rianglos: salilC clata with artifically introclucecl error of 0.263 percent.
I I I I I I I I
\ \ Dev ia t ion of do to from the \ Virial Equat ion
\
b T = 44 oK , <Z> = RTV (Z - I) = RT B + RTCp , ,
" " ..... ... 0 ci. "', ~
~ ------0& 0" ----- - --
0 -------~--u 0 -----] 0
..----0& .-~
/ /
I I
I I ~O.O2% Er ror in density
I 1 L L I I I I 0 4 5 6 9
P (mole/ cm3 x 10 ' )
FIGURE 2. Deviations of data, <1> = (Z- l )RTv, where Z = Pv/RT, from eq. (1) at 44 0 K.
Dashed lines corresp ond to ± 0.02 percent systematic error in density.
123
3. Uncertainty of the data of Michels et al., was estimated by them to b e 0.15 cm3/g mol in B, and about 15 percent in C. Excellent agreement of the independent data at 100 oK sugges ts that the virial coefficients of these hydrogen modifications may b e indistinguishable at this and higher tempe1'atUl'es . Small differ ences h ave b een detected at lower temperatures [1 3].
3. Representation of Second Virial Coefficient
Figure 3 presents the derived data of table 2 as ,1
function of 1'- 5/4 . The data for normal hydrogen at low temperatures are seen to deviate from the straight line extrapolated from the parahydrogen data, in agreement with the experimental comparison of the two modifications m ade by Beenakker et al. [1 3].
Systematic deviations persist with all analytical representations which have b een investigated for the temperatuI'e-dependence of B. It therefore does no t appear possible to select a form which is best for all purposes from among the followin g two, which ut,ilize Lwo a nd four co nstants, r espec tively, with not,ltion :c= To/T:
B = B o[ 1-x5!4],
B o= 19.866 cm3/g mol,
4 B = ~ B i x (2i- 1l ! 4,
i = !
B 1=+42.464,
B 3=- 2.2982,
6. = 0.066 cm 3/g mol.
1'0= 109.83 oK ,
6. = 0.125 cm3/g mol. (2a)
1'0= 109.781 oK ,
B 2 = -37.1172,
B 4=-3.0484,
(2b)
N(ean deviations, given for each equat ioll above , ,1,1'e defined as
n 6. = (n-N)-I L:: !B- Beule l,
wherein n = 49 is the number of datum pairs, and N is the number of constants in the equation. Calculated results from these equations are given in table 2, and the individual deviations are plot ted in figure 4 .
The form of (2 a) is that used by Keesom for h elium [14], the constant high-temperature limit corresponding to the rigid-sphere model for molecular interaction [5] . The value of 130 in (2a) is compa mble with the volume 22 .65 cm 3/g mol of solid normal hydrogen at 4.2 OK [9]. The rather good fit provided by this simple equation is indicated by figUl'e 3. Equation (2 b) consists of the leading terms of an expansion derived from the LennardJ ones potential [5] . Appendix, table II, gives coefficients for that expansion with increasing number of terms. (The form of the expansion given in

50-------,,------,,-------,-------,-------,-------,--------,-------,
, ~ ~ g I I T
o
:il I
40 -5/4 .3
T -10 -
FIGURE 3. Second viTial coefficient, B, vel'SUS T - 5/1 .
Open circ!es fl re for parabydrogen. Filled circles for normal hydrogen below 21 oK are from [9] "nu " hoyc 100 oK from [10].
0.4.----,-------,----,---,---,----,--~,---------,_-----,---___,--___,--,--,1
0 2 .
~ o~_,oo--_.~~---------.._------~--~-------.--------------~~~~ aJ o
00 ~ . o 0 o ·
° 0 • 0
-0.2
T, "K --
EaN. 2- " ,0
2- 8 . •
FIGURE 4. D eviations of second viTial coefficient, B, in cm3/g 11101, from eq (2a), open circles and from (2b) , filled ciTcles .
the appendix does not include the root, To. ) It is seen that four terms give an acceptable representation. vVhereas use of additional terms improves the fit, the similarity in form of the two sets of deviations in figure 4 suggests the presence of systematic experimental errors. If such errors are present, it is doubtful that use of higher terms wo uld be justi-
124
fied . The form of the deviations in figure 4 having been found also with analytical representations of B other than polynomials, it is improbable that they arise from the selected polynomial forms of (2a) and (2b). It appears equally improbable that they arise entirely from deviations of the NBS temperature scale used.

J
I I
I I
1
4. Representation of Third Virial Coefficient
The Lennftl'd-Jones potential yields an expansion in powers of T- l/2 [5]. From this key, eq (3) was evolved , using notation X= To/T,
To = 20.615 oK,
c= 2.1486,
00= 1310.5 (cm3/g mol)2,
Ll= 17.4 (cm3/g mol)2. (3)
It represents the third virial coefficient within the apparent precision of the data. The last factor on the right of (3) differs significantly from unity only at temperatures below 40 oIL Calculated values of G are given in table 3.
The series
(3a)
requires at least six terms to give a better representation than eq (3) . The alternatinO" series obtained by least-squares, however, are highly divergent; for example, the fifth term for N = 6 exceeds the value of 0 by factor 240 at 24 OK.
5. Note on Two-Term Representations
The behavior of plots of y= B or 0 as funct,ions of X= To/T suggests an empirical relation of the form
y/Yo= XI' - x ' (4)
with constants J.l < v. The limi tfttions of (4) having been examined in obtaining (2) and (3) above, it is reasonftble next to examine the relation
y/Yo= exp (kxl')- exp (kx ') . (4 a)
Since t be five parameters in (4a) must be found tediously by trial, the exploration has been cliscontinued with preliminary results in the following table. It is concluded that (4a) may be sufficiently flexible to offer promise of accurate representations of both Band O.
y I' v k 1'0 yO n LI
--------------------. ---B 74 I/o 0. 6 110. 9 92. IS 49 0.20
------------------------c I/o 1 4 20 135 32 55
n
Ll = (n - 3)- IL; iY - Ycalc i .
Robert J. COl'l'uccini and Paul F. Wacker of this labol'tttol'Y made numerous suggestions for improving the manuscript, for which the authors are most appreciative. This work was supported by the N ational Aeronautics and Space Administration.
125
6. Appendix
TABLE I. Vi"ial coe.fJici ents f rom extended isothe1'lns of eq (1 )
T, OJ( 13, cm3/g lllOl C, CJ113/g 111012 1', 0 J( B, cm'/g mol C, cm3/g mol2
24 -11 5.3 5Wl 40 -50.J 8 1027 42 - 46. 02 9J9
25 - 106.5 1952 44 - 42.54 11;)4 2(, - 101.1 2736 46 -39. 25 1108 27 - 95. 0J 2032 48 -36. 28 1103 28 - 90. 36 262'1 29 -85. 72 2561 50 -33. 49 1050
fi5 -27.67 1068 30 -SO. 96 1725 60 -22. 93 10,\7 31 - 77.24 21S0 65 - 18.77 906 32 - 73. 69 2642 70 - 15.30 R09 33 - 69. 14 554 34 - 66. 27 15'19 75 -12.57 S54
80 -9.96 767 35 - 63. 29 1537 85 - 7.58 615 36 - 60. 30 1402 90 - 5.57 559 37 - 57. 51 J280 95 - 4. 00 6:J7 38 - 55.04 1335 39 - 52. 66 1321 JOO - 2. 52 620
TABLE II. Polynomial coe.Oic'ients in LennaTd-J ones ex pansion for second virial coeffic ient
N B = L;b tT - (2t-1) !\ (cm3/gmol). (2b)
, i ~ l
~N 3 4 5 6 ~
b, ~
b, + 1.1 8579. J02 + I. 37452. 102 + 1. 45098. 10' + 1. 20054. ]0' D, - 7. 320 17. 10' - I. 25884. 10' -1. 55190. 10' -3.70405. 102 /)3 -5.21897. 10' - 8. 16662. JO' +3. 04443. 10' - 1. 78006. J Q' b, - 1. ] ;)500. 10' - 3.24 136. 10' + 1. 41 284. 10' b, + 4. 070S5. 10' -6. 48921. 10' b, + 1.05121. 106 d 0.2991 0.0664 0.06 15 0. 0408
7 . References [1] R. D . Goodwin, D. E. Diller, H. M . R oder, and L. A.
Weber, Pressure-densi ty-t emperatul'e r elations of fluid parahydrogen from 15 to 100 OK a t press ures to 350 atm, J. R es. NBS 67A (Phys. and Chem.) No.2, 173 (1963) .
[2] R. D. Goodwin , Apparatus for determination of pressure-density-temperature r elations and specific heats of hydrogen to 350 atm. at temperatures above 14 OK, J. Res. NBS 65C (Eng. and Instr. ) No. 4, 231 (1961) .
[3] H. M. Roder, L. A. Weber, and n. D . Goodwin , Thermodynamic and related propertie'S of parahydl'ogen from the triple point to 100 OK at pressure's to 340 atm (to be published).
[4] L. Holbol'll and J. Otto, On th e isotherms of some gases between + 400 and - 183°, Z. Physik 33, 1(1925); 38, 359 (1926) .
[5] J. O. Hirschfeld cr, C. F. Curti ss, and R. B. Bi I'd, Molecular theory of gases andliqllids (Johu Wiley a nd Sons Inc., N ew York, N.Y., 1954).
[6] I-I. M . Rod er, D. E . Diller, L. A. Weber, a nd R. D . Goodwin, The orthobari e densiti es of parahydrogen, derived heats of vaporization a nd critical constants, Cryogenics 3, 16 (1963).
[7] A. Michels, J. C. Abels, C. A. T en Scldam, and W. d e Graaff, Polynomial representation of experimental data ; application to virial coeffici ents of gases, Physi ca 26, 381 (1960) .
[8] H. L. Johnston, 1. 1. Bezman, and C. B. Hood, JoulcThomson effects in hydrogen at liquid air and room t emperatures, J. Am. Chem. Soc. 68, 2367 (1946)
[9] H. W. Woolley, R. B. Scott, and F. G. Brick"'pdde, Compilation of thermal properties of hydrogpn in its various isotopic and ortho-para modifica tion s, J. R es. NBS 41, 379 (1948) RP1932.
[10] A. Michels, W. de Graa ff, and C. A. T en Seldam, Virial coefficients of hydrogen and dcuterium at temperatures betwecn - 175°C and + 150°C. Conclusions from the second viria l coefficient with rcgard to the intermolecular potent.iai, Physica 26, 393 (1960) .
[11] Roseann Piser, The vi rial co pffici ents of hydrogen, Thesis, D ept. of Chem., Brooklyn College (Jan. 1960).
126
[12] H . F . P. Knaap, M. Knocst er, C. M . Knobler, and J. J. M . Becnakker, The second vi rial coeffici ents of the hydrogen isotopes bet"' een 20 and 70 OK, Physica 28,21 (1962).
[13] J . J . M . Beenakker, F. H . Varekamp, and H . F . P . Knaap, The second vi rial coeffici ent of ortho and para hydrogen at liquid hydrogcn temperatures, Physica 26, 43 (I 960).
[14] W. H . K eesom, Helium (Elseyi er Pub!. Co., (1942).
(Paper 68Al- 260)