SEB Enskilda Finnish Blue Chip Seminar 2011 - UPMassets.upm.com/Investors/Documents/2011/SEB Finnish...
23
UPM SEB Enskilda Finnish Blue Chip Seminar 2011 Jussi Pesonen President and CEO 25 August, 2011
Transcript of SEB Enskilda Finnish Blue Chip Seminar 2011 - UPMassets.upm.com/Investors/Documents/2011/SEB Finnish...

UPM
SEB Enskilda Finnish Blue Chip Seminar 2011
Jussi Pesonen
President and CEO
25 August, 2011
FINANCIALS Q2 2011

| © UPM
FINANCIALS
Solid result despite challenging cost
environment
Gearing
44% -11 pp
EBITDA
EUR 751 m +110 m
Operating cash flow
EUR 446 m +135 m
Net debt
EUR 3,162 m -675 m
2
Sales
EUR 2,423 m +9%
EBITDA
EUR 372 m +5%
Operating profit (*
EUR 201 m +1%
EPS (*
EUR 0.26 -10%
*) excluding special items
Q2/2011 vs. Q2/2010 H1/2011 vs. H1/ 2010

| © UPM 3
0
50
100
150
200
250
300
350
400
450
500
EBITDA
Q1/11
EBITDA
Q2/11
FINANCIALS
Q2 2011 EBITDA increased from last year
0
50
100
150
200
250
300
350
400
450
500
EBITDA
Q2/10
EBITDA
Q2/11
EUR million
Prices,
currency
Fibre
costs
Other
variable
costs
Fixed
costs
Deliveries
Energy
costs
EUR million
Prices,
currency Fibre
costs
Other
variable
costs
Fixed
costs
Deliveries Energy
costs
353 15.9%
372 15.4%
379 16.1%
372 15.4%
Price and cost development
stabilised in Q2 vs. Q1 2011
Higher prices offset the rise
in costs in Q2 vs. Q2 2010

| © UPM
FINANCIALS
Operating profit was steady
4
-100
-50
0
50
100
150
200
250
300
EUR million
201 8.3%
199 9.0%
31 1.7%
Operating profit excluding special items
155 6.5%
| © UPM
FINANCIALS
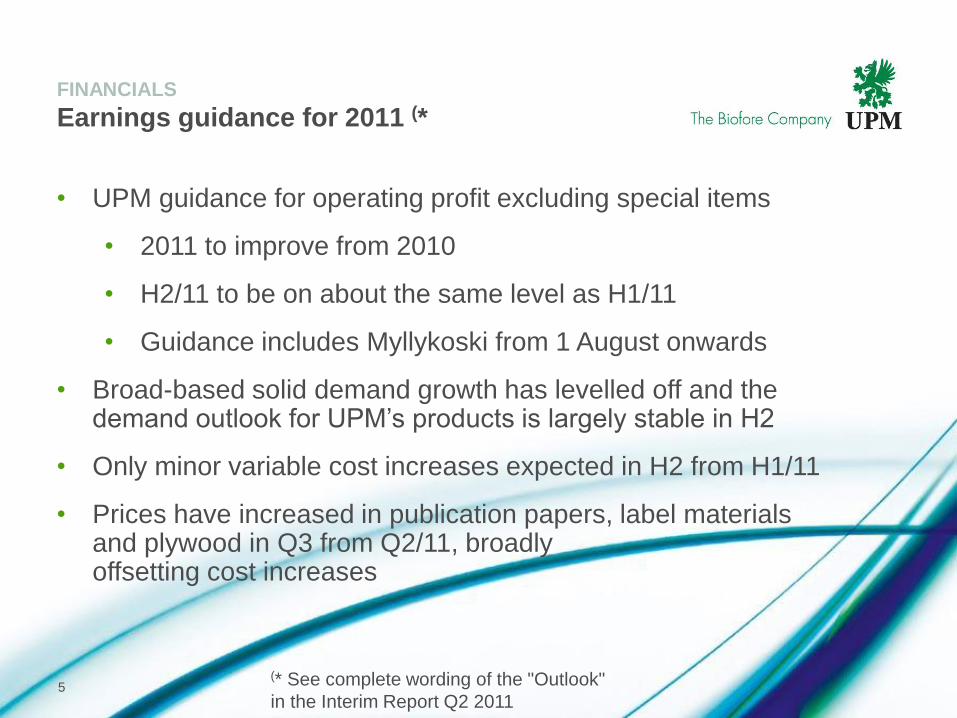
Earnings guidance for 2011 (*
(* See complete wording of the "Outlook"
in the Interim Report Q2 2011
• UPM guidance for operating profit excluding special items
• 2011 to improve from 2010
• H2/11 to be on about the same level as H1/11
• Guidance includes Myllykoski from 1 August onwards
• Broad-based solid demand growth has levelled off and the demand outlook for UPM’s products is largely stable in H2
• Only minor variable cost increases expected in H2 from H1/11
• Prices have increased in publication papers, label materials and plywood in Q3 from Q2/11, broadly offsetting cost increases
5

STRATEGIC FOCUS AREAS

| © UPM
8,3
3,5
5,4
8,3
7,2
6,0
8,2
0
2
4
6
8
10
12
2005 2006 2007 2008 2009 2010 H1 2011
Operating profit recovered to the pre-
recession level
% of sales Operating profit excluding special items
Target over 10%
7

| © UPM
8
Operating profit evenly distributed
– Paper is a major source of cash flow
Forest and Timber 3%
Pulp 23%
Energy 14%
Label 6%
Plywood 2%
Cumulative
EBITDA 2007 – H1 2011
Paper 53%
Forest and
Timber 13%
Pulp 35%
Energy 25%
Label 7%
Plywood 0%
Paper 19%
Cumulative
Operating profit 2007 – H1 2011
excluding special items

| © UPM
UPM's business portfolio and performance over the recession
9
0
20
40
60
80
100
120
140
160
180
200
220
Energy Pulp Label Paper Forest
and
timber
Plywood UPM
Total
0
5
10
15
20
25
30
35
40
Energy Pulp Label Paper Forest
and
timber
Plywood UPM
Total
Profitability
challenge
Average margins and returns over 2007 – H1 2011
Sales in H1 2011, as % of the economic peak year H1 2007
Operating margin % (** ROCE % (**
% %
**) excluding special items
WACC
100%
*) includes acquisition of the Uruguayan operations
(*

Myllykoski acquisition

| © UPM
MYLLYKOSKI ACQUISITION
Consolidation and restructuring are required
to create value in the Paper business
• UPM is determined to be the cost leader in the European paper
industry and the global leader in magazine papers
• A fundamental improvement in cost efficiency and value creation in
the Paper business are necessary. These are best achieved through
consolidation and restructuring
• The merits of the Myllykoski acquisition are clear. It creates UPM a
unique momentum for profitability improvement
UPM aims for a step change in its Paper business profitability
11

| © UPM
MYLLYKOSKI ACQUISITION
Myllykoski acquisition
UPM acquired Myllykoski Oyj and Rhein Papier GmbH
• Enterprise value EUR 900 million
• Publication paper production capacity of 2.8 million tonnes
• 0.8% stake in Pohjolan Voima Oy (PVO)
EU Commission approved the transaction on 13 July 2011
and it was completed on 1 August
Financing
• UPM issued 5 million new shares at the subscription price of
EUR 10.84 per share
• UPM raised bank loans of EUR 800 million
12

| © UPM
MYLLYKOSKI ACQUISITION
Summary of the financial impacts
Earnings and cash flow
• Preliminary estimate for annual cost synergies exceeds EUR 100 million
• Cash flow enhancing from the second half of 2011
• Earnings per share enhancing from 2012
Other
• UPM will book a one-off gain of approximately EUR 40 million in Q3 2011
• Preliminary estimate for restructuring costs and investments EUR 100-150m
Balance sheet
• Net debt increases by approximately EUR 800 million
• Gearing estimated to increase by 11 percentage points – UPM gearing on 30 June was 44%
13

| © UPM
14
Reported
1-6/2011
Adjustments Pro forma 1-6/2011
Sales, €m 4,779 722 5,501
EBITDA, €m 751 33 784
Operating profit, €m
‒ excl. special items, €m
487
399
-7
-7
480
392
Profit before tax, €m
‒ excl. special items, €m 511
355
-24
-24
487
331
Profit for the period 464 -17 447
MYLLYKOSKI ACQUISITION Pro forma financials – Group

| © UPM
MYLLYKOSKI ACQUISITION
Near term focus
• Customers and brand alignment
• UPM introduction to Myllykoski employees
– learning of best practices and achieving together
• Speed in integration and prompt capturing of
synergies
• Now access to detailed information.
The planning work to identify cost synergies is
proceeding towards announcement as soon as
possible, however latest by mid-September
15

| © UPM
16
Managing change
– UPM has a consistent track record
Restructuring and
efficiency
improvement
Cost competitiveness
and cash flow
Improved
financial flexibility
500
600
700
800
900
1000
2003 2004 2005 2006 2007 2008 2009 2010
tons/person
+28% in 5 years
Paper business group capacity per employee
closed
1.8mt (14%)
of capacity

| © UPM
17
Managing change
– UPM has a consistent track record
0 %
5 %
10 %
15 %
20 %
25 %
Q10
6
Q20
6
Q30
6
Q40
6
Q10
7
Q20
7
Q30
7
Q40
7
Q10
8
Q20
8
Q30
8
Q40
8
Q10
9
Q20
9
Q30
9
Q40
9
Q11
0
Q21
0
Q31
0
Q41
0
Q11
1
Q21
1
Norske Skog Stora Enso M-realHolmen Sappi SCAIP Lecta UPM
EBITDA margin compared with peers
Restructuring and
efficiency
improvement
Cost competitiveness
and cash flow
Improved
financial flexibility

| © UPM
18
Managing change
– UPM has a consistent track record
2 500
3 000
3 500
4 000
4 500
5 000
5 500
Q10
6
Q20
6
Q30
6
Q40
6
Q10
7
Q20
7
Q30
7
Q40
7
Q10
8
Q20
8
Q30
8
Q40
8
Q10
9
Q20
9
Q30
9
Q40
9
Q11
0
Q21
0
Q31
0
Q41
0
Q11
1
Q21
1
1,5
2,0
2,5
3,0
3,5
4,0
4,5
Net debt, € million Net debt / EBITDA (trailing 12 months)
Net debt
Net debt / EBITDA
Restructuring and
efficiency
improvement
Cost competitiveness
and cash flow
Improved
financial flexibility
| © UPM
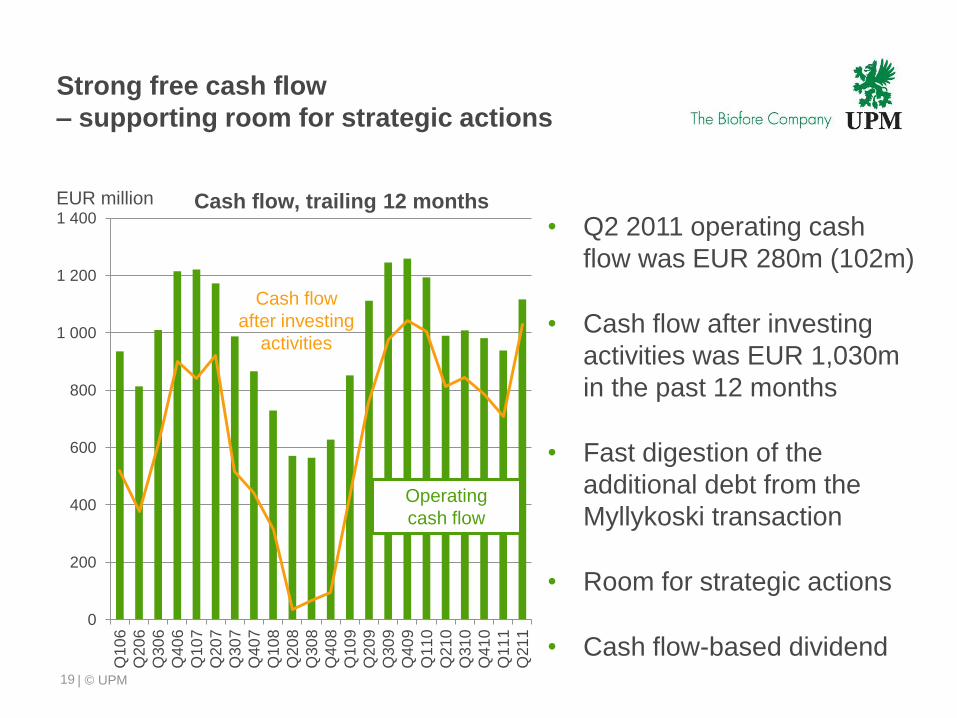
Strong free cash flow
– supporting room for strategic actions
19
0
200
400
600
800
1 000
1 200
1 400
Q10
6
Q20
6
Q30
6
Q40
6
Q10
7
Q20
7
Q30
7
Q40
7
Q10
8
Q20
8
Q30
8
Q40
8
Q10
9
Q20
9
Q30
9
Q40
9
Q11
0
Q21
0
Q31
0
Q41
0
Q11
1
Q21
1
Operating
cash flow
Cash flow
after investing
activities
EUR million Cash flow, trailing 12 months
• Q2 2011 operating cash
flow was EUR 280m (102m)
• Cash flow after investing
activities was EUR 1,030m
in the past 12 months
• Fast digestion of the
additional debt from the
Myllykoski transaction
• Room for strategic actions
• Cash flow-based dividend

| © UPM
Low operational investments – strategic capex
focused on value enhancing M&A
20
0
200
400
600
800
1 000
05 06 07 08 09 10 11e
€ million
Operational investments
350
Capital expenditure
Strategic investments
Depreciation
Uruguay
acquisition
20
Estimate
Myllykoski
acquisition

| © UPM
UPM has potential for increasing
shareholder value
21
Solid free cash flow
Competitive, valuable, cash-generative assets
Cash flow-based dividend
Improve profitability through
consolidation, cost synergies, restructuring
Case Myllykoski
Growth
Biofuels
Label, Paper in growth markets
Low emission Energy, competitive Pulp
New Biofore products
Strategic enabler
floor for share price
Short- to mid-term:
improvement
in profitability
and cash flow
Mid- to long-term:
increase valuation
multiples by growth
and reshaping
portfolio