Seasonal variability of the red tide-forming heterotrophic ... · Plankton Benthos Res 8(1):...
22
Plankton Benthos Res 8(1): 9–30, 2013 Seasonal variability of the red tide-forming heterotrophic dinoflagellate Noctiluca scintillans in the neritic area of Sagami Bay, Japan: its role in the nutrient-environment and aquatic ecosystem KOICHI ARA 1, * , SACHIKO NAKAMURA 1 , RYOTO T AKAHASHI 1 , AKIHIRO SHIOMOTO 2,3 & JURO HIROMI 1 1 Department of Marine Science and Resources, College of Bioresource Sciences, Nihon University, Fujisawa, Kanagawa 252– 0880, Japan 2 National Research Institute of Fisheries Science, Fisheries Research Agency, Kanazawa-ku, Yokohama, Kanagawa 236– 8648, Japan 3 Present Address: Department of Aquatic Bioscience, Faculty of Bioindustry, Tokyo University of Agriculture, Abashiri, Hokkaido 099–2493, Japan Received 19 June 2012; Accepted 14 January 2013 Abstract: The role of the heterotrophic dinoflagellate Noctiluca scintillans in affecting the nutrient-environment and aquatic ecosystem was investigated in the neritic area of Sagami Bay, Kanagawa, Japan, from January 2002 to De- cember 2006, based on abundance, intracellular nutrient content, excretion rate and response of phytoplankton (dia- toms) to enrichment of nutrients extracted from N. scintillans cells. Seasonal variations in abundance and vertical distribution of N. scintillans were significantly related to the physical structure of the water column, water tempera- ture, chlorophyll a and primary productivity. Intracellular nutrient contents, except for Si(OH) 4 -Si, revealed clear sea- sonal fluctuations, which were significantly correlated to cell size variations. Thalassiosira rotula increased to higher cell abundances at higher concentrations of nutrients, which were extracted from N. scintillans cells. NH 4 + -N and PO 4 3– -P excretion rates were much higher during the first 1–3 h, and decreased rapidly with time. Daily NH 4 + -N and PO 4 3– -P supply by N. scintillans excretion was estimated to be on average 34.8% and 55.3%, especially 50.6–85.4% and 80.5–135.8% in April–July (monthly mean), of the daily N and P requirement for primary production, respec- tively. The large amounts of nutrients regenerated and released by N. scintillans excretion can increase the N and P concentrations in ambient seawater, especially in the upper layer in spring–summer, and consequently affect phyto- plankton (diatom) abundance. These may exacerbate eutrophication in these waters by a mutually supportive relation- ship between phytoplankton and N. scintillans: bottom-up control (phytoplankton–N. scintillans ) and nutrient supply by N. scintillans to phytoplankton through excretion. Key words: excretion rate, intracellular nutrient contents, Noctiluca scintillans, nutrient pools and supplies, Sagami Bay Introduction Red tide outbreaks caused by the large heterotrophic di- noflagellate Noctiluca scintillans (Macartney) Ehrenberg (Noctiluca hereafter), one of the most common red tide- forming organisms, have been frequently observed in tem- perate-to-tropical estuarine and coastal waters around the world (e.g. Kuroda 1990, Elbrächter & Qi 1998). Seasonal, year-on-year and/or spatial variations in abundance of Noctiluca have been extensively studied in temperate and subtropical estuarine and coastal waters (e.g. Kuroda & Saga 1978, Uhlig & Sahling 1990, Huang & Qi 1997, Tada et al. 2004, Miyaguchi et al. 2006). These studies found distinct seasonal variations with considerable peaks (i.e. blooms, red tide outbreaks) of Noctiluca abundance in spring–summer after the final stage of spring phytoplank- * Corresponding author: Koichi Ara; E-mail, [email protected] Plankton & Benthos Research © The Plankton Society of Japan
Transcript of Seasonal variability of the red tide-forming heterotrophic ... · Plankton Benthos Res 8(1):...

Plankton Benthos Res 8(1): 9–30, 2013
Seasonal variability of the red tide-forming heterotrophic dinoflagellate Noctiluca scintillans in the neritic area of Sagami Bay, Japan: its role in the nutrient-environment and aquatic ecosystem
KOICHI ARA1,*, SACHIKO NAKAMURA1, RYOTO TAKAHASHI1, AKIHIRO SHIOMOTO2,3 & JURO HIROMI1
1 Department of Marine Science and Resources, College of Bioresource Sciences, Nihon University, Fujisawa, Kanagawa 252–0880, Japan
2 National Research Institute of Fisheries Science, Fisheries Research Agency, Kanazawa-ku, Yokohama, Kanagawa 236–8648, Japan
3 Present Address: Department of Aquatic Bioscience, Faculty of Bioindustry, Tokyo University of Agriculture, Abashiri, Hokkaido 099–2493, Japan
Received 19 June 2012; Accepted 14 January 2013
Abstract: The role of the heterotrophic dinoflagellate Noctiluca scintillans in affecting the nutrient-environment and aquatic ecosystem was investigated in the neritic area of Sagami Bay, Kanagawa, Japan, from January 2002 to De-cember 2006, based on abundance, intracellular nutrient content, excretion rate and response of phytoplankton (dia-toms) to enrichment of nutrients extracted from N. scintillans cells. Seasonal variations in abundance and vertical distribution of N. scintillans were significantly related to the physical structure of the water column, water tempera-ture, chlorophyll a and primary productivity. Intracellular nutrient contents, except for Si(OH)4-Si, revealed clear sea-sonal fluctuations, which were significantly correlated to cell size variations. Thalassiosira rotula increased to higher cell abundances at higher concentrations of nutrients, which were extracted from N. scintillans cells. NH4
+-N and PO4
3–-P excretion rates were much higher during the first 1–3 h, and decreased rapidly with time. Daily NH4+-N and
PO43–-P supply by N. scintillans excretion was estimated to be on average 34.8% and 55.3%, especially 50.6–85.4%
and 80.5–135.8% in April–July (monthly mean), of the daily N and P requirement for primary production, respec-tively. The large amounts of nutrients regenerated and released by N. scintillans excretion can increase the N and P concentrations in ambient seawater, especially in the upper layer in spring–summer, and consequently affect phyto-plankton (diatom) abundance. These may exacerbate eutrophication in these waters by a mutually supportive relation-ship between phytoplankton and N. scintillans: bottom-up control (phytoplankton–N. scintillans) and nutrient supply by N. scintillans to phytoplankton through excretion.
Key words: excretion rate, intracellular nutrient contents, Noctiluca scintillans, nutrient pools and supplies, Sagami Bay
Introduction
Red tide outbreaks caused by the large heterotrophic di-noflagellate Noctiluca scintillans (Macartney) Ehrenberg (Noctiluca hereafter), one of the most common red tide-forming organisms, have been frequently observed in tem-perate-to-tropical estuarine and coastal waters around the
world (e.g. Kuroda 1990, Elbrächter & Qi 1998). Seasonal, year-on-year and/or spatial variations in abundance of Noctiluca have been extensively studied in temperate and subtropical estuarine and coastal waters (e.g. Kuroda & Saga 1978, Uhlig & Sahling 1990, Huang & Qi 1997, Tada et al. 2004, Miyaguchi et al. 2006). These studies found distinct seasonal variations with considerable peaks (i.e. blooms, red tide outbreaks) of Noctiluca abundance in spring–summer after the final stage of spring phytoplank-* Corresponding author: Koichi Ara; E-mail, [email protected]
Plankton & Benthos Research
© The Plankton Society of Japan

10 K. ArA et al.
ton (diatom) blooms. Noctiluca has extremely high liquid contents of ammo-
nia (NH4+-N) and phosphate (PO4
3–-P) within the cells (Okaichi & Nishio 1976, Montani et al. 1998, Pithakpol et al. 2000a, b), which may contaminate the surface seawater after secretion, exudation and lysis of Noctiluca cells. In fact, abnormally high NH4
+-N and PO43–-P concentrations in
the surface waters have been reported to be associated with Noctiluca red tides and/or blooms (Schaumann et al. 1988, Elbrächter & Qi 1998, Montani et al. 1998, Pithakpol et al. 2000a, Al-Azri et al. 2007). Pithakpol et al. (2000a, b) stated that NH4
+-N and PO43–-P pools within Noctiluca
cells contributed high percentages to the water column NH4
+-N and PO43–-P pools, especially during the period at
which a Noctiluca red tide was formed in the upper waters in spring.
It is well known that light and dissolved inorganic nutri-ents are major limiting factors for phytoplankton growth. Phytoplankton species are limited to grow and increase in the upper layer of the water column, within which dis-solved inorganic nutrient concentrations decrease fre-
quently to very low levels in spring–summer in temperate waters, while nutrient supplies from the nutrient-rich deeper layer are obstructed by seasonal stratification. In these waters, Noctiluca may serve as a nutrient regenerator due to its high contents of ammonia and phosphate. How-ever, studies on Noctiluca as a nutrient regenerator and supplier affecting aquatic ecosystems have been limited.
Sagami Bay, located on the southern coast of central Honshu, the main island of Japan, is a semi-circular em-bayment facing the western North Pacific Ocean (Fig. 1), and is geographically located in the transition zone where nutrient-rich estuarine water from neighboring Tokyo Bay, one of the most eutrophic semi-enclosed embayments in Japan, flows out to the Pacific Ocean. Although chemical oxygen demand (COD), dissolved inorganic nutrient and chlorophyll a (Chl-a) concentrations in Sagami Bay have maintained much lower levels than in neighboring Tokyo Bay (Saitou 1992, Ara & Hiromi 2008, Ara et al. 2011b), since the 1980s some signs of eutrophication (i.e. gradual rise in COD and Chl-a concentration, decline in transpar-ency, red tide outbreaks) have occurred, partly in the
Fig. 1. Map showing the sampling station in Sagami Bay with isobaths in meters.

Noctiluca scintillans in Sagami Bay 11
coastal waters of Sagami Bay (Yamada & Iwata 1992, Ya-mada 1997, Machida et al. 1999, Yamada & Matsushita 2005, Miyaguchi et al. 2006, Ara & Hiromi 2008, Ara et al. 2011a). The neritic waters in the innermost open area of Sagami Bay, especially the upper layer around Enoshima Island, have higher phytoplankton standing crops (Chl-a) and primary production than those in any other open area in the bay (Ara & Hiromi 2007, 2008, 2009, Ara et al. 2011a, b). The higher phytoplankton biomasses and pro-duction rates in these waters are induced by much higher nutrient concentrations due to nutrient-rich run-off from the Sakai and Hikiji Rivers (Saitou 1992, Yamada & Iwata 1992, Tanaka 1993, Yamada & Matsushita 2005, 2006, Ara & Hiromi 2007, 2008, 2009, Ara et al. 2011a, b).
Studies on Noctiluca in the coastal waters of Sagami Bay have dealt with aspects of red tides and/or red color-ation phenomena, sometimes having originated in ex-panded from neighboring Tokyo Bay (Tanaka 1985, Ya-mada 1997, Kamataki 2005), predominance in the micro-phytoplankton assemblages (Tatara & Kikuchi 2003, Baek et al. 2009), and seasonal and interannual variations in abundance in relation to environmental factors (Miyaguchi et al. 2006). However, in these waters as well as other wa-ters of the world, there has been no attempt to investigate the availability of nutrients regenerated by Noctiluca for phytoplankton growth or to evaluate the contribution of nutrient (N and P) supply by Noctiluca excretion to phyto-plankton primary production. This study provides data on (1) seasonal variations in abundance, cell size and intracel-lular nutrient contents and concentration of Noctiluca in relation to abiotic/biotic properties and estimation of the contribution of intracellular nutrient pools within Nocti-luca cells to the total nutrient standing stocks, (2) response of phytoplankton (diatoms) to nutrients extracted from Noctiluca cells, and (3) NH4
+-N and PO43–-P excretion
rates of Noctiluca, estimating the contribution of NH4+-N
and PO43–-P supply for primary production, over five years
(2002–2006) in the neritic area of Sagami Bay.
Materials and Methods
Field investigation
A series of field investigations were conducted mostly every two weeks (i.e. twice a month) from January 2002 to December 2006, at a station (Lat. 35o16′22.0′′N, Long. 139o29′41.0′′E; local depth: ca. 55 m) located in the neritic area, ca. 4.5 km off Enoshima Island, Fujisawa, of Sagami Bay (Fig. 1). On each sampling date, water samples for Noctiluca enumeration were taken at depths of 0, 5, 10, 20, 30, 40 and 50 m, using duplicate Van Dorn bottles (10 L×2). For Noctiluca enumeration, 20 L water samples were concentrated using a hand-net (63 μm mesh size), transferred into 100 mL bottles and immediately preserved in 1% glutaraldehyde (final concentration). For laboratory experiments, live Noctiluca samples were collected by
gently vertical towing from 20 m depth to the surface, using a NORPAC net (45 cm in mouth diameter, 200 μm in mesh opening size), and were carefully transferred into a 20 L tank filled with the ambient surface seawater. For the diatom culture experiment on April 20, 2004, live micro-phytoplankton samples were collected by vertical tows from 20 m depth to the surface, using a plankton net (30 cm in mouth diameter, 63 μm in mesh opening size), and transferred into 1 L bottles filled with ambient surface seawater. These live samples were taken to the laboratory within 1–2 h. Seawater for laboratory experiments was taken at the sea surface (ca. 1 m depth) and filtered through a Whatman GF/F glass fiber filter (filtered seawater hereaf-ter) prior to experiments.
Physicochemical properties (i.e. water temperature, sa-linity and density) and Chl-a concentration at this station were previously published by Ara & Hiromi (2007, 2008, 2009), Ara et al. (2011a, b) and Okutsu et al. (2012), and details of observation methods can be found in these pa-pers. Prior to sample collection, water temperature and sa-linity were recorded using a Memory STD (AST-1000/ P-64K, Alec Electronics, Japan), and density (σt) was cal-culated. Water samples taken at the seven depths, as de-scribed above, were used for Chl-a and dissolved inorganic nutrient analyses. When a red tide of Noctiluca had formed at the surface on April 19, 2006, after removing Noctiluca carefully using a 200 μm-mesh screen at the sea surface, an additional water sample for dissolved inorganic nutri-ents was taken at the center of Noctiluca patches in the up-permost surface layer (0 to ca. 3 cm depth) using a plastic bucket. For Chl-a analysis, 0.5 L of seawater aliquots were filtered through Whatman GF/F glass fiber filters (47 mm). Chl-a concentration was determined with a fluorometer (TD-700, Turner Designs, USA) after extraction with 90% acetone (Holm-Hansen et al. 1965, Parsons et al. 1984a). Dissolved inorganic nutrient concentrations, i.e. ammo-nium (NH4
+-N), nitrate+nitrite (NO3–+NO2
–-N), phosphate (DIP: PO4
3–-P) and silicate (DSi: Si(OH)4-Si), were deter-mined using an Autoanalyzer (AACSIII, Bran+Luebbe, Germany) (Parsons et al. 1984a, Hansen & Koroleff 1999).
Primary productivity (PP) was determined by the in situ 13C tracer method (Hama et al. 1983), as described by Ara & Hiromi (2007, 2009) and Ara et al. (2011b). Water sam-ples were taken from depths corresponding to 100, 50, 25, 10, 5 and 1% photon fluxes of that just above the sea sur-face using a Niskin bottle. Dissolved inorganic carbon (DIC) concentration in the seawater was determined using a Total Organic Carbon (TOC) Analyzer (TOC-VCPH, Shi-madzu, Japan). After removing large zooplankton with a 200 μm-mesh, seawater samples were immediately trans-ferred into clean 1 or 0.5 L polycarbonate bottles. After the addition of NaH13CO3 (Cambridge Isotope Laboratories, ca. 10% of the total inorganic carbon in ambient water), the bottles were placed at the same depths at which the water samples were taken, and were incubated in situ for 24 h. The samples were then filtered through precombusted (at

12 K. ArA et al.
400oC for 4 h) Whatman GF/F filters (47 mm). These fil-ters were dried at 60oC for 1–2 h, treated with HCl fumes for 3 h to remove inorganic carbon, completely dried at 60oC for 1–2 h and stored in a vacuum desiccator. The iso-topic concentration of 13C and 12C was determined using a mass-spectrometer (ANCA-SL, Europe Scientific, UK). The dark uptake was always corrected for primary produc-tivity.
Sample treatments
Noctiluca from 10–100% subsamples were counted under a microscope. Cell diameter was measured using an eyepiece micrometer for 100–300 cells per sample or all cells when samples contained <100 cells. Cell volume was calculated from cell diameter assuming spherical configu-ration.
Intracellular nutrient contents
The methods for preparing and determining intracellular nutrient contents of Noctiluca were based on Montani et al. (1998), an outline of which is briefly given as follows. After standing for 2–3 h, 200 buoyant Noctiluca cells were separated from mixed samples into separate petri dishes, using a wide-bore pipette. In each analysis, 3–5 replicates were prepared. These cells were carefully washed with fil-tered seawater several times by sieving through a 200 μm-mesh screen to remove small algae and particles. Then, the cells with a small amount of filtered seawater (5–10 mL) were smashed up with a Teflon homogenizer, final volume was adjusted to 50 mL using filtered seawater, and this mixture was filtered through Whatman GF/F filters (25 mm). These samples were transferred into 50 mL clean polypropylene bottles, and kept in a freezer (–40oC) until analysis. Dissolved inorganic nutrient concentrations were determined, as described above. Intracellular nutrient con-tents were quantified by subtracting the NH4
+-N, NO3–+NO2
–
-N, PO43–-P and Si(OH)4-Si concentrations measured in fil-
tered seawater from the respective NH4+-N, NO3
–+NO2–-N,
PO43–-P and Si(OH)4-Si concentrations measured in filtered
seawater containing extracted intracellular nutrients and by dividing the number of cells (i.e. 200) that had been ex-tracted in each analysis.
Diatom response to enrichment with nutrients ex-tracted from Noctiluca cells
Cell chains of the diatom Thalassiosira rotula Meunier, one of the dominant species in the microphytoplankton as-semblages at our study site (Ara et al. 2011a), were isolated from natural assemblages and mono-cultured in modified Erd-Schreiber medium (Nakajima 1988) under laboratory conditions (i.e. temperature: 23.0±1.0ºC; white fluorescent light at photon flux density of 60 μmol m–2 sec–1; light : dark photoperiod of 12L : 12D). Photon flux density was mea-sured using an underwater quantum sensor (LI-1925SA/LI-250, LI-COR, USA). Filtered seawater, previously auto-claved at 121oC for 20 min, was prepared for the controls
(culture experiment seawater hereafter). Filtered seawater containing intracellular nutrients extracted from 1000 Noctiluca cells was prepared (NS medium hereafter), as described above. Usually, 15 mL of culture experiment seawater was introduced into each 20 mL glass test tube. Test media (i.e. Medium 1, 2 and 3) were made by adding 3 and 1.5 mL of NS medium and 1.5 mL of 10% NS medium (diluted with filtered seawater) to 15 mL of culture experi-ment seawater, respectively. The T. rotula cells were intro-duced into each glass test tube containing culture experi-ment seawater and test media. The initial cell abundance in each test tube was adjusted to be 1.6–2.0×10³ cells mL–1. The initial concentration of dissolved inorganic nutrients in control and test media were determined, as described above, and are presented in Table 1. For the control and each test medium, triplicates were incubated for 288 h under the same laboratory conditions as for monoculture. The cell abundance of T. rotula in each test tube was counted under a microscope at intervals of 6 h for the first 12 h, and every 12 h from 12 to 288 h.
Excretion rate
Excretion rate of Noctiluca was measured by a water-bottle method (Ikeda 1974). After acclimating for 4–6 h in an incubator adjusted to the in situ surface temperature at capture (16.7–25.8oC), buoyant Noctiluca cells were sepa-rated from mixed samples into petri dishes using a wide-bore pipette, and were carefully washed with filtered sea-water several times by sieving through a 200 μm-mesh screen. Usually, 400 Noctiluca cells were transferred into each 100 mL glass DO bottle filled with filtered seawater. In each experiment, at least three replicates and one con-trol (without Noctiluca) were prepared. The experiment was run for 1–72 h in an incubator adjusted to the same temperatures as for acclimation under dark conditions. Noctiluca was not fed during the experiment. After the in-cubation, seawater was siphoned off through a 200 μm-mesh screen into 50 mL clean polypropylene bottles, and kept in a freezer (–40oC) until analysis. NH4
+-N and PO43–-P
were determined, as described above. NH4+-N and PO4
3–-P excretion rates were quantified by subtracting NH4
+-N and PO4
3–-P concentrations in the control bottles from the NH4+-
N and PO43–-P concentrations in the respective experimen-
tal bottles at the end of each incubation period, and by di-
Table 1. The initial concentrations of dissolved inorganic nu-trients in control and test media for the culture experiment on the diatom Thalassiosira rotula.
Medium/nutrients
Concentration (μM)
NH4+-N NO3
-+NO2--N PO4
3--P Si(OH)4-Si
Control 0.17 0.68 0.07 5.12Medium 1 21.30 1.91 1.33 21.71Medium 2 11.69 1.35 0.76 14.17Medium 3 1.31 0.69 0.13 5.60
Noctiluca scintillans in Sagami Bay 13
viding by the number of cells (i.e. 400) in each experimen-tal bottle.
Data analysis
The depths where 25, 50 and 75% of the Noctiluca popu-lation was distributed (25, 50 and 75%D, respectively) on each sampling date were calculated from the abundance at depths of 0, 5, 10, 20, 30, 40 and 50 m, according to Pen-nak (1943). Correlations between abiotic/biotic variables (water temperature, salinity, Chl-a and PP) and Noctiluca abundance in the water column (0–50 m depth) for all sam-pling dates in 2002–2006 and in each season of 2002–2006 (winter: December–February; spring: March–May; sum-mer: June–September; autumn: October–November) and at the depth of 50%D were analyzed by Spearman rank correlation.
Results
Temperature, salinity, density and dissolved inorganic nutrients
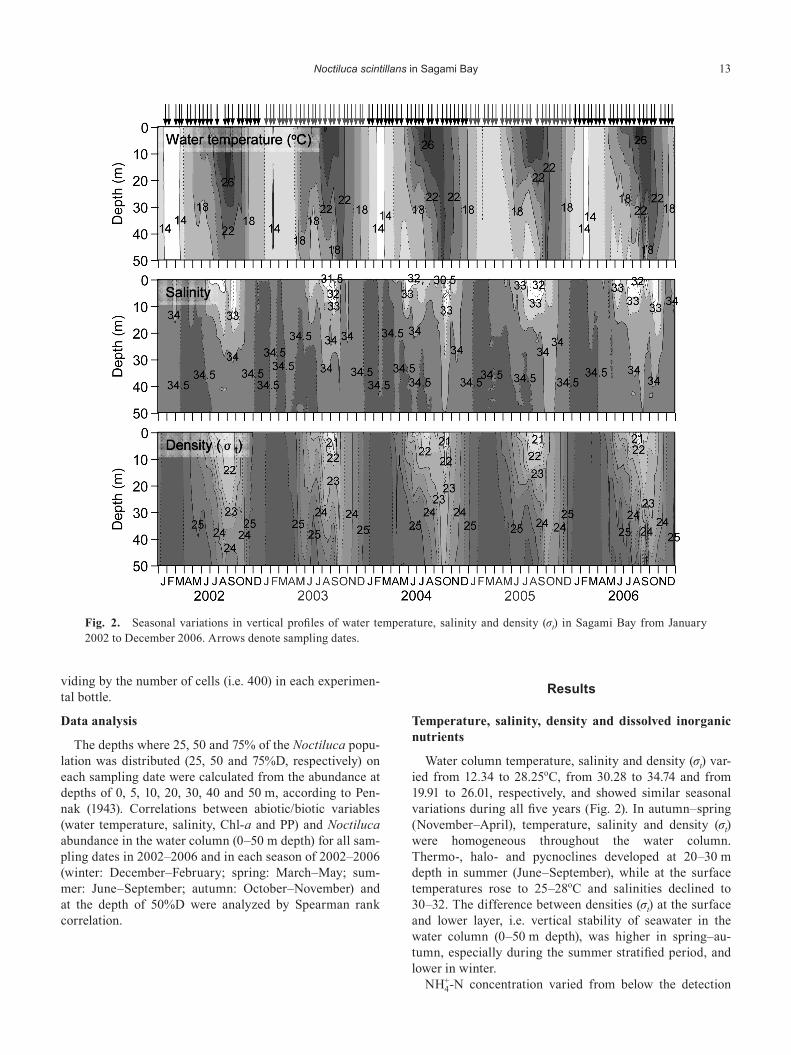
Water column temperature, salinity and density (σt) var-ied from 12.34 to 28.25oC, from 30.28 to 34.74 and from 19.91 to 26.01, respectively, and showed similar seasonal variations during all five years (Fig. 2). In autumn–spring (November–April), temperature, salinity and density (σt) were homogeneous throughout the water column. Thermo-, halo- and pycnoclines developed at 20–30 m depth in summer (June–September), while at the surface temperatures rose to 25–28oC and salinities declined to 30–32. The difference between densities (σt) at the surface and lower layer, i.e. vertical stability of seawater in the water column (0–50 m depth), was higher in spring–au-tumn, especially during the summer stratified period, and lower in winter.
NH4+-N concentration varied from below the detection
Fig. 2. Seasonal variations in vertical profiles of water temperature, salinity and density (σt) in Sagami Bay from January 2002 to December 2006. Arrows denote sampling dates.

14 K. ArA et al.
limit (0.02 μM) to 5.56 μM, and there was no consistent trend in seasonal and vertical distributions (Fig. 3). The concentrations of NO3
–+NO2–-N, PO4
3–-P and Si(OH)4-Si showed similar seasonal variations during all five years. NO3
–+NO2–-N, PO4
3–-P and Si(OH)4-Si concentration ranged from 0.15 to 13.60 μM, from below the detection limit (0.02 μM) to 0.91 μM and from 0.22 to 32.75 μM, respec-tively. In late autumn–spring (November–March), NO3
–
+NO2–-N, PO4
3–-P and Si(OH)4-Si concentrations were high and homogeneous throughout the water column. During
the summer stratified period (June–September), NO3–+NO2
–
-N, PO43–-P and Si(OH)4-Si concentrations were very low
in the upper layer (0–20 m depth), whereas they main-tained high levels below the stratified layer. When a red tide of Noctiluca was formed at the surface on April 19, 2006, dissolved inorganic nutrient concentrations, except for Si(OH)4-Si, were extremely high (NH4
+-N: 92.0 μM; NO3
–+NO2–-N: 28.6 μM; PO4
3–-P: 7.9 μM; Si(OH)4-Si: 7.0 μM) at the center of Noctiluca patches in the uppermost layer (0–3 cm depth).
Fig. 3. Seasonal variations in vertical profiles of ammonium nitrogen (NH4+-N), nitrate+nitrite (NO3
-+NO2--N), phosphate
(PO43--P) and silicate (Si(OH)4-Si) in Sagami Bay from January 2002 to December 2006. Arrows denote sampling dates.

Noctiluca scintillans in Sagami Bay 15
Chl-a concentration and primary production
Chl-a concentration varied from 0.03 to 20.36 μg L–1 (Fig. 4). In November–January, Chl-a concentrations were low (<1 μg L–1) throughout the water column. Chl-a con-centrations were very high throughout the water column or in the upper layer (0–20 m depth) during the period of spring phytoplankton blooms (February–May). The maxi-mum Chl-a concentration during the spring phytoplankton blooms (February–May) in 2004 (20.4 μg L–1) was greater than that in other years (5.3–5.9 μg L–1). Relatively high Chl-a concentrations (3–5 μg L–1) remained in the upper layer (0–10 m depth) during summer (June–September). The maximum Chl-a concentration during the autumn phytoplankton blooms (October–November) in 2006 (14.9 μg L–1) was greater than in other years (0.9–3.4 μg L–1).
The depth of the euphotic zone (i.e. the depth corre-sponding to 1% of sea surface sunlight intensity) varied from 4.5 m to the bottom, with an overall mean±SE of 26.5±1.1 m. PP varied from ca. 0 to 1321.4 μg C L–1 d–1 (Fig. 4). Higher rates (>300 μg C L–1 d–1) of PP were ob-served in the upper layer (0–10 m depth) in April–October, and the rates were low (<40 μg C L–1 d–1) throughout the water column in December–January.
Abundance
Noctiluca abundance varied from 0 to 1.8×10³ cells L–1, with an overall mean±SE of 2.5×101±3 cells L–1 (Fig. 5). The abundance was high in spring–summer, especially in
the upper layer (0–10 m depth). Drastic increases in abun-dance at the surface were associated with increases in water temperature and with decreases in salinity, and these appeared during or just after the period of spring phyto-plankton blooms. Higher abundances (>1.0×10² cells L–1) were found in May–July 2002, April–May, July and Sep-tember 2003, April and July 2004, April, August and Octo-ber 2005 and June 2006. The maximum abundance in 2002 (1.8×10³ cells L–1) was higher than that in other years (2.1×10²–9.7×10² cells L–1).
The depth where 50% of the Noctiluca population was distributed (50%D) varied from 0 to 40 m, with an overall mean±SE of 6.7±0.7 m (Fig. 5). The depth of 50%D was found frequently in the upper layer (0–10 m depth) during most of the study period, especially at the surface-to-sub-surface (0–2 m depth) in spring–summer, whereas during late autumn–early spring when Noctiluca was scarce (<5 cells L–1), the depth of 50%D was found below 20 m depth.
In almost all cases, Noctiluca abundance showed signifi-cantly positive correlations with Chl-a and PP, and signifi-cantly negative correlations with salinity (Table 2). Nocti-luca abundance showed significantly positive correlations with water temperature in spring and summer in the water column and during all periods at the depth of 50%D, but significantly negative correlation in winter in the water column.
Cell diameter and volume
The mean (±SE) cell diameter and volume of Noctiluca
Fig. 4. Seasonal variations in vertical profiles of chlorophyll a concentration and primary productivity in Sagami Bay from January 2002 to December 2006. Arrows denote sampling dates.

16 K. ArA et al.
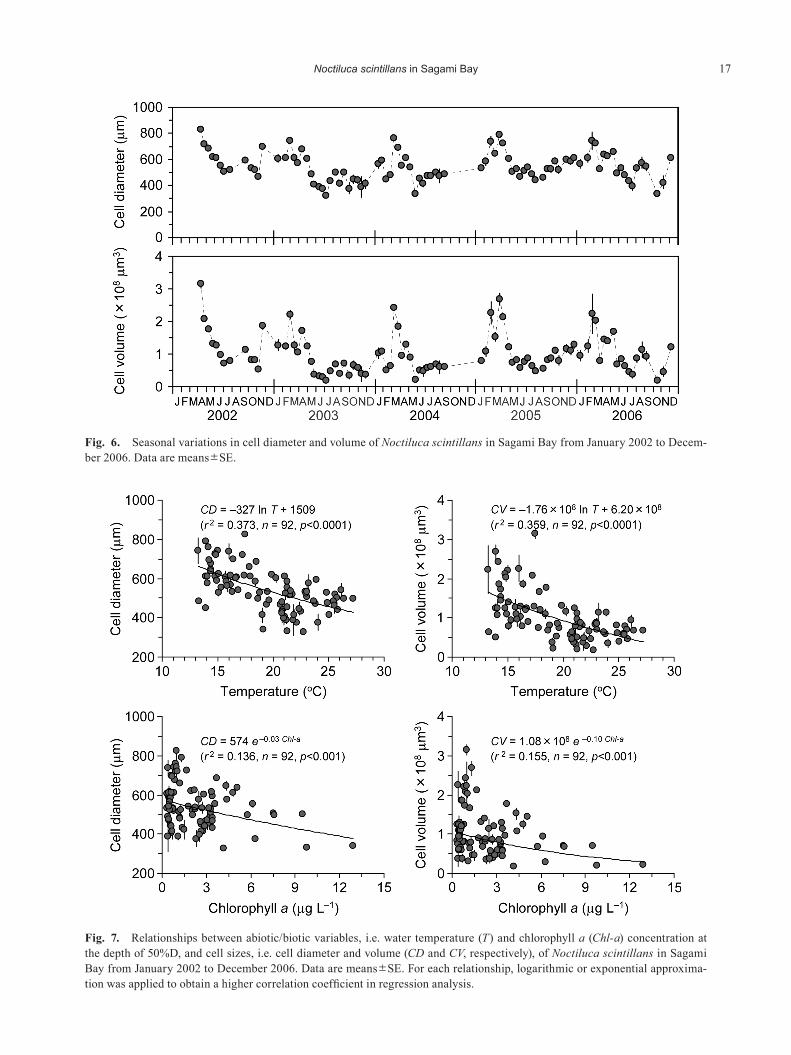
varied from 325±13 to 826±10 μm and from 1.83×10⁷± 1.99×10⁶ to 3.15×10⁸±1.27×107 μm3, respectively (Fig. 6). Cell size (i.e. diameter and volume) of Noctiluca showed seasonal fluctuations: their cell sizes were generally larger in winter–early spring and smaller in summer. There were significantly negative correlations between abiotic/biotic variables (i.e. temperature and Chl-a) and cell sizes (Fig. 7), while there was no statistically significant correlation between temperature and Chl-a (p>0.05). With the present multiple regression model, 43% and 42% of variance in cell diameter and volume were explained by temperature
and Chl-a. Temperature and Chl-a showed similar contri-butions to cell size variations (Table 3).
Intracellular nutrient content and concentration
The mean (±SE) intracellular nutrient content and con-centration of Noctiluca varied from 0.45±0.01 to 4.95± 0.39 nmol cell–1 and from 10.1±0.28 to 49.0±1.79 amol μm–3 for NH4
+-N, from 0.03±0.01 to 0.64±0.02 nmol cell–1 and from 0.37±0.17 to 6.52±<0.01 amol μm–3 for NO3
–
+NO2–-N, from 0.07±<0.01 to 0.40±0.01 nmol cell–1 and
from 0.89±0.04 to 2.75±0.05 amol μm–3 for PO43–-P, and
Fig. 5. Seasonal variations in abundance of Noctiluca scintillans and the midpoint distribution depth (50%D) in Sagami Bay from January 2002 to December 2006. Arrows denote sampling dates. Filled circles and vertical lines in the bottom panel de-note 50%D and the range of 25–75%D, respectively.
Table 2. Coefficients of Spearman rank correlation between abiotic/biotic variables (water temperature, salinity, chlorophyll a and pri-mary productivity) and the abundance of Noctiluca scintillans (cells L-1) in the water column (0–50 m depth, WC) and at the midpoint distribution depth (50%D) in Sagami Bay, from January 2002 to December 2006. T: water temperature (°C); S: salinity; Chl-a: chloro-phyll a (μg L-1); PP: primary productivity (μg C L-1 d-1). Significant correlation: *0.01<p<0.05; **0.001<p<0.01; ***p<0.001.
Period/depth
Abiotic/biotic variables
T (°C) S Chl-a
(μg L-1)PP
(μg C L-1 d-1)
All period (WC) 0.023 -0.148*** 0.437*** 0.364***Winter (WC) -0.414*** 0.249*** 0.410*** 0.133Spring (WC) 0.440*** -0.397*** 0.178** 0.397***Summer (WC) 0.171** -0.463*** 0.443*** 0.512***Autumn (WC) -0.029 -0.180* 0.245** 0.198*All period (50%D) 0.209* -0.328** 0.311** 0.444***
Noctiluca scintillans in Sagami Bay 17
Fig. 6. Seasonal variations in cell diameter and volume of Noctiluca scintillans in Sagami Bay from January 2002 to Decem-ber 2006. Data are means±SE.
Fig. 7. Relationships between abiotic/biotic variables, i.e. water temperature (T) and chlorophyll a (Chl-a) concentration at the depth of 50%D, and cell sizes, i.e. cell diameter and volume (CD and CV, respectively), of Noctiluca scintillans in Sagami Bay from January 2002 to December 2006. Data are means±SE. For each relationship, logarithmic or exponential approxima-tion was applied to obtain a higher correlation coefficient in regression analysis.

18 K. ArA et al.
from 0.13±0.03 to 0.99±0.02 nmol cell–1 and from 0.88±0.18 to 16.2±1.46 amol μm–3 for Si(OH)4-Si, respec-tively (Fig. 8). Intracellular NH4
+-N, NO3–+NO2
–-N and PO43–
-P contents and concentrations exhibited seasonal fluctua-tions: the intracellular nutrient contents were higher in spring and lower in summer, which was similar to the
Table 3. Regression statistics for cell diameter and volume of Noctiluca scintillans (Y and ln Y, μm and μm3, respectively) with respect to ambient water temperature (X1, °C) and chlorophyll a (Chl-a) (X2, μg L-1). a, b and c are constants.
Cell sizeY or ln Y=aX1+bX2+c
r2 n pa b c
Cell diameter -15.6 -12.3 877 0.426 92 <0.0001Cell volume -0.079 -0.081 20.0 0.416 92 <0.0001
Fig. 8. Seasonal variations in intracellular nutrient (NH4+-N, NO3
-+NO2--N, PO4
3--P and Si(OH)4-Si) content and concentra-tion of Noctiluca scintillans in Sagami Bay from January 2002 to December 2006. Data are means±SE.

Noctiluca scintillans in Sagami Bay 19
trend seen in cell size variations, whereas the intracellular nutrient concentrations were higher in summer and lower in spring, which translates to a mostly inverse relationship to the intracellular nutrient contents. For intracellular Si(OH)4-Si content, there was no consistent trend in the seasonal fluctuations during the study period. There were significant correlations between cell volume and intracel-lular NH4
+-N, NO3–+NO2
–-N and PO43–-P content and be-
tween cell volume and intracellular NH4+-N, PO4
3–-P and Si(OH)4-Si concentration, respectively (Fig. 9).
The intracellular nutrient concentrations quoted above were 10,100–49,000 μM for NH4
+-N, 374–6,520 μM for NO3
–+NO2–-N, 891–2,790 μM for PO4
3–-P and 878–16,200 μM for Si(OH)4-Si (Table 4). The ratio of intracellular nu-trient concentration to nutrient concentration in the sur-rounding seawater (i.e. the concentration ratio) at each sampling date and depth was 3.5×10³–1.1×10⁶-fold for NH4
+-N, 6.1×101–1.4×10⁴-fold for NO3–+NO2
–-N, 1.4× 10³–2.6×10⁵-fold for PO4
3–-P, and 6.7×101–3.2×10⁴-fold for Si(OH)4-Si.
Diatom response to enrichment with nutrients ex-tracted from Noctiluca cells
The cell abundance of Thalassiosira rotula in the con-trol and enriched solutions (i.e. Medium 1, 2 and 3) showed similar values at 6–60 h, increasing to ca. 3×10³ cells mL–1 at 60 h (Fig. 10). The cell abundances in enriched so-lutions increased rapidly at 60–84 h, whereas at that time those in the control solution remained low. Thereafter, until the end of experiment (72–288 h), the cell abundances in the test solutions remained at higher levels than in the control. The cell abundance in the control was largely con-stant (ca. 3.5×10³ cells mL–1) at 72–204 h and then de-creased gradually. The maximum cell abundances in the control, Medium 1, 2 and 3 were found at 144, 276, 252 and 240 h, respectively.
Excretion rate
The mean (±SE) NH4+-N and PO4
3–-P excretion rate of Noctiluca varied from 2.4±0.9 to 242.6±7.4 pmol cell–1 h–1 and from 0.2±0.1 to 24.2±10.8 pmol cell–1 h–1, respec-tively (Fig. 11). Both NH4
+-N and PO43–-P excretion rates de-
creased exponentially with time: the rates were higher at 1–12 h, especially at 1–3 h, and were almost constant at 24–72 h. There were significant correlations between ex-periment time and NH4
+-N and PO43–-P excretion rates, re-
spectively. With the present multiple regression model, 91% and 88% of variance in NH4
+-N and PO43–-P excretion
rates were explained by experiment time, ambient water temperature and intracellular NH4
+-N and PO43–-P contents
(Table 5). The proportion (%) of nutrient excretion to intra-cellular nutrient content varied from 0.1 to 23.2% h–1 for NH4
+-N and from 0.1 to 22.5% h–1 for PO43–-P. The propor-
tions of NH4+-N and PO4
3–-P excretion to intracellular NH4+-
N and PO43–-P content decreased exponentially with time.
There were significant correlations between experiment
time and proportion (%) of NH4+-N and PO4
3–-P excretion to intracellular NH4
+-N and PO43–-P content. There was no sta-
tistical difference (p>0.05) between these two regression equations of experiment time–proportion of nutrient excre-tion to intracellular nutrient content relationships for NH4
+-N and PO4
3–-P.
Discussion
Seasonal variations in abundance
The present study found clear seasonal variations in Noctiluca abundance: although the variations (i.e. exact duration of occurrence, abundance, distribution) differed depending on the year, overall variation patterns were es-sentially similar during all five years, and these were simi-lar to those reported for other temperate coastal waters (e.g. Uhlig & Sahling 1990, Pithakpol et al. 2000a, b, Tada et al. 2004, Miyaguchi et al. 2006). For Noctiluca, such seasonal variations occur commonly in temperate seas, being explainable by local abiotic/biotic variables (i.e. physical structure of ambient seawater, water temperature, food availability) and the abiotic/biotic variable-dependent growth of Noctiluca. The seasonal variations in vertical distribution of Noctiluca were correlated significantly to the physical structure of the water column: Noctiluca was distributed most densely in the upper layer (0–10 m depth) in late spring–early autumn (April–October), and in even greater numbers during the summer stratified period (June–September), whereas during other periods of verti-cal mixing of waters (November–March), it was rare and dispersed throughout the water column. The depth where 50% of the Noctiluca population was distributed (50%D) exhibited a mostly inverse relationship to the vertical sta-bility of the water column (Figs. 2, 5), and there was a sig-nificantly negative correlation between them (exponential approximation, r2=0.177, p<0.0001). This indicates that seasonal stratification, i.e. increasing vertical stability of the water column (0–50 m depth), was one of the principal factors causing accumulation of positively buoyant cells in the upper layer, due to the lower specific gravity of Nocti-luca cells than that of seawater (Nozawa 1943). Aggrega-tion of Noctiluca in the surface water has been found in many other coastal waters (e.g. Kuroda & Saga 1978, Schaumann et al. 1988, Elbrächter & Qi 1998, Tada et al. 2004). In littoral waters, after ascent to the upper layer caused by seasonal stratification, the passive accumulation of Noctiluca cells due to wind and/or tidal currents has been reported as an important mechanism for the forma-tion of Noctiluca blooms or aggregations (Le Fèvre & Grall 1970, Huang & Qi 1997, Dela-Cruz et al. 2003, Mi-yaguchi et al. 2006).
At our study site, Noctiluca abundance showed signifi-cantly positive correlations with water temperature, Chl-a and PP, and an inverse correlation to salinity: in almost all seasons, these correlations were significant. Significantly

20 K. ArA et al.
Fig. 9. Relationships between cell volume (CV) and intracellular nutrient [NH4+-N (ICTNH4
), NO3-+NO2
--N (ICTNO3+NO2),
PO43--P (ICTPO4
) and Si(OH)4-Si] content and between cell volume and intracellular nutrient [NH4+-N (ICCNH4
), NO3-+NO2
--N, PO4
3–-P (ICCPO4) and Si(OH)4-Si (ICCSi(OH)4
)] concentration in Sagami Bay from January 2002 to December 2006. Data are means±SE. For each relationship, linear, logarithmic, exponential or power approximation was applied to obtain a higher cor-relation coefficient in regression analysis.

Noctiluca scintillans in Sagami Bay 21
positive correlations between Noctiluca abundance and Chl-a have been reported in other coastal waters (e.g. Schaumann et al. 1998, Painting et al. 1993, Dela-Cruz et al. 2002). Significant correlations with Chl-a and PP sug-gest that Noctiluca and phytoplankton are in a grazer–prey relationship: the variations in abundance of Noctiluca are affected by Chl-a concentration (i.e. bottom-up control), while Chl-a concentration would not be affected mainly by Noctiluca abundance (i.e. top-down control), because in the latter case prey and grazer organism abundances nor-mally would show an inverse relationship and there would be significantly negative correlation between them (Huang & Qi 1997, Isinibilir et al. 2008). In spring, Noctiluca abundance showed stronger correlations with water tem-perature, salinity and PP than Chl-a, whereas in summer it showed stronger correlations with salinity, Chl-a and PP
than with water temperature. In the present study, it is ex-pected that salinity would affect abundances minimally because it varied within the range (30.3–34.7) of suitable salinities for continual Noctiluca population growth (14–34, Lee & Hirayama 1992). In summer, especially in the upper layer (0–10 m depth) at temperatures of 26–28oC, even though Chl-a and PP remained relatively high, Nocti-luca abundances were very low (Figs. 2, 4, 5), as similarly found in other waters (e.g. Uhlig & Sahling 1990, Huang & Qi 1997, Schoemann et al. 1998, Tada et al. 2004, Miya-guchi et al. 2006). Laboratory-culture experiments have shown that growth and production rates of Noctiluca are temperature- and food-dependent: Noctiluca has enhanced growth rates at temperatures ranging from 5 to 21–23oC and under higher prey (phytoplankton) concentrations, whereas it could not grow at temperatures higher than 26–
Table 4. The mean (±SE) intracellular nutrient (HN4+-N, NO3
-+NO2--N, PO4
3--P and Si(OH)4-Si) content and concentration within Noctiluca scintillans cells, and the ratio of intracellular nutrient concentration to nutrient concentration in the surrounding seawater (i.e. concentration ratio) at each sampling date and depth in Sagami Bay, from January 2002 to December 2006. Data in parentheses are over-all mean±SE.
Intracellular content (nmol cell-1)
Intracellular concentration (μM)
Concentration ratio (-fold)
HN4+-N 0.45±0.01–4.95±0.39
(2.16±0.15) 10,100–49,000 (20,600±1,230)
3.5×10³–1.1×10⁶ (1.5×10⁴±4.2×10³)
NO3-+NO2
--N 0.03±0.01–0.64±0.02 (0.27±0.03)
374–6,520 (2,560±242)
6.1×101–1.4×10⁴ (9.2×10²±1.3×10²)
PO43--P 0.07±<0.01–0.40±0.01
(0.19 ± 0.01) 891–2,790
(1,720±72)1.4×10³–2.6×10⁵
(7.0×10³±1.3×10³)
Si(OH)4-Si 0.13±0.03–0.99±0.02 (0.44±0.04)
878–16,200 (5,040±604)
6.7×101–3.2×10⁴ (9.7×10²±1.9×10²)
Fig. 10. Temporal variation in cell abundance of Thalassiosira rotula under three different enrichment conditions with nutri-ents extracted from Noctiluca scintillans cells.

22 K. ArA et al.
27oC (Lee & Hirayama 1992, Buskey 1995, Kiørboe & Titelman 1998, Nakamura 1998a, b, Pithakpol et al. 2000a, Tada et al. 2004). At our study site, the abundance and bio-mass of planktonic organisms (i.e. pico-, nano-, micro- and mesozooplankton) and the concentrations of particulate carbon and nitrogen (PC and PN, respectively) were higher in spring–autumn, especially in the upper layer, whereas these were lower throughout the water column (0–50 m depth) in winter (Ara & Hiromi 2007, 2009, Ara et al. 2011a, b, Okutsu et al. 2012). These could enhance popula-
tion growth of Noctiluca in the upper layer in spring–au-tumn, except during the periods of temperatures higher than ca. 26oC in summer, since Noctiluca has been known to feed on a variety of prey items, including phytoplank-ton, bacteria, micro- and mesozooplankton, fish eggs and detritus (e.g. Kirchner et al. 1996, Shanks & Walters 1996, Sautour et al. 2000, Fonda Umani et al. 2004).
The present study found that Noctiluca abundance and Chl-a concentration followed similar seasonal variations as outlined above. However, they showed drastic variations
Fig. 11. Relationships between elapsed experiment time (ET) and nutrient (NH4+-N and PO4
3--P) excretion rate of Noctiluca scintillans and between experiment time and proportion of nutrient excretion to the intracellular nutrient content (ER%NH4
and ER%PO4
). Data are means±SE.
Table 5. Regression statistics for ammonia (NH4+-N) and phosphate (PO4
3--P) excretion rates (Y, pmol cell-1 h-1) with respect to elapsed experiment time (X1, hours), water temperature (X2, °C) and intracellular NH4
+-N or PO43--P content (X3, nmol cell-1). a, b, c and
d are constants.
Excretion rate
ln Y=a ln X1+bX2+cX3+dr2 n p
a b c d
Ammonia excretion -0.92 0.11 1.25 0.67 0.913 24 <0.0001
Phosphate excretion -1.05 -0.12 -3.87 6.33 0.882 24 <0.0001

Noctiluca scintillans in Sagami Bay 23
within the scale of a few days or weeks, with increases in Noctiluca abundance following increases in Chl-a concen-trations with a time lag of a few weeks (Figs. 4, 5). This is similar to the seasonal variation pattern where heterotroph (i.e. zooplankton) biomass peaks appear after phytoplank-ton biomass (i.e. Chl-a) peaks in open seas (e.g. Parsons et al. 1984b). In the upper layer (0–10 m depth), the time lag in the fortnightly present time-series of Chl-a concentra-tion and Noctiluca abundance (n, cells L–1) when converted to log (n+1), and examined by a cross-correlation analysis, was roughly estimated to be 39 days (r=0.294, p<0.0001).
Seasonal variations in cell size
The cell size of Noctiluca exhibited seasonal fluctua-tions, with larger sizes in winter–early spring and smaller sizes in summer. The cell size was negatively correlated with water temperature, as has been found in the Inland Sea of Japan (Pithakpol et al. 2000a). Laboratory-culture experiments on Noctiluca have shown that cell size in-creases with decreasing food availability (i.e. phytoplank-ton cell abundance) and the cells swelled when the dura-tion of the starved condition was prolonged. Furthermore, growth rates decreased with increasing cell size (Buskey 1995, Kiørboe & Titelman 1998), although the cell size of other heterotrophic dinoflagellates has been reported to in-crease with increasing food (phytoplankton) concentration (e.g. Protoperidinium hirobis (Abé) Balech, Jacobson & Anderson 1993). In the present study, cell size of Noctiluca decreased with increasing Chl-a concentration, as has been found in other coastal waters (Dela-Cruz et al. 2003). The seasonal variations in cell size imply that during the period of lower temperatures and Chl-a concentrations (winter–early spring) Noctiluca would be exposed to lower food availability, have lower growth rates and survive longer than during periods of higher temperatures and Chl-a con-centrations (late spring–summer), and this was consistent with the variations in abundance. Thus, the cell size could reveal the nutritional state and information on the popula-tion growth of Noctiluca at our study site.
Intracellular nutrient content and concentration, and nutrient pools
The present study showed that Noctiluca had high intra-cellular nutrient contents and concentrations. The values for intracellular NH4
+-N and PO43–-P contents obtained in
the present study were comparable to or slightly lower than those obtained for the Inland Sea of Japan (NH4
+-N: 1.7–6.8 nmol cell–1, PO4
3–-P: 0.1–0.6 nmol cell–1, Montani et al. 1998, Pithakpol et al. 2000a, b). The intracellular nutrient contents, except for Si(OH)4-Si, revealed clear seasonal fluctuations that were positively correlated to cell size, as has also been reported in the Inland Sea of Japan (Montani et al. 1998, Pithakpol et al. 2000a, b). The intracellular nu-trient concentrations were negatively correlated to cell size. This indicates that intracellular nutrient contents and concentrations are dependent mainly on the nutritional sta-
tus and growth of Noctiluca. During the period of lower temperatures and Chl-a concentrations (winter–early spring), larger cells would be exposed to conditions of lower food availability, have lower growth rates and sur-vive longer, as mentioned above, and thus they would ac-cumulate lower nutrient concentrations but higher nutrient contents, whereas during the other periods of higher tem-peratures and Chl-a concentrations (late spring–summer), smaller cells would have higher growth (cell division) rates and accumulate higher nutrient concentrations but lower nutrient contents.
Our preliminary laboratory-culture experiments on Noc-tiluca found that under conditions of sufficient food (prey: raphidophycean flagellate Heterosigma akashiwo (Hada) Hada, initial prey abundance: 1.3×10⁴ cells mL–1), intra-cellular NH4
+-N, NO3–+NO2
–-N and PO43–-P contents in-
creased gradually until the 35th day, whereas intracellular Si(OH)4-Si contents revealed neither increasing nor de-creasing trends during the experiment. Under starvation conditions, intracellular NH4
+-N, NO3–+NO2
–-N, PO43–-P and
Si(OH)4-Si contents stayed at similar levels at least until the 13th day, and then most of the Noctiluca cells died be-fore reaching the 25th day (Ara unpublished data). These results indicate that Noctiluca regenerates NH4
+-N and PO4
3–-P by active feeding and accumulates these sub-stances within the cells, whereas NO2
–-N and NO3–-N might
be nitrified (oxidized) by-product substances derived from NH4
+-N, due to the high acidity of the intracellular liquids (pH 4–5, Okaichi & Nishio 1976). In addition, these data indicate that Noctiluca contains silicate, derived from dia-tom frustules from its phytoplankton prey (diatoms), that would be neither digested nor regenerated by Noctiluca, as has been mentioned by Montani et al. (1998).
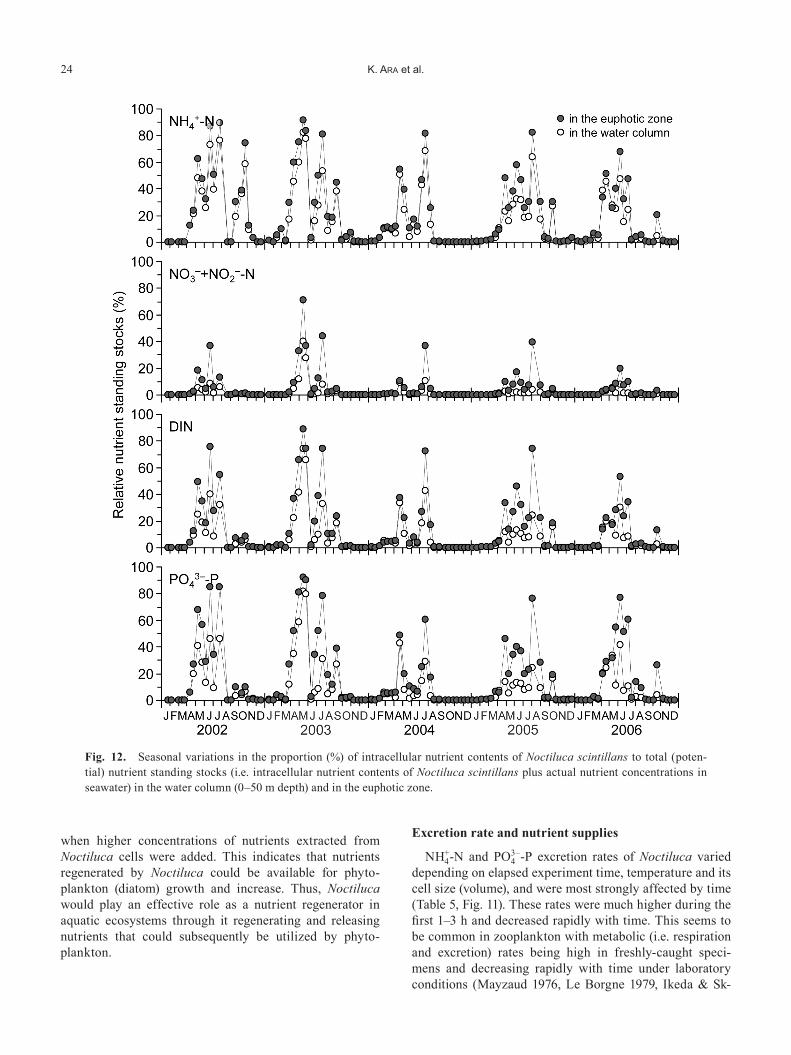
The proportion of intracellular nutrient contents in the water column (0–50 m depth) and in the euphotic zone at each sampling date accounted for 0–82.5% (mean: 22.7%) and 0–91.7% (mean: 30.5%) for NH4
+-N, 0–40.4% (mean: 1.2%) and 0–71.1% (mean: 2.0%) for NO3
–+NO2–-N,
0–74.1% (mean: 7.6%) and 0–89.0% (mean: 11.8%) for DIN (dissolved inorganic nitrogen: NH4
++NO3–+NO2
–-N), and 0–81.4% (mean: 9.3%) and 0–91.8% (mean: 15.1%) for PO4
3–-P of the total nutrient standing stocks (i.e. intracellu-lar nutrient contents plus nutrient concentrations in the am-bient seawater), respectively (Fig. 12). The intracellular nu-trient contents comprised larger proportions during the pe-riod of higher Noctiluca abundances in April–July, ac-counting for an average in the euphotic zone and in the water column (0–50 m depth) of 49.2–63.7% and 33.9–54.5% for NH4
+-N, 6.4–16.6% and 2.8–6.4% for NO3–+NO2
–
-N, 28.0–48.8% and 15.5–30.2% for DIN, 39.2–62.7% and 16.7–35.5% for PO4
3–-P of the total nutrient standing stocks, respectively.
Diatom response to enrichment with nutrients ex-tracted from Noctiluca cells
Thalassiosira rotula increased to higher cell abundances
24 K. ArA et al.
when higher concentrations of nutrients extracted from Noctiluca cells were added. This indicates that nutrients regenerated by Noctiluca could be available for phyto-plankton (diatom) growth and increase. Thus, Noctiluca would play an effective role as a nutrient regenerator in aquatic ecosystems through it regenerating and releasing nutrients that could subsequently be utilized by phyto-plankton.
Excretion rate and nutrient supplies
NH4+-N and PO4
3–-P excretion rates of Noctiluca varied depending on elapsed experiment time, temperature and its cell size (volume), and were most strongly affected by time (Table 5, Fig. 11). These rates were much higher during the first 1–3 h and decreased rapidly with time. This seems to be common in zooplankton with metabolic (i.e. respiration and excretion) rates being high in freshly-caught speci-mens and decreasing rapidly with time under laboratory conditions (Mayzaud 1976, Le Borgne 1979, Ikeda & Sk-
Fig. 12. Seasonal variations in the proportion (%) of intracellular nutrient contents of Noctiluca scintillans to total (poten-tial) nutrient standing stocks (i.e. intracellular nutrient contents of Noctiluca scintillans plus actual nutrient concentrations in seawater) in the water column (0–50 m depth) and in the euphotic zone.
Noctiluca scintillans in Sagami Bay 25
joldal 1980, Skjoldal et al. 1984, Fernández-Urruzola et al. 2011). Two possible explanations can be offered for the phenomenon: (1) higher rates for freshly caught specimens are due to the increased activity during sampling, and (2) lower rates after prolonged laboratory maintenance of specimens are due to laboratory effects, such as depletion of the food source. The former scenario supposes that the lower rates in specimens maintained over long periods would better estimate the rates under natural conditions, while the latter supposes that the higher rates of freshly caught specimens are closer to their natural values (Omori & Ikeda 1984). Actually, NH4
+-N and PO43–-P excretion
rates of Noctiluca were higher when Chl-a concentrations in ambient seawater were higher during our study, espe-cially early in the experiment (i.e. the first 1–6 h). This in-dicates that Noctiluca excretion rates reflect food availabil-ity in the ambient seawater on each sampling date, and that the rapid decreases in Noctiluca excretion rate with elapsed experiment time were due to the effect of starva-tion during the experiment. Our preliminary laboratory-culture experiments on Noctiluca found that under starved conditions the intracellular nutrient contents remained constant for several days, as mentioned above, which im-plies that during this period Noctiluca accumulated nutri-ents and decreased its excretion rates to very low levels. In addition, the proportion (%) of NH4
+-N and PO43–-P excre-
tion rates to intracellular NH4+-N and PO4
3–-P contents ex-hibited similar variations to each other (Fig. 11), indicating that Noctiluca excreted liquids containing both NH4
+-N and PO4
3–-P that had been regenerated and accumulated within the cells in the same proportions. Thus, it was assumed that the highest NH4
+-N and PO43–-P excretion rates, ob-
tained during the first 1 h (243 pmol N cell–1 h–1 and 24 pmol P cell–1 h–1), would have been less influenced by starvation and would therefore be closer to the actual ex-cretion rate for Noctiluca in ambient seawater. These val-ues were applied to the following calculations. The NH4
+-N and PO4
3–-P excretion rates of Noctiluca were 7.5–10.3-fold and 7.9–15.3-fold higher than those of micro- and meso-zooplankton (i.e. planktonic protists and metazoans) with the same body weights (188 ng C or 428 ng DW) at the same water temperature (24.5oC). These values were calcu-lated using the regression equations of cell volume-cell carbon weight relationship and assuming carbon weight to be 43.9% of dry weight for Noctiluca (Omori 1969, Tada et al. 2000), and the regression equations of body weight-ex-cretion rate relationships for mesozooplankton and plank-tonic protists (Ikeda 1985, Dolan 1997).
During spring–summer, seasonal stratification inter-fered with nutrient supply to the upper layer and kept dis-solved inorganic nutrients at low concentrations in the upper layer (0–20 m depth) due to nutrient uptake by phy-toplankton (Figs. 2–4, Ara & Hiromi 2008, Ara et al. 2011a, b). However, when a Noctiluca red tide was formed at the surface on April 19, 2006, dissolved inorganic nutri-ent concentrations, except for Si(OH)4-Si, were extremely
high in the uppermost layer (0–3 cm depth), as also found in the Inland Sea of Japan (Montani et al. 1998, Pithakpol et al. 2000a). In addition, relatively high nutrient concen-trations associated with high Noctiluca abundances at the surface have been observed in other waters (Schaumann et al. 1988, Elbrächter & Qi 1998, Al-Azri et al. 2007). Ac-cordingly, we addressed whether the concentrations of dis-solved inorganic nutrients, especially NH4
+-N and PO43–-P,
in ambient seawater were influenced by Noctiluca. The timing of intermittently high NH4
+-N, PO43–-P, Chl-a and/or
PP in the upper layer (0–10 m depth) followed high Nocti-luca abundances and presumably high NH4
+-N and PO43–-P
supply by Noctiluca excretion (Fig. 13). Thus, dense Nocti-luca populations could cause increases in dissolved inor-ganic nutrient concentrations in ambient seawater and con-sequently in Chl-a and PP. In this case, the timing of both the high Noctiluca abundances and Chl-a concentrations could be explained by a mutually supportive relationship (e.g. Harris 1959, Dugdale & Goering 1967, Corner & Davis 1971) between phytoplankton and Noctiluca: bot-tom-up control (i.e. phytoplankton–Noctiluca) and nutrient supply by Noctiluca excretion stimulating phytoplankton growth. On the other hand, in April 2004, in April 2003 and June 2006, and in April and August 2005, intermit-tently high NH4
+-N, PO43–-P, Chl-a and/or PP could have
been caused mainly by the intrusion of nutrient-rich waters into the bay, i.e. by the expansion of Tokyo Bay Water and by the intrusion of Intermediate Oyashio Water and of the bottom slope water (deep water) from the continental slope, respectively (Ara & Hiromi 2008, Ara et al. 2011b), as well as nutrient supply by Noctiluca excretion also being high.
We evaluated the role of Noctiluca in the marine ecosys-tem by estimating the contribution of NH4
+-N and PO43–-P
supply from excretion to the DIN and DIP requirement for phytoplankton primary production at our study site. Daily DIN and DIP requirement for phytoplankton was esti-mated from PP values obtained in the present study, as-suming a nutrient uptake molar C : N : P ratio of 106 : 16 : 1 (i.e. Redfield ratio, Redfield et al. 1963, Brzez-inski 1985, Brzezinski & Nelson 1995). The depth-inte-grated daily DIN and DIP requirement was calculated by the integral of daily DIN and DIP requirement in the eu-photic zone, i.e. from the sea-surface to the depth corre-sponding to 1% of sea-surface sunlight intensity. NH4
+-N and PO4
3–-P excretion rates (243 pmol N cell–1 h–1 and 24 pmol P cell–1 h–1) were converted to daily rates by mul-tiplying by 24 (hours). The contribution of daily NH4
+-N and PO4
3–-P supply by Noctiluca excretion was estimated to be 0–3,118% (mean: 34.8%) and 0–4,959% (mean: 55.3%) to the daily DIN and DIP requirement for primary produc-tion, respectively (Fig. 14). The estimated values of daily NH4
+-N and PO43–-P supply by Noctiluca excretion were
higher during the period of higher Noctiluca abundances, contributing on average 11.2–85.4% and 17.9–135.8% in March–October, especially 50.6–85.4% and 80.5–135.8%

26 K. ArA et al.
Fig. 13. Seasonal variations in abundance of Noctiluca scintillans, estimated N and P supplies by Noctiluca excretion, NH4+-N
and PO43--P concentrations in ambient seawater, chlorophyll a and primary productivity in the upper layer (0–10 m depth) in
Sagami Bay from January 2002 to December 2006. Data are means±SE. Hatched bar denotes the period of high Noctiluca abundances and high NH4
+-N and PO43--P supply by Noctiluca excretion associated with intermittently high NH4
+-N, PO43--P,
Chl-a and/or primary productivity. Dark shading denotes the period of vertical mixing between surface and deeper waters.

Noctiluca scintillans in Sagami Bay 27
in April–July, to the daily DIN and DIP requirement for primary production, respectively. These mean and maxi-mum percentages obtained in the present study were com-parable to, or relatively higher than, those calculated for micro- and mesozooplankton in other waters (e.g. Verity 1985, Harrison 1992, Hernándes-León et al. 2008).
The role of Noctiluca in the nutrient-environment and aquatic ecosystems
One of the most characteristic aspects of Noctiluca was
that of extremely high intracellular NH4+-N and PO4
3–-P contents and high NH4
+-N and PO43–-P excretion rates. In
addition, nutrients regenerated and released by Noctiluca could be available for phytoplankton growth and increase. At our study site, Noctiluca can therefore be expected to play an important role as a nutrient regenerator and sup-plier due to the significant amount of NH4
+-N and PO43–-P
regeneration, the pools within the cells, and its supply to primary production. This would be especially true during the period of higher Noctiluca abundances and lower nutri-
Fig. 14. Seasonal variations in N and P requirement for phytoplankton primary production, NH4+-N and PO4
3--P supplied by Noctiluca scintillans in the euphotic zone, and the ratio (%) of NH4
+-N and PO43--P supplied by Noctiluca scintillans to the N
and P requirements for primary production respectively, in Sagami Bay from January 2002 to December 2006.

28 K. ArA et al.
ent concentrations in the upper layer in late spring–sum-mer. This would stimulate phytoplankton (diatom) abun-dance, biomass and production, and may exacerbate eutro-phication by the mutually supportive relationship between phytoplankton and Noctiluca: bottom-up control (i.e. phy-toplankton–Noctiluca) and nutrient supply by Noctiluca excretion to phytoplankton. Moreover, increasing eutrophi-cation, especially Si deficiency relative to N and P, can re-sult in ecosystem-level changes by reducing the role of dia-toms in aquatic ecosystems, e.g. frequent Noctiluca red tides and/or other noxious phytoplankton (i.e. non-diatom) blooms, which have been observed in other estuarine and coastal waters of Japan, e.g. Tokyo Bay (Nomura 1998, Yo-shida et al. 1998, Kamataki 2005, Yoshida & Ishimaru 2008) and Osaka Bay and/or the Inland Sea of Japan (Ma-nabe et al. 1994, Hori et al. 1998, Imai et al. 2006, Yoshi-matsu 2008).
Acknowledgments
We thank Mr. Kazuharu Yuasa, captain/owner of the fishery boat “Genshun-maru”, for his continuous helpful assistance in fieldwork. We thank Dr. Kuninao Tada, Kagawa University, for technical advice in measurement of intracellular nutrient contents and Dr. Yukio Yanagisawa, Nihon University, for advice in statistical analysis. Thanks are also due to all members who participated in “Project SHONAM” for helping with fieldwork and analyzing sam-ples. This research was financially supported in part by the Ministry of Education, Culture, Sports Science and Tech-nology of Japan through the “Open Research Center Proj-ect” of Nihon University.
References
Al-Azri A, Al-Hashmi K, Goes J, Gomes H, Rushdi AI, Al-Habsi H, Al-Khusaibi S, Al-Kindi R, Al-Azri N (2007) Sea-sonality of the bloom-forming heterotrophic dinoflagellate Noctiluca scintillans in the Gulf of Oman in relation to envi-ronmental conditions. Int J Oceans Oceanogr 2: 51–60.
Ara K, Hiromi J (2007) Temporal variability in primary and co-pepod production in Sagami Bay, Japan. J Plankton Res 29 (Suppl. 1): 185–196.
Ara K, Hiromi J (2008) Temporal variability and characteriza-tion of physicochemical properties in the neritic area of Sag-ami Bay, Japan. J Oceanogr 64: 195–210.
Ara K, Hiromi J (2009) Seasonal variability in plankton food web structure and trophodynamics in the neritic area of Sag-ami Bay, Japan. J Oceanogr 65: 757–779.
Ara K, Fukuyama S, Tashiro M, Hiromi J (2011a) Seasonal and year-on-year variability in chlorophyll a and microphytoplank-ton assemblages for 9 years (2001–2009) in the neritic area of Sagami Bay, Japan. Plankton Benthos Res 6: 158–174.
Ara K, Yamaki K, Wada K, Fukuyama S, Okutsu T, Nagasaka S, Shiomoto A, Hiromi J (2011b) Temporal variability in physico-chemical properties, phytoplankton standing crop and primary production for 7 years (2002–2008) in the neritic area of Sag-
ami Bay, Japan. J Oceanogr 67: 87–111. Baek SH, Shimode S, Kim H-C, Han M-S, Kikuchi T (2009)
Strong bottom-up effects on phytoplankton community caused by a rainfall during spring and summer in Sagami Bay, Japan. J Mar Syst 75: 253–264.
Brzezinski MA (1985) The Si : C : N ratio of marine diatoms: in-terspecific variability and the effect of some environmental variables. J Phycol 21: 347–357.
Brzezinski MA, Nelson DM (1995) The annual silica cycle in the Sargasso Sea near Bermuda. Deep-Sea Res I 42: 1215–1237.
Buskey E (1995) Growth and bioluminescence of Noctiluca scin-tillans on varying algal diets. J Plankton Res 17: 29–40.
Corner EDS, Davis AC (1971) Plankton as a factor in the nitro-gen and phosphorus cycles in the sea. Adv Mar Biol 9: 101 – 204.
Dela-Cruz J, Ajani P, Lee R, Pritchard T, Suthers I (2002) Tem-poral abundance patterns of the red tide dinoflagellate Nocti-luca scintillans along the southeast coast of Australia. Mar Ecol Prog Ser 236: 75–88.
Dela-Cruz J, Middleton JH, Suthers IM (2003) Population growth and transport of the red tide dinoflagellate, Noctiluca scintillans, in the coastal waters off Sydney Australia, using cell diameter as a tracer. Limnol Oceanogr 48: 656–674.
Dolan JR (1997) Phosphorus and ammonia excretion by plank-tonic protists. Mar Geol 139: 109–122.
Dugdale RD, Goering JJ (1967) Uptake of new and regenerated forms of nitrogen in primary production. Limnol Oceanogr 12: 196–206.
Elbrächter M, Qi ZY (1998) Aspect of Noctiluca (Dinophyceae) population dynamics. In: Physiological Ecology of Harmful Algal Blooms (eds Anderson DM, Cembella AD, Hallegraeff MG). NATO ASI Series, Vol. G. 41. Springer-Verlag, Berlin, pp. 315–335.
Fernández-Urruzola I, Packard TT, Gómez M (2011) GDH activ-ity and ammonium excretion in the marine mysid, Leptomysis lingvura: effects of age and starvation. J Exp Mar Biol Ecol 409: 21–29.
Fonda Umani S, Beran A, Parlato S, Virgilio D, Zollet T, De Olazabal A, Lazzarini B, Cabrini M (2004) Noctiluca scintil-lans Macartney in the Northern Adriatic Sea: long-term dy-namics, relationships with temperature and eutrophication, and role in the food web. J Plankton Res 26: 545–561.
Hama T, Miyazaki T, Ogawa Y, Iwakuma T, Takahashi M, Ot-suki A, Ichimura S (1983) Measurement of photosynthetic pro-duction of a marine phytoplankton population using a stable 13C isotope. Mar Biol 73: 31–36.
Hansen HP, Koroleff F (1999) Determination of nutrients. In: Methods of Seawater Analysis, 3rd Edition (eds Grasshoff K, Kremling K, Ehrhardt M). Wiely-VCH, Weinheim, pp. 159–228.
Harris E (1959) The nitrogen cycle in Long Island Sound. Bull Bingham Oceanogr Coll 17: 31–65.
Harrison WG (1992) Regeneration of nutrients. In: Primary Pro-ductivity and Biogeochemical Cycles in the Sea (eds Falkowski PG, Woodhead AD). Plenum Press, New York, pp. 385–409.
Hernándes-León S, Fraga C, Ikeda T (2008) A global estimation of zooplankton ammonium excretion in the open ocean. J

Noctiluca scintillans in Sagami Bay 29
Plankton Res 30: 577–585. Holm-Hansen O, Lorenzen CJ, Holmes RW, Strickland JDH
(1965) Fluorometric determination of chlorophyll. J Cons Perm Int Explor Mer 30: 3–15.
Hori Y, Miyahara K, Nagai S, Tsujino K, Nakajima M, Yama-moto K, Yoshida Y, Araki N, Sakai Y (1998) Relationships be-tween the dominant phytoplankton and DIN : DIP ratios in Osaka Bay and Harima-nada. Nippon Suisan Gakkaishi 64: 243–248. (in Japanese with English abstract)
Huang C, Qi Y (1997) The abundance cycle and influence factors on red tide phenomena of Noctiluca scintillans (Dinophyceae) in Dapeng Bay, the South China Sea. J Plankton Res 19: 303–318.
Ikeda T (1974) Nutritional ecology of marine zooplankton. Mem Fac Fish Hokkaido Univ 22: 1–97.
Ikeda T (1985) Metabolic rates of epipelagic marine zooplankton as a function of body mass and temperature. Mar Biol 85: 1–11.
Ikeda T, Skjoldal HR (1980) The effect of laboratory conditions on the extrapolation of experimental measurements to the ecology of marine zooplankton. VI. Changes in physiological activities and biochemical components of Acetes sibogae aus-tralis and Acartia australis after capture. Mar Biol 58: 285–293.
Imai I, Yamaguchi M, Hori Y (2006) Eutrophication and occur-rences of harmful algal blooms in the Seto Inland Sea, Japan. Plankton Benthos Res 1: 71–84.
Isinibilir M, Kideys AE, Tarkan AN, Yilmaz IN (2008) Annual cycle of zooplankton abundance and species composition in Izmit Bay (the northeastern Marmara Sea). Estur Coast Shelf Sci 78: 739–747.
Jacobson DM, Anderson DM (1993) Growth and grazing rates of Protoperidinium hirobis Abè, a thecate heterotrophic dinofla-gellate. J Plankton Res 15: 723–736.
Kamataki H (2005) Occurrence of red tides in Tokyo Bay and Sagami Bay from 1975 to 2003. Bull Kanagawa Pref Fish Res Inst 10: 49–53. (in Japanese)
Kiørboe T, Titelman J (1998) Feeding, prey selection and prey encounter mechanisms in the heterotrophic dinoflagellate Noc-tiluca scintillans. J Plankton Res 20: 1615–1636.
Kirchner M, Sahling G, Uhlig G, Gunkel W, Klings KW (1996) Does the red tide-forming dinoflagellate Noctiluca scintillans feed on bacteria? Sarsia 81: 45–55.
Kuroda K (1990) Noctiluca scintillans (Macartney) Ehrenberg. In: Red Tide Organisms in Japan̶An Illustrated Taxonomic Guide̶(eds Fukuyo Y, Takano H, Chihara M, Matsuoka K). Uchida Rokakuho, Tokyo, pp. 78–79. (in Japanese with Eng-lish notes)
Kuroda K, Saga S (1978) The distribution and ecology of Nocti-luca scintillans in Osaka Bay. Bull Japan Soc Fish Oceanogr 32: 56–67. (in Japanese)
Le Borgne RP (1979) Influence of duration of incubation on zoo-plankton respiration and excretion results. J Exp Mar Biol Ecol 37: 127–137.
Le Fèvre J, Grall JR (1970) On the relationships of Noctiluca swarming off the western coast of Brittany with hydrological features and plankton characteristics of the environment. J Exp Mar Biol Ecol 4: 287–306.
Lee JK, Hirayama K (1992) Effects of salinity, food level and temperature on the population growth of Noctiluca scintillans (Macartney). Bull Fac Fish Nagasaki Univ 71: 163–168.
Machida M, Fujitomi M, Hasegawa K, Kudo T, Kai M, Ko-bayashi T, Uede T (1999) Red tide of Ceratium furca along the Pacific coast of central Japan in 1997. Nippon Suisan Gakkai-shi 65: 755–756. (in Japanese)
Manabe T, Tanda M, Hori Y, Nagai S, Nakamura Y (1994) Changes in eutrophication and phytoplankton in Harima-nada–results of environmental monitoring for 20 years. Bull Coast Oceanogr 31: 169–181. (in Japanese with English ab-stract)
Mayzaud P (1976) Respiration and nitrogen excretion of zoo-plankton. IV. The influence of starvation on the metabolism and the biochemical composition of some species. Mar Biol 37: 47–58.
Miyaguchi H, Fujiki T, Kikuchi T, Kuwahara VS, Toda T (2006) Relationship between the bloom of Noctiluca scintillans and environmental factors in the coastal waters of Sagami Bay. J Plankton Res 28: 313–324.
Montani S, Pithakpol S, Tada K (1998) Nutrient regeneration in coastal seas by Noctiluca scintillans, a red tide-causing dino-flagellate. J Mar Biotechnol 6: 224–228.
Nakajima T (1988) Effects of deep sea water on the growth of a marine diatom species Skeletonema costatum. Bull Plankton Soc Jpn 35: 45–55. (in Japanese with English abstract)
Nakamura Y (1998a) Growth and grazing of a large heterotro-phic dinoflagellate, Noctiluca scintillans, in laboratory cul-tures. J Plankton Res 20: 1171–1720.
Nakamura Y (1998b) Biomass, feeding and production of Nocti-luca scintillans in the Seto Inland Sea, Japan. J Plankton Res 20: 2213–2222.
Nomura H (1998) Changes in red tide events and phytoplankton community composition in Tokyo Bay from the historical plankton records in a period between 1907 and 1997. Ocean-ogr Jpn 7: 159–178. (in Japanese with English abstract)
Nozawa K (1943) Specific gravity and its adaptation to environ-mental sea water in Noctiluca. Zool Soc Jpn 55: 305–314. (in Japanese)
Okaichi T, Nishio S (1976) Identification of ammonia as the toxic principle of red tide of Noctiluca miliaris. Bull Plankton Soc Jpn 23: 75–80. (in Japanese with English abstract)
Okutsu T, Ara K, Hiromi J (2012) Microbial food web structure of the plankton ecosystem in the neritic area of Sagami Bay, Japan: seasonal variability in chlorophyll a <20 μm, bacteria, heterotrophic nanoflagellates and microzooplankton. Bull Plankton Soc Jpn 59: 1–19. (in Japanese with English abstract)
Omori M (1969) Weight and chemical composition of some im-portant oceanic zooplankton in the North Pacific Ocean. Mar Biol 3: 4–10.
Omori M, Ikeda, T (1984) Methods in Marine Zooplankton Ecol-ogy. A Wiley-Interscience Publication, New York, 332 pp.
Painting SJ, Lucas MI, Peterson WT, Brown PC, Hutchings L, Mitchell-Innes BA (1993) Dynamics of bacterioplankton, phy-toplankton and mesozooplankton communities during the de-velopment of an upwelling plume in the southern Benguela. Mar Ecol Prog Ser 100: 35–53.
Parsons TR, Maita Y, Lalli CM (1984a) A Manual of Chemical

30 K. ArA et al.
and Biological Methods for Seawater Analysis. Pergamon Press, Oxford, 173 pp.
Parsons TR, Takahashi M, Hargrave B (1984b) Biological Oceanographic Processes, 3rd Edition. Pergamon Press, Ox-ford, 329 pp.
Pennak RW (1943) An effective method of diagramming diurnal movements of zooplankton organisms. Ecology 24: 405–407.
Pithakpol S, Tada K, Montani S (2000a) Nutrient regeneration during Noctiluca scintillans red tide in Harima Nada, the Seto Inland Sea, Japan. In: Proceedings of the 15th Ocean Engi-neering Symposium (ed the Society of Naval Architects of Japan). pp. 127–134.
Pithakpol S, Tada K, Montani S (2000b) Ammonium and phos-phate pools of Noctiluca scintillans and their supplies to the water column in Harima Nada, the Seto Inland Sea, Japan. La mer 37: 153–162.
Redfield AC, Ketchum BH, Richards FA (1963) The influence of organisms on the composition of seawater. In: The Sea, Vol. 2 (ed Hill MN). John Wiley, New York, pp. 26–77.
Saitou K (1992) Year to year variations in water quality in the coastal areas in Sagami Bay. Bull Jpn Soc Fish Oceanogr 56: 328–334. (in Japanese)
Sautour B, Artigas LF, Delmas D, Herbland A, Laborde P (2000) Grazing impact of micro- and mesozooplankton during a spring situation in coastal waters off the Gironde estuary. J Plankton Res 22: 531–552.
Schaumann K, Gerders D, Hesse K-J (1988) Hydrographic and biological characteristics of a Noctiluca scintillans red tide in the German Bight, 1984. Meeresforsch 32: 77–91.
Schoemann V, de Baar HJW, de Jong JTM, Lancelot C (1998) Effects of phytoplankton blooms on the cycling of manganese and iron in coastal waters. Limnol Oceanogr 43: 1427–1441.
Shanks A, Walters K (1996) Feeding by a heterotrophic dinofla-gellate in marine snow. Limnol Oceanogr 41: 177–181.
Skjoldal HR, Båmstedt U, Klinken J, Laing A (1984) Changes with time after capture in the metabolic activity of the carniv-orous copepod Euchaeta norvegica Boeck. J Exp Mar Biol Ecol 83: 195–210.
Tada K, Pithakpol S, Montani S (2004) Seasonal variation in the abundance of Noctiluca scintillans in the Seto Inland Sea, Japan. Plankton Biol Ecol 51: 7–14.
Tada K, Pithakpol S, Yano R, Montani S (2000) Carbon and ni-
trogen content of Noctiluca scintillans in the Seto Inland Sea of Japan. J Plankton Res 22: 1203–1211.
Tanaka K (1993) A condition of water pollution in Sagami Bay and inflowing rivers. Bull Japan Soc Fish Oceanogr 57: 249–255. (in Japanese)
Tanaka N (1985) IV Biology. In Coastal Oceanography Research Committee. In: Oceanography in Japanese Islands (ed the Oceanographic Society of Japan). Tokai University Press, Tokyo, pp. 417–427. (in Japanese)
Tatara E, Kikuchi T (2003) Seasonal change of standing stocks of phytoplankton and some ecological parameters in the coastal waters of Sagami Bay. Actinia 15: 15–24. (in Japanese with English abstract)
Uhlig G, Sahling G (1990) Long-term studies on Noctiluca scin-tillans in the German Bight population dynamics and red tide phenomena 1968–1988. Neth J Sea Res 25: 101–112.
Verity PG (1985) Grazing, respiration, excretion, and growth rates of tintinnids. Limnol Oceanogr 30: 1268–1282.
Yamada Y (1997) The strange color of sea occurred in Tokyo Bay and Sagami Bay, May 1996. Bull Kanagawa Pref Fish Res Inst 2: 65–75. (in Japanese with English abstract)
Yamada Y, Iwata S (1992) Recent trend of marine environment in Sagami Bay. Bull Japan Soc Fish Oceanogr 56: 323–327. (in Japanese)
Yamada Y, Matsushita S (2005) Environmental properties in the coastal area of Sagami Bay. Bull Japan Soc Fish Oceanogr 69: 208–212. (in Japanese)
Yamada Y, Matsushita S (2006) Estimation of pollution loads of nitrogen, phosphorus and COD to Sagami Bay by using water quality data of the influent rivers. Bull Kanagawa Pref Fish Tech Center 1: 43–49. (in Japanese)
Yoshida K, Ishimaru T (2008) Long term change of the phyto-plankton community in Tokyo Bay. Bull Plankton Soc Japan 55: 45–47. (in Japanese with English abstract)
Yoshida Y, Mishima Y, Sato M (1998) Relationships between the dominant phytoplankton and DIN : DIP ratios in the inner part of Tokyo Bay. Nippon Suisan Gakkaishi 64: 259–263. (in Japa-nese with English abstract)
Yoshimatsu S (2008) Long-term variation in phytoplankton in southern part of Harimanada. Bull Plankton Soc Jpn 55: 41–44. (in Japanese with English abstract)


![Heterotrophic nutrition [2015]](https://static.fdocuments.net/doc/165x107/55d39cc0bb61ebf8268b46dd/heterotrophic-nutrition-2015-55d47f014ed07.jpg)