Seasonal LAI in Slash Pine Estimated with Landsat TM · Seasonal LAI in Slash Pine Estimated with...
20
NASA Technical Memorandum 102278 Seasonal LAI in Slash Pine Estimated with Landsat TM Paul J. Curran, Jennifer L. Dungan, and Henry L. Gholz May 1990 • (NASA—TM-10227) SFASONAL IAI IN SLASH PINE ESTIMATED WIT 4 LANOSAT TM (NASA) 20 p Unci as G3143 029155 N9O-5391 NASA National Aeronautics and Space Administration https://ntrs.nasa.gov/search.jsp?R=19900016081 2018-06-03T02:55:17+00:00Z
Transcript of Seasonal LAI in Slash Pine Estimated with Landsat TM · Seasonal LAI in Slash Pine Estimated with...
NASA Technical Memorandum 102278
Seasonal LAI in Slash Pine Estimated with Landsat TM
Paul J. Curran, Jennifer L. Dungan, and Henry L. Gholz
May 1990
• (NASA—TM-10227) SFASONAL IAI IN SLASH PINE ESTIMATED WIT 4 LANOSAT TM (NASA) 20 p
Unci as G3143 029155
N9O-5391
NASA National Aeronautics and Space Administration
https://ntrs.nasa.gov/search.jsp?R=19900016081 2018-06-03T02:55:17+00:00Z
NASA Technical Memorandum 102278
CR%WL CEAfl
LR LSTW
Seasonal LAI in Slash Pine Estimated with Landsat TIVI Paul J. Curran, University College of Swansea, Swansea, United Kingdom Jennifer L. Dungan, TGS Technology, Inc., Ames Research Center, Moffett Field, California Henry L. Gholz, University of Florida, Gainesville, Florida
May 1990
NASA National Aeronautics and Space Administration
Ames Research Center Moffett Field, California 94035-1000

SUMMARY
The leaf area index (LAI, total area of leaves per unit area of ground) of most forest canopies varies throughout the year, yet for logistical reasons it is difficult to estimate anything more detailed than a seasonal maximum LAI. To determine if remotely sensed data can be used to estimate LA! seasonally, field measurements of LAI were compared to normalized difference vegetation index (NDVI) values, derived using Landsat Thematic Mapper (TM) data, for 16 fertilized and control slash pine plots on three dates.
Linear relationships existed between NDVI and LAI with R 2 values of 0.35, 0.75, and 0.86 for February 1988, September 1988, and March 1989, respectively. This is the first reported study in which NDVI is related to forest LAI recorded during the month of sensor overpass.
Predictive relationships based on data from eight of the plots were used to estimate the LAI of the other eight plots with a root-mean-square error of 0.74 LAI, which is 15.6% of the mean LAI. This demonstrates the potential use of Landsat TM data for studying seasonal dynamics in forest canopies.
INTRODUCTION
Accurate estimates of the seasonal dynamics of forest leaf area index (LAI, total area of leaves per unit area of ground) of forests are essential for determining the seasonal exchange of energy and material between the forest canopy and atmosphere. Without seasonal estimates of LA! it is not possible to pre-dict the forest's subtle response to changing environmental conditions (Rook et al., 1985) or to develop seasonally sensitive models of canopy processes (Smolander et al., 1987). However, the destructive mea-surement of forest LAI throughout the year is arduous, involving the manual enumeration of leaves for representative, and therefore large, areas of forest.
Remotely sensed radiation in near infrared (NIR: 760-900nm) and red (R: 630-690nm) wavebands has the potential for use in estimating forest LA! (Peterson and Running, 1989). In NW wavelengths, within-leaf scattering is high and therefore reflection from the canopy is high, but in R wavelengths pigment absorption is high and therefore reflection is low (Curran, 1983; Jensen, 1983). Consequently, LAI is usually related positively to an increase in the difference between MR and R (Ashcroft et al., 1990, Girard et al., 1990), at least up to the reflectance asymptote of the canopy (Curran, 1985).
The remote sensing of forest LAI has been hampered by the need to measure LA! (or similar mea-sure of foliar mass) with an accuracy adequate for deriving a predictive relationship (Curran and Williamson, 1985). Despite the logistical problems involved, several groups have managed to produce such relationships (e.g., Jensen and Hodgson, 1985; Running et al., 1986; Badhwar et al., 1986a, 1986b; Danson, 1987; Spanner et al., 1990; Running et al., 1989; Sader et al., 1989; Herwitz et al., in press; Spanner et al., in review). For instance, Peterson et al. (1987) reported a correlation coefficient between LA! and NIR/R of 0.83 for forests in the Pacific Northwest, pointing to the potential of this approach. Some of these relationships were made possible by including a very wide range of vegetation types or LAI. Unfortunately, the ground data upon which these reported relationships were based used methods
of measuring LA! that are inherently unresponsive to seasonal cIange. For example, most were derived using regression relationships between leaf area (or leaf mass) per tree and a seasonally stable tree dimension (e.g., diameter at breast height (dbh)), with both variables collected at various times through-out the growing season and often over different years (e.g., Gholz et al., 1979). Therefore, the applica-tion of these relationships, although potentially useful for estimating LA! over large areas for one point in time, cannot be used to study the seasonal LA! of a forest stand.
This paper reports the use of remotely sensed data for estimating seasonal LA! in a stand of slash pine (Pinus elliottii). This work was partially funded by NASA's Earth Sciences Applications Division while Paul Curran held a Senior NRC/NASA Research Associateship at NASA Ames Research Center under a grant from the NASA Life Sciences Division and by NSF Ecosystem Program Grant number 8106678. The stands for this research were used with the permission of the Jefferson-Smurfit Co. The authors thank Wendell Cropper Jr., Dave Delgado, Denise Guerin, David Nolletti, and Sherryl Vogel, Department of Forestry, University of Florida, for assistance in the field and the laboratory; Xoan Trinh, NASA Ames Research Center, for assistance with data processing; and Dave Peterson, Mike Spanner, and Vern Vanderbilt, NASA Ames Research Center, for their comments on the manuscript.
Study Site
The study site is a 23-year-old (in 1988) slash pine plantation in northern Florida, located approxi-mately 20 km northeast of Gainesville (fig. 1). The site is essentially flat and has a mean elevation of 35 m. The soil is an ultic haplaquod with a low organic matter and nutrient content and a seasonally high water table (USDA, 1954). The mean annual rainfall for the area is 1350 mm and the mean annual tem-perature is 21.7'C (Gholz et al., 1990). The canopy is open and the understory comprises a shrub cover, dominated by saw palmetto (Serenoa repens) and a sparse cover of grasses and forbs overlying dead pine needles. The ecology of the area is well documented (Gholz and Fisher, 1982; Gholz et al., 1985a, 1985b, 1986, 1990).
In 1986, 16 50 m x 50 in plots were established at the study site (fig. 1). Half of the plots were fertil-ized (plots 1, 4, 6, 8, 10, 11, 14, and 15) and the other half were controls (plots 2, 3, 5, 7, 9, 12, 13, and 16). Fertilization involved quarterly additions of a complete fertilizer, starting in February 1987 (Gholz et al., 1990). The increase in LA! associated with the fertilization was evident by early 1988 and resulted in a near 40% increase in LAI by early 1989.
METHODS
LA! and remotely sensed data were collected for each of the 16 plots.
LA! Measurements
The LA! of each plot was determined monthly for three years from mid-1986, with the aim of quan-tifying the carbon flux in slash pine. The procedures for determining LA! are given in detail in Gholz et al. (1990); here we present a summary of the four methodological stages.
Stage 1: Estimating the biomass per plot for August 1987, 1988, and 1989.
The dbh of all trees in each plot was measured annually and allocated to one of six dbh classes. In August of each year, between 20 and 30 trees were felled in proportion to the number of trees in each dbh class. The branches were divided into two size classes for each 1-rn vertical segment of each tree. Dimensional measurements (primary branch length, diameter at the base, foliated length, diameter at the base of live foliage, number of high-order branchlets, and number of foliage clumps) were made for one branch in each size class. The branches were divided into new foliage (<1 year old), old foliage (>1 year old), and woody material; dried at 70°C; and weighed. The foliar biomass was reconstructed for each sample tree by multiplying sample branch dimensions and dry weights from each 1-rn vertical segment, and then summing the products for the tree. These biomass estimates per sample tree were then extrapo-lated to each plot using the dbh classes measured annually.
Stage 2: Determining the growth of new foliage
The lengths of needles on 15 branches from the central four plots (fig. 1) were measured twice monthly in the spring and monthly for the rest of the year. The monthly elongation rates averaged over all canopy positions were expressed as proportions of the maximum for that year. These proportions were then used to adjust the new foliage biomass values from zero at bud-burst, through the August sampling, and on to the maximum in the fall.
Stage 3: Determining the loss of old foliage
Litterfall was collected monthly from five 1-m2 traps in each of the plots. The litterfall was separated into needles and woody material and was dried at 70°C. The dry weight of litter biomass was used to adjust the old foliage biomass values. This was achieved by adding monthly values of litter biomass from bud-burst until August to August old foliage biomass values. Monthly values of litter biomass were subtracted from August old foliage biomass values until the old foliage biomass reached zero in the fall.
Stage 4: Converting from biomass to leaf area
The relationship between biomass (g of dry needles) and leaf area (cm2 of fresh needles) was deter-mined using 1072 fascicles sampled in August 1986; 5 fascicles in each age class within the upper, middle, and lower positions of the canopy sampled in October 1986; 20 fascicles from the upper and lower portions of the canopy sampled in 1988 and 1989; and a selection of fresh litterfall. Total fascicle LA! was calculated from needle volumes and lengths using the water-inversion method (Johnson, 1984). This relationship was applied to all biomass estimates and resulted in estimates of new LA! and old LA!. These estimates of LAI were combined to give one estimate of LAI in each plot for each month for three years. These values had a relatively low error of approximately 0.6 LAI (Gholz et al., 1990), so for the remainder of this paper they are referred to as measured LAI.
3
Remotely Sensed Measurements
Remotely sensed data in R and NIR wavebands with a spatial resolution finer than the plot size are available from airborne multispectral scanners, the Systeme Probatoire de l'Observation de la Terre High Resolution Visible (SPOT HRV) scanner and the Landsat Thematic Mapper (TM). The largest his-torical and likely future record of the study site was provided by the Landsat TM, therefore these data were chosen for analysis.
The images were in digital form with each radiation value representing an area approximately 30 m x 30 m on the ground. Three images with under 10% cloud cover were selected from February 26, 1988 (scene Y5145715305X0), September 21, 1988 (scene Y5166515315X0), and March 16, 1989 (scene Y51841 15302X0) (fig. 2). Scenes were purchased with nearest-neighbor geometric correction on a space oblique Mercator projection. Image processing involved two stages: general radiometric and atmospheric correction and specific processing comprising plot location, irradiance normalization, and waveband ratioing and normalization for the effect of solar zenith angle.
Radiometric correction involved converting relative digital numbers (DN) in each waveband to absolute radiance (L) in mWcm2j.Lm1:
L = gain (DN - offset)
using the gain and offset data provided by the Earth Observation Satellite Company (Clark, 1986).
Atmospheric correction involved suppressing the effect of atmospheric scattering using the modified dark-object subtraction technique of Chavez (1988,1989). First, the minimum radiance of deep lakes in the image was extracted, assuming that without atmospheric scattering the minimum radiance of these features would be zero. Second, a relative power-law scattering model was selected to represent the atmospheric conditions at the time the images were collected, using the guidelines provided by Chavez (1988). This usually varies from the —1 power of the wavelength on moderately clear days to the —0.7 power on hazy days. Using the minimum radiance in the green TM waveband as an arbitrary starting point, the model was applied to radiance in all wavebands. For example, in the September 1988 image, 0.623 and 0.732 mWcnT 2 sr4tm 1 were subtracted from radiance in the MR and R wavebands respectively.
To locate the plots on the images, between 16 and 20 ground control points were collocated on a topographic map and each digital image of the study site. The pixel closest to the center of each plot was identified by triple-triangulation from relevant ground control points and the radiance was extracted. If repeated triangulation located two adjacent pixels for one plot, the mean radiance of the two was used.
To suppress irradiance differences between images, the radiance was normalized by the irradiance. This was accomplished by using the mean radiance of three road intersections in each image as a mea-sure of relative irradiance with which to normalize all of the images to that of February 1988. For exam-ple, to ensure that three road intersections in the September 1988 image had a radiance similar to the same road intersections in the February 1988 image, 1.31 and 0.88 mWcm 2 sr 1 j.tm 1 were subtracted respectively from radiance in the MR and R wavebands of the September 1988 image.
4
Using radiance (L) in MR and R wavebands, the normalized difference vegetation index (NDVI) was calculated as
NDVI = (LMR - LR)/(LNIR + LR)
Finally, as the NDVI is related negatively to the solar zenith angle (Holben, 1986), it was normalized to a constant solar zenith angle using the relative look-up graph of Singh (1988). This processing yielded one NDVI value per plot, per date.
RESULTS
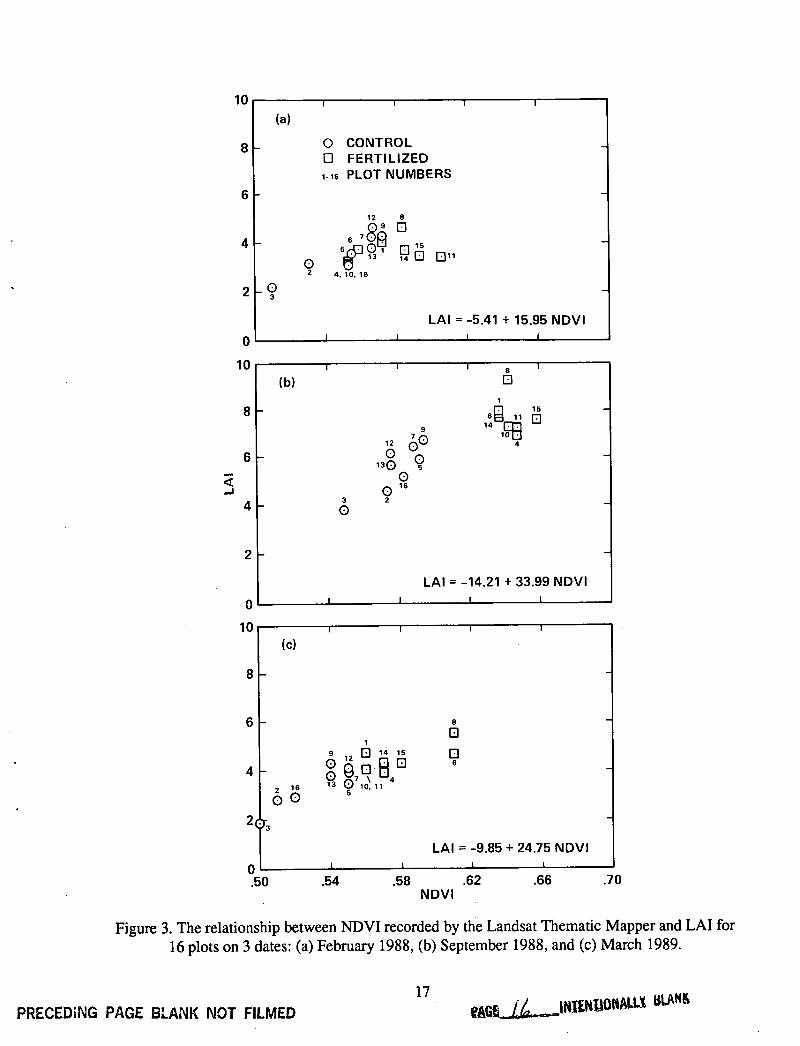
The NDVI and LAI for 16 plots on 3 dates are presented in an abbreviated form in table 1 and as scatterplots in figure 3. The increased variability of both NDVI and LAI in September 1988 and March 1989 was attributable to the higher values of both variables on the fertilized plots (table 2).
There was a positive, linear relationship between NDVI and LAI on all three dates, with R 2 values of 0.35, 0.75, and 0.86 for February 1988, September 1988, and March 1989, respectively (fig. 3). This linearity was expected as the reflectance asymptote for conifer canopies is usually reached at LAI values far in excess of those recorded on the study site (Peterson et al., 1987, Herwitz et al., in press). The relationships between NDVI and LAI are visually similar for the three dates (fig. 3). However, the con-stants and NDVI coefficients differed (F test) at the 0.95 level of significance. These differences can be attributed to measurement error and probable differences in atmospheric conditions and understory ground cover at the time of image acquisition (Fraser and Kaufman, 1985; Curran and Williamson, 1987; Spanner et al., 1989).
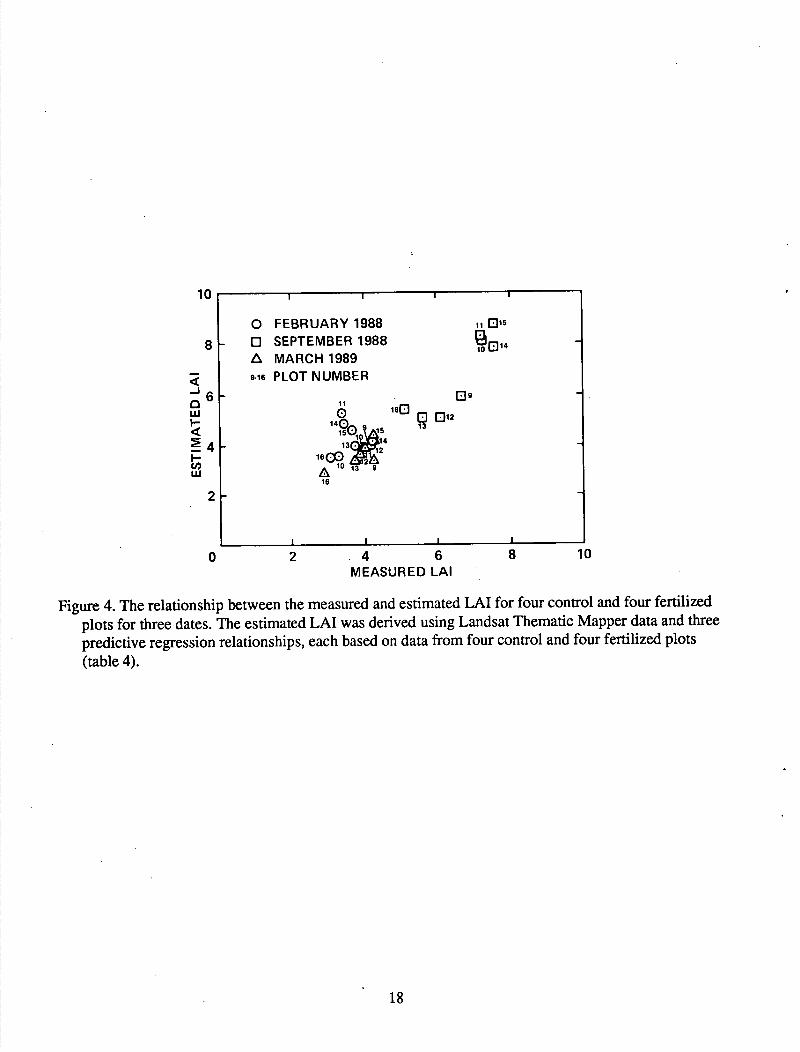
Using data from plots 1 to 8, three predictive relationships were derived (table 3). These relation-ships were used to estimate the LAI of plots 9 to 16 with a root-mean-square error of 0.74 LAI, which is 15.6% of the mean LAI (fig. 4). Table 4 presents results combined by treatment, showing the mean esti-mated and measured LAI for fertilized plots 10, 11, 14, and 15 and control plots 9, 12, 13, and 16.
DISCUSSION
The relationships illustrated in figure 4, in which remotely sensed data are related directly to forest LAI measured during the month of satellite overpass, are the first of their kind to be reported. They demonstrate the potential value of Landsat TM data for estimating seasonal changes in a single forest type by accurately tracking the LAI increase from February 1988 to September 1988 and the decrease from September 1988 to March 1989 (fig. 4, table 4). These relationships were made possible by the existence of monthly ground measurements of LAI; the relatively simple structure and single age of the slash pine plantation; and careful correction of Landsat TM radiance values for the effects of the tempo-rally variable atmosphere, irradiance, and solar angle.
5
The NDVI used in this study suppresses waveband-independent effects and enhances waveband-dependent effects. In doing so it masks the individual roles of R and MR in the NDVI. Researchers have shown that NW varies little over a wide range of forest LAI while R varies greatly over a wide range of forest LAI (e.g., Peterson et al., 1987). This was also observed in the data for February 1988, as the
coefficients of variation were 0.047 and 0.071 for MR and R, respectively. However, by September 1988, the LAI and MR were higher on the fertilized plots, but the R was similar on the fertilized and control plots. Consequently, the coefficients of variation in September 1988 were 0.088 and 0.047 for MR and R, respectively, a pattern which remained in March 1989, with coefficients of variation of 0.079 and 0.057.
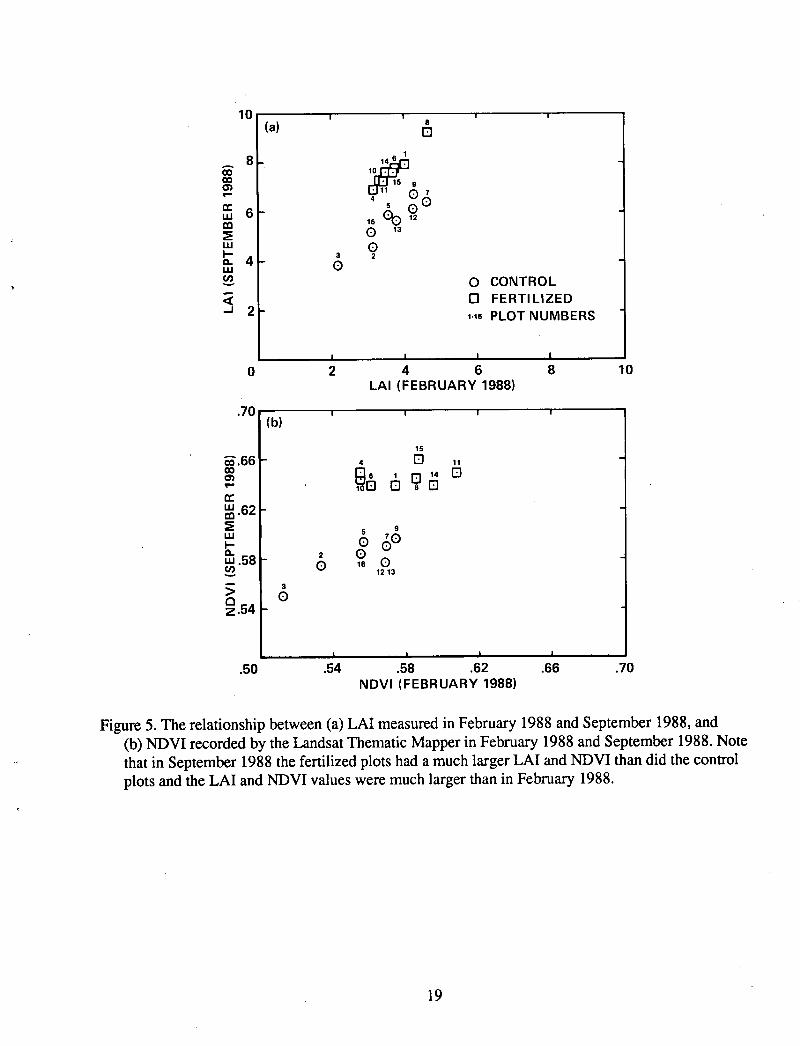
The fertilized plots tended to have a higher LA! than the control plots and could be discriminated on the basis of NDV! (fig. 5). This was also visually apparent on false color Landsat TM images (fig. 2). Part of the increase in the total LA! on the fertilized plots was due to an increase in understory LA! (D. Guerin and H. Gholz, unpubi.). However this effect was small. Between 1986 and 1988, the dates for which we have data, the understory LA! increased by approximately 35% on the control and 65% on the fertilized plots, while maintaining preexisting patterns in understory coverage between plots. Clearly, the NDVI values may have been inflated relative to the canopy LA! when the canopy LA! was low; field observations indicated that this is the case for plot 6, where the growth of understory was unusually rapid.
It should be possible to retrospectively validate the historical patterns of LA! in these stands using available ground LA! data, the kind of relationships demonstrated here, and available Landsat TM imagery. Once the relationships between NDVI and LA! have been obtained, they could be extrapolated spatially with Landsat TM imagery and thus used to drive seasonally sensitive ecosystem models over a number of years (Gholz et al., 1990).
CONCLUSION
Landsat TM data were used to estimate the seasonal LA! of slash pine. This illustrates the potential value of remotely sensed data for the study of seasonal dynamics in forest canopies.
ri
A
REFERENCES
Ashcroft, P. M.; Catt, J. A.; Curran, P. J.; Munden, J.; and Webster, R.: The Relation Between Reflected Radiation and Yield on the Broadbalk Winter Wheat Experiment. Inter. J. Remote Sensing, 11 (in press), 1990.
Badhwar, G. D.; MacDonald, R. B.; and Mehta, N. C.: Satellite-Derived Leaf-Area-Index and Vegeta-tion Maps as Input to Global Carbon Cycle Models—a Hierarchical Approach. Inter. J. Remote Sensing,vol. 7, 1986a, pp. 265-281.
Badhwar, G. D.; MacDonald, R. B.; Hall, F. G.; and Carnes, J. G.: Spectral Characterization of Bio-physical Characteristics in a Boreal Forest: Relationship Between Thematic Mapper Band Reflectance and Leaf Area Index for Aspen. IEEE Trans. Geoscience and Remote Sensing, vol. 214, 1986b, pp. 322-326.
Chavez, P. S.: An Improved Dark-Object Subtraction Technique for Atmospheric Scattering Correction of Multispectral Data. Remote Sensing of Environ., vol. 24, 1988, pp. 459-479.
Chavez, P. S.: Radiometric Calibration of Landsat Thematic Mapper Multispectral Images. Photogram-metric Eng. and Remote Sensing, vol. 55, 1989, pp. 1289-1294.
Clark, B. P.: New Look-up Tables. EOSAT, Landsat Tech. Notes, vol. 1, 1986, pp. 2-8.
Curran, P. J.: Multispectral Remote Sensing for the Estimation of Green Leaf Area Index. Phil. Trans. Roy. Soc. London, Series A, vol. 309, 1983, pp. 257-270.
Curran, P. J.: Principles of Remote Sensing. Longman Scientific and Technical, London, 1985.
Curran, P. J.; and Williamson, H. D.: The Accuracy of Ground Data Used in Remote Sensing Investiga-tions. Inter. J. Remote Sensing, vol. 6, 1985, pp. 1637-1651.
Curran, P. J.; and Williamson, H. D.: Airborne MSS to Estimate GLAI. Inter. J. Remote Sensing, vol. 8, 1987, pp. 57-74.
Danson, F. M.: Preliminary Evaluation of the Relationships Between SPOT-1 HRV Data and Forest Stand Parameters. Inter. J. Remote Sensing, vol. 8, 1987, pp. 1571-1575.
Fraser, R. S.; and Kaufman, Y. K.: The Relative Importance of Aerosol Scattering and Absorption in Remote Sensing. IEEE Trans. on Geoscience and Remote Sensing, vol. 23, 1985, pp. 625-633.
Gholz, H. L.; and Fisher, R. F.: Organic Matter Production and Distribution in Slash Pine (Pinus elliottii) Plantations. Ecology, vol. 63, 1982, pp. 1827-1839.
Gholz, H. L.; Fisher, R. F.; and Pritchett, W. L.: Nutrient Dynamics in Slash Pine Ecosystems. Ecology, vol. 66, 1985a, pp. 647-659.
7

Gholz, H. L.; Hendry, L. C.; and Cropper, W. P., Jr.: Organic Matter Dynamics of Pine Roots in Planta-tions of Slash Pine (Pinus elliottii) in North Florida. Canadian J. Forest Research, vol. 16, 1986,
pp. 529-538.
Gholz, H. L.; Grier, C. C.; Campbell, A. G.; and Brown, A. T.: Equations for Estimating Biomass and Leaf Area of Plants in the Pacific Northwest. Forest Research Laboratory, Oregon State Uni-versity, Corvallis Oregon, Research Paper 41, 1979.
Gholz, H. L.; Perry, C. S.; Cropper, W. P., Jr.; and Hendry L. C.: Litterfall, Decomposition, and Nitro-gen and Phosphorus Dynamics in a Chronosequence of Slash Pine (Pinus elliottii) Plantations. Forest Science, vol. 31, 1985b, pp. 463-478.
Gholz, H. L.; Vogel, S. A.; Cropper, W. P., Jr.; McKelvey, K.; Ewel, K. C.; Teskey, R. 0.; and Curran, P. J.: Dynamics of Canopy Structure and Light Interception in Pinus elliorrii Stands of North Florida. Ecological Monographs (in press), 1990.
Girard, C. M.; Benoit, M.; deVaubernier, E.; and Curran, P. J.: SPOT HRV Data to Discriminate Grass-land Quality. Inter. J. Remote Sensing 11 (in press), 1990.
Herwitz, S. R.; Peterson, D. L.; and Eastman, J. R.: Thematic Mapper Detection of Change in the Leaf Area Index of Closed Canopy Pine Plantations in Central Massachusetts. Remote Sensing of Environment (in press), 1990.
Holben, B. N.: Characteristics of Maximum Value Composite Images from Temporal AVHRR Data. Inter. J. Remote Sensing, vol. 7, 1986, pp. 1417-1434.
Jensen, J. R.: Biophysical Remote Sensing. Annals Assoc. American Geographers, vol. 73, 1983, pp. 111-132.
Jensen, J. R.; and Hodgson, M. E.: Remote Sensing of Forest Biomass: An Evaluation Using High Reso-
lution Remote Sensor Data and Loblolly Pine Plots. The Prof. Geographer, vol. 37, 1985, pp. 46-56.
Johnson, J. D.: A Rapid Technique for Estimating Total Surface Area of Pine Needles. Forest Science, vol. 30, 1984, pp. 913-921.
Peterson, D. L.; Spanner, M. A.; Running, S. W.; and Teuber, K. B.: Relationship of Thematic Mapper Simulator Data to Leaf Area Index of Temperate Coniferous Forests. Remote Sensing of Environ., vol. 22, 1987, pp. 323-341.
Peterson, D. L.; and Running, S. W.: Applications in Forest Management. In Theory and Applications of Optical Remote Sensing (0. Asrar, Ed.), John Wiley, New York, 1989, pp. 429-473.
8
A
Rook, D. A.; Grace, J. C.; Beets, P. N.; Whitehead, D.; Santantonio, D.; and Madgwick, H. A. I.: Forest Canopy Design: Biological Models and Management Implications. In Attributes of Trees as Crop Plants (M. G. R. Cannel! and J. E. Jackson, Eds.), Institute of Terrestrial Ecology, Natural Environment Research Council, Huntingdon, United Kingdom, 1985, pp. 507-524.
Running, S. W.; Peterson, D. L.; Spanner, M. A.; and Teuber, K. B.: Remote Sensing of Coniferous Forest Leaf Area. Ecology, vol. 67, 1986, pp. 273-276.
Running, S. W.; Nemani, R. R.; Peterson, D. L.; Band, L. E.; Potts, D. F.; Pierce, L. L.; and Spanner, M. A.: Mapping Regional Forest Evapotranspiration and Photosynthesis by Coupling Satellite Data with Ecosystem Simulation. Ecology, vol. 70, 1989, pp. 1090-1101.
Sader, S. A.; Waide, R. B.; Lawrence, W. T.; and Joyce, A. T.: Tropical Forest Biomass Successional Age Class Relationships to a Vegetation Index Derived from Landsat TM Data. Remote Sensing of Environ., vol. 28, 1989, pp. 143-156.
Singh, S. M.: Simulation of Solar Zenith Angle Effect on Global Vegetation Index (GVI) Data. Inter. J. Remote Sensing, vol. 9, 1988, pp. 237-248.
Smolander, H.; Oker-Blom, P.; Ross, J.; Kellomaki, S.; and Lahti, T.: Photosynthesis of a Scots pine Shoot: Test of a Shoot Photosynthesis Model in a Direct Radiation Field. Agri. Forest Meteorology, vol. 38, 1987, pp. 231-242.
Spanner, M. A.; Pierce, L. L.; Peterson, D. L.; and Running, S. W.: Remote Sensing of Temperate Coniferous Forest Leaf Area Index: The Influence of Canopy Closure, Understory Vegetation and Background Reflectance. Inter. J. Remote Sensing, vol. 11, 1990, pp. 95-111.
Spanner, M. A.; Pierce, L. L.; Running S. W.; and Peterson, D. L.: The Seasonality of AVHRR Data of Temperate Coniferous Forests: Relationship with Leaf Area Index. Remote Sensing of Environment (in review).
U. S. Department of Agriculture: Soil Survey, Alachua County, Florida. U. S. Department of Agriculture, Washington, DC, 1954.
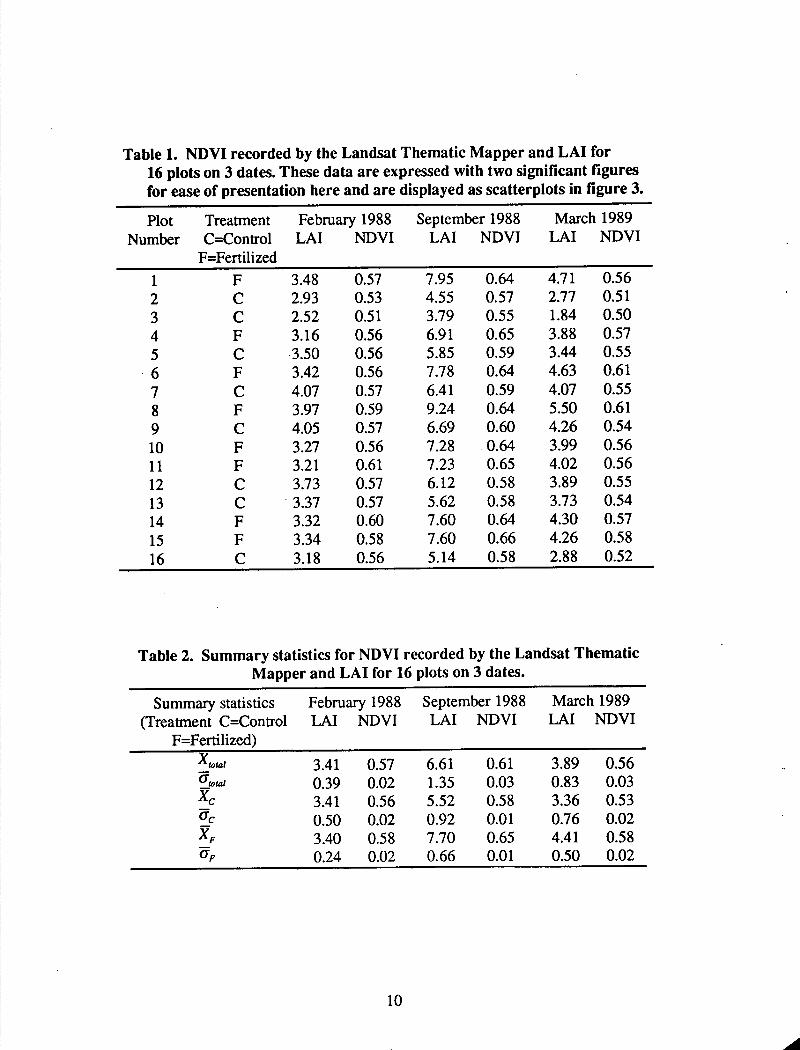
Table 1. NDVI recorded by the Landsat Thematic Mapper and LA! for 16 plots on 3 dates. These data are expressed with two significant figures for ease of presentation here and are displayed as scatterplots in figure 3.
Plot Number
Treatment C=Control
F=Fertilized
February 1988 LA! NDVI
September 1988 LAI NDVI
March 1989 LAI NDVI
1 F 3.48 0.57 7.95 0.64 4.71 0.56 2 C 2.93 0.53 4.55 0.57 2.77 0.51 3 C 2.52 0.51 3.79 0.55 1.84 0.50 4 F 3.16 0.56 6.91 0.65 3.88 0.57 5 C 3.50 0.56 5.85 0.59 3.44 0.55 6 F 3.42 0.56 7.78 0.64 4.63 0.61 7 C 4.07 0.57 6.41 0.59 4.07 0.55
8 F 3.97 0.59 9.24 0.64 5.50 0.61 9 C 4.05 0.57 6.69 0.60 4.26 0.54
10 F 3.27 0.56 7.28 0.64 3.99 0.56 11 F 3.21 0.61 7.23 0.65 4.02 0.56 12 C 3.73 0.57 6.12 0.58 3.89 0.55 13 C 3.37 0.57 5.62 0.58 3.73 0.54 14 F 3.32 0.60 7.60 0.64 4.30 0.57 15 F 3.34 0.58 7.60 0.66 4.26 0.58 16 - C 3.18 0.56 5.14 0.58 2.88 0.52
Table 2. Summary statistics for NDVI recorded by the Landsat Thematic Mapper and LA! for 16 plots on 3 dates.
Summary statistics February 1988 September 1988 March 1989 (Treatment C=Control LAI NDVI LAI NDVI LAI NDVI
F=Fertilized) Xtotal 3.41 0.57 6.61 0.61 3.89 0.56
otal 0.39 0.02 1.35 0.03 0.83 0.03 YC 3.41 0.56 5.52 0.58 3.36 0.53
0.50 0.02 0.92 0.01 0.76 0.02 XF 3.40 0.58 7.70 0.65 4.41 0.58 0F 0.24 0.02 0.66 0.01 0.50 0.02
10
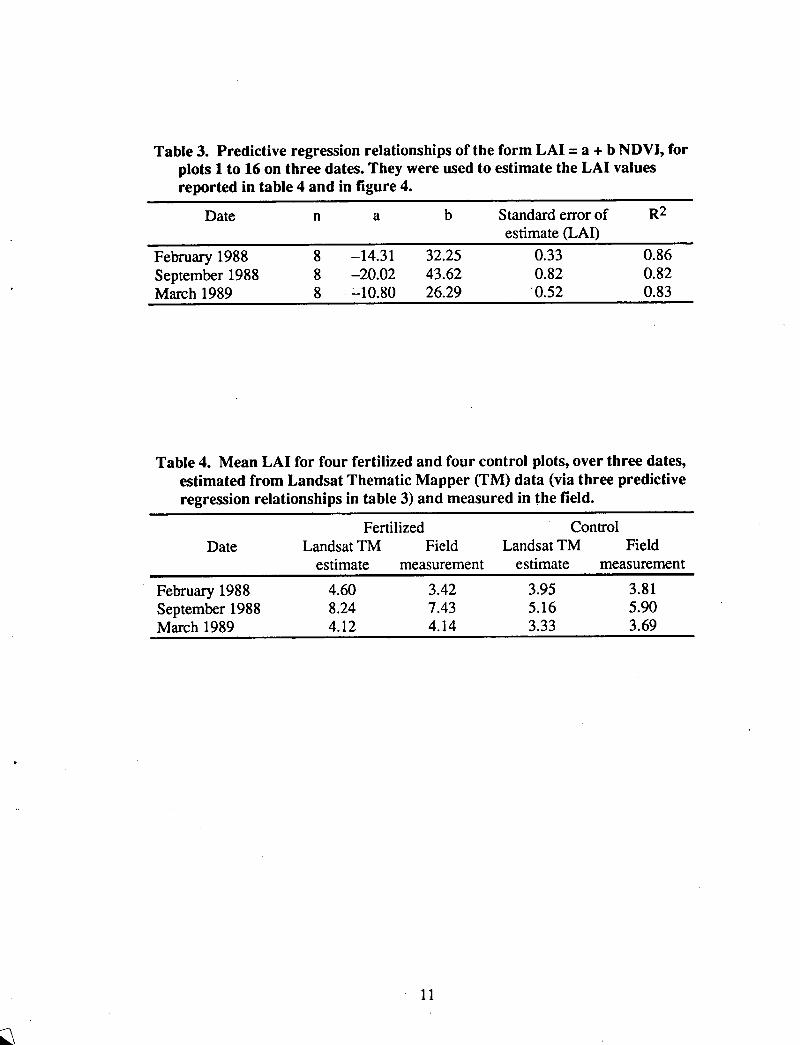
Table 3. Predictive regression relationships of the form LA! = a + b NDVI, for plots 1 to 16 on three dates. They were used to estimate the LA! values reported in table 4 and in figure 4.
Date n a b Standard error of R2 estimate (LAI)
February 1988 8 —14.31 32.25 0.33 0.86 September 1988 8 —20.02 43.62 0.82 0.82 March 1989 8 —10.80 26.29 0.52 0.83
Table 4. Mean LA! for four fertilized and four control plots, over three dates, estimated from Landsat Thematic Mapper (TM) data (via three predictive regression relationships in table 3) and measured in the field.
Fertilized Control Date Landsat TM Field Landsat TM Field
estimate measurement estimate measurement
February 1988 4.60 3.42 3.95 3.81 September 1988 8.24 7.43 5.16 5.90 March 1989 4.12 4.14 3.33 3.69
11
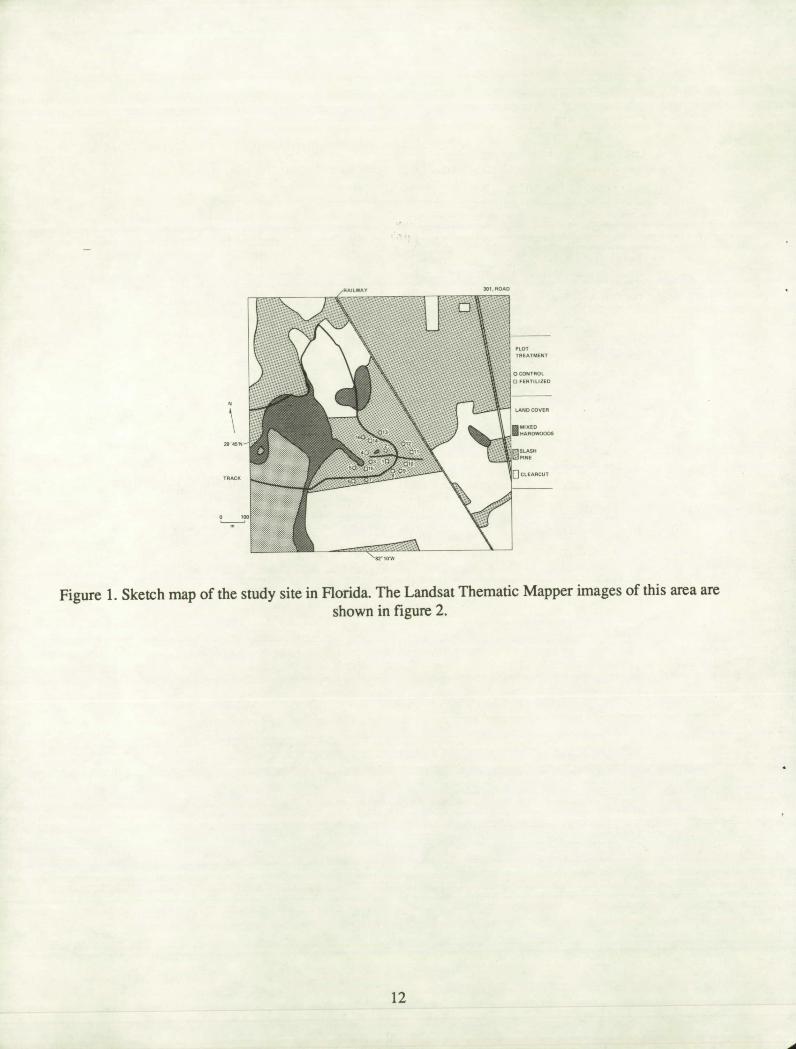
Figure 1. Sketch map of the study site in Florida. The Landsat Thematic Mapper images of this area are shown in figure 2.
12
(a)
cc; r'iJi.
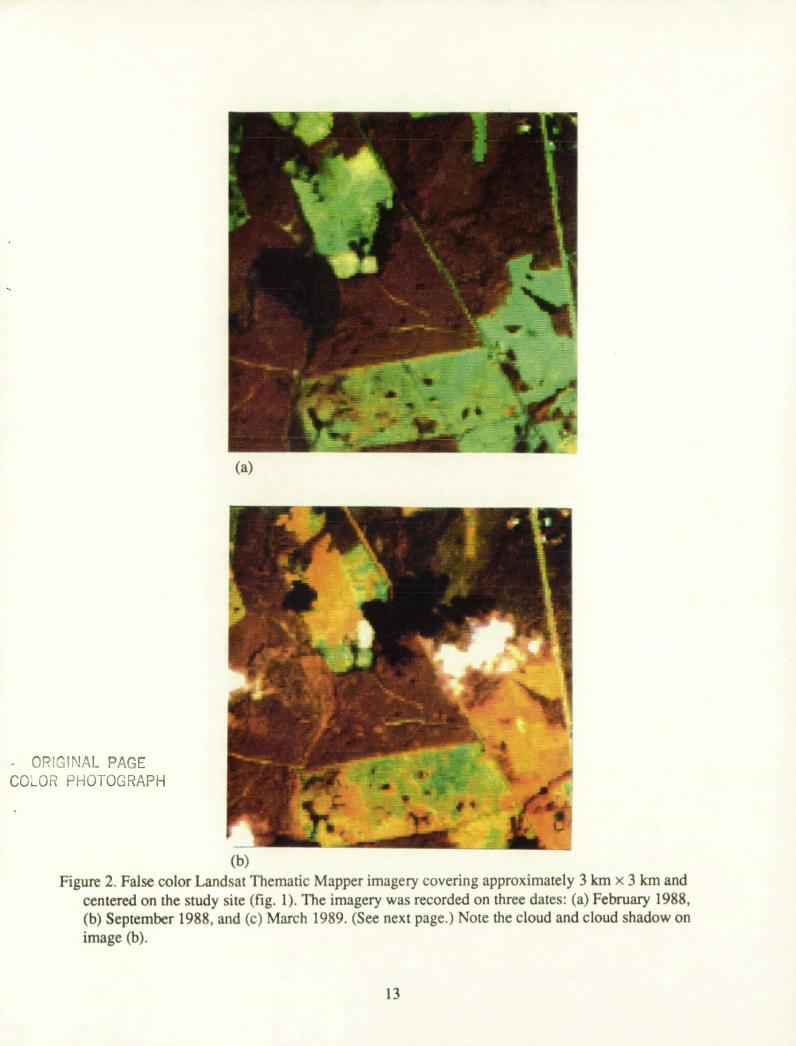
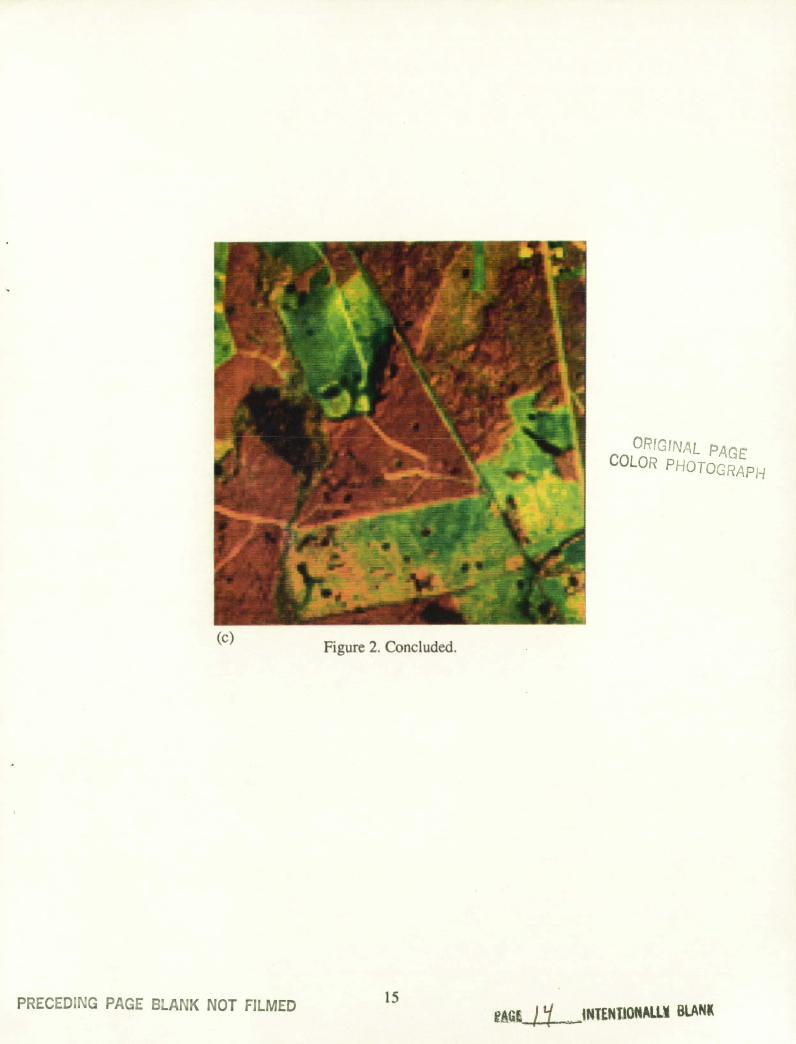
(b) Figure 2. False color Landsat Thematic Mapper imagery covering approximately 3 km x 3 km and
centered on the study site (fig. 1). The imagery was recorded on three dates: (a) February 1988, (b) September 1988, and (c) March 1989. (See next page.) Note the cloud and cloud shadow on image (b).
13
W
'S.
dr
Ltr1 .. :. a.
()Figure 2. Concluded.
4GE COLOR PHOTOGRAPH
PRECEDlNG PAGE BLANK NOT FILMED15
AGL1..JNTENTIONALL BLANK
o CONTROL 0 FERTILIZED 1-16 PLOT NUMBERS
12 8
6 7 §^ C]
011
2 41016
LAI = -5.41 + 15.95 NDVI
I 8 (b) 0
6 15 110
9 14
12 0 00
130 5 0
Q16
3 2 0
LAI = -14.21 + 33.99 NDVI
I I
0 I
(c)
8-
6- 8 0
1214 15
6 4- 07\U4
2 16 13 5 ,
10 11
2.,3
LAI = -9.85 + 24.75 NDVI A I I
NDVI
Figure 3. The relationship between NDVI recorded by the Landsat Thematic Mapper and LA! for 16 plots on 3 dates: (a) February 1988, (b) September 1988, and (c) March 1989.
17 PRECEDING PAGE BLANK NOT FILMED
10
8
6
4
2
0 10
8
6
-J4
(a)
LO 13
0 1
I I I
0 FEBRUARY 1988 ii O5 0 SEPTEMBER 1988
MARCH 1989 9•16 PLOT NUMBER
Ii D 0 16000
140, 13
13C114
10 13 9
16
I I I
0 2 4 6 8 10 MEASURED LAI
Figure 4. The relationship between the measured and estimated LAI for four control and four fertilized plots for three dates. The estimated LAI was derived using Landsat Thematic Mapper data and three predictive regression relationships, each based on data from four control and four fertilized plots (table 4).
10
8
-j
W I-I-Cl) w
2
18
10 I I
(a) 8 0
148
ull 4 500
00 12 o 13
0
3 2 0
o CONTROL o FERTILIZED
1 .16 PLOT NUMBERS
I I
2 4 6 8 10 LAI (FEBRUARY 1988)
8
0)
w
w I-o4 w U)
—2
.70
15
4 0 6 0 D o
W62.5 9
w I-
58- 2 0 1213
3 0
.50 .54 .58 .62 .66 .70 NDVI (FEBRUARY 1988)
Figure 5. The relationship between (a) LAI measured in February 1988 and September 1988, and (b) NDVI recorded by the Landsat Thematic Mapper in February 1988 and September 1988. Note that in September 1988 the fertilized plots had a much larger LAI and NDVI than did the control plots and the LAI and NDVI values were much larger than in February 1988.
19

PJASA Report Documentation Page Sç,cs Ai,aa,
1. Report No. 2. Government Accession No. I. Recipient's Catalog No.
NASA TM-102278
4. Title and Subtitle 5. Report Date
Seasonal LAI in Slash Pine Estimated with Landsat TM May 1990 6. Performing Organization Code
7. Author(s) 8. Performing Organization Report No.
Paul J. Curran,* Jennifer L. Dungan,t and Henry L. Gholz A-90060
10. Work Unit No.
677-21-35 9. Performing Organization Name and Address
11. Contract or Grant No. Ames Research Center Moffett Field, CA 94035-1000
13. Type of Report and Period Covered
Technical Memorandum 12. Sponsoring Agency Name and Address
National Aeronautics and Space Administration 14. Sponsoring Agency Code Washington, DC 20546-000 1
15. Supplementary Notes Point of Contact: David Peterson, Ames Research Center, MS 242-4, Moffett Field, CA 94035-1000, (415) 604-5599 or FTS 464-5599
*Department of Geography, University College of Swansea, Singleton Park, Swansea SA2 800, UK tTGS Technology, Inc., Ames Research Center, Moffett Field, CA 94035-1000 USA *Department of Forestry, University of Florida, Gainesville, FL 32611 USA 16. Abstract p (Sf..l
The leaf area index (LAI, total area of leaves per unit area of ground) of most forest canopies varies throughout the year, yet for logistical reasons it is difficult to estimate anything more detailed than a seasonal maximum LAI. To determine if remotely sensed data can be "used to estimate LAI seasonally, field measurements of LAI were compared to normalized difference vegetation index (NDVI) values, derived using Landsat Thematic Mapper (TM) data, for 16 fertilized and control slash pine plots on 3 dates.
Linear relationships existed between NDVI and LAI with"R 2 values of 0.35,035, and 0.86 for February 1988, September 1988, and March 1989, respectively. This is the first reported study in which NDVI is related to forest LAI recorded during the month of sensor overpass.
Predictive relationships based on data from eight of the plots were used to estimate the LAI of the other eight plots with a root-mean-square error of 0.74 LAI, which is 15.6 010 of the mean LAI. This demonstrates the potential use of Landsat TM data for studying seasonal dynamics in forest canopies.
17. Key Words (Suggested by Author(s)) 18. Distribution Statement
Remote sensing Unclassified-Unlimited LAI Landsat TM Subject Category - 43 Slash pine
19. Security Classit. (of this report) 20. Security Classif. (of this page) 21. No. of Pages 22. Price
Unclassified Unclassified 22 A02
NASA FORM 1626 OCTFor sale by the National Technical Information Service, Springfield, Virginia 22161