Collie and Pemberton Landsat TM Scenes Salinity Mapping
13
Collie and Pemberton Landsat TM Scenes Salinity Mapping A report from the NHT-funded project Land Monitor Fiona Evans CSIRO Mathematical and Information Science CMIS Task Report No. 3/01
Transcript of Collie and Pemberton Landsat TM Scenes Salinity Mapping
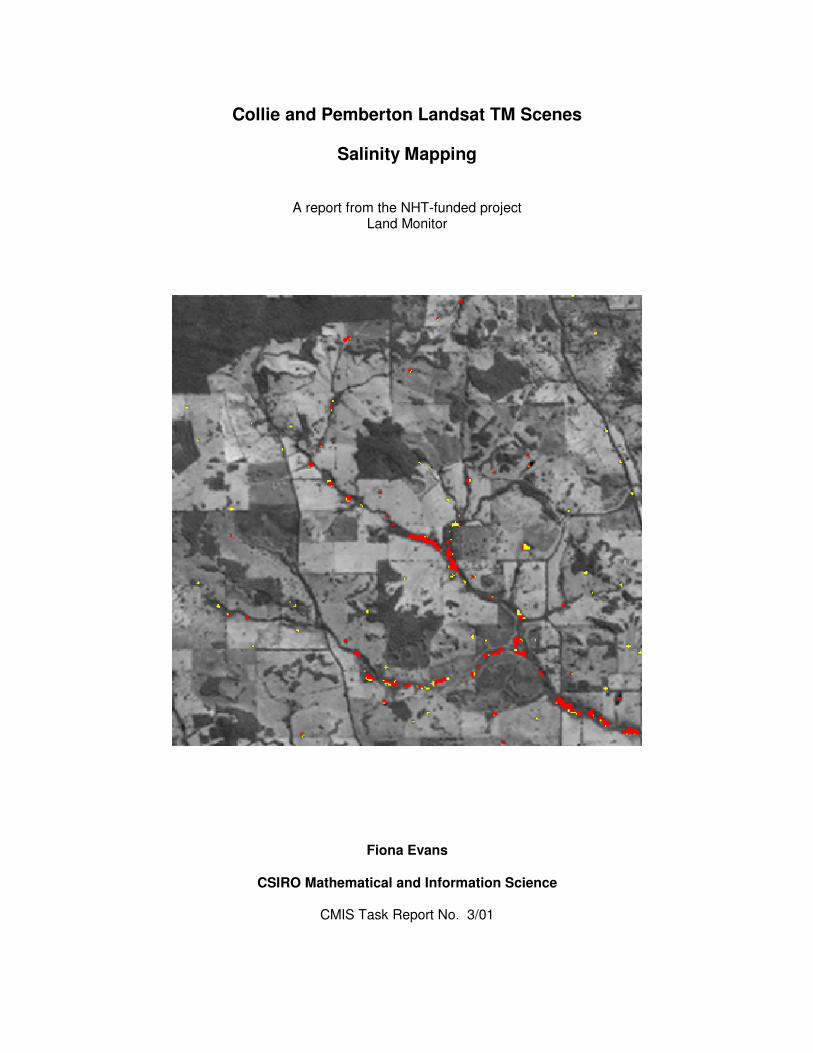
Collie and Pemberton Landsat TM Scenes
Salinity Mapping
A report from the NHT-funded project
Land Monitor
Fiona Evans
CSIRO Mathematical and Information Science
CMIS Task Report No. 3/01

2
Executive Summary : Collie & Pemberton Scenes Image Dates:
September 1988 September 1996 August 1998 August 1999
Additional early-date images were unavailable due to problems with cloud cover. Accuracy Assessment:
Catchment Accuracy of Salt-affected land
detected
Non-saline land labelled correctly
East Collie 99% of bare salt 70%of marginal salt
99% remnant vegetation 100% agricultural land
Comments on the Accuracy Assessment: The biggest sources of omission errors (salt-affected land not detected) are:
- Areas with a cover of salt-tolerant grasses. The biggest source of commission errors are:
- Sparse remnant vegetation.
Special Comments:
The mosaicked Collie - Pemberton Landsat TM scenes have been divided into five zones that broadly correspond to the major hydrogeological systems of the region, as mapped by the Agriculture WA Soil Landscape zones. The salinity mapping zones are:
− Coastal zone including the coastal plains irrigation areas
− South west zone including the Margaret River vineyard areas
− Forest zone
− Eastern Zone (including a significant overlap with the Dumbleyung scene)
− Southern Zone (areas east including the upper Tone and Lake Muir catchments have been processed as part of the Mt Barker scene)
Expressions of salinity in south west and forest zones are minor and quite different to those observed in most of the wheatbelt. These zones have not been processed for this reason. The coastal zone is known to have large areas affected by salinity. However, the salt-affected areas cannot be discriminated using Landsat TM satellite imagery. Salinity is also affecting significant areas of agricultural land in the coastal zone, but ground data in the Manjimup-Pemberton area have shown that the Land Monitor method is also unsuitable in these higher rainfall areas.

3
The Study Area The Collie and Pemberton Landsat TM scenes (112-083 and 112-084) extend from Bunbury to the south coast and from the western coastline of WA to to Lake Muir in the east. It has been divided into five zones that broadly correspond to the major hydrogeological systems of the region, as mapped by the Agriculture WA Soil Landscape zones. The salinity mapping zones are:
− Coastal zone including the coastal plains irrigation areas
− South west zone including the Margaret River vineyard areas
− Forest zone
− Eastern Zone
− Southern Zone including the Manjimup-Pemberton and Lake Muir areas The soil landscape zones and stratification zones are shown in figures 1 and 2 below.
Figure 1: Location map showing the
Soil Landscape zones of the Collie and Pemberton scenes
Figure 2: Location map showing the
rough boundaries of stratification zones for the Collie and Pemberton scenes
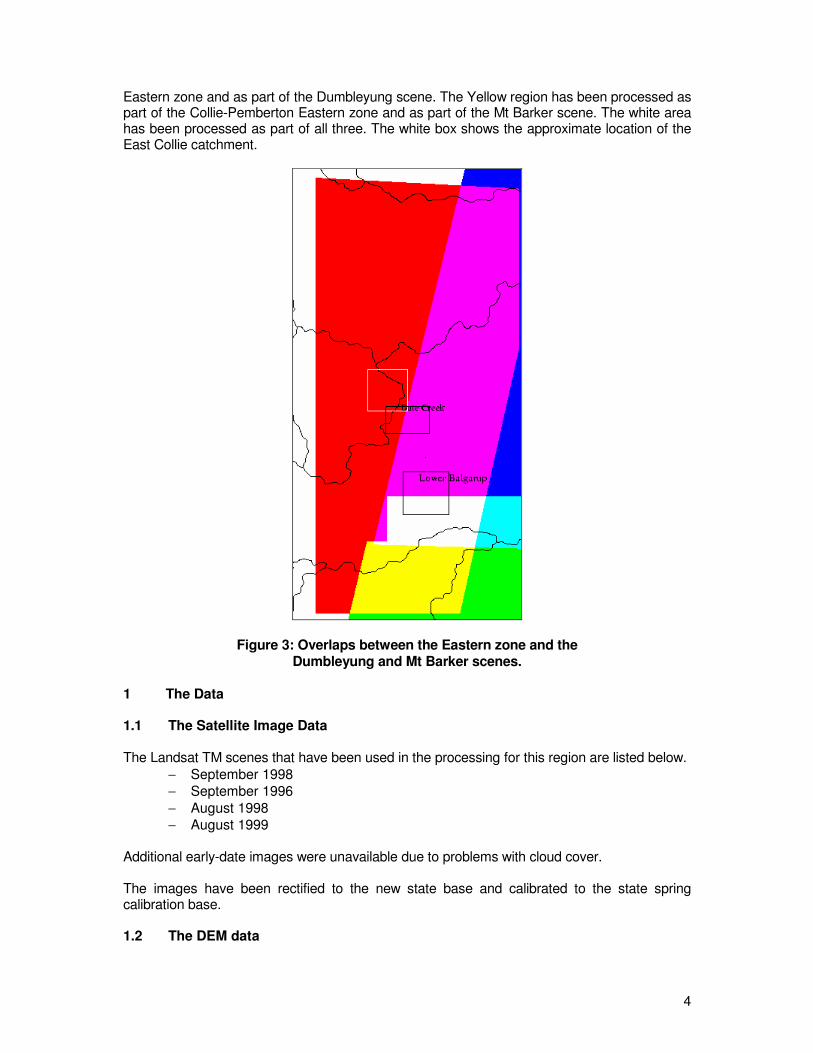
It should be noted that the Eastern zone includes a large area of overlap with the Dumbleyung scene. The only advantage to processing this area simultaneously with the western parts of the zone is that ground data used for the Dumbleyung salinity monitoring can be re-used to extrapolate westwards. Figure 3 shows the overlap areas between the Eastern zone (shown in the red colour gun), the Dumbleyung scene (shown in the blue colour gun) and the Mt Barker Scene (shown in the green colour gun). The pink region has been processed as part of the Collie-Pemberton
4
Eastern zone and as part of the Dumbleyung scene. The Yellow region has been processed as part of the Collie-Pemberton Eastern zone and as part of the Mt Barker scene. The white area has been processed as part of all three. The white box shows the approximate location of the East Collie catchment.
Figure 3: Overlaps between the Eastern zone and the Dumbleyung and Mt Barker scenes.
1 The Data
1.1 The Satellite Image Data The Landsat TM scenes that have been used in the processing for this region are listed below.
− September 1998
− September 1996
− August 1998
− August 1999
Additional early-date images were unavailable due to problems with cloud cover. The images have been rectified to the new state base and calibrated to the state spring calibration base.
1.2 The DEM data

5
The DEM for the Collie-Pemberton scenes was formed from two parts. In the eastern part of the region, 5m contour data obtained from DOLA were gridded using spline interpolation. In the western part of the region, the Land Monitor DEMs were used.
1.3 The Ground-Truth Data Ground data for the five stratification zones is summarised in table 1 below.
Table 1: Ground truth data by stratification zone
Zone Ground data
Coastal zone Gridded EM-38 measurements for selected farms and soil landscape units at 1:50 000 scale and aerial photograph interpretations (7) provided by Dennis Van Gool and Brian Beetson, Agriculture WA
South west zone Minimal salinity in this zone
Forest zone Minimal salinity in this zone
Eastern Zone Land Monitor salinity monitoring information from the Dumbleyung scene available in the scene overlap area – this included data from the Date Creek and Lower Balgarup catchments in the form of digital maps showing the boundaries of salt-affected areas
Salinity map for the East Collie catchment provided by Shawan Dogramaci, Water and Rivers Commission
On-ground validation performed by Richard George and Don Bennett, Agriculture WA
Southern Zone Aerial photograph interpretations (5) provided by Steve DeMonk, Water and Rivers Commission
Ground data, in the forms described above, are held by CSIRO Mathematical and Information Sciences. 2 Salinity Mapping Methodology The steps used to produce the salinity maps are listed below. This is the standard methodology being used for Land Monitor salinity mapping and monitoring. 1. Co-register the images to a common map base. This allows ground sites to be traced
through time and the satellite data to be compared with the ancillary map data, such as the DEM.
2. Calibrate the image data from different dates to a reference image so that digital counts
from different image dates can be compared (Furby et al, 1996). 3. Locate ground sites of all the major cover types in each of the images.

6
4. Stratify the study area into zones within which there are no marked regional variations in
rainfall, land-use types or rotations, geology, predominant soil types or visible patterns in the image. If there are strong differences between these zones, they should be processed separately.
5. Apply discriminant analysis procedures, in particular canonical variate analyses
(Campbell and Atchley, 1981), to the training data to examine the separation of ground cover types in the TM spectral data, determine which image dates are most appropriate and define sensible spectral groupings of ground cover types.
6. Apply maximum likelihood classification techniques (Campbell and Wallace, 1989) to the
best individual image dates. This produces probabilities of belonging to each of the major cover classes on each date for each pixel in the images.
7. Combine the cover class probabilities from each date with position in the landscape – hill,
slope, valley floor – to calculate the probability of each pixel being salt-affected. A conditional probability network (CPN) is used for these calculations (Caccetta et al 1995).
8. Post-processing to remove obvious errors in the final salinity maps, such as roads and
edges of bush blocks being labelled as salt-affected. 3 Final Salinity Maps: The Processing History The final salinity maps are a result of the several processing iterations. These final-pass maps will be described in detail in section 4.2. Section 4.1 provides a brief description of the previous iteration. Detailed task reports describe each of the processing steps; only summary information is provided here. The task reports are held by CSIRO Mathematical and Information Sciences.
3.1 Previous iteration: The Processing History by Zone Expressions of salinity in several of the zones are minor and quite different to those observed in most of the wheatbelt. The following sections describe in detail the conclusions about each zone. As a result of this process, only the eastern zone has been processed using the Land Monitor methodology.
4.1.1 Coastal Zone Ground data for the coastal zone, including irrigated areas, were provided in the form of:
− Gridded EM-38 measurements for selected farms
− Soil landscape units at 1:50 000 scale
− Aerial photograph interpretations (7) The EM-38 measurements consisted of real-values that varied from 2 to 293. The interpretation of these values was recommended as follows:
− 0-50 condition ok
− 50-100 salt-affected with 10-25% loss in productivity
− 100-175 highly salt-affected with >50% loss in productivity
− >175 severely salt-affected with >75% loss in productivity

7
Examples of the EM-38 maps with the corresponding 1999 Landsat TM image are shown in figures 4 and 5 below. In these figures, it can be seen that the variations in the 'colours' of the satellite images do not match the salinity classes measured by the EM-38 instrument. In figure 4, the severely salt-affected areas that are shown inn red on the left hand side can be seen to contain multiple landcover types and conditions in the satellite image. This area includes remnant vegetation that seems to be supporting a healthy cover, and pastures that look similar to those pastures seen in other parts of the image.
Figure 4 EM-38 salinity classes and 1999 Landsat image for the same area
red = severely salt-affected, yellow = highly salt-affected,
blue = salt-affected, dark blue = ok.
Figure 5 EM-38 salinity classes and 1999 Landsat image for the same area red = severely salt-affected, yellow = highly salt-affected,
blue = salt-affected, dark blue = ok. Detailed visual inspection of the areas for which EM-38 measurements are available suggests that discrimination between saline and non-saline land will not be possible using the Landsat imagery given the conditions in the coastal zone. This conclusion is further backed up when the ground data provided in the form of interpreted aerial photographs is examined. Figure 6 shows one example of the interpretations overlaid on the 1999 Landsat TM image. As can be seen in figure 6, areas with barley grass show similar image 'colours' to other pastures in the aerial photograph and

8
areas with reeds are very small and unable to be distinguished from the remainder the photograph. It can also be noted that of the seven photographs that were provided, only four contained any salt-affected areas. Of these, the areas with reed cover were minimal. It is concluded that salt-affected land (as detected by EM-38) in the coastal zone cannot be mapped using the Land Monitor methodology. Note that the EM-38 criteria are different from the standard training data for the project, which are based on visible effects of salinity on landcover or productivity. Therefore, the data for this zone has not been further processed. It should be noted; however, that despite the failure of the Land Monitor methodology in this zone, salinity does affect large areas. Note: Agriculture WA research officer Dennis Van Gool has suggested that the Natural Resource Assessment Group soil landscape mapping at 1:50 000 scale can be used to identify areas of low productivity based on land quality values. It is recommended that this information be used as a guide only, as the effects of salinity in the coastal plain and irrigated areas may be seasonal and mitigated by rainfall and irrigation patterns (this may explain why the effects of salinity cannot be seen in the Landsat TM imagery).
Figure 6 1999 Landsat TM image data to Coastal zone aerial photograph no. 1
4.1.2 South West Zone The south west zone receives high rainfall and is known to have minimal dryland salinity. For this reason, the data for this zone have not been processed.

9
4.1.3 Forest Zone There is known to be very little dryland salinity in the forest areas comprising the forest zone. The data for this zone have not been processed.
4.1.4 Eastern Zone Ground data for the eastern zone was provided in the form of:
− Land Monitor salinity monitoring information from the Dumbleyung scene available in the scene overlap area, including data from the Date Creek and Lower Balgarup catchments
− Salinity map for the East Collie catchment provided by Shawan Dogramaci, Water and Rivers Commission
The East Collie data were retained for validation purposes, and 48 saline training areas were selected using the Land Monitor salinity maps for the Dumbleyung overlap area (see Figure 3 for map). First-pass maps were sent to the WRC and AgWest for on-ground assessment. The ground-truthing of the first pass salinity maps produced the following conclusion:
- Salt-affected areas were significantly under-estimated in the Eastern Collie catchment and Darkan region. Bare salt-affected areas were mapped, but marginally-affected areas with ground covers consisting of grasses and poorly performing pastures were not being adequately mapped.
- The majority of salt-affected areas missed were located in lower valley areas, but
these were inadequately represented by the landform map.
4.1.5 Southern Zone Ground data for the southern zone consisted of aerial photograph interpretations (5) from the Wilgarup subcatchment, north of Manjimup. Five training areas were marked on these photos, of which all were waterlogged and four are known to have saline watertables. Three of the areas are shown in figures 7 and 8 overleaf. In these figures, the waterlogged site to the west cannot be visually discriminated from the non-waterlogged sites in the streamline to which it flows. The two waterlogged sites in the east look to be no different to the nearby remnant vegetation and pastures. The central site is the only ground site from the Wilgarup catchment that can be clearly seen in the image data. However, in the 1988 image, it looks very similar to other non-saline sites that can be seen in the area covered by the aerial photographs (shown in Figure 9) and in the 1999 image, the recovery work is beginning to disguise its location. For these reasons, image classifications for this area have not been performed for the southern zone. It should be noted that the Lake Muir region in the Upper Tone catchment, located in the eastern part of the zone, has been processed separately as a part of the Mt Barker Landsat TM scene. The overlap region covers approximately half (the eastern half) of the zone.

10
Figure 7 Ground data sites in the Wilgarup catchment overlaid
on the 1988 Landsat TM data
Figure 8 Ground data sites in the Wilgarup catchment overlaid
on the 1999 Landsat TM data

11
Figure 9: Wilgarup subcatcment - 1988 Landsat TM image
3.2 The Final Salinity Maps The final-pass processing performed for the eastern zone was:
- To redo the Landsat TM classifications, training specifically on marginally salt-affected areas in the Eastern Collie and Darkan regions.
- To recreate the landform map to include a larger proportion of valleys and their
foothills.
- To apply neighbour smoothing during the CPN run to correct isolated pixels and to mask out cultural features.
- To use the bush mask and road and dam vectors to mask the remaining cultural
features.
- To use the landform map to remove commission areas on hilltops.
4 Accuracy Assessment The statistical accuracy assessment for the Eastern zone was performed using reserved ground truth data from the East Collie catchment.

12
Table 1: Accuracy assessment of the salinity maps in East Collie catchment
Land cover type % accurately
detected
bare salt 99%
marginal salt including barley grass and salt / waterlogged areas
70%
remnant vegetation 99%
non-saline agricultural land 100% The biggest sources of omission errors (salt-affected land not detected) are:
- Areas with a cover of salt-tolerant grasses. The biggest source of commission errors are:
- Sparse remnant vegetation. 5 Area of Salt-affected Land The following table shows the area of salt-affected land for the local government authorities completely within the in the Eastern zone of the Collie and Pemberton Landsat TM scenes. Such summaries can be calculated for any sub-region of interest within the scene.
Table 2: Areas of salt-affected land
Shire Total Area (ha)
Salt-affected 1988 ha
Salt-affected 1998 ha
West Arthur 282 885 5 824 9 423
Williams 230 446 1 303 1 944 6 Limitations and Liabilities The information contained in these salinity maps is necessarily based in part upon various assumptions and predictions. The Land Monitor Project (comprising the Western Australian State Government agencies, Agriculture Western Australia, Department of Conservation and Land Management, Department of Environmental Protection, Department of Land Administration, Main Roads Western Australia, and The Water and Rivers Commission and the Commonwealth agency CSIRO Mathematical and Information Sciences) accepts no responsibility for any inaccuracies in these salinity maps and persons relying on these maps do so at their own risk. Areas mapped as salt-affected are areas of persistent low productivity which may include salt-affected land, dam embankments, fire breaks and roads. Areas mapped as salt-affected represent areas greater than about one hectare. Salt-affected areas smaller than this cannot be mapped reliably. The precise definition of salt-affected is dependent in part on the qualitative assessment of the ground-

13
truthing personnel and in part on the limitations of the productivity changes that can be reliably measured by the Landsat TM instrument. 7 References Caccetta, P., Campbell, N.A., West, G., Kiverii, H. K. and Gahegan, M. (1995). Aspects of reasoning with uncertainty in an agricultural GIS environment. The New Review of Applied Expert Systems, 1, 161-178. Campbell, N. A. and Atchley, W. R. (1981). The geometry of canonical variate analysis. Syst. Zool., 30, 268-280. Campbell, N. A. and Wallace, J. F., (1989). Statistical methods for cover class mapping using remotely sensed data. Proc. Int. Geosci. Remote Sensing Symp: 493-496. Furby, S. L., Palmer, M. J. and Campbell, N. A. (1996). Image calibration to like values. Proceedings of 8
th Australasian Remote Sensing Conference, Canberra, Australia.
Furby, S. L., Wallace, J. F., Caccetta, P. and Wheaton, G. A. (1995). Detecting and monitoring salt-affected land. Report to LWRRDC project ‘Detecting and Monitoring Changes in Land Condition Through Time Using Remotely Sensed Data’.