Scott Denning, Arlyn Andrews, Martha Butler, Kathy Corbin ... · Nick Parazoo, Marek Uliasz, and...
42
Scott Denning, Arlyn Andrews, Martha Butler, Kathy Corbin, Kenneth J. Davis, Timothy Hilton, Andy Jacobson, Anna Michalak, Sharon Gourdji, Natasha Miles, Scott Richardson, Andrew Schuh, Ravi Lokupitiya, Steven Wofsy, Erandi Lokupitiya, Nick Parazoo, Marek Uliasz, and Dusanka Zupanski
Transcript of Scott Denning, Arlyn Andrews, Martha Butler, Kathy Corbin ... · Nick Parazoo, Marek Uliasz, and...
Scott Denning, Arlyn Andrews, Martha Butler, Kathy Corbin, Kenneth J. Davis, Timothy Hilton, Andy Jacobson,
Anna Michalak, Sharon Gourdji, Natasha Miles, Scott Richardson, Andrew Schuh, Ravi Lokupitiya,
Steven Wofsy, Erandi Lokupitiya, Nick Parazoo, Marek Uliasz, and Dusanka Zupanski
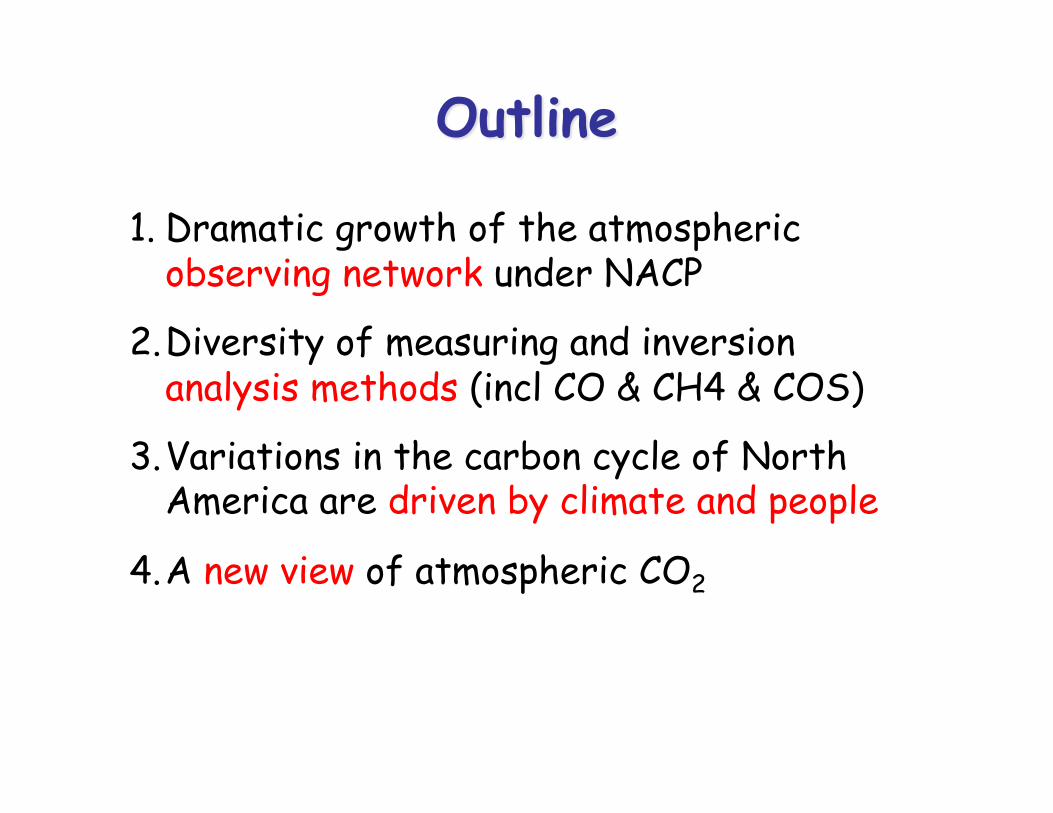
1. Dramatic growth of the atmospheric observing network under NACP
2. Diversity of measuring and inversion analysis methods (incl CO & CH4 & COS)
3. Variations in the carbon cycle of North America are driven by climate and people
4. A new view of atmospheric CO2
1. Dramatic growth of the atmospheric observing network under NACP
2. Diversity of measuring and inversion analysis methods (incl CO & CH4 & COS)
3. Variations in the carbon cycle of North America are driven by climate and people
4. A new view of atmospheric CO2
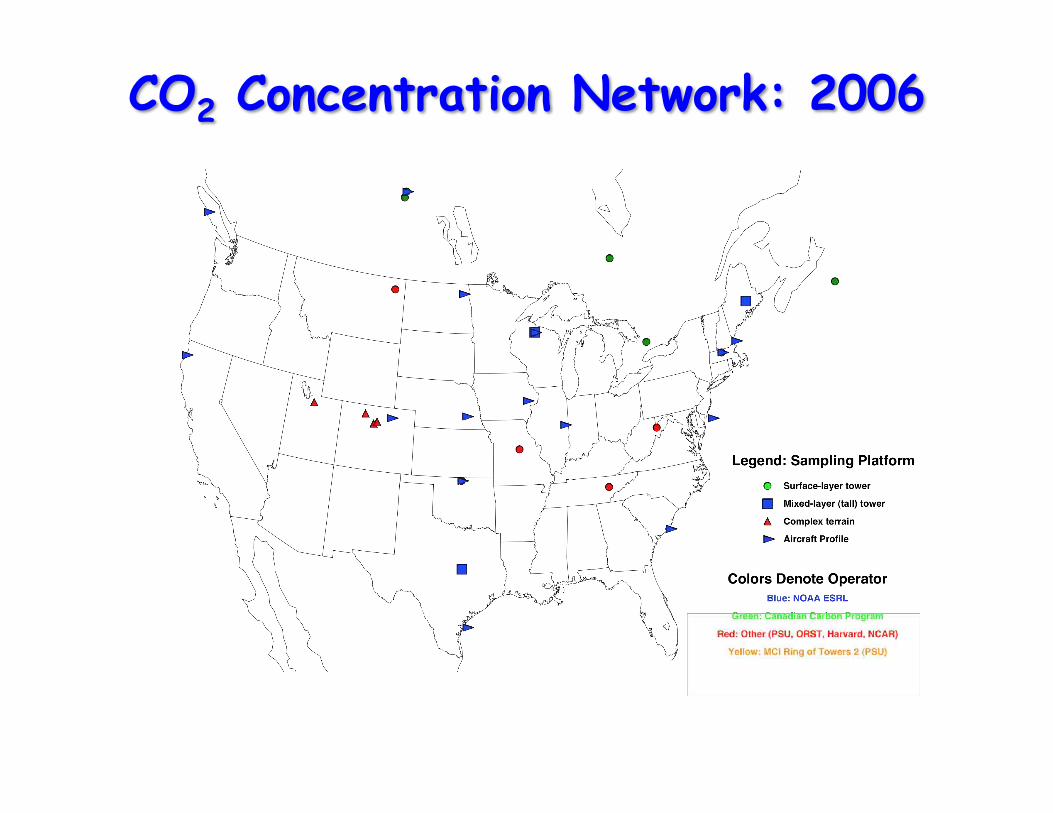
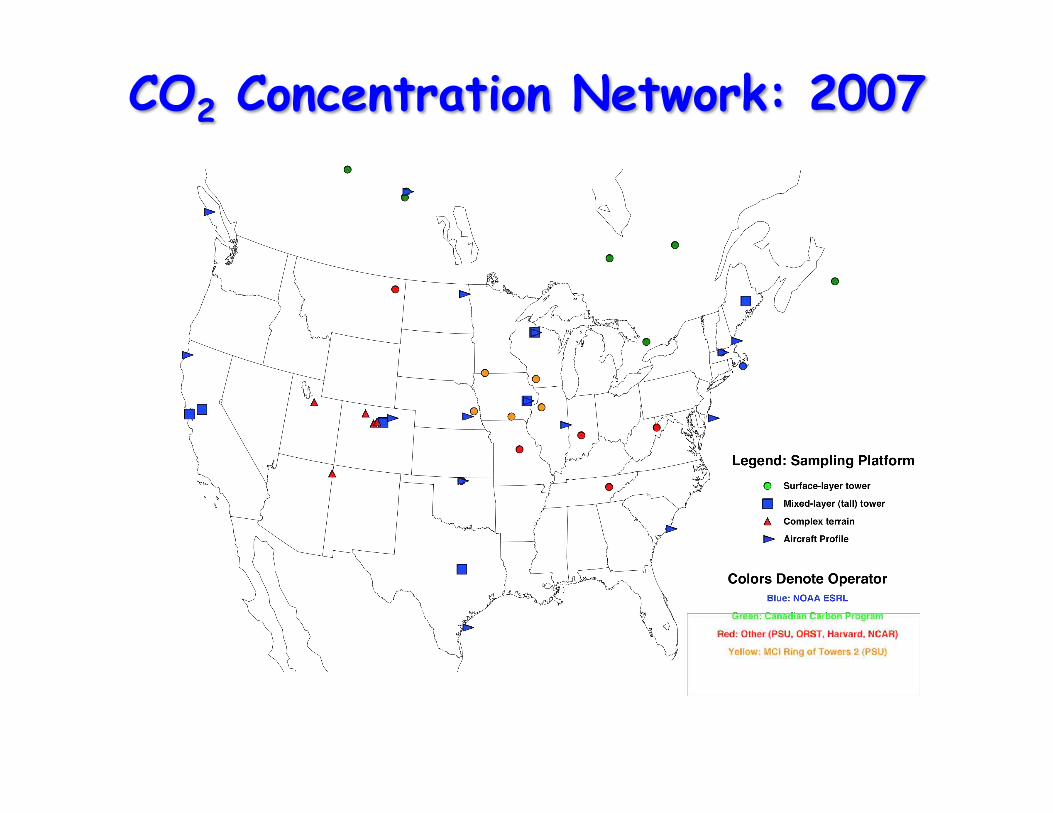
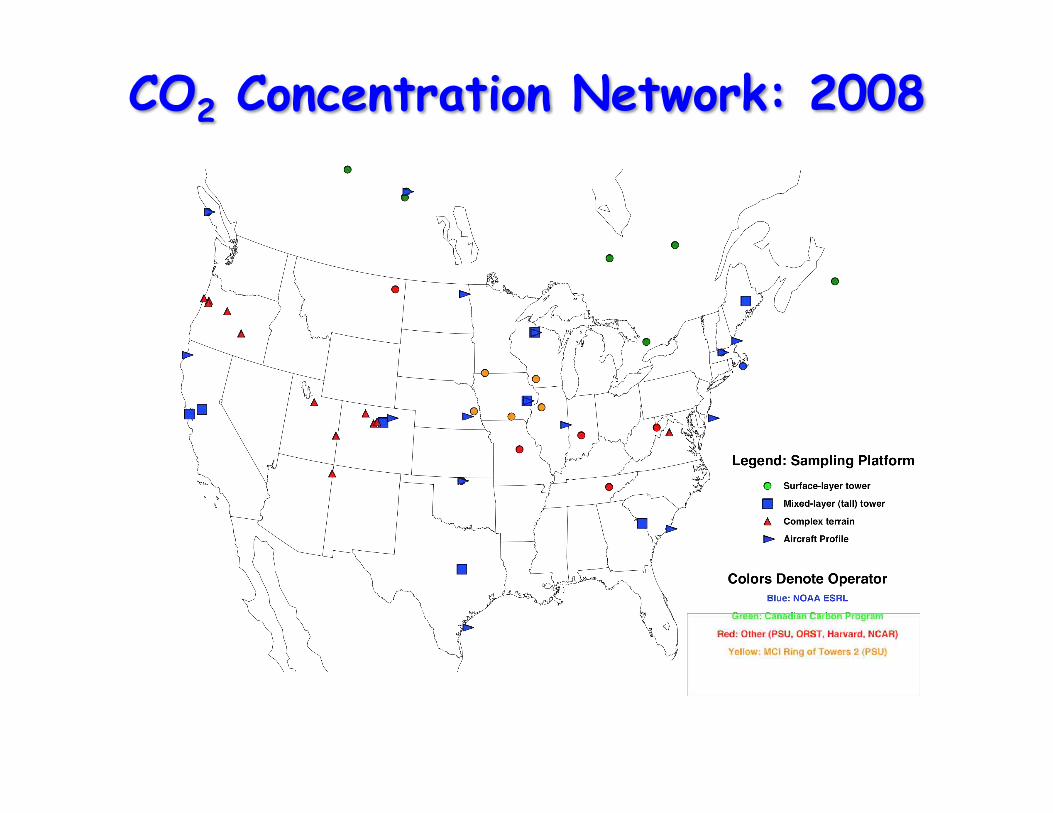

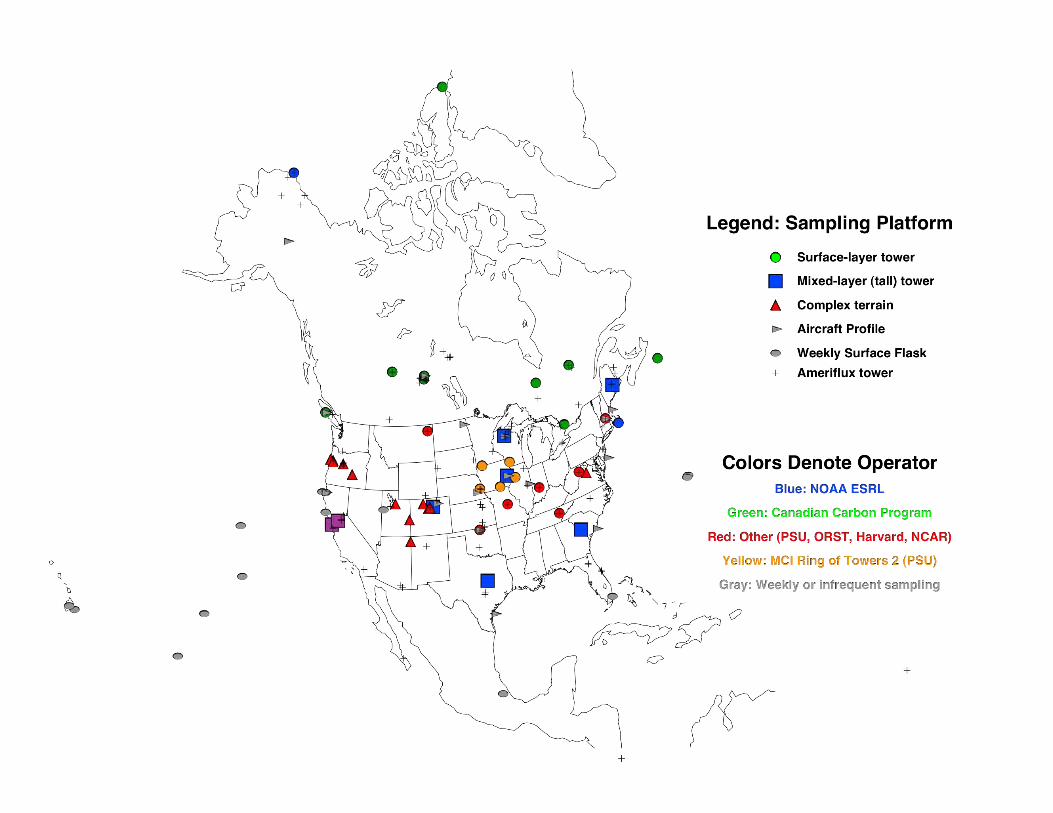
1. Dramatic growth of the atmospheric observing network under NACP
2. Diversity of measuring and inversion analysis methods (incl CO & CH4 & COS)
3. Variations in the carbon cycle of North America are driven by climate and people
4. A new view of atmospheric CO2
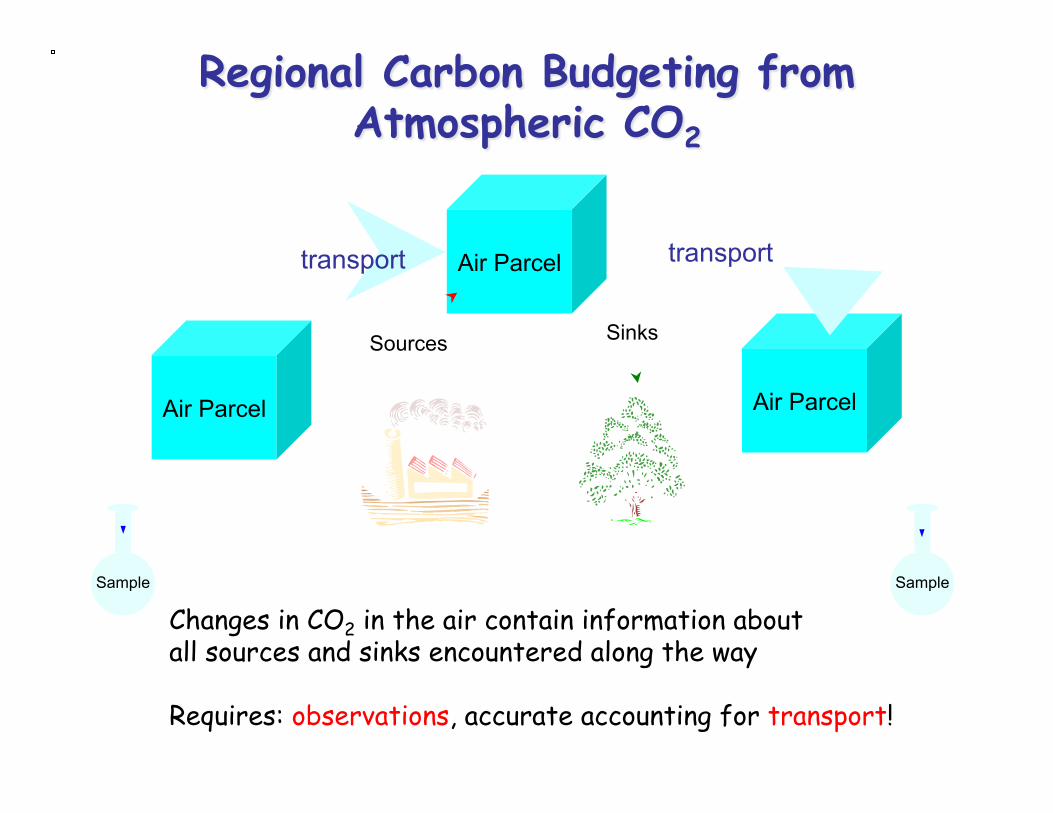
Air Parcel Air Parcel
Air Parcel
Sources Sinks
transport transport
Sample Sample
Changes in CO2 in the air contain information about all sources and sinks encountered along the way
Requires: observations, accurate accounting for transport!
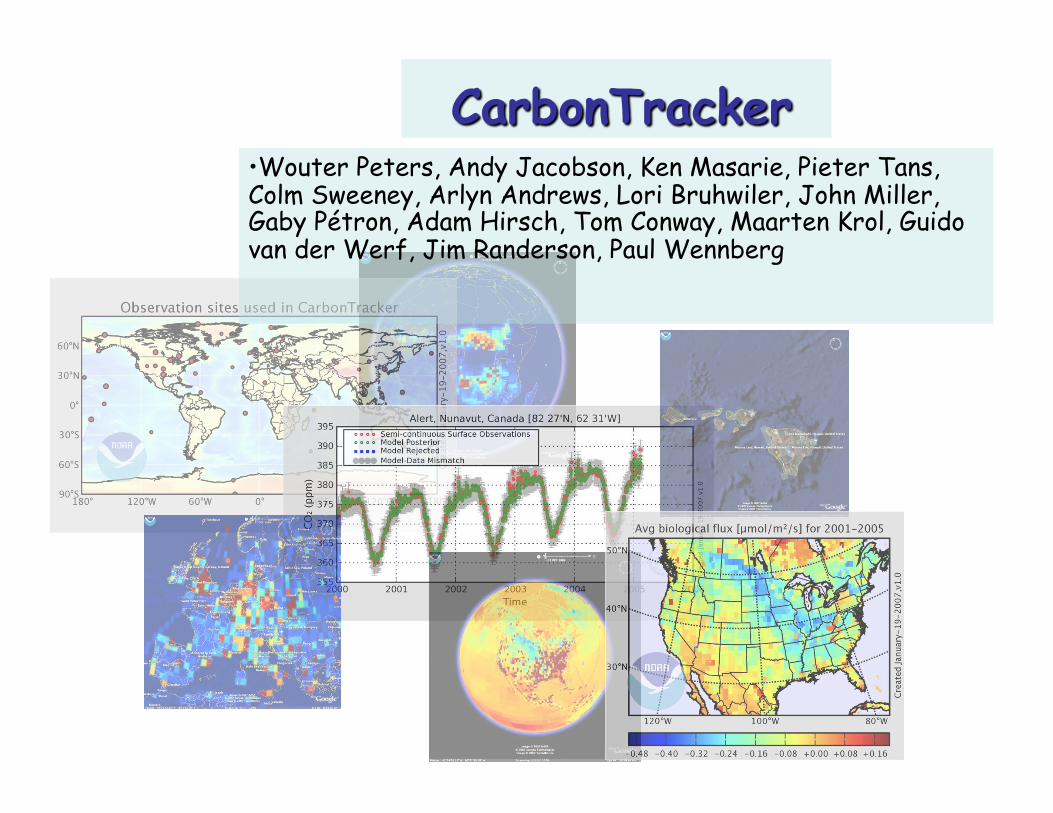
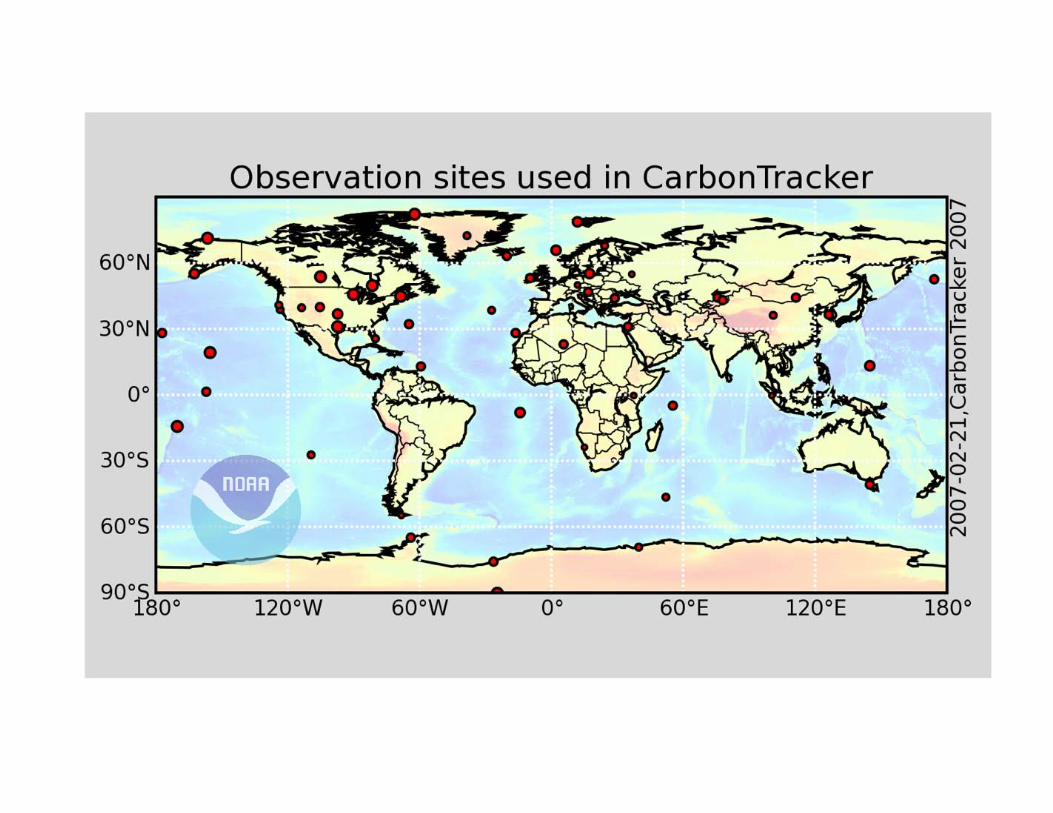
• Wouter Peters, Andy Jacobson, Ken Masarie, Pieter Tans, Colm Sweeney, Arlyn Andrews, Lori Bruhwiler, John Miller, Gaby Pétron, Adam Hirsch, Tom Conway, Maarten Krol, Guido van der Werf, Jim Randerson, Paul Wennberg
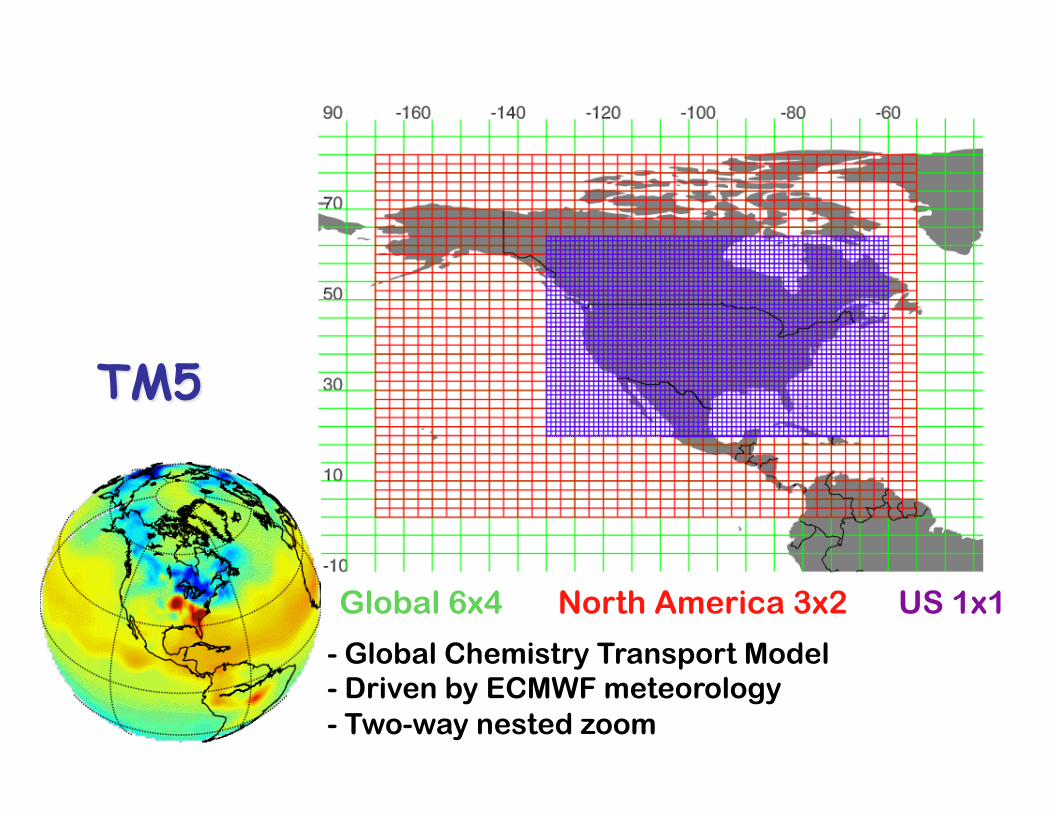
Global 6x4 North America 3x2 US 1x1
- Global Chemistry Transport Model - Driven by ECMWF meteorology - Two-way nested zoom
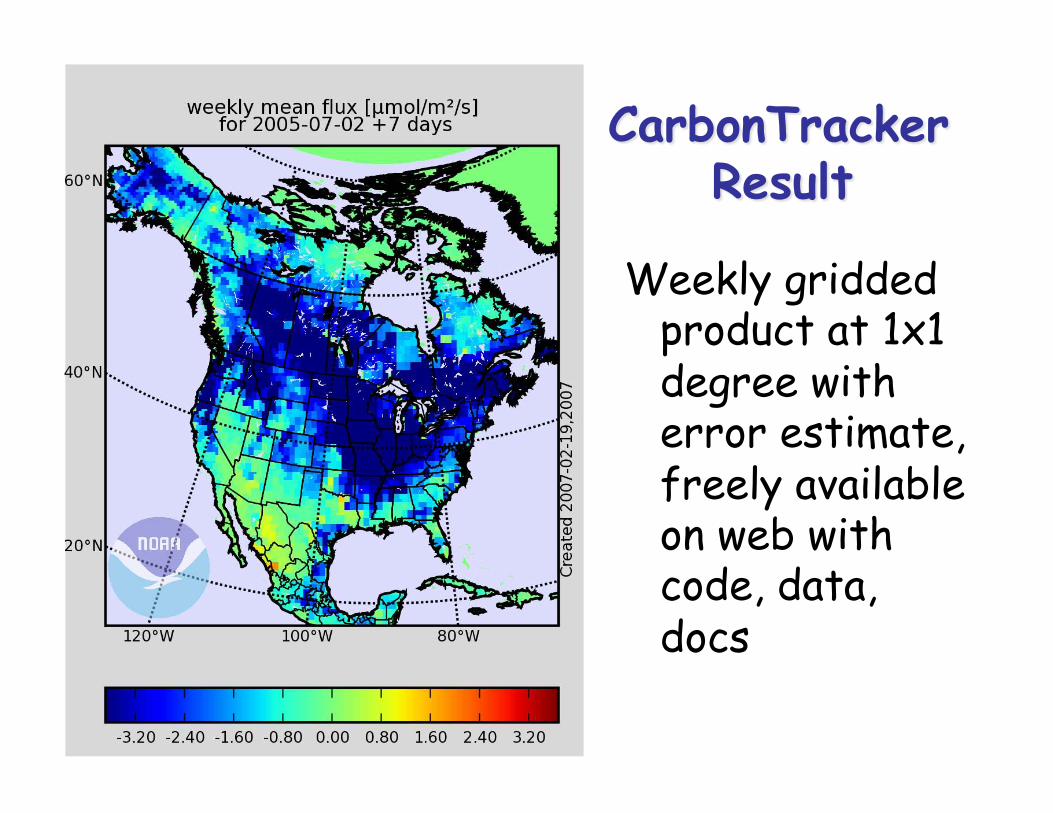
Weekly gridded product at 1x1 degree with error estimate, freely available on web with code, data, docs
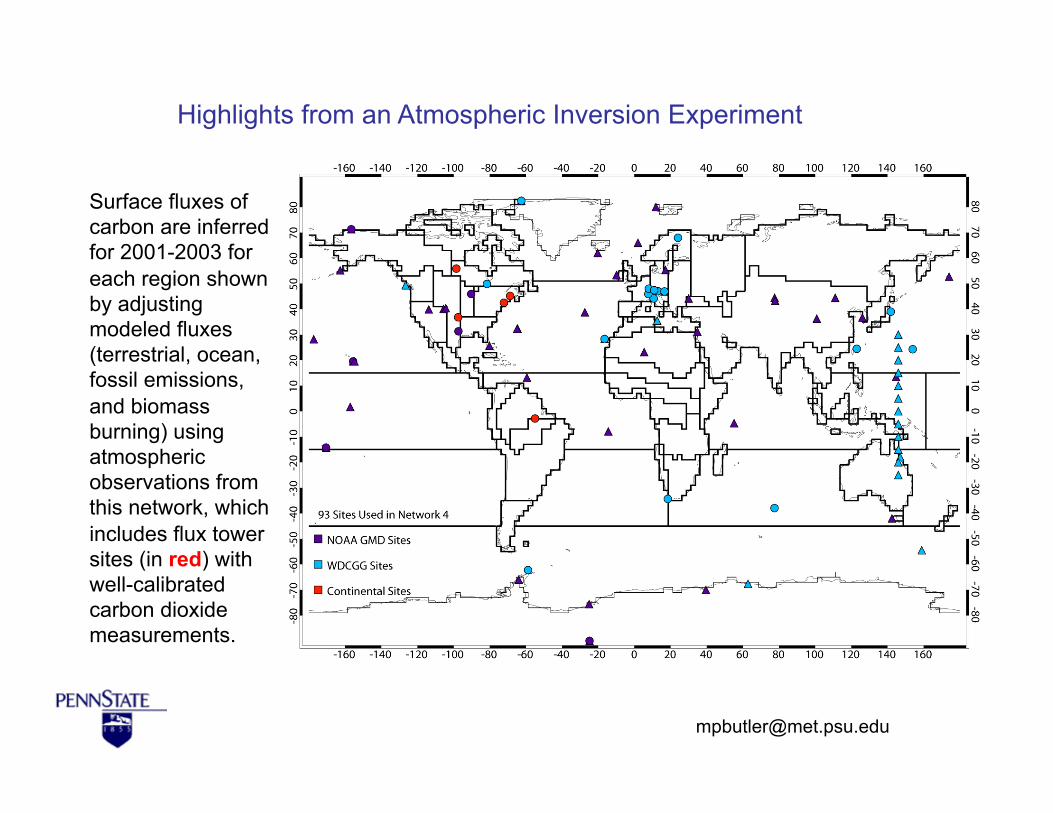
Highlights from an Atmospheric Inversion Experiment
Surface fluxes of carbon are inferred for 2001-2003 for each region shown by adjusting modeled fluxes (terrestrial, ocean, fossil emissions, and biomass burning) using atmospheric observations from this network, which includes flux tower sites (in red) with well-calibrated carbon dioxide measurements.

Sensitivity to Choice of Terrestrial Flux Model
For this well-constrained region, the inferred fluxes are not significantly different when using terrestrial flux models which vary in:
- Time resolution (hourly with interannual variability vs. monthly mean climatology)
- Amplitude of seasonal cycle
- Timing of seasonal
cycle
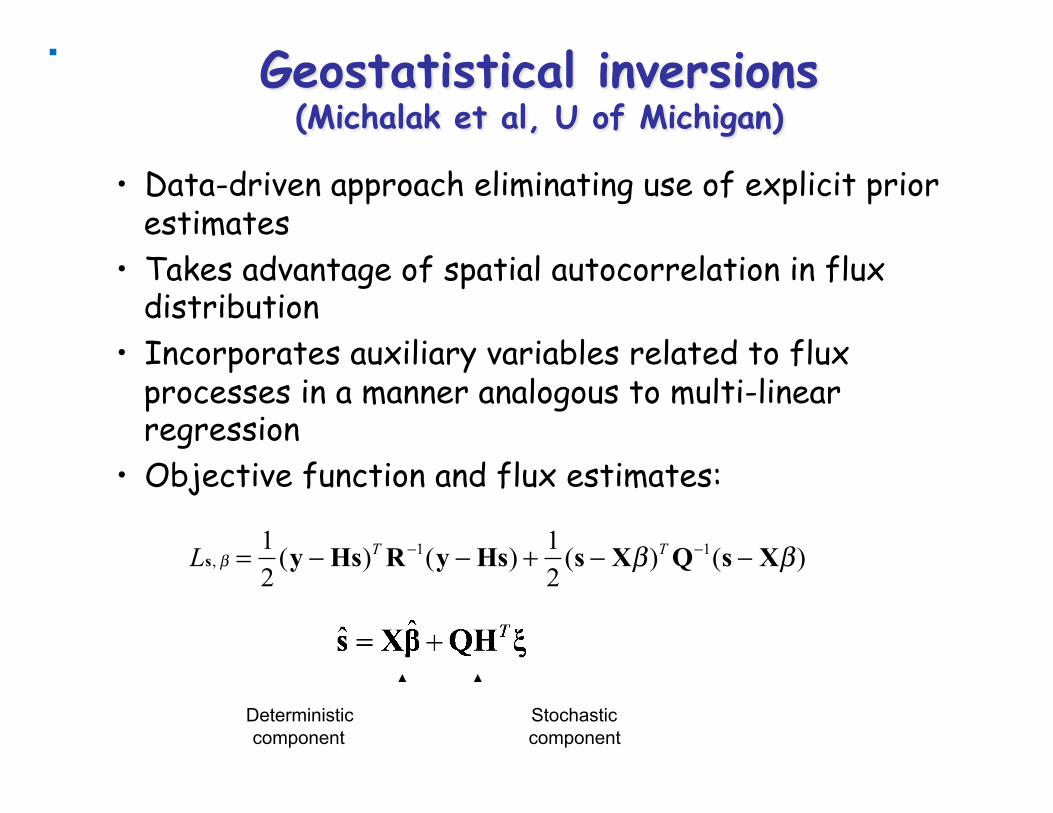
• Data-driven approach eliminating use of explicit prior estimates
• Takes advantage of spatial autocorrelation in flux distribution
• Incorporates auxiliary variables related to flux processes in a manner analogous to multi-linear regression
• Objective function and flux estimates:
Ls, β = 1
2(y − Hs)T R−1(y − Hs) + 1
2(s − Xβ)T Q−1(s − Xβ)
Deterministic component
Stochastic component
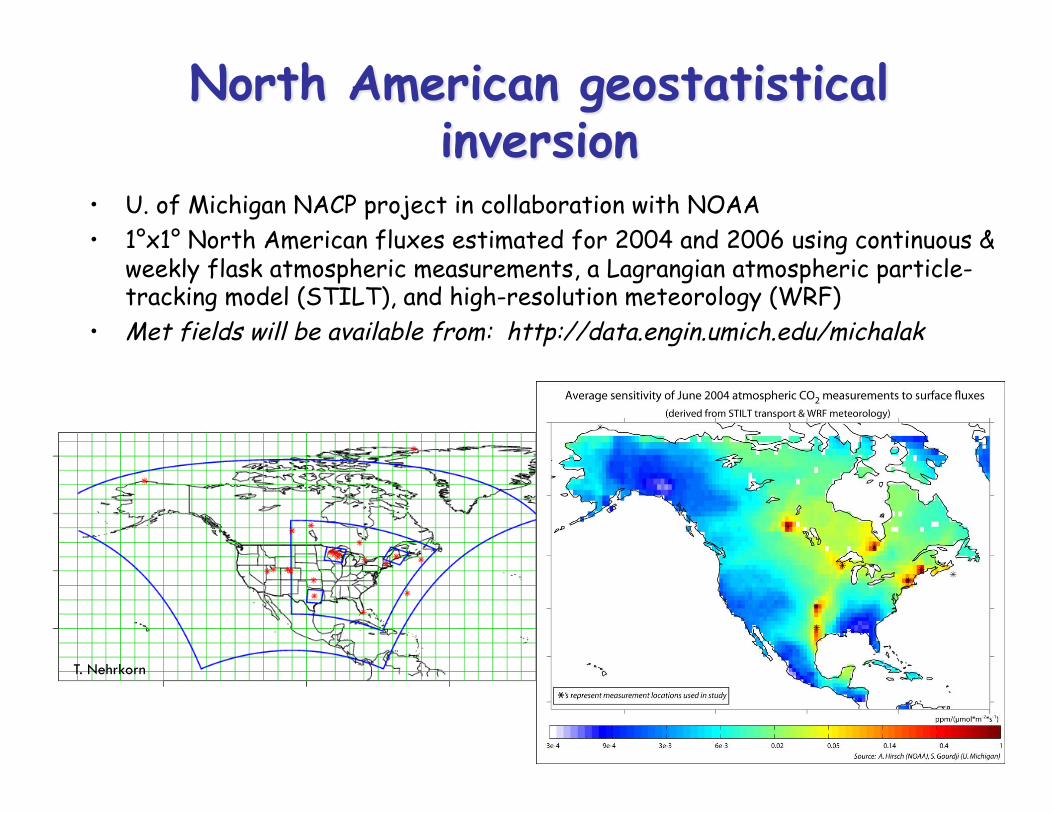
• U. of Michigan NACP project in collaboration with NOAA • 1°x1° North American fluxes estimated for 2004 and 2006 using continuous &
weekly flask atmospheric measurements, a Lagrangian atmospheric particle-tracking model (STILT), and high-resolution meteorology (WRF)
• Met fields will be available from: http://data.engin.umich.edu/michalak
T. Nehrkorn
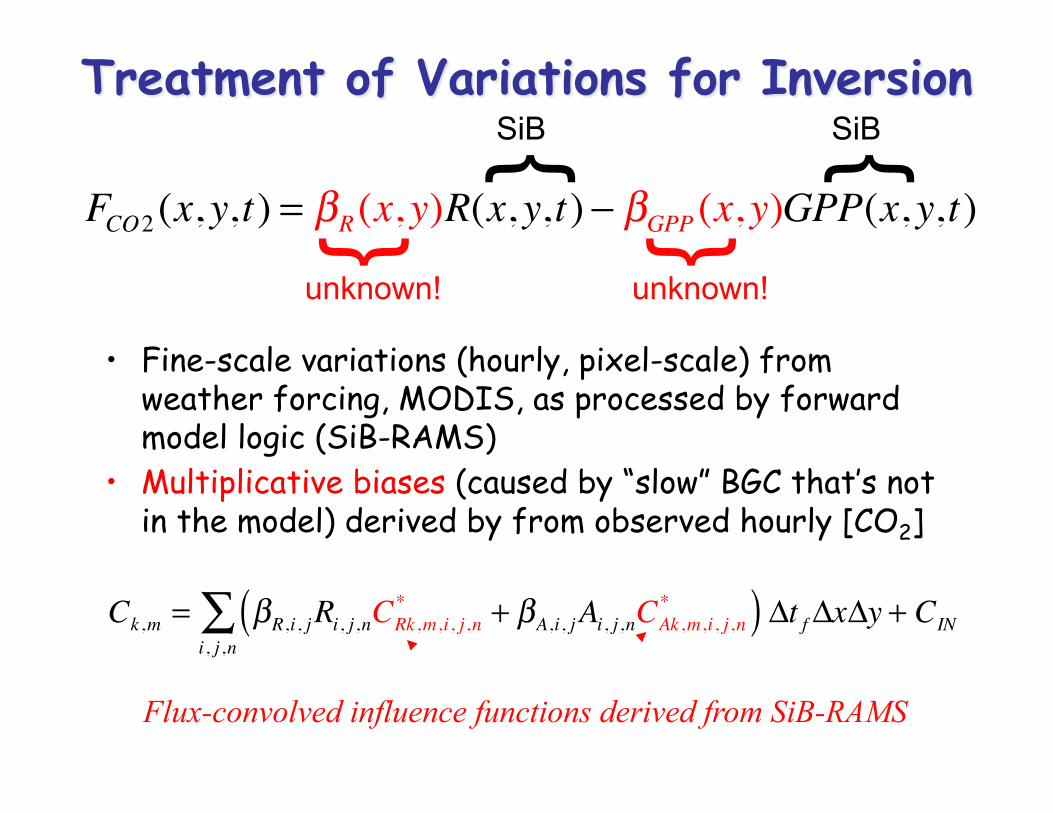
FCO2 (x, y,t) = R(x, y,t) −GPP(x, y,t)
• Fine-scale variations (hourly, pixel-scale) from weather forcing, MODIS, as processed by forward model logic (SiB-RAMS)
• Multiplicative biases (caused by “slow” BGC that’s not in the model) derived by from observed hourly [CO2]
FCO2 (x, y,t) = βR (x, y)R(x, y,t) − βGPP (x, y)GPP(x, y,t)
SiB } SiB }
unknown!
}
unknown!
}
Ck ,m = βR,i, jRi, j ,nCRk ,m,i, j ,n* + βA,i, jAi, j ,nCAk ,m,i, j ,n
*( )i, j ,n∑ Δt fΔxΔy + CIN
Flux-convolved influence functions derived from SiB-RAMS

20 days of “upstream” transport in 50 seconds
Black: air parcels in contact with surface Red: air parcels reach lateral boundaries
SiB-RAMS-LPDM
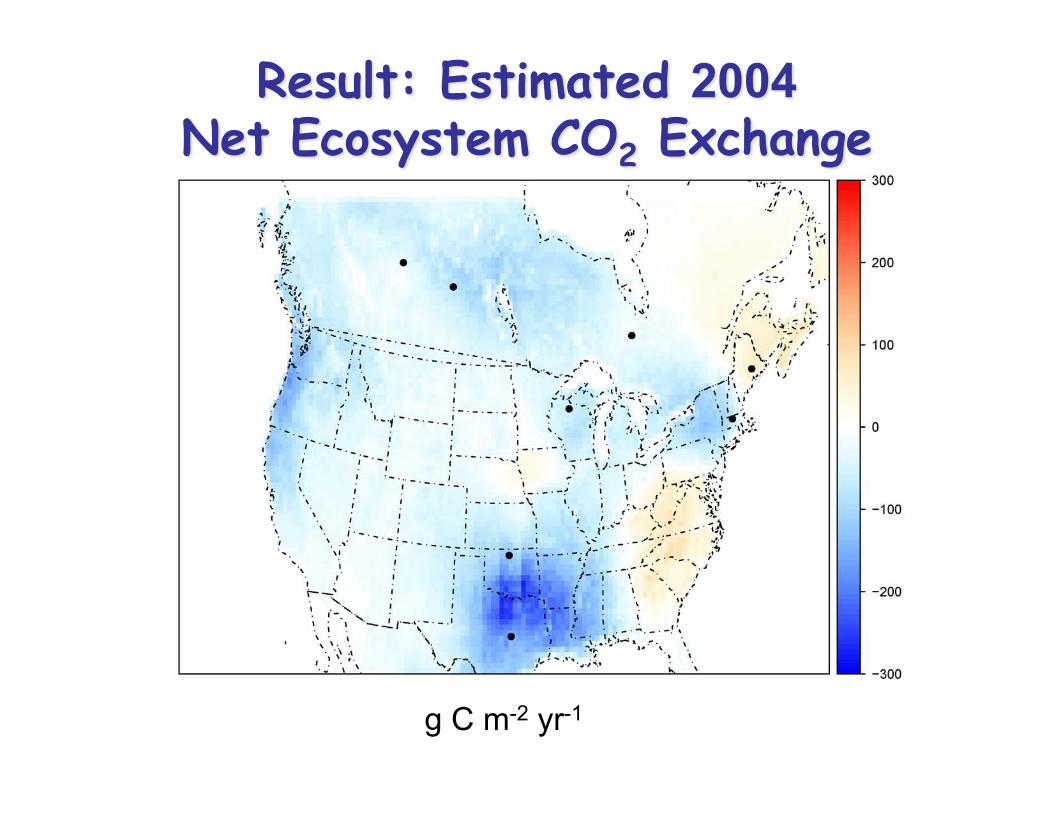
g C m-2 yr-1
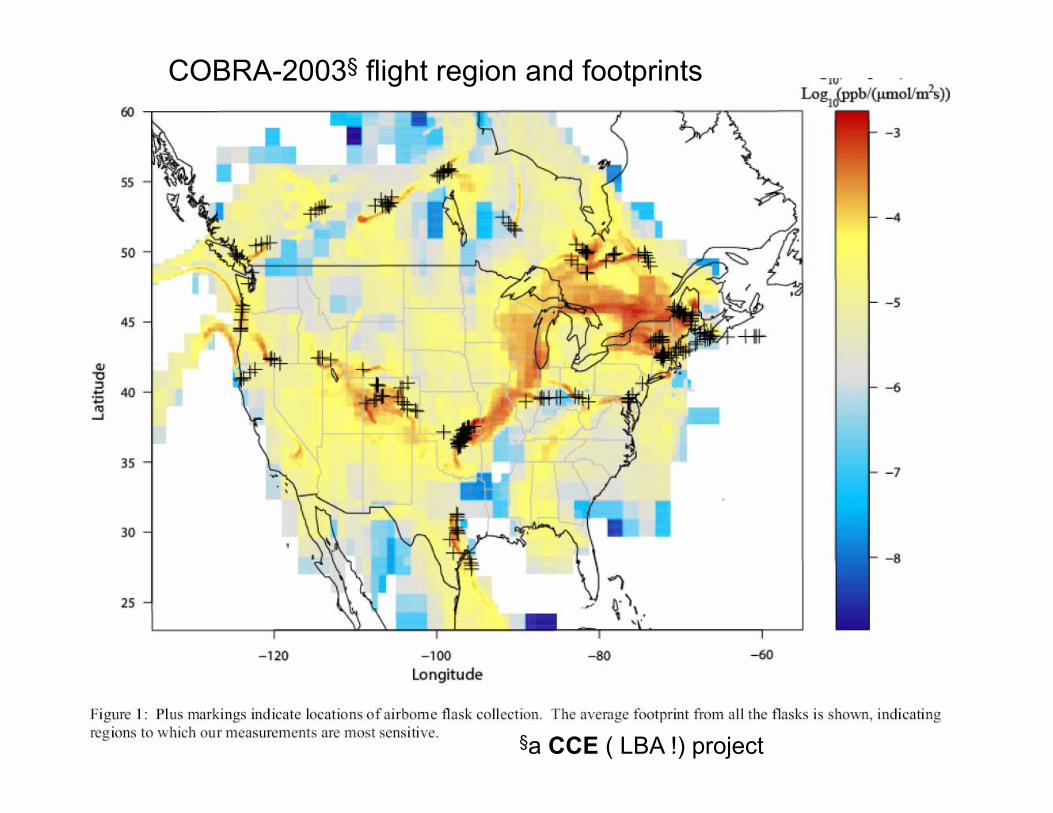
COBRA-2003§ flight region and footprints
§a CCE ( LBA !) project
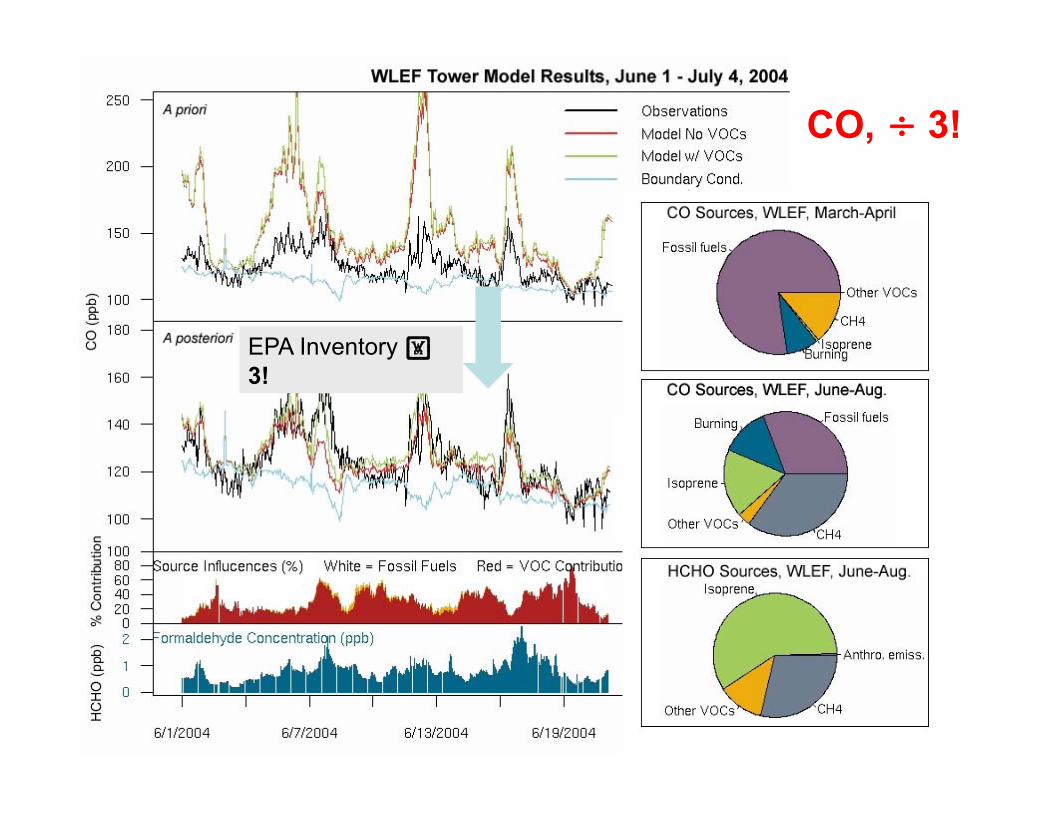
EPA Inventory 3!
CO, ÷ 3!

1. Dramatic growth of the atmospheric observing network under NACP
2. Diversity of measuring and inversion analysis methods (incl CO & CH4 & COS)
3. Variations in the carbon cycle of North America are driven by climate and people
4. A new view of atmospheric CO2
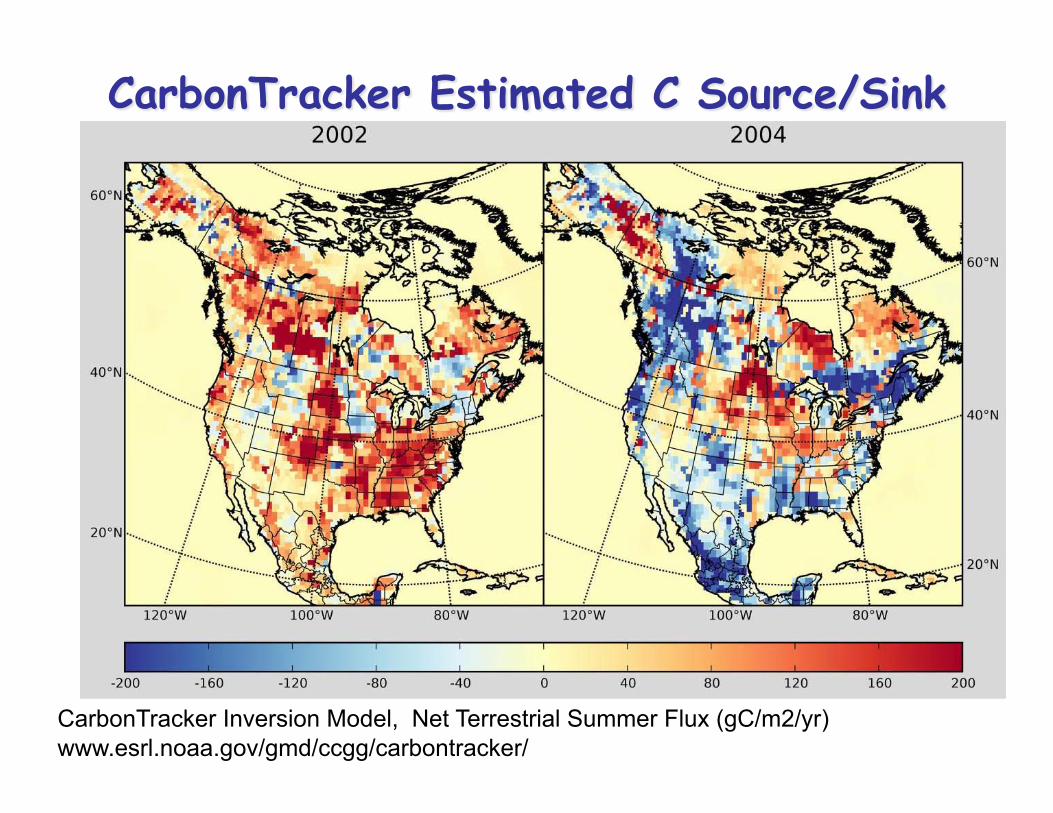
CarbonTracker Inversion Model, Net Terrestrial Summer Flux (gC/m2/yr) www.esrl.noaa.gov/gmd/ccgg/carbontracker/
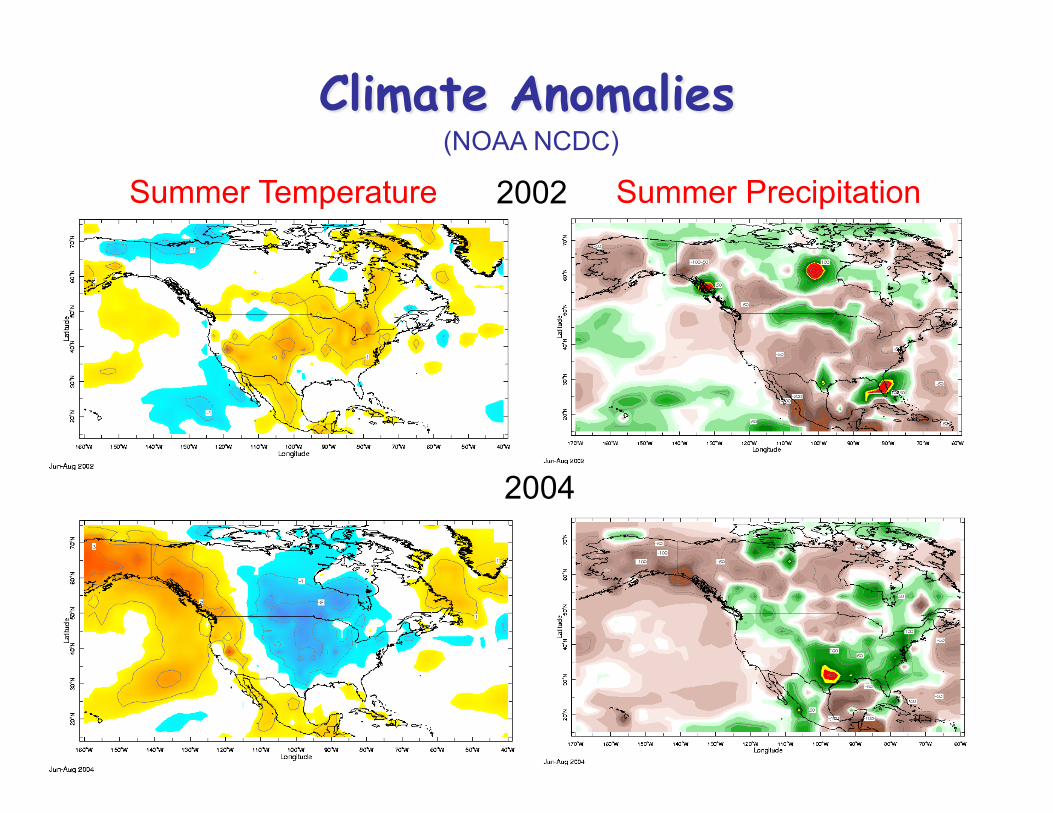
Summer Temperature 2002
2004
Summer Precipitation (NOAA NCDC)
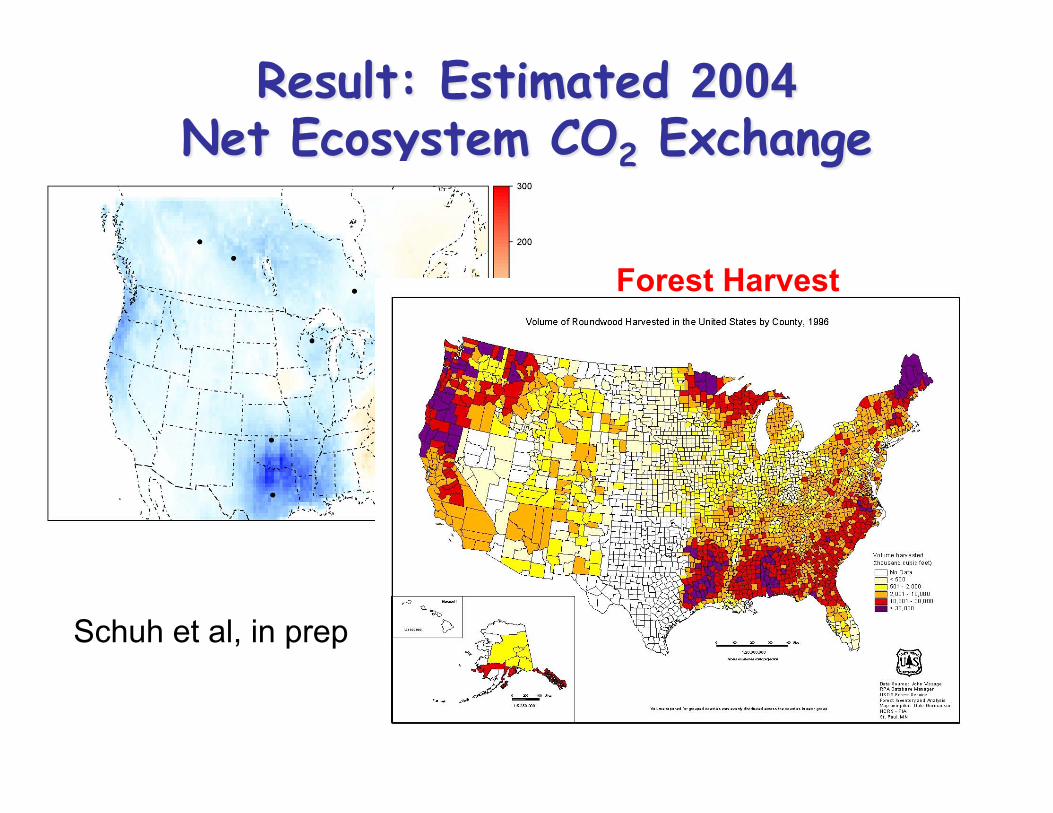
Forest Harvest
Schuh et al, in prep
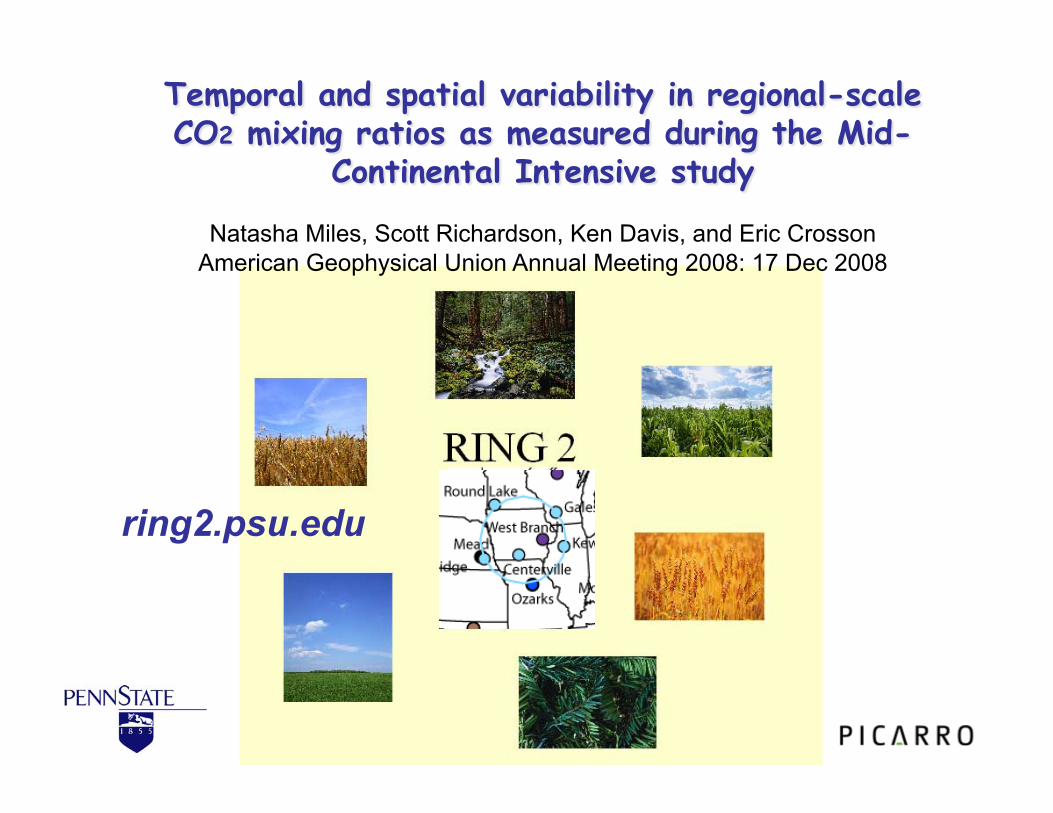
ring2.psu.edu
Natasha Miles, Scott Richardson, Ken Davis, and Eric Crosson American Geophysical Union Annual Meeting 2008: 17 Dec 2008
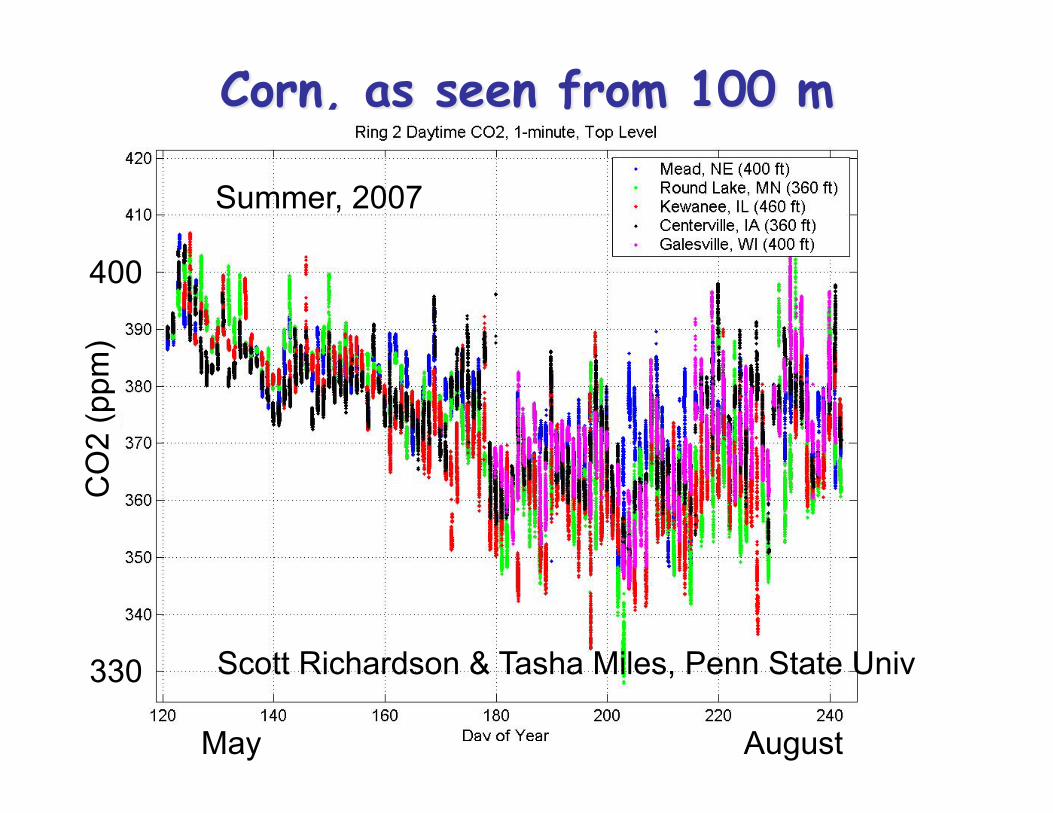
Scott Richardson & Tasha Miles, Penn State Univ
May August
400
330
CO
2 (p
pm)
Summer, 2007
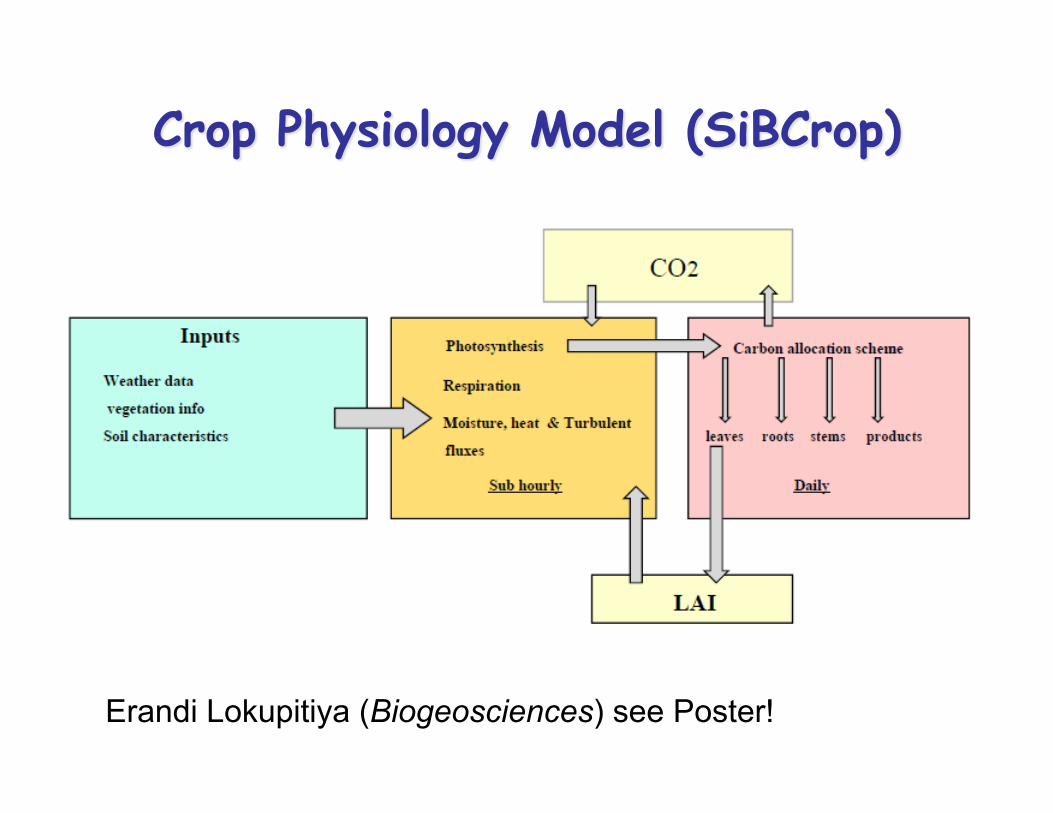
Erandi Lokupitiya (Biogeosciences) see Poster!
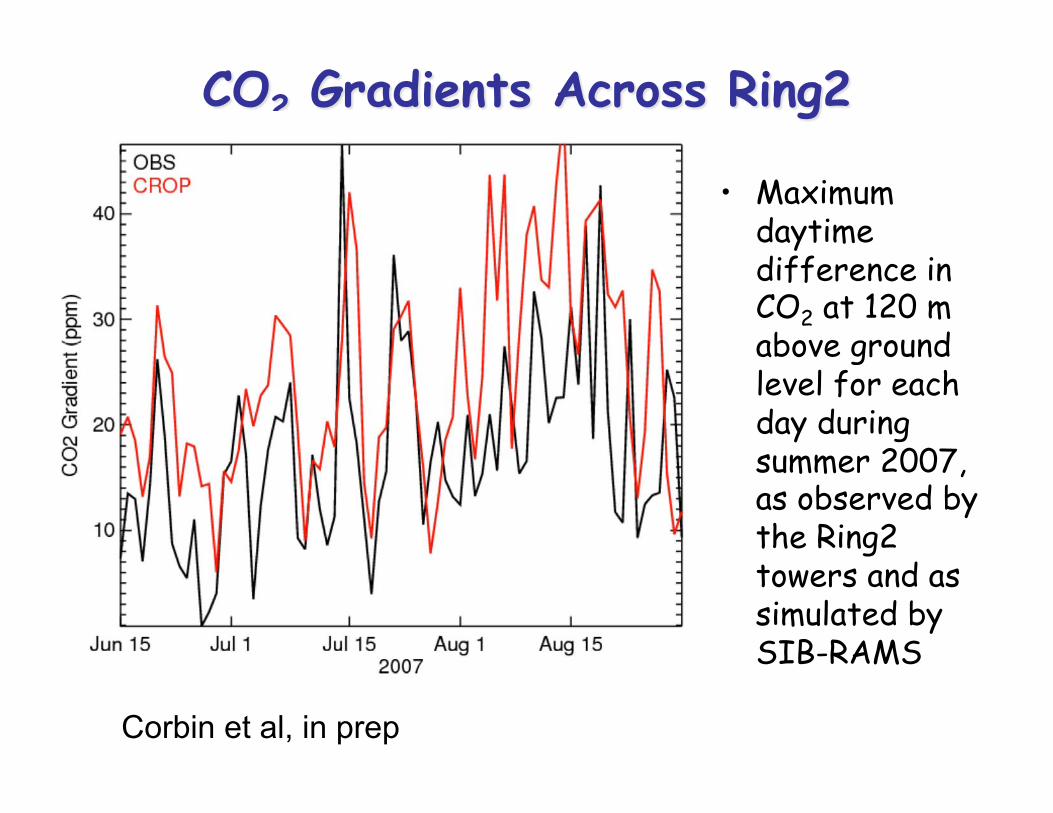
• Maximum daytime difference in CO2 at 120 m above ground level for each day during summer 2007, as observed by the Ring2 towers and as simulated by SIB-RAMS
Corbin et al, in prep
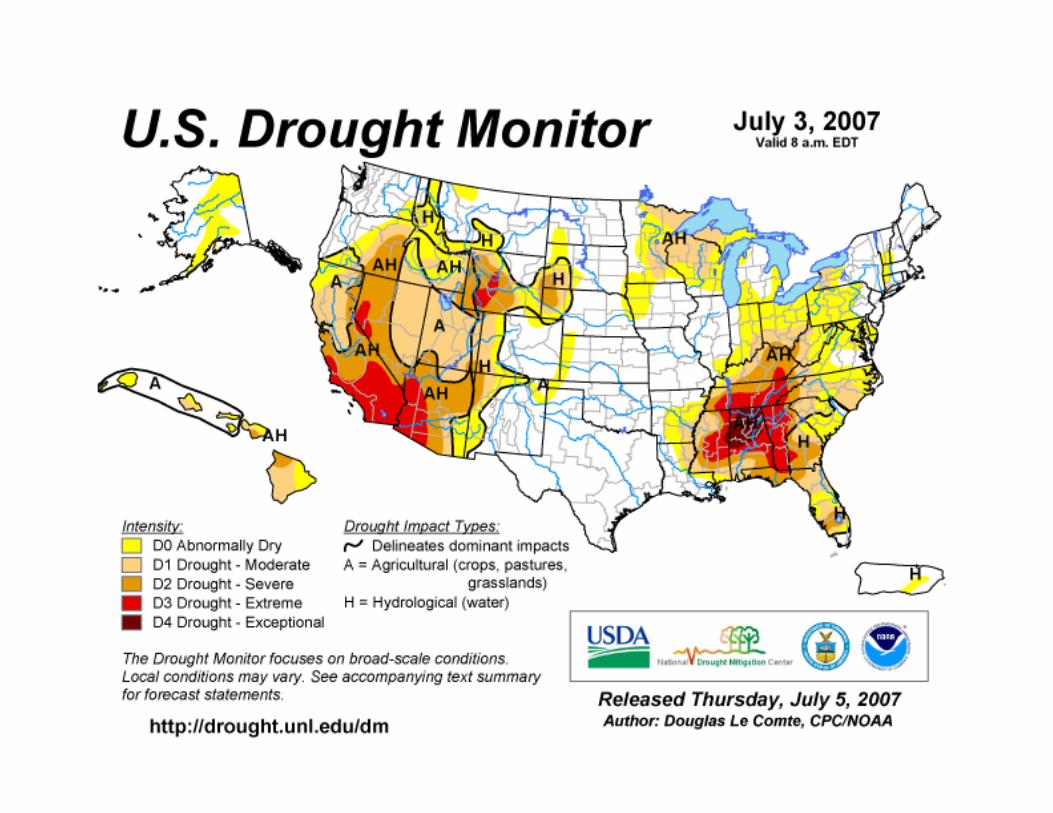
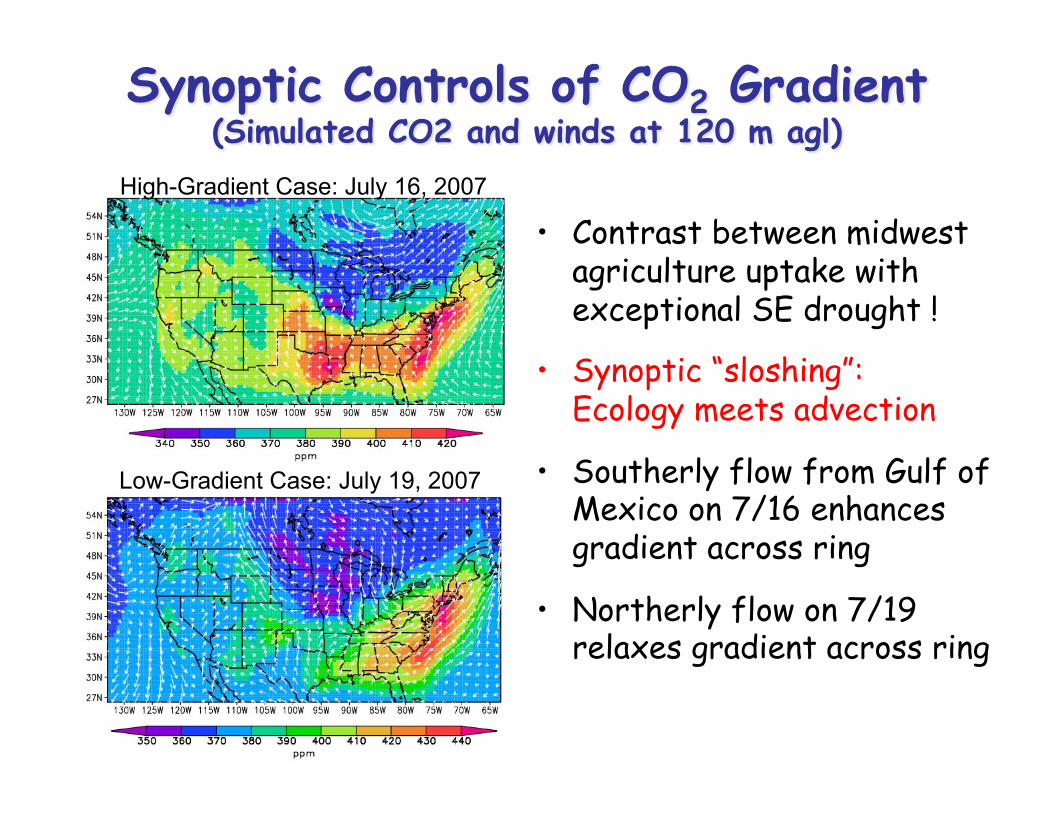
• Contrast between midwest agriculture uptake with exceptional SE drought !
• Synoptic “sloshing”: Ecology meets advection
• Southerly flow from Gulf of Mexico on 7/16 enhances gradient across ring
• Northerly flow on 7/19 relaxes gradient across ring
High-Gradient Case: July 16, 2007
Low-Gradient Case: July 19, 2007
1. Dramatic growth of the atmospheric observing network under NACP
2. Diversity of measuring and inversion analysis methods (incl CO & CH4 & COS)
3. Variations in the carbon cycle of North America are driven by climate and people
4. A new view of atmospheric CO2
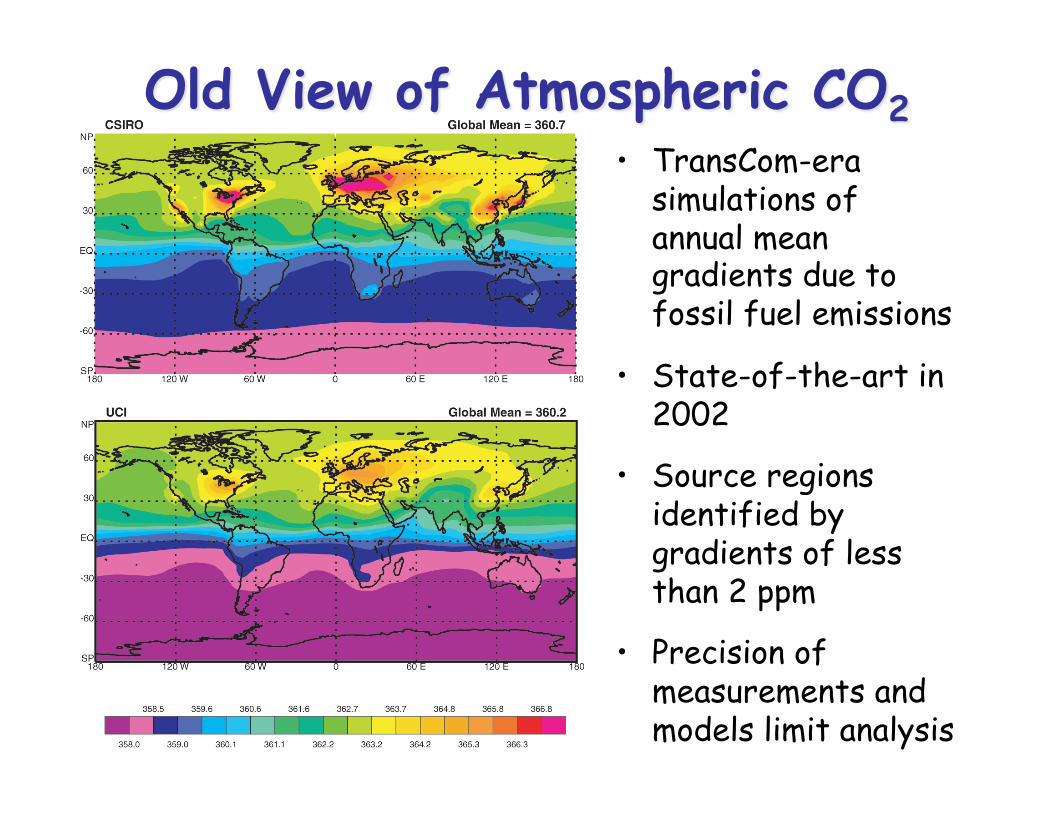
• TransCom-era simulations of annual mean gradients due to fossil fuel emissions
• State-of-the-art in 2002
• Source regions identified by gradients of less than 2 ppm
• Precision of measurements and models limit analysis


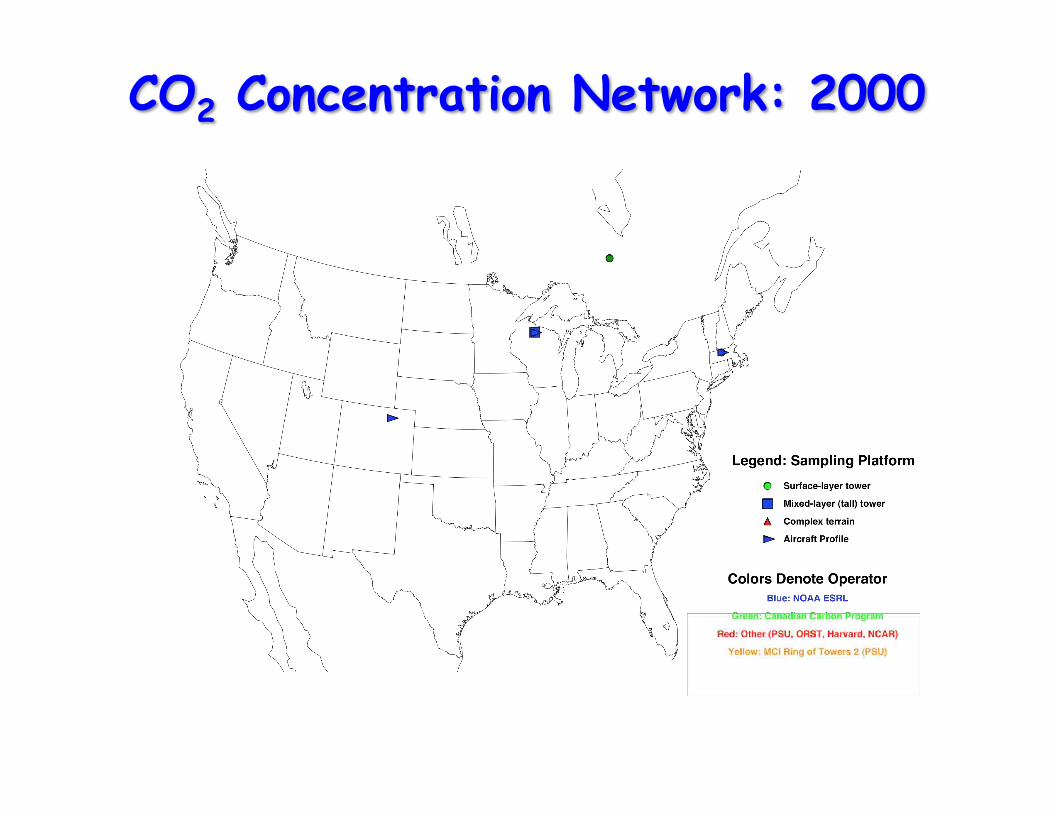
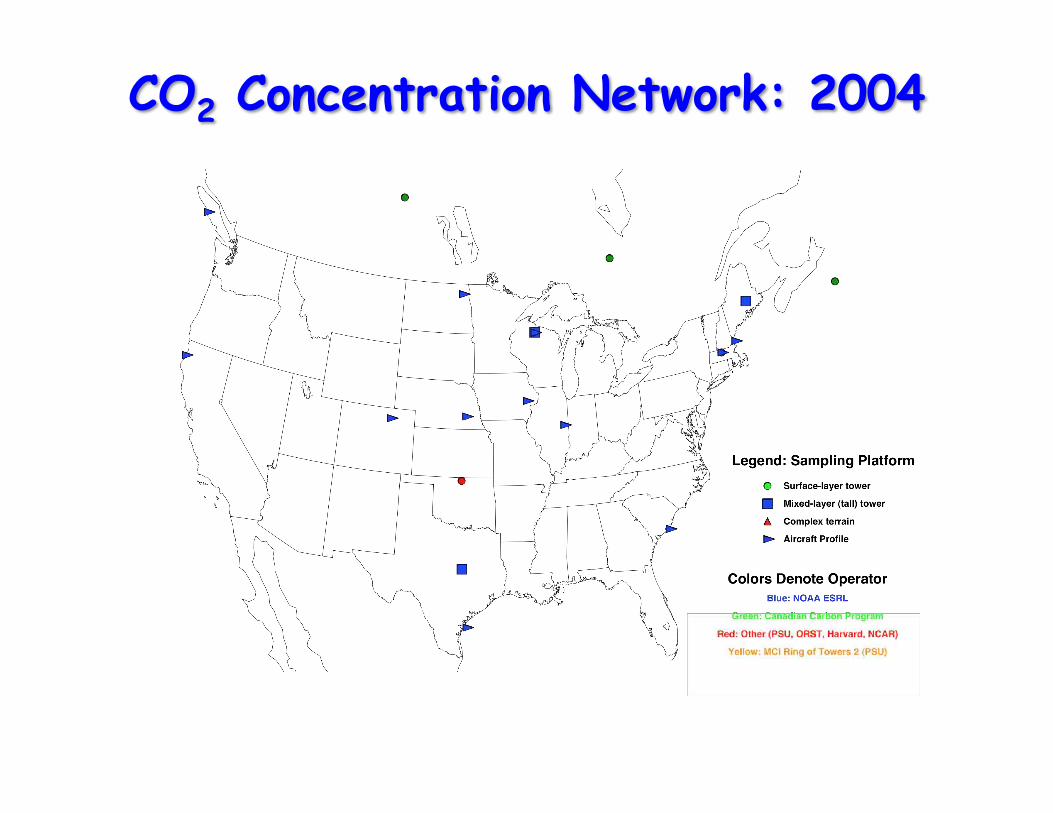
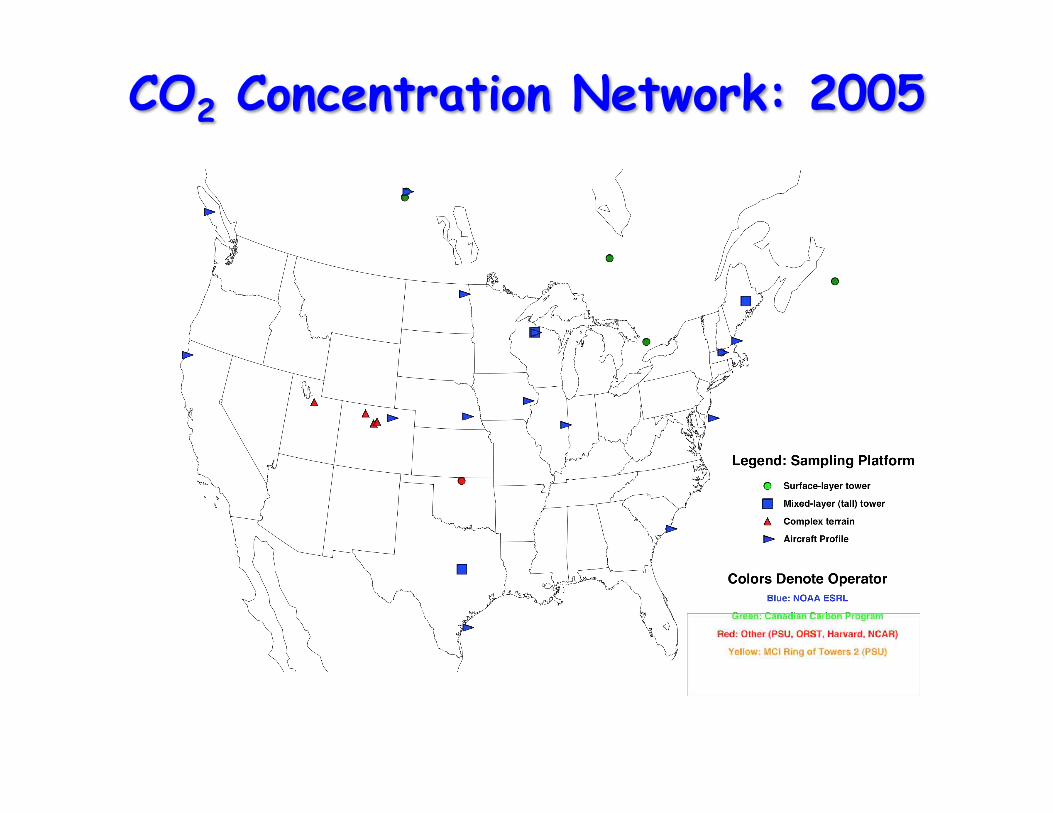
• The CO2 observing network has grown dramatically under NACP and gives us new eyes with which to see the carbon cycle
• A diverse suite of approaches to analysis has emerged to interpret the new data
• The NA Carbon Cycle is dynamic and variable in time and space, responding to variations in climate and management
• Our new eyes have provided the first “synoptic” view of CO2: there are huge gradients, waves, vortices and fronts
• Next week we’ll take a giant leap with OCO launch!