School Data Analysis Diagnostic Using MISchoolData and ASSIST Jennifer Parker-Moore, Ed.D. Lisa...
64
School Data Analysis Diagnostic Using MISchoolData and ASSIST Jennifer Parker-Moore, Ed.D. Lisa Guzzardo Asaro, Ed.S. Kristina Martin Macomb ISD Paul Bielawski Center for Educational Performance and Innovation
-
Upload
edwina-cunningham -
Category
Documents
-
view
217 -
download
1
Transcript of School Data Analysis Diagnostic Using MISchoolData and ASSIST Jennifer Parker-Moore, Ed.D. Lisa...

School Data Analysis DiagnosticUsing MISchoolData and ASSIST
Jennifer Parker-Moore, Ed.D. Lisa Guzzardo Asaro, Ed.S.
Kristina MartinMacomb ISD
Paul BielawskiCenter for Educational Performance and Innovation

What is the SDAD?School Data Analysis Diagnostic
• The School Data Analysis (SDA) is a diagnostic tool intended to
facilitate rich and deep collaborative discussions among staff members about school data.
• The SDA can serve as a guide to determine a school’s strengths, challenges, and directions for improvement based on an analysis of data and responses to a series of data related questions.
• This data collection and analysis process includes the identification of content area achievement gaps and reflections on causation. Please note that questions related to gaps and causes for a gap are marked with an asterisk (*).
• This diagnostic represents the various types of student data that should be continuously collected, reviewed, and analyzed in conjunction with other local school data. Completion of the SDA is required.

ASSIST Online ResourcesLocating the SDAD

What’s IN the SDAD?
• Demographic– Enrollment
• Achievement – All students– Subgroups
• Process data• Perception data• Other
Data Dig

What Data do I Need for SDAD?

Questions 1-5: Student Enrollment
Questions 6-18: Student Achievement Data (All Students)
Questions 19-48: Student Achievement (by Subgroup) with Questions 34-39: Process Data
Questions 49-68: Perception Data

Where Do I Find the Data?
Where Do I Report the Data?

What Resources are Available to Help Me?
Chapter 5 specifically
speaks to the SDAD

Jigsaw of the“Data Reference Manual”
• Your facilitator will give you a section assignment• Explore the resources on your own• Share out with your group.
– Describe the contents, uses, and connections you made between school improvement and the resources available
• Be prepared to share some take aways from your table talk with the entire group

Putting It All Together

K-12th Grade• Student Counts• Student TestingSpecial Education• Special Education InquiriesOther• Annual Education Report• Data for Student Success
(D4SS)• MEAP• MME• MI-Access• School Data Profile
Analysis• PA-25
Where can I locate SDA Data in MISchoolData?
D4SS
SDAD Part I:Student Enrollment
• Student Counts– Student Counts– Graduation/Dropout Rates– Non-Resident Status
• Attendance, Retentions, Mobility• Multiple Views
– Snapshot, Trend, Entity Breakdown
Pages 50-60

Student Counts
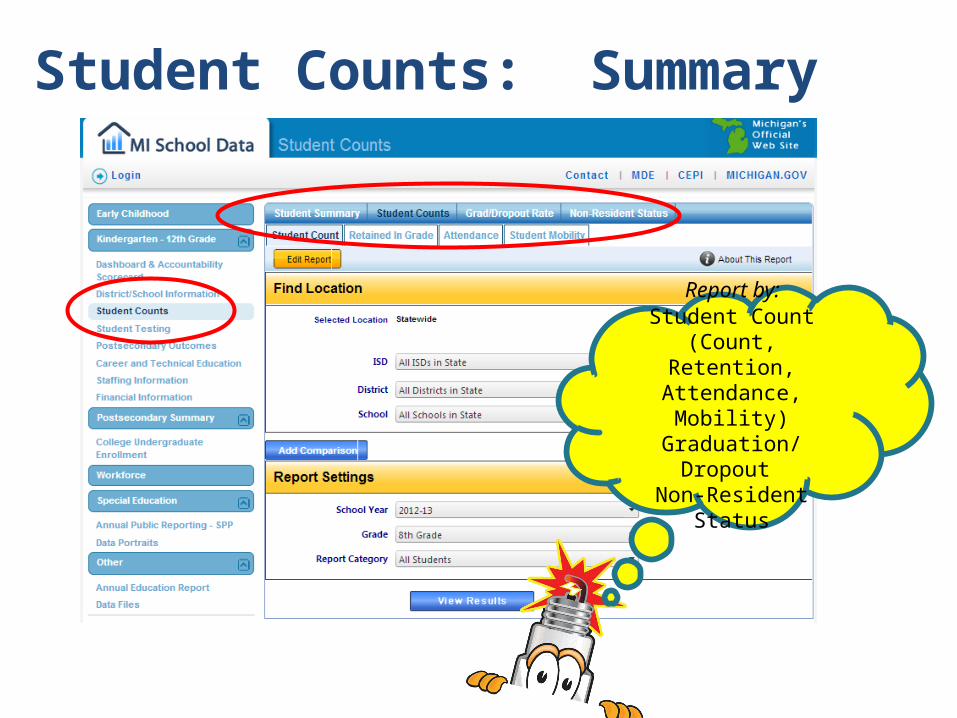
Student Counts: Summary
Report by: Student Count
(Count, Retention, Attendance, Mobility)Graduation/Dropout Non-Resident Status

Student Counts: Student Count
Report by:*Snapshot
*Trends* Entity/Building

Snapshot: Student Count

Trend: Student Count

Entity Breakdown: Student Count

Retention

Snapshot: Graduation Rate

Non-Resident Report:
Schools of Choice“Select Primary Residency Statuses”

SDAD: Part IIAAchievement: All Students
• Dashboard/School Accountability– Top 30/Bottom 30
• Student Testing– MEAP, MME
• Change views: Snapshot, Trend, Entity Breakdown• Data Tools for School Improvement
– Intro Report– Achievement SES Scatterplots– Proficiency Targets– Research
• School Research, Other Links• D4SS
– MEAP, MME• Snapshot, Comparative Item, Near Proficiency
– PA 25– School Data Profile Analysis
• AER
Pages 61-76

DashBoard & Accountability Scorecard
Many of the features of the Dashboard are only accessible with a login.
For example: Scorecard Summary and the Top 30/Bottom 30 Analysis

New! Top 30/Bottom 30 Locate the 30/40/30% by:
● Race/Ethnicity● Program
Participation● Gender● Grade

MEAP Snapshot

MME Snapshot

Trends

Entity Breakdown

ACT/College Readiness

Dig deeper on the Assessment Performance of students using
● Data 4 SS Inquiries
For More Details...

Data Tools for School Improvement

Data Tools: Intro Report

Data Tools: Achievement SES Scatterplot

Data Tools: School Research

Annual Education Report

AER – Student AssessmentMEAP, MME, MEAP Access, MIAccess

AER - Accountability
Achievement, Graduation, Attendance, and Status/Score

SDAD: Part IIBAchievement: Subgroups
• Student Testing– Use “Edit Report Settings” by Subgroup– MI-Access– Change views: Snapshot, Trend, Entity Breakdown
• Special Education/Early On– Special Education Inquiries
• MEAP, MME, MI-Access• Snapshot, Comparative Item, Near Proficiency
• Other
Pages 77-85

Special Education: Annual Public Reporting (SPP)

Student Testing

MI Access

By Participation Levels

Dig deeper on the Assessment Performance of students using
● Special Education Inquiries
For More Details...
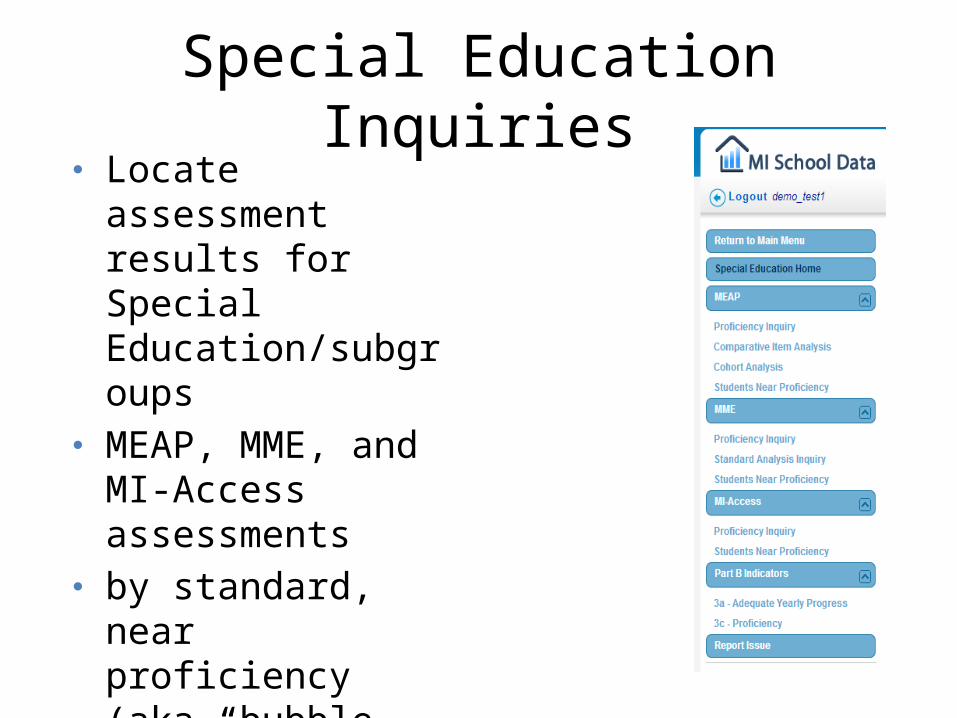
● Locate assessment results for Special Education/subgroups
● MEAP, MME, and MI-Access assessments
● by standard, near proficiency (aka “bubble kids”), or cohort
Special Education Inquiries

Process: Part III
• This section asks respondents to provide an overview of programs, policies, and percentages that are not specifically found in MISchoolData.
• Check with your school improvement consultant for more information.
Page 86

Staffing: Part IV• K-12 Dashboard
– Staffing• Teacher• Administrator
• AER– Teacher Quality
• Coming Soon: – Educator Effectiveness Ratings
• Teacher• Administrator
Pages 87-89

Staffing Information

Educator Effectiveness:Teachers & Administrators

AER – Teacher Quality

Reporting in ASSIST

Begin with a Loginhttp://advanc-ed.org/mde

Select “Diagnostics & Surveys”
Navigate to ““Diagnostics” tab
Click on Name = “School Data Analysis”

Select Area to Edit

Enrollment

Sample Response Area

Student Achievement

Perception: Students

Perception: Parents/Guardians

Perception: Teachers/Staff

SurveysSelect “Surveys” tab
Select the Survey, key a name, click Next.
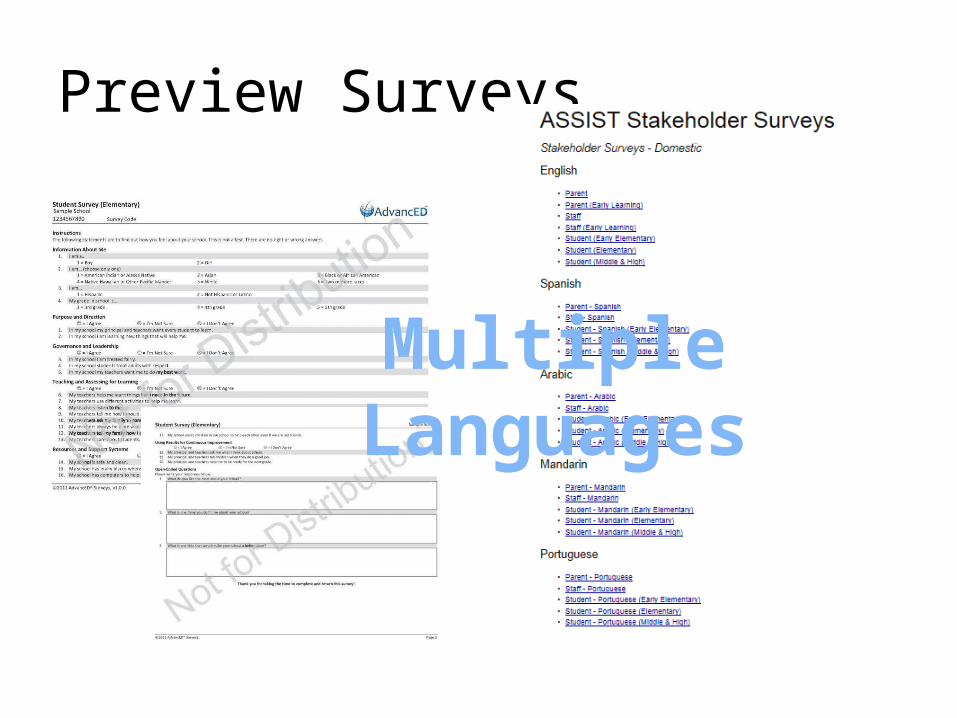
Preview Surveys
Multiple Languages

Other
Health, Curriculum/Instruction,
and Common Core

Reporting
Export or Review Data files

Thank you!For more information, contact
us.Kristina Martin
Macomb Intermediate School District
Dr. Jennifer Parker-Moore
Macomb Intermediate School District
Paul Bielawski CEPI State of [email protected]
Lisa Guzzardo AsaroMacomb Intermediate School [email protected]
Or the Help Desk @[email protected]