School Accountability Report ard - Edl · Responsibility Accountability ... *Total Teacher...
10
About This School School’s Mission Statement The Mountain View High School Mission is to deliver equitable access to an educaon that can build and strengthen student academic learning skills, posive character traits, confidence, and professional communicaon skills, which are essenal for college and career readiness. Expected-Schoolwide-Learning-Results (ESLRS) Academic ESLR: Mountain View High School students are skilled individuals who can: Meet state and district academic standards Be crical thinkers and life long learners Demonstrate technical competence Character ESLR: Mountain View High School students build character by gaining: The skills to work cooperavely Responsibility Accountability Transion ESLR: Mountain View High School students are ready to make the transion from school to a career because they: Demonstrate adaptability Exhibit community readiness Acquire me management skills Principal’s Message This report card will give the staff at Mountain View High School the opportunity to inform parents of achievements of the preceding year, of areas for improvement, and of strengths to be built upon. The school’s vision is to work with high school students who, due to educaonal, physical, or personal circumstances, are in need of a more flexible, individualized method of obtaining their high school diploma. In March of 2013 Mountain View High School was visited by a commiee from the Western Associaon of Schools and Colleges (WASC). Aſter reviewing and validang our self study, the vising commiee recommended a Six Year Accreditaon. The Mountain View administraon oversees other Alternave Programs including: Mountain Heights Academy (independent study), the San Jacinto Adult School, and Home/Hospital Instrucon. Mountain View High School has a morning and mid-aſternoon program. The adult school program offers diploma, HiSET preparaon, and computer classes . Mountain View High School School Accountability Report Card Reported Using Data from the 2015-16 School Year Published During 2016-17 Kenneth Swanson, Principal [email protected] 1000 North Ramona Blvd, San Jacinto, CA 92582-2576 (951) 487-7710 • FAX (951) 487-7718 CDS Code: 33672493337649 Grades 10-12 Contents Condions of Learning 2 Textbooks 3 Specialized Services 3 School Facilies 3 Pupil Outcomes 4 Parental Involvement 6 Pupil Engagement 6 School Climate 7 Other SARC Informaon 7 School Finances 8 Professional Development 8 About this SARC 10 San Jacinto Unified School District 2045 S. San Jacinto Avenue San Jacinto, California 92583 (951) 929-7700 www.sanjacinto.k12.ca.us Board of Trustees John I. Norman Willie Hamilton Deborah Rex Jasmin Rubio Trica Ojeda Administraon Diane Perez Superintendent [email protected] Sherry Smith Assistant Superintendent Educaonal Excellence Ma Hixson Assistant Superintendent Personnel Services Seth Heeren Assistant Superintendent Business Services
Transcript of School Accountability Report ard - Edl · Responsibility Accountability ... *Total Teacher...

About This School
School’s Mission Statement The Mountain View High School Mission is to deliver equitable access to an education that can build and strengthen student academic learning skills, positive character traits, confidence, and professional communication skills, which are essential for college and career readiness.
Expected-Schoolwide-Learning-Results (ESLRS) Academic ESLR: Mountain View High School students are skilled individuals who can:
Meet state and district academic standards
Be critical thinkers and life long learners
Demonstrate technical competence Character ESLR: Mountain View High School students build character by gaining:
The skills to work cooperatively
Responsibility
Accountability Transition ESLR: Mountain View High School students are ready to make the transition from school to a career because they:
Demonstrate adaptability
Exhibit community readiness
Acquire time management skills
Principal’s Message This report card will give the staff at Mountain View High School the opportunity to inform parents of achievements of the preceding year, of areas for improvement, and of strengths to be built upon.
The school’s vision is to work with high school students who, due to educational, physical, or personal circumstances, are in need of a more flexible, individualized method of obtaining their high school diploma.
In March of 2013 Mountain View High School was visited by a committee from the Western Association of Schools and Colleges (WASC). After reviewing and validating our self study, the visiting committee recommended a Six Year Accreditation.
The Mountain View administration oversees other Alternative Programs including: Mountain Heights Academy (independent study), the San Jacinto Adult School, and Home/Hospital Instruction. Mountain View High School has a morning and mid-afternoon program. The adult school program offers diploma, HiSET preparation, and computer classes .
Mountain View High School School Accountability Report Card
Reported Using Data from the 2015-16 School Year Published During 2016-17
Kenneth Swanson, Principal [email protected]
1000 North Ramona Blvd, San Jacinto, CA 92582-2576 (951) 487-7710 • FAX (951) 487-7718
CDS Code: 33672493337649
Grades K-5 Grades 10-12
Contents
Conditions of Learning 2
Textbooks 3
Specialized Services 3
School Facilities 3
Pupil Outcomes 4
Parental Involvement 6
Pupil Engagement 6
School Climate 7
Other SARC Information 7
School Finances 8
Professional Development 8
About this SARC 10
San Jacinto Unified School District
2045 S. San Jacinto Avenue San Jacinto, California 92583
(951) 929-7700 www.sanjacinto.k12.ca.us
Board of Trustees John I. Norman Willie Hamilton
Deborah Rex Jasmin Rubio Trica Ojeda
Administration Diane Perez
Superintendent [email protected]
Sherry Smith Assistant Superintendent
Educational Excellence
Matt Hixson Assistant Superintendent
Personnel Services
Seth Heeren Assistant Superintendent
Business Services
2
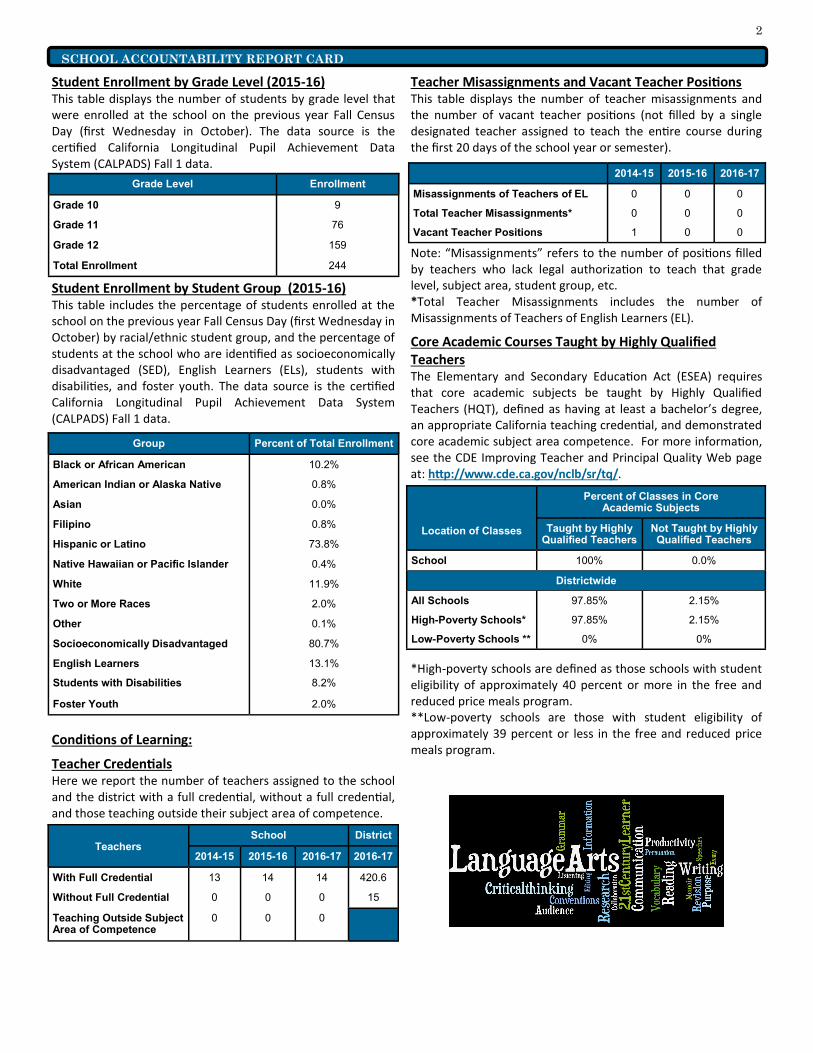
Student Enrollment by Grade Level (2015-16) This table displays the number of students by grade level that were enrolled at the school on the previous year Fall Census Day (first Wednesday in October). The data source is the certified California Longitudinal Pupil Achievement Data System (CALPADS) Fall 1 data.
Student Enrollment by Student Group (2015-16) This table includes the percentage of students enrolled at the school on the previous year Fall Census Day (first Wednesday in October) by racial/ethnic student group, and the percentage of students at the school who are identified as socioeconomically disadvantaged (SED), English Learners (ELs), students with disabilities, and foster youth. The data source is the certified California Longitudinal Pupil Achievement Data System (CALPADS) Fall 1 data.
Conditions of Learning:
Teacher Credentials Here we report the number of teachers assigned to the school and the district with a full credential, without a full credential, and those teaching outside their subject area of competence.
Teacher Misassignments and Vacant Teacher Positions This table displays the number of teacher misassignments and the number of vacant teacher positions (not filled by a single designated teacher assigned to teach the entire course during the first 20 days of the school year or semester).
Note: “Misassignments” refers to the number of positions filled by teachers who lack legal authorization to teach that grade level, subject area, student group, etc. *Total Teacher Misassignments includes the number of Misassignments of Teachers of English Learners (EL).
Core Academic Courses Taught by Highly Qualified Teachers The Elementary and Secondary Education Act (ESEA) requires that core academic subjects be taught by Highly Qualified Teachers (HQT), defined as having at least a bachelor’s degree, an appropriate California teaching credential, and demonstrated core academic subject area competence. For more information, see the CDE Improving Teacher and Principal Quality Web page at: http://www.cde.ca.gov/nclb/sr/tq/.
*High-poverty schools are defined as those schools with student eligibility of approximately 40 percent or more in the free and reduced price meals program. **Low-poverty schools are those with student eligibility of approximately 39 percent or less in the free and reduced price meals program.
Group Percent of Total Enrollment
Black or African American 10.2%
American Indian or Alaska Native 0.8%
Asian 0.0%
Filipino 0.8%
Hispanic or Latino 73.8%
Native Hawaiian or Pacific Islander 0.4%
White 11.9%
Two or More Races 2.0%
Other 0.1%
Socioeconomically Disadvantaged 80.7%
English Learners 13.1%
Students with Disabilities 8.2%
Foster Youth 2.0%
Grade Level Enrollment
Grade 10 9
Grade 11 76
Grade 12 159
Total Enrollment 244
School District Teachers
2014-15 2015-16 2016-17 2016-17
With Full Credential 13 14 14 420.6
Without Full Credential 0 0 0 15
Teaching Outside Subject Area of Competence
0 0 0
2014-15 2015-16 2016-17
Misassignments of Teachers of EL 0 0 0
Total Teacher Misassignments* 0 0 0
Vacant Teacher Positions 1 0 0
Location of Classes
Percent of Classes in Core Academic Subjects
Taught by Highly Qualified Teachers
Not Taught by Highly Qualified Teachers
School 100% 0.0%
Districtwide
All Schools 97.85% 2.15%
High-Poverty Schools* 97.85% 2.15%
Low-Poverty Schools ** 0% 0%
SCHOOL ACCOUNTABILITY REPORT CARD

3
Quality, Currency, and Availability of Textbooks and Instructional Materials (School Year 2016-17) This table displays information about the quality, currency, and availability of the standards-aligned textbooks and other instructional materials used at the school; whether the textbooks and instructional materials are from the most recent adoption (yes/no); and information about the school’s use of any supplemental curriculum or non-adopted textbooks or instructional materials. The adoption of the resolution regarding sufficiency of instructional and supplemental instructional materials for fiscal year 2016-2017 pursuant to Education Code Sections 60119, 60422(b) and 60451 was done on September 13, 2016.
SCHOOL ACCOUNTABILITY REPORT CARD
Core Curriculum Area Textbooks and Instructional Materials/Year of Adoption
Reading/Language Arts
McGraw Hill Education, Inc. – StudySync (Grades: 9th, 10th , 11th & 12th (Adoption 2016) 9th Grade Novels: To Kill a Mockingbird, The Odyssey, Tragedy of Romeo & Juliet 10th Grade Novels: Frankenstein, Night, Animal Farm 11th Grade Novels: Adventures of Huck Finn, Midsummer Night’s Dream, The Great Gatsby 12th Grade Novels: Gulliver’s Travels, Hamlet, Beowulf
Mathematics Pearson Education, Inc. – Integrated Math 1 & 2 (Adoption 2009) Holt McDougal – California Algebra 2 (Adoption 2009) MVP Math Online Program (Adoption 2014)
Science Holt, Reinhart & Winston - CA Biology / Chemistry (Adoption 2007) McDougal Littell - Earth Science (Adoption (2005) McDougal Littell - Life Science (Adoption 2008) Holt, Reinhart & Winston - Physical Science (Adoption 2008)
History-Social Science
McDougal Littell—Modern World History (Adoption 2006) Glencoe-McGraw Hill - US History American Vision, Economics Principles & Practices, Government, Democracy in Action, (Adoption 2006)
Foreign Language/ Intervention
Scholastic READ 180 & System 44 Next Generation (Adoption 2015) Scholastic READ 180, English 1 & 2 Next Generation (Adoption 2015) Pearson Education, Inc. Realidades (Spanish 1) (Adoption 2011)
Health Pearson Education, Inc. - Health (Adoption 2011)
All textbooks listed above are from the most recent adoption Yes
Percent of students lacking their own assigned textbook in core curriculum area 0%
Specialized Services Our school provides educational services to assist academically struggling students, English Language Learners, Special Education, and GATE students. Staff is continually working to enhance learning techniques to assist all students in their classes. We also have aides to further assist students.
The goal for students at Mountain View High School, who have special needs, is that they participate as successful learners in the regular school program. A number of supplementary services are provided to help attain this goal. These include the English Language Learner Program, the Student Study Team, resource specialist services, speech services, counseling services, after school tutoring, reading remediation and other specialized programs.
English Learner Program: Students not yet fluent in English participate in the English Language Development programs which includes reading remediation and supplemental instructional materials.
Special Education Programs: Students with moderate to severe learning differences are sometimes entitled to individual education plans and extra attention. Students enrolled in Special Education meet regularly with a Special Education teacher who provides specialized individual and small-group instruction based on the student’s Individualized Education Plan (IEP).
A Special Day Class (SDC): Victory Academy is a mid-day program from 10:30-2:30 p.m. This is a sheltered classroom with the emphasis on credit recovery and social skill development.
School Facilities
School Facility Conditions and Planned Improvements (2016-17) Mountain View High School opened in July of 1980. Mountain View High School has sixteen classrooms with individually controlled air-conditioning/heating units. Overhead projector units were installed in all classrooms. In addition, the school has a media/testing center with materials available for checkout, a multi-purpose room, food service facility and student store. Every classroom has adequate space and all the materials needed to ensure student success.
Maintenance and Repair District maintenance staff ensures that the repairs necessary to keep the school in good repair and working order are completed in a timely manner. A work order process is used to ensure efficient service and that emergency repairs are given the highest priority. Regular and corrective maintenance is handled on a priority daily basis and emergencies are handled immediately.
4
Cleaning Process and Schedule Our campus is clean, safe, and structurally sound. The campus is checked daily by staff for safety and a monthly site inspection checklist is completed by site staff. Students share the responsibility of maintaining the cleanliness of the campus. All rooms are cleaned daily, with major repairs completed as necessary.
The District makes great effort to ensure that all schools are clean, safe, and functional. To assist in this effort, the District uses a facility survey instrument developed by the State of California Office of Public School Construction. The results of this survey are available at the school office or at the District Office Maintenance & Operations Office.
Pupil Outcomes:
State Priority: Pupil Achievement The SARC provides the following information relevant to the State priority: Pupil Achievement (Priority 4):
Statewide assessments (i.e., California Assessment of Student Performance and Progress [CAASPP], Science California Standards Tests); and
The percentage of pupils who have successfully completed courses that satisfy the requirements for entrance to the University of California and the California State University, or career technical education sequences or programs of study.
California Assessment of Student Performance & Progress Results for all Students For the two-year period (2014-15 and 2015-16), this section includes the school, LEA, and state information on the percent of students meeting or exceeding the State standards on the California Assessment of Student Performance and Progress (CAASPP) Smarter Balanced Summative Assessments for English
Language Arts (ELA)/literacy and mathematics for grades three through eight and grade eleven.
The source of the data is the CAASPP test results, including results from the Smarter Balanced Summative Assessments for ELA/literacy in grades three through eight and grade eleven. Detailed information regarding the 2016 CAASPP ELA and mathematics results for each grade and achievement level can be found on the CDE CAASPP Results Web page at http://caaspp.cde.ca.gov/.
Note: Percentages are not calculated when the number of students tested is ten or less, either because the number of students in this category is too small for statistical accuracy or to protect student privacy.
CAASPP Assessment Results by Student Group For the SARC reporting year (2015-16) testing period, the percent of students by student group, total enrollment, number tested, percent tested, and achievement levels in CAASPP ELA, grades three through eight, and eleven.
Socioeconomically Disadvantaged students are defined as students: (1) who are eligible for the FRPM program (also known as the National School Lunch Program or NSLP), or have a direct certification for FRPMs, or (2) who are migrant, homeless, or foster youth, or (3) where neither of the parents were a high school graduate.
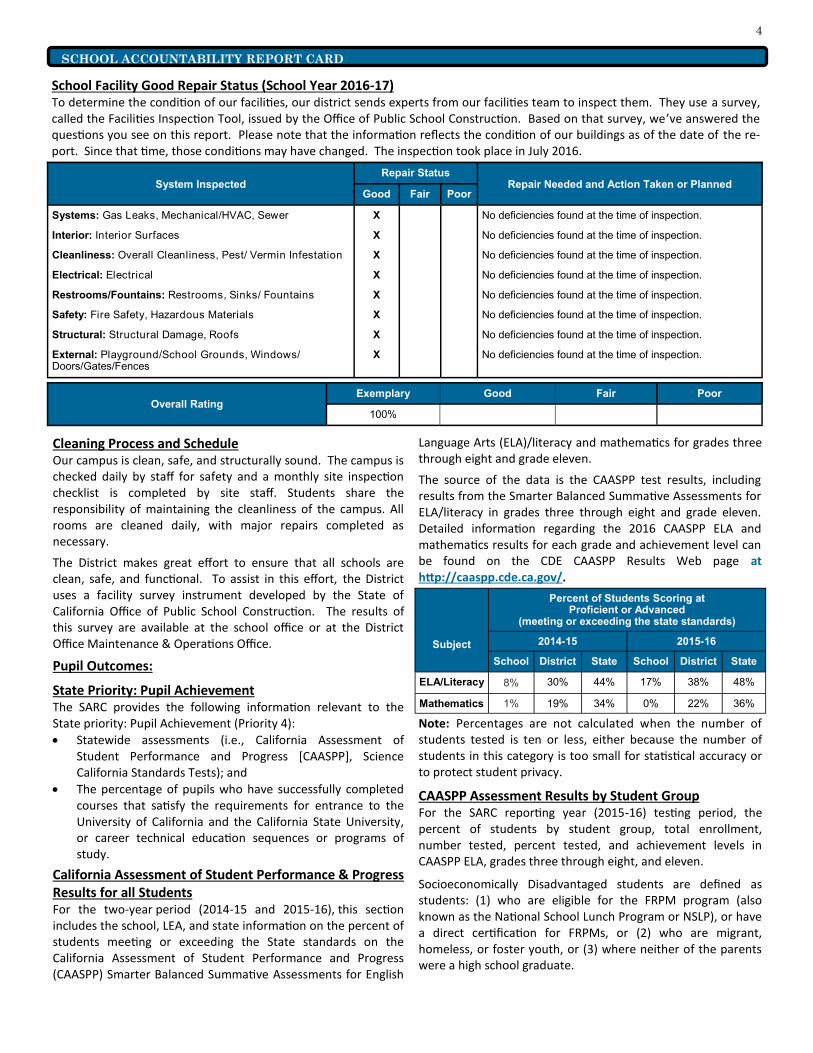
School Facility Good Repair Status (School Year 2016-17) To determine the condition of our facilities, our district sends experts from our facilities team to inspect them. They use a survey, called the Facilities Inspection Tool, issued by the Office of Public School Construction. Based on that survey, we’ve answered the questions you see on this report. Please note that the information reflects the condition of our buildings as of the date of the re-port. Since that time, those conditions may have changed. The inspection took place in July 2016.
System Inspected
Repair Status Repair Needed and Action Taken or Planned
Good Fair Poor
Systems: Gas Leaks, Mechanical/HVAC, Sewer X No deficiencies found at the time of inspection.
Interior: Interior Surfaces X No deficiencies found at the time of inspection.
Cleanliness: Overall Cleanliness, Pest/ Vermin Infestation X No deficiencies found at the time of inspection.
Electrical: Electrical X No deficiencies found at the time of inspection.
Restrooms/Fountains: Restrooms, Sinks/ Fountains X No deficiencies found at the time of inspection.
Safety: Fire Safety, Hazardous Materials X No deficiencies found at the time of inspection.
Structural: Structural Damage, Roofs X No deficiencies found at the time of inspection.
External: Playground/School Grounds, Windows/ Doors/Gates/Fences
X No deficiencies found at the time of inspection.
Exemplary Good Fair Poor Overall Rating
100%
SCHOOL ACCOUNTABILITY REPORT CARD
Subject
Percent of Students Scoring at Proficient or Advanced
(meeting or exceeding the state standards)
2014-15 2015-16
School District State School District State
ELA/Literacy 8% 30% 44% 17% 38% 48%
Mathematics 1% 19% 34% 0% 22% 36%

5
SCHOOL ACCOUNTABILITY REPORT CARD
CAASPP Assessment Results-English Language Arts (ELA) Disaggregated by Student Groups—Grade 11—(2015-16)
CAASPP Assessment Results-Mathematics Disaggregated by Student Groups—Grade 11—(2015-16)
Note: Double dashes (--) appear in the table when the number of students is ten or less, either because the number of students in this category is too small for statistical accuracy or to protect student privacy.
Student Groups Total Enrollment Number Tested Percent Tested
Percent Met or Exceeded
All Students 119 105 88.2% 16.5%
Male 66 59 89.4% 13.6%
Female 53 46 86.8% 20.5%
Black or African American 13 11 84.6% 18.2%
American Indian or Alaska Native -- -- -- --
Asian -- -- -- --
Filipino -- -- -- --
Hispanic or Latino 74 67 90.5% 12.1%
Native Hawaiian or Pacific Islander -- -- -- --
White 22 18 81.8% 29.4%
Two or More Races -- -- -- --
Socioeconomically Disadvantaged 95 87 91.6% 13.8%
English Learners 15 14 93.3% 7.1%
Students with Disabilities 15 8 53.3% 12.5%
Students Receiving Migrant Education Services -- -- -- --
Foster Youth -- -- -- -
Student Groups Total Enrollment Number Tested Percent Tested
Percent Met or Exceeded
All Students 119 104 87.4% --
Male 66 59 89.4% --
Female 53 45 84.9% --
Black or African American 13 11 84.6% --
American Indian or Alaska Native -- -- -- --
Asian -- -- -- --
Filipino -- -- -- --
Hispanic or Latino 73 65 89.0% --
Native Hawaiian or Pacific Islander -- -- -- --
White 22 18 81.8% --
Two or More Races -- -- -- --
Socioeconomically Disadvantaged 94 85 90.4% --
English Learners 15 14 93.3% --
Students with Disabilities 15 8 53.3% --
Students Receiving Migrant Education Services -- -- -- --
Foster Youth -- -- -- --

6
California Standards Tests for All Students in Science Three-Year Comparison The most recent three years (2013–14, 2014–15, and 2015-16) of school, LEA, and state information on the percent of students scoring at proficient or advanced on the California Standards Test (CST) for Science for grades five, eight, and ten.
The assessments under the CAASPP show how well students are doing in relation to the state-adopted content standards. On each of these assessments, student aggregate scores are reported as achievement levels.
More information about the CAASPP system can be found on the CDE CAASPP System Web page at http://www.cde.ca.gov/ta/tg/ca/.
Note: Scores are not shown when the number of students tested is ten or less, either because the number of students in this category is too small for statistical accuracy or to protect student privacy.
Engagement:
State Priority: Parental Involvement Contact Person: Trisha Ochoa Phone Number: (951) 487-7710 Each year the parents, students, and staff are asked to choose representatives to serve on the site council. Once the council has been selected, members of all constituent groups are encouraged to attend and to provide input even if not “official” members. Each year the constituent groups of the site council review the school budget at their first meeting. The budget is monitored at each meeting thereafter.
An English Learner Advisory Committee (ELAC) was formed in the 2008-09 school year. Parents interested in participating may contact the school for details and meeting dates.
Every year MVHS hosts two evening, parent open houses where parents/guardians are encouraged to come and meet with the staff. One meeting is usually in October and the second in April.
State Priority: Pupil Engagement:
Dropout Rate and Graduation Rate
SCHOOL ACCOUNTABILITY REPORT CARD
School District State
13-14
14-15
13-14
14-15
13-14
14-15
12-13
12-13
12-13
Dropout Rate
4.7 4.4 4.7 4.4 11.5 10.7 5.6 5.6 11.4
Graduation Rate
86.7 87.5 86.7 87.5 80.9 82.3 81.6 81.6 80.4
CAASPP Test Results in Science by Student Group Grade Ten (School Year 2015–16)
Note: Science test results include CSTs, CMA, and CAPA in grades five, eight, and ten. The “Proficient or Advanced” is calculated by taking the total number of students who scored at Proficient or Advanced on the science assessment divided by the total number of students with valid scores.
Note: Scores are not shown when the number of students tested is ten or less, either because the number of students in this category is too small for statistical accuracy or to protect student privacy.
Student Groups Total
Enrollment Number of Students
with Valid Scores Percent of Students
with Valid Scores Percent Proficient or
Advanced
All Students 31 26 83.9% 3.9%
Male 21 17 81.0% 5.9%
Female -- -- -- --
Black or African American -- -- -- --
American Indian or Alaska Native -- -- -- --
Asian 0 0 0.0% 0.0%
Filipino 0 0 0.0% 0.0%
Hispanic or Latino 22 18 81.8% 0.0%
Native Hawaiian or Pacific Islander 0 0 0.0% 0.0%
White -- -- -- --
Two or More Races 0 0 0.0% 0.0%
Socioeconomically Disadvantaged 28 23 82.1% 4.4%
English Learners -- -- -- --
Students with Disabilities -- -- -- --
Students Receiving Migrant Education Services 0 0 0.0% 0.0%
Foster Youth -- -- -- --
Subject
School District State
2014 2015 2016 2014 2015 2016 2014 2015 2016
Science 8% 9% 4% 55% 49% 48% 60% 56% 54%

7
Completion of High School Graduation Requirements The percent of students in the school’s most recent certified graduating class that met all state and local graduation requirements for grade twelve completion. Data are provided at the school, district, and state levels for all students and for those student groups for which numerically significant data are reported by the CDE.
State Priority: School Climate:
School Safety SB187 Safety Plan Date the plan was last updated: 3/10/16 Date the plan was last reviewed with staff: 2/9/16 The Comprehensive Safe School Plan includes data regarding crime, safe school procedures and compliance with laws including: (1) child abuse reporting, (2) disaster response, (3) suspension and expulsion policies, (4) notification of teachers of dangerous pupils, (5) sexual harassment, (6) schoolwide dress codes prohibiting gang-related apparel, (7) procedures for safe ingress and egress from school, (8) procedures to ensure a safe and orderly environment conducive to learning, (9) rules and procedures on school discipline adopted pursuant to Ed Code Sections 35291 and 35291.5, and (10) lockdown procedures. A copy of the plan is available for inspection by the public at each school.
Our school and grounds are very safe. Staff members monitor the campus before school, after school, and during breaks. Our discipline policies curtail fighting and bullying.
Mountain View High School yearly updates its Site Disaster Plan and staff is regularly in-serviced as to their duties in emergency situations. A school safety audit conducted using a student, parent, and staff opinion survey is the backbone of the School Safety Report. Stakeholders view Mountain View, overall, as a safe school.
Suspensions and Expulsions This table displays the rate of suspensions and expulsions (the total number of incidents divided by the total enrollment) at the school, district, and state for the most recent three-year period.
Other SARC Information:
Federal Intervention Program (2016-17)
Note: Percent of Schools Currently in Program Improvement: The number of schools currently in PI within the District divided by the total number of Title I schools within the District.
Academic Counselors and Other Support Staff The following table lists the number of full-time equivalent qualified support personnel who provide counseling and other pupil support services in our school. These specialists often work part-time at our school and some may work at more than one school in our district.
* One Full-Time Equivalent (FTE) equals one staff member working full-time; one FTE could also represent two staff members who each work 50 percent of full-time.
Title
Number of FTE* Assigned to School
Average Number of Students per
Academic Counselor
Academic Counselor 0.50 488.0
Library Media Services (paraprofessional)
0.25
Psychologist 0.25
Nurse 0.20
School
2013-14 2014-15 2015-16
Suspensions 12.5% 6.3% 7.5%
Expulsions 0.4% 0.0% 0.0%
District
Suspensions 6.8% 5.6% 5.8%
Expulsions 0.1% 0.1% 0.1%
State
Suspensions 4.4% 3.8% 3.7%
Expulsions 0.1% 0.1% 0.1%
SCHOOL ACCOUNTABILITY REPORT CARD
Graduating Class of 2015
Group School District State
All Students 47 80 85
Black or African American 63 72 77
American Indian or Alaska Native 0 56 75
Asian 0 100 99
Filipino 0 91 97
Hispanic or Latino 45 80 84
Native Hawaiian or Pacific Islander 0 100 85
White 47 83 87
Two or More Races 100 100 91
Socioeconomically Disadvantaged 28 47 77
English Learners 43 49 51
Students with Disabilities 81 49 68
Foster Youth -- -- --
School District
Program Improvement Status Not in PI In PI
First Year of Program Improvement 2004-2005
Year in Program Improvement Year 3
Number of Schools Currently in PI 5
Percent of Schools Currently in PI 62.5%

8
Average Class Size and Class Size Distribution (Secondary) The average class size is calculated by dividing the number of students enrolled in classes, excluding special education and a few other minor categories, divided by the number of classes. The following table provides three years of data.
* Number of classes indicates how many classrooms fall into each size category (a range of total students per classroom). At the secondary school level, this information is reported by subject area rather than grade level.
Subject
2013-14 2014-15 2015-16
Avg. Class Size
Number of Classes* Avg. Class Size
Number of Classes* Avg. Class Size
Number of Classes*
1-22 23-32 33+ 1-22 23-32 33+ 1-22 23-32 33+
English 4.0 73 4.0 77 2.0 126
Mathematics 6.0 38 4.0 53 2.0 99
Science 4.0 16 5.0 24 3.0 40
Social Science 5.0 52 4.0 61 3.0 95
School Finance
Expenditures Per Pupil and School Site Teacher Salaries (Fiscal Year 2014-15)
Restricted source means money whose use is restricted by legal requirement or by the donor. Examples include, but are not limited to, instructional materials, economic impact aid, and teacher and principal training funds.
Unrestricted source means money that can be used for any lawful purpose, whose use is not restricted by legal requirement or by the donor. Examples include, but are not limited to, class size reduction, state lottery (not the instructional materials portion), and undesignated local parcel tax funds.
The CDE’s calculation is based on EC Section 41372 definitions (see the CDE Current Expense of Education & Per-pupil Spending Web page at http://www.cde.ca.gov/ds/fd/ec/, modified to include only unrestricted sources in the calculation.
For more information, see the CDE Certificated Salaries & Benefits Web page at http://www.cde.ca.gov/ds/fd/cs/. To look up expenditures and salaries for a specific school district, see the Ed-Data Web site at http://www.ed-data.org.
Other Funding (2015-16) Funding is provided through special programs to supplement the core instructional program provided by the school district.
Teacher & Administrative Salaries (Fiscal Year 2014-15) This table displays district-level salary information for teachers, principals, and the superintendent, and compares these figures to the state averages for districts of the same type and size. The table also displays teacher and administrative salaries as a percent of a district's budget, and compares these figures to the state averages for districts of the same type and size. Detailed information regarding salaries may be found at http://www.cde.ca.gov/ds/fd/cs/.
Professional Development The San Jacinto Unified School District provides all certificated and classified staff members with ongoing professional development to enhance employee knowledge and skills. Administrators, teachers, counselors, and classified staff are provided with research-based professional development activities based on student performance data and the needs of employees. A District Site Leadership Team model has been utilized to train key teacher-leaders at all school sites which in turn, provide direct professional development training sessions to their respective school sites. RCOE has partnered with the San Jacinto Unified School District to train DSLTs in the implementation of Designated and Integrated ELD strategies to support English Learners throughout the district.
Expenditures Per Pupil Average Teacher Salary Level Total Restricted Unrestricted
School $9,935 $2,630 $7,305 $84,004
District $6,496 $75,917
State $5,677 $71,517
Percent Difference: school/district 11.1% 9.6%
Percent Difference: school/state 22.3% 14.9%
SCHOOL ACCOUNTABILITY REPORT CARD
Category
District Amount
State Average for Districts in Same
Category
Beginning Teacher Salary $47,064 $43,821
Mid-Range Teacher Salary $73,327 $69,131
Highest Teacher Salary $95,592 $89,259
Average Principal Salary (ES) $114,122 $108,566
Average Principal Salary (MS) $121,724 $115,375
Average Principal Salary (HS) $129,896 $125,650
Superintendent’s Salary $183,518 $198,772
Percent of District Budget
Teacher Salaries 37.0% 37.0%
Administrative Salaries 6.0% 6.0%

9
Support for increased student writing is an important part of the common core design. Writing instruction for core content teachers encompasses Thinking Maps, co-teaching, and small group instruction. Consultants have been retained to provide explicit writing instruction to all teachers with an emphasis on expository reading and writing. This includes Jane Schaffer writing training, coaching, and support being provided to teachers at the secondary level.
Professional development for school administrators includes monthly Leadership Team meetings (3-hours), weekly coaching visits by district administrators, and facilitated training on writing, the district academic focus area. Particular attention is given to supporting the principals as academic and instructional leaders at the school sites.
All teachers engage in ongoing professional growth through school and district workshops or meetings on Fridays (minimum/modified day schedule), during quarterly grade-level department meetings, and during after school staff meetings. Teachers engage in professional growth activities as they analyze student benchmark test scores and discuss instructional strategies during grade-level department meetings on Fridays or during after school staff meetings. New teachers participate in the Center for Teacher Innovation (CTI) program, and Peer Assistance and Review (PAR) is available for veteran teachers. Teachers also participate in webinars or attend specialized conferences in subject/content-specific areas such as the AVID Summer Institute, Career Technical Education (CTE), and International Baccalaureate (IB) at the high school.
Teachers receive support during the implementation of instructional strategies by their administrators, their colleagues, and by the district Instructional Coaches and TOSAs. School administrators meet with teachers after observing their classrooms and provide feedback and support on specific instructional focus areas. Teachers are committed to the Professional Learning Community model that emphasizes interdependent work, a focus on student learning, and immediate intervention when students are not successful. Instructional coaching support includes consultation, in-class coaching, co-planning/co-teaching sessions during the school day, and demonstration lessons. Teachers participate on Instructional Review Teams to monitor the implementation of the school and district focus areas.
Professional development activities, which support the Reading of Complex Text across all content areas have been provided for all teachers districtwide. This opportunity, provided by Dr. Douglas Fisher, will continue to be a major focus of professional development to support students in developing the literacy skills necessary to be successful beyond high school. Leadership Teams from each of the 12 school sites in San Jacinto Unified have been involved in a multi-year process involving a deep understanding of Close Reading Strategies that entail: clear purpose statements, the gradual release process, text dependent questions, and collaborative conversations. Upon completion of each training session, these Leadership Teams are scheduled to provide Close Reading training to their respective school sites. A major emphasis at the Elementary Level has been the use of Guided Reading. Guided reading focuses on the development of critical skills to support reading metacognition for students. Also, Guided Reading supports close and scaffolded reading instruction. A significant component of the professional development plan is the collaboration and planning session for all teachers throughout the district. There are currently multiple opportunities throughout the school year where all content level teachers receive release days for training and collaboration with colleagues in job-alike assignments. This has provided the opportunity for teachers to share best practices and to revisit curriculum.
Focused training on CCSS mathematics is ongoing. The teachers have adopted curricula for each grade level, i.e. elementary, middle school, and high school. Training in these materials has been provided to all teachers. Teachers benefit from a professional development plan which emphasizes the Standards for Mathematical Practice (SMP) with structured collaboration time. Coaching and support are provided to teachers by district Math TOSAs to support effective math instruction that is aligned to the California Math Framework. Instructional strategies such as Number Talks, Concept Attainment, and 3Reads. Understanding grade level standards and fluency expectations are a high priority as we support teachers in this understanding and instructional practice .
Professional development in the area of NGSS has been a targeted and strategic process starting with middle school and high school teachers. High school teachers examined the suggested course models and have selected a 4 year course model which is Biology, Chemistry, Physics, and Earth Science as the capstone. Middle School teachers examined and decided on the integrated approach vs. the discipline specific approach. Middle school teachers have worked extensively to develop an understanding of the integrated concepts for their grade levels, participating in standards crosswalks which compare CST standards to NGSS, and teachers have begun in-depth work of following the state approved framework which outlines suggested units and lessons, and have begun integrating these concepts into their current curriculum and instructional plan. Elementary teachers are early in the process of learning the NGSS and the structure and progressions and participate in quarterly, optional training in the NGSS.
SCHOOL ACCOUNTABILITY REPORT CARD

10
SCHOOL ACCOUNTABILITY REPORT CARD
About the SARC
By February 1 of each year, every school in California is required by state law to publish a School Accountability Report Card (SARC). The SARC contains information about the condition and performance of each California public school. Under the Local Control Funding Formula (LCFF) all local educational agencies (LEAs) are required to prepare a Local Control Accountability Plan (LCAP), which describes how they intend to meet annual school-specific goals for all pupils, with specific activities to address state and local priorities. Additionally, data reported in an LCAP is to be consistent with data reported in the SARC.
For more information about SARC requirements, see the California Department of Education (CDE) SARC Web page at http://www.cde.ca.gov/ta/ac/sa/.
For more information about the LCFF or LCAP, see the CDE LCFF Web page at http://www.cde.ca.gov/fg/aa/lc/.
For additional information about the school, parents/guardians and community members should contact the school or the district office.
DataQuest DataQuest is an online data tool located on the CDE DataQuest Web page at http://dq.cde.ca.gov/dataquest/ that contains additional information about this school and comparisons of the school to the district and the county. Specifically, DataQuest is a dynamic system that provides reports for accountability (e.g., test data, enrollment, high school graduates, dropouts, course enrollments, staffing, and data regarding English learners).
Internet Access Internet access is available at public libraries and other locations that are publicly accessible (e.g., the California State Library). Access to the Internet at libraries and public locations is generally provided on a first-come, first-served basis. Other use restrictions may include the hours of operation, the length of time that a workstation may be used (depending on availability), the types of software programs available on a workstation, and the ability to print documents.