
Schemewise Annual Reports 2012 - 2013 - HSBC...Structural model for India equity investment remains...
401
Schemewise Annual Reports 2012 - 2013
Transcript of Schemewise Annual Reports 2012 - 2013 - HSBC...Structural model for India equity investment remains...
Schemewise Annual Reports 2012 - 2013

► INDEX HSBC Equity Fund HSBC India Opportunities Fund HSBC Unique Opportunities Fund HSBC Dynamic Fund HSBC Tax Saver Equity Fund

4
HSBC Equity Fund
Trustees’ ReportFor the year ended March 31, 2013
The Trustees present the eleventh report and the audited abridged fi nancial statements of the Schemes of HSBC Mutual Fund (the “Fund”), for the year ended March 31, 2013.
1. SCHEME PERFORMANCE, FUTURE OUTLOOK AND OPERATIONS OF THE SCHEMES
a) Operations and Performance of the Schemes
HSBC Equity Fund (HEF) - an open-ended diversifi ed Equity Scheme
HEF seeks to generate long-term capital growth from an actively managed portfolio of equity and equity related securities.
The net assets of HEF amounted to Rs. 537.31 crores as at March 31, 2013 as against Rs. 684.20 crores as at March 31, 2012. Around 99.21% of the net assets were invested in equities, 1.48% of the net assets were invested in reverse repos/CBLO and (- 0.69%) was in the net current assets as at March 31, 2013.
HEF remained invested in a diversifi ed portfolio across large capitalization stocks on the exchange. The relative underweight in healthcare was the cause of the underperformance against its benchmark during the period 2012-13.
Date of Inception : 10 December, 2002 Absolute (%) Compounded Annualized (%)
Scheme Name & Benchmarks April ‘12 - March ‘13
April ‘11 - March ‘12
April ‘10 - March ‘11
Since Inception
HSBC Equity Fund – Growth 4.20 -8.90 9.67 24.76
CNX Nifty Index (Standard Benchmark) 6.93 -9.13 10.27 17.41
S&P BSE 200 (Scheme Benchmark) 5.41 -9.55 7.27 18.68
Rs. 10,000, if invested in HEF - Growth, would have become
10,420 9,110 10,967 98,173
Rs. 10,000, if invested in CNX Nifty Index, would have become
10,693 9087 11,027 52,409
Rs. 10,000, if invested in S&P BSE 200, would have become
10,541 9045 10,727 58,573
Returns data as on March 31, 2013. Past performance may or may not be sustained in future. ‘Since Inception’ returns are calculated on Rs. 10 invested at inception. Calculations are based on Growth NAVs.
b) Market Overview & Outlook
EQUITY OUTLOOK
The Sensex returned 8.23% for the FY ended March 2013. While this looks to be a tepid return, the market rallied smoothly for a low of 15965 in June to end at 18835 at the FY end, a return of 17.98%. This was largely due to a series of announcements on reforms by the government and falling crude oil prices, signaling hopes of an economic recovery.
Returns (April 1, 2012 - March 31, 2013) 1 Year (%)
NIFTY 7.31
Sensex 8.23
S&P BSE 100 6.84
S&P BSE 200 6.03
S&P BSE 500 4.81
CNX Midcap -4.02
Source: Bloomberg

5
HSBC Equity Fund
Trustees’ ReportFor the year ended March 31, 2013 (Contd...)
Our view in respect of key issues facing equity market currently is highlighted as under, based on which we do expect a likely reversal of the prevailing negative sentiment going forward -
� Macro challenge - expect some relief in current account defi cit given likely lower gold imports and crude oil correction. Solution to fi scal defi cit may however need policy decision to reduce subsidy burden on diesel, kerosene, LPG.
� Commodities infl ation expected to decline on account of China slowdown and lower growth in western world. This may have positive impact margin expansion for corporate sector and on currency (INR) and will give room for reducing interest rates over time. Lower cost of capital should hopefully revive capex spending, though gradually (recovery from 2H12).
� Lower interest rates directionally would be the single most important variable for equity markets to rally. This will be driven by lower commodity infl ation and focus back on reviving growth through monetary policy (recent disappointing GDP/IIP numbers support this view).
� Valuations (for large Sensex companies) are attractive at close to 13x forward earnings and in the lower range of historic multiples. A large number of mid-caps available at a signifi cant discount to large cap peer.
� Structural model for India equity investment remains intact for long term returns. These include favourable demography, high savings rate, rising incomes, growing consumption demand growth, existing low penetration, etc.
DEBT OUTLOOK
Fixed Income market in FY 2013 moved towards lower yields on back of 100 bps rate cut and CRR cuts. RBI front loaded the rate cut in April and then followed it up in January 2013 and March 2013. Towards the second half rates stabilized largely as the core infl ation remained within comfort zone.
In the second half of the year expectation of rate cut and series of open market operations led to rally in rates. Government borrowing was lower than budgeted and the spending was also controlled in second half of the year. Towards the end of the year short end rates tightened substantially due to low deposit growth in banking system.
Corporate yield curve remained inverted with short end rates higher than long end rates for the large part of the year due to liquidity tightness.
Expectation is to see continuation of some easing of the rates stance from RBI in FY 14. However, there is a need to focus on key variables in the economy to judge future directions. These are:
� Liquidity: Liquidity will drive short end rates and eventually drive decisions on open market operations as well as CRR cuts.
� Infl ation: Infl ation numbers will determine future course of action for RBI and remains a critical variable for policy. We expect infl ation to ease in fi rst half of FY 14.
� Growth: GDP growth numbers as well as industrial activity will also determine the decision on policy. Weak GDP numbers may continue for couple of quarters.
� Fiscal defi cit: Fiscal defi cit and government spending will determine the government borrowing and crowding out in interest rate curve.
� Current account defi cit / BoP situation: CAD determines how the pressure on currency works and effective management of forex reserves
� Currency levels: Level of INR will determine how the central banker reacts to the situation on the global crisis etc.

6
HSBC Equity Fund
Trustees’ ReportFor the year ended March 31, 2013 (Contd...)
2. BRIEF BACKGROUND OF SPONSORS, BOARD OF TRUSTEES AND ASSET MANAGEMENT COMPANY
a) Sponsor HSBC Mutual Fund is sponsored by HSBC Securities and Capital Markets (India) Private Limited (HSCI).
The Sponsor is the Settler of the Mutual Fund Trust. The Sponsor has entrusted a sum of Rs.1,00,000 (Rupees One Lakh only) to the Trustee as the initial contribution towards the corpus of the Mutual Fund.
HSCI offers integrated investment banking services, securities and corporate fi nance & advisory. HSCI is a member of The Bombay Stock Exchange Limited and National Stock Exchange (capital and derivative market segments). HSCI holds 100% of the paid up equity share capital of HSBC Asset Management (India) Private Limited.
b) HSBC Mutual Fund HSBC Mutual Fund (“the Mutual Fund” or “the Fund”) has been constituted as a Trust in accordance with
the provisions of the Indian Trusts Act, 1882 (2 of 1882) vide a Trust Deed dated February 7, 2002 with HSBC Securities and Capital Markets (India) Private Limited, as the Sponsor and the Board of Individual Trustees. The Trustee has entered into an Investment Management Agreement dated February 7, 2002 with HSBC Asset Management (India) Private Limited (AMC) to function as the Investment Manager for all the Schemes of the Fund. The Fund was registered with SEBI vide registration number MF/046/02/5 dated May 27, 2002.
The Trust has been formed for the purpose of pooling of capital from the public for collective investment in securities/any other property for the purpose of providing facilities for participation by persons as benefi ciaries in such properties/investments and in the profi ts/income arising therefrom.
c) Board of Trustees (the Trustees) The Board of Trustees is the exclusive owner of the Trust Fund and holds the same in trust for the benefi t
of the unit holders. The Trustees have been discharging their duties and carrying out the responsibilities as provided in the SEBI (Mutual Funds) Regulations, 1996 and the Trust Deed. The Trustees seek to ensure that the Fund and the Schemes fl oated there under are managed by the AMC in accordance with the Trust Deed, the said Regulations, directions and guidelines issued by the SEBI, the Stock Exchanges, the Association of Mutual Funds in India and other regulatory agencies.
d) Asset Management Company (the AMC) HSBC Asset Management (India) Private Limited (the Investment Manager or the AMC) is a private limited
company incorporated under the Companies Act, 1956 on December 12, 2001 having its Registered Offi ce at 16, V. N. Road, Fort, Mumbai 400 001. HSBC Asset Management (India) Private Limited has been appointed as the Asset Management Company of the HSBC Mutual Fund by the Trustee vide Investment Management Agreement (IMA) dated February 7, 2002 and executed between the Trustees and the AMC. SEBI approved the AMC to act as the Investment Manager of the Fund vide its letter No. MFD/BC/163/2002 dated May 27, 2002. The paid-up equity share capital of the AMC is Rs. 54.2 crores. HSBC Securities and Capital Markets (India) Private Limited holds 100% of the paid up equity share capital of the AMC.
3. INVESTMENT OBJECTIVE OF THE SCHEMESThe investment objective of the respective Schemes has been provided above under the heading “Scheme Performance, Future Outlook and Operation of the Scheme” (Refer Section 1).
4. SIGNIFICANT ACCOUNTING POLICIESThe accounting policies are in accordance with Securities Exchange Board of India (Mutual Funds) Regulations 1996.

7
HSBC Equity Fund
Trustees’ ReportFor the year ended March 31, 2013 (Contd...)
5. UNCLAIMED DIVIDENDS & REDEMPTIONSSummary of number of Investors & corresponding amount Scheme-wise as on March 31, 2013
SchemeUnclaimed Dividends Unclaimed Redemptions
Amount (Rs.)
No. of Investors
Amount (Rs.)
No. of Investors
HSBC Equity Fund 4,225,053.45 986 6,707,513.98 198
6. INVESTOR SERVICESThe number of offi cial points of acceptance of transactions is 197 locations. In addition to the offi ces of the Registrar & Transfer agents, the AMC has Investor Service Centres in 4 locations at its own offi ces - namely Mumbai, New Delhi, Kolkata and Chennai. With a view to enhance customer convenience, the AMC has extended the facility of priority based servicing to key distributors through the enhancement of the Interactive Voice Reponses. Call Centre number has now been converted to a single Toll Free number which can be dialed from anywhere in India. The call Centre service is being managed by the Registrar and Transfer Agents. The AMC continues to retain the outsourced back offi ce services with HOPE.
On the distribution front, the number of empanelled distributors was 2471 as on 31 March 2013. During the year, the AMC initiated tie-ups for online distribution of the Mutual Fund’s Schemes with several channel partners taking the total number of such tie-ups to 45.
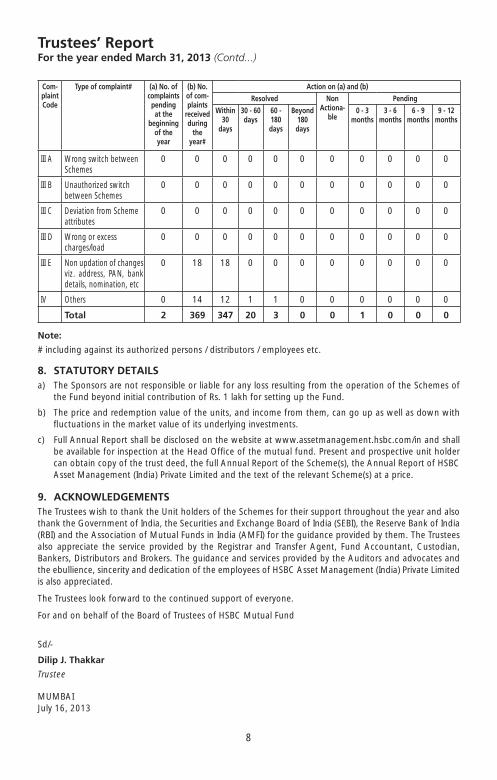
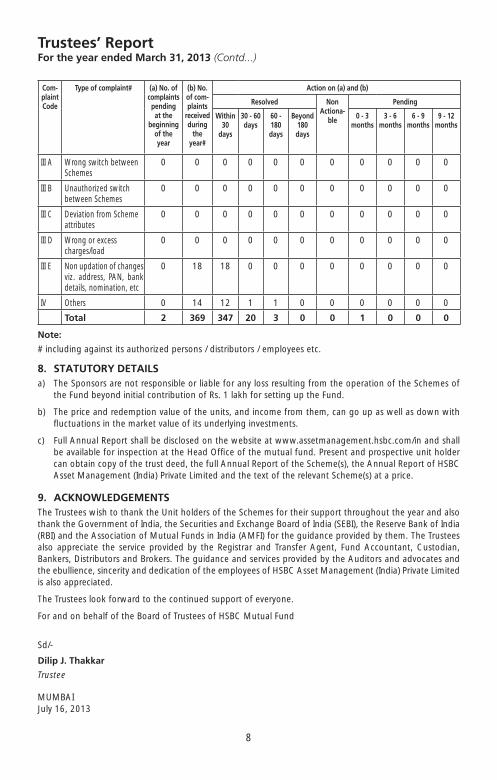
7. DETAILS OF INVESTOR GRIEVANCE REDRESSALThe details of the redressal of investor complaints received against HSBC Mutual Fund during April 2012- March 2013 are as follows:
Total Number of Folios: 261694
Com-plaintCode
Type of complaint#
(a) No. ofcomplaintspendingat the
beginningof theyear
(b) No. of com-plaints
receivedduring
theyear#
Action on (a) and (b)
Resolved Non Actiona-
ble
Pending
Within 30
days
30 - 60 days
60 - 180 days
Beyond 180 days
0 - 3 months
3 - 6 months
6 - 9 months
9 - 12 months
I A Non receipt of Dividend on Units
0 3 3 0 0 0 0 0 0 0 0
I B Interest on delayed payment of Dividend
0 0 0 0 0 0 0 0 0 0 0
I C Non receipt of Redemption Proceeds
2 40 22 18 2 0 0 0 0 0 0
I D Interest on delayed payment of Redemption
0 2 1 1 0 0 0 0 0 0 0
II A Non receipt of Statement of Account/Unit Certifi cate
0 9 9 0 0 0 0 0 0 0 0
II B Discrepancy in Statement of Account
0 6 5 0 0 0 0 1 0 0 0
II C Data corrections in Investor details
0 277 277 0 0 0 0 0 0 0 0
II D Non receipt of Annual Report/Abridged Summary
0 0 0 0 0 0 0 0 0 0 0

8
HSBC Equity Fund
Trustees’ ReportFor the year ended March 31, 2013 (Contd...)
Com-plaintCode
Type of complaint#
(a) No. ofcomplaintspendingat the
beginningof theyear
(b) No. of com-plaints
receivedduring
theyear#
Action on (a) and (b)
Resolved Non Actiona-
ble
Pending
Within 30
days
30 - 60 days
60 - 180 days
Beyond 180 days
0 - 3 months
3 - 6 months
6 - 9 months
9 - 12 months
III A Wrong switch between Schemes
0 0 0 0 0 0 0 0 0 0 0
III B Unauthorized switch between Schemes
0 0 0 0 0 0 0 0 0 0 0
III C Deviation from Scheme attributes
0 0 0 0 0 0 0 0 0 0 0
III D Wrong or excess charges/load
0 0 0 0 0 0 0 0 0 0 0
III E Non updation of changes viz. address, PAN, bank details, nomination, etc
0 18 18 0 0 0 0 0 0 0 0
IV Others 0 14 12 1 1 0 0 0 0 0 0
Total 2 369 347 20 3 0 0 1 0 0 0
Note:
# including against its authorized persons / distributors / employees etc.
8. STATUTORY DETAILSa) The Sponsors are not responsible or liable for any loss resulting from the operation of the Schemes of
the Fund beyond initial contribution of Rs. 1 lakh for setting up the Fund.
b) The price and redemption value of the units, and income from them, can go up as well as down with fl uctuations in the market value of its underlying investments.
c) Full Annual Report shall be disclosed on the website at www.assetmanagement.hsbc.com/in and shall be available for inspection at the Head Offi ce of the mutual fund. Present and prospective unit holder can obtain copy of the trust deed, the full Annual Report of the Scheme(s), the Annual Report of HSBC Asset Management (India) Private Limited and the text of the relevant Scheme(s) at a price.
9. ACKNOWLEDGEMENTSThe Trustees wish to thank the Unit holders of the Schemes for their support throughout the year and also thank the Government of India, the Securities and Exchange Board of India (SEBI), the Reserve Bank of India (RBI) and the Association of Mutual Funds in India (AMFI) for the guidance provided by them. The Trustees also appreciate the service provided by the Registrar and Transfer Agent, Fund Accountant, Custodian, Bankers, Distributors and Brokers. The guidance and services provided by the Auditors and advocates and the ebullience, sincerity and dedication of the employees of HSBC Asset Management (India) Private Limited is also appreciated.
The Trustees look forward to the continued support of everyone.
For and on behalf of the Board of Trustees of HSBC Mutual Fund
Sd/-
Dilip J. Thakkar
Trustee
MUMBAIJuly 16, 2013
9
HSBC Equity Fund
To the Board of Trustees of
HSBC Mutual Fund
Report on the Financial Statements1. We have audited the accompanying fi nancial statements of HSBC Mutual Fund - HSBC Equity Fund, (the
“Scheme”), which comprise the Balance Sheet as at March 31, 2013, and the related Revenue Account and Cash Flow Statement for the year then ended, and a summary of signifi cant accounting policies and other explanatory information, which we have signed under reference to this report.
Trustee’s and Management’s Responsibility for the Financial Statements2. The Board of Trustees of HSBC Mutual Fund (the “Trustee”) and the Management of HSBC Asset
Management (India) Private Limited (the “Management”) are responsible for the preparation of these fi nancial statements that give a true and fair view of the fi nancial position, fi nancial performance and cash fl ows of the Scheme in accordance with the accounting policies and standards specifi ed in the Ninth Schedule of the Securities and Exchange Board of India (Mutual Funds) Regulations, 1996 and amendments thereto (the “Regulations”). This responsibility includes the design, implementation and maintenance of internal control relevant to the preparation and presentation of the fi nancial statements that give a true and fair view and are free from material misstatement, whether due to fraud or error.
Auditors’ Responsibility3. Our responsibility is to express an opinion on these fi nancial statements based on our audit. We conducted
our audit in accordance with the Standards on Auditing issued by the Institute of Chartered Accountants of India. Those Standards require that we comply with ethical requirements and plan and perform the audit to obtain reasonable assurance about whether the fi nancial statements are free from material misstatement.
4. An audit involves performing procedures to obtain audit evidence, about the amounts and disclosures in the fi nancial statements. The procedures selected depend on the auditors’ judgment, including the assessment of the risks of material misstatement of the fi nancial statements, whether due to fraud or error. In making those risk assessments, the auditors consider internal control relevant to the preparation and fair presentation of the fi nancial statements in order to design audit procedures that are appropriate in the circumstances. Our procedures included confi rmation of securities owned and unit capital balances as at March 31, 2013 by correspondence with the custodian/others and registrar and transfer agent, respectively. An audit also includes evaluating the appropriateness of accounting policies used and the reasonableness of the accounting estimates made by the Trustee and the Management, as well as evaluating the overall presentation of the fi nancial statements.
5. We believe that the audit evidence we have obtained is suffi cient and appropriate to provide a basis for our audit opinion.
Opinion6. In our opinion, and to the best of our information and according to the explanations given to us, the
accompanying fi nancial statements give the information required by the Regulations in the manner so required and give a true and fair view in conformity with the accounting principles generally accepted in India:
(a) in the case of the Balance Sheet, of the state of affairs of the Scheme as at March 31, 2013;
(b) in the case of the Revenue Account, of the net surplus for the year ended on that date; and
(c) in the case of the Cash Flow Statement, of the cash fl ows for the year ended on that date.
Report on Other Legal and Regulatory Requirement7. As required by section 55(4) of the Regulations, we report that:
(a) We have obtained all the information and explanations which, to the best of our knowledge and belief, were necessary for the purposes of our audit; and
Independent Auditors’ Report
10
HSBC Equity Fund
Independent Auditors’ Report (Contd...)
(b) In our opinion, the Balance Sheet, Revenue Account and Cash Flow Statement dealt with by this report have been prepared in accordance with the accounting policies and standards specifi ed in the Ninth Schedule of the Regulations.
8. As required by clause 5 (ii)(2) of the Eleventh Schedule to the Regulations, we report that the Balance Sheet, Revenue Account, and Cash Flow Statement dealt with by this Report are in agreement with the books of account of the Scheme.
For PRICE WATERHOUSEFirm Registration Number: 301112EChartered Accountants
Sd/-
Vivek PrasadPartnerMembership Number: 104941
Place : MumbaiDate : July 16, 2013
4
HSBC INDIA OPPORTUNITIES FUND
Trustees’ ReportFor the year ended March 31, 2013
The Trustees present the eleventh report and the audited abridged fi nancial statements of the Schemes of HSBC Mutual Fund (the “Fund”), for the year ended March 31, 2013.
1. SCHEME PERFORMANCE, FUTURE OUTLOOK AND OPERATIONS OF THE SCHEMES
a) Operations and Performance of the Schemes
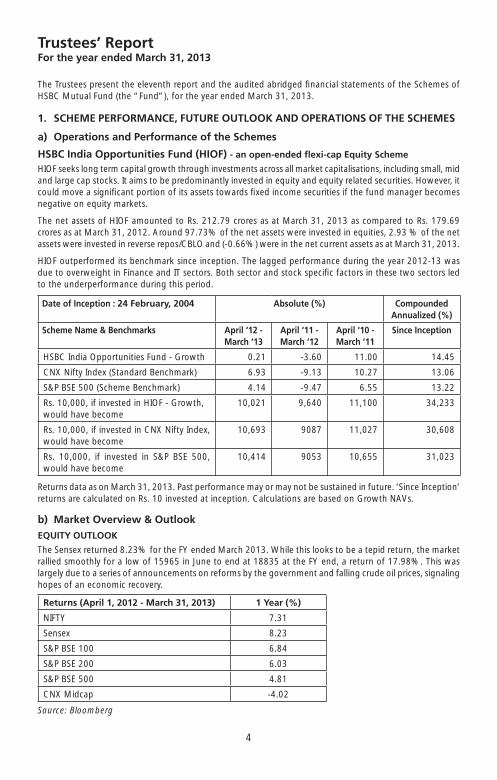
HSBC India Opportunities Fund (HIOF) - an open-ended fl exi-cap Equity Scheme
HIOF seeks long term capital growth through investments across all market capitalisations, including small, mid and large cap stocks. It aims to be predominantly invested in equity and equity related securities. However, it could move a signifi cant portion of its assets towards fi xed income securities if the fund manager becomes negative on equity markets.
The net assets of HIOF amounted to Rs. 212.79 crores as at March 31, 2013 as compared to Rs. 179.69 crores as at March 31, 2012. Around 97.73% of the net assets were invested in equities, 2.93 % of the net assets were invested in reverse repos/CBLO and (-0.66%) were in the net current assets as at March 31, 2013.
HIOF outperformed its benchmark since inception. The lagged performance during the year 2012-13 was due to overweight in Finance and IT sectors. Both sector and stock specifi c factors in these two sectors led to the underperformance during this period.
Date of Inception : 24 February, 2004 Absolute (%) Compounded Annualized (%)
Scheme Name & Benchmarks April ‘12 - March ‘13
April ‘11 - March ‘12
April ‘10 - March ‘11
Since Inception
HSBC India Opportunities Fund - Growth 0.21 -3.60 11.00 14.45
CNX Nifty Index (Standard Benchmark) 6.93 -9.13 10.27 13.06
S&P BSE 500 (Scheme Benchmark) 4.14 -9.47 6.55 13.22
Rs. 10,000, if invested in HIOF - Growth, would have become
10,021 9,640 11,100 34,233
Rs. 10,000, if invested in CNX Nifty Index, would have become
10,693 9087 11,027 30,608
Rs. 10,000, if invested in S&P BSE 500, would have become
10,414 9053 10,655 31,023
Returns data as on March 31, 2013. Past performance may or may not be sustained in future. ‘Since Inception’ returns are calculated on Rs. 10 invested at inception. Calculations are based on Growth NAVs.
b) Market Overview & OutlookEQUITY OUTLOOK
The Sensex returned 8.23% for the FY ended March 2013. While this looks to be a tepid return, the market rallied smoothly for a low of 15965 in June to end at 18835 at the FY end, a return of 17.98%. This was largely due to a series of announcements on reforms by the government and falling crude oil prices, signaling hopes of an economic recovery.
Returns (April 1, 2012 - March 31, 2013) 1 Year (%)
NIFTY 7.31
Sensex 8.23
S&P BSE 100 6.84
S&P BSE 200 6.03
S&P BSE 500 4.81
CNX Midcap -4.02
Source: Bloomberg

5
HSBC INDIA OPPORTUNITIES FUND
Trustees’ ReportFor the year ended March 31, 2013 (Contd...)
Our view in respect of key issues facing equity market currently is highlighted as under, based on which we do expect a likely reversal of the prevailing negative sentiment going forward -
� Macro challenge - expect some relief in current account defi cit given likely lower gold imports and crude oil correction. Solution to fi scal defi cit may however need policy decision to reduce subsidy burden on diesel, kerosene, LPG.
� Commodities infl ation expected to decline on account of China slowdown and lower growth in western world. This may have positive impact margin expansion for corporate sector and on currency (INR) and will give room for reducing interest rates over time. Lower cost of capital should hopefully revive capex spending, though gradually (recovery from 2H12).
� Lower interest rates directionally would be the single most important variable for equity markets to rally. This will be driven by lower commodity infl ation and focus back on reviving growth through monetary policy (recent disappointing GDP/IIP numbers support this view).
� Valuations (for large Sensex companies) are attractive at close to 13x forward earnings and in the lower range of historic multiples. A large number of mid-caps available at a signifi cant discount to large cap peer.
� Structural model for India equity investment remains intact for long term returns. These include favourable demography, high savings rate, rising incomes, growing consumption demand growth, existing low penetration, etc.
DEBT OUTLOOK
Fixed Income market in FY 2013 moved towards lower yields on back of 100 bps rate cut and CRR cuts. RBI front loaded the rate cut in April and then followed it up in January 2013 and March 2013. Towards the second half rates stabilized largely as the core infl ation remained within comfort zone.
In the second half of the year expectation of rate cut and series of open market operations led to rally in rates. Government borrowing was lower than budgeted and the spending was also controlled in second half of the year. Towards the end of the year short end rates tightened substantially due to low deposit growth in banking system.
Corporate yield curve remained inverted with short end rates higher than long end rates for the large part of the year due to liquidity tightness.
Expectation is to see continuation of some easing of the rates stance from RBI in FY 14. However, there is a need to focus on key variables in the economy to judge future directions. These are:
� Liquidity: Liquidity will drive short end rates and eventually drive decisions on open market operations as well as CRR cuts.
� Infl ation: Infl ation numbers will determine future course of action for RBI and remains a critical variable for policy. We expect infl ation to ease in fi rst half of FY 14.
� Growth: GDP growth numbers as well as industrial activity will also determine the decision on policy. Weak GDP numbers may continue for couple of quarters.
� Fiscal defi cit: Fiscal defi cit and government spending will determine the government borrowing and crowding out in interest rate curve.
� Current account defi cit / BoP situation: CAD determines how the pressure on currency works and effective management of forex reserves.
� Currency levels: Level of INR will determine how the central banker reacts to the situation on the global crisis etc.

6
HSBC INDIA OPPORTUNITIES FUND
Trustees’ ReportFor the year ended March 31, 2013 (Contd...)
2. BRIEF BACKGROUND OF SPONSORS, BOARD OF TRUSTEES AND ASSET MANAGEMENT COMPANY
a) Sponsor HSBC Mutual Fund is sponsored by HSBC Securities and Capital Markets (India) Private Limited (HSCI).
The Sponsor is the Settler of the Mutual Fund Trust. The Sponsor has entrusted a sum of Rs.1,00,000 (Rupees One Lakh only) to the Trustee as the initial contribution towards the corpus of the Mutual Fund.
HSCI offers integrated investment banking services, securities and corporate fi nance & advisory. HSCI is a member of The Bombay Stock Exchange Limited and National Stock Exchange (capital and derivative market segments). HSCI holds 100% of the paid up equity share capital of HSBC Asset Management (India) Private Limited.
b) HSBC Mutual Fund HSBC Mutual Fund (“the Mutual Fund” or “the Fund”) has been constituted as a Trust in accordance with
the provisions of the Indian Trusts Act, 1882 (2 of 1882) vide a Trust Deed dated February 7, 2002 with HSBC Securities and Capital Markets (India) Private Limited, as the Sponsor and the Board of Individual Trustees. The Trustee has entered into an Investment Management Agreement dated February 7, 2002 with HSBC Asset Management (India) Private Limited (AMC) to function as the Investment Manager for all the Schemes of the Fund. The Fund was registered with SEBI vide registration number MF/046/02/5 dated May 27, 2002.
The Trust has been formed for the purpose of pooling of capital from the public for collective investment in securities/any other property for the purpose of providing facilities for participation by persons as benefi ciaries in such properties/investments and in the profi ts/income arising therefrom.
c) Board of Trustees (the Trustees) The Board of Trustees is the exclusive owner of the Trust Fund and holds the same in trust for the benefi t
of the unit holders. The Trustees have been discharging their duties and carrying out the responsibilities as provided in the SEBI (Mutual Funds) Regulations, 1996 and the Trust Deed. The Trustees seek to ensure that the Fund and the Schemes fl oated there under are managed by the AMC in accordance with the Trust Deed, the said Regulations, directions and guidelines issued by the SEBI, the Stock Exchanges, the Association of Mutual Funds in India and other regulatory agencies.
d) Asset Management Company (the AMC) HSBC Asset Management (India) Private Limited (the Investment Manager or the AMC) is a private limited
company incorporated under the Companies Act, 1956 on December 12, 2001 having its Registered Offi ce at 16, V. N. Road, Fort, Mumbai 400 001. HSBC Asset Management (India) Private Limited has been appointed as the Asset Management Company of the HSBC Mutual Fund by the Trustee vide Investment Management Agreement (IMA) dated February 7, 2002 and executed between the Trustees and the AMC. SEBI approved the AMC to act as the Investment Manager of the Fund vide its letter No. MFD/BC/163/2002 dated May 27, 2002. The paid-up equity share capital of the AMC is Rs. 54.2 crores. HSBC Securities and Capital Markets (India) Private Limited holds 100% of the paid up equity share capital of the AMC.
3. INVESTMENT OBJECTIVE OF THE SCHEMESThe investment objective of the respective Schemes has been provided above under the heading “Scheme Performance, Future Outlook and Operation of the Scheme” (Refer Section 1).
4. SIGNIFICANT ACCOUNTING POLICIESThe accounting policies are in accordance with Securities Exchange Board of India (Mutual Funds) Regulations 1996.

7
HSBC INDIA OPPORTUNITIES FUND
Trustees’ ReportFor the year ended March 31, 2013 (Contd...)
5. UNCLAIMED DIVIDENDS & REDEMPTIONSSummary of number of Investors & corresponding amount Scheme-wise as on March 31, 2013
SchemeUnclaimed Dividends Unclaimed Redemptions
Amount (Rs.)
No. of Investors
Amount (Rs.)
No. of Investors
HSBC India Opportunities Fund 1,026,412.19 387 1,377,717.79 54
6. INVESTOR SERVICESThe number of offi cial points of acceptance of transactions is 197 locations. In addition to the offi ces of the Registrar & Transfer agents, the AMC has Investor Service Centres in 4 locations at its own offi ces - namely Mumbai, New Delhi, Kolkata and Chennai. With a view to enhance customer convenience, the AMC has extended the facility of priority based servicing to key distributors through the enhancement of the Interactive Voice Reponses. Call Centre number has now been converted to a single Toll Free number which can be dialed from anywhere in India. The call Centre service is being managed by the Registrar and Transfer Agents. The AMC continues to retain the outsourced back offi ce services with HOPE.
On the distribution front, the number of empanelled distributors was 2471 as on 31 March 2013. During the year, the AMC initiated tie-ups for online distribution of the Mutual Fund’s Schemes with several channel partners taking the total number of such tie-ups to 45.
7. DETAILS OF INVESTOR GRIEVANCE REDRESSALThe details of the redressal of investor complaints received against HSBC Mutual Fund during April 2012- March 2013 are as follows:
Total Number of Folios: 261694
Com-plaintCode
Type of complaint#
(a) No. ofcomplaintspendingat the
beginningof theyear
(b) No. of com-plaints
receivedduring
theyear#
Action on (a) and (b)
Resolved Non Actiona-
ble
Pending
Within 30
days
30 - 60 days
60 - 180 days
Beyond 180 days
0 - 3 months
3 - 6 months
6 - 9 months
9 - 12 months
I A Non receipt of Dividend on Units
0 3 3 0 0 0 0 0 0 0 0
I B Interest on delayed payment of Dividend
0 0 0 0 0 0 0 0 0 0 0
I C Non receipt of Redemption Proceeds
2 40 22 18 2 0 0 0 0 0 0
I D Interest on delayed payment of Redemption
0 2 1 1 0 0 0 0 0 0 0
II A Non receipt of Statement of Account/Unit Certifi cate
0 9 9 0 0 0 0 0 0 0 0
II B Discrepancy in Statement of Account
0 6 5 0 0 0 0 1 0 0 0
II C Data corrections in Investor details
0 277 277 0 0 0 0 0 0 0 0
II D Non receipt of Annual Report/Abridged Summary
0 0 0 0 0 0 0 0 0 0 0

8
HSBC INDIA OPPORTUNITIES FUND
Trustees’ ReportFor the year ended March 31, 2013 (Contd...)
Com-plaintCode
Type of complaint#
(a) No. ofcomplaintspendingat the
beginningof theyear
(b) No. of com-plaints
receivedduring
theyear#
Action on (a) and (b)
Resolved Non Actiona-
ble
Pending
Within 30
days
30 - 60 days
60 - 180 days
Beyond 180 days
0 - 3 months
3 - 6 months
6 - 9 months
9 - 12 months
III A Wrong switch between Schemes
0 0 0 0 0 0 0 0 0 0 0
III B Unauthorized switch between Schemes
0 0 0 0 0 0 0 0 0 0 0
III C Deviation from Scheme attributes
0 0 0 0 0 0 0 0 0 0 0
III D Wrong or excess charges/load
0 0 0 0 0 0 0 0 0 0 0
III E Non updation of changes viz. address, PAN, bank details, nomination, etc
0 18 18 0 0 0 0 0 0 0 0
IV Others 0 14 12 1 1 0 0 0 0 0 0
Total 2 369 347 20 3 0 0 1 0 0 0
Note:
# including against its authorized persons / distributors / employees etc.
8. STATUTORY DETAILSa) The Sponsors are not responsible or liable for any loss resulting from the operation of the Schemes of
the Fund beyond initial contribution of Rs. 1 lakh for setting up the Fund.
b) The price and redemption value of the units, and income from them, can go up as well as down with fl uctuations in the market value of its underlying investments.
c) Full Annual Report shall be disclosed on the website at www.assetmanagement.hsbc.com/in and shall be available for inspection at the Head Offi ce of the mutual fund. Present and prospective unit holder can obtain copy of the trust deed, the full Annual Report of the Scheme(s), the Annual Report of HSBC Asset Management (India) Private Limited and the text of the relevant Scheme(s) at a price.
9. ACKNOWLEDGEMENTSThe Trustees wish to thank the Unit holders of the Schemes for their support throughout the year and also thank the Government of India, the Securities and Exchange Board of India (SEBI), the Reserve Bank of India (RBI) and the Association of Mutual Funds in India (AMFI) for the guidance provided by them. The Trustees also appreciate the service provided by the Registrar and Transfer Agent, Fund Accountant, Custodian, Bankers, Distributors and Brokers. The guidance and services provided by the Auditors and advocates and the ebullience, sincerity and dedication of the employees of HSBC Asset Management (India) Private Limited is also appreciated.
The Trustees look forward to the continued support of everyone.
For and on behalf of the Board of Trustees of HSBC Mutual Fund
Sd/-
Dilip J. Thakkar
Trustee
MUMBAIJuly 16, 2013

9
HSBC INDIA OPPORTUNITIES FUND
To the Board of Trustees of
HSBC Mutual Fund
Report on the Financial Statements1. We have audited the accompanying fi nancial statements of HSBC Mutual Fund - HSBC India Opportunities
Fund (the “Scheme”), which comprise the Balance Sheet as at March 31, 2013, and the related Revenue Account for the year then ended, and a summary of signifi cant accounting policies and other explanatory information, which we have signed under reference to this report.
Trustee’s and Management’s Responsibility for the Financial Statements2. The Board of Trustees of HSBC Mutual Fund (the “Trustee”) and the Management of HSBC Asset
Management (India) Private Limited (the “Management”) are responsible for the preparation of these fi nancial statements that give a true and fair view of the fi nancial position and fi nancial performance of the Scheme in accordance with the accounting policies and standards specifi ed in the Ninth Schedule of the Securities and Exchange Board of India (Mutual Funds) Regulations, 1996 and amendments thereto (the “Regulations”). This responsibility includes the design, implementation and maintenance of internal control relevant to the preparation and presentation of the fi nancial statements that give a true and fair view and are free from material misstatement, whether due to fraud or error.
Auditors’ Responsibility3. Our responsibility is to express an opinion on these fi nancial statements based on our audit. We conducted
our audit in accordance with the Standards on Auditing issued by the Institute of Chartered Accountants of India. Those Standards require that we comply with ethical requirements and plan and perform the audit to obtain reasonable assurance about whether the fi nancial statements are free from material misstatement.
4. An audit involves performing procedures to obtain audit evidence, about the amounts and disclosures in the fi nancial statements. The procedures selected depend on the auditors’ judgment, including the assessment of the risks of material misstatement of the fi nancial statements, whether due to fraud or error. In making those risk assessments, the auditors consider internal control relevant to the preparation and fair presentation of the fi nancial statements in order to design audit procedures that are appropriate in the circumstances. Our procedures included confi rmation of securities owned and unit capital balances as at March 31, 2013 by correspondence with the custodian/others and registrar and transfer agent, respectively. An audit also includes evaluating the appropriateness of accounting policies used and the reasonableness of the accounting estimates made by the Trustee and the Management, as well as evaluating the overall presentation of the fi nancial statements.
5. We believe that the audit evidence we have obtained is suffi cient and appropriate to provide a basis for our audit opinion.
Opinion6. In our opinion, and to the best of our information and according to the explanations given to us, the
accompanying fi nancial statements give the information required by the Regulations in the manner so required and give a true and fair view in conformity with the accounting principles generally accepted in India:
(a) in the case of the Balance Sheet, of the state of affairs of the Scheme as at March 31, 2013; and
(b) in the case of the Revenue Account, of the net surplus for the year ended on that date.
Report on Other Legal and Regulatory Requirement7. As required by section 55(4) of the Regulations, we report that:
(a) We have obtained all the information and explanations which, to the best of our knowledge and belief, were necessary for the purposes of our audit; and
Independent Auditors’ Report

10
HSBC INDIA OPPORTUNITIES FUND
(b) In our opinion, the Balance Sheet and Revenue Account dealt with by this report have been prepared in accordance with the accounting policies and standards specifi ed in the Ninth Schedule of the Regulations.
8. As required by clause 5 (ii)(2) of the Eleventh Schedule to the Regulations, we report that the Balance Sheet and Revenue Account dealt with by this Report are in agreement with the books of account of the Scheme.
For PRICE WATERHOUSEFirm Registration Number: 301112EChartered Accountants
Sd/-
Vivek PrasadPartnerMembership Number: 104941
Place : MumbaiDate : July 16, 2013
Independent Auditors’ Report (Contd...)

4
HSBC UNIQUE OPPORTUNITIES FUND
Trustees’ ReportFor the year ended March 31, 2013
The Trustees present the eleventh report and the audited abridged fi nancial statements of the Schemes of HSBC Mutual Fund (the “Fund”), for the year ended March 31, 2013.
1. SCHEME PERFORMANCE, FUTURE OUTLOOK AND OPERATIONS OF THE SCHEMES
a) Operations and Performance of the Schemes
HSBC Unique Opportunities Fund (HUOF) - an open ended Equity Scheme
HUOF seeks to provide long-term capital growth from a diversifi ed portfolio of equity and equity related instruments. The focus would be to invest in stocks of companies facing “out-of-ordinary” conditions.
The net assets of HUOF amounted to Rs. 51.50 crores as at March 31, 2013 compared to Rs. 67.52 crores as at March 31, 2012. Around 95.96 % of the net assets were invested in equities, 4.85% of the net assets were invested in reverse repos / CBLO and (-0.81%) were in net current assets as at March 31, 2013.
HUOF is positioned towards a cyclical turn in the economy with an overweight position in materials and banks during the period 2012-13. These sectors had underperformed during this period.
Date of Inception : 21 March, 2007 Absolute (%) Compounded Annualized (%)
Scheme Name & Benchmarks April ‘12 - March ‘13
April ‘11 - March ‘12
April ‘10 - March ‘11
Since Inception
HSBC Unique Opportunities Fund - Growth 4.82 -9.79 8.92 0.79
CNX Nifty Index (Standard Benchmark) 6.93 -9.13 10.27 6.71
S&P BSE 200 (Scheme Benchmark) 5.41 -9.55 7.27 6.52
Rs. 10,000, if invested in HUOF - Growth, would have become
10,482 9,021 10,892 10,486
Rs. 10,000, if invested in CNX Nifty Index, would have become
10,693 9087 11,027 14,808
Rs. 10,000, if invested in S&P BSE 200, would have become
10,541 9045 10,727 14,648
Returns data as on March 31, 2013. Past performance may or may not be sustained in future. ‘Since inception’ returns are calculated on Rs. 10 invested at inception. Calculations are based on Growth NAVs.
b) Market Overview & Outlook
EQUITY OUTLOOK
The Sensex returned 8.23% for the FY ended March 2013. While this looks to be a tepid return, the market rallied smoothly for a low of 15965 in June to end at 18835 at the FY end, a return of 17.98%. This was largely due to a series of announcements on reforms by the government and falling crude oil prices, signaling hopes of an economic recovery.
Returns (April 1, 2012 - March 31, 2013) 1 Year (%)
NIFTY 7.31
Sensex 8.23
S&P BSE 100 6.84
S&P BSE 200 6.03
S&P BSE 500 4.81
CNX Midcap -4.02
Source: Bloomberg

5
HSBC UNIQUE OPPORTUNITIES FUND
Trustees’ ReportFor the year ended March 31, 2013 (Contd...)
Our view in respect of key issues facing equity market currently is highlighted as under, based on which we do expect a likely reversal of the prevailing negative sentiment going forward -
� Macro challenge - expect some relief in current account defi cit given likely lower gold imports and crude oil correction. Solution to fi scal defi cit may however need policy decision to reduce subsidy burden on diesel, kerosene, LPG.
� Commodities infl ation expected to decline on account of China slowdown and lower growth in western world. This may have positive impact margin expansion for corporate sector and on currency (INR) and will give room for reducing interest rates over time. Lower cost of capital should hopefully revive capex spending, though gradually (recovery from 2H12).
� Lower interest rates directionally would be the single most important variable for equity markets to rally. This will be driven by lower commodity infl ation and focus back on reviving growth through monetary policy (recent disappointing GDP/IIP numbers support this view).
� Valuations (for large Sensex companies) are attractive at close to 13x forward earnings and in the lower range of historic multiples. A large number of mid-caps available at a signifi cant discount to large cap peer.
� Structural model for India equity investment remains intact for long term returns. These include favourable demography, high savings rate, rising incomes, growing consumption demand growth, existing low penetration, etc.
DEBT OUTLOOK
Fixed Income market in FY 2013 moved towards lower yields on back of 100 bps rate cut and CRR cuts. RBI front loaded the rate cut in April and then followed it up in January 2013 and March 2013. Towards the second half rates stabilized largely as the core infl ation remained within comfort zone.
In the second half of the year expectation of rate cut and series of open market operations led to rally in rates. Government borrowing was lower than budgeted and the spending was also controlled in second half of the year. Towards the end of the year short end rates tightened substantially due to low deposit growth in banking system.
Corporate yield curve remained inverted with short end rates higher than long end rates for the large part of the year due to liquidity tightness.
Expectation is to see continuation of some easing of the rates stance from RBI in FY 14. However, there is a need to focus on key variables in the economy to judge future directions. These are:
� Liquidity: Liquidity will drive short end rates and eventually drive decisions on open market operations as well as CRR cuts.
� Infl ation: Infl ation numbers will determine future course of action for RBI and remains a critical variable for policy. We expect infl ation to ease in fi rst half of FY 14.
� Growth: GDP growth numbers as well as industrial activity will also determine the decision on policy. Weak GDP numbers may continue for couple of quarters.
� Fiscal defi cit: Fiscal defi cit and government spending will determine the government borrowing and crowding out in interest rate curve.
� Current account defi cit / BoP situation: CAD determines how the pressure on currency works and effective management of forex reserves.
� Currency levels: Level of INR will determine how the central banker reacts to the situation on the global crisis etc.

6
HSBC UNIQUE OPPORTUNITIES FUND
Trustees’ ReportFor the year ended March 31, 2013 (Contd...)
2. BRIEF BACKGROUND OF SPONSORS, BOARD OF TRUSTEES AND ASSET MANAGEMENT COMPANY
a) Sponsor HSBC Mutual Fund is sponsored by HSBC Securities and Capital Markets (India) Private Limited (HSCI).
The Sponsor is the Settler of the Mutual Fund Trust. The Sponsor has entrusted a sum of Rs.1,00,000 (Rupees One Lakh only) to the Trustee as the initial contribution towards the corpus of the Mutual Fund.
HSCI offers integrated investment banking services, securities and corporate fi nance & advisory. HSCI is a member of The Bombay Stock Exchange Limited and National Stock Exchange (capital and derivative market segments). HSCI holds 100% of the paid up equity share capital of HSBC Asset Management (India) Private Limited.
b) HSBC Mutual Fund HSBC Mutual Fund (“the Mutual Fund” or “the Fund”) has been constituted as a Trust in accordance with
the provisions of the Indian Trusts Act, 1882 (2 of 1882) vide a Trust Deed dated February 7, 2002 with HSBC Securities and Capital Markets (India) Private Limited, as the Sponsor and the Board of Individual Trustees. The Trustee has entered into an Investment Management Agreement dated February 7, 2002 with HSBC Asset Management (India) Private Limited (AMC) to function as the Investment Manager for all the Schemes of the Fund. The Fund was registered with SEBI vide registration number MF/046/02/5 dated May 27, 2002.
The Trust has been formed for the purpose of pooling of capital from the public for collective investment in securities/any other property for the purpose of providing facilities for participation by persons as benefi ciaries in such propertie s/ investments and in the profi ts/income arising therefrom.
c) Board of Trustees (the Trustees) The Board of Trustees is the exclusive owner of the Trust Fund and holds the same in trust for the benefi t
of the unit holders. The Trustees have been discharging their duties and carrying out the responsibilities as provided in the SEBI (Mutual Funds) Regulations, 1996 and the Trust Deed. The Trustees seek to ensure that the Fund and the Schemes fl oated there under are managed by the AMC in accordance with the Trust Deed, the said Regulations, directions and guidelines issued by the SEBI, the Stock Exchanges, the Association of Mutual Funds in India and other regulatory agencies.
d) Asset Management Company (the AMC) HSBC Asset Management (India) Private Limited (the Investment Manager or the AMC) is a private limited
company incorporated under the Companies Act, 1956 on December 12, 2001 having its Registered Offi ce at 16, V. N. Road, Fort, Mumbai 400 001. HSBC Asset Management (India) Private Limited has been appointed as the Asset Management Company of the HSBC Mutual Fund by the Trustee vide Investment Management Agreement (IMA) dated February 7, 2002 and executed between the Trustees and the AMC. SEBI approved the AMC to act as the Investment Manager of the Fund vide its letter No. MFD/BC/163/2002 dated May 27, 2002. The paid-up equity share capital of the AMC is Rs. 54.2 crores. HSBC Securities and Capital Markets (India) Private Limited holds 100% of the paid up equity share capital of the AMC.
3. INVESTMENT OBJECTIVE OF THE SCHEMESThe investment objective of the respective Schemes has been provided above under the heading “Scheme Performance, Future Outlook and Operation of the Scheme” (Refer Section 1).
4. SIGNIFICANT ACCOUNTING POLICIESThe accounting policies are in accordance with Securities Exchange Board of India (Mutual Funds) Regulations 1996.

7
HSBC UNIQUE OPPORTUNITIES FUND
Trustees’ ReportFor the year ended March 31, 2013 (Contd...)
5. UNCLAIMED DIVIDENDS & REDEMPTIONSSummary of number of Investors & corresponding amount Scheme-wise as on March 31, 2013
SchemeUnclaimed Dividends Unclaimed Redemptions
Amount (Rs.)
No. of Investors
Amount (Rs.)
No. of Investors
HSBC Unique Opportunities Fund – – 1,407,480.65 55
6. INVESTOR SERVICESThe number of offi cial points of acceptance of transactions is 197 locations. In addition to the offi ces of the Registrar & Transfer agents, the AMC has Investor Service Centres in 4 locations at its own offi ces - namely Mumbai, New Delhi, Kolkata and Chennai. With a view to enhance customer convenience, the AMC has extended the facility of priority based servicing to key distributors through the enhancement of the Interactive Voice Reponses. Call Centre number has now been converted to a single Toll Free number which can be dialed from anywhere in India. The call Centre service is being managed by the Registrar and Transfer Agents. The AMC continues to retain the outsourced back offi ce services with HOPE.
On the distribution front, the number of empanelled distributors was 2471 as on 31 March 2013. During the year, the AMC initiated tie-ups for online distribution of the Mutual Fund’s Schemes with several channel partners taking the total number of such tie-ups to 45.
7. DETAILS OF INVESTOR GRIEVANCE REDRESSALThe details of the redressal of investor complaints received against HSBC Mutual Fund during April 2012- March 2013 are as follows:
Total Number of Folios: 261694
Com-plaintCode
Type of complaint#
(a) No. ofcomplaintspendingat the
beginningof theyear
(b) No. of com-plaints
receivedduring
theyear#
Action on (a) and (b)
Resolved Non Actiona-
ble
Pending
Within 30
days
30 - 60 days
60 - 180 days
Beyond 180 days
0 - 3 months
3 - 6 months
6 - 9 months
9 - 12 months
I A Non receipt of Dividend on Units
0 3 3 0 0 0 0 0 0 0 0
I B Interest on delayed payment of Dividend
0 0 0 0 0 0 0 0 0 0 0
I C Non receipt of Redemption Proceeds
2 40 22 18 2 0 0 0 0 0 0
I D Interest on delayed payment of Redemption
0 2 1 1 0 0 0 0 0 0 0
II A Non receipt of Statement of Account/Unit Certifi cate
0 9 9 0 0 0 0 0 0 0 0
II B Discrepancy in Statement of Account
0 6 5 0 0 0 0 1 0 0 0
II C Data corrections in Investor details
0 277 277 0 0 0 0 0 0 0 0
II D Non receipt of Annual Report/Abridged Summary
0 0 0 0 0 0 0 0 0 0 0
8
HSBC UNIQUE OPPORTUNITIES FUND
Trustees’ ReportFor the year ended March 31, 2013 (Contd...)
Com-plaintCode
Type of complaint#
(a) No. ofcomplaintspendingat the
beginningof theyear
(b) No. of com-plaints
receivedduring
theyear#
Action on (a) and (b)
Resolved Non Actiona-
ble
Pending
Within 30
days
30 - 60 days
60 - 180 days
Beyond 180 days
0 - 3 months
3 - 6 months
6 - 9 months
9 - 12 months
III A Wrong switch between Schemes
0 0 0 0 0 0 0 0 0 0 0
III B Unauthorized switch between Schemes
0 0 0 0 0 0 0 0 0 0 0
III C Deviation from Scheme attributes
0 0 0 0 0 0 0 0 0 0 0
III D Wrong or excess charges/load
0 0 0 0 0 0 0 0 0 0 0
III E Non updation of changes viz. address, PAN, bank details, nomination, etc
0 18 18 0 0 0 0 0 0 0 0
IV Others 0 14 12 1 1 0 0 0 0 0 0
Total 2 369 347 20 3 0 0 1 0 0 0
Note:
# including against its authorized persons / distributors / employees etc.
8. STATUTORY DETAILSa) The Sponsors are not responsible or liable for any loss resulting from the operation of the Schemes of
the Fund beyond initial contribution of Rs. 1 lakh for setting up the Fund.
b) The price and redemption value of the units, and income from them, can go up as well as down with fl uctuations in the market value of its underlying investments.
c) Full Annual Report shall be disclosed on the website at www.assetmanagement.hsbc.com/in and shall be available for inspection at the Head Offi ce of the mutual fund. Present and prospective unit holder can obtain copy of the trust deed, the full Annual Report of the Scheme(s), the Annual Report of HSBC Asset Management (India) Private Limited and the text of the relevant Scheme(s) at a price.
9. ACKNOWLEDGEMENTSThe Trustees wish to thank the Unit holders of the Schemes for their support throughout the year and also thank the Government of India, the Securities and Exchange Board of India (SEBI), the Reserve Bank of India (RBI) and the Association of Mutual Funds in India (AMFI) for the guidance provided by them. The Trustees also appreciate the service provided by the Registrar and Transfer Agent, Fund Accountant, Custodian, Bankers, Distributors and Brokers. The guidance and services provided by the Auditors and advocates and the ebullience, sincerity and dedication of the employees of HSBC Asset Management (India) Private Limited is also appreciated.
The Trustees look forward to the continued support of everyone.
For and on behalf of the Board of Trustees of HSBC Mutual Fund
Sd/-
Dilip J. Thakkar
Trustee
MUMBAIJuly 16, 2013
9
HSBC UNIQUE OPPORTUNITIES FUND
Independent Auditors’ Report
To the Board of Trustees of
HSBC Mutual Fund
Report on the Financial Statements1. We have audited the accompanying fi nancial statements of HSBC Mutual Fund - HSBC Unique
Opportunities Fund, (the “Scheme”), which comprise the Balance Sheet as at March 31, 2013, and the related Revenue Account and Cash Flow Statement for the year then ended, and a summary of signifi cant accounting policies and other explanatory information, which we have signed under reference to this report.
Trustee’s and Management’s Responsibility for the Financial Statements2. The Board of Trustees of HSBC Mutual Fund (the “Trustee”) and the Management of HSBC Asset
Management (India) Private Limited (the “Management”) are responsible for the preparation of these fi nancial statements that give a true and fair view of the fi nancial position, fi nancial performance and cash fl ows of the Scheme in accordance with the accounting policies and standards specifi ed in the Ninth Schedule of the Securities and Exchange Board of India (Mutual Funds) Regulations, 1996 and amendments thereto (the “Regulations”). This responsibility includes the design, implementation and maintenance of internal control relevant to the preparation and presentation of the fi nancial statements that give a true and fair view and are free from material misstatement, whether due to fraud or error.
Auditors’ Responsibility3. Our responsibility is to express an opinion on these fi nancial statements based on our audit. We conducted
our audit in accordance with the Standards on Auditing issued by the Institute of Chartered Accountants of India. Those Standards require that we comply with ethical requirements and plan and perform the audit to obtain reasonable assurance about whether the fi nancial statements are free from material misstatement.
4. An audit involves performing procedures to obtain audit evidence, about the amounts and disclosures in the fi nancial statements. The procedures selected depend on the auditors’ judgment, including the assessment of the risks of material misstatement of the fi nancial statements, whether due to fraud or error. In making those risk assessments, the auditors consider internal control relevant to the preparation and fair presentation of the fi nancial statements in order to design audit procedures that are appropriate in the circumstances. Our procedures included confi rmation of securities owned and unit capital balances as at March 31, 2013 by correspondence with the custodian/others and registrar and transfer agent, respectively. An audit also includes evaluating the appropriateness of accounting policies used and the reasonableness of the accounting estimates made by the Trustee and the Management, as well as evaluating the overall presentation of the fi nancial statements.
5. We believe that the audit evidence we have obtained is suffi cient and appropriate to provide a basis for our audit opinion.
Opinion6. In our opinion, and to the best of our information and according to the explanations given to us, the
accompanying fi nancial statements give the information required by the Regulations in the manner so required and give a true and fair view in conformity with the accounting principles generally accepted in India:
(a) in the case of the Balance Sheet, of the state of affairs of the Scheme as at March 31, 2013;
(b) in the case of the Revenue Account, of the net surplus for the year ended on that date; and
(c) in the case of the Cash Flow Statement of the cash fl ows for the year ended on that date.
Report on Other Legal and Regulatory Requirement7. As required by section 55(4) of the Regulations, we report that:
(a) We have obtained all the information and explanations which, to the best of our knowledge and belief, were necessary for the purposes of our audit; and

10
HSBC UNIQUE OPPORTUNITIES FUND
Independent Auditors’ Report (Contd...)
(b) In our opinion, the Balance Sheet, Revenue Account and Cash Flow Statement dealt with by this report have been prepared in accordance with the accounting policies and standards specifi ed in the Ninth Schedule of the Regulations.
8. As required by clause 5 (ii)(2) of the Eleventh Schedule to the Regulations, we report that the Balance Sheet, Revenue Account, and Cash Flow Statement dealt with by this Report are in agreement with the books of account of the Scheme.
For PRICE WATERHOUSEFirm Registration Number: 301112EChartered Accountants
Sd/-
Vivek PrasadPartnerMembership Number: 104941
Place : MumbaiDate : July 16, 2013

4
HSBC DYNAMIC FUND
Trustees’ ReportFor the year ended March 31, 2013
The Trustees present the eleventh report and the audited abridged fi nancial statements of the Schemes of HSBC Mutual Fund (the “Fund”), for the year ended March 31, 2013.
1. SCHEME PERFORMANCE, FUTURE OUTLOOK AND OPERATIONS OF THE SCHEMES
a) Operations and Performance of the Schemes
HSBC Dynamic Fund (HDF) - an open-ended Scheme
HDF seeks to provide long term capital appreciation by allocating funds in equity and equity related instruments. It also has the fl exibility to move, entirely if required, into debt instruments in times that the view on equity markets seems negative.
The net assets of HDF amounted to Rs. 132.97 crores as at March 31, 2013 compared to Rs. 75.61 crores as at March 31, 2012. Around 95.35% of the net assets were invested in equities. Around 5.98% was invested in reverse repos/CBLO and (-1.33%) were in net current assets as at March 31, 2013.
HDF has underperformed its benchmark over the period 2012-13 due to the stock selection factor. The scheme allocates dynamically across equity and debt oriented securities.
Date of Inception : 24 September, 2007 Absolute (%) Compounded Annualized (%)
Scheme Name & Benchmarks April ‘12 - March ‘13
April ‘11 - March ‘12
April ‘10 - March ‘11
Since Inception
HSBC Dynamic Fund - Growth 1.59 -8.24 8.77 -0.65
CNX Nifty Index (Standard Benchmark) 6.93 -9.13 10.27 2.24
S&P BSE 200 (Scheme Benchmark) 5.41 -9.55 7.27 1.55
Rs. 10,000, if invested in HDF - Growth, would have become
10,159 9,176 10,877 9,648
Rs. 10,000, if invested in CNX Nifty Index, would have become
10,693 9087 11,027 11,303
Rs. 10,000, if invested in S&P BSE 200, would have become
10,541 9045 10,727 10,889
Returns data as on March 31, 2013. Past performance may or may not be sustained in future. ‘Since Inception’ returns are calculated on Rs. 10 invested at inception. Calculations are based on Growth NAVs.
b) Market Overview & Outlook
EQUITY OUTLOOK
The Sensex returned 8.23% for the FY ended March 2013. While this looks to be a tepid return, the market rallied smoothly for a low of 15965 in June to end at 18835 at the FY end, a return of 17.98%. This was largely due to a series of announcements on reforms by the government and falling crude oil prices, signaling hopes of an economic recovery.
Returns (April 1, 2012 - March 31, 2013) 1 Year (%)
NIFTY 7.31
Sensex 8.23
S&P BSE 100 6.84
S&P BSE 200 6.03
S&P BSE 500 4.81
CNX Midcap -4.02
Source: Bloomberg

5
HSBC DYNAMIC FUND
Trustees’ ReportFor the year ended March 31, 2013 (Contd...)
Our view in respect of key issues facing equity market currently is highlighted as under, based on which we do expect a likely reversal of the prevailing negative sentiment going forward -
� Macro challenge - expect some relief in current account defi cit given likely lower gold imports and crude oil correction. Solution to fi scal defi cit may however need policy decision to reduce subsidy burden on diesel, kerosene, LPG.
� Commodities infl ation expected to decline on account of China slowdown and lower growth in western world. This may have positive impact margin expansion for corporate sector and on currency (INR) and will give room for reducing interest rates over time. Lower cost of capital should hopefully revive capex spending, though gradually (recovery from 2H12).
� Lower interest rates directionally would be the single most important variable for equity markets to rally. This will be driven by lower commodity infl ation and focus back on reviving growth through monetary policy (recent disappointing GDP/IIP numbers support this view).
� Valuations (for large Sensex companies) are attractive at close to 13x forward earnings and in the lower range of historic multiples. A large number of mid-caps available at a signifi cant discount to large cap peer.
� Structural model for India equity investment remains intact for long term returns. These include favourable demography, high savings rate, rising incomes, growing consumption demand growth, existing low penetration, etc.
DEBT OUTLOOK
Fixed Income market in FY 2013 moved towards lower yields on back of 100 bps rate cut and CRR cuts. RBI front loaded the rate cut in April and then followed it up in January 2013 and March 2013. Towards the second half rates stabilized largely as the core infl ation remained within comfort zone.
In the second half of the year expectation of rate cut and series of open market operations led to rally in rates. Government borrowing was lower than budgeted and the spending was also controlled in second half of the year. Towards the end of the year short end rates tightened substantially due to low deposit growth in banking system.
Corporate yield curve remained inverted with short end rates higher than long end rates for the large part of the year due to liquidity tightness.
Expectation is to see continuation of some easing of the rates stance from RBI in FY 14. However, there is a need to focus on key variables in the economy to judge future directions. These are:
� Liquidity: Liquidity will drive short end rates and eventually drive decisions on open market operations as well as CRR cuts.
� Infl ation: Infl ation numbers will determine future course of action for RBI and remains a critical variable for policy. We expect infl ation to ease in fi rst half of FY 14.
� Growth: GDP growth numbers as well as industrial activity will also determine the decision on policy. Weak GDP numbers may continue for couple of quarters.
� Fiscal defi cit: Fiscal defi cit and government spending will determine the government borrowing and crowding out in interest rate curve.
� Current account defi cit / BoP situation: CAD determines how the pressure on currency works and effective management of forex reserves.
� Currency levels: Level of INR will determine how the central banker reacts to the situation on the global crisis etc.

6
HSBC DYNAMIC FUND
Trustees’ ReportFor the year ended March 31, 2013 (Contd...)
2. BRIEF BACKGROUND OF SPONSORS, BOARD OF TRUSTEES AND ASSET MANAGEMENT COMPANY
a) Sponsor HSBC Mutual Fund is sponsored by HSBC Securities and Capital Markets (India) Private Limited (HSCI).
The Sponsor is the Settler of the Mutual Fund Trust. The Sponsor has entrusted a sum of Rs.1,00,000 (Rupees One Lakh only) to the Trustee as the initial contribution towards the corpus of the Mutual Fund.
HSCI offers integrated investment banking services, securities and corporate fi nance & advisory. HSCI is a member of The Bombay Stock Exchange Limited and National Stock Exchange (capital and derivative market segments). HSCI holds 100% of the paid up equity share capital of HSBC Asset Management (India) Private Limited.
b) HSBC Mutual Fund HSBC Mutual Fund (“the Mutual Fund” or “the Fund”) has been constituted as a Trust in accordance with
the provisions of the Indian Trusts Act, 1882 (2 of 1882) vide a Trust Deed dated February 7, 2002 with HSBC Securities and Capital Markets (India) Private Limited, as the Sponsor and the Board of Individual Trustees. The Trustee has entered into an Investment Management Agreement dated February 7, 2002 with HSBC Asset Management (India) Private Limited (AMC) to function as the Investment Manager for all the Schemes of the Fund. The Fund was registered with SEBI vide registration number MF/046/02/5 dated May 27, 2002.
The Trust has been formed for the purpose of pooling of capital from the public for collective investment in securities/any other property for the purpose of providing facilities for participation by persons as benefi ciaries in such properties/investments and in the profi ts/income arising therefrom.
c) Board of Trustees (the Trustees) The Board of Trustees is the exclusive owner of the Trust Fund and holds the same in trust for the benefi t
of the unit holders. The Trustees have been discharging their duties and carrying out the responsibilities as provided in the SEBI (Mutual Funds) Regulations, 1996 and the Trust Deed. The Trustees seek to ensure that the Fund and the Schemes fl oated there under are managed by the AMC in accordance with the Trust Deed, the said Regulations, directions and guidelines issued by the SEBI, the Stock Exchanges, the Association of Mutual Funds in India and other regulatory agencies.
d) Asset Management Company (the AMC) HSBC Asset Management (India) Private Limited (the Investment Manager or the AMC) is a private limited
company incorporated under the Companies Act, 1956 on December 12, 2001 having its Registered Offi ce at 16, V. N. Road, Fort, Mumbai 400 001. HSBC Asset Management (India) Private Limited has been appointed as the Asset Management Company of the HSBC Mutual Fund by the Trustee vide Investment Management Agreement (IMA) dated February 7, 2002 and executed between the Trustees and the AMC. SEBI approved the AMC to act as the Investment Manager of the Fund vide its letter No. MFD/BC/163/2002 dated May 27, 2002. The paid-up equity share capital of the AMC is Rs. 54.2 crores. HSBC Securities and Capital Markets (India) Private Limited holds 100% of the paid up equity share capital of the AMC.
3. INVESTMENT OBJECTIVE OF THE SCHEMESThe investment objective of the respective Schemes has been provided above under the heading “Scheme Performance, Future Outlook and Operation of the Scheme” (Refer Section 1).
4. SIGNIFICANT ACCOUNTING POLICIESThe accounting policies are in accordance with Securities Exchange Board of India (Mutual Funds) Regulations 1996.

7
HSBC DYNAMIC FUND
Trustees’ ReportFor the year ended March 31, 2013 (Contd...)
5. UNCLAIMED DIVIDENDS & REDEMPTIONSSummary of number of Investors & corresponding amount Scheme-wise as on March 31, 2013
SchemeUnclaimed Dividends Unclaimed Redemptions
Amount (Rs.)
No. of Investors
Amount (Rs.)
No. of Investors
HSBC Dynamic Fund – – 3,182,136.75 80
6. INVESTOR SERVICESThe number of offi cial points of acceptance of transactions is 197 locations. In addition to the offi ces of the Registrar & Transfer agents, the AMC has Investor Service Centres in 4 locations at its own offi ces - namely Mumbai, New Delhi, Kolkata and Chennai. With a view to enhance customer convenience, the AMC has extended the facility of priority based servicing to key distributors through the enhancement of the Interactive Voice Reponses. Call Centre number has now been converted to a single Toll Free number which can be dialed from anywhere in India. The call Centre service is being managed by the Registrar and Transfer Agents. The AMC continues to retain the outsourced back offi ce services with HOPE.
On the distribution front, the number of empanelled distributors was 2471 as on 31 March 2013. During the year, the AMC initiated tie-ups for online distribution of the Mutual Fund’s Schemes with several channel partners taking the total number of such tie-ups to 45.
7. DETAILS OF INVESTOR GRIEVANCE REDRESSALThe details of the redressal of investor complaints received against HSBC Mutual Fund during April 2012- March 2013 are as follows:
Total Number of Folios: 261694
Com-plaintCode
Type of complaint#
(a) No. ofcomplaintspendingat the
beginningof theyear
(b) No. of com-plaints
receivedduring
theyear#
Action on (a) and (b)
Resolved Non Actiona-
ble
Pending
Within 30
days
30 - 60 days
60 - 180 days
Beyond 180 days
0 - 3 months
3 - 6 months
6 - 9 months
9 - 12 months
I A Non receipt of Dividend on Units
0 3 3 0 0 0 0 0 0 0 0
I B Interest on delayed payment of Dividend
0 0 0 0 0 0 0 0 0 0 0
I C Non receipt of Redemption Proceeds
2 40 22 18 2 0 0 0 0 0 0
I D Interest on delayed payment of Redemption
0 2 1 1 0 0 0 0 0 0 0
II A Non receipt of Statement of Account/Unit Certifi cate
0 9 9 0 0 0 0 0 0 0 0
II B Discrepancy in Statement of Account
0 6 5 0 0 0 0 1 0 0 0
II C Data corrections in Investor details
0 277 277 0 0 0 0 0 0 0 0
II D Non receipt of Annual Report/Abridged Summary
0 0 0 0 0 0 0 0 0 0 0
8
HSBC DYNAMIC FUND
Trustees’ ReportFor the year ended March 31, 2013 (Contd...)
Com-plaintCode
Type of complaint#
(a) No. ofcomplaintspendingat the
beginningof theyear
(b) No. of com-plaints
receivedduring
theyear#
Action on (a) and (b)
Resolved Non Actiona-
ble
Pending
Within 30
days
30 - 60 days
60 - 180 days
Beyond 180 days
0 - 3 months
3 - 6 months
6 - 9 months
9 - 12 months
III A Wrong switch between Schemes
0 0 0 0 0 0 0 0 0 0 0
III B Unauthorized switch between Schemes
0 0 0 0 0 0 0 0 0 0 0
III C Deviation from Scheme attributes
0 0 0 0 0 0 0 0 0 0 0
III D Wrong or excess charges/load
0 0 0 0 0 0 0 0 0 0 0
III E Non updation of changes viz. address, PAN, bank details, nomination, etc
0 18 18 0 0 0 0 0 0 0 0
IV Others 0 14 12 1 1 0 0 0 0 0 0
Total 2 369 347 20 3 0 0 1 0 0 0
Note:
# including against its authorized persons / distributors / employees etc.
8. STATUTORY DETAILSa) The Sponsors are not responsible or liable for any loss resulting from the operation of the Schemes of
the Fund beyond initial contribution of Rs. 1 lakh for setting up the Fund.
b) The price and redemption value of the units, and income from them, can go up as well as down with fl uctuations in the market value of its underlying investments.
c) Full Annual Report shall be disclosed on the website at www.assetmanagement.hsbc.com/in and shall be available for inspection at the Head Offi ce of the mutual fund. Present and prospective unit holder can obtain copy of the trust deed, the full Annual Report of the Scheme(s), the Annual Report of HSBC Asset Management (India) Private Limited and the text of the relevant Scheme(s) at a price.
9. ACKNOWLEDGEMENTSThe Trustees wish to thank the Unit holders of the Schemes for their support throughout the year and also thank the Government of India, the Securities and Exchange Board of India (SEBI), the Reserve Bank of India (RBI) and the Association of Mutual Funds in India (AMFI) for the guidance provided by them. The Trustees also appreciate the service provided by the Registrar and Transfer Agent, Fund Accountant, Custodian, Bankers, Distributors and Brokers. The guidance and services provided by the Auditors and advocates and the ebullience, sincerity and dedication of the employees of HSBC Asset Management (India) Private Limited is also appreciated.
The Trustees look forward to the continued support of everyone.
For and on behalf of the Board of Trustees of HSBC Mutual Fund
Sd/-
Dilip J. Thakkar
Trustee
MUMBAIJuly 16, 2013

9
HSBC DYNAMIC FUND
To the Board of Trustees of
HSBC Mutual Fund
Report on the Financial Statements1. We have audited the accompanying fi nancial statements of HSBC Mutual Fund - HSBC Dynamic Fund
(the “Scheme”), which comprise the Balance Sheet as at March 31, 2013, and the related Revenue Account for the year then ended, and a summary of signifi cant accounting policies and other explanatory information, which we have signed under reference to this report.
Trustee’s and Management’s Responsibility for the Financial Statements2. The Board of Trustees of HSBC Mutual Fund (the “Trustee”) and the Management of HSBC Asset
Management (India) Private Limited (the “Management”) are responsible for the preparation of these fi nancial statements that give a true and fair view of the fi nancial position and fi nancial performance of the Scheme in accordance with the accounting policies and standards specifi ed in the Ninth Schedule of the Securities and Exchange Board of India (Mutual Funds) Regulations, 1996 and amendments thereto (the “Regulations”). This responsibility includes the design, implementation and maintenance of internal control relevant to the preparation and presentation of the fi nancial statements that give a true and fair view and are free from material misstatement, whether due to fraud or error.
Auditors’ Responsibility3. Our responsibility is to express an opinion on these fi nancial statements based on our audit. We conducted
our audit in accordance with the Standards on Auditing issued by the Institute of Chartered Accountants of India. Those Standards require that we comply with ethical requirements and plan and perform the audit to obtain reasonable assurance about whether the fi nancial statements are free from material misstatement.
4. An audit involves performing procedures to obtain audit evidence, about the amounts and disclosures in the fi nancial statements. The procedures selected depend on the auditors’ judgment, including the assessment of the risks of material misstatement of the fi nancial statements, whether due to fraud or error. In making those risk assessments, the auditors consider internal control relevant to the preparation and fair presentation of the fi nancial statements in order to design audit procedures that are appropriate in the circumstances. Our procedures included confi rmation of securities owned and unit capital balances as at March 31, 2013 by correspondence with the custodian/others and registrar and transfer agent, respectively. An audit also includes evaluating the appropriateness of accounting policies used and the reasonableness of the accounting estimates made by the Trustee and the Management, as well as evaluating the overall presentation of the fi nancial statements.
5. We believe that the audit evidence we have obtained is suffi cient and appropriate to provide a basis for our audit opinion.
Opinion6. In our opinion, and to the best of our information and according to the explanations given to us, the
accompanying fi nancial statements give the information required by the Regulations in the manner so required and give a true and fair view in conformity with the accounting principles generally accepted in India:
(a) in the case of the Balance Sheet, of the state of affairs of the Scheme as at March 31, 2013; and
(b) in the case of the Revenue Account, of the net surplus for the year ended on that date.
Report on Other Legal and Regulatory Requirement7. As required by section 55(4) of the Regulations, we report that:
(a) We have obtained all the information and explanations which, to the best of our knowledge and belief, were necessary for the purposes of our audit; and
Independent Auditors’ Report
10
HSBC DYNAMIC FUND
Independent Auditors’ Report (Contd...)
(b) In our opinion, the Balance Sheet and Revenue Account, dealt with by this report have been prepared in accordance with the accounting policies and standards specifi ed in the Ninth Schedule of the Regulations.
8. As required by clause 5 (ii)(2) of the Eleventh Schedule to the Regulations, we report that the Balance Sheet and Revenue Account, dealt with by this Report are in agreement with the books of account of the Scheme.
For PRICE WATERHOUSEFirm Registration Number: 301112EChartered Accountants
Sd/-
Vivek PrasadPartnerMembership Number: 104941
Place : MumbaiDate : July 16, 2013

4
HSBC TAX SAVER EQUITY FUND
Trustees’ ReportFor the year ended March 31, 2013
The Trustees present the eleventh report and the audited abridged fi nancial statements of the Schemes of HSBC Mutual Fund (the “Fund”), for the year ended March 31, 2013.
1. SCHEME PERFORMANCE, FUTURE OUTLOOK AND OPERATIONS OF THE SCHEMES
a) Operations and Performance of the Schemes
HSBC Tax Saver Equity Fund (HTSF) - an open ended Equity linked Savings Scheme
HTSF seeks to provide long term capital appreciation by investing in a diversifi ed portfolio of equity & equity related instruments of companies across various sectors and industries, with no capitalisation bias. The Fund may also invest in fi xed income securities.
The net assets of HTSF amounted to Rs. 183.75 crores as at March 31, 2013 compared to Rs.208.31 crores as at March 31, 2012. Around 97.40 % of the net assets were invested in equities, 0.70% of the net assets were invested in reverse repos/CBLO and 1.90% was in the net current assets as at March 31, 2013.
HTSF outperformed most of the time frames especially during the period 2012-13 against its benchmark on account of reasonable stock selection and the approach of creating a stable and quality portfolio which can do well in different market conditions.
Date of Inception : 05 January, 2007 Absolute (%) Compounded Annualized (%)
Scheme Name & Benchmarks April ‘12 - March ‘13
April ‘11 - March ‘12
April ‘10 - March ‘11
Since Inception
HSBC Tax Saver Equity Fund - Growth 11.90 -4.42 4.41 7.00
CNX Nifty Index (Standard Benchmark) 6.93 -9.13 10.27 5.53
S&P BSE 200 (Scheme Benchmark) 5.41 -9.55 7.27 4.99
Rs. 10,000, if invested in HTSF - Growth, would have become
11,190 9,558 10,441 15,263
Rs. 10,000, if invested in CNX Nifty Index, would have become
10,693 9087 11,027 13,995
Rs. 10,000, if invested in S&P BSE 200, would have become
10,541 9045 10,727 13,556
Returns data as on March 31, 2013. Past performance may or may not be sustained in future. ‘Since Inception’ returns are calculated on Rs. 10 invested at inception. Calculations are based on Growth NAVs.
b) Market Overview & Outlook
EQUITY OUTLOOK
The Sensex returned 8.23% for the FY ended March 2013. While this looks to be a tepid return, the market rallied smoothly for a low of 15965 in June to end at 18835 at the FY end, a return of 17.98%. This was largely due to a series of announcements on reforms by the government and falling crude oil prices, signaling hopes of an economic recovery.
Returns (April 1, 2012 - March 31, 2013) 1 Year (%)
NIFTY 7.31
Sensex 8.23
S&P BSE 100 6.84
S&P BSE 200 6.03
S&P BSE 500 4.81
CNX Midcap -4.02
Source: Bloomberg

5
HSBC TAX SAVER EQUITY FUND
Trustees’ ReportFor the year ended March 31, 2013 (Contd...)
Our view in respect of key issues facing equity market currently is highlighted as under, based on which we do expect a likely reversal of the prevailing negative sentiment going forward -
� Macro challenge - expect some relief in current account defi cit given likely lower gold imports and crude oil correction. Solution to fi scal defi cit may however need policy decision to reduce subsidy burden on diesel, kerosene, LPG.
� Commodities infl ation expected to decline on account of China slowdown and lower growth in western world. This may have positive impact margin expansion for corporate sector and on currency (INR) and will give room for reducing interest rates over time. Lower cost of capital should hopefully revive capex spending, though gradually (recovery from 2H12).
� Lower interest rates directionally would be the single most important variable for equity markets to rally. This will be driven by lower commodity infl ation and focus back on reviving growth through monetary policy (recent disappointing GDP/IIP numbers support this view).
� Valuations (for large Sensex companies) are attractive at close to 13x forward earnings and in the lower range of historic multiples. A large number of mid-caps available at a signifi cant discount to large cap peer.
� Structural model for India equity investment remains intact for long term returns. These include favourable demography, high savings rate, rising incomes, growing consumption demand growth, existing low penetration, etc.
DEBT OUTLOOK
Fixed Income market in FY 2013 moved towards lower yields on back of 100 bps rate cut and CRR cuts. RBI front loaded the rate cut in April and then followed it up in January 2013 and March 2013. Towards the second half rates stabilized largely as the core infl ation remained within comfort zone.
In the second half of the year expectation of rate cut and series of open market operations led to rally in rates. Government borrowing was lower than budgeted and the spending was also controlled in second half of the year. Towards the end of the year short end rates tightened substantially due to low deposit growth in banking system.
Corporate yield curve remained inverted with short end rates higher than long end rates for the large part of the year due to liquidity tightness.
Expectation is to see continuation of some easing of the rates stance from RBI in FY 14. However, there is a need to focus on key variables in the economy to judge future directions. These are:
� Liquidity: Liquidity will drive short end rates and eventually drive decisions on open market operations as well as CRR cuts.
� Infl ation: Infl ation numbers will determine future course of action for RBI and remains a critical variable for policy. We expect infl ation to ease in fi rst half of FY 14.
� Growth: GDP growth numbers as well as industrial activity will also determine the decision on policy. Weak GDP numbers may continue for couple of quarters.
� Fiscal defi cit: Fiscal defi cit and government spending will determine the government borrowing and crowding out in interest rate curve.
� Current account defi cit / BoP situation: CAD determines how the pressure on currency works and effective management of forex reserves
� Currency levels: Level of INR will determine how the central banker reacts to the situation on the global crisis etc.

6
HSBC TAX SAVER EQUITY FUND
Trustees’ ReportFor the year ended March 31, 2013 (Contd...)
2. BRIEF BACKGROUND OF SPONSORS, BOARD OF TRUSTEES AND ASSET MANAGEMENT COMPANY
a) Sponsor HSBC Mutual Fund is sponsored by HSBC Securities and Capital Markets (India) Private Limited (HSCI).
The Sponsor is the Settler of the Mutual Fund Trust. The Sponsor has entrusted a sum of Rs.1,00,000 (Rupees One Lakh only) to the Trustee as the initial contribution towards the corpus of the Mutual Fund.
HSCI offers integrated investment banking services, securities and corporate fi nance & advisory. HSCI is a member of The Bombay Stock Exchange Limited and National Stock Exchange (capital and derivative market segments). HSCI holds 100% of the paid up equity share capital of HSBC Asset Management (India) Private Limited.
b) HSBC Mutual Fund HSBC Mutual Fund (“the Mutual Fund” or “the Fund”) has been constituted as a Trust in accordance with
the provisions of the Indian Trusts Act, 1882 (2 of 1882) vide a Trust Deed dated February 7, 2002 with HSBC Securities and Capital Markets (India) Private Limited, as the Sponsor and the Board of Individual Trustees. The Trustee has entered into an Investment Management Agreement dated February 7, 2002 with HSBC Asset Management (India) Private Limited (AMC) to function as the Investment Manager for all the Schemes of the Fund. The Fund was registered with SEBI vide registration number MF/046/02/5 dated May 27, 2002.
The Trust has been formed for the purpose of pooling of capital from the public for collective investment in securities/any other property for the purpose of providing facilities for participation by persons as benefi ciaries in such properties/investments and in the profi ts/income arising therefrom.
c) Board of Trustees (the Trustees) The Board of Trustees is the exclusive owner of the Trust Fund and holds the same in trust for the benefi t
of the unit holders. The Trustees have been discharging their duties and carrying out the responsibilities as provided in the SEBI (Mutual Funds) Regulations, 1996 and the Trust Deed. The Trustees seek to ensure that the Fund and the Schemes fl oated there under are managed by the AMC in accordance with the Trust Deed, the said Regulations, directions and guidelines issued by the SEBI, the Stock Exchanges, the Association of Mutual Funds in India and other regulatory agencies.
d) Asset Management Company (the AMC) HSBC Asset Management (India) Private Limited (the Investment Manager or the AMC) is a private limited
company incorporated under the Companies Act, 1956 on December 12, 2001 having its Registered Offi ce at 16, V. N. Road, Fort, Mumbai 400 001. HSBC Asset Management (India) Private Limited has been appointed as the Asset Management Company of the HSBC Mutual Fund by the Trustee vide Investment Management Agreement (IMA) dated February 7, 2002 and executed between the Trustees and the AMC. SEBI approved the AMC to act as the Investment Manager of the Fund vide its letter No. MFD/BC/163/2002 dated May 27, 2002. The paid-up equity share capital of the AMC is Rs. 54.2 crores. HSBC Securities and Capital Markets (India) Private Limited holds 100% of the paid up equity share capital of the AMC.
3. INVESTMENT OBJECTIVE OF THE SCHEMESThe investment objective of the respective Schemes has been provided above under the heading “Scheme Performance, Future Outlook and Operation of the Scheme” (Refer Section 1).
4. SIGNIFICANT ACCOUNTING POLICIESThe accounting policies are in accordance with Securities Exchange Board of India (Mutual Funds) Regulations 1996.
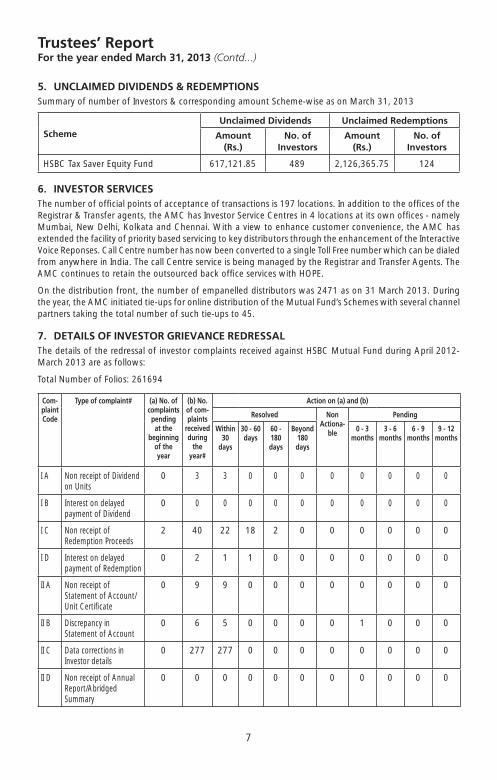
7
HSBC TAX SAVER EQUITY FUND
Trustees’ ReportFor the year ended March 31, 2013 (Contd...)
5. UNCLAIMED DIVIDENDS & REDEMPTIONSSummary of number of Investors & corresponding amount Scheme-wise as on March 31, 2013
SchemeUnclaimed Dividends Unclaimed Redemptions
Amount (Rs.)
No. of Investors
Amount (Rs.)
No. of Investors
HSBC Tax Saver Equity Fund 617,121.85 489 2,126,365.75 124
6. INVESTOR SERVICESThe number of offi cial points of acceptance of transactions is 197 locations. In addition to the offi ces of the Registrar & Transfer agents, the AMC has Investor Service Centres in 4 locations at its own offi ces - namely Mumbai, New Delhi, Kolkata and Chennai. With a view to enhance customer convenience, the AMC has extended the facility of priority based servicing to key distributors through the enhancement of the Interactive Voice Reponses. Call Centre number has now been converted to a single Toll Free number which can be dialed from anywhere in India. The call Centre service is being managed by the Registrar and Transfer Agents. The AMC continues to retain the outsourced back offi ce services with HOPE.
On the distribution front, the number of empanelled distributors was 2471 as on 31 March 2013. During the year, the AMC initiated tie-ups for online distribution of the Mutual Fund’s Schemes with several channel partners taking the total number of such tie-ups to 45.
7. DETAILS OF INVESTOR GRIEVANCE REDRESSALThe details of the redressal of investor complaints received against HSBC Mutual Fund during April 2012- March 2013 are as follows:
Total Number of Folios: 261694
Com-plaintCode
Type of complaint#
(a) No. ofcomplaintspendingat the
beginningof theyear
(b) No. of com-plaints
receivedduring
theyear#
Action on (a) and (b)
Resolved Non Actiona-
ble
Pending
Within 30
days
30 - 60 days
60 - 180 days
Beyond 180 days
0 - 3 months
3 - 6 months
6 - 9 months
9 - 12 months
I A Non receipt of Dividend on Units
0 3 3 0 0 0 0 0 0 0 0
I B Interest on delayed payment of Dividend
0 0 0 0 0 0 0 0 0 0 0
I C Non receipt of Redemption Proceeds
2 40 22 18 2 0 0 0 0 0 0
I D Interest on delayed payment of Redemption
0 2 1 1 0 0 0 0 0 0 0
II A Non receipt of Statement of Account/Unit Certifi cate
0 9 9 0 0 0 0 0 0 0 0
II B Discrepancy in Statement of Account
0 6 5 0 0 0 0 1 0 0 0
II C Data corrections in Investor details
0 277 277 0 0 0 0 0 0 0 0
II D Non receipt of Annual Report/Abridged Summary
0 0 0 0 0 0 0 0 0 0 0

8
HSBC TAX SAVER EQUITY FUND
Trustees’ ReportFor the year ended March 31, 2013 (Contd...)
Com-plaintCode
Type of complaint#
(a) No. ofcomplaintspendingat the
beginningof theyear
(b) No. of com-plaints
receivedduring
theyear#
Action on (a) and (b)
Resolved Non Actiona-
ble
Pending
Within 30
days
30 - 60 days
60 - 180 days
Beyond 180 days
0 - 3 months
3 - 6 months
6 - 9 months
9 - 12 months
III A Wrong switch between Schemes
0 0 0 0 0 0 0 0 0 0 0
III B Unauthorized switch between Schemes
0 0 0 0 0 0 0 0 0 0 0
III C Deviation from Scheme attributes
0 0 0 0 0 0 0 0 0 0 0
III D Wrong or excess charges/load
0 0 0 0 0 0 0 0 0 0 0
III E Non updation of changes viz. address, PAN, bank details, nomination, etc
0 18 18 0 0 0 0 0 0 0 0
IV Others 0 14 12 1 1 0 0 0 0 0 0
Total 2 369 347 20 3 0 0 1 0 0 0
Note:
# including against its authorized persons / distributors / employees etc.
8. STATUTORY DETAILSa) The Sponsors are not responsible or liable for any loss resulting from the operation of the Schemes of
the Fund beyond initial contribution of Rs. 1 lakh for setting up the Fund.
b) The price and redemption value of the units, and income from them, can go up as well as down with fl uctuations in the market value of its underlying investments.
c) Full Annual Report shall be disclosed on the website at www.assetmanagement.hsbc.com/in and shall be available for inspection at the Head Offi ce of the mutual fund. Present and prospective unit holder can obtain copy of the trust deed, the full Annual Report of the Scheme(s), the Annual Report of HSBC Asset Management (India) Private Limited and the text of the relevant Scheme(s) at a price.
9. ACKNOWLEDGEMENTSThe Trustees wish to thank the Unit holders of the Schemes for their support throughout the year and also thank the Government of India, the Securities and Exchange Board of India (SEBI), the Reserve Bank of India (RBI) and the Association of Mutual Funds in India (AMFI) for the guidance provided by them. The Trustees also appreciate the service provided by the Registrar and Transfer Agent, Fund Accountant, Custodian, Bankers, Distributors and Brokers. The guidance and services provided by the Auditors and advocates and the ebullience, sincerity and dedication of the employees of HSBC Asset Management (India) Private Limited is also appreciated.
The Trustees look forward to the continued support of everyone.
For and on behalf of the Board of Trustees of HSBC Mutual Fund
Sd/-
Dilip J. Thakkar
Trustee
MUMBAIJuly 16, 2013
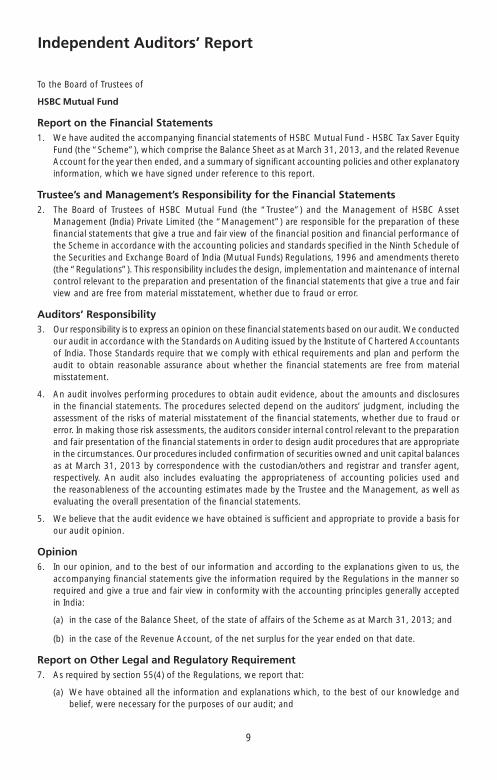
9
HSBC TAX SAVER EQUITY FUND
To the Board of Trustees of
HSBC Mutual Fund
Report on the Financial Statements1. We have audited the accompanying fi nancial statements of HSBC Mutual Fund - HSBC Tax Saver Equity
Fund (the “Scheme”), which comprise the Balance Sheet as at March 31, 2013, and the related Revenue Account for the year then ended, and a summary of signifi cant accounting policies and other explanatory information, which we have signed under reference to this report.
Trustee’s and Management’s Responsibility for the Financial Statements2. The Board of Trustees of HSBC Mutual Fund (the “Trustee”) and the Management of HSBC Asset
Management (India) Private Limited (the “Management”) are responsible for the preparation of these fi nancial statements that give a true and fair view of the fi nancial position and fi nancial performance of the Scheme in accordance with the accounting policies and standards specifi ed in the Ninth Schedule of the Securities and Exchange Board of India (Mutual Funds) Regulations, 1996 and amendments thereto (the “Regulations”). This responsibility includes the design, implementation and maintenance of internal control relevant to the preparation and presentation of the fi nancial statements that give a true and fair view and are free from material misstatement, whether due to fraud or error.
Auditors’ Responsibility3. Our responsibility is to express an opinion on these fi nancial statements based on our audit. We conducted
our audit in accordance with the Standards on Auditing issued by the Institute of Chartered Accountants of India. Those Standards require that we comply with ethical requirements and plan and perform the audit to obtain reasonable assurance about whether the fi nancial statements are free from material misstatement.
4. An audit involves performing procedures to obtain audit evidence, about the amounts and disclosures in the fi nancial statements. The procedures selected depend on the auditors’ judgment, including the assessment of the risks of material misstatement of the fi nancial statements, whether due to fraud or error. In making those risk assessments, the auditors consider internal control relevant to the preparation and fair presentation of the fi nancial statements in order to design audit procedures that are appropriate in the circumstances. Our procedures included confi rmation of securities owned and unit capital balances as at March 31, 2013 by correspondence with the custodian/others and registrar and transfer agent, respectively. An audit also includes evaluating the appropriateness of accounting policies used and the reasonableness of the accounting estimates made by the Trustee and the Management, as well as evaluating the overall presentation of the fi nancial statements.
5. We believe that the audit evidence we have obtained is suffi cient and appropriate to provide a basis for our audit opinion.
Opinion6. In our opinion, and to the best of our information and according to the explanations given to us, the
accompanying fi nancial statements give the information required by the Regulations in the manner so required and give a true and fair view in conformity with the accounting principles generally accepted in India:
(a) in the case of the Balance Sheet, of the state of affairs of the Scheme as at March 31, 2013; and
(b) in the case of the Revenue Account, of the net surplus for the year ended on that date.
Report on Other Legal and Regulatory Requirement7. As required by section 55(4) of the Regulations, we report that:
(a) We have obtained all the information and explanations which, to the best of our knowledge and belief, were necessary for the purposes of our audit; and
Independent Auditors’ Report
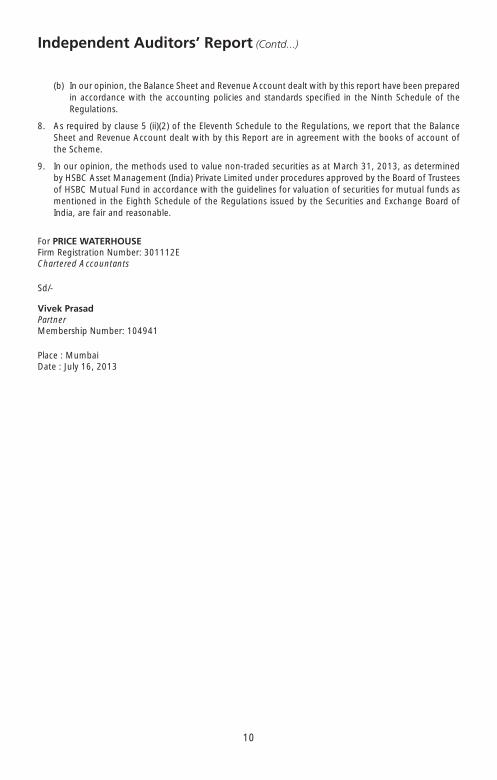
10
HSBC TAX SAVER EQUITY FUND
Independent Auditors’ Report (Contd...)
(b) In our opinion, the Balance Sheet and Revenue Account dealt with by this report have been prepared in accordance with the accounting policies and standards specifi ed in the Ninth Schedule of the Regulations.
8. As required by clause 5 (ii)(2) of the Eleventh Schedule to the Regulations, we report that the Balance Sheet and Revenue Account dealt with by this Report are in agreement with the books of account of the Scheme.
9. In our opinion, the methods used to value non-traded securities as at March 31, 2013, as determined by HSBC Asset Management (India) Private Limited under procedures approved by the Board of Trustees of HSBC Mutual Fund in accordance with the guidelines for valuation of securities for mutual funds as mentioned in the Eighth Schedule of the Regulations issued by the Securities and Exchange Board of India, are fair and reasonable.
For PRICE WATERHOUSEFirm Registration Number: 301112EChartered Accountants
Sd/-
Vivek PrasadPartnerMembership Number: 104941
Place : MumbaiDate : July 16, 2013
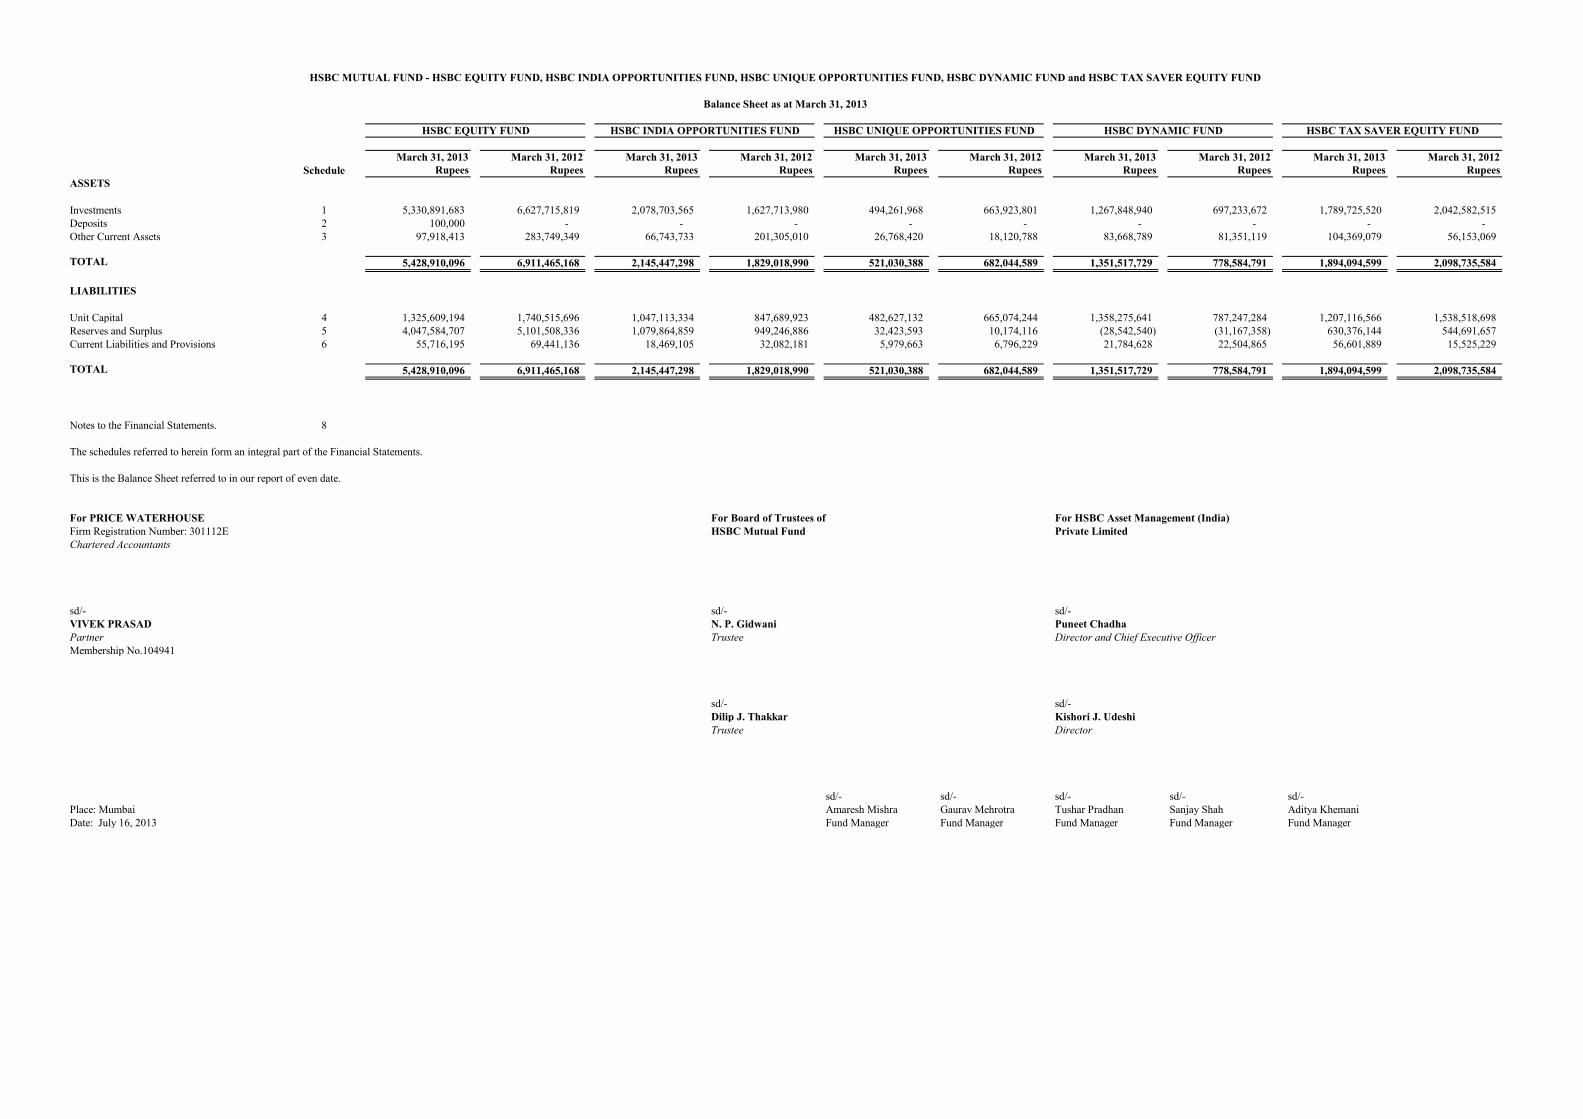
March 31, 2013 March 31, 2012 March 31, 2013 March 31, 2012 March 31, 2013 March 31, 2012 March 31, 2013 March 31, 2012 March 31, 2013 March 31, 2012Schedule Rupees Rupees Rupees Rupees Rupees Rupees Rupees Rupees Rupees Rupees
ASSETS
Investments 1 5,330,891,683 6,627,715,819 2,078,703,565 1,627,713,980 494,261,968 663,923,801 1,267,848,940 697,233,672 1,789,725,520 2,042,582,515 Deposits 2 100,000 - - - - - - - - - Other Current Assets 3 97,918,413 283,749,349 66,743,733 201,305,010 26,768,420 18,120,788 83,668,789 81,351,119 104,369,079 56,153,069
TOTAL 5,428,910,096 6,911,465,168 2,145,447,298 1,829,018,990 521,030,388 682,044,589 1,351,517,729 778,584,791 1,894,094,599 2,098,735,584
LIABILITIES
Unit Capital 4 1,325,609,194 1,740,515,696 1,047,113,334 847,689,923 482,627,132 665,074,244 1,358,275,641 787,247,284 1,207,116,566 1,538,518,698 Reserves and Surplus 5 4,047,584,707 5,101,508,336 1,079,864,859 949,246,886 32,423,593 10,174,116 (28,542,540) (31,167,358) 630,376,144 544,691,657 Current Liabilities and Provisions 6 55,716,195 69,441,136 18,469,105 32,082,181 5,979,663 6,796,229 21,784,628 22,504,865 56,601,889 15,525,229
TOTAL 5,428,910,096 6,911,465,168 2,145,447,298 1,829,018,990 521,030,388 682,044,589 1,351,517,729 778,584,791 1,894,094,599 2,098,735,584
(0) -0.29 0.48 -0.50 -0.655,373,193,901 2,126,978,193 515,050,725 1,329,733,101 1,837,492,710
Notes to the Financial Statements. 8 5,373,193,901 2,126,978,193 515,050,725 1,329,733,101 1,837,492,710 0.00 0.00 0.00 0.00 0.00
The schedules referred to herein form an integral part of the Financial Statements.
This is the Balance Sheet referred to in our report of even date.
For PRICE WATERHOUSE For Board of Trustees of For HSBC Asset Management (India)Firm Registration Number: 301112E HSBC Mutual Fund Private LimitedChartered Accountants
sd/- sd/- sd/-VIVEK PRASAD N. P. Gidwani Puneet ChadhaPartner Trustee Director and Chief Executive OfficerMembership No.104941
sd/- sd/-Dilip J. Thakkar Kishori J. UdeshiTrustee Director
sd/- sd/- sd/- sd/- sd/-Place: Mumbai Amaresh Mishra Gaurav Mehrotra Tushar Pradhan Sanjay Shah Aditya KhemaniDate: July 16, 2013 Fund Manager Fund Manager Fund Manager Fund Manager Fund Manager
HSBC MUTUAL FUND - HSBC EQUITY FUND, HSBC INDIA OPPORTUNITIES FUND, HSBC UNIQUE OPPORTUNITIES FUND, HSBC DYNAMIC FUND and HSBC TAX SAVER EQUITY FUND
Balance Sheet as at March 31, 2013
HSBC TAX SAVER EQUITY FUNDHSBC DYNAMIC FUNDHSBC EQUITY FUND HSBC INDIA OPPORTUNITIES FUND HSBC UNIQUE OPPORTUNITIES FUND
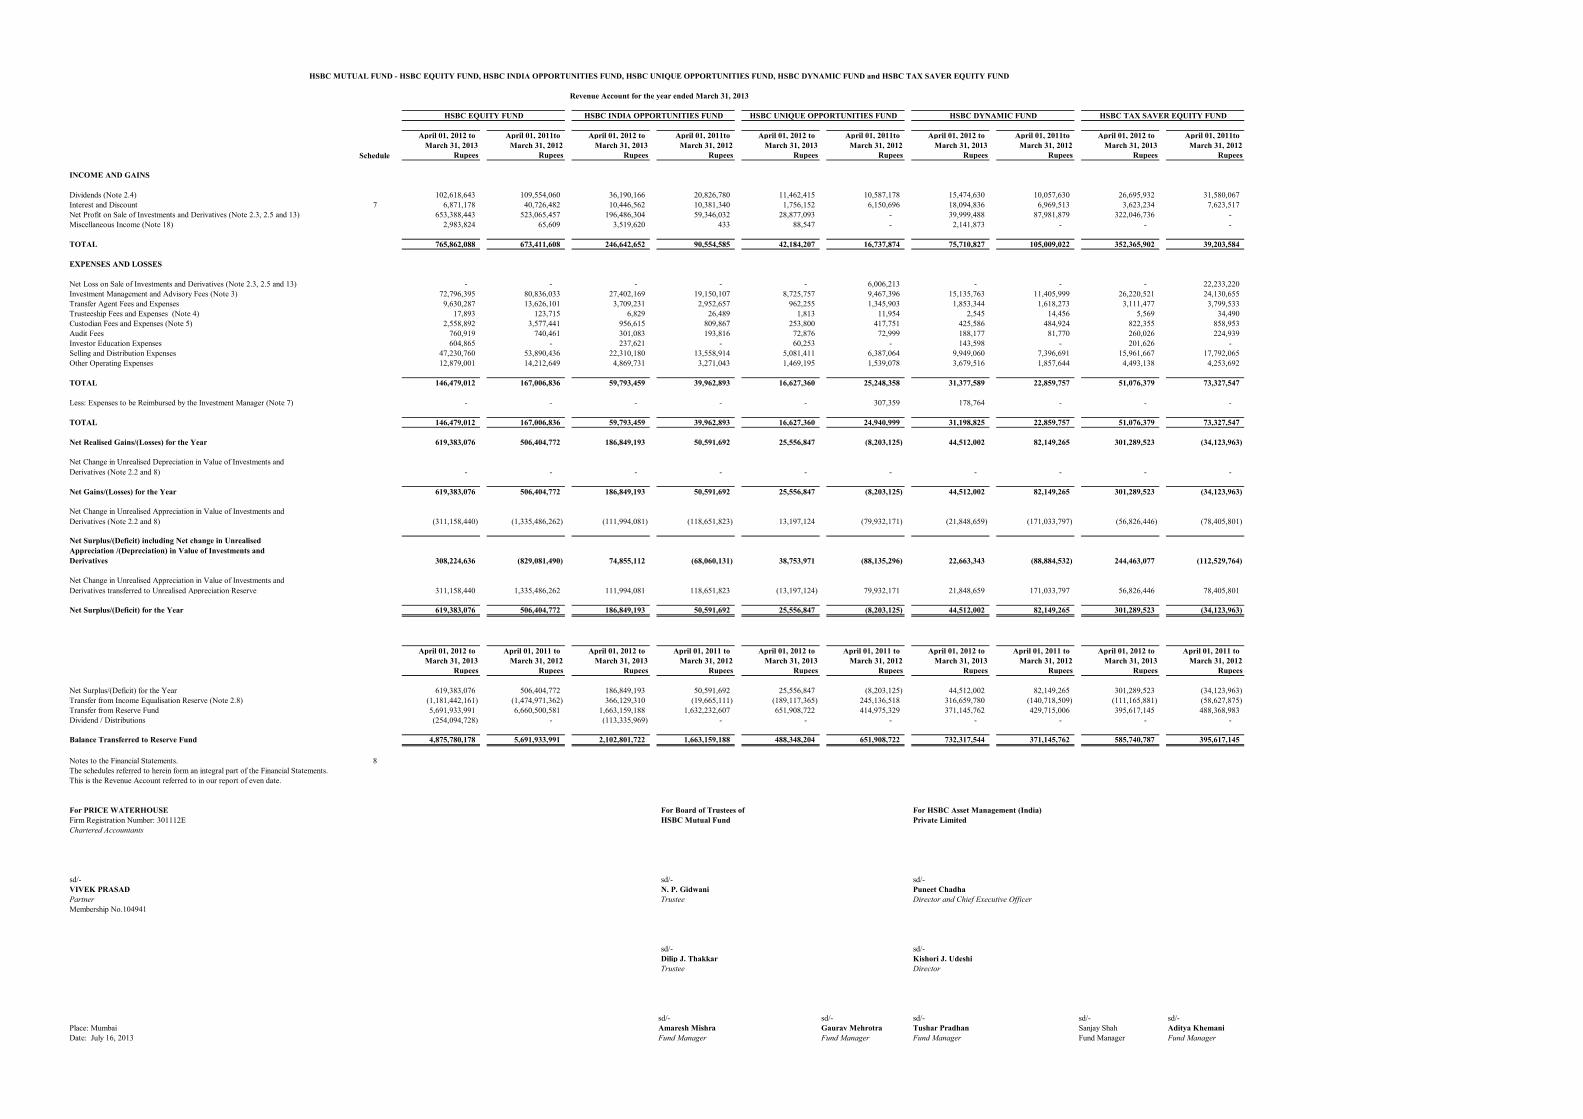
H27333 H32871 H44485 H47404 H43684
April 01, 2012 to April 01, 2011to April 01, 2012 to April 01, 2011to April 01, 2012 to April 01, 2011to April 01, 2012 to April 01, 2011to April 01, 2012 to April 01, 2011toMarch 31, 2013 March 31, 2012 March 31, 2013 March 31, 2012 March 31, 2013 March 31, 2012 March 31, 2013 March 31, 2012 March 31, 2013 March 31, 2012
Schedule Rupees Rupees Rupees Rupees Rupees Rupees Rupees Rupees Rupees Rupees
INCOME AND GAINS
Dividends (Note 2.4) 102,618,643 109,554,060 36,190,166 20,826,780 11,462,415 10,587,178 15,474,630 10,057,630 26,695,932 31,580,067 Interest and Discount 7 6,871,178 40,726,482 10,446,562 10,381,340 1,756,152 6,150,696 18,094,836 6,969,513 3,623,234 7,623,517 Net Profit on Sale of Investments and Derivatives (Note 2.3, 2.5 and 13) 653,388,443 523,065,457 196,486,304 59,346,032 28,877,093 - 39,999,488 87,981,879 322,046,736 - Miscellaneous Income (Note 18) 2,983,824 65,609 3,519,620 433 88,547 - 2,141,873 - - -
TOTAL 765,862,088 673,411,608 246,642,652 90,554,585 42,184,207 16,737,874 75,710,827 105,009,022 352,365,902 39,203,584
EXPENSES AND LOSSES
Net Loss on Sale of Investments and Derivatives (Note 2.3, 2.5 and 13) - - - - - 6,006,213 - - - 22,233,220 Investment Management and Advisory Fees (Note 3) 72,796,395 80,836,033 27,402,169 19,150,107 8,725,757 9,467,396 15,135,763 11,405,999 26,220,521 24,130,655 Transfer Agent Fees and Expenses 9,630,287 13,626,101 3,709,231 2,952,657 962,255 1,345,903 1,853,344 1,618,273 3,111,477 3,799,533 Trusteeship Fees and Expenses (Note 4) 17,893 123,715 6,829 26,489 1,813 11,954 2,545 14,456 5,569 34,490 Custodian Fees and Expenses (Note 5) 2,558,892 3,577,441 956,615 809,867 253,800 417,751 425,586 484,924 822,355 858,953 Audit Fees 760,919 740,461 301,083 193,816 72,876 72,999 188,177 81,770 260,026 224,939 Investor Education Expenses 604,865 - 237,621 - 60,253 - 143,598 - 201,626 - Selling and Distribution Expenses 47,230,760 53,890,436 22,310,180 13,558,914 5,081,411 6,387,064 9,949,060 7,396,691 15,961,667 17,792,065 Other Operating Expenses 12,879,001 14,212,649 4,869,731 3,271,043 1,469,195 1,539,078 3,679,516 1,857,644 4,493,138 4,253,692
TOTAL 146,479,012 167,006,836 59,793,459 39,962,893 16,627,360 25,248,358 31,377,589 22,859,757 51,076,379 73,327,547
Less: Expenses to be Reimbursed by the Investment Manager (Note 7) - - - - - 307,359 178,764 - - -
TOTAL 146,479,012 167,006,836 59,793,459 39,962,893 16,627,360 24,940,999 31,198,825 22,859,757 51,076,379 73,327,547
Net Realised Gains/(Losses) for the Year 619,383,076 506,404,772 186,849,193 50,591,692 25,556,847 (8,203,125) 44,512,002 82,149,265 301,289,523 (34,123,963)
Net Change in Unrealised Depreciation in Value of Investments and Derivatives (Note 2.2 and 8) - - - - - - - - - -
Net Gains/(Losses) for the Year 619,383,076 506,404,772 186,849,193 50,591,692 25,556,847 (8,203,125) 44,512,002 82,149,265 301,289,523 (34,123,963)
Net Change in Unrealised Appreciation in Value of Investments and Derivatives (Note 2.2 and 8) (311,158,440) (1,335,486,262) (111,994,081) (118,651,823) 13,197,124 (79,932,171) (21,848,659) (171,033,797) (56,826,446) (78,405,801)
Net Surplus/(Deficit) including Net change in Unrealised Appreciation /(Depreciation) in Value of Investments and Derivatives 308,224,636 (829,081,490) 74,855,112 (68,060,131) 38,753,971 (88,135,296) 22,663,343 (88,884,532) 244,463,077 (112,529,764)
Net Change in Unrealised Appreciation in Value of Investments and Derivatives transferred to Unrealised Appreciation Reserve 311,158,440 1,335,486,262 111,994,081 118,651,823 (13,197,124) 79,932,171 21,848,659 171,033,797 56,826,446 78,405,801
Net Surplus/(Deficit) for the Year 619,383,076 506,404,772 186,849,193 50,591,692 25,556,847 (8,203,125) 44,512,002 82,149,265 301,289,523 (34,123,963)
April 01, 2012 to April 01, 2011 to April 01, 2012 to April 01, 2011 to April 01, 2012 to April 01, 2011 to April 01, 2012 to April 01, 2011 to April 01, 2012 to April 01, 2011 toMarch 31, 2013 March 31, 2012 March 31, 2013 March 31, 2012 March 31, 2013 March 31, 2012 March 31, 2013 March 31, 2012 March 31, 2013 March 31, 2012
Rupees Rupees Rupees Rupees Rupees Rupees Rupees Rupees Rupees Rupees
Net Surplus/(Deficit) for the Year 619,383,076 506,404,772 186,849,193 50,591,692 25,556,847 (8,203,125) 44,512,002 82,149,265 301,289,523 (34,123,963) Transfer from Income Equalisation Reserve (Note 2.8) (1,181,442,161) (1,474,971,362) 366,129,310 (19,665,111) (189,117,365) 245,136,518 316,659,780 (140,718,509) (111,165,881) (58,627,875) Transfer from Reserve Fund 5,691,933,991 6,660,500,581 1,663,159,188 1,632,232,607 651,908,722 414,975,329 371,145,762 429,715,006 395,617,145 488,368,983 Dividend / Distributions (254,094,728) - (113,335,969) - - - - - - -
Balance Transferred to Reserve Fund 4,875,780,178 5,691,933,991 2,102,801,722 1,663,159,188 488,348,204 651,908,722 732,317,544 371,145,762 585,740,787 395,617,145
Notes to the Financial Statements. 8The schedules referred to herein form an integral part of the Financial Statements.This is the Revenue Account referred to in our report of even date.
For PRICE WATERHOUSE For Board of Trustees of For HSBC Asset Management (India)Firm Registration Number: 301112E HSBC Mutual Fund Private LimitedChartered Accountants
sd/- sd/- sd/-VIVEK PRASAD N. P. Gidwani Puneet ChadhaPartner Trustee Director and Chief Executive OfficerMembership No.104941
sd/- sd/-Dilip J. Thakkar Kishori J. UdeshiTrustee Director
sd/- sd/- sd/- sd/- sd/-Place: Mumbai Amaresh Mishra Gaurav Mehrotra Tushar Pradhan Sanjay Shah Aditya KhemaniDate: July 16, 2013 Fund Manager Fund Manager Fund Manager Fund Manager Fund Manager
HSBC MUTUAL FUND - HSBC EQUITY FUND, HSBC INDIA OPPORTUNITIES FUND, HSBC UNIQUE OPPORTUNITIES FUND, HSBC DYNAMIC FUND and HSBC TAX SAVER EQUITY FUND
Revenue Account for the year ended March 31, 2013
HSBC TAX SAVER EQUITY FUNDHSBC DYNAMIC FUNDHSBC EQUITY FUND HSBC INDIA OPPORTUNITIES FUND HSBC UNIQUE OPPORTUNITIES FUND
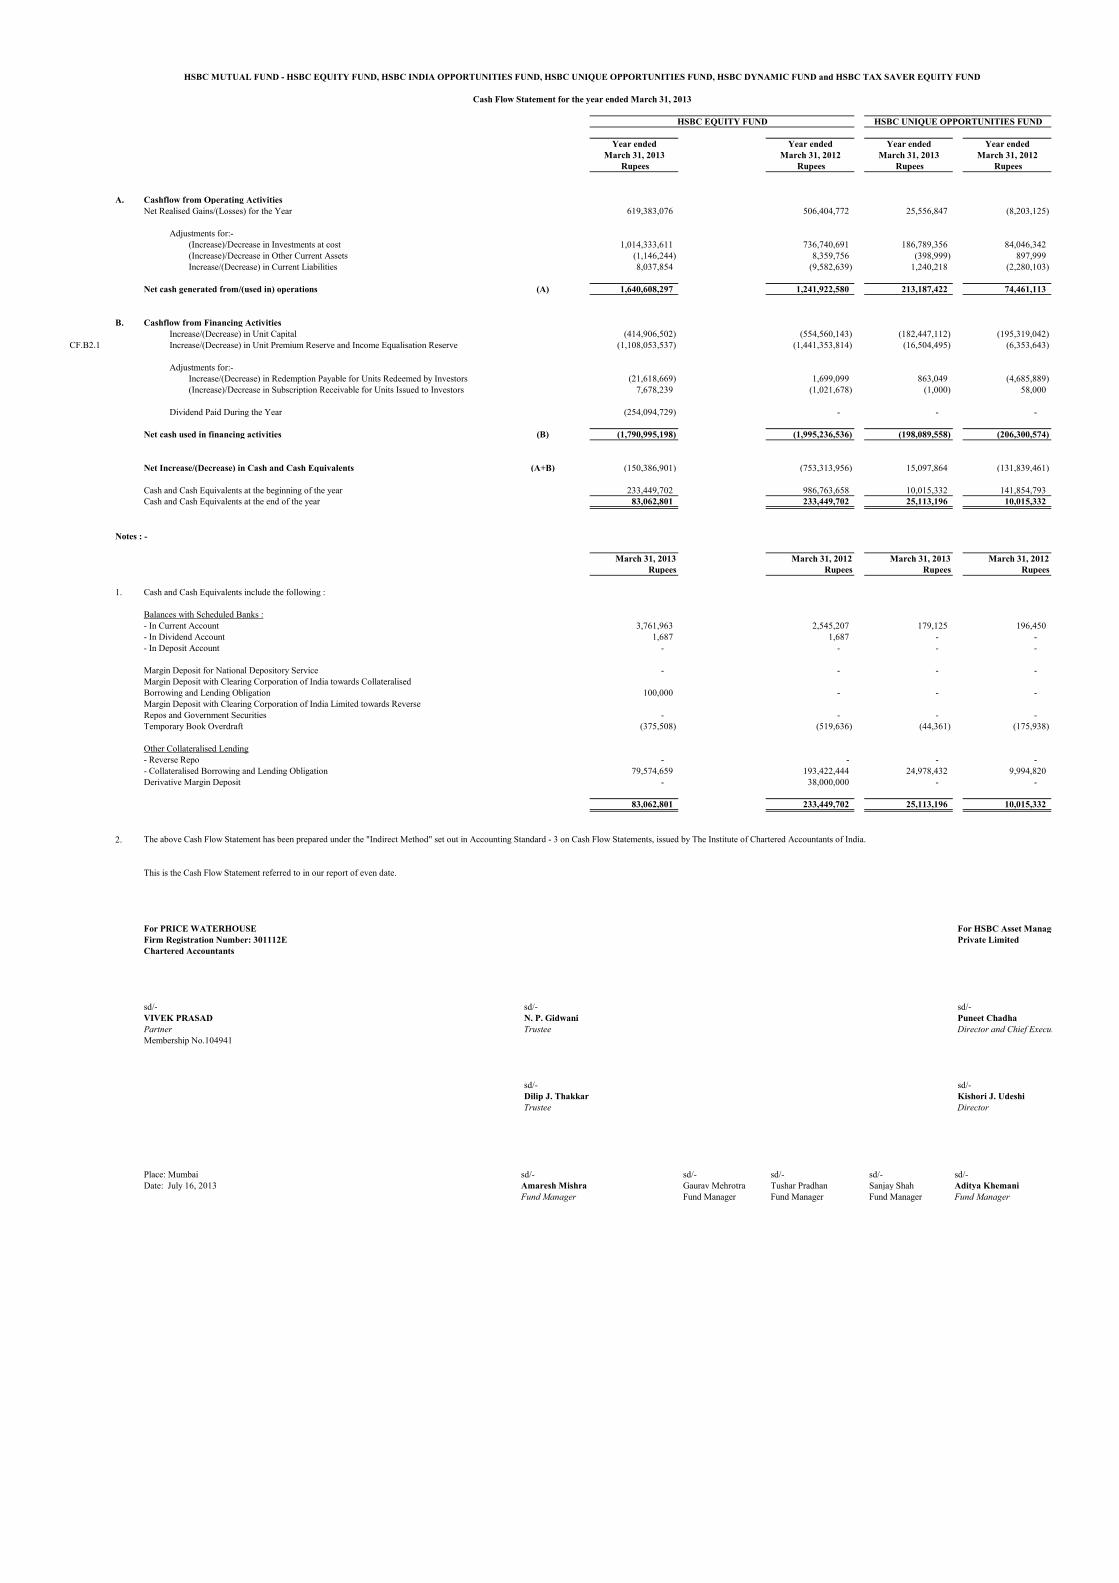
Year ended Year ended Year ended Year endedMarch 31, 2013 March 31, 2012 March 31, 2013 March 31, 2012
Rupees Rupees Rupees Rupees
A. Cashflow from Operating ActivitiesNet Realised Gains/(Losses) for the Year 619,383,076 506,404,772 25,556,847 (8,203,125)
Adjustments for:-(Increase)/Decrease in Investments at cost 1,014,333,611 736,740,691 186,789,356 84,046,342 (Increase)/Decrease in Other Current Assets (1,146,244) 8,359,756 (398,999) 897,999 Increase/(Decrease) in Current Liabilities 8,037,854 (9,582,639) 1,240,218 (2,280,103)
Net cash generated from/(used in) operations (A) 1,640,608,297 1,241,922,580 213,187,422 74,461,113
B. Cashflow from Financing ActivitiesIncrease/(Decrease) in Unit Capital (414,906,502) (554,560,143) (182,447,112) (195,319,042)
CF.B2.1 Increase/(Decrease) in Unit Premium Reserve and Income Equalisation Reserve (1,108,053,537) (1,441,353,814) (16,504,495) (6,353,643)
Adjustments for:-Increase/(Decrease) in Redemption Payable for Units Redeemed by Investors (21,618,669) 1,699,099 863,049 (4,685,889) (Increase)/Decrease in Subscription Receivable for Units Issued to Investors 7,678,239 (1,021,678) (1,000) 58,000
Dividend Paid During the Year (254,094,729) - - -
Net cash used in financing activities (B) (1,790,995,198) (1,995,236,536) (198,089,558) (206,300,574)
Net Increase/(Decrease) in Cash and Cash Equivalents (A+B) (150,386,901) (753,313,956) 15,097,864 (131,839,461)
Cash and Cash Equivalents at the beginning of the year 233,449,702 986,763,658 10,015,332 141,854,793 Cash and Cash Equivalents at the end of the year 83,062,801 233,449,702 25,113,196 10,015,332
0 0 0Notes : -
March 31, 2013 March 31, 2012 March 31, 2013 March 31, 2012 Rupees Rupees Rupees Rupees
1. Cash and Cash Equivalents include the following :
Balances with Scheduled Banks :- In Current Account 3,761,963 2,545,207 179,125 196,450 - In Dividend Account 1,687 1,687 - - - In Deposit Account - - - -
Margin Deposit for National Depository Service - - - - Margin Deposit with Clearing Corporation of India towards CollateralisedBorrowing and Lending Obligation 100,000 - - - Margin Deposit with Clearing Corporation of India Limited towards ReverseRepos and Government Securities - - - - Temporary Book Overdraft (375,508) (519,636) (44,361) (175,938)
Other Collateralised Lending- Reverse Repo - - - - - Collateralised Borrowing and Lending Obligation 79,574,659 193,422,444 24,978,432 9,994,820 Derivative Margin Deposit - 38,000,000 - -
83,062,801 233,449,702 25,113,196 10,015,332
2. The above Cash Flow Statement has been prepared under the "Indirect Method" set out in Accounting Standard - 3 on Cash Flow Statements, issued by The Institute of Chartered Accountants of India.
This is the Cash Flow Statement referred to in our report of even date.
For PRICE WATERHOUSE For HSBC Asset Management (India)Firm Registration Number: 301112E Private LimitedChartered Accountants
sd/- sd/- sd/-VIVEK PRASAD N. P. Gidwani Puneet ChadhaPartner Trustee Director and Chief Executive OfficerMembership No.104941
sd/- sd/-Dilip J. Thakkar Kishori J. UdeshiTrustee Director
Place: Mumbai sd/- sd/- sd/- sd/- sd/-Date: July 16, 2013 Amaresh Mishra Gaurav Mehrotra Tushar Pradhan Sanjay Shah Aditya Khemani
Fund Manager Fund Manager Fund Manager Fund Manager Fund Manager
HSBC MUTUAL FUND - HSBC EQUITY FUND, HSBC INDIA OPPORTUNITIES FUND, HSBC UNIQUE OPPORTUNITIES FUND, HSBC DYNAMIC FUND and HSBC TAX SAVER EQUITY FUND
Cash Flow Statement for the year ended March 31, 2013
HSBC EQUITY FUND HSBC UNIQUE OPPORTUNITIES FUND

SCHEDULE 1Investments Market Value Cost Market / Fair Value Cost Market / Fair Value Cost Market / Fair Value Cost Market/Fair Value Cost Market/Fair Value Cost Market Value Cost Market / Fair Value Cost Market / Fair Value Cost Market / Fair Value Cost (Notes 2.2, 2.3, 2.5, 5A, 8, 9, 10, 13 and 15) Rupees Rupees Rupees Rupees Rupees Rupees Rupees Rupees Rupees Rupees Rupees Rupees Rupees Rupees Rupees Rupees Rupees Rupees Rupees Rupees (Refer to the attached Statement of Portfolio Holding as at March 31, 2013)
Equity Shares 5,330,891,683 4,378,711,343 6,627,715,819 5,364,377,039 2,078,703,565 1,824,362,351 1,627,713,980 1,261,378,685 494,261,968 416,814,184 663,923,801 599,673,141 1,267,848,940 1,131,415,295 697,233,672 538,951,368 1,789,725,520 1,511,903,935 2,042,582,515 1,707,934,484
TOTAL 5,330,891,683 4,378,711,343 6,627,715,819 5,364,377,039 2,078,703,565 1,824,362,351 1,627,713,980 1,261,378,685 494,261,968 416,814,184 663,923,801 599,673,141 1,267,848,940 1,131,415,295 697,233,672 538,951,368 1,789,725,520 1,511,903,935 2,042,582,515 1,707,934,484
SCHEDULE 2 March 31, 2013 March 31, 2012 March 31, 2013 March 31, 2012 March 31, 2013 March 31, 2012 March 31, 2013 March 31, 2012 March 31, 2013 March 31, 2012Deposits Rupees Rupees Rupees Rupees Rupees Rupees Rupees Rupees Rupees Rupees
Margin Deposit with Clearing Corporation of India Limited towards Collateralised Borrowing and Lending Obligation 100,000 - - - - - - - - - TOTAL 100,000 - - - - - - - - -
SCHEDULE 3 March 31, 2013 March 31, 2012 March 31, 2013 March 31, 2012 March 31, 2013 March 31, 2012 March 31, 2013 March 31, 2012 March 31, 2013 March 31, 2012Other Current Assets Rupees Rupees Rupees Rupees Rupees Rupees Rupees Rupees Rupees Rupees
Balances with Banks - in Current Account 3,761,963 2,545,207 951,460 4,501,298 179,125 196,450 206,388 831,390 15,281,486 2,427,726 - in Dividend Account 1,687 1,687 - - - - - - - - Sales Contracts Awaiting Completion - Equity Shares - 28,667,915 - - - 6,718,654 - - 71,538,291 35,077,488 Collateralised Borrowing and Lending Obligation 79,574,659 193,422,444 62,399,354 187,375,237 24,978,432 9,994,820 79,571,764 78,839,403 12,902,471 16,085,172 Unit Subscription Receivable 236,000 669,100 35,501 64,001 3,000 2,000 12,000 11,001 1,959,000 183,500 Inter-Scheme Receivable- For 'Switch-In' 60,066 7,305,205 35,846 7,300,714 - - - - 297,454 30,183 - For 'Others' - 132,455 - 22,214 - 2,508 - 22,629 101,456 7,727 Derivative Margin Deposit (Note 2.5) - 38,000,000 - - - - - - - - Interest Receivable on : - - Deposits - - - - - - - - - 19,462 - Collateralised Borrowing and Lending Obligation 99,419 119,720 77,960 120,809 31,208 6,444 99,415 50,831 16,120 10,371 Dividend Receivable 3,200,001 3,150,001 904,000 123,750 250,000 - 508,000 74,250 - 708,750 Receivable from Investment Manager 44,106 2,742 4,540 - 136 307,359 179,167 - 214 100 Investment Towards Unclaimed Redemption (Note 17) 6,165,459 2,609,717 1,308,660 768,791 1,326,519 892,553 3,092,055 1,521,615 1,655,465 854,837 Investment Towards Unclaimed Dividend (Note 17) 4,225,053 6,603,011 1,026,412 1,028,196 - - - - 617,122 747,753 Advances and deposit 550,000 520,145 - - - - - - - -
TOTAL 97,918,413 283,749,349 66,743,733 201,305,010 26,768,420 18,120,788 83,668,789 81,351,119 104,369,079 56,153,069
March 31, 2012 March 31, 2013 March 31, 2012 March 31, 2013 March 31, 2012March 31, 2013 March 31, 2012 March 31, 2013 March 31, 2012 March 31, 2013
HSBC UNIQUE OPPORTUNITIES FUND HSBC DYNAMIC FUND
HSBC MUTUAL FUND - HSBC EQUITY FUND, HSBC INDIA OPPORTUNITIES FUND, HSBC UNIQUE OPPORTUNITIES FUND, HSBC DYNAMIC FUND and HSBC TAX SAVER EQUITY FUND
Schedules forming part of the Balance Sheet as at March 31, 2013and the Revenue Account for the year ended March 31, 2013
HSBC TAX SAVER EQUITY FUND HSBC EQUITY FUND HSBC INDIA OPPORTUNITIES FUND

SCHEDULE 4
Unit Capital (Note 12A) March 31, 2013 March 31, 2013 March 31, 2012 March 31, 2012 Rupees Units Rupees Units
Growth OptionIssued and SubscribedUnits of Rs. 10 each fully paid up 315,148,602 31,514,860.200 315,148,602 31,514,860.200 Outstanding:At the beginning of the year 369,103,473 36,910,347.173 455,606,284 45,560,628.334 Issued during the year 86,656,399 8,665,639.949 53,816,637 5,381,663.679
455,759,872 45,575,987.122 509,422,921 50,942,292.013 Redeemed during the year 152,263,450 15,226,344.994 140,319,448 14,031,944.840 At the end of the year 303,496,422 30,349,642.128 369,103,473 36,910,347.173
Dividend OptionIssued and SubscribedUnits of Rs. 10 each fully paid up 36,688,499 3,668,849.900 36,688,499 3,668,849.900 Outstanding:At the beginning of the year 1,371,412,223 137,141,222.324 1,839,469,555 183,946,955.561 Issued during the year 77,639,930 7,763,992.960 123,650,422 12,365,042.150
1,449,052,153 144,905,215.284 1,963,119,977 196,311,997.711 Redeemed during the year 429,584,742 42,958,474.242 591,707,754 59,170,775.387 At the end of the year 1,019,467,411 101,946,741.042 1,371,412,223 137,141,222.324
TOTAL 1,322,963,833 132,296,383.170 1,740,515,696 174,051,569.497
Direct PlanGrowth OptionIssued and SubscribedUnits of Rs. 10 each fully paid up - - Outstanding:At the beginning of the year - - Issued during the year 707,966 70,796.605
707,966 70,796.605 Redeemed during the year 3,306 330.554 At the end of the year 704,660 70,466.051
Dividend OptionIssued and SubscribedUnits of Rs. 10 each fully paid up - - Outstanding:At the beginning of the year - - Issued during the year 1,941,805 194,180.482
1,941,805 194,180.482 Redeemed during the year 1,104 110.426 At the end of the year 1,940,701 194,070.056
TOTAL 2,645,361 264,536.107
TOTAL 1,325,609,194 132,560,919.277 1,740,515,696 174,051,569.497
March 31, 2013 March 31, 2013 March 31, 2012 March 31, 2012 Rupees Units Rupees Units
Growth OptionIssued and SubscribedUnits of Rs. 10 each fully paid up 705,593,731 70,559,373.092 705,593,731 70,559,373.092 Outstanding:At the beginning of the year 233,542,169 23,354,216.844 207,487,049 20,748,704.841 Issued during the year 361,032,794 36,103,279.373 80,874,341 8,087,434.087
594,574,963 59,457,496.217 288,361,390 28,836,138.928 Redeemed during the year 307,852,832 30,785,283.178 54,819,221 5,481,922.084 At the end of the year 286,722,131 28,672,213.039 233,542,169 23,354,216.844
Dividend OptionIssued and SubscribedUnits of Rs. 10 each fully paid up 1,900,309,787 190,030,978.748 1,900,309,787 190,030,978.748 Outstanding:At the beginning of the year 614,147,754 61,414,775.256 688,276,253 68,827,625.200 Issued during the year 530,491,242 53,049,124.197 87,136,182 8,713,618.150
1,144,638,996 114,463,899.453 775,412,435 77,541,243.350 Redeemed during the year 384,546,604 38,454,660.368 161,264,681 16,126,468.094 At the end of the year 760,092,392 76,009,239.085 614,147,754 61,414,775.256
TOTAL 1,046,814,523 104,681,452.124 847,689,923 84,768,992.100
Direct PlanGrowth OptionIssued and SubscribedUnits of Rs. 10 each fully paid up - - Outstanding:At the beginning of the year - - Issued during the year 219,233 21,923.340
219,233 21,923.340 Redeemed during the year 540 53.972 At the end of the year 218,693 21,869.368
Dividend OptionIssued and SubscribedUnits of Rs. 10 each fully paid up - - Outstanding:At the beginning of the year - - Issued during the year 80,118 8,011.816
80,118 8,011.816 Redeemed during the year - - At the end of the year 80,118 8,011.816
TOTAL 298,811 29,881.184
TOTAL 1,047,113,334 104,711,333.308 847,689,923 84,768,992.100
HSBC MUTUAL FUND - HSBC EQUITY FUND, HSBC INDIA OPPORTUNITIES FUND, HSBC UNIQUE OPPORTUNITIES FUND, HSBC DYNAMIC FUND and HSBC TAX SAVER EQUITY FUND
Schedules forming part of the Balance Sheet as at March 31, 2013and the Revenue Account for the year ended March 31, 2013
Regular Plan
HSBC EQUITY FUND
HSBC INDIA OPPORTUNITIES FUND
Regular Plan
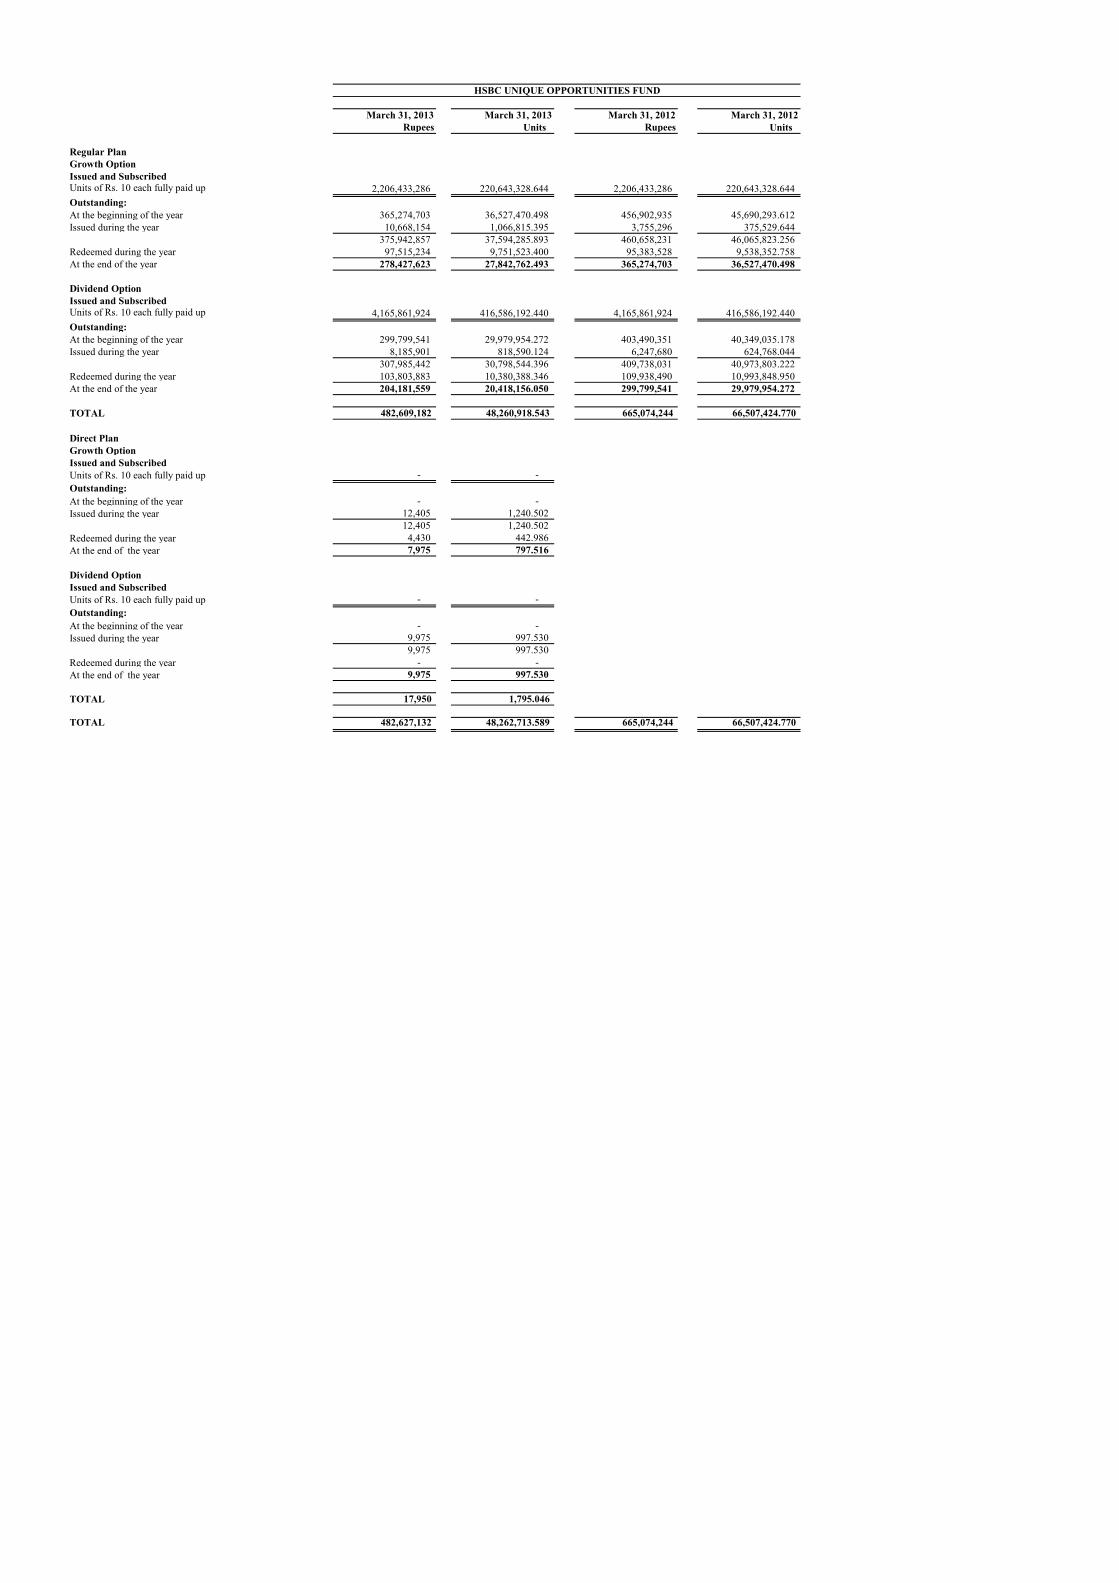
March 31, 2013 March 31, 2013 March 31, 2012 March 31, 2012 Rupees Units Rupees Units
Growth OptionIssued and SubscribedUnits of Rs. 10 each fully paid up 2,206,433,286 220,643,328.644 2,206,433,286 220,643,328.644 Outstanding:At the beginning of the year 365,274,703 36,527,470.498 456,902,935 45,690,293.612 Issued during the year 10,668,154 1,066,815.395 3,755,296 375,529.644
375,942,857 37,594,285.893 460,658,231 46,065,823.256 Redeemed during the year 97,515,234 9,751,523.400 95,383,528 9,538,352.758 At the end of the year 278,427,623 27,842,762.493 365,274,703 36,527,470.498
Dividend OptionIssued and SubscribedUnits of Rs. 10 each fully paid up 4,165,861,924 416,586,192.440 4,165,861,924 416,586,192.440 Outstanding:At the beginning of the year 299,799,541 29,979,954.272 403,490,351 40,349,035.178 Issued during the year 8,185,901 818,590.124 6,247,680 624,768.044
307,985,442 30,798,544.396 409,738,031 40,973,803.222 Redeemed during the year 103,803,883 10,380,388.346 109,938,490 10,993,848.950 At the end of the year 204,181,559 20,418,156.050 299,799,541 29,979,954.272
TOTAL 482,609,182 48,260,918.543 665,074,244 66,507,424.770
Direct PlanGrowth OptionIssued and SubscribedUnits of Rs. 10 each fully paid up - - Outstanding:At the beginning of the year - - Issued during the year 12,405 1,240.502
12,405 1,240.502 Redeemed during the year 4,430 442.986 At the end of the year 7,975 797.516
Dividend OptionIssued and SubscribedUnits of Rs. 10 each fully paid up - - Outstanding:At the beginning of the year - - Issued during the year 9,975 997.530
9,975 997.530 Redeemed during the year - - At the end of the year 9,975 997.530
TOTAL 17,950 1,795.046
TOTAL 482,627,132 48,262,713.589 665,074,244 66,507,424.770
HSBC UNIQUE OPPORTUNITIES FUND
Regular Plan
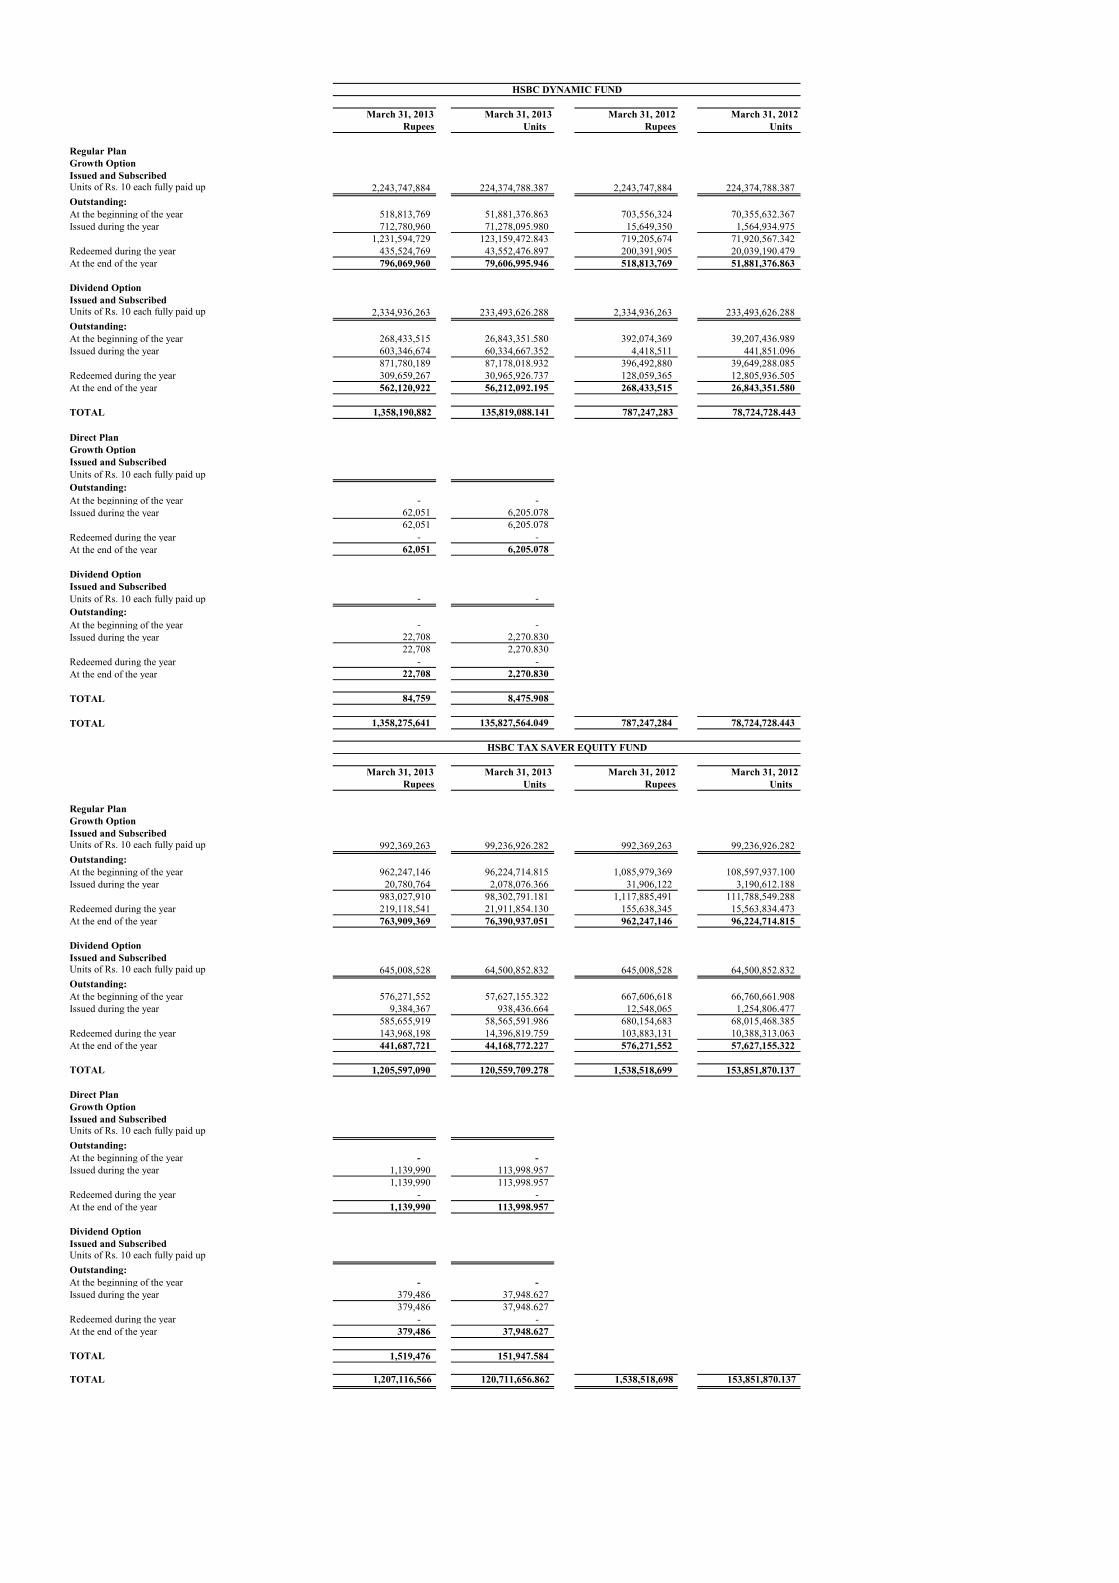
March 31, 2013 March 31, 2013 March 31, 2012 March 31, 2012 Rupees Units Rupees Units
Growth OptionIssued and SubscribedUnits of Rs. 10 each fully paid up 2,243,747,884 224,374,788.387 2,243,747,884 224,374,788.387 Outstanding:At the beginning of the year 518,813,769 51,881,376.863 703,556,324 70,355,632.367 Issued during the year 712,780,960 71,278,095.980 15,649,350 1,564,934.975
1,231,594,729 123,159,472.843 719,205,674 71,920,567.342 Redeemed during the year 435,524,769 43,552,476.897 200,391,905 20,039,190.479 At the end of the year 796,069,960 79,606,995.946 518,813,769 51,881,376.863
Dividend OptionIssued and SubscribedUnits of Rs. 10 each fully paid up 2,334,936,263 233,493,626.288 2,334,936,263 233,493,626.288 Outstanding:At the beginning of the year 268,433,515 26,843,351.580 392,074,369 39,207,436.989 Issued during the year 603,346,674 60,334,667.352 4,418,511 441,851.096
871,780,189 87,178,018.932 396,492,880 39,649,288.085 Redeemed during the year 309,659,267 30,965,926.737 128,059,365 12,805,936.505 At the end of the year 562,120,922 56,212,092.195 268,433,515 26,843,351.580
TOTAL 1,358,190,882 135,819,088.141 787,247,283 78,724,728.443
Direct PlanGrowth OptionIssued and SubscribedUnits of Rs. 10 each fully paid upOutstanding:At the beginning of the year - - Issued during the year 62,051 6,205.078
62,051 6,205.078 Redeemed during the year - - At the end of the year 62,051 6,205.078
Dividend OptionIssued and SubscribedUnits of Rs. 10 each fully paid up - - Outstanding:At the beginning of the year - - Issued during the year 22,708 2,270.830
22,708 2,270.830 Redeemed during the year - - At the end of the year 22,708 2,270.830
TOTAL 84,759 8,475.908
TOTAL 1,358,275,641 135,827,564.049 787,247,284 78,724,728.443
March 31, 2013 March 31, 2013 March 31, 2012 March 31, 2012 Rupees Units Rupees Units
Growth OptionIssued and SubscribedUnits of Rs. 10 each fully paid up 992,369,263 99,236,926.282 992,369,263 99,236,926.282 Outstanding:At the beginning of the year 962,247,146 96,224,714.815 1,085,979,369 108,597,937.100 Issued during the year 20,780,764 2,078,076.366 31,906,122 3,190,612.188
983,027,910 98,302,791.181 1,117,885,491 111,788,549.288 Redeemed during the year 219,118,541 21,911,854.130 155,638,345 15,563,834.473 At the end of the year 763,909,369 76,390,937.051 962,247,146 96,224,714.815
Dividend OptionIssued and SubscribedUnits of Rs. 10 each fully paid up 645,008,528 64,500,852.832 645,008,528 64,500,852.832 Outstanding:At the beginning of the year 576,271,552 57,627,155.322 667,606,618 66,760,661.908 Issued during the year 9,384,367 938,436.664 12,548,065 1,254,806.477
585,655,919 58,565,591.986 680,154,683 68,015,468.385 Redeemed during the year 143,968,198 14,396,819.759 103,883,131 10,388,313.063 At the end of the year 441,687,721 44,168,772.227 576,271,552 57,627,155.322
TOTAL 1,205,597,090 120,559,709.278 1,538,518,699 153,851,870.137
Direct PlanGrowth OptionIssued and SubscribedUnits of Rs. 10 each fully paid upOutstanding:At the beginning of the year - - Issued during the year 1,139,990 113,998.957
1,139,990 113,998.957 Redeemed during the year - - At the end of the year 1,139,990 113,998.957
Dividend OptionIssued and SubscribedUnits of Rs. 10 each fully paid upOutstanding:At the beginning of the year - - Issued during the year 379,486 37,948.627
379,486 37,948.627 Redeemed during the year - - At the end of the year 379,486 37,948.627
TOTAL 1,519,476 151,947.584
TOTAL 1,207,116,566 120,711,656.862 1,538,518,698 153,851,870.137
HSBC DYNAMIC FUND
Regular Plan
HSBC TAX SAVER EQUITY FUND
Regular Plan

SCHEDULE 5 March 31, 2013 March 31, 2012 March 31, 2013 March 31, 2012 March 31, 2013 March 31, 2012 March 31, 2013 March 31, 2012 March 31, 2013 March 31, 2012Reserves and Surplus Rupees Rupees Rupees Rupees Rupees Rupees Rupees Rupees Rupees Rupees
Unit Premium Reserve (Note 2.7)At the beginning of the year (1,853,764,435) (1,887,381,983) (1,080,247,597) (1,113,910,803) (705,985,266) (454,495,104) (560,595,424) (706,745,886) (185,573,519) (172,038,038)Added during the year 73,388,624 33,617,548 (197,030,480) 33,663,206 172,612,871 (251,490,162) (336,698,305) 146,150,462 (47,612,710) (13,535,481)
At the end of the year (1,780,375,811) (1,853,764,435) (1,277,278,077) (1,080,247,597) (533,372,395) (705,985,266) (897,293,729) (560,595,424) (233,186,229) (185,573,519)
Unrealised Appreciation ReserveAt the beginning of the year 1,263,338,780 2,598,825,042 366,335,295 484,987,118 64,250,660 144,182,831 158,282,304 329,316,101 334,648,031 413,053,832 Net Change in Unrealised Appreciation in Value of Investments and Derivatives Transferred from Revenue Account (Note 8) (311,158,440) (1,335,486,262) (111,994,081) (118,651,823) 13,197,124 (79,932,171) (21,848,659) (171,033,797) (56,826,446) (78,405,801)
At the end of the year 952,180,340 1,263,338,780 254,341,214 366,335,295 77,447,784 64,250,660 136,433,645 158,282,304 277,821,585 334,648,031
Reserve FundAt the beginning of the year 5,691,933,991 6,660,500,581 1,663,159,188 1,632,232,607 651,908,722 414,975,329 371,145,762 429,715,006 395,617,145 488,368,983 Transferred to Revenue Account (5,691,933,991) (6,660,500,581) (1,663,159,188) (1,632,232,607) (651,908,722) (414,975,329) (371,145,762) (429,715,006) (395,617,145) (488,368,983) Balance Transferred from Revenue Account 4,875,780,178 5,691,933,991 2,102,801,722 1,663,159,188 488,348,204 651,908,722 732,317,544 371,145,762 585,740,788 395,617,145
At the end of the year 4,875,780,178 5,691,933,991 2,102,801,722 1,663,159,188 488,348,204 651,908,722 732,317,544 371,145,762 585,740,788 395,617,145
TOTAL 4,047,584,707 * 5,101,508,336 * 1,079,864,859 * 949,246,886 * 32,423,593 * 10,174,116 * (28,542,540) * (31,167,358) * 630,376,144 * 544,691,657 *
HSBC MUTUAL FUND - HSBC EQUITY FUND, HSBC INDIA OPPORTUNITIES FUND, HSBC UNIQUE OPPORTUNITIES FUND, HSBC DYNAMIC FUND and HSBC TAX SAVER EQUITY FUND
Schedules forming part of the Balance Sheet as at March 31, 2013and the Revenue Account for the year ended March 31, 2013
HSBC TAX SAVER EQUITY FUNDHSBC UNIQUE OPPORTUNITIES FUND HSBC DYNAMIC FUNDHSBC EQUITY FUND HSBC INDIA OPPORTUNITIES FUND
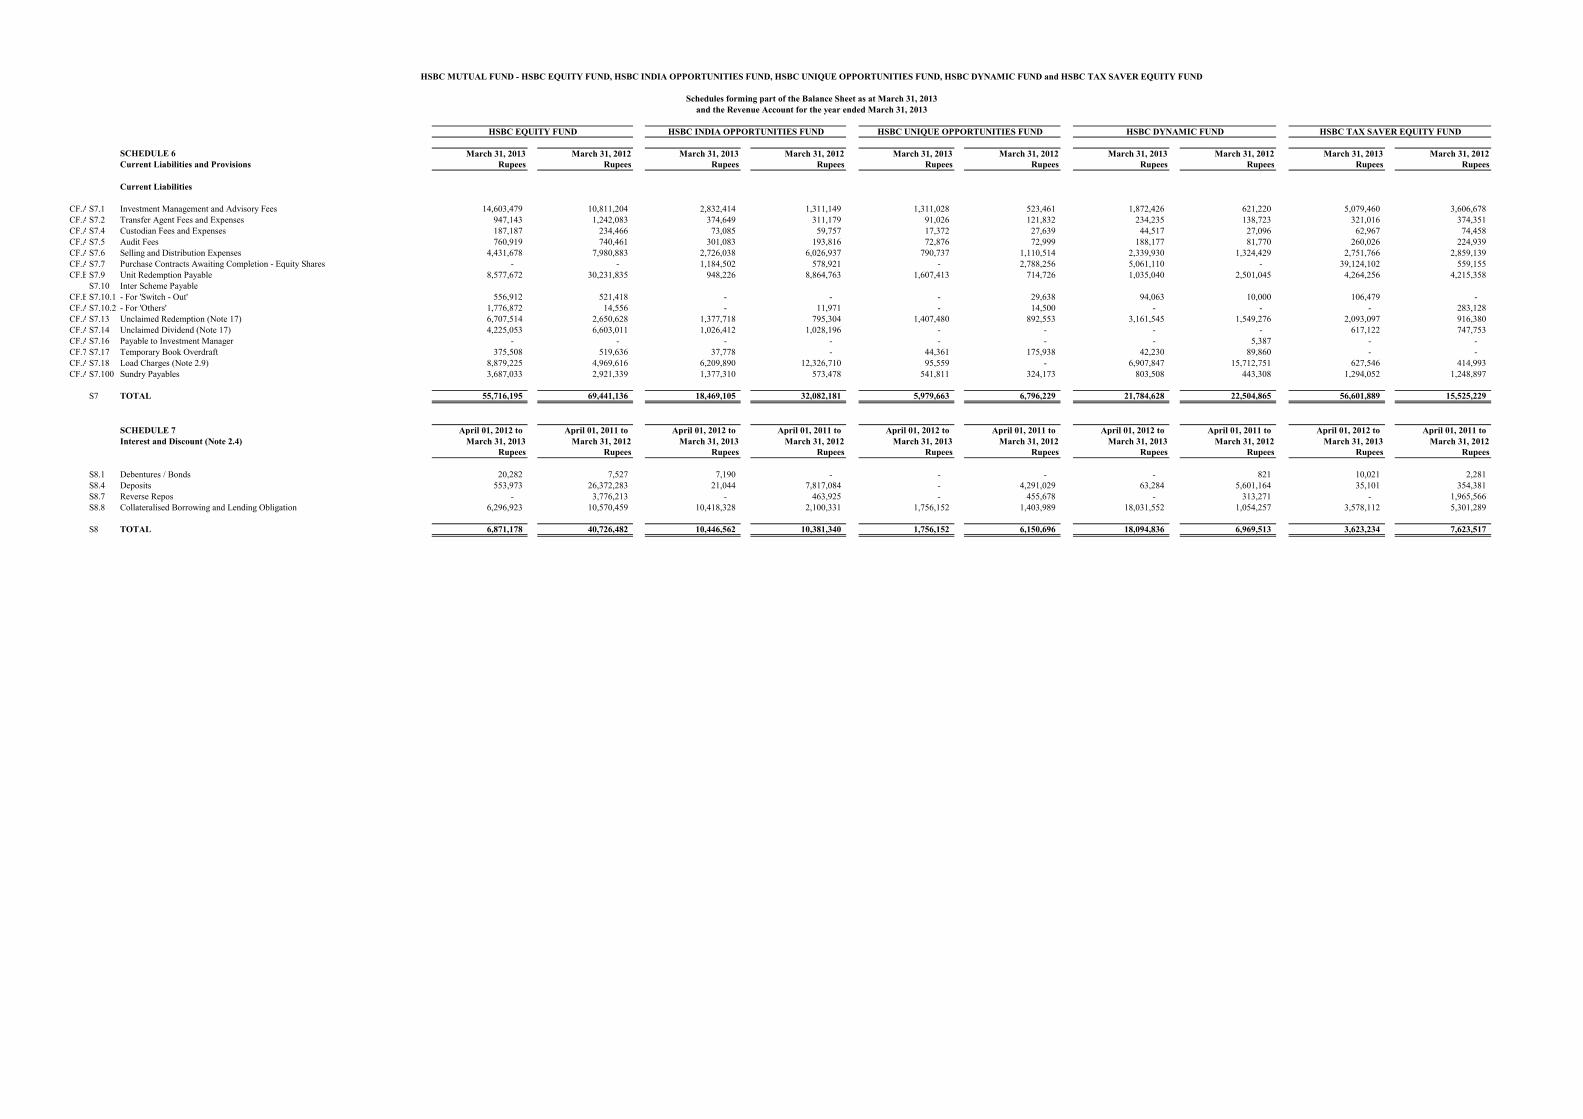
SCHEDULE 6 March 31, 2013 March 31, 2012 March 31, 2013 March 31, 2012 March 31, 2013 March 31, 2012 March 31, 2013 March 31, 2012 March 31, 2013 March 31, 2012Current Liabilities and Provisions Rupees Rupees Rupees Rupees Rupees Rupees Rupees Rupees Rupees Rupees
Current Liabilities
CF.A5S7.1 Investment Management and Advisory Fees 14,603,479 10,811,204 2,832,414 1,311,149 1,311,028 523,461 1,872,426 621,220 5,079,460 3,606,678 CF.A5S7.2 Transfer Agent Fees and Expenses 947,143 1,242,083 374,649 311,179 91,026 121,832 234,235 138,723 321,016 374,351 CF.A5S7.4 Custodian Fees and Expenses 187,187 234,466 73,085 59,757 17,372 27,639 44,517 27,096 62,967 74,458 CF.A5S7.5 Audit Fees 760,919 740,461 301,083 193,816 72,876 72,999 188,177 81,770 260,026 224,939 CF.A5S7.6 Selling and Distribution Expenses 4,431,678 7,980,883 2,726,038 6,026,937 790,737 1,110,514 2,339,930 1,324,429 2,751,766 2,859,139 CF.A3S7.7 Purchase Contracts Awaiting Completion - Equity Shares - - 1,184,502 578,921 - 2,788,256 5,061,110 - 39,124,102 559,155 CF.B3S7.9 Unit Redemption Payable 8,577,672 30,231,835 948,226 8,864,763 1,607,413 714,726 1,035,040 2,501,045 4,264,256 4,215,358
S7.10 Inter Scheme PayableCF.B3S7.10.1 - For 'Switch - Out' 556,912 521,418 - - - 29,638 94,063 10,000 106,479 - CF.A5S7.10.2 - For 'Others' 1,776,872 14,556 - 11,971 - 14,500 - - - 283,128 CF.A5S7.13 Unclaimed Redemption (Note 17) 6,707,514 2,650,628 1,377,718 795,304 1,407,480 892,553 3,161,545 1,549,276 2,093,097 916,380 CF.A5S7.14 Unclaimed Dividend (Note 17) 4,225,053 6,603,011 1,026,412 1,028,196 - - - - 617,122 747,753 CF.A5S7.16 Payable to Investment Manager - - - - - - - 5,387 - - CF.7 S7.17 Temporary Book Overdraft 375,508 519,636 37,778 - 44,361 175,938 42,230 89,860 - - CF.A5S7.18 Load Charges (Note 2.9) 8,879,225 4,969,616 6,209,890 12,326,710 95,559 - 6,907,847 15,712,751 627,546 414,993 CF.A5S7.100 Sundry Payables 3,687,033 2,921,339 1,377,310 573,478 541,811 324,173 803,508 443,308 1,294,052 1,248,897
S7 TOTAL 55,716,195 69,441,136 18,469,105 32,082,181 5,979,663 6,796,229 21,784,628 22,504,865 56,601,889 15,525,229
SCHEDULE 7 April 01, 2012 to April 01, 2011 to April 01, 2012 to April 01, 2011 to April 01, 2012 to April 01, 2011 to April 01, 2012 to April 01, 2011 to April 01, 2012 to April 01, 2011 toInterest and Discount (Note 2.4) March 31, 2013 March 31, 2012 March 31, 2013 March 31, 2012 March 31, 2013 March 31, 2012 March 31, 2013 March 31, 2012 March 31, 2013 March 31, 2012
Rupees Rupees Rupees Rupees Rupees Rupees Rupees Rupees Rupees Rupees
S8.1 Debentures / Bonds 20,282 7,527 7,190 - - - - 821 10,021 2,281 S8.4 Deposits 553,973 26,372,283 21,044 7,817,084 - 4,291,029 63,284 5,601,164 35,101 354,381 S8.7 Reverse Repos - 3,776,213 - 463,925 - 455,678 - 313,271 - 1,965,566 S8.8 Collateralised Borrowing and Lending Obligation 6,296,923 10,570,459 10,418,328 2,100,331 1,756,152 1,403,989 18,031,552 1,054,257 3,578,112 5,301,289
S8 TOTAL 6,871,178 40,726,482 10,446,562 10,381,340 1,756,152 6,150,696 18,094,836 6,969,513 3,623,234 7,623,517
HSBC MUTUAL FUND - HSBC EQUITY FUND, HSBC INDIA OPPORTUNITIES FUND, HSBC UNIQUE OPPORTUNITIES FUND, HSBC DYNAMIC FUND and HSBC TAX SAVER EQUITY FUND
Schedules forming part of the Balance Sheet as at March 31, 2013and the Revenue Account for the year ended March 31, 2013
HSBC TAX SAVER EQUITY FUNDHSBC UNIQUE OPPORTUNITIES FUND HSBC DYNAMIC FUNDHSBC EQUITY FUND HSBC INDIA OPPORTUNITIES FUND

Description Quantity Market ValueRupees
Equity Shares (100.00%)Auto (8.08%)
Bajaj Auto Limited 80,000 143,964,000Tata Motors Limited 425,000 114,388,750Hero MotoCorp Limited 72,000 111,024,000Tata Motors DVR Limited 400,000 61,100,000
430,476,750Auto Ancillaries (1.88%)
Apollo Tyres Limited 1,199,585 100,105,368100,105,368
Banks (21.91%)ICICI Bank Limited 376,000 392,995,200HDFC Bank Limited 440,000 275,154,000State Bank of India 80,000 165,820,000The Federal Bank Limited 300,000 144,195,000Bank of Baroda 175,000 118,195,000Punjab National Bank 100,000 71,790,000
1,168,149,200Cement (4.22%)
Grasim Industries Limited 80,000 225,064,000225,064,000
Construction Project (3.59%)Larsen & Toubro Limited @ 140,000 191,268,000
191,268,000Consumer Non Durables (6.97%)
ITC Limited 1,200,000 371,340,000371,340,000
Fertilisers (1.06%)Coromandel International Limited 304,650 56,345,018
56,345,018Finance (7.36%)
Housing Development Finance Corporation Limited 340,000 280,925,000LIC Housing Finance Limited 300,000 67,470,000Power Finance Corporation Limited 243,000 43,910,100
392,305,100Gas (1.61%)
GAIL (India) Limited 270,000 85,927,50085,927,500
Industrial Capital Goods (1.00%)Bharat Heavy Electricals Limited 300,000 53,100,000
53,100,000Minerals/Mining (1.74%)
Coal India Limited 300,000 92,730,00092,730,000
Non - Ferrous Metals (3.87%)Hindustan Zinc Limited 1,700,000 206,210,000
206,210,000Oil (6.46%)
Oil & Natural Gas Corporation Limited 800,000 249,120,000Cairn India Limited 350,000 95,357,500
344,477,500Petroleum Products (7.20%)
Reliance Industries Limited @ 350,000 270,515,000Bharat Petroleum Corporation Limited 300,000 113,310,000
383,825,000Pharmaceuticals (4.67%)
Dr. Reddy's Laboratories Limited 99,000 174,883,500Cadila Healthcare Limited 100,000 74,275,000
249,158,500Power (1.86%)
NTPC Limited 700,000 99,365,00099,365,000
Software (12.56%)Infosys Limited 115,000 332,275,250Tata Consultancy Services Limited 140,000 220,605,000Tech Mahindra Limited 110,021 116,567,249
669,447,499Telecom - Services (1.91%)
Bharti Airtel Limited 350,000 102,112,500102,112,500
Textile Products (2.05%)Arvind Limited 1,415,446 109,484,748
109,484,748Total (Cost Rs. 4,378,711,343) 5,330,891,683TOTAL INVESTMENTS (Cost Rs. 4,378,711,343) 5,330,891,683
There were no derivative transactions during the year.
HSBC EQUITY FUND
Statement of Portfolio Holding as at March 31, 2013(Referred to in Schedule 1 to the Balance Sheet as at March 31, 2013 and the Revenue Account
for the year ended March 31, 2013)
Confirmation has been received from J P Morgan Chase Bank, Mumbai Branch at the end of the financial year for the investments held by them.@ Investment in companies which have invested more than five percent of the net asset value of any scheme of HSBC Mutual Fund.
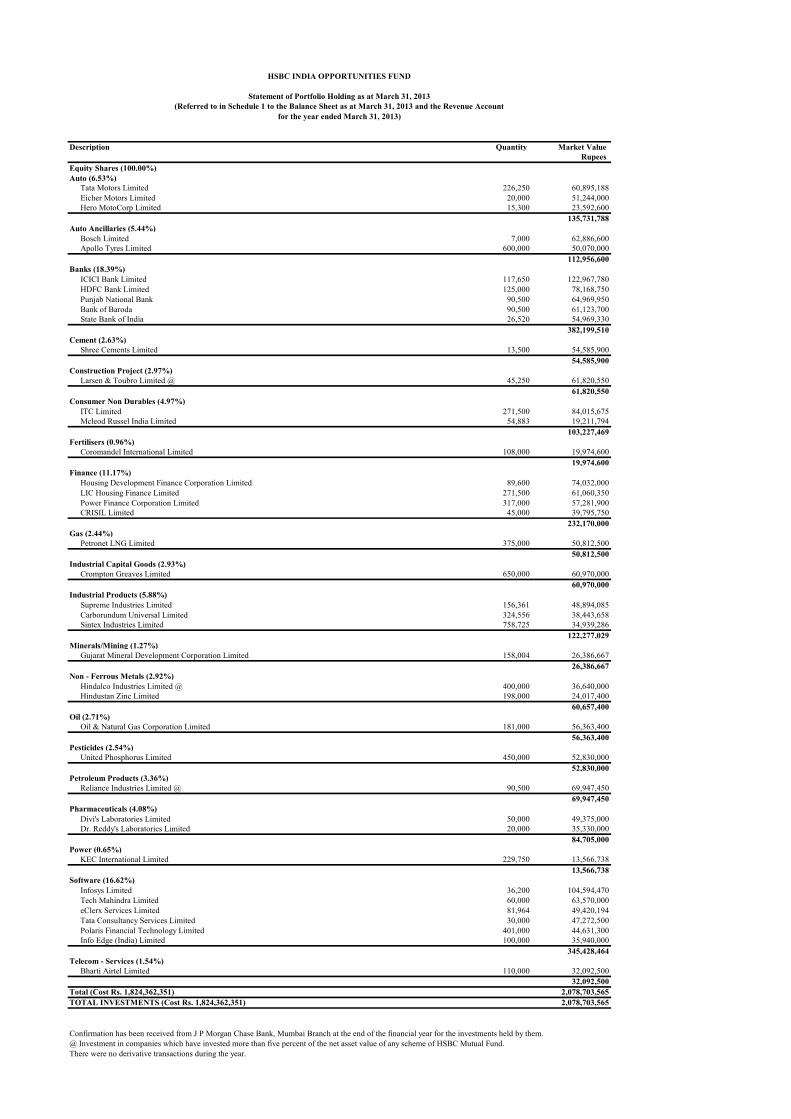
Description Quantity Market ValueRupees
Equity Shares (100.00%)Auto (6.53%)
Tata Motors Limited 226,250 60,895,188Eicher Motors Limited 20,000 51,244,000Hero MotoCorp Limited 15,300 23,592,600
135,731,788Auto Ancillaries (5.44%)
Bosch Limited 7,000 62,886,600Apollo Tyres Limited 600,000 50,070,000
112,956,600Banks (18.39%)
ICICI Bank Limited 117,650 122,967,780HDFC Bank Limited 125,000 78,168,750Punjab National Bank 90,500 64,969,950Bank of Baroda 90,500 61,123,700State Bank of India 26,520 54,969,330
382,199,510Cement (2.63%)
Shree Cements Limited 13,500 54,585,90054,585,900
Construction Project (2.97%)Larsen & Toubro Limited @ 45,250 61,820,550
61,820,550Consumer Non Durables (4.97%)
ITC Limited 271,500 84,015,675Mcleod Russel India Limited 54,883 19,211,794
103,227,469Fertilisers (0.96%)
Coromandel International Limited 108,000 19,974,60019,974,600
Finance (11.17%)Housing Development Finance Corporation Limited 89,600 74,032,000LIC Housing Finance Limited 271,500 61,060,350Power Finance Corporation Limited 317,000 57,281,900CRISIL Limited 45,000 39,795,750
232,170,000Gas (2.44%)
Petronet LNG Limited 375,000 50,812,50050,812,500
Industrial Capital Goods (2.93%)Crompton Greaves Limited 650,000 60,970,000
60,970,000Industrial Products (5.88%)
Supreme Industries Limited 156,361 48,894,085Carborundum Universal Limited 324,556 38,443,658Sintex Industries Limited 758,725 34,939,286
122,277,029Minerals/Mining (1.27%)
Gujarat Mineral Development Corporation Limited 158,004 26,386,66726,386,667
Non - Ferrous Metals (2.92%)Hindalco Industries Limited @ 400,000 36,640,000Hindustan Zinc Limited 198,000 24,017,400
60,657,400Oil (2.71%)
Oil & Natural Gas Corporation Limited 181,000 56,363,40056,363,400
Pesticides (2.54%)United Phosphorus Limited 450,000 52,830,000
52,830,000Petroleum Products (3.36%)
Reliance Industries Limited @ 90,500 69,947,45069,947,450
Pharmaceuticals (4.08%)Divi's Laboratories Limited 50,000 49,375,000Dr. Reddy's Laboratories Limited 20,000 35,330,000
84,705,000Power (0.65%)
KEC International Limited 229,750 13,566,73813,566,738
Software (16.62%)Infosys Limited 36,200 104,594,470Tech Mahindra Limited 60,000 63,570,000eClerx Services Limited 81,964 49,420,194Tata Consultancy Services Limited 30,000 47,272,500Polaris Financial Technology Limited 401,000 44,631,300Info Edge (India) Limited 100,000 35,940,000
345,428,464Telecom - Services (1.54%)
Bharti Airtel Limited 110,000 32,092,50032,092,500
Total (Cost Rs. 1,824,362,351) 2,078,703,565TOTAL INVESTMENTS (Cost Rs. 1,824,362,351) 2,078,703,565
There were no derivative transactions during the year.
HSBC INDIA OPPORTUNITIES FUND
Statement of Portfolio Holding as at March 31, 2013(Referred to in Schedule 1 to the Balance Sheet as at March 31, 2013 and the Revenue Account
for the year ended March 31, 2013)
Confirmation has been received from J P Morgan Chase Bank, Mumbai Branch at the end of the financial year for the investments held by them.@ Investment in companies which have invested more than five percent of the net asset value of any scheme of HSBC Mutual Fund.
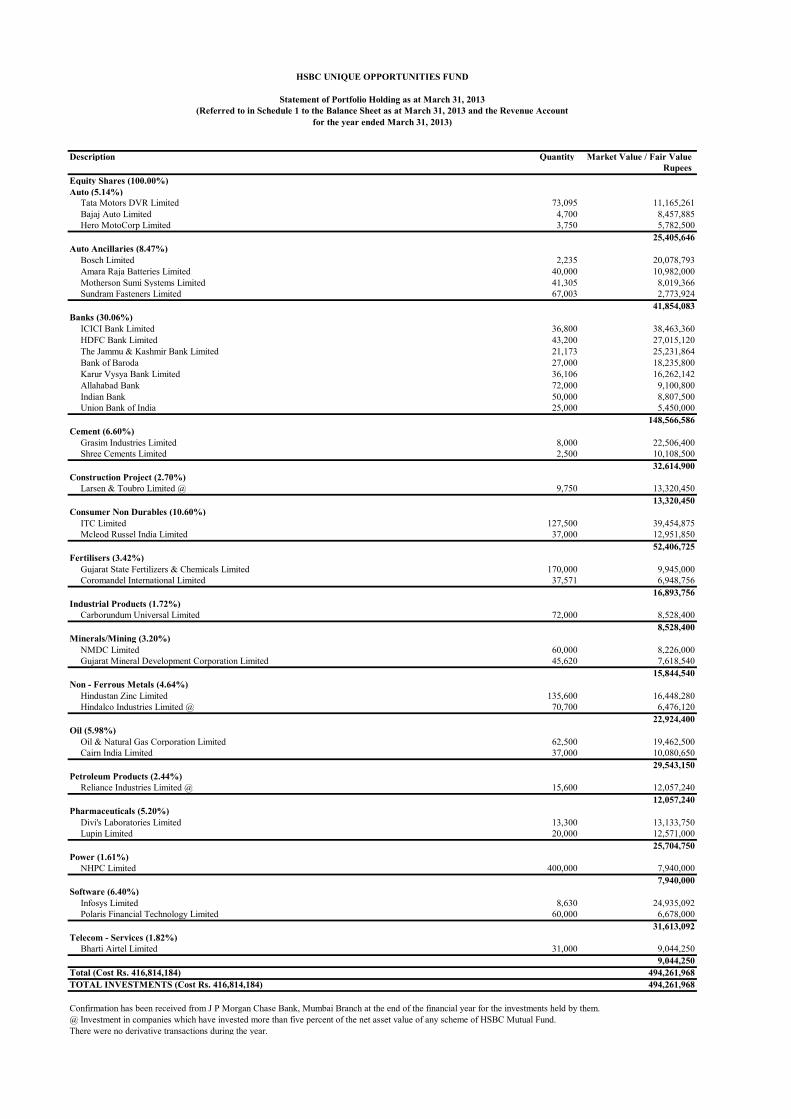
Description Quantity Market Value / Fair ValueRupees
Equity Shares (100.00%)Auto (5.14%)
Tata Motors DVR Limited 73,095 11,165,261Bajaj Auto Limited 4,700 8,457,885Hero MotoCorp Limited 3,750 5,782,500
25,405,646Auto Ancillaries (8.47%)
Bosch Limited 2,235 20,078,793Amara Raja Batteries Limited 40,000 10,982,000Motherson Sumi Systems Limited 41,305 8,019,366Sundram Fasteners Limited 67,003 2,773,924
41,854,083Banks (30.06%)
ICICI Bank Limited 36,800 38,463,360HDFC Bank Limited 43,200 27,015,120The Jammu & Kashmir Bank Limited 21,173 25,231,864Bank of Baroda 27,000 18,235,800Karur Vysya Bank Limited 36,106 16,262,142Allahabad Bank 72,000 9,100,800Indian Bank 50,000 8,807,500Union Bank of India 25,000 5,450,000
148,566,586Cement (6.60%)
Grasim Industries Limited 8,000 22,506,400Shree Cements Limited 2,500 10,108,500
32,614,900Construction Project (2.70%)
Larsen & Toubro Limited @ 9,750 13,320,45013,320,450
Consumer Non Durables (10.60%)ITC Limited 127,500 39,454,875Mcleod Russel India Limited 37,000 12,951,850
52,406,725Fertilisers (3.42%)
Gujarat State Fertilizers & Chemicals Limited 170,000 9,945,000Coromandel International Limited 37,571 6,948,756
16,893,756Industrial Products (1.72%)
Carborundum Universal Limited 72,000 8,528,4008,528,400
Minerals/Mining (3.20%)NMDC Limited 60,000 8,226,000Gujarat Mineral Development Corporation Limited 45,620 7,618,540
15,844,540Non - Ferrous Metals (4.64%)
Hindustan Zinc Limited 135,600 16,448,280Hindalco Industries Limited @ 70,700 6,476,120
22,924,400Oil (5.98%)
Oil & Natural Gas Corporation Limited 62,500 19,462,500Cairn India Limited 37,000 10,080,650
29,543,150Petroleum Products (2.44%)
Reliance Industries Limited @ 15,600 12,057,24012,057,240
Pharmaceuticals (5.20%)Divi's Laboratories Limited 13,300 13,133,750Lupin Limited 20,000 12,571,000
25,704,750Power (1.61%)
NHPC Limited 400,000 7,940,0007,940,000
Software (6.40%)Infosys Limited 8,630 24,935,092Polaris Financial Technology Limited 60,000 6,678,000
31,613,092Telecom - Services (1.82%)
Bharti Airtel Limited 31,000 9,044,2509,044,250
Total (Cost Rs. 416,814,184) 494,261,968TOTAL INVESTMENTS (Cost Rs. 416,814,184) 494,261,968
There were no derivative transactions during the year.
HSBC UNIQUE OPPORTUNITIES FUND
Statement of Portfolio Holding as at March 31, 2013(Referred to in Schedule 1 to the Balance Sheet as at March 31, 2013 and the Revenue Account
for the year ended March 31, 2013)
Confirmation has been received from J P Morgan Chase Bank, Mumbai Branch at the end of the financial year for the investments held by them.@ Investment in companies which have invested more than five percent of the net asset value of any scheme of HSBC Mutual Fund.
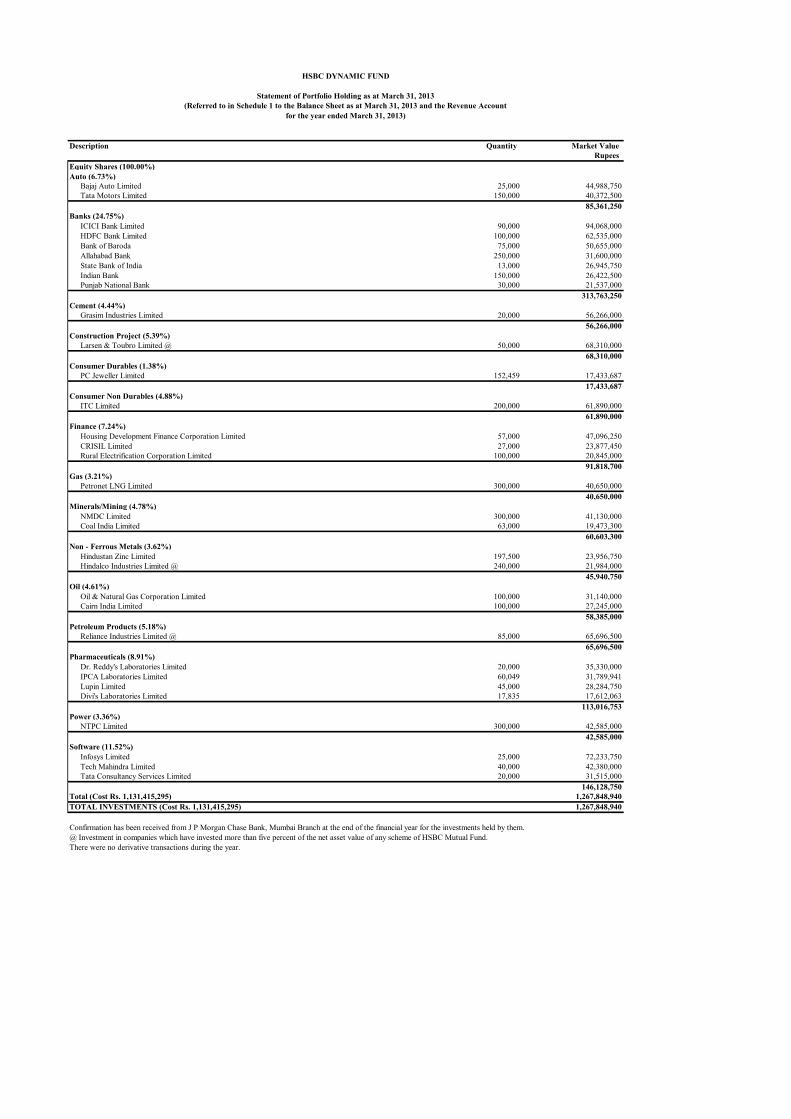
Description Quantity Market ValueRupees
Equity Shares (100.00%)Auto (6.73%)
Bajaj Auto Limited 25,000 44,988,750Tata Motors Limited 150,000 40,372,500
85,361,250Banks (24.75%)
ICICI Bank Limited 90,000 94,068,000HDFC Bank Limited 100,000 62,535,000Bank of Baroda 75,000 50,655,000Allahabad Bank 250,000 31,600,000State Bank of India 13,000 26,945,750Indian Bank 150,000 26,422,500Punjab National Bank 30,000 21,537,000
313,763,250Cement (4.44%)
Grasim Industries Limited 20,000 56,266,00056,266,000
Construction Project (5.39%)Larsen & Toubro Limited @ 50,000 68,310,000
68,310,000Consumer Durables (1.38%)
PC Jeweller Limited 152,459 17,433,68717,433,687
Consumer Non Durables (4.88%)ITC Limited 200,000 61,890,000
61,890,000Finance (7.24%)
Housing Development Finance Corporation Limited 57,000 47,096,250CRISIL Limited 27,000 23,877,450Rural Electrification Corporation Limited 100,000 20,845,000
91,818,700Gas (3.21%)
Petronet LNG Limited 300,000 40,650,00040,650,000
Minerals/Mining (4.78%)NMDC Limited 300,000 41,130,000Coal India Limited 63,000 19,473,300
60,603,300Non - Ferrous Metals (3.62%)
Hindustan Zinc Limited 197,500 23,956,750Hindalco Industries Limited @ 240,000 21,984,000
45,940,750Oil (4.61%)
Oil & Natural Gas Corporation Limited 100,000 31,140,000Cairn India Limited 100,000 27,245,000
58,385,000Petroleum Products (5.18%)
Reliance Industries Limited @ 85,000 65,696,50065,696,500
Pharmaceuticals (8.91%)Dr. Reddy's Laboratories Limited 20,000 35,330,000IPCA Laboratories Limited 60,049 31,789,941Lupin Limited 45,000 28,284,750Divi's Laboratories Limited 17,835 17,612,063
113,016,753Power (3.36%)
NTPC Limited 300,000 42,585,00042,585,000
Software (11.52%)Infosys Limited 25,000 72,233,750Tech Mahindra Limited 40,000 42,380,000Tata Consultancy Services Limited 20,000 31,515,000
146,128,750Total (Cost Rs. 1,131,415,295) 1,267,848,940TOTAL INVESTMENTS (Cost Rs. 1,131,415,295) 1,267,848,940
There were no derivative transactions during the year.
HSBC DYNAMIC FUND
Statement of Portfolio Holding as at March 31, 2013(Referred to in Schedule 1 to the Balance Sheet as at March 31, 2013 and the Revenue Account
for the year ended March 31, 2013)
Confirmation has been received from J P Morgan Chase Bank, Mumbai Branch at the end of the financial year for the investments held by them.@ Investment in companies which have invested more than five percent of the net asset value of any scheme of HSBC Mutual Fund.
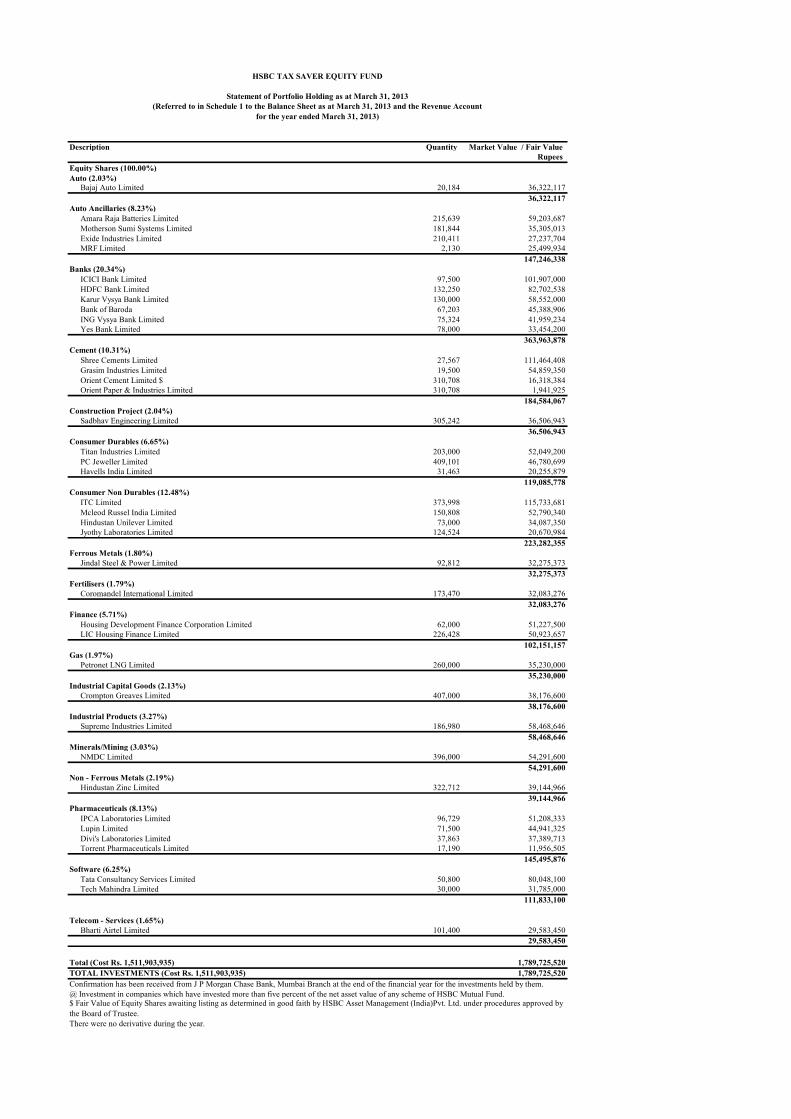
Description Quantity Market Value / Fair ValueRupees
Equity Shares (100.00%)Auto (2.03%)
Bajaj Auto Limited 20,184 36,322,11736,322,117
Auto Ancillaries (8.23%)Amara Raja Batteries Limited 215,639 59,203,687Motherson Sumi Systems Limited 181,844 35,305,013Exide Industries Limited 210,411 27,237,704MRF Limited 2,130 25,499,934
147,246,338Banks (20.34%)
ICICI Bank Limited 97,500 101,907,000HDFC Bank Limited 132,250 82,702,538Karur Vysya Bank Limited 130,000 58,552,000Bank of Baroda 67,203 45,388,906ING Vysya Bank Limited 75,324 41,959,234Yes Bank Limited 78,000 33,454,200
363,963,878Cement (10.31%)
Shree Cements Limited 27,567 111,464,408Grasim Industries Limited 19,500 54,859,350Orient Cement Limited $ 310,708 16,318,384Orient Paper & Industries Limited 310,708 1,941,925
184,584,067Construction Project (2.04%)
Sadbhav Engineering Limited 305,242 36,506,94336,506,943
Consumer Durables (6.65%)Titan Industries Limited 203,000 52,049,200PC Jeweller Limited 409,101 46,780,699Havells India Limited 31,463 20,255,879
119,085,778Consumer Non Durables (12.48%)
ITC Limited 373,998 115,733,681Mcleod Russel India Limited 150,808 52,790,340Hindustan Unilever Limited 73,000 34,087,350Jyothy Laboratories Limited 124,524 20,670,984
223,282,355Ferrous Metals (1.80%)
Jindal Steel & Power Limited 92,812 32,275,37332,275,373
Fertilisers (1.79%)Coromandel International Limited 173,470 32,083,276
32,083,276Finance (5.71%)
Housing Development Finance Corporation Limited 62,000 51,227,500LIC Housing Finance Limited 226,428 50,923,657
102,151,157Gas (1.97%)
Petronet LNG Limited 260,000 35,230,00035,230,000
Industrial Capital Goods (2.13%)Crompton Greaves Limited 407,000 38,176,600
38,176,600Industrial Products (3.27%)
Supreme Industries Limited 186,980 58,468,64658,468,646
Minerals/Mining (3.03%)NMDC Limited 396,000 54,291,600
54,291,600Non - Ferrous Metals (2.19%)
Hindustan Zinc Limited 322,712 39,144,96639,144,966
Pharmaceuticals (8.13%)IPCA Laboratories Limited 96,729 51,208,333Lupin Limited 71,500 44,941,325Divi's Laboratories Limited 37,863 37,389,713Torrent Pharmaceuticals Limited 17,190 11,956,505
145,495,876Software (6.25%)
Tata Consultancy Services Limited 50,800 80,048,100Tech Mahindra Limited 30,000 31,785,000
111,833,100
Telecom - Services (1.65%)Bharti Airtel Limited 101,400 29,583,450
29,583,450
Total (Cost Rs. 1,511,903,935) 1,789,725,520TOTAL INVESTMENTS (Cost Rs. 1,511,903,935) 1,789,725,520
There were no derivative during the year.
$ Fair Value of Equity Shares awaiting listing as determined in good faith by HSBC Asset Management (India)Pvt. Ltd. under procedures approved by the Board of Trustee.
HSBC TAX SAVER EQUITY FUND
Statement of Portfolio Holding as at March 31, 2013(Referred to in Schedule 1 to the Balance Sheet as at March 31, 2013 and the Revenue Account
for the year ended March 31, 2013)
Confirmation has been received from J P Morgan Chase Bank, Mumbai Branch at the end of the financial year for the investments held by them.@ Investment in companies which have invested more than five percent of the net asset value of any scheme of HSBC Mutual Fund.

HSBC MUTUAL FUND HSBC EQUITY FUND, HSBC INDIA OPPORTUNITIES FUND, HSBC UNIQUE OPPORTUNITIES
FUND, HSBC DYNAMIC FUND and HSBC TAX SAVER EQUITY FUND
Schedules forming part of the Balance Sheet as at March 31, 2013 and the Revenue Account for the year ended March 31, 2013
SCHEDULE 8
Notes to the Financial Statements
1 Organisation HSBC Mutual Fund (the Fund) has been sponsored by HSBC Securities and Capital Markets (India) Private Limited. HSBC Asset Management (India) Private Limited incorporated under the Companies Act, 1956 has been appointed as the asset management company. The key features of the Schemes presented in these financial statements are as under:-
Scheme Name Type of Scheme Launched on
Date of Allotment
Investment Objective Options Currently Offered
HSBC Equity Fund (“HEF”)
An open-ended diversified Equity
Scheme
November 14, 2002
December 27, 2002
To generate long-term capital growth from an actively managed
portfolio of equity and equity related securities.
Regular Plan offers Growth Option and
Dividend Option
Direct Plan# offers Growth Option and
Dividend Option
HSBC India Opportunities
Fund (“HIOF”)
An open ended flexi-cap equity scheme
January 22, 2004
March 05, 2004
To seek long term capital growth through investments across all
market capitalizations, including small, mid and large cap stocks
Regular Plan offers Growth Option and
Dividend Option
Direct Plan# offers Growth Option and
Dividend Option
HSBC Unique Opportunities
Fund (“HUOF”)
An open ended equity scheme
February 2, 2007
March 28, 2007
To provide long term capital growth from a diversified portfolio
of equity and equity related instruments with a focus on
investing in stocks of companies facing “out of ordinary”
conditions
Regular Plan offers Growth Option and
Dividend Option
Direct Plan# offers Growth Option and
Dividend Option
HSBC Dynamic Fund (“HDF”)
An open ended scheme
August 03, 2007
September 28, 2007
To provide long term capital appreciation by allocating funds in
equity and equity related instruments and also has the
flexibility to move, entirely if required, into debt instruments
when the view on equity markets seems negative
Regular Plan offers Growth Option and
Dividend Option
Direct Plan# offers Growth Option and
Dividend Option

HSBC MUTUAL FUND HSBC EQUITY FUND, HSBC INDIA OPPORTUNITIES FUND, HSBC UNIQUE OPPORTUNITIES
FUND, HSBC DYNAMIC FUND and HSBC TAX SAVER EQUITY FUND
Schedules forming part of the Balance Sheet as at March 31, 2013 and the Revenue Account for the year ended March 31, 2013
Scheme Name Type of Scheme Launched
on Date of
Allotment Investment Objective Options Currently
Offered
HSBC Tax Saver Equity
Fund (“HTSF”)
An open-ended Equity Linked
Savings Scheme
November 20, 2006
January 17, 2007
To provide long term capital appreciation by investing in a
diversified portfolio of equity & equity related instruments of
companies across various sectors and industries, with no
capitalization bias
Regular Plan offers Growth Option and
Dividend Option
Direct Plan# offers Growth Option and
Dividend Option
# Pursuant to SEBI circular no. CIR/IMD/DF/21/2012 dated September 13, 2012, HSBC Mutual Fund has introduced separate plan for direct investments (i.e. investments routed without intermediary) with effect from January 1, 2013. These plans are introduced in all existing schemes of the Fund except the Schemes/Plans discontinued for further subscriptions. From January 01, 2013, applicable NAV (including equalization reserve per unit and unit premium reserve per unit) used for allotment of units on the first transaction in the direct plans were of corresponding option under the existing plan as on December 31, 2012 for HSBC Cash Fund and as on January 01, 2013 for other schemes. Thereafter, separate NAVs are calculated and published for direct plans.
2 Significant Accounting Policies
2.1 Basis of Accounting The Schemes maintains its books of account on an accrual basis. These financial statements have been prepared in accordance with the accounting policies and standards specified in the Ninth Schedule of the Securities and Exchange Board of India (SEBI) (Mutual Funds) Regulations, 1996 and amendments thereto (the “Regulations”), as applicable. Presentation of these separate Balance Sheets, Revenue Accounts and Cash Flow Statements, where applicable, in a columnar form is not intended to indicate that they bear any relation to each other, or are interdependent or comparable in any way.
2.2 Portfolio Valuation
Investments are stated at market / fair value at the Balance Sheet date / date of determination. In valuing the Scheme’s investments:
i. Equity securities listed on a recognized stock exchange are valued at the last quoted closing price on the National Stock Exchange of India Limited (NSE). If on a particular valuation date, a security is not traded on NSE, the value at which it is traded on Bombay Stock Exchange Limited (BSE) is used. If no sale is reported at that time, the last quoted closing price on the principal stock exchange on which the security is traded is used when it is not more than thirty days prior to the valuation date.
ii. Non-traded and thinly traded equity securities, including those not traded within thirty days prior to the
valuation date are valued at fair value as determined by HSBC Asset Management (India) Private Limited under procedures approved by the Board of Trustees of HSBC Mutual Fund (the Trustee) in accordance with the guidelines for valuation of securities specified in the Regulations.
HSBC MUTUAL FUND HSBC EQUITY FUND, HSBC INDIA OPPORTUNITIES FUND, HSBC UNIQUE OPPORTUNITIES
FUND, HSBC DYNAMIC FUND and HSBC TAX SAVER EQUITY FUND
Schedules forming part of the Balance Sheet as at March 31, 2013 and the Revenue Account for the year ended March 31, 2013
iii. Equity shares awaiting listing are valued at fair value as determined in good faith by HSBC Asset Management (India) Private Limited under procedures approved by the Board of Trustees of HSBC Mutual Fund.
iv. For money market securities, debt securities and floating rate securities :
a) All traded money market securities, debt securities and floating rate securities listed on the recognized stock exchange are valued at the weighted average price at which they are traded on the particular valuation day. b) Non-traded /thinly traded money market securities, debt securities and floating rate securities with residual maturity of upto 91 days are valued on amortization basis. Floating rate securities with floor and caps on coupon rate and residual maturity of upto 91 days are valued on amortization basis taking the coupon rate as floor. c) Non-traded /thinly traded money market securities, debt securities and floating rate securities with residual maturity of over 91 days are valued at fair value as per procedures determined by HSBC Asset Management (India) Private Limited and approved by the Trustee in accordance with the guidelines for valuation of securities for mutual funds, issued by SEBI from time to time. For money market securities, debt securities and floating rate securities (with effect from July 06, 2012) a) All traded money market securities and debt securities and floating rate securities are valued at the weighted average traded YTM or weighted average price at which they are traded / reported on public platform on the particular valuation day as per procedures determined by HSBC Asset Management (India) Private Limited and approved by the Trustee in accordance with the guidelines for valuation of securities for mutual funds, issued by SEBI from time to time. b) Non-traded /thinly traded money market and debt securities and floating rate securities, with residual maturity of up to 91* days are valued on amortization basis. Floating rate securities with floor and caps on coupon rate and residual maturity of up to 91* days are valued on amortization basis taking the coupon rate as floor. Amortized price as per Crisil Bond Valuer (CBV) will be compared with the reference price (as per CBV) to ascertain if the difference is within the band of +/- 10 basis points of the reference price. In case of amortised price falling outside the band, the YTM of the amortised price will be adjusted in order to bring the price within the band. c) Non-traded /thinly traded money market securities, debt securities and floating rate securities with residual maturity of over 91* days are valued at fair value as per procedures determined by HSBC Asset Management (India) Private Limited and approved by the Trustee in accordance with the guidelines for valuation of securities for mutual funds, issued by SEBI from time to time. Thus they are valued at benchmark yield/matrix of spread over risk free benchmark yield obtained from agencies entrusted for the said purpose by AMFI. This may be further adjusted for the illiquidity mark-up / mark-down as permitted under the regulations. *Pursuant to SEBI circular CIR/IMD/DF/6/2012 dated February 28, 2012, with effect from October 01, 2012, reference to 91 days above was changed to 60 days.

HSBC MUTUAL FUND HSBC EQUITY FUND, HSBC INDIA OPPORTUNITIES FUND, HSBC UNIQUE OPPORTUNITIES
FUND, HSBC DYNAMIC FUND and HSBC TAX SAVER EQUITY FUND
Schedules forming part of the Balance Sheet as at March 31, 2013 and the Revenue Account for the year ended March 31, 2013
v. Instruments bought on ‘repo’ basis are valued at the resale price after deduction of applicable interest up to the date of resale. Instruments sold on repo basis are adjusted for the difference between the repurchase price (after deduction of applicable interest upto the date of repurchase) and the value of instrument.
vi. Collateralised Borrowing and Lending Obligations (CBLO) are valued at cost plus accrued interest.
The net unrealised appreciation / depreciation in the value of investments and derivatives is determined
separately for each category of investments and derivatives. In respect of each category of investments and
derivatives, the net change in the unrealised appreciation if any, between two balance sheet dates / valuation
dates is accounted through the Revenue Account and thereafter the net change in unrealised appreciation is
transferred from the Revenue Account to the Unrealised Appreciation Reserve. The net change in unrealised
depreciation in the value of investments and derivatives between the two balance sheet dates/ valuation dates
if any, is accounted through the Revenue Account.
Net unrealised appreciation is reduced from the distributable income at the time of income distribution.
2.3 Securities Transaction
(i) Investment securities transactions are accounted for on a trade date basis. The Scheme uses the average cost
method for determining the realized gain or loss on sale of investments. The cost of investments includes
brokerage stamp charges and any other charges customarily included in the contract note but excludes
custodian safekeeping fees. Pursuant to SEBI circular no. CIR/IMD/DF/21/2012 dated September 13, 2012,
with effect from October 01, 2012, Brokerage and Transaction Costs which are incurred for the purpose of
execution of trade, is included in the cost of investment, not exceeding 0.12 per cent in case of cash market
transactions and 0.05 per cent in case of derivatives transactions. Remaining portion is charged to expenses,
within total expense ratio in line with the Regulations.
(ii) Rights entitlements are recognized as investments on the ex-rights date or during the rights offer period
depending upon the date of intention to subscribe to the rights issue.
(iii) Bonus entitlements are recognized as investments on the ex-bonus date.
2.4 Investment Income
Interest income is recorded on accrual basis. Dividend income is recognised on ex dividend date.
2.5 Derivatives The Scheme enters into derivative transactions in stock / index futures and options for the purpose of hedging and
portfolio balancing. “Derivative margin deposits” representing the margin towards stock / index derivative contracts entered into by
the Schemes are disclosed under “Other Current Assets”.
HSBC MUTUAL FUND HSBC EQUITY FUND, HSBC INDIA OPPORTUNITIES FUND, HSBC UNIQUE OPPORTUNITIES
FUND, HSBC DYNAMIC FUND and HSBC TAX SAVER EQUITY FUND
Schedules forming part of the Balance Sheet as at March 31, 2013 and the Revenue Account for the year ended March 31, 2013
Futures
• Futures contracts are marked to market daily at the futures settlement price as determined by the exchange.
The variation margin calculated as the difference between the trade price or the previous day’s settlement
price, as the case may be, and the current day’s settlement price is recorded as a receivable or payable.
• When a contract is closed (squared off)/ settled (on expiry), the difference between the final settlement /
square-off price and the contract price is recognised in the Revenue Account. If more than one futures
contracts in respect of the same stock / index and expiry date, to which the squared off / settled contract
pertains, is outstanding at the time of square off / settlement of the contract, the weighted average method is
followed for determining the gain or loss.
• As at the Balance Sheet date / date of determination, all open futures positions are valued at the futures
settlement price as determined by the exchange where it is traded. The unrealised appreciation / depreciation
on all open positions is considered for determining the net asset value.
Options
(i) Premium paid/received on bought/written option contracts is debited / credited to “equity option premium
account” and recorded as an Asset/Liability.
(ii) When the option contracts are squared off before expiry, the difference between the premium paid and received
on the squared off transactions is recognized in the revenue account. When the option contracts are exercised
on or before expiry, the difference between the option settlement price as determined by the exchange and the
premium is recognized in the revenue account. If more than one option contracts in respect of the same
stock/index with the same strike price and expiry date to which the squared off /exercised contract pertains is
outstanding at the time of square off /exercise of the contract, the weighted average method is followed for
determining the gain or loss.
(iii) Premium asset/liability in respect of options not exercised / squared off as on expiry date is transferred to
revenue account.
As at the Balance Sheet date/date of determination, all open option positions are valued at the settlement
price as determined by the exchange where it is traded. Non traded option contracts are valued at fair value as
determined by HSBC Asset Management (India) Private Limited and approved by the Trustee. The
unrealized appreciation/depreciation on all open positions is considered for determining the net asset value.
2.6 Net Asset Value The net asset value of the units of the Schemes is determined separately for the units issued under the various
Plans/ Options. For reporting the net asset value of the Plans/ Options, daily income earned, including realised
and unrealised gain or loss in the value of investments and expenses incurred by the Schemes are allocated to the
Plans/ Options in proportion to the value of the net assets.
HSBC MUTUAL FUND HSBC EQUITY FUND, HSBC INDIA OPPORTUNITIES FUND, HSBC UNIQUE OPPORTUNITIES
FUND, HSBC DYNAMIC FUND and HSBC TAX SAVER EQUITY FUND
Schedules forming part of the Balance Sheet as at March 31, 2013 and the Revenue Account for the year ended March 31, 2013
2.7 Unit Premium Reserve
Upon issue and redemption of units, the net premium or discount to the face value of units is adjusted against the
unit premium reserve of the respective Plans/ Options of the Schemes, after an appropriate portion of the issue
proceeds and redemption payout is credited or debited respectively to the income equalisation reserve.
2.8 Income Equalisation Reserve The net income relating to units issued / repurchased is transferred to / from income equalisation reserve (for open ended schemes) for determining the net surplus / deficit transferred from / to unit premium reserve. At the year end, balance in income equalisation reserve is transferred to Revenue Account.
2.9 Load Charges
Upto September 30, 2012, Exit load (Net of Service Tax) collected in the Schemes up to a maximum of 1% of
redemption proceeds is maintained in a separate account and utilized to meet marketing & selling expenses. Any
load (Net of Service Tax) collected in excess of 1% is credited to the Schemes immediately.
SEBI circular No. CIR /IMD/DF/ 4/2011 dated March 09, 2011 has mandated that there should be segregation of
load accounts into two parts, one to reflect the balance as on July 31, 2009 and the other to reflect accretions since
August 01, 2009. While the unutilized balances can be carried forward, not more than one third of the load
balances lying in the Scheme as on July 31, 2009 can be used in any financial year, starting from financial year
2010-2011. All accretions after July 31, 2009 can be used by the Schemes without any such restriction. Further,
both load balances can be used for marketing and selling expenses including distributor‟ s /agent‟ s commission.
Pursuant to SEBI (Second Amendment) (Mutual Fund) Regulations, 1996 dated September 26, 2012, with effect
from October 01, 2012, entire Exit load (Net of Service Tax) is credited to the Schemes.
3 Investment Management and Advisory Fees The Schemes have paid or provided for investment management and advisory fees payable to HSBC Asset
Management (India) Private Limited for managing the Schemes at the following average annual rate (excluding
service tax on management fees) as a percentage of the average daily net assets recorded by respective Schemes:

HSBC MUTUAL FUND HSBC EQUITY FUND, HSBC INDIA OPPORTUNITIES FUND, HSBC UNIQUE OPPORTUNITIES
FUND, HSBC DYNAMIC FUND and HSBC TAX SAVER EQUITY FUND
Schedules forming part of the Balance Sheet as at March 31, 2013 and the Revenue Account for the year ended March 31, 2013
Scheme Name
Average daily net assets for the year ended
Investment Management Fees charged during the year (excluding service tax)
Percentage of Management Fees
charged
March 31, 2013 (Rupees)
March 31, 2012 (Rupees)
March 31, 2013 (Rupees)
March 31, 2012 (Rupees)
31-Mar-13
31-Mar-12
HEF 6,216,947,356 7,833,697,084 72,796,395 80,836,033 1.17 1.03
HIOF 2,371,961,885 1,665,160,615 27,402,169 19,150,107 1.16 1.15
HUOF 622,239,834 757,399,911 8,725,757 9,467,396 1.40 1.25
HDF 1,183,674,159 915,632,111 15,135,763 11,405,999 1.28 1.25
HTSF 2,005,670,044 2,163,212,891 26,220,521 24,130,655 1.31 1.12
All costs, charges and expenses incurred by HSBC Asset Management (India) Private Limited in the
administration and execution of the activities of the Schemes, except costs allowed to be charged to the Scheme
under the Regulations, are on their own account for which they receive investment management and advisory
fees.
4 Trusteeship Fees
In accordance with the Deed of Trust dated February 7, 2002 between HSBC Securities and Capital Markets
(India) Private Limited (“The Settlor”) and the Board of Trustees of HSBC Mutual Fund, the Schemes have paid
or provided for a fee not exceeding Rs.20,000 (w.e.f. September 11, 2012 Rs.40,000) for each meeting of the
Board of Trustees attended by such Trustee not affiliated with the Settlor.
5 Custodian Fees J P Morgan Chase Bank provides custodial services to the Schemes for which it receives custody fees including
safekeeping (including transaction and registration charges).
5A Custodian Confirmation
Confirmation has been received from JPMorgan Chase Bank at the end of the year for the investments held by the
Schemes. All investments, except Government Securities, Reverse Repos and Collateralised Borrowing and
Lending Obligation (CBLO), units of mutual fund are held in safe custody of the custodian.
6 Income Taxes No provision for income tax is made as Schemes qualify as a recognized mutual fund under Section 10(23D) of the Income Tax Act, 1961.

HSBC MUTUAL FUND HSBC EQUITY FUND, HSBC INDIA OPPORTUNITIES FUND, HSBC UNIQUE OPPORTUNITIES
FUND, HSBC DYNAMIC FUND and HSBC TAX SAVER EQUITY FUND
Schedules forming part of the Balance Sheet as at March 31, 2013 and the Revenue Account for the year ended March 31, 2013
7 Limitation on Expenses
The total expenses chargeable to HSBC Dynamic Fund (HDF) are limited to 2.64% of average daily net assets of
Schemes. HSBC Asset Management (India) Private Limited has borne following amounts of expenses in excess
of the below stated percentage of the average daily net assets to be charged to HDF as total expenses for the year.
Name of the Scheme Percentage of average daily net
assets Excess expense borne by
investment manager (Rupees)
March 2013 March 2012 March 2013 March 2012
HDF 2.64 2.50 178,764 - HUOF 2.67 2.50 - 307,3559
8 Aggregate Appreciation and Depreciation in Value of Investments and Derivatives
Aggregate appreciation and depreciation in value of investments and derivatives are as follows:
March 31, 2013 March 31, 2012
Equity Shares Equity Shares
HEF - Appreciation 1,243,676,670 1,438,679,189
- Depreciation 291,496,330 175,340,409 HIOF
- Appreciation 396,108,991 387,712,226 - Depreciation 141,767,777 21,376,931 HUOF
- Appreciation 106,022,228 86,124,878 - Depreciation 28,574,444 21,874,218 HDF
- Appreciation 188,393,378 174,581,944 - Depreciation 51,959,733 16,299,640 HTSF
- Appreciation 377,882,008 388,369,529 - Depreciation 100,060,423 53,721,498
9 Aggregate Value of Purchases and Sale of Investments
The aggregate value of investment securities (excluding CBLO and Reverse Repos) purchased and sold (including matured) during the year (excluding accretion of discount) and their percentage of the respective average daily net assets are as follows:
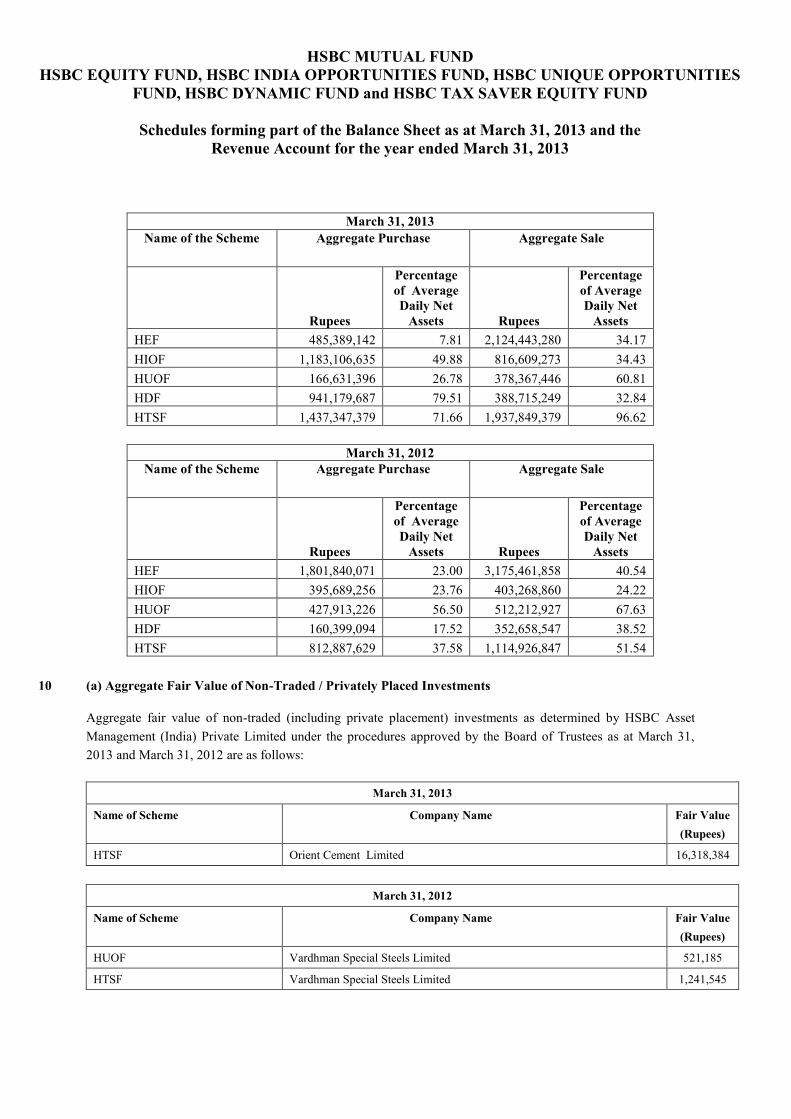
HSBC MUTUAL FUND HSBC EQUITY FUND, HSBC INDIA OPPORTUNITIES FUND, HSBC UNIQUE OPPORTUNITIES
FUND, HSBC DYNAMIC FUND and HSBC TAX SAVER EQUITY FUND
Schedules forming part of the Balance Sheet as at March 31, 2013 and the Revenue Account for the year ended March 31, 2013
March 31, 2013 Name of the Scheme Aggregate Purchase Aggregate Sale
Rupees
Percentage of Average Daily Net
Assets Rupees
Percentage of Average Daily Net
Assets HEF 485,389,142 7.81 2,124,443,280 34.17 HIOF 1,183,106,635 49.88 816,609,273 34.43 HUOF 166,631,396 26.78 378,367,446 60.81 HDF 941,179,687 79.51 388,715,249 32.84 HTSF 1,437,347,379 71.66 1,937,849,379 96.62
March 31, 2012
Name of the Scheme Aggregate Purchase Aggregate Sale
Rupees
Percentage of Average Daily Net
Assets Rupees
Percentage of Average Daily Net
Assets HEF 1,801,840,071 23.00 3,175,461,858 40.54 HIOF 395,689,256 23.76 403,268,860 24.22 HUOF 427,913,226 56.50 512,212,927 67.63 HDF 160,399,094 17.52 352,658,547 38.52 HTSF 812,887,629 37.58 1,114,926,847 51.54
10 (a) Aggregate Fair Value of Non-Traded / Privately Placed Investments
Aggregate fair value of non-traded (including private placement) investments as determined by HSBC Asset Management (India) Private Limited under the procedures approved by the Board of Trustees as at March 31, 2013 and March 31, 2012 are as follows:
March 31, 2013
Name of Scheme Company Name Fair Value (Rupees)
HTSF Orient Cement Limited 16,318,384
March 31, 2012
Name of Scheme Company Name Fair Value (Rupees)
HUOF Vardhman Special Steels Limited 521,185
HTSF Vardhman Special Steels Limited 1,241,545
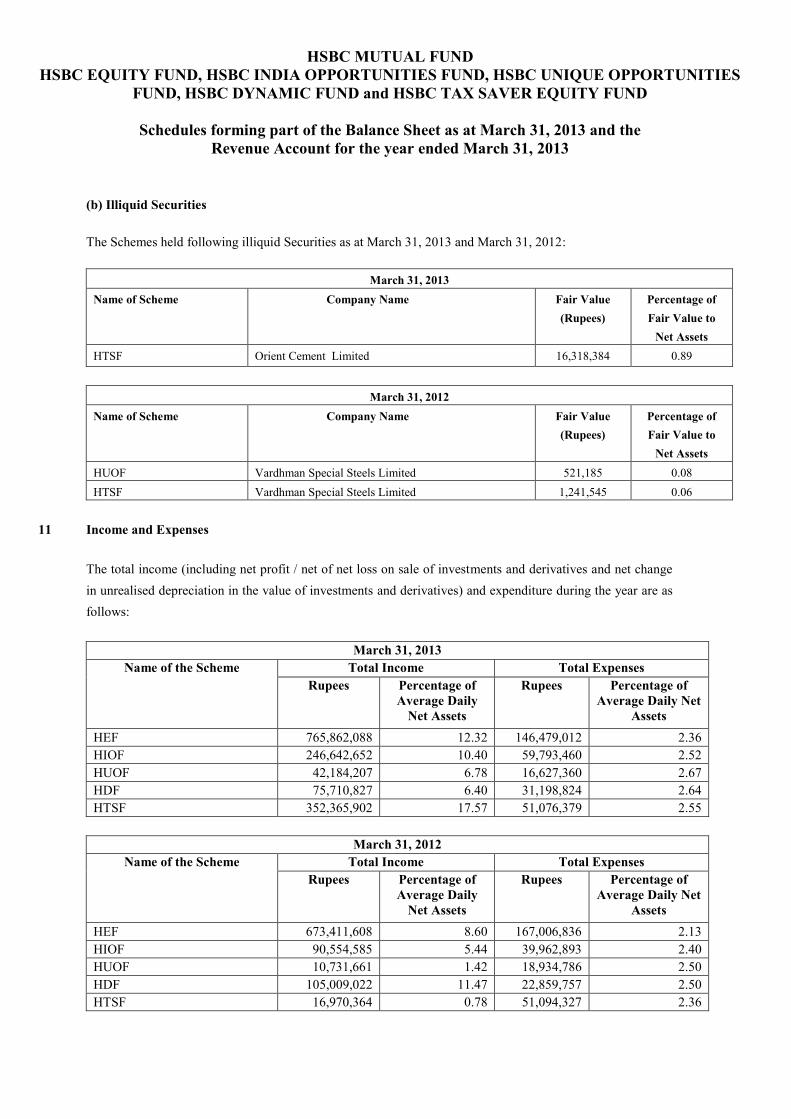
HSBC MUTUAL FUND HSBC EQUITY FUND, HSBC INDIA OPPORTUNITIES FUND, HSBC UNIQUE OPPORTUNITIES
FUND, HSBC DYNAMIC FUND and HSBC TAX SAVER EQUITY FUND
Schedules forming part of the Balance Sheet as at March 31, 2013 and the Revenue Account for the year ended March 31, 2013
(b) Illiquid Securities The Schemes held following illiquid Securities as at March 31, 2013 and March 31, 2012:
March 31, 2013 Name of Scheme Company Name Fair Value
(Rupees) Percentage of Fair Value to
Net Assets HTSF Orient Cement Limited 16,318,384 0.89
March 31, 2012
Name of Scheme Company Name Fair Value (Rupees)
Percentage of Fair Value to
Net Assets HUOF Vardhman Special Steels Limited 521,185 0.08 HTSF Vardhman Special Steels Limited 1,241,545 0.06
11 Income and Expenses
The total income (including net profit / net of net loss on sale of investments and derivatives and net change in unrealised depreciation in the value of investments and derivatives) and expenditure during the year are as follows:
March 31, 2013 Name of the Scheme Total Income Total Expenses
Rupees Percentage of Average Daily
Net Assets
Rupees Percentage of Average Daily Net
Assets HEF 765,862,088 12.32 146,479,012 2.36 HIOF 246,642,652 10.40 59,793,460 2.52 HUOF 42,184,207 6.78 16,627,360 2.67 HDF 75,710,827 6.40 31,198,824 2.64 HTSF 352,365,902 17.57 51,076,379 2.55
March 31, 2012
Name of the Scheme Total Income Total Expenses Rupees Percentage of
Average Daily Net Assets
Rupees Percentage of Average Daily Net
Assets HEF 673,411,608 8.60 167,006,836 2.13 HIOF 90,554,585 5.44 39,962,893 2.40 HUOF 10,731,661 1.42 18,934,786 2.50 HDF 105,009,022 11.47 22,859,757 2.50 HTSF 16,970,364 0.78 51,094,327 2.36
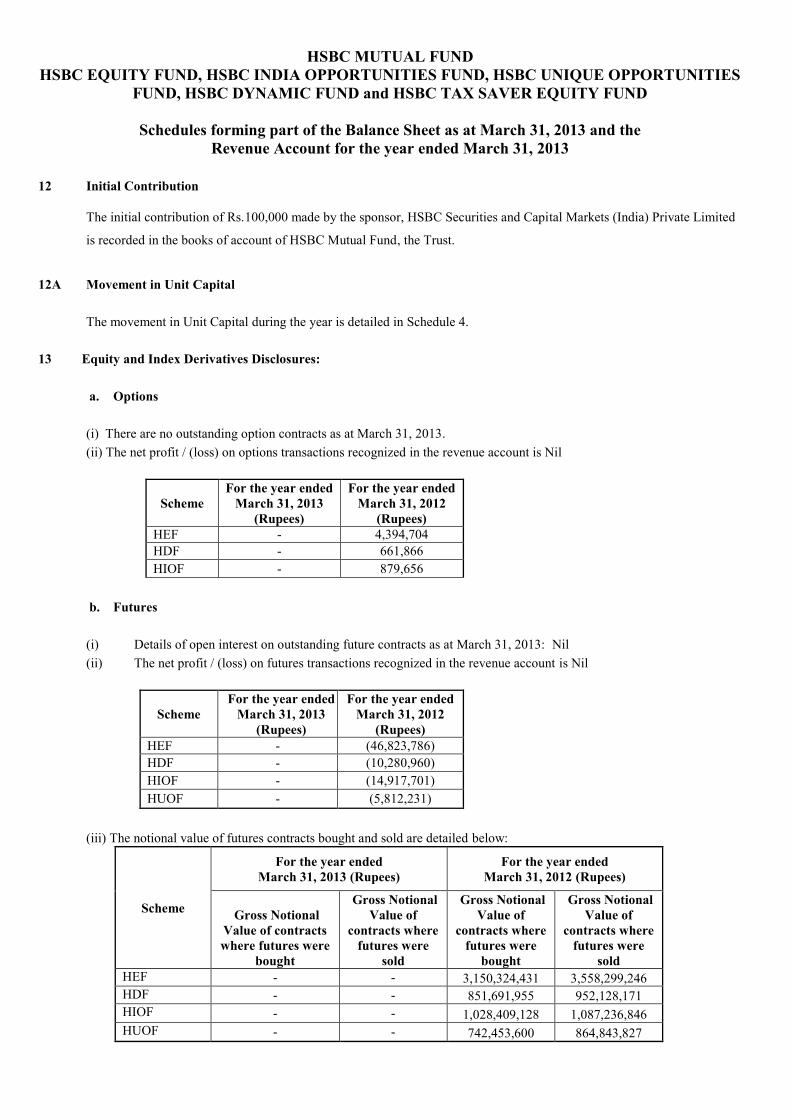
HSBC MUTUAL FUND HSBC EQUITY FUND, HSBC INDIA OPPORTUNITIES FUND, HSBC UNIQUE OPPORTUNITIES
FUND, HSBC DYNAMIC FUND and HSBC TAX SAVER EQUITY FUND
Schedules forming part of the Balance Sheet as at March 31, 2013 and the Revenue Account for the year ended March 31, 2013
12 Initial Contribution
The initial contribution of Rs.100,000 made by the sponsor, HSBC Securities and Capital Markets (India) Private Limited
is recorded in the books of account of HSBC Mutual Fund, the Trust.
12A Movement in Unit Capital The movement in Unit Capital during the year is detailed in Schedule 4. 13 Equity and Index Derivatives Disclosures:
a. Options
(i) There are no outstanding option contracts as at March 31, 2013. (ii) The net profit / (loss) on options transactions recognized in the revenue account is Nil
Scheme For the year ended
March 31, 2013 (Rupees)
For the year ended March 31, 2012
(Rupees) HEF - 4,394,704 HDF - 661,866 HIOF - 879,656
b. Futures
(i) Details of open interest on outstanding future contracts as at March 31, 2013: Nil (ii) The net profit / (loss) on futures transactions recognized in the revenue account is Nil
Scheme For the year ended
March 31, 2013 (Rupees)
For the year ended March 31, 2012
(Rupees) HEF - (46,823,786) HDF - (10,280,960) HIOF - (14,917,701) HUOF - (5,812,231)
(iii) The notional value of futures contracts bought and sold are detailed below:
Scheme
For the year ended March 31, 2013 (Rupees)
For the year ended March 31, 2012 (Rupees)
Gross Notional Value of contracts where futures were
bought
Gross Notional Value of
contracts where futures were
sold
Gross Notional Value of
contracts where futures were
bought
Gross Notional Value of
contracts where futures were
sold HEF - - 3,150,324,431 3,558,299,246 HDF - - 851,691,955 952,128,171 HIOF - - 1,028,409,128 1,087,236,846 HUOF - - 742,453,600 864,843,827
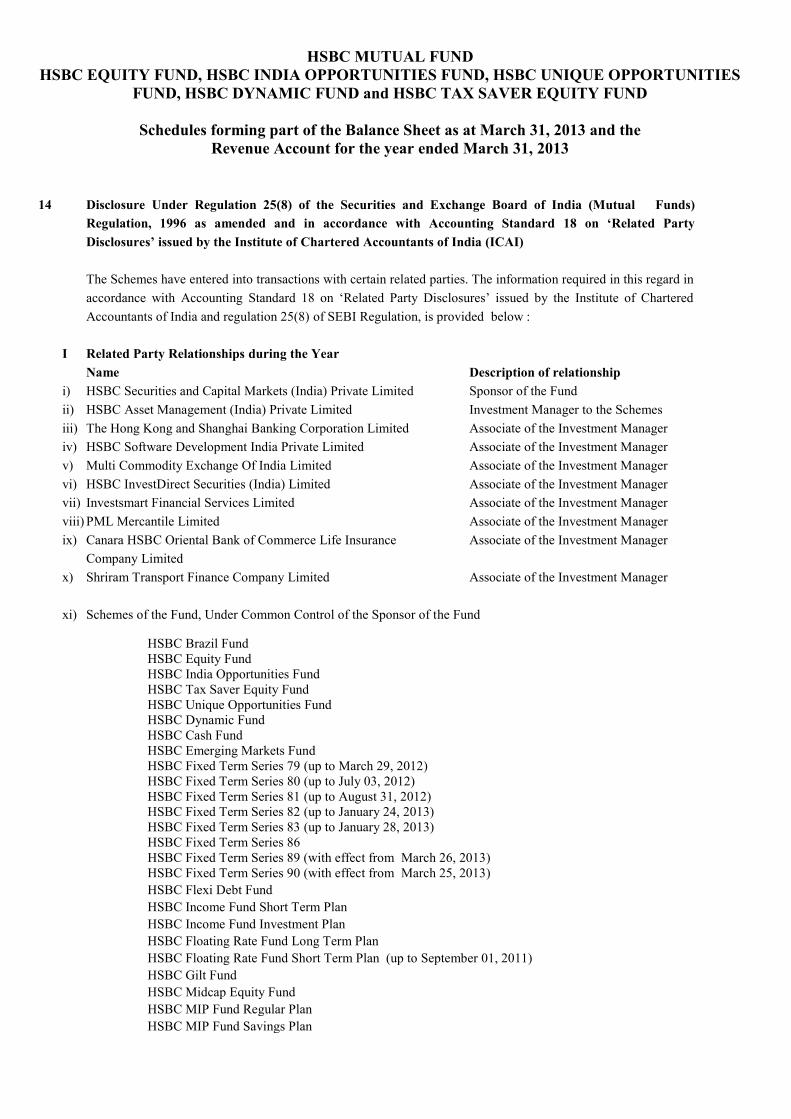
HSBC MUTUAL FUND HSBC EQUITY FUND, HSBC INDIA OPPORTUNITIES FUND, HSBC UNIQUE OPPORTUNITIES
FUND, HSBC DYNAMIC FUND and HSBC TAX SAVER EQUITY FUND
Schedules forming part of the Balance Sheet as at March 31, 2013 and the Revenue Account for the year ended March 31, 2013
14 Disclosure Under Regulation 25(8) of the Securities and Exchange Board of India (Mutual Funds)
Regulation, 1996 as amended and in accordance with Accounting Standard 18 on ‘Related Party Disclosures’ issued by the Institute of Chartered Accountants of India (ICAI)
The Schemes have entered into transactions with certain related parties. The information required in this regard in accordance with Accounting Standard 18 on ‘Related Party Disclosures’ issued by the Institute of Chartered Accountants of India and regulation 25(8) of SEBI Regulation, is provided below :
I Related Party Relationships during the Year Name Description of relationship i) HSBC Securities and Capital Markets (India) Private Limited Sponsor of the Fund ii) HSBC Asset Management (India) Private Limited Investment Manager to the Schemes iii) The Hong Kong and Shanghai Banking Corporation Limited Associate of the Investment Manager iv) HSBC Software Development India Private Limited Associate of the Investment Manager v) Multi Commodity Exchange Of India Limited Associate of the Investment Manager vi) HSBC InvestDirect Securities (India) Limited Associate of the Investment Manager vii) Investsmart Financial Services Limited Associate of the Investment Manager viii) PML Mercantile Limited Associate of the Investment Manager ix) Canara HSBC Oriental Bank of Commerce Life Insurance Associate of the Investment Manager Company Limited x) Shriram Transport Finance Company Limited Associate of the Investment Manager xi) Schemes of the Fund, Under Common Control of the Sponsor of the Fund
HSBC Brazil Fund HSBC Equity Fund HSBC India Opportunities Fund HSBC Tax Saver Equity Fund HSBC Unique Opportunities Fund HSBC Dynamic Fund HSBC Cash Fund HSBC Emerging Markets Fund HSBC Fixed Term Series 79 (up to March 29, 2012) HSBC Fixed Term Series 80 (up to July 03, 2012) HSBC Fixed Term Series 81 (up to August 31, 2012) HSBC Fixed Term Series 82 (up to January 24, 2013) HSBC Fixed Term Series 83 (up to January 28, 2013) HSBC Fixed Term Series 86 HSBC Fixed Term Series 89 (with effect from March 26, 2013) HSBC Fixed Term Series 90 (with effect from March 25, 2013) HSBC Flexi Debt Fund HSBC Income Fund Short Term Plan HSBC Income Fund Investment Plan HSBC Floating Rate Fund Long Term Plan HSBC Floating Rate Fund Short Term Plan (up to September 01, 2011) HSBC Gilt Fund HSBC Midcap Equity Fund HSBC MIP Fund Regular Plan HSBC MIP Fund Savings Plan
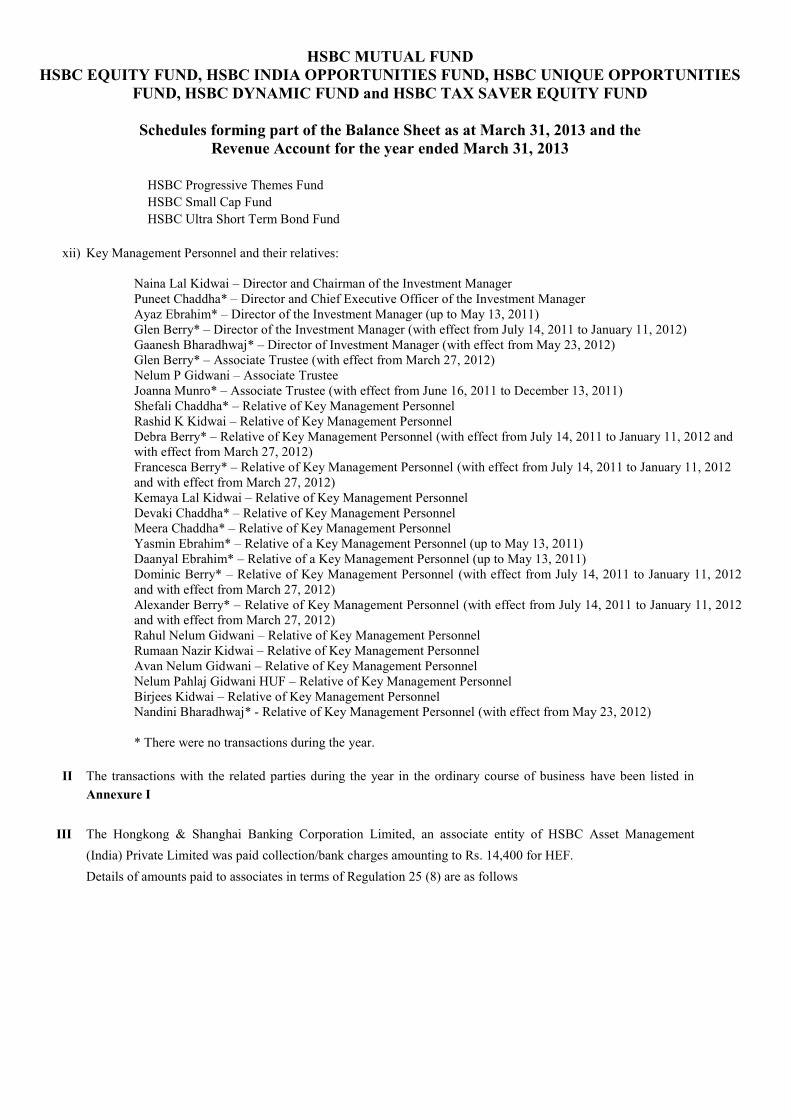
HSBC MUTUAL FUND HSBC EQUITY FUND, HSBC INDIA OPPORTUNITIES FUND, HSBC UNIQUE OPPORTUNITIES
FUND, HSBC DYNAMIC FUND and HSBC TAX SAVER EQUITY FUND
Schedules forming part of the Balance Sheet as at March 31, 2013 and the Revenue Account for the year ended March 31, 2013
HSBC Progressive Themes Fund HSBC Small Cap Fund HSBC Ultra Short Term Bond Fund
xii) Key Management Personnel and their relatives:
Naina Lal Kidwai – Director and Chairman of the Investment Manager Puneet Chaddha* – Director and Chief Executive Officer of the Investment Manager Ayaz Ebrahim* – Director of the Investment Manager (up to May 13, 2011) Glen Berry* – Director of the Investment Manager (with effect from July 14, 2011 to January 11, 2012) Gaanesh Bharadhwaj* – Director of Investment Manager (with effect from May 23, 2012) Glen Berry* – Associate Trustee (with effect from March 27, 2012) Nelum P Gidwani – Associate Trustee Joanna Munro* – Associate Trustee (with effect from June 16, 2011 to December 13, 2011) Shefali Chaddha* – Relative of Key Management Personnel Rashid K Kidwai – Relative of Key Management Personnel Debra Berry* – Relative of Key Management Personnel (with effect from July 14, 2011 to January 11, 2012 and with effect from March 27, 2012) Francesca Berry* – Relative of Key Management Personnel (with effect from July 14, 2011 to January 11, 2012 and with effect from March 27, 2012) Kemaya Lal Kidwai – Relative of Key Management Personnel Devaki Chaddha* – Relative of Key Management Personnel Meera Chaddha* – Relative of Key Management Personnel Yasmin Ebrahim* – Relative of a Key Management Personnel (up to May 13, 2011) Daanyal Ebrahim* – Relative of a Key Management Personnel (up to May 13, 2011) Dominic Berry* – Relative of Key Management Personnel (with effect from July 14, 2011 to January 11, 2012 and with effect from March 27, 2012) Alexander Berry* – Relative of Key Management Personnel (with effect from July 14, 2011 to January 11, 2012 and with effect from March 27, 2012) Rahul Nelum Gidwani – Relative of Key Management Personnel Rumaan Nazir Kidwai – Relative of Key Management Personnel Avan Nelum Gidwani – Relative of Key Management Personnel Nelum Pahlaj Gidwani HUF – Relative of Key Management Personnel Birjees Kidwai – Relative of Key Management Personnel Nandini Bharadhwaj* - Relative of Key Management Personnel (with effect from May 23, 2012) * There were no transactions during the year.
II The transactions with the related parties during the year in the ordinary course of business have been listed in Annexure I
III The Hongkong & Shanghai Banking Corporation Limited, an associate entity of HSBC Asset Management (India) Private Limited was paid collection/bank charges amounting to Rs. 14,400 for HEF. Details of amounts paid to associates in terms of Regulation 25 (8) are as follows
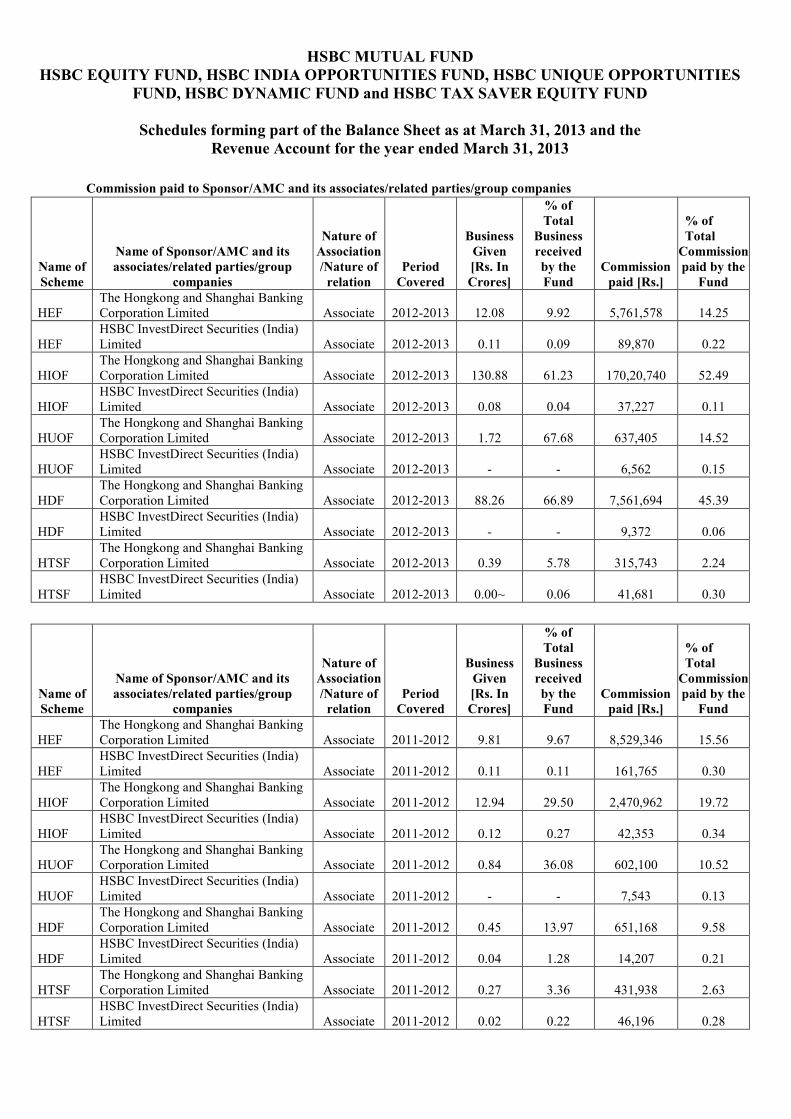
HSBC MUTUAL FUND HSBC EQUITY FUND, HSBC INDIA OPPORTUNITIES FUND, HSBC UNIQUE OPPORTUNITIES
FUND, HSBC DYNAMIC FUND and HSBC TAX SAVER EQUITY FUND
Schedules forming part of the Balance Sheet as at March 31, 2013 and the Revenue Account for the year ended March 31, 2013
Commission paid to Sponsor/AMC and its associates/related parties/group companies
Name of Scheme
Name of Sponsor/AMC and its associates/related parties/group
companies
Nature of Association /Nature of
relation Period
Covered
Business Given [Rs. In Crores]
% of Total
Business received by the Fund
Commission paid [Rs.]
% of Total
Commission paid by the
Fund
HEF The Hongkong and Shanghai Banking Corporation Limited Associate 2012-2013 12.08 9.92 5,761,578 14.25
HEF HSBC InvestDirect Securities (India) Limited Associate 2012-2013 0.11 0.09 89,870 0.22
HIOF The Hongkong and Shanghai Banking Corporation Limited Associate 2012-2013 130.88 61.23 170,20,740 52.49
HIOF HSBC InvestDirect Securities (India) Limited Associate 2012-2013 0.08 0.04 37,227 0.11
HUOF The Hongkong and Shanghai Banking Corporation Limited Associate 2012-2013 1.72 67.68 637,405 14.52
HUOF HSBC InvestDirect Securities (India) Limited Associate 2012-2013 - - 6,562 0.15
HDF The Hongkong and Shanghai Banking Corporation Limited Associate 2012-2013 88.26 66.89 7,561,694 45.39
HDF HSBC InvestDirect Securities (India) Limited Associate 2012-2013 - - 9,372 0.06
HTSF The Hongkong and Shanghai Banking Corporation Limited Associate 2012-2013 0.39 5.78 315,743 2.24
HTSF HSBC InvestDirect Securities (India) Limited Associate 2012-2013 0.00~ 0.06 41,681 0.30
Name of Scheme
Name of Sponsor/AMC and its associates/related parties/group
companies
Nature of Association /Nature of
relation Period
Covered
Business Given [Rs. In Crores]
% of Total
Business received by the Fund
Commission paid [Rs.]
% of Total
Commission paid by the
Fund
HEF The Hongkong and Shanghai Banking Corporation Limited Associate 2011-2012 9.81 9.67 8,529,346 15.56
HEF HSBC InvestDirect Securities (India) Limited Associate 2011-2012 0.11 0.11 161,765 0.30
HIOF The Hongkong and Shanghai Banking Corporation Limited Associate 2011-2012 12.94 29.50 2,470,962 19.72
HIOF HSBC InvestDirect Securities (India) Limited Associate 2011-2012 0.12 0.27 42,353 0.34
HUOF The Hongkong and Shanghai Banking Corporation Limited Associate 2011-2012 0.84 36.08 602,100 10.52
HUOF HSBC InvestDirect Securities (India) Limited Associate 2011-2012 - - 7,543 0.13
HDF The Hongkong and Shanghai Banking Corporation Limited Associate 2011-2012 0.45 13.97 651,168 9.58
HDF HSBC InvestDirect Securities (India) Limited Associate 2011-2012 0.04 1.28 14,207 0.21
HTSF The Hongkong and Shanghai Banking Corporation Limited Associate 2011-2012 0.27 3.36 431,938 2.63
HTSF HSBC InvestDirect Securities (India) Limited Associate 2011-2012 0.02 0.22 46,196 0.28
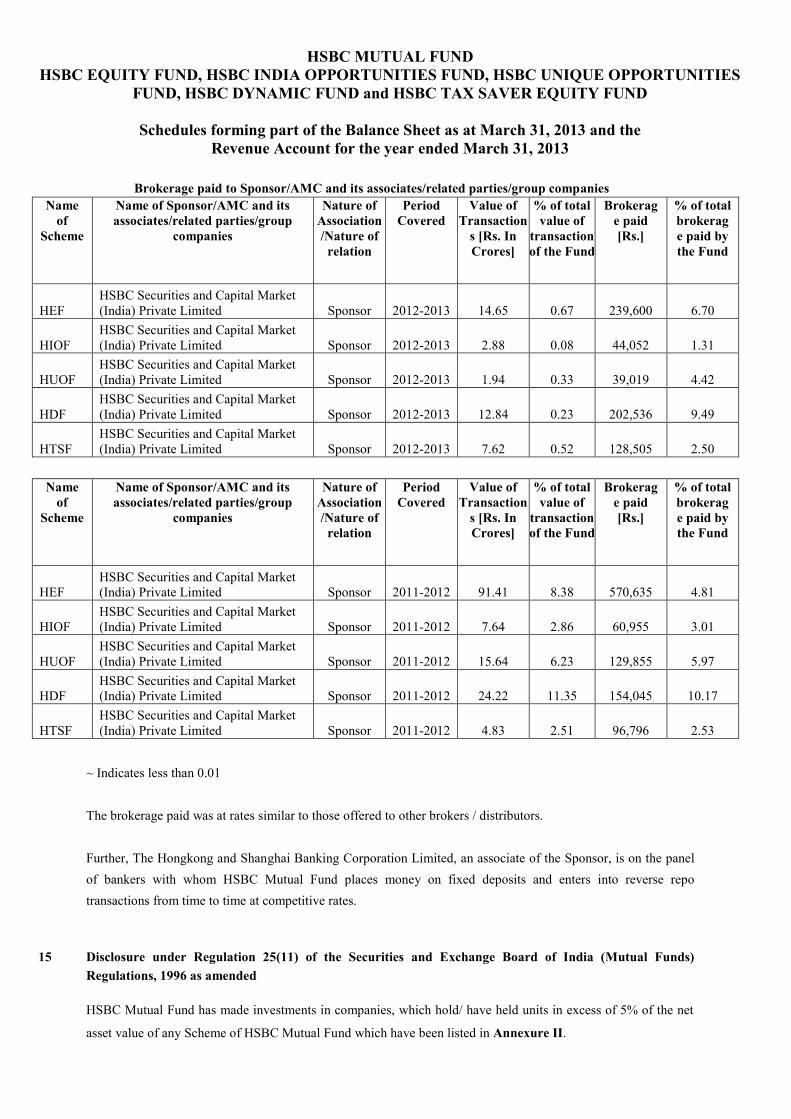
HSBC MUTUAL FUND HSBC EQUITY FUND, HSBC INDIA OPPORTUNITIES FUND, HSBC UNIQUE OPPORTUNITIES
FUND, HSBC DYNAMIC FUND and HSBC TAX SAVER EQUITY FUND
Schedules forming part of the Balance Sheet as at March 31, 2013 and the Revenue Account for the year ended March 31, 2013
Brokerage paid to Sponsor/AMC and its associates/related parties/group companies Name
of Scheme
Name of Sponsor/AMC and its associates/related parties/group
companies
Nature of Association /Nature of
relation
Period Covered
Value of Transaction
s [Rs. In Crores]
% of total value of
transaction of the Fund
Brokerage paid [Rs.]
% of total brokerage paid by the Fund
HEF HSBC Securities and Capital Market (India) Private Limited Sponsor 2012-2013 14.65 0.67 239,600 6.70
HIOF HSBC Securities and Capital Market (India) Private Limited Sponsor 2012-2013 2.88 0.08 44,052 1.31
HUOF HSBC Securities and Capital Market (India) Private Limited Sponsor 2012-2013 1.94 0.33 39,019 4.42
HDF HSBC Securities and Capital Market (India) Private Limited Sponsor 2012-2013 12.84 0.23 202,536 9.49
HTSF HSBC Securities and Capital Market (India) Private Limited Sponsor 2012-2013 7.62 0.52 128,505 2.50
Name
of Scheme
Name of Sponsor/AMC and its associates/related parties/group
companies
Nature of Association /Nature of
relation
Period Covered
Value of Transaction
s [Rs. In Crores]
% of total value of
transaction of the Fund
Brokerage paid [Rs.]
% of total brokerage paid by the Fund
HEF HSBC Securities and Capital Market (India) Private Limited Sponsor 2011-2012 91.41 8.38 570,635 4.81
HIOF HSBC Securities and Capital Market (India) Private Limited Sponsor 2011-2012 7.64 2.86 60,955 3.01
HUOF HSBC Securities and Capital Market (India) Private Limited Sponsor 2011-2012 15.64 6.23 129,855 5.97
HDF HSBC Securities and Capital Market (India) Private Limited Sponsor 2011-2012 24.22 11.35 154,045 10.17
HTSF HSBC Securities and Capital Market (India) Private Limited Sponsor 2011-2012 4.83 2.51 96,796 2.53
~ Indicates less than 0.01 The brokerage paid was at rates similar to those offered to other brokers / distributors. Further, The Hongkong and Shanghai Banking Corporation Limited, an associate of the Sponsor, is on the panel of bankers with whom HSBC Mutual Fund places money on fixed deposits and enters into reverse repo transactions from time to time at competitive rates.
15 Disclosure under Regulation 25(11) of the Securities and Exchange Board of India (Mutual Funds) Regulations, 1996 as amended HSBC Mutual Fund has made investments in companies, which hold/ have held units in excess of 5% of the net
asset value of any Scheme of HSBC Mutual Fund which have been listed in Annexure II.

HSBC MUTUAL FUND HSBC EQUITY FUND, HSBC INDIA OPPORTUNITIES FUND, HSBC UNIQUE OPPORTUNITIES
FUND, HSBC DYNAMIC FUND and HSBC TAX SAVER EQUITY FUND
Schedules forming part of the Balance Sheet as at March 31, 2013 and the Revenue Account for the year ended March 31, 2013
The investments comprise equity shares, debentures/ bonds, commercial paper, fixed deposits and other debt
instruments and were made solely on the basis of sound fundamentals of these companies.
16 Segment Reporting
The Schemes are primarily engaged in the business of investing, amounts received from investors as unit capital, in
accordance with their investment objectives to generate returns. Since there is only one business segment and no
geographical segments, the segmental reporting disclosures as required by Accounting Standard (AS)-17, issued by the
Institute of Chartered Accountants of India have not been made.
17 Unclaimed Dividend and Unclaimed Redemption The amounts of unclaimed dividends and unclaimed redemption proceeds as on March 31, 2013 and the number of
investors to whom the amounts are payable are as follows: -
31-Mar-13 Schemes Unclaimed Dividend Unclaimed Redemption
No. of investors
Amount (Rupees)
Units Market Value
No. of investors
Amount (Rupees)
Units Market Value
(Rupees) * (Rupees) * HEF 986 4,225,053 4,940.625 5,774,690 198 6,707,514 5,977.82 6,986,980 HIOF 387 1,026,412 1,131.183 1,322,147 54 1,377,718 1,222.67 1,429,073 HUOF - - - - 55 1,407,480 1,318.74 1,541,371 HDF - - - - 79 3,161,545 2,727.44 3,187,882 HTSF 489 617,122 621.060 725,906 122 2,093,097 1,588.67 1,856,862
* Invested in HSBC Cash Fund – Growth Option and HSBC Cash Fund – Direct Growth Option 18 Margin Deposit with Clearing Corporation of India Limited
The Schemes have placed margin deposit with Clearing Corporation of India Limited, of which the following amounts are
towards 'Securities Segment' transactions and 'Collateralised Borrowing and Lending Obligation' transactions. These
deposits are held in the name of HSBC Mutual Fund.
March 31, 2012 Schemes Unclaimed Dividend Unclaimed Redemption
No. of investors
Amount (Rupees)
Units Market Value (Rupees) *
No. of investors
Amount (Rupees)
Units Market Value
(Rupees) * HEF 1091 6,603,011 325,083.856 5,511,439 98 2,650,628 180,925.778 3,067,398
HIOF 399 1,028,196 74,501.241 1,263,087 30 795,304 50,929.823 863,459
HUOF - - - - 28 892,553 58,106.546 985,133
HDF - - - - 42 1,549,276 90,736.575 1,538,339
HTSF 584 747,753 43,722.155 741,261 59 916,380 52,902.875 896,910

HSBC MUTUAL FUND HSBC EQUITY FUND, HSBC INDIA OPPORTUNITIES FUND, HSBC UNIQUE OPPORTUNITIES
FUND, HSBC DYNAMIC FUND and HSBC TAX SAVER EQUITY FUND
Schedules forming part of the Balance Sheet as at March 31, 2013 and the Revenue Account for the year ended March 31, 2013
19 Miscellaneous Income
Miscellaneous Income comprises of the following: 20 Net Asset Value Per Unit
The net asset value disclosed below represents the computed NAV on March 31, 2013 (non-business day), and not the last declared NAV. HEF HIOF HUOF HDF HTSF Plan 2013 2012 2013 2012 2013 2012 2013 2012 2013 2012
Rupees Rupees Rupees Rupees Rupees Rupees Rupees Rupees Rupees Rupees
Growth Option 100.1318 95.8173 34.6079 34.3676 10.6718 10.1530 9.7899 9.6041 15.6680 13.9463 Dividend Option 22.7799 24.1020 14.9168 16.1900 10.6718 10.1530 9.7899 9.6041 14.4505 12.8626 Direct Plan - Growth Option 100.4499 - 34.7041 - 10.6935 - 9.8125 - 15.7114 - Direct Plan - Dividend Option 22.8126 - 15.0520 - 10.6935 - 9.8125 - 14.4900 -
Pursuant to SEBI circular no. CIR/IMD/DF/21/2012 dated September 13, 2012, HSBC Mutual Fund has introduced separate plan for direct investments (i.e. investments routed without intermediary) with effect from January 1, 2013. These plans are introduced in all existing schemes of the Fund except the Schemes/Plans discontinued for further subscriptions. From January 01, 2013, applicable NAV (including equalization reserve per unit and unit premium reserve per unit) used for allotment of units on the first transaction in the direct plans were of corresponding option under the existing plan as on December 31, 2012 for HSBC Cash Fund and as on January 01, 2013 for other schemes. Thereafter, separate NAVs are calculated and published for direct plans.
21 Prior Year’s Figures
Previous year’s figures have been re-grouped/re-arranged where necessary.
March 31, 2013 Name of the
Scheme Total amount of
Margin deposit with Clearing Corporation
of India Limited
Deposit made towards Security Segment
transactions
Deposit made towards Collateralised
Borrowing and Lending Obligation transactions
HEF 1,00,000 - 1,00,000
Name of the Scheme
Description of the income March 31, 2013 Amount (Rupees)
HEF Exit load credited to the scheme 2,646,864 HEF Provision for expenses written back since no
longer required 336,960
HIOF Exit load credited to the scheme 3,354,520 HIOF Provision for expenses written back since no
longer required 165,100
HUOF Exit load credited to the scheme 4,747 HUOF Provision for expenses written back since no
longer required 83,800
HDF Exit load credited to the scheme 2,069,073 HDF Provision for expenses written back since no
longer required 72,800

HSBC MUTUAL FUND HSBC EQUITY FUND, HSBC INDIA OPPORTUNITIES FUND, HSBC UNIQUE OPPORTUNITIES
FUND, HSBC DYNAMIC FUND and HSBC TAX SAVER EQUITY FUND
Schedules forming part of the Balance Sheet as at March 31, 2013 and the Revenue Account for the year ended March 31, 2013
Signatures to the Schedules 1 to 8 forming part of the Balance Sheet and the Revenue Account.
For PRICE WATERHOUSE Firm Registration Number: 301112E
Chartered Accountants
For Board of Trustees of HSBC Mutual Fund
For HSBC Asset Management (India) Private Limited
sd/- VIVEK PRASAD Partner Membership No. 104941
sd/- N.P.Gidwani Trustee
sd/- Puneet Chaddha
Director and Chief Executive Officer
sd/- Dilip J. Thakkar Trustee
sd/- Kishori J. Udeshi Director
Place: Mumbai Date : July 16, 2013
sd/- Tushar Pradhan Fund Manager sd/- Sanjay Shah Fund Manager
sd/- Aditya Khemani Fund Manager sd/- Amaresh Mishra Fund Manager sd/- Gaurav Mehrotra Fund Manager
sd/- Neelotpal Sahai Fund Manager
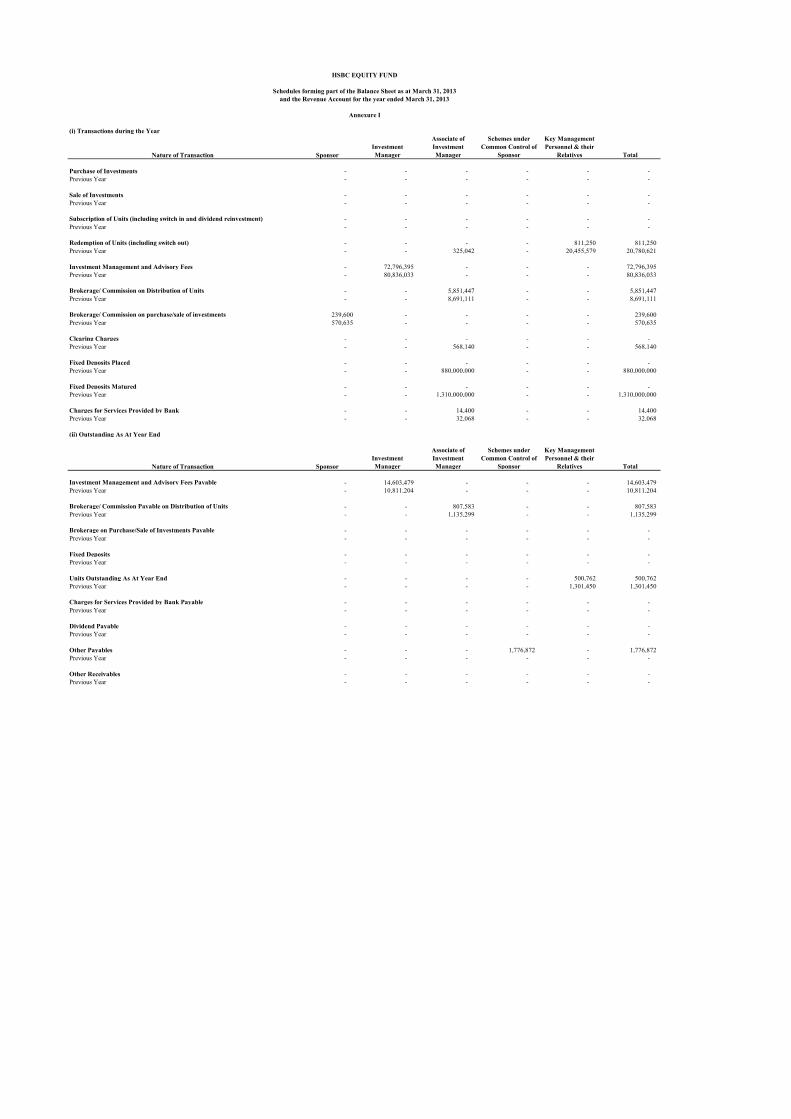
(i) Transactions during the Year
Nature of Transaction SponsorInvestment Manager
Associate of Investment Manager
Schemes under Common Control of
Sponsor
Key Management Personnel & their
Relatives Total
Purchase of Investments - - - - - - Previous Year - - - - - -
Sale of Investments - - - - - - Previous Year - - - - - -
Subscription of Units (including switch in and dividend reinvestment) - - - - - - Previous Year - - - - - -
Redemption of Units (including switch out) - - - - 811,250 811,250 Previous Year - - 325,042 - 20,455,579 20,780,621
Investment Management and Advisory Fees - 72,796,395 - - - 72,796,395 Previous Year - 80,836,033 - - - 80,836,033
Brokerage/ Commission on Distribution of Units - - 5,851,447 - - 5,851,447 Previous Year - - 8,691,111 - - 8,691,111
Brokerage/ Commission on purchase/sale of investments 239,600 - - - - 239,600 Previous Year 570,635 - - - - 570,635
Clearing Charges - - - - - - Previous Year - - 568,140 - - 568,140
Fixed Deposits Placed - - - - - - Previous Year - - 880,000,000 - - 880,000,000
Fixed Deposits Matured - - - - - - Previous Year - - 1,310,000,000 - - 1,310,000,000
Charges for Services Provided by Bank - - 14,400 - - 14,400 Previous Year - - 32,068 - - 32,068
(ii) Outstanding As At Year End
Nature of Transaction SponsorInvestment Manager
Associate of Investment Manager
Schemes under Common Control of
Sponsor
Key Management Personnel & their
Relatives Total
Investment Management and Advisory Fees Payable - 14,603,479 - - - 14,603,479 Previous Year - 10,811,204 - - - 10,811,204
Brokerage/ Commission Payable on Distribution of Units - - 807,583 - - 807,583 Previous Year - - 1,135,299 - - 1,135,299
Brokerage on Purchase/Sale of Investments Payable - - - - - - Previous Year - - - - - -
Fixed Deposits - - - - - - Previous Year - - - - - -
Units Outstanding As At Year End - - - - 500,762 500,762 Previous Year - - - - 1,301,450 1,301,450
Charges for Services Provided by Bank Payable - - - - - - Previous Year - - - - - -
Dividend Payable - - - - - - Previous Year - - - - - -
Other Payables - - - 1,776,872 - 1,776,872 Previous Year - - - - - -
Other Receivables - - - - - - Previous Year - - - - - -
HSBC EQUITY FUND
Schedules forming part of the Balance Sheet as at March 31, 2013and the Revenue Account for the year ended March 31, 2013
Annexure I
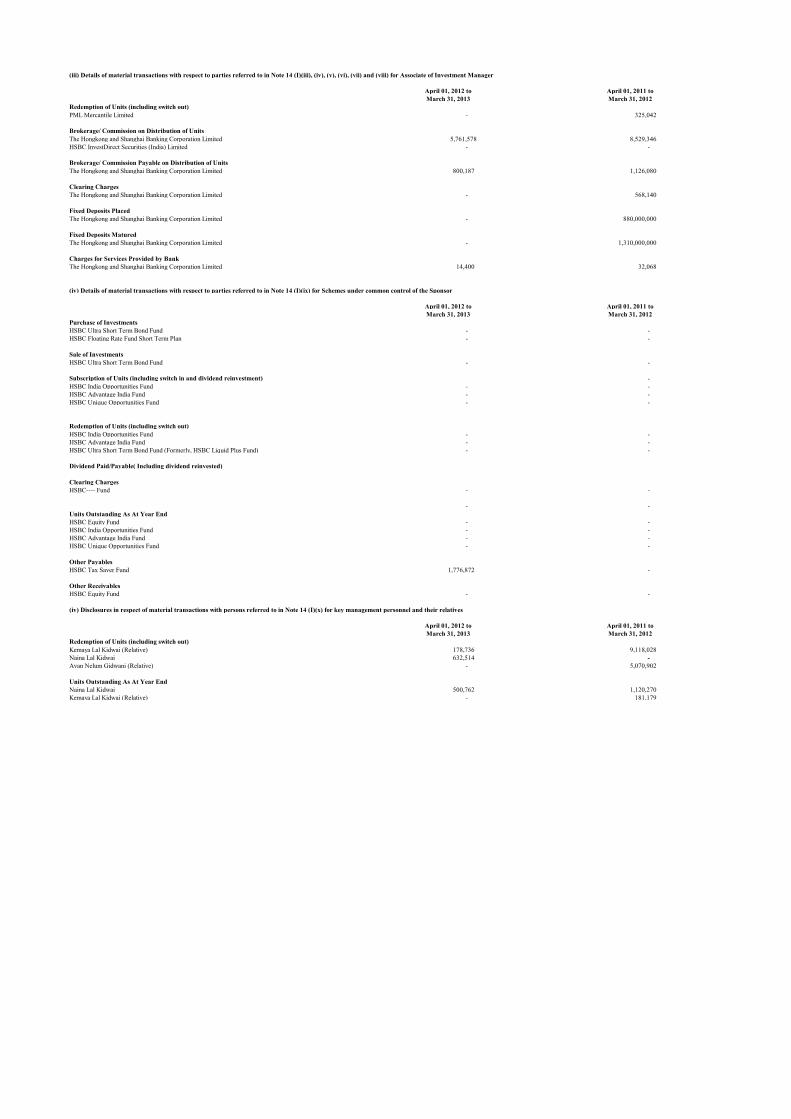
(iii) Details of material transactions with respect to parties referred to in Note 14 (I)(iii), (iv), (v), (vi), (vii) and (viii) for Associate of Investment Manager
April 01, 2012 to April 01, 2011 toMarch 31, 2013 March 31, 2012
Redemption of Units (including switch out)PML Mercantile Limited - 325,042
Brokerage/ Commission on Distribution of UnitsThe Hongkong and Shanghai Banking Corporation Limited 5,761,578 8,529,346 HSBC InvestDirect Securities (India) Limited - -
Brokerage/ Commission Payable on Distribution of UnitsThe Hongkong and Shanghai Banking Corporation Limited 800,187 1,126,080
Clearing ChargesThe Hongkong and Shanghai Banking Corporation Limited - 568,140
Fixed Deposits PlacedThe Hongkong and Shanghai Banking Corporation Limited - 880,000,000
Fixed Deposits MaturedThe Hongkong and Shanghai Banking Corporation Limited - 1,310,000,000
Charges for Services Provided by BankThe Hongkong and Shanghai Banking Corporation Limited 14,400 32,068
(iv) Details of material transactions with respect to parties referred to in Note 14 (I)(ix) for Schemes under common control of the Sponsor
April 01, 2012 to April 01, 2011 toMarch 31, 2013 March 31, 2012
Purchase of InvestmentsHSBC Ultra Short Term Bond Fund - - HSBC Floating Rate Fund Short Term Plan - -
Sale of InvestmentsHSBC Ultra Short Term Bond Fund - -
Subscription of Units (including switch in and dividend reinvestment) - HSBC India Opportunities Fund - - HSBC Advantage India Fund - - HSBC Unique Opportunities Fund - -
Redemption of Units (including switch out)HSBC India Opportunities Fund - - HSBC Advantage India Fund - - HSBC Ultra Short Term Bond Fund (Formerly, HSBC Liquid Plus Fund) - -
Dividend Paid/Payable( Including dividend reinvested)
Clearing ChargesHSBC---- Fund - -
- - Units Outstanding As At Year EndHSBC Equity Fund - - HSBC India Opportunities Fund - - HSBC Advantage India Fund - - HSBC Unique Opportunities Fund - -
Other PayablesHSBC Tax Saver Fund 1,776,872 -
Other ReceivablesHSBC Equity Fund - -
(iv) Disclosures in respect of material transactions with persons referred to in Note 14 (I)(x) for key management personnel and their relatives
April 01, 2012 to April 01, 2011 toMarch 31, 2013 March 31, 2012
Redemption of Units (including switch out)Kemaya Lal Kidwai (Relative) 178,736 9,118,028 Naina Lal Kidwai 632,514 - Avan Nelum Gidwani (Relative) - 5,070,902
Units Outstanding As At Year EndNaina Lal Kidwai 500,762 1,120,270 Kemaya Lal Kidwai (Relative) - 181,179

(i) Transactions during the Year
Nature of Transaction SponsorInvestment Manager
Associate of Investment Manager
Schemes under Common Control of
Sponsor
Key Management Personnel & their
Relatives Total
Purchase of Investments - - - - - - Previous Year - - - - - -
Sale of Investments - - - - - - Previous Year - - - - - -
Subscription of Units (including switch in and dividend reinvestment) - - - - - - Previous Year - - - - - -
Redemption of Units (including switch out) - - - - - - Previous Year - - - - 3,488,398 3,488,398
Investment Management and Advisory Fees - 27,402,169 - - - 27,402,169 Previous Year - 19,150,107 - - - 19,150,107
Brokerage/ Commission on Distribution of Units - - 17,057,967 - - 17,057,967 Previous Year - - 2,513,315 - - 2,513,315
Brokerage/ Commission on purchase/sale of investments 44,052 - - - - 44,052 Previous Year 60,955 - - - - 60,955
Clearing Charges - - - - - - Previous Year - - 177,657 - - 177,657
Fixed Deposits Placed - - - - - - Previous Year - - 290,000,000 - - 290,000,000
Fixed Deposits Matured - - - - - - Previous Year - - 420,000,000 - - 420,000,000
Interest Rate Swaps placed - - - - - - Previous Year - - - - - -
Interest Rate Swaps Matured - - - - - - Previous Year - - - - - -
Reverse Repos Placed - - - - - - Previous Year - - - - - -
Reverse Repos Matured - - - - - - Previous Year - - - - - -
Charges for Services Provided by Bank - - 14,400 - - 14,400 Previous Year - - - - - -
(ii) Outstanding As At Year End
Nature of Transaction SponsorInvestment Manager
Associate of Investment Manager
Schemes under Common Control of
Sponsor
Key Management Personnel & their
Relatives Total
Investment Management and Advisory Fees Payable - 2,832,414 - - - 2,832,414 Previous Year - 1,311,149 - - - 1,311,149
Trusteeship Fees Payable - - - - - - Previous Year - - - - - -
Brokerage/ Commission Payable on Distribution of Units - - 1,390,939 - - 1,390,939 Previous Year - - 877,981 - - 877,981
Brokerage on Purchase/Sale of Investments Payable - - - - - - Previous Year - - - - - -
Fixed Deposits - - - - - - Previous Year - - - - - -
Units Outstanding As At Year End - - - - - - Previous Year - - - - - -
Charges for Services Provided by Bank Payable - - - - - - Previous Year - - - - - -
Dividend Payable - - - - - - Previous Year - - - - - -
Other Payables - - - - - - Previous Year - - - - - -
Other Receivables - 4,540 - - - 4,540 Previous Year - - - - - -
HSBC INDIA OPPORTUNITIES FUND
Schedules forming part of the Balance Sheet as at March 31, 2013and the Revenue Account for the year ended March 31, 2013
Annexure I

(iii) Details of material transactions with respect to parties referred to in Note 14 (I)(iii), (iv), (v), (vi), (vii) and (viii) for Associate of Investment Manager
April 01, 2012 to April 01, 2011 toMarch 31, 2013 March 31, 2012
Subscription of Units (including switch in and dividend reinvestment)HSBC InvestDirect Securities (India) Limited - - Investsmart Financial Services Limited - -
Redemption of Units (including switch out)HSBC InvestDirect Securities (India) Limited - - Investsmart Financial Services Limited - -
Dividend Paid/Payable( Including dividend reinvested)HSBC Asset Management India Private Limited - - HSBC Asset Management Pms Ac Signature Portfolio - -
Brokerage/ Commission on Distribution of UnitsThe Hongkong and Shanghai Banking Corporation Limited 17,020,740 2,470,962 HSBC InvestDirect Securities (India) Limited - 45,604
Clearing ChargesThe Hongkong and Shanghai Banking Corporation Limited - 177,657
Fixed Deposits PlacedThe Hongkong and Shanghai Banking Corporation Limited - 290,000,000
Fixed Deposits MaturedThe Hongkong and Shanghai Banking Corporation Limited - 420,000,000
Charges for Services Provided by BankThe Hongkong and Shanghai Banking Corporation Limited 14,400 -
Brokerage/ Commission Payable on Distribution of UnitsThe Hongkong and Shanghai Banking Corporation Limited 1,388,298 872,998 HSBC InvestDirect Securities (India) Limited - 4,225
Units Outstanding As At Year EndHSBC InvestDirect Securities (India) Limited - - HSBC Asset Management India Private Limited - - HSBC Asset Management PMS AC LCOP - - HSBC Asset Management PMS AC Signature Portfolio - -
(iv) Details of material transactions with respect to parties referred to in Note 14 (I)(ix) for Schemes under common control of the Sponsor
April 01, 2012 to April 01, 2011 toMarch 31, 2013 March 31, 2012
Purchase of InvestmentsHSBC Ultra Short Term Bond Fund - - HSBC Floating Rate Fund Short Term Plan - -
Sale of InvestmentsHSBC Ultra Short Term Bond Fund - -
Subscription of Units (including switch in and dividend reinvestment) - HSBC India Opportunities Fund - - HSBC Advantage India Fund - - HSBC Unique Opportunities Fund - -
Redemption of Units (including switch out)HSBC India Opportunities Fund - - HSBC Advantage India Fund - - HSBC Ultra Short Term Bond Fund (Formerly, HSBC Liquid Plus Fund) - -
Dividend Paid/Payable( Including dividend reinvested)
Clearing ChargesHSBC---- Fund - -
- - Units Outstanding As At Year EndHSBC Cash Fund - - HSBC Equity Fund - - HSBC India Opportunities Fund - - HSBC Advantage India Fund - - HSBC Unique Opportunities Fund - -
Other PayablesHSBC Equity Fund - - HSBC Floating Rate Fund - Long Term Plan - - HSBC MIP - Saving Plan - -
Other ReceivablesHSBC Equity Fund - - HSBC Progressive Themes Fund - - HSBC MIP Savings Plan - -
(v) Disclosures in respect of material transactions with persons referred to in Note 14 (I)(x) for key management personnel and their relatives
April 01, 2012 to April 01, 2011 toMarch 31, 2013 March 31, 2012
Redemption of Units (including switch out)Kemaya Lal Kidwai - - Birjees Kidwai - - Naina Lal Kidwai - - Avan Nelum Gidwani (Relative) - 962,179 Nelum Pahlaj Gidwani - 987,702 Rahul Nelum Gidwani (Relative) - 1,474,372
Dividend Distribution (Including dividend reinvested)Rahul Nelum Gidwani (Relative) - - Naina Lal Kidwai - - Nelum Pahlaj Gidwani - -
Units Outstanding As At Year EndKemaya Lal Kidwai - - Naina Lal Kidwai - - Nelum Pahlaj Gidwani - - Avan Nelum Gidwani (Relative) - - Rahul Nelum Gidwani (Relative) - -
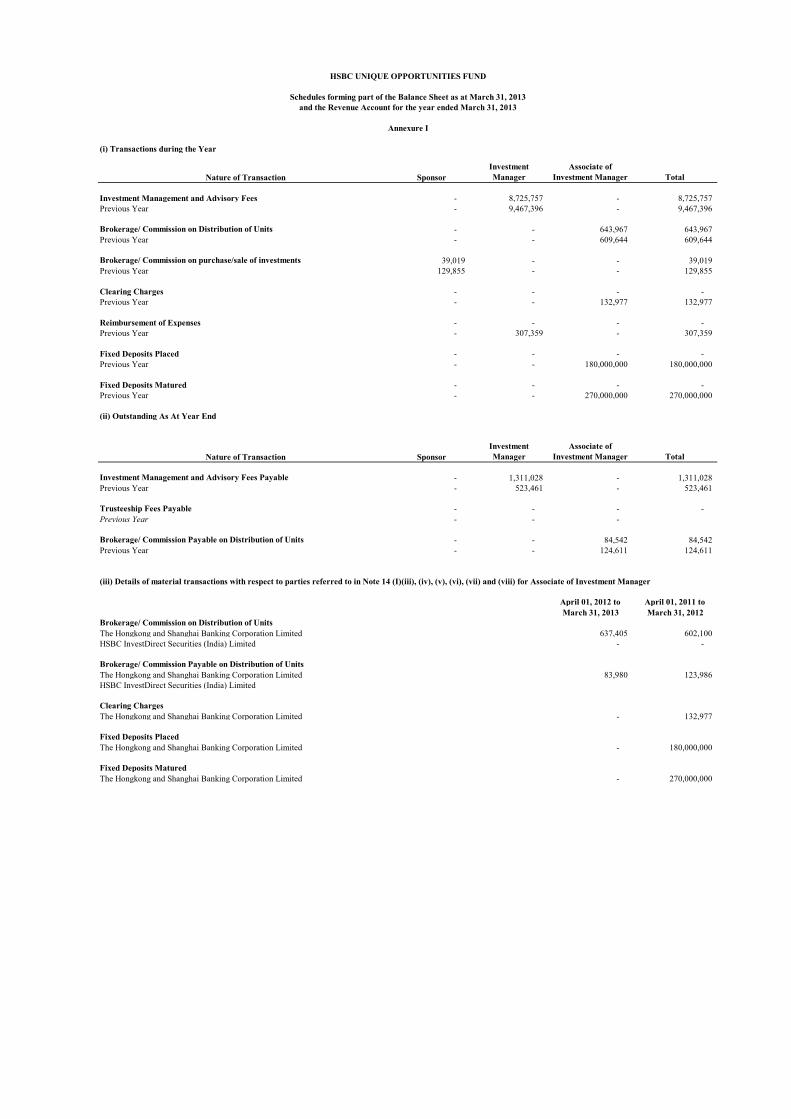
(i) Transactions during the Year
Nature of Transaction SponsorInvestment Manager
Associate of Investment Manager Total
Investment Management and Advisory Fees - 8,725,757 - 8,725,757 Previous Year - 9,467,396 - 9,467,396
Brokerage/ Commission on Distribution of Units - - 643,967 643,967 Previous Year - - 609,644 609,644
Brokerage/ Commission on purchase/sale of investments 39,019 - - 39,019 Previous Year 129,855 - - 129,855
Clearing Charges - - - - Previous Year - - 132,977 132,977
Reimbursement of Expenses - - - - Previous Year - 307,359 - 307,359
Fixed Deposits Placed - - - - Previous Year - - 180,000,000 180,000,000
Fixed Deposits Matured - - - - Previous Year - - 270,000,000 270,000,000
(ii) Outstanding As At Year End
Nature of Transaction SponsorInvestment Manager
Associate of Investment Manager Total
Investment Management and Advisory Fees Payable - 1,311,028 - 1,311,028 Previous Year - 523,461 - 523,461
Trusteeship Fees Payable - - - - Previous Year - - -
Brokerage/ Commission Payable on Distribution of Units - - 84,542 84,542 Previous Year - - 124,611 124,611
(iii) Details of material transactions with respect to parties referred to in Note 14 (I)(iii), (iv), (v), (vi), (vii) and (viii) for Associate of Investment Manager
April 01, 2012 to April 01, 2011 toMarch 31, 2013 March 31, 2012
Brokerage/ Commission on Distribution of UnitsThe Hongkong and Shanghai Banking Corporation Limited 637,405 602,100 HSBC InvestDirect Securities (India) Limited - -
Brokerage/ Commission Payable on Distribution of UnitsThe Hongkong and Shanghai Banking Corporation Limited 83,980 123,986 HSBC InvestDirect Securities (India) Limited
Clearing ChargesThe Hongkong and Shanghai Banking Corporation Limited - 132,977
Fixed Deposits PlacedThe Hongkong and Shanghai Banking Corporation Limited - 180,000,000
Fixed Deposits MaturedThe Hongkong and Shanghai Banking Corporation Limited - 270,000,000
HSBC UNIQUE OPPORTUNITIES FUND
Schedules forming part of the Balance Sheet as at March 31, 2013and the Revenue Account for the year ended March 31, 2013
Annexure I

(i) Transactions during the Year
Nature of Transaction SponsorInvestment Manager
Associate of Investment Manager
Schemes under Common Control of
Sponsor
Key Management Personnel & their
Relatives Total
Subscription of Units (including switch in and dividend reinvestment) - - - - 454,320 454,320 Previous Year - - - - - -
Investment Management and Advisory Fees - 15,135,763 - - - 15,135,763 Previous Year - 11,405,999 - - - 11,405,999
Brokerage/ Commission on Distribution of Units - - 7,571,066 - - 7,571,066 Previous Year - - 665,376 - - 665,376
Brokerage/ Commission on purchase/sale of investments 202,536 - - - - 202,536 Previous Year 154,045 - - - - 154,045
Clearing Charges - - - - - - Previous Year - - 151,204 - - 151,204
Fixed Deposits Placed - - - - - - Previous Year - - 216,000,000 - - 216,000,000
Reimbursement of Expenses - - 178,764 - - 178,764 Previous Year - - - - - -
- Fixed Deposits Matured - - - - - - Previous Year - - 312,000,000 - - 312,000,000
(ii) Outstanding As At Year End
Nature of Transaction SponsorInvestment Manager
Associate of Investment Manager
Schemes under Common Control of
Sponsor
Key Management Personnel & their
Relatives Total
Investment Management and Advisory Fees Payable - 1,872,426 - - - 1,872,426 Previous Year - 621,220 - - - 621,220
Brokerage/ Commission Payable on Distribution of Units - - 1,333,671 - - 1,333,671 Previous Year - - 92,111 - - 92,111
Units Outstanding As At Year End - - - - 433,214 433,214 Previous Year - - - - - -
Other Payables - - - - - - Previous Year - 5,387 - - - 5,387
Other Receivables - 179,167 - - - 179,167 Previous Year - - - - - -
(iii) Details of material transactions with respect to parties referred to in Note 14 (I)(iii), (iv), (v), (vi), (vii) and (viii) for Associate of Investment Manager
April 01, 2012 to April 01, 2011 toMarch 31, 2013 March 31, 2012
Brokerage/ Commission on Distribution of UnitsThe Hongkong and Shanghai Banking Corporation Limited 7,561,694 651,168HSBC InvestDirect Securities (India) Limited 0 14,615
Brokerage/ Commission Payable on Distribution of UnitsThe Hongkong and Shanghai Banking Corporation Limited 1,332,929 91,189 HSBC InvestDirect Securities (India) Limited - 2,378
(iv) Disclosures in respect of material transactions with persons referred to in Note 10 (I)(vi) for key management personnel and their relatives
April 01, 2012 to April 01, 2011 toMarch 31, 2013 March 31, 2012
Subscription of Units (including switch in and dividend reinvestment)Devaki Chaddha 227,160 - Meera Chaddha 227,160 - Units Outstanding As At Year EndDevaki Chaddha 216,607 - Meera Chaddha 216,607 -
HSBC DYNAMIC FUND
Schedules forming part of the Balance Sheet as at March 31, 2013and the Revenue Account for the year ended March 31, 2013
Annexure I
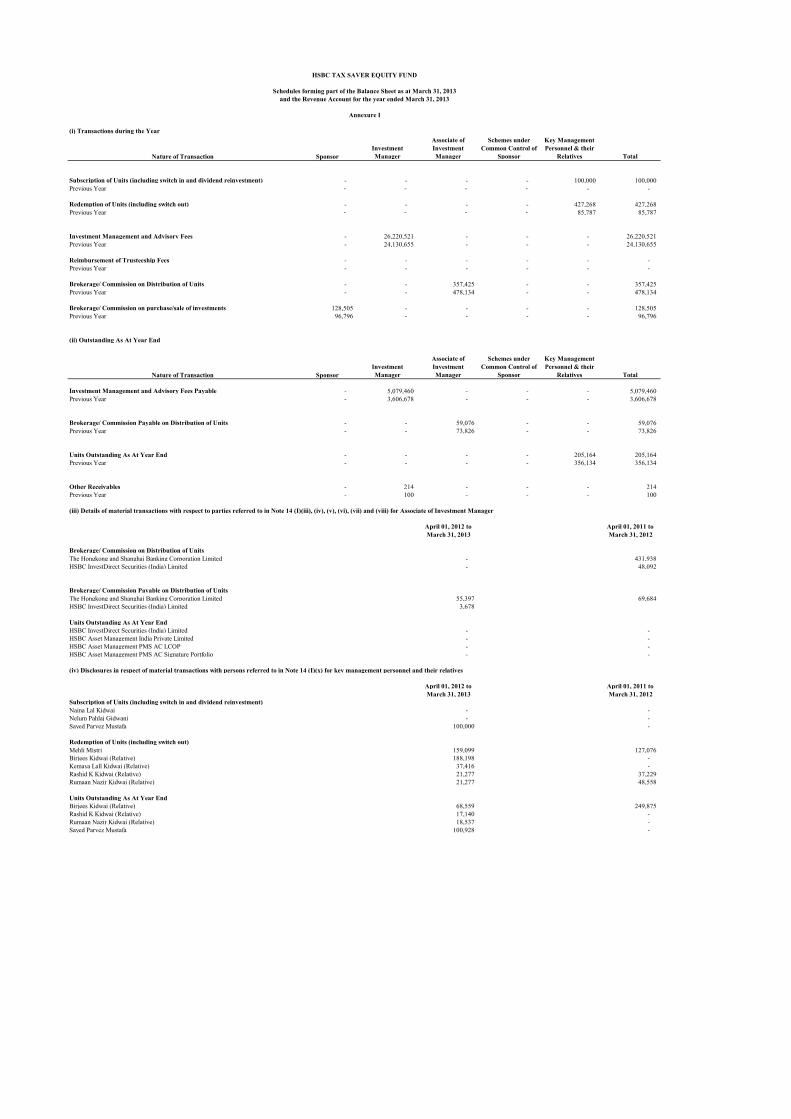
(i) Transactions during the Year
Nature of Transaction SponsorInvestment Manager
Associate of Investment Manager
Schemes under Common Control of
Sponsor
Key Management Personnel & their
Relatives Total
Subscription of Units (including switch in and dividend reinvestment) - - - - 100,000 100,000 Previous Year - - - - - -
Redemption of Units (including switch out) - - - - 427,268 427,268 Previous Year - - - - 85,787 85,787
Investment Management and Advisory Fees - 26,220,521 - - - 26,220,521 Previous Year - 24,130,655 - - - 24,130,655
Reimbursement of Trusteeship Fees - - - - - - Previous Year - - - - - -
Brokerage/ Commission on Distribution of Units - - 357,425 - - 357,425 Previous Year - - 478,134 - - 478,134
Brokerage/ Commission on purchase/sale of investments 128,505 - - - - 128,505 Previous Year 96,796 - - - - 96,796
(ii) Outstanding As At Year End
Nature of Transaction SponsorInvestment Manager
Associate of Investment Manager
Schemes under Common Control of
Sponsor
Key Management Personnel & their
Relatives Total
Investment Management and Advisory Fees Payable - 5,079,460 - - - 5,079,460 Previous Year - 3,606,678 - - - 3,606,678
Brokerage/ Commission Payable on Distribution of Units - - 59,076 - - 59,076 Previous Year - - 73,826 - - 73,826
Units Outstanding As At Year End - - - - 205,164 205,164 Previous Year - - - - 356,134 356,134
Other Receivables - 214 - - - 214 Previous Year - 100 - - - 100
(iii) Details of material transactions with respect to parties referred to in Note 14 (I)(iii), (iv), (v), (vi), (vii) and (viii) for Associate of Investment Manager
April 01, 2012 to April 01, 2011 toMarch 31, 2013 March 31, 2012
Brokerage/ Commission on Distribution of UnitsThe Hongkong and Shanghai Banking Corporation Limited - 431,938 HSBC InvestDirect Securities (India) Limited - 48,092
Brokerage/ Commission Payable on Distribution of UnitsThe Hongkong and Shanghai Banking Corporation Limited 55,397 69,684 HSBC InvestDirect Securities (India) Limited 3,678
Units Outstanding As At Year EndHSBC InvestDirect Securities (India) Limited - - HSBC Asset Management India Private Limited - - HSBC Asset Management PMS AC LCOP - - HSBC Asset Management PMS AC Signature Portfolio - -
(iv) Disclosures in respect of material transactions with persons referred to in Note 14 (I)(x) for key management personnel and their relatives
April 01, 2012 to April 01, 2011 toMarch 31, 2013 March 31, 2012
Subscription of Units (including switch in and dividend reinvestment)Naina Lal Kidwai - - Nelum Pahlaj Gidwani - - Sayed Parvez Mustafa 100,000 -
Redemption of Units (including switch out)Mehli Mistri 159,099 127,076 Birjees Kidwai (Relative) 188,198 - Kemaya Lall Kidwai (Relative) 37,416 - Rashid K Kidwai (Relative) 21,277 37,229 Rumaan Nazir Kidwai (Relative) 21,277 48,558
Units Outstanding As At Year EndBirjees Kidwai (Relative) 68,559 249,875 Rashid K Kidwai (Relative) 17,140 - Rumaan Nazir Kidwai (Relative) 18,537 - Sayed Parvez Mustafa 100,928 -
HSBC TAX SAVER EQUITY FUND
Schedules forming part of the Balance Sheet as at March 31, 2013and the Revenue Account for the year ended March 31, 2013
Annexure I

Company Name Schemes invested in by the Company
Investment made by schemes of HSBC Mutual Fund in the
company/subsidiary
Aggregate cost of acquisition during
the year ended March 31, 2013
Outstanding as at March 31, 2013(At Market / Fair
Value)
(Rupees in Lakhs) (Rupees in Lakhs)
Hindalco Industries Limited HFTS81 HDF 309.76 219.84
HIOF 514.67 366.40
HTSF 409.96 -
HUOF 93.18 64.76
Larsen & Toubro Limited HCF HDF 794.22 683.10
HFRF HEF - 1,912.68
HIOF 338.53 618.21
HMIP 365.99 -
HPTF 556.00 -
HTSF 137.77 -
HUOF 149.90 133.20
L&T Finance Limited HCF 9,110.12 -
(Subsidiary of Larsen & Toubro Limited) HFRF 4,231.84 -
HUSBF 9.87 -
Mahindra & Mahindra Limited HCF HTSF 956.77 -
Mahindra & Mahindra Financial Services Limited HCF 7,207.55 2,473.50
(Subsidiary of Mahindra & Mahindra Limited) HFRF 10,164.61 -
HIF 1,973.43 -
HMIP 2,498.35 -
HUSBF 345.73 -
Reliance Industries Limited HIF HDF 483.06 656.97
HFTS90 HEF - 2,705.15
HIOF - 699.47
HUOF - 120.57
Shriram Transport Finance Company Limited HCF HCF 1,483.40 -
HFDF 2,993.62 3,307.96
HIF 3,498.62 7,914.07
HMIP 280.88 3,080.23
Shriram Equipment Finance Company Ltd HCF 988.86 -
(Subsidiary of Shriram Transport Finance Company Limited) HFRF 1,486.31 -
United Bank of India HCF HCF 3,239.95 2,376.57
HFRF 97.33 -
HFTS80 2,498.34 -
HFTS83 1,775.75 -
HIF 3,061.35 2,578.75
HPTF 240.51 189.34
HUSBF 486.66 -
Scheme Name Scheme CodeHSBC Cash Fund HCF
HSBC Dynamic Fund HDF
HSBC Equity Fund HEF
HSBC Flexi Debt Fund HFDF
HSBC Floating Rate Fund - Long Term Plan HFRF
HSBC Fixed Term Series 79 HFTS79
HSBC Fixed Term Series 81 HFTS81
HSBC Fixed Term Series 80 HFTS80
HSBC Fixed Term Series 83 HFTS83
HSBC Income Fund HIF
HSBC India Opportunities Fund HIOF
HSBC Progressive Themes Fund HPTF
HSBC Small Cap Fund HSCF
HSBC Tax Saver Equity Fund HTSF
HSBC Ultra Short Term Bond Fund HUSBF
HSBC Fixed Term Series 90 HFTS90
HSBC MIP Fund HMIP
HSBC Unique Opportunities Fund HUOF
Annexure II
Disclosure under Regulation 25(11) of the Securities and Exchange Board of India (Mutual Funds) Regulations, 1996 as amended Investments made by the schemes of HSBC Mutual Fund in Companies or their subsidiaries that have invested more than 5%
of the net assets of any scheme
The above investments comprise equity shares, debentures / bonds, commercial papers, certificate of deposits, fixed deposits and other debt instruments. These investments have been made on account of their high credit quality and competitive yield for the investment in fixed income/ money market instruments and in case of equity shares because of
attractive valuations of these companies.
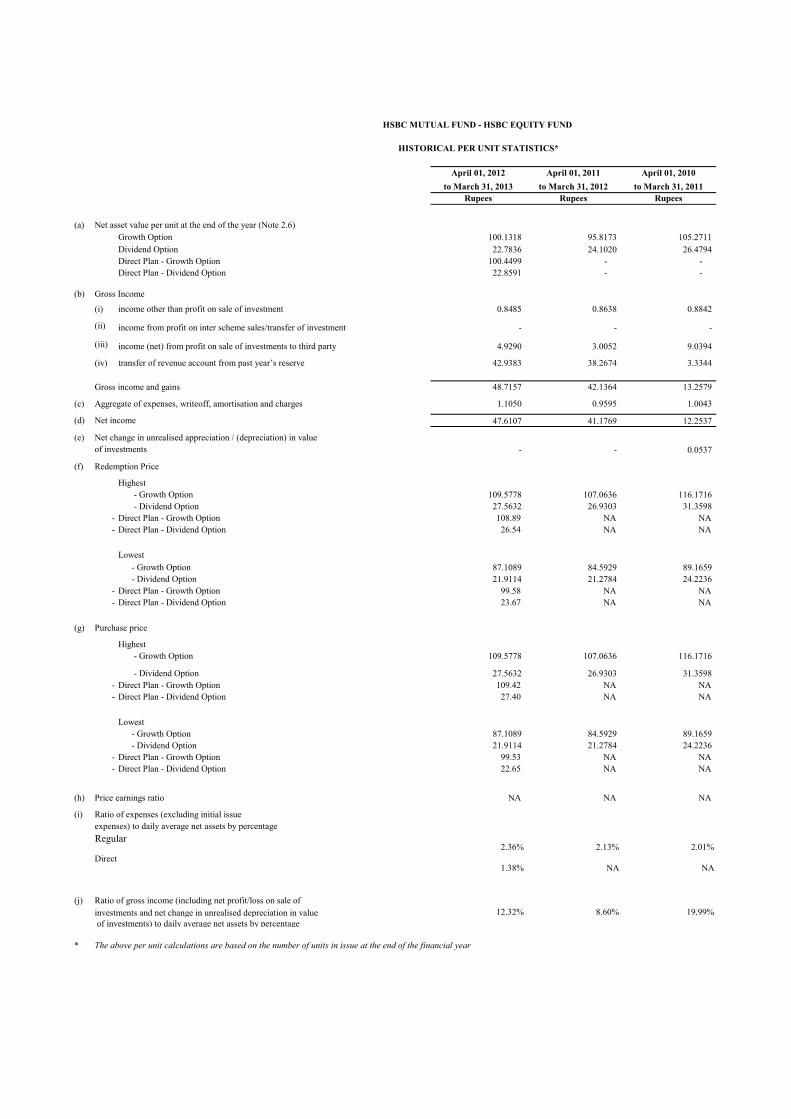
April 01, 2012 April 01, 2011 April 01, 2010to March 31, 2013 to March 31, 2012 to March 31, 2011
Rupees Rupees Rupees
(a) Net asset value per unit at the end of the year (Note 2.6)Growth Option 100.1318 95.8173 105.2711 Dividend Option 22.7836 24.1020 26.4794 Direct Plan - Growth Option 100.4499 - - Direct Plan - Dividend Option 22.8591 - -
(b) Gross Income
(i) income other than profit on sale of investment 0.8485 0.8638 0.8842
(ii) income from profit on inter scheme sales/transfer of investment - - -
(iii) income (net) from profit on sale of investments to third party 4.9290 3.0052 9.0394
(iv) transfer of revenue account from past year’s reserve 42.9383 38.2674 3.3344
Gross income and gains 48.7157 42.1364 13.2579
(c) Aggregate of expenses, writeoff, amortisation and charges 1.1050 0.9595 1.0043
(d) Net income 47.6107 41.1769 12.2537
(e) Net change in unrealised appreciation / (depreciation) in valueof investments - - 0.0537
(f) Redemption Price
Highest - Growth Option 109.5778 107.0636 116.1716 - Dividend Option 27.5632 26.9303 31.3598
- Direct Plan - Growth Option 108.89 NA NA- Direct Plan - Dividend Option 26.54 NA NA
Lowest - Growth Option 87.1089 84.5929 89.1659 - Dividend Option 21.9114 21.2784 24.2236
- Direct Plan - Growth Option 99.58 NA NA- Direct Plan - Dividend Option 23.67 NA NA
(g) Purchase price
Highest - Growth Option 109.5778 107.0636 116.1716
- Dividend Option 27.5632 26.9303 31.3598 - Direct Plan - Growth Option 109.42 NA NA- Direct Plan - Dividend Option 27.40 NA NA
Lowest - Growth Option 87.1089 84.5929 89.1659 - Dividend Option 21.9114 21.2784 24.2236
- Direct Plan - Growth Option 99.53 NA NA- Direct Plan - Dividend Option 22.65 NA NA
(h) Price earnings ratio NA NA NA
(i) Ratio of expenses (excluding initial issue expenses) to daily average net assets by percentageRegular
2.36% 2.13% 2.01%Direct
1.38% NA NA
(j) Ratio of gross income (including net profit/loss on sale of investments and net change in unrealised depreciation in value 12.32% 8.60% 19.99% of investments) to daily average net assets by percentage
* The above per unit calculations are based on the number of units in issue at the end of the financial year
HSBC MUTUAL FUND - HSBC EQUITY FUND
HISTORICAL PER UNIT STATISTICS*
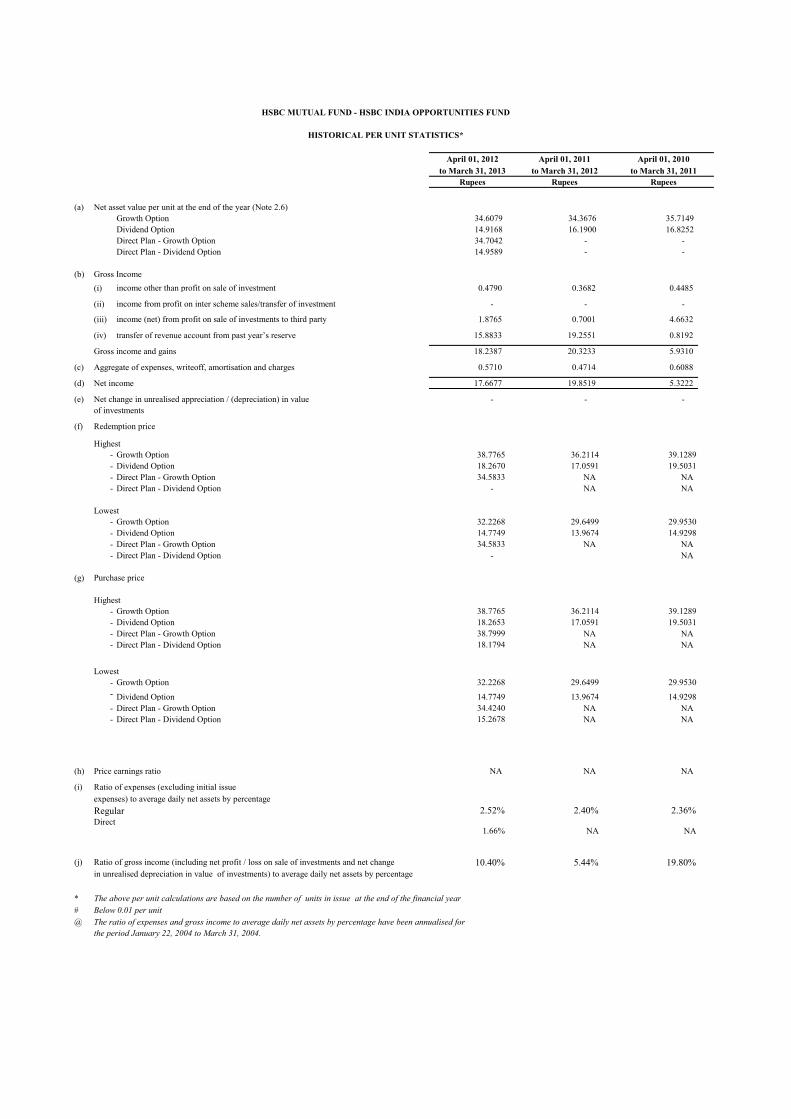
(a) Net asset value per unit at the end of the year (Note 2.6)Growth Option 34.6079 34.3676 35.7149 Dividend Option 14.9168 16.1900 16.8252 Direct Plan - Growth Option 34.7042 - - Direct Plan - Dividend Option 14.9589 - -
(b) Gross Income(i) income other than profit on sale of investment 0.4790 0.3682 0.4485
(ii) income from profit on inter scheme sales/transfer of investment - - -
(iii) income (net) from profit on sale of investments to third party 1.8765 0.7001 4.6632
(iv) transfer of revenue account from past year’s reserve 15.8833 19.2551 0.8192
Gross income and gains 18.2387 20.3233 5.9310
(c) Aggregate of expenses, writeoff, amortisation and charges 0.5710 0.4714 0.6088
(d) Net income 17.6677 19.8519 5.3222
(e) Net change in unrealised appreciation / (depreciation) in value - - - of investments
(f) Redemption price
Highest- Growth Option 38.7765 36.2114 39.1289 - Dividend Option 18.2670 17.0591 19.5031 - Direct Plan - Growth Option 34.5833 NA NA- Direct Plan - Dividend Option - NA NA
Lowest- Growth Option 32.2268 29.6499 29.9530 - Dividend Option 14.7749 13.9674 14.9298 - Direct Plan - Growth Option 34.5833 NA NA- Direct Plan - Dividend Option - NA
(g) Purchase price
Highest- Growth Option 38.7765 36.2114 39.1289 - Dividend Option 18.2653 17.0591 19.5031 - Direct Plan - Growth Option 38.7999 NA NA- Direct Plan - Dividend Option 18.1794 NA NA
Lowest- Growth Option 32.2268 29.6499 29.9530 - Dividend Option 14.7749 13.9674 14.9298 - Direct Plan - Growth Option 34.4240 NA NA- Direct Plan - Dividend Option 15.2678 NA NA
(h) Price earnings ratio NA NA NA
(i) Ratio of expenses (excluding initial issue expenses) to average daily net assets by percentageRegular 2.52% 2.40% 2.36%Direct
1.66% NA NA
(j) Ratio of gross income (including net profit / loss on sale of investments and net change 10.40% 5.44% 19.80%in unrealised depreciation in value of investments) to average daily net assets by percentage
* The above per unit calculations are based on the number of units in issue at the end of the financial year# Below 0.01 per unit@ The ratio of expenses and gross income to average daily net assets by percentage have been annualised for
the period January 22, 2004 to March 31, 2004.
HSBC MUTUAL FUND - HSBC INDIA OPPORTUNITIES FUND
HISTORICAL PER UNIT STATISTICS*
April 01, 2012 April 01, 2011to March 31, 2013 to March 31, 2012
Rupees Rupees Rupees
April 01, 2010to March 31, 2011

April 01, 2012 April 01, 2011 April 01, 2010to March 31, 2013 to March 31, 2012 to March 31, 2011
Rupees Rupees Rupees
(a) Net asset value per unit at the end of the year (Note 2.7)Growth Option 10.6718 10.1530 11.2165 Dividend Option 10.6718 10.1530 11.2165 Direct Plan - Growth Option 10.6923 - - Direct Plan - Dividend Option 10.6923 - -
(b) Gross Income(i) income other than profit on sale of investment 0.2757 0.2517 0.3098
(ii) income from profit on inter scheme sales/transfer of investment - - -
(iii) income (net) from profit on sale of investments to third party 0.5983 - 5.6516
(iv) transfer of revenue account from past year’s reserve 13.5075 6.24 - Gross income and gains 14.3816 6.4912 5.9615
(c) Aggregate of expenses, writeoff, amortisation and charges 0.3445 0.2847 0.3957
(d) Net income 14.0370 6.2065 5.5657
(e) Net change in unrealised appreciation / (depreciation) in value - - 0.0171
(f) Redemption Price
Highest - Growth Option 11.8946 11.5146 13.1459 - Dividend Option 11.8946 11.5146 13.1459
- Direct Plan - Growth Option 10.87 NA NA- Direct Plan - Dividend Option - NA NA
Lowest - Growth Option 9.4010 8.7049 9.4990 - Dividend Option 9.4010 8.7049 9.4990
- Direct Plan - Growth Option 10.87 NA NA- Direct Plan - Dividend Option - NA NA
(g) Purchase Price
Highest - Growth Option 11.8946 11.5039 13.1459 - Dividend Option 11.8873 11.5039 13.1459
- Direct Plan - Growth Option 11.81 NA NA- Direct Plan - Dividend Option 11.74 NA NA
Lowest - Growth Option 9.4352 8.7049 9.6860 - Dividend Option 9.4352 8.8122 9.4990
- Direct Plan - Growth Option 10.60 NA NA- Direct Plan - Dividend Option 11.74 NA NA
(h) Price earnings ratio NA NA NA
(i) Ratio of expenses (excluding initial issue expenses) to daily average net assets by percentageRegular 2.67% 2.50% 2.50%Direct 1.80% NA NA
(j) Ratio of gross income (including net profit / loss on sale of investments and net change inunrealised depreciation in value of investments) to daily average net assets by percentage 6.78% 1.42% 36.69%
* The above per unit calculations are based on the number of units in issue at the end of the financial year
HSBC MUTUAL FUND - HSBC UNIQUE OPPORTUNITIES FUND
HISTORICAL PER UNIT STATISTICS*
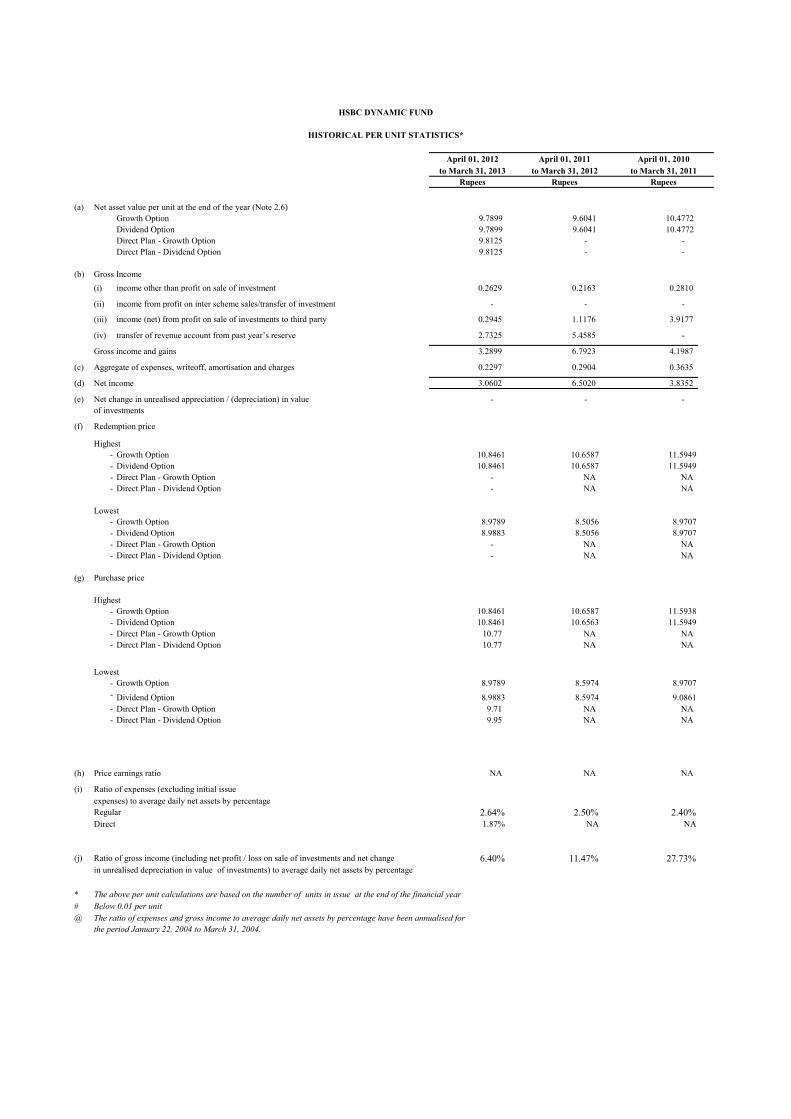
(a) Net asset value per unit at the end of the year (Note 2.6)Growth Option 9.7899 9.6041 10.4772 Dividend Option 9.7899 9.6041 10.4772 Direct Plan - Growth Option 9.8125 - - Direct Plan - Dividend Option 9.8125 - -
(b) Gross Income(i) income other than profit on sale of investment 0.2629 0.2163 0.2810
(ii) income from profit on inter scheme sales/transfer of investment - - -
(iii) income (net) from profit on sale of investments to third party 0.2945 1.1176 3.9177
(iv) transfer of revenue account from past year’s reserve 2.7325 5.4585 -
Gross income and gains 3.2899 6.7923 4.1987
(c) Aggregate of expenses, writeoff, amortisation and charges 0.2297 0.2904 0.3635
(d) Net income 3.0602 6.5020 3.8352
(e) Net change in unrealised appreciation / (depreciation) in value - - - of investments
(f) Redemption price
Highest- Growth Option 10.8461 10.6587 11.5949 - Dividend Option 10.8461 10.6587 11.5949 - Direct Plan - Growth Option - NA NA- Direct Plan - Dividend Option - NA NA
Lowest- Growth Option 8.9789 8.5056 8.9707 - Dividend Option 8.9883 8.5056 8.9707 - Direct Plan - Growth Option - NA NA- Direct Plan - Dividend Option - NA NA
(g) Purchase price
Highest- Growth Option 10.8461 10.6587 11.5938 - Dividend Option 10.8461 10.6563 11.5949 - Direct Plan - Growth Option 10.77 NA NA- Direct Plan - Dividend Option 10.77 NA NA
Lowest- Growth Option 8.9789 8.5974 8.9707 - Dividend Option 8.9883 8.5974 9.0861 - Direct Plan - Growth Option 9.71 NA NA- Direct Plan - Dividend Option 9.95 NA NA
(h) Price earnings ratio NA NA NA
(i) Ratio of expenses (excluding initial issue expenses) to average daily net assets by percentageRegular 2.64% 2.50% 2.40%Direct 1.87% NA NA
(j) Ratio of gross income (including net profit / loss on sale of investments and net change 6.40% 11.47% 27.73%in unrealised depreciation in value of investments) to average daily net assets by percentage
* The above per unit calculations are based on the number of units in issue at the end of the financial year# Below 0.01 per unit@ The ratio of expenses and gross income to average daily net assets by percentage have been annualised for
the period January 22, 2004 to March 31, 2004.
Rupees Rupees Rupees
HSBC DYNAMIC FUND
HISTORICAL PER UNIT STATISTICS*
April 01, 2012 April 01, 2011 April 01, 2010to March 31, 2013 to March 31, 2012 to March 31, 2011
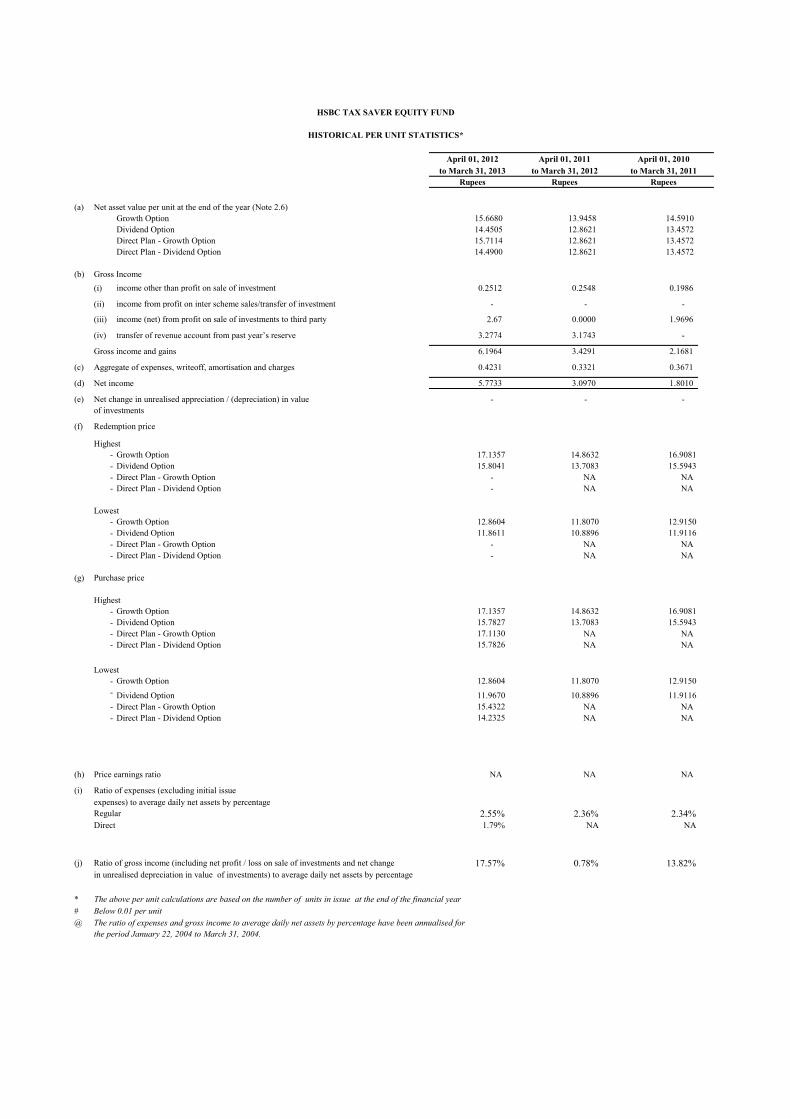
(a) Net asset value per unit at the end of the year (Note 2.6)Growth Option 15.6680 13.9458 14.5910 Dividend Option 14.4505 12.8621 13.4572 Direct Plan - Growth Option 15.7114 12.8621 13.4572 Direct Plan - Dividend Option 14.4900 12.8621 13.4572
(b) Gross Income(i) income other than profit on sale of investment 0.2512 0.2548 0.1986
(ii) income from profit on inter scheme sales/transfer of investment - - -
(iii) income (net) from profit on sale of investments to third party 2.67 0.0000 1.9696
(iv) transfer of revenue account from past year’s reserve 3.2774 3.1743 -
Gross income and gains 6.1964 3.4291 2.1681
(c) Aggregate of expenses, writeoff, amortisation and charges 0.4231 0.3321 0.3671
(d) Net income 5.7733 3.0970 1.8010
(e) Net change in unrealised appreciation / (depreciation) in value - - - of investments
(f) Redemption price
Highest- Growth Option 17.1357 14.8632 16.9081 - Dividend Option 15.8041 13.7083 15.5943 - Direct Plan - Growth Option - NA NA- Direct Plan - Dividend Option - NA NA
Lowest- Growth Option 12.8604 11.8070 12.9150 - Dividend Option 11.8611 10.8896 11.9116 - Direct Plan - Growth Option - NA NA- Direct Plan - Dividend Option - NA NA
(g) Purchase price
Highest- Growth Option 17.1357 14.8632 16.9081 - Dividend Option 15.7827 13.7083 15.5943 - Direct Plan - Growth Option 17.1130 NA NA- Direct Plan - Dividend Option 15.7826 NA NA
Lowest- Growth Option 12.8604 11.8070 12.9150 - Dividend Option 11.9670 10.8896 11.9116 - Direct Plan - Growth Option 15.4322 NA NA- Direct Plan - Dividend Option 14.2325 NA NA
(h) Price earnings ratio NA NA NA
(i) Ratio of expenses (excluding initial issue expenses) to average daily net assets by percentageRegular 2.55% 2.36% 2.34%Direct 1.79% NA NA
(j) Ratio of gross income (including net profit / loss on sale of investments and net change 17.57% 0.78% 13.82%in unrealised depreciation in value of investments) to average daily net assets by percentage
* The above per unit calculations are based on the number of units in issue at the end of the financial year# Below 0.01 per unit@ The ratio of expenses and gross income to average daily net assets by percentage have been annualised for
the period January 22, 2004 to March 31, 2004.
Rupees Rupees Rupees
HSBC TAX SAVER EQUITY FUND
HISTORICAL PER UNIT STATISTICS*
April 01, 2012 April 01, 2011 April 01, 2010to March 31, 2013 to March 31, 2012 to March 31, 2011

► INDEX HSBC Progressive Themes Fund HSBC Midcap Equity Fund HSBC Small Cap Fund HSBC Emerging Markets Fund HSBC Brazil Fund
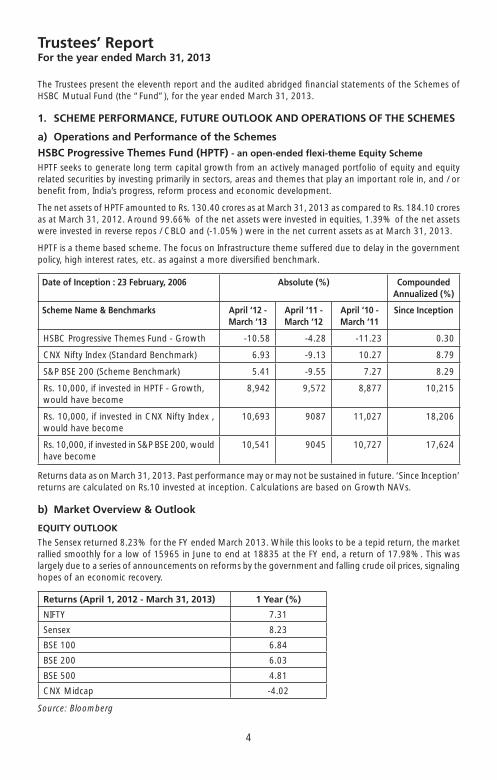
4
HSBC Progressive Themes Fund
The Trustees present the eleventh report and the audited abridged fi nancial statements of the Schemes of HSBC Mutual Fund (the “Fund”), for the year ended March 31, 2013.
1. SCHEME PERFORMANCE, FUTURE OUTLOOK AND OPERATIONS OF THE SCHEMES
a) Operations and Performance of the Schemes
HSBC Progressive Themes Fund (HPTF) - an open-ended fl exi-theme Equity Scheme
HPTF seeks to generate long term capital growth from an actively managed portfolio of equity and equity related securities by investing primarily in sectors, areas and themes that play an important role in, and / or benefi t from, India’s progress, reform process and economic development.
The net assets of HPTF amounted to Rs. 130.40 crores as at March 31, 2013 as compared to Rs. 184.10 crores as at March 31, 2012. Around 99.66% of the net assets were invested in equities, 1.39% of the net assets were invested in reverse repos / CBLO and (-1.05%) were in the net current assets as at March 31, 2013.
HPTF is a theme based scheme. The focus on Infrastructure theme suffered due to delay in the government policy, high interest rates, etc. as against a more diversifi ed benchmark.
Date of Inception : 23 February, 2006 Absolute (%) Compounded Annualized (%)
Scheme Name & Benchmarks April ‘12 - March ‘13
April ‘11 - March ‘12
April ‘10 - March ‘11
Since Inception
HSBC Progressive Themes Fund - Growth -10.58 -4.28 -11.23 0.30
CNX Nifty Index (Standard Benchmark) 6.93 -9.13 10.27 8.79
S&P BSE 200 (Scheme Benchmark) 5.41 -9.55 7.27 8.29
Rs. 10,000, if invested in HPTF - Growth, would have become
8,942 9,572 8,877 10,215
Rs. 10,000, if invested in CNX Nifty Index , would have become
10,693 9087 11,027 18,206
Rs. 10,000, if invested in S&P BSE 200, would have become
10,541 9045 10,727 17,624
Returns data as on March 31, 2013. Past performance may or may not be sustained in future. ‘Since Inception’ returns are calculated on Rs.10 invested at inception. Calculations are based on Growth NAVs.
b) Market Overview & Outlook
EQUITY OUTLOOK
The Sensex returned 8.23% for the FY ended March 2013. While this looks to be a tepid return, the market rallied smoothly for a low of 15965 in June to end at 18835 at the FY end, a return of 17.98%. This was largely due to a series of announcements on reforms by the government and falling crude oil prices, signaling hopes of an economic recovery.
Returns (April 1, 2012 - March 31, 2013) 1 Year (%)
NIFTY 7.31
Sensex 8.23
BSE 100 6.84
BSE 200 6.03
BSE 500 4.81
CNX Midcap -4.02
Source: Bloomberg
Trustees’ ReportFor the year ended March 31, 2013
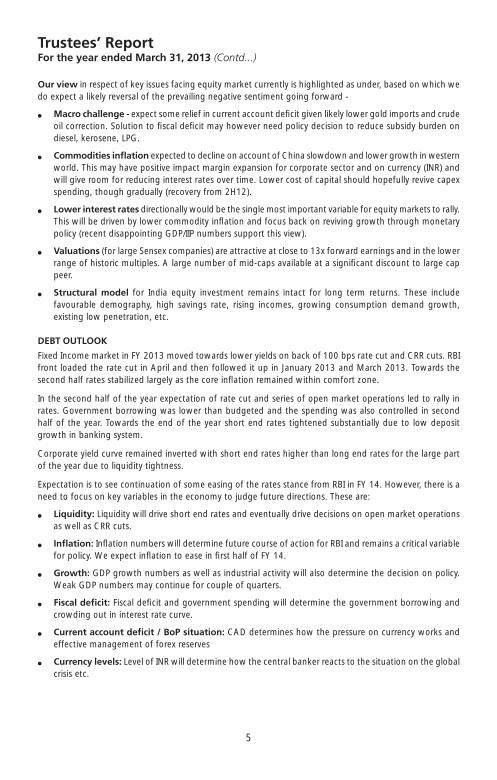
5
HSBC Progressive Themes Fund
Our view in respect of key issues facing equity market currently is highlighted as under, based on which we do expect a likely reversal of the prevailing negative sentiment going forward -
� Macro challenge - expect some relief in current account defi cit given likely lower gold imports and crude oil correction. Solution to fi scal defi cit may however need policy decision to reduce subsidy burden on diesel, kerosene, LPG.
� Commodities infl ation expected to decline on account of China slowdown and lower growth in western world. This may have positive impact margin expansion for corporate sector and on currency (INR) and will give room for reducing interest rates over time. Lower cost of capital should hopefully revive capex spending, though gradually (recovery from 2H12).
� Lower interest rates directionally would be the single most important variable for equity markets to rally. This will be driven by lower commodity infl ation and focus back on reviving growth through monetary policy (recent disappointing GDP/IIP numbers support this view).
� Valuations (for large Sensex companies) are attractive at close to 13x forward earnings and in the lower range of historic multiples. A large number of mid-caps available at a signifi cant discount to large cap peer.
� Structural model for India equity investment remains intact for long term returns. These include favourable demography, high savings rate, rising incomes, growing consumption demand growth, existing low penetration, etc.
DEBT OUTLOOK
Fixed Income market in FY 2013 moved towards lower yields on back of 100 bps rate cut and CRR cuts. RBI front loaded the rate cut in April and then followed it up in January 2013 and March 2013. Towards the second half rates stabilized largely as the core infl ation remained within comfort zone.
In the second half of the year expectation of rate cut and series of open market operations led to rally in rates. Government borrowing was lower than budgeted and the spending was also controlled in second half of the year. Towards the end of the year short end rates tightened substantially due to low deposit growth in banking system.
Corporate yield curve remained inverted with short end rates higher than long end rates for the large part of the year due to liquidity tightness.
Expectation is to see continuation of some easing of the rates stance from RBI in FY 14. However, there is a need to focus on key variables in the economy to judge future directions. These are:
� Liquidity: Liquidity will drive short end rates and eventually drive decisions on open market operations as well as CRR cuts.
� Infl ation: Infl ation numbers will determine future course of action for RBI and remains a critical variable for policy. We expect infl ation to ease in fi rst half of FY 14.
� Growth: GDP growth numbers as well as industrial activity will also determine the decision on policy. Weak GDP numbers may continue for couple of quarters.
� Fiscal defi cit: Fiscal defi cit and government spending will determine the government borrowing and crowding out in interest rate curve.
� Current account defi cit / BoP situation: CAD determines how the pressure on currency works and effective management of forex reserves
� Currency levels: Level of INR will determine how the central banker reacts to the situation on the global crisis etc.
Trustees’ ReportFor the year ended March 31, 2013 (Contd...)
6
HSBC Progressive Themes Fund
2. BRIEF BACKGROUND OF SPONSORS, BOARD OF TRUSTEES AND ASSET MANAGEMENT COMPANY
a) Sponsor HSBC Mutual Fund is sponsored by HSBC Securities and Capital Markets (India) Private Limited (HSCI).
The Sponsor is the Settler of the Mutual Fund Trust. The Sponsor has entrusted a sum of Rs.1,00,000 (Rupees One Lakh only) to the Trustee as the initial contribution towards the corpus of the Mutual Fund.
HSCI offers integrated investment banking services, securities and corporate fi nance & advisory. HSCI is a member of The Bombay Stock Exchange Limited and National Stock Exchange (capital and derivative market segments). HSCI holds 100% of the paid up equity share capital of HSBC Asset Management (India) Private Limited.
b) HSBC Mutual Fund HSBC Mutual Fund (“the Mutual Fund” or “the Fund”) has been constituted as a Trust in accordance with
the provisions of the Indian Trusts Act, 1882 (2 of 1882) vide a Trust Deed dated February 7, 2002 with HSBC Securities and Capital Markets (India) Private Limited, as the Sponsor and the Board of Individual Trustees. The Trustee has entered into an Investment Management Agreement dated February 7, 2002 with HSBC Asset Management (India) Private Limited (AMC) to function as the Investment Manager for all the Schemes of the Fund. The Fund was registered with SEBI vide registration number MF/046/02/5 dated May 27, 2002.
The Trust has been formed for the purpose of pooling of capital from the public for collective investment in securities/any other property for the purpose of providing facilities for participation by persons as benefi ciaries in such properties/investments and in the profi ts/income arising therefrom.
c) Board of Trustees (the Trustees) The Board of Trustees is the exclusive owner of the Trust Fund and holds the same in trust for the benefi t
of the unit holders. The Trustees have been discharging their duties and carrying out the responsibilities as provided in the SEBI (Mutual Funds) Regulations, 1996 and the Trust Deed. The Trustees seek to ensure that the Fund and the Schemes fl oated there under are managed by the AMC in accordance with the Trust Deed, the said Regulations, directions and guidelines issued by the SEBI, the Stock Exchanges, the Association of Mutual Funds in India and other regulatory agencies.
d) Asset Management Company (the AMC) HSBC Asset Management (India) Private Limited (the Investment Manager or the AMC) is a private limited
company incorporated under the Companies Act, 1956 on December 12, 2001 having its Registered Offi ce at 16, V. N. Road, Fort, Mumbai 400 001. HSBC Asset Management (India) Private Limited has been appointed as the Asset Management Company of the HSBC Mutual Fund by the Trustee vide Investment Management Agreement (IMA) dated February 7, 2002 and executed between the Trustees and the AMC. SEBI approved the AMC to act as the Investment Manager of the Fund vide its letter No. MFD/BC/163/2002 dated May 27, 2002. The paid-up equity share capital of the AMC is Rs. 54.2 crores. HSBC Securities and Capital Markets (India) Private Limited holds 100% of the paid up equity share capital of the AMC.
3. INVESTMENT OBJECTIVE OF THE SCHEMESThe investment objective of the respective Schemes has been provided above under the heading “Scheme Performance, Future Outlook and Operation of the Scheme” (Refer Section 1).
4. SIGNIFICANT ACCOUNTING POLICIESThe accounting policies are in accordance with Securities Exchange Board of India (Mutual Funds) Regulations 1996.
Trustees’ ReportFor the year ended March 31, 2013 (Contd...)
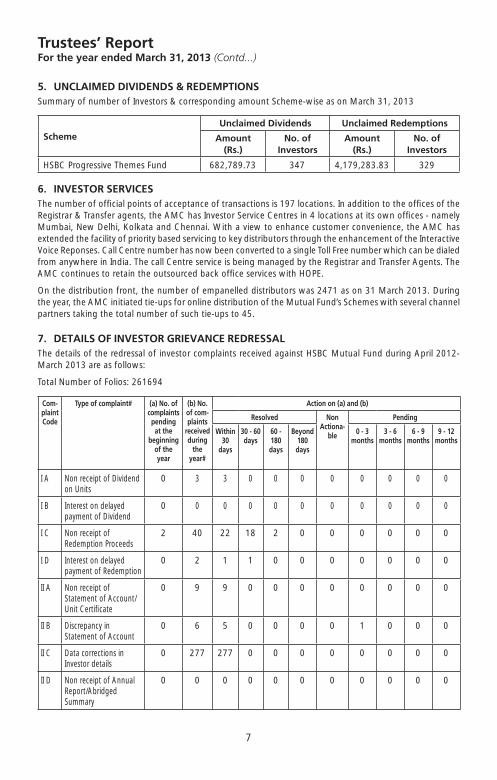
7
HSBC Progressive Themes Fund
5. UNCLAIMED DIVIDENDS & REDEMPTIONSSummary of number of Investors & corresponding amount Scheme-wise as on March 31, 2013
SchemeUnclaimed Dividends Unclaimed Redemptions
Amount (Rs.)
No. of Investors
Amount (Rs.)
No. of Investors
HSBC Progressive Themes Fund 682,789.73 347 4,179,283.83 329
6. INVESTOR SERVICESThe number of offi cial points of acceptance of transactions is 197 locations. In addition to the offi ces of the Registrar & Transfer agents, the AMC has Investor Service Centres in 4 locations at its own offi ces - namely Mumbai, New Delhi, Kolkata and Chennai. With a view to enhance customer convenience, the AMC has extended the facility of priority based servicing to key distributors through the enhancement of the Interactive Voice Reponses. Call Centre number has now been converted to a single Toll Free number which can be dialed from anywhere in India. The call Centre service is being managed by the Registrar and Transfer Agents. The AMC continues to retain the outsourced back offi ce services with HOPE.
On the distribution front, the number of empanelled distributors was 2471 as on 31 March 2013. During the year, the AMC initiated tie-ups for online distribution of the Mutual Fund’s Schemes with several channel partners taking the total number of such tie-ups to 45.
7. DETAILS OF INVESTOR GRIEVANCE REDRESSALThe details of the redressal of investor complaints received against HSBC Mutual Fund during April 2012- March 2013 are as follows:
Total Number of Folios: 261694
Com-plaintCode
Type of complaint#
(a) No. ofcomplaintspendingat the
beginningof theyear
(b) No. of com-plaints
receivedduring
theyear#
Action on (a) and (b)
Resolved Non Actiona-
ble
Pending
Within 30
days
30 - 60 days
60 - 180 days
Beyond 180 days
0 - 3 months
3 - 6 months
6 - 9 months
9 - 12 months
I A Non receipt of Dividend on Units
0 3 3 0 0 0 0 0 0 0 0
I B Interest on delayed payment of Dividend
0 0 0 0 0 0 0 0 0 0 0
I C Non receipt of Redemption Proceeds
2 40 22 18 2 0 0 0 0 0 0
I D Interest on delayed payment of Redemption
0 2 1 1 0 0 0 0 0 0 0
II A Non receipt of Statement of Account/Unit Certifi cate
0 9 9 0 0 0 0 0 0 0 0
II B Discrepancy in Statement of Account
0 6 5 0 0 0 0 1 0 0 0
II C Data corrections in Investor details
0 277 277 0 0 0 0 0 0 0 0
II D Non receipt of Annual Report/Abridged Summary
0 0 0 0 0 0 0 0 0 0 0
Trustees’ ReportFor the year ended March 31, 2013 (Contd...)

8
HSBC Progressive Themes Fund
Com-plaintCode
Type of complaint#
(a) No. ofcomplaintspendingat the
beginningof theyear
(b) No. of com-plaints
receivedduring
theyear#
Action on (a) and (b)
Resolved Non Actiona-
ble
Pending
Within 30
days
30 - 60 days
60 - 180 days
Beyond 180 days
0 - 3 months
3 - 6 months
6 - 9 months
9 - 12 months
III A Wrong switch between Schemes
0 0 0 0 0 0 0 0 0 0 0
III B Unauthorized switch between Schemes
0 0 0 0 0 0 0 0 0 0 0
III C Deviation from Scheme attributes
0 0 0 0 0 0 0 0 0 0 0
III D Wrong or excess charges/load
0 0 0 0 0 0 0 0 0 0 0
III E Non updation of changes viz. address, PAN, bank details, nomination, etc
0 18 18 0 0 0 0 0 0 0 0
IV Others 0 14 12 1 1 0 0 0 0 0 0
Total 2 369 347 20 3 0 0 1 0 0 0
Note:
# including against its authorized persons / distributors / employees etc.
8. STATUTORY DETAILSa) The Sponsors are not responsible or liable for any loss resulting from the operation of the Schemes of
the Fund beyond initial contribution of Rs. 1 lakh for setting up the Fund.
b) The price and redemption value of the units, and income from them, can go up as well as down with fl uctuations in the market value of its underlying investments.
c) Full Annual Report shall be disclosed on the website at www.assetmanagement.hsbc.com/in and shall be available for inspection at the Head Offi ce of the mutual fund. Present and prospective unit holder can obtain copy of the trust deed, the full Annual Report of the Scheme(s), the Annual Report of HSBC Asset Management (India) Private Limited and the text of the relevant Scheme(s) at a price.
9. ACKNOWLEDGEMENTSThe Trustees wish to thank the Unit holders of the Schemes for their support throughout the year and also thank the Government of India, the Securities and Exchange Board of India (SEBI), the Reserve Bank of India (RBI) and the Association of Mutual Funds in India (AMFI) for the guidance provided by them. The Trustees also appreciate the service provided by the Registrar and Transfer Agent, Fund Accountant, Custodian, Bankers, Distributors and Brokers. The guidance and services provided by the Auditors and advocates and the ebullience, sincerity and dedication of the employees of HSBC Asset Management (India) Private Limited is also appreciated.
The Trustees look forward to the continued support of everyone.
For and on behalf of the Board of Trustees of HSBC Mutual Fund
Sd/-
Dilip J. Thakkar
Trustee
MUMBAIJuly 16, 2013
Trustees’ ReportFor the year ended March 31, 2013 (Contd...)

9
HSBC Progressive Themes Fund
To the Board of Trustees of
HSBC Mutual Fund
Report on the Financial Statements1. We have audited the accompanying fi nancial statements of HSBC Mutual Fund - HSBC Progressive Themes
Fund, (the “Scheme”), which comprise the Balance Sheet as at March 31, 2013, and the related Revenue Account and Cash Flow Statement for the year then ended, and a summary of signifi cant accounting policies and other explanatory information, which we have signed under reference to this report.
Trustee’s and Management’s Responsibility for the Financial Statements2. The Board of Trustees of HSBC Mutual Fund (the “Trustee”) and the Management of HSBC Asset
Management (India) Private Limited (the “Management”) are responsible for the preparation of these fi nancial statements that give a true and fair view of the fi nancial position, fi nancial performance and cash fl ows of the Scheme in accordance with the accounting policies and standards specifi ed in the Ninth Schedule of the Securities and Exchange Board of India (Mutual Funds) Regulations, 1996 and amendments thereto (the “Regulations”). This responsibility includes the design, implementation and maintenance of internal control relevant to the preparation and presentation of the fi nancial statements that give a true and fair view and are free from material misstatement, whether due to fraud or error.
Auditors’ Responsibility3. Our responsibility is to express an opinion on these fi nancial statements based on our audit. We conducted
our audit in accordance with the Standards on Auditing issued by the Institute of Chartered Accountants of India. Those Standards require that we comply with ethical requirements and plan and perform the audit to obtain reasonable assurance about whether the fi nancial statements are free from material misstatement.
4. An audit involves performing procedures to obtain audit evidence, about the amounts and disclosures in the fi nancial statements. The procedures selected depend on the auditors’ judgment, including the assessment of the risks of material misstatement of the fi nancial statements, whether due to fraud or error. In making those risk assessments, the auditors consider internal control relevant to the preparation and fair presentation of the fi nancial statements in order to design audit procedures that are appropriate in the circumstances. Our procedures included confi rmation of securities owned and unit capital balances as at March 31, 2013 by correspondence with the custodian/others and registrar and transfer agent, respectively. An audit also includes evaluating the appropriateness of accounting policies used and the reasonableness of the accounting estimates made by the Trustee and the Management, as well as evaluating the overall presentation of the fi nancial statements.
5. We believe that the audit evidence we have obtained is suffi cient and appropriate to provide a basis for our audit opinion.
Opinion6. In our opinion, and to the best of our information and according to the explanations given to us, the
accompanying fi nancial statements give the information required by the Regulations in the manner so required and give a true and fair view in conformity with the accounting principles generally accepted in India:
(a) in the case of the Balance Sheet, of the state of affairs of the Scheme as at March 31, 2013;
(b) in the case of the Revenue Account, of the net defi cit for the year ended on that date; and
(c) in the case of the Cash Flow Statement, of the cash fl ows for the year ended on that date.
Report on Other Legal and Regulatory Requirement7. As required by section 55(4) of the Regulations, we report that:
(a) We have obtained all the information and explanations which, to the best of our knowledge and belief, were necessary for the purposes of our audit; and
Independent Auditors’ Report

10
HSBC Progressive Themes Fund
Independent Auditors’ Report (Contd...)
(b) In our opinion, the Balance Sheet, Revenue Account and Cash Flow Statement dealt with by this report have been prepared in accordance with the accounting policies and standards specifi ed in the Ninth Schedule of the Regulations.
8. As required by clause 5 (ii)(2) of the Eleventh Schedule to the Regulations, we report that the Balance Sheet, Revenue Account, and Cash Flow Statement dealt with by this Report are in agreement with the books of account of the Scheme.
For PRICE WATERHOUSEFirm Registration Number: 301112EChartered Accountants
Sd/-
Vivek PrasadPartnerMembership Number: 104941
Place : MumbaiDate : July 16, 2013

4
HSBC MIDCAP EQUITY FUND
Trustees’ ReportFor the year ended March 31, 2013
The Trustees present the eleventh report and the audited abridged fi nancial statements of the Schemes of HSBC Mutual Fund (the “Fund”), for the year ended March 31, 2013.
1. SCHEME PERFORMANCE, FUTURE OUTLOOK AND OPERATIONS OF THE SCHEMES
a) Operations and Performance of the Schemes
HSBC Midcap Equity Fund (HMEF) - an open-ended diversifi ed Equity Scheme
HMEF seeks to generate long term capital growth from an actively managed portfolio of equity and equity related securities primarily being midcap stocks. However, it could move a portion of its assets towards fi xed income securities if the fund manager becomes negative on the Indian equity markets.
The net assets of HMEF amounted to Rs. 82.29 crores as at March 31, 2013 as compared to Rs. 109.54 crores as at March 31, 2012. Around 99.54 % of the net assets were invested in equities, 0.71% of the net assets were invested in reverse repos/CBLO and (-0.26 %) were in the net current assets as at March 31, 2013.
HMEF being relatively in lower market cap companies has under-performed against its benchmark. During the year 2012-13, the mid-small cap side of the market has seen weak sentiments, margin funding and related issues. HMEF was underweight in expensive sectors like Consumer and Pharma stocks during the period which had performed well.
Date of Inception : 19 May, 2005 Absolute (%) Compounded Annualized (%)
Scheme Name & Benchmarks April ‘12 - March ‘13
April ‘11 - March ‘12
April ‘10 - March ‘11
Since Inception
HSBC Midcap Equity Fund - Growth -8.82 -8.51 -10.38 7.17
CNX Nifty Index (Standard Benchmark) 6.93 -9.13 10.27 13.96
S&P BSE MID CAP (Scheme Benchmark) -4.30 -9.14 0.11 8.43
Rs. 10,000, if invested in HMEF - Growth, would have become
9,118 9,149 8,962 17,263
Rs. 10,000, if invested in CNX Nifty Index, would have become
10,693 9087 11,027 28,002
Rs. 10,000, if invested in S&P BSE MID CAP, would have become
9,570 9086 10,011 18,919
Returns data as on March 31, 2013. Past performance may or may not be sustained in future. ‘Since Inception’ returns are calculated on Rs. 10 invested at inception. Calculations are based on Growth NAVs.
b) Market Overview & Outlook
EQUITY OUTLOOK
The Sensex returned 8.23% for the FY ended March 2013. While this looks to be a tepid return, the market rallied smoothly for a low of 15965 in June to end at 18835 at the FY end, a return of 17.98%. This was largely due to a series of announcements on reforms by the government and falling crude oil prices, signaling hopes of an economic recovery.
Returns (April 1, 2012 - March 31, 2013) 1 Year (%)
NIFTY 7.31
Sensex 8.23
S&P BSE 100 6.84
S&P BSE 200 6.03
S&P BSE 500 4.81
CNX Midcap -4.02
Source: Bloomberg

5
HSBC MIDCAP EQUITY FUND
Trustees’ ReportFor the year ended March 31, 2013 (Contd...)
Our view in respect of key issues facing equity market currently is highlighted as under, based on which we do expect a likely reversal of the prevailing negative sentiment going forward -
� Macro challenge - expect some relief in current account defi cit given likely lower gold imports and crude oil correction. Solution to fi scal defi cit may however need policy decision to reduce subsidy burden on diesel, kerosene, LPG.
� Commodities infl ation expected to decline on account of China slowdown and lower growth in western world. This may have positive impact margin expansion for corporate sector and on currency (INR) and will give room for reducing interest rates over time. Lower cost of capital should hopefully revive capex spending, though gradually (recovery from 2H12).
� Lower interest rates directionally would be the single most important variable for equity markets to rally. This will be driven by lower commodity infl ation and focus back on reviving growth through monetary policy (recent disappointing GDP/IIP numbers support this view).
� Valuations (for large Sensex companies) are attractive at close to 13x forward earnings and in the lower range of historic multiples. A large number of mid-caps available at a signifi cant discount to large cap peer.
� Structural model for India equity investment remains intact for long term returns. These include favourable demography, high savings rate, rising incomes, growing consumption demand growth, existing low penetration, etc.
DEBT OUTLOOK
Fixed Income market in FY 2013 moved towards lower yields on back of 100 bps rate cut and CRR cuts. RBI front loaded the rate cut in April and then followed it up in January 2013 and March 2013. Towards the second half rates stabilized largely as the core infl ation remained within comfort zone.
In the second half of the year expectation of rate cut and series of open market operations led to rally in rates. Government borrowing was lower than budgeted and the spending was also controlled in second half of the year. Towards the end of the year short end rates tightened substantially due to low deposit growth in banking system.
Corporate yield curve remained inverted with short end rates higher than long end rates for the large part of the year due to liquidity tightness.
Expectation is to see continuation of some easing of the rates stance from RBI in FY 14. However, there is a need to focus on key variables in the economy to judge future directions. These are:
� Liquidity: Liquidity will drive short end rates and eventually drive decisions on open market operations as well as CRR cuts.
� Infl ation: Infl ation numbers will determine future course of action for RBI and remains a critical variable for policy. We expect infl ation to ease in fi rst half of FY 14.
� Growth: GDP growth numbers as well as industrial activity will also determine the decision on policy. Weak GDP numbers may continue for couple of quarters.
� Fiscal defi cit: Fiscal defi cit and government spending will determine the government borrowing and crowding out in interest rate curve.
� Current account defi cit / BoP situation: CAD determines how the pressure on currency works and effective management of forex reserves.
� Currency levels: Level of INR will determine how the central banker reacts to the situation on the global crisis etc.

6
HSBC MIDCAP EQUITY FUND
Trustees’ ReportFor the year ended March 31, 2013 (Contd...)
2. BRIEF BACKGROUND OF SPONSORS, BOARD OF TRUSTEES AND ASSET MANAGEMENT COMPANY
a) Sponsor HSBC Mutual Fund is sponsored by HSBC Securities and Capital Markets (India) Private Limited (HSCI).
The Sponsor is the Settler of the Mutual Fund Trust. The Sponsor has entrusted a sum of Rs.1,00,000 (Rupees One Lakh only) to the Trustee as the initial contribution towards the corpus of the Mutual Fund.
HSCI offers integrated investment banking services, securities and corporate fi nance & advisory. HSCI is a member of The Bombay Stock Exchange Limited and National Stock Exchange (capital and derivative market segments). HSCI holds 100% of the paid up equity share capital of HSBC Asset Management (India) Private Limited.
b) HSBC Mutual Fund HSBC Mutual Fund (“the Mutual Fund” or “the Fund”) has been constituted as a Trust in accordance with
the provisions of the Indian Trusts Act, 1882 (2 of 1882) vide a Trust Deed dated February 7, 2002 with HSBC Securities and Capital Markets (India) Private Limited, as the Sponsor and the Board of Individual Trustees. The Trustee has entered into an Investment Management Agreement dated February 7, 2002 with HSBC Asset Management (India) Private Limited (AMC) to function as the Investment Manager for all the Schemes of the Fund. The Fund was registered with SEBI vide registration number MF/046/02/5 dated May 27, 2002.
The Trust has been formed for the purpose of pooling of capital from the public for collective investment in securities/any other property for the purpose of providing facilities for participation by persons as benefi ciaries in such properties/investments and in the profi ts/income arising therefrom.
c) Board of Trustees (the Trustees) The Board of Trustees is the exclusive owner of the Trust Fund and holds the same in trust for the benefi t
of the unit holders. The Trustees have been discharging their duties and carrying out the responsibilities as provided in the SEBI (Mutual Funds) Regulations, 1996 and the Trust Deed. The Trustees seek to ensure that the Fund and the Schemes fl oated there under are managed by the AMC in accordance with the Trust Deed, the said Regulations, directions and guidelines issued by the SEBI, the Stock Exchanges, the Association of Mutual Funds in India and other regulatory agencies.
d) Asset Management Company (the AMC) HSBC Asset Management (India) Private Limited (the Investment Manager or the AMC) is a private limited
company incorporated under the Companies Act, 1956 on December 12, 2001 having its Registered Offi ce at 16, V. N. Road, Fort, Mumbai 400 001. HSBC Asset Management (India) Private Limited has been appointed as the Asset Management Company of the HSBC Mutual Fund by the Trustee vide Investment Management Agreement (IMA) dated February 7, 2002 and executed between the Trustees and the AMC. SEBI approved the AMC to act as the Investment Manager of the Fund vide its letter No. MFD/BC/163/2002 dated May 27, 2002. The paid-up equity share capital of the AMC is Rs. 54.2 crores. HSBC Securities and Capital Markets (India) Private Limited holds 100% of the paid up equity share capital of the AMC.
3. INVESTMENT OBJECTIVE OF THE SCHEMESThe investment objective of the respective Schemes has been provided above under the heading “Scheme Performance, Future Outlook and Operation of the Scheme” (Refer Section 1).
4. SIGNIFICANT ACCOUNTING POLICIESThe accounting policies are in accordance with Securities Exchange Board of India (Mutual Funds) Regulations 1996.

7
HSBC MIDCAP EQUITY FUND
Trustees’ ReportFor the year ended March 31, 2013 (Contd...)
5. UNCLAIMED DIVIDENDS & REDEMPTIONSSummary of number of Investors & corresponding amount Scheme-wise as on March 31, 2013
SchemeUnclaimed Dividends Unclaimed Redemptions
Amount (Rs.)
No. of Investors
Amount (Rs.)
No. of Investors
HSBC Midcap Equity Fund 716,392.34 392 68,292.99 3
6. INVESTOR SERVICESThe number of offi cial points of acceptance of transactions is 197 locations. In addition to the offi ces of the Registrar & Transfer agents, the AMC has Investor Service Centres in 4 locations at its own offi ces - namely Mumbai, New Delhi, Kolkata and Chennai. With a view to enhance customer convenience, the AMC has extended the facility of priority based servicing to key distributors through the enhancement of the Interactive Voice Reponses. Call Centre number has now been converted to a single Toll Free number which can be dialed from anywhere in India. The call Centre service is being managed by the Registrar and Transfer Agents. The AMC continues to retain the outsourced back offi ce services with HOPE.
On the distribution front, the number of empanelled distributors was 2471 as on 31 March 2013. During the year, the AMC initiated tie-ups for online distribution of the Mutual Fund’s Schemes with several channel partners taking the total number of such tie-ups to 45.
7. DETAILS OF INVESTOR GRIEVANCE REDRESSALThe details of the redressal of investor complaints received against HSBC Mutual Fund during April 2012- March 2013 are as follows:
Total Number of Folios: 261694
Com-plaintCode
Type of complaint#
(a) No. ofcomplaintspendingat the
beginningof theyear
(b) No. of com-plaints
receivedduring
theyear#
Action on (a) and (b)
Resolved Non Actiona-
ble
Pending
Within 30
days
30 - 60 days
60 - 180 days
Beyond 180 days
0 - 3 months
3 - 6 months
6 - 9 months
9 - 12 months
I A Non receipt of Dividend on Units
0 3 3 0 0 0 0 0 0 0 0
I B Interest on delayed payment of Dividend
0 0 0 0 0 0 0 0 0 0 0
I C Non receipt of Redemption Proceeds
2 40 22 18 2 0 0 0 0 0 0
I D Interest on delayed payment of Redemption
0 2 1 1 0 0 0 0 0 0 0
II A Non receipt of Statement of Account/Unit Certifi cate
0 9 9 0 0 0 0 0 0 0 0
II B Discrepancy in Statement of Account
0 6 5 0 0 0 0 1 0 0 0
II C Data corrections in Investor details
0 277 277 0 0 0 0 0 0 0 0
II D Non receipt of Annual Report/Abridged Summary
0 0 0 0 0 0 0 0 0 0 0
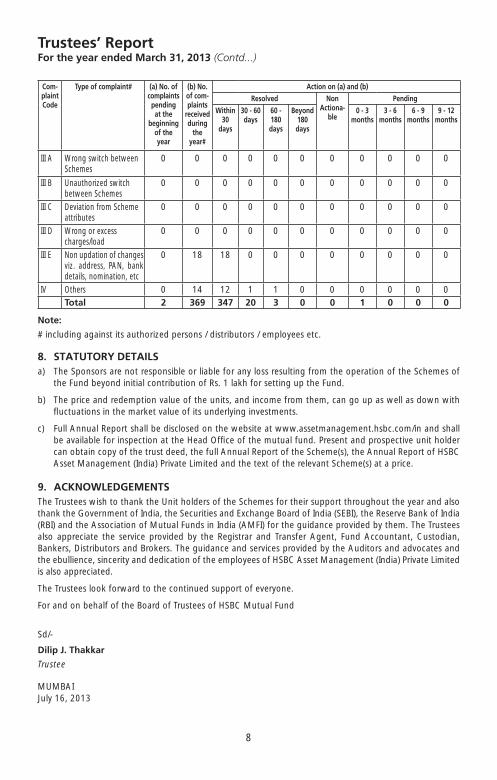
8
HSBC MIDCAP EQUITY FUND
Trustees’ ReportFor the year ended March 31, 2013 (Contd...)
Com-plaintCode
Type of complaint#
(a) No. ofcomplaintspendingat the
beginningof theyear
(b) No. of com-plaints
receivedduring
theyear#
Action on (a) and (b)
Resolved Non Actiona-
ble
Pending
Within 30
days
30 - 60 days
60 - 180 days
Beyond 180 days
0 - 3 months
3 - 6 months
6 - 9 months
9 - 12 months
III A Wrong switch between Schemes
0 0 0 0 0 0 0 0 0 0 0
III B Unauthorized switch between Schemes
0 0 0 0 0 0 0 0 0 0 0
III C Deviation from Scheme attributes
0 0 0 0 0 0 0 0 0 0 0
III D Wrong or excess charges/load
0 0 0 0 0 0 0 0 0 0 0
III E Non updation of changes viz. address, PAN, bank details, nomination, etc
0 18 18 0 0 0 0 0 0 0 0
IV Others 0 14 12 1 1 0 0 0 0 0 0Total 2 369 347 20 3 0 0 1 0 0 0
Note:
# including against its authorized persons / distributors / employees etc.
8. STATUTORY DETAILSa) The Sponsors are not responsible or liable for any loss resulting from the operation of the Schemes of
the Fund beyond initial contribution of Rs. 1 lakh for setting up the Fund.
b) The price and redemption value of the units, and income from them, can go up as well as down with fl uctuations in the market value of its underlying investments.
c) Full Annual Report shall be disclosed on the website at www.assetmanagement.hsbc.com/in and shall be available for inspection at the Head Offi ce of the mutual fund. Present and prospective unit holder can obtain copy of the trust deed, the full Annual Report of the Scheme(s), the Annual Report of HSBC Asset Management (India) Private Limited and the text of the relevant Scheme(s) at a price.
9. ACKNOWLEDGEMENTSThe Trustees wish to thank the Unit holders of the Schemes for their support throughout the year and also thank the Government of India, the Securities and Exchange Board of India (SEBI), the Reserve Bank of India (RBI) and the Association of Mutual Funds in India (AMFI) for the guidance provided by them. The Trustees also appreciate the service provided by the Registrar and Transfer Agent, Fund Accountant, Custodian, Bankers, Distributors and Brokers. The guidance and services provided by the Auditors and advocates and the ebullience, sincerity and dedication of the employees of HSBC Asset Management (India) Private Limited is also appreciated.
The Trustees look forward to the continued support of everyone.
For and on behalf of the Board of Trustees of HSBC Mutual Fund
Sd/-
Dilip J. Thakkar
Trustee
MUMBAIJuly 16, 2013
9
HSBC MIDCAP EQUITY FUND
To the Board of Trustees of
HSBC Mutual Fund
Report on the Financial Statements1. We have audited the accompanying fi nancial statements of HSBC Mutual Fund - HSBC Midcap Equity
Fund (the “Scheme”), which comprise the Balance Sheet as at March 31, 2013, and the related Revenue Account for the year then ended, and a summary of signifi cant accounting policies and other explanatory information, which we have signed under reference to this report.
Trustee’s and Management’s Responsibility for the Financial Statements2. The Board of Trustees of HSBC Mutual Fund (the “Trustee”) and the Management of HSBC Asset
Management (India) Private Limited (the “Management”) are responsible for the preparation of these fi nancial statements that give a true and fair view of the fi nancial position and fi nancial performance of the Scheme in accordance with the accounting policies and standards specifi ed in the Ninth Schedule of the Securities and Exchange Board of India (Mutual Funds) Regulations, 1996 and amendments thereto (the “Regulations”). This responsibility includes the design, implementation and maintenance of internal control relevant to the preparation and presentation of the fi nancial statements that give a true and fair view and are free from material misstatement, whether due to fraud or error.
Auditors’ Responsibility3. Our responsibility is to express an opinion on these fi nancial statements based on our audit. We conducted
our audit in accordance with the Standards on Auditing issued by the Institute of Chartered Accountants of India. Those Standards require that we comply with ethical requirements and plan and perform the audit to obtain reasonable assurance about whether the fi nancial statements are free from material misstatement.
4. An audit involves performing procedures to obtain audit evidence, about the amounts and disclosures in the fi nancial statements. The procedures selected depend on the auditors’ judgment, including the assessment of the risks of material misstatement of the fi nancial statements, whether due to fraud or error. In making those risk assessments, the auditors consider internal control relevant to the preparation and fair presentation of the fi nancial statements in order to design audit procedures that are appropriate in the circumstances. Our procedures included confi rmation of securities owned and unit capital balances as at March 31, 2013 by correspondence with the custodian/others and registrar and transfer agent, respectively. An audit also includes evaluating the appropriateness of accounting policies used and the reasonableness of the accounting estimates made by the Trustee and the Management, as well as evaluating the overall presentation of the fi nancial statements.
5. We believe that the audit evidence we have obtained is suffi cient and appropriate to provide a basis for our audit opinion.
Opinion6. In our opinion, and to the best of our information and according to the explanations given to us, the
accompanying fi nancial statements give the information required by the Regulations in the manner so required and give a true and fair view in conformity with the accounting principles generally accepted in India:
(a) in the case of the Balance Sheet, of the state of affairs of the Scheme as at March 31, 2013; and
(b) in the case of the Revenue Account, of the net defi cit for the year ended on that date.
Report on Other Legal and Regulatory Requirement7. As required by section 55(4) of the Regulations, we report that:
(a) We have obtained all the information and explanations which, to the best of our knowledge and belief, were necessary for the purposes of our audit; and
Independent Auditors’ Report

10
HSBC MIDCAP EQUITY FUND
Independent Auditors’ Report (Contd...)
(b) In our opinion, the Balance Sheet and Revenue Account dealt with by this report have been prepared in accordance with the accounting policies and standards specifi ed in the Ninth Schedule of the Regulations.
8. As required by clause 5 (ii)(2) of the Eleventh Schedule to the Regulations, we report that the Balance Sheet and Revenue Account dealt with by this Report are in agreement with the books of account of the Scheme.
For PRICE WATERHOUSEFirm Registration Number: 301112EChartered Accountants
Sd/-
Vivek PrasadPartnerMembership Number: 104941
Place : MumbaiDate : July 16, 2013
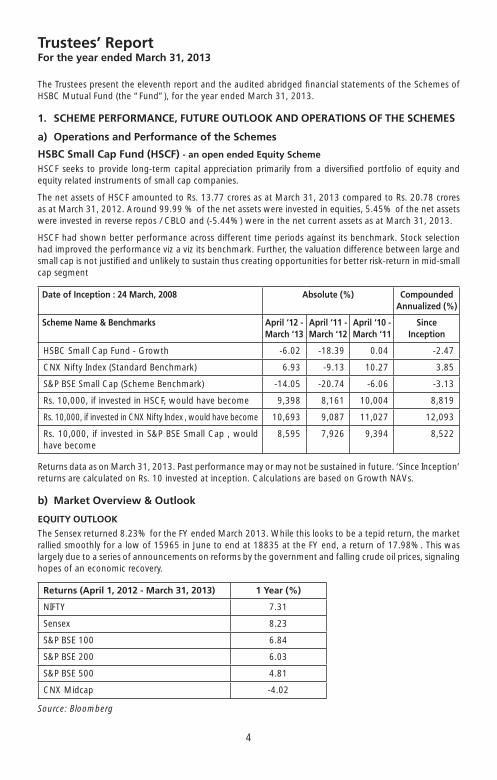
4
HSBC SMALL CAP FUND
Trustees’ ReportFor the year ended March 31, 2013
The Trustees present the eleventh report and the audited abridged fi nancial statements of the Schemes of HSBC Mutual Fund (the “Fund”), for the year ended March 31, 2013.
1. SCHEME PERFORMANCE, FUTURE OUTLOOK AND OPERATIONS OF THE SCHEMES
a) Operations and Performance of the Schemes
HSBC Small Cap Fund (HSCF) - an open ended Equity Scheme
HSCF seeks to provide long-term capital appreciation primarily from a diversifi ed portfolio of equity and equity related instruments of small cap companies.
The net assets of HSCF amounted to Rs. 13.77 crores as at March 31, 2013 compared to Rs. 20.78 crores as at March 31, 2012. Around 99.99 % of the net assets were invested in equities, 5.45% of the net assets were invested in reverse repos / CBLO and (-5.44%) were in the net current assets as at March 31, 2013.
HSCF had shown better performance across different time periods against its benchmark. Stock selection had improved the performance viz a viz its benchmark. Further, the valuation difference between large and small cap is not justifi ed and unlikely to sustain thus creating opportunities for better risk-return in mid-small cap segment
Date of Inception : 24 March, 2008 Absolute (%) Compounded Annualized (%)
Scheme Name & Benchmarks April ‘12 - March ‘13
April ‘11 - March ‘12
April ‘10 - March ‘11
Since Inception
HSBC Small Cap Fund - Growth -6.02 -18.39 0.04 -2.47
CNX Nifty Index (Standard Benchmark) 6.93 -9.13 10.27 3.85
S&P BSE Small Cap (Scheme Benchmark) -14.05 -20.74 -6.06 -3.13
Rs. 10,000, if invested in HSCF, would have become 9,398 8,161 10,004 8,819
Rs. 10,000, if invested in CNX Nifty Index , would have become 10,693 9,087 11,027 12,093
Rs. 10,000, if invested in S&P BSE Small Cap , would have become
8,595 7,926 9,394 8,522
Returns data as on March 31, 2013. Past performance may or may not be sustained in future. ‘Since Inception’ returns are calculated on Rs. 10 invested at inception. Calculations are based on Growth NAVs.
b) Market Overview & Outlook
EQUITY OUTLOOK
The Sensex returned 8.23% for the FY ended March 2013. While this looks to be a tepid return, the market rallied smoothly for a low of 15965 in June to end at 18835 at the FY end, a return of 17.98%. This was largely due to a series of announcements on reforms by the government and falling crude oil prices, signaling hopes of an economic recovery.
Returns (April 1, 2012 - March 31, 2013) 1 Year (%)
NIFTY 7.31
Sensex 8.23
S&P BSE 100 6.84
S&P BSE 200 6.03
S&P BSE 500 4.81
CNX Midcap -4.02
Source: Bloomberg

5
HSBC SMALL CAP FUND
Trustees’ ReportFor the year ended March 31, 2013 (Contd...)
Our view in respect of key issues facing equity market currently is highlighted as under, based on which we do expect a likely reversal of the prevailing negative sentiment going forward -
� Macro challenge - expect some relief in current account defi cit given likely lower gold imports and crude oil correction. Solution to fi scal defi cit may however need policy decision to reduce subsidy burden on diesel, kerosene, LPG.
� Commodities infl ation expected to decline on account of China slowdown and lower growth in western world. This may have positive impact margin expansion for corporate sector and on currency (INR) and will give room for reducing interest rates over time. Lower cost of capital should hopefully revive capex spending, though gradually (recovery from 2H12).
� Lower interest rates directionally would be the single most important variable for equity markets to rally. This will be driven by lower commodity infl ation and focus back on reviving growth through monetary policy (recent disappointing GDP/IIP numbers support this view).
� Valuations (for large Sensex companies) are attractive at close to 13x forward earnings and in the lower range of historic multiples. A large number of mid-caps available at a signifi cant discount to large cap peer.
� Structural model for India equity investment remains intact for long term returns. These include favourable demography, high savings rate, rising incomes, growing consumption demand growth, existing low penetration, etc.
DEBT OUTLOOK
Fixed Income market in FY 2013 moved towards lower yields on back of 100 bps rate cut and CRR cuts. RBI front loaded the rate cut in April and then followed it up in January 2013 and March 2013. Towards the second half rates stabilized largely as the core infl ation remained within comfort zone.
In the second half of the year expectation of rate cut and series of open market operations led to rally in rates. Government borrowing was lower than budgeted and the spending was also controlled in second half of the year. Towards the end of the year short end rates tightened substantially due to low deposit growth in banking system.
Corporate yield curve remained inverted with short end rates higher than long end rates for the large part of the year due to liquidity tightness.
Expectation is to see continuation of some easing of the rates stance from RBI in FY 14. However, there is a need to focus on key variables in the economy to judge future directions. These are:
� Liquidity: Liquidity will drive short end rates and eventually drive decisions on open market operations as well as CRR cuts.
� Infl ation: Infl ation numbers will determine future course of action for RBI and remains a critical variable for policy. We expect infl ation to ease in fi rst half of FY 14.
� Growth: GDP growth numbers as well as industrial activity will also determine the decision on policy. Weak GDP numbers may continue for couple of quarters.
� Fiscal defi cit: Fiscal defi cit and government spending will determine the government borrowing and crowding out in interest rate curve.
� Current account defi cit / BoP situation: CAD determines how the pressure on currency works and effective management of forex reserves.
� Currency levels: Level of INR will determine how the central banker reacts to the situation on the global crisis etc.

6
HSBC SMALL CAP FUND
Trustees’ ReportFor the year ended March 31, 2013 (Contd...)
2. BRIEF BACKGROUND OF SPONSORS, BOARD OF TRUSTEES AND ASSET MANAGEMENT COMPANY
a) Sponsor HSBC Mutual Fund is sponsored by HSBC Securities and Capital Markets (India) Private Limited (HSCI).
The Sponsor is the Settler of the Mutual Fund Trust. The Sponsor has entrusted a sum of Rs.1,00,000 (Rupees One Lakh only) to the Trustee as the initial contribution towards the corpus of the Mutual Fund.
HSCI offers integrated investment banking services, securities and corporate fi nance & advisory. HSCI is a member of The Bombay Stock Exchange Limited and National Stock Exchange (capital and derivative market segments). HSCI holds 100% of the paid up equity share capital of HSBC Asset Management (India) Private Limited.
b) HSBC Mutual Fund HSBC Mutual Fund (“the Mutual Fund” or “the Fund”) has been constituted as a Trust in accordance with
the provisions of the Indian Trusts Act, 1882 (2 of 1882) vide a Trust Deed dated February 7, 2002 with HSBC Securities and Capital Markets (India) Private Limited, as the Sponsor and the Board of Individual Trustees. The Trustee has entered into an Investment Management Agreement dated February 7, 2002 with HSBC Asset Management (India) Private Limited (AMC) to function as the Investment Manager for all the Schemes of the Fund. The Fund was registered with SEBI vide registration number MF/046/02/5 dated May 27, 2002.
The Trust has been formed for the purpose of pooling of capital from the public for collective investment in securities/any other property for the purpose of providing facilities for participation by persons as benefi ciaries in such properties/investments and in the profi ts/income arising therefrom.
c) Board of Trustees (the Trustees) The Board of Trustees is the exclusive owner of the Trust Fund and holds the same in trust for the benefi t
of the unit holders. The Trustees have been discharging their duties and carrying out the responsibilities as provided in the SEBI (Mutual Funds) Regulations, 1996 and the Trust Deed. The Trustees seek to ensure that the Fund and the Schemes fl oated there under are managed by the AMC in accordance with the Trust Deed, the said Regulations, directions and guidelines issued by the SEBI, the Stock Exchanges, the Association of Mutual Funds in India and other regulatory agencies.
d) Asset Management Company (the AMC) HSBC Asset Management (India) Private Limited (the Investment Manager or the AMC) is a private limited
company incorporated under the Companies Act, 1956 on December 12, 2001 having its Registered Offi ce at 16, V. N. Road, Fort, Mumbai 400 001. HSBC Asset Management (India) Private Limited has been appointed as the Asset Management Company of the HSBC Mutual Fund by the Trustee vide Investment Management Agreement (IMA) dated February 7, 2002 and executed between the Trustees and the AMC. SEBI approved the AMC to act as the Investment Manager of the Fund vide its letter No. MFD/BC/163/2002 dated May 27, 2002. The paid-up equity share capital of the AMC is Rs. 54.2 crores. HSBC Securities and Capital Markets (India) Private Limited holds 100% of the paid up equity share capital of the AMC.
3. INVESTMENT OBJECTIVE OF THE SCHEMESThe investment objective of the respective Schemes has been provided above under the heading “Scheme Performance, Future Outlook and Operation of the Scheme” (Refer Section 1).
4. SIGNIFICANT ACCOUNTING POLICIESThe accounting policies are in accordance with Securities Exchange Board of India (Mutual Funds) Regulations 1996.

7
HSBC SMALL CAP FUND
Trustees’ ReportFor the year ended March 31, 2013 (Contd...)
5. UNCLAIMED DIVIDENDS & REDEMPTIONSSummary of number of Investors & corresponding amount Scheme-wise as on March 31, 2013
SchemeUnclaimed Dividends Unclaimed Redemptions
Amount (Rs.)
No. of Investors
Amount (Rs.)
No. of Investors
HSBC Small Cap Fund 25,300.00 13 309,257.88 17
6. INVESTOR SERVICESThe number of offi cial points of acceptance of transactions is 197 locations. In addition to the offi ces of the Registrar & Transfer agents, the AMC has Investor Service Centres in 4 locations at its own offi ces - namely Mumbai, New Delhi, Kolkata and Chennai. With a view to enhance customer convenience, the AMC has extended the facility of priority based servicing to key distributors through the enhancement of the Interactive Voice Reponses. Call Centre number has now been converted to a single Toll Free number which can be dialed from anywhere in India. The call Centre service is being managed by the Registrar and Transfer Agents. The AMC continues to retain the outsourced back offi ce services with HOPE.
On the distribution front, the number of empanelled distributors was 2471 as on 31 March 2013. During the year, the AMC initiated tie-ups for online distribution of the Mutual Fund’s Schemes with several channel partners taking the total number of such tie-ups to 45.
7. DETAILS OF INVESTOR GRIEVANCE REDRESSALThe details of the redressal of investor complaints received against HSBC Mutual Fund during April 2012- March 2013 are as follows:
Total Number of Folios: 261694
Com-plaintCode
Type of complaint#
(a) No. ofcomplaintspendingat the
beginningof theyear
(b) No. of com-plaints
receivedduring
theyear#
Action on (a) and (b)
Resolved Non Actiona-
ble
Pending
Within 30
days
30 - 60 days
60 - 180 days
Beyond 180 days
0 - 3 months
3 - 6 months
6 - 9 months
9 - 12 months
I A Non receipt of Dividend on Units
0 3 3 0 0 0 0 0 0 0 0
I B Interest on delayed payment of Dividend
0 0 0 0 0 0 0 0 0 0 0
I C Non receipt of Redemption Proceeds
2 40 22 18 2 0 0 0 0 0 0
I D Interest on delayed payment of Redemption
0 2 1 1 0 0 0 0 0 0 0
II A Non receipt of Statement of Account/Unit Certifi cate
0 9 9 0 0 0 0 0 0 0 0
II B Discrepancy in Statement of Account
0 6 5 0 0 0 0 1 0 0 0
II C Data corrections in Investor details
0 277 277 0 0 0 0 0 0 0 0
II D Non receipt of Annual Report/Abridged Summary
0 0 0 0 0 0 0 0 0 0 0

8
HSBC SMALL CAP FUND
Trustees’ ReportFor the year ended March 31, 2013 (Contd...)
Com-plaintCode
Type of complaint#
(a) No. ofcomplaintspendingat the
beginningof theyear
(b) No. of com-plaints
receivedduring
theyear#
Action on (a) and (b)
Resolved Non Actiona-
ble
Pending
Within 30
days
30 - 60 days
60 - 180 days
Beyond 180 days
0 - 3 months
3 - 6 months
6 - 9 months
9 - 12 months
III A Wrong switch between Schemes
0 0 0 0 0 0 0 0 0 0 0
III B Unauthorized switch between Schemes
0 0 0 0 0 0 0 0 0 0 0
III C Deviation from Scheme attributes
0 0 0 0 0 0 0 0 0 0 0
III D Wrong or excess charges/load
0 0 0 0 0 0 0 0 0 0 0
III E Non updation of changes viz. address, PAN, bank details, nomination, etc
0 18 18 0 0 0 0 0 0 0 0
IV Others 0 14 12 1 1 0 0 0 0 0 0
Total 2 369 347 20 3 0 0 1 0 0 0
Note:
# including against its authorized persons / distributors / employees etc.
8. STATUTORY DETAILSa) The Sponsors are not responsible or liable for any loss resulting from the operation of the Schemes of
the Fund beyond initial contribution of Rs. 1 lakh for setting up the Fund.
b) The price and redemption value of the units, and income from them, can go up as well as down with fl uctuations in the market value of its underlying investments.
c) Full Annual Report shall be disclosed on the website at www.assetmanagement.hsbc.com/in and shall be available for inspection at the Head Offi ce of the mutual fund. Present and prospective unit holder can obtain copy of the trust deed, the full Annual Report of the Scheme(s), the Annual Report of HSBC Asset Management (India) Private Limited and the text of the relevant Scheme(s) at a price.
9. ACKNOWLEDGEMENTSThe Trustees wish to thank the Unit holders of the Schemes for their support throughout the year and also thank the Government of India, the Securities and Exchange Board of India (SEBI), the Reserve Bank of India (RBI) and the Association of Mutual Funds in India (AMFI) for the guidance provided by them. The Trustees also appreciate the service provided by the Registrar and Transfer Agent, Fund Accountant, Custodian, Bankers, Distributors and Brokers. The guidance and services provided by the Auditors and advocates and the ebullience, sincerity and dedication of the employees of HSBC Asset Management (India) Private Limited is also appreciated.
The Trustees look forward to the continued support of everyone.
For and on behalf of the Board of Trustees of HSBC Mutual Fund
Sd/-
Dilip J. Thakkar
Trustee
MUMBAIJuly 16, 2013
9
HSBC SMALL CAP FUND
To the Board of Trustees of
HSBC Mutual Fund
Report on the Financial Statements1. We have audited the accompanying fi nancial statements of HSBC Mutual Fund - HSBC Small Cap Fund
(the “Scheme”), which comprise the Balance Sheet as at March 31, 2013, and the related Revenue Account for the year then ended, and a summary of signifi cant accounting policies and other explanatory information, which we have signed under reference to this report.
Trustee’s and Management’s Responsibility for the Financial Statements2. The Board of Trustees of HSBC Mutual Fund (the “Trustee”) and the Management of HSBC Asset
Management (India) Private Limited (the “Management”) are responsible for the preparation of these fi nancial statements that give a true and fair view of the fi nancial position and fi nancial performance of the Scheme in accordance with the accounting policies and standards specifi ed in the Ninth Schedule of the Securities and Exchange Board of India (Mutual Funds) Regulations, 1996 and amendments thereto (the “Regulations”). This responsibility includes the design, implementation and maintenance of internal control relevant to the preparation and presentation of the fi nancial statements that give a true and fair view and are free from material misstatement, whether due to fraud or error.
Auditors’ Responsibility3. Our responsibility is to express an opinion on these fi nancial statements based on our audit. We conducted
our audit in accordance with the Standards on Auditing issued by the Institute of Chartered Accountants of India. Those Standards require that we comply with ethical requirements and plan and perform the audit to obtain reasonable assurance about whether the fi nancial statements are free from material misstatement.
4. An audit involves performing procedures to obtain audit evidence, about the amounts and disclosures in the fi nancial statements. The procedures selected depend on the auditors’ judgment, including the assessment of the risks of material misstatement of the fi nancial statements, whether due to fraud or error. In making those risk assessments, the auditors consider internal control relevant to the preparation and fair presentation of the fi nancial statements in order to design audit procedures that are appropriate in the circumstances. Our procedures included confi rmation of securities owned and unit capital balances as at March 31, 2013 by correspondence with the custodian and registrar and transfer agent, respectively. An audit also includes evaluating the appropriateness of accounting policies used and the reasonableness of the accounting estimates made by the Trustee and the Management, as well as evaluating the overall presentation of the fi nancial statements.
5. We believe that the audit evidence we have obtained is suffi cient and appropriate to provide a basis for our audit opinion.
Opinion6. In our opinion, and to the best of our information and according to the explanations given to us, the
accompanying fi nancial statements give the information required by the Regulations in the manner so required and give a true and fair view in conformity with the accounting principles generally accepted in India:
(a) in the case of the Balance Sheet, of the state of affairs of the Scheme as at March 31, 2013; and
(b) in the case of the Revenue Account, of the net defi cit for the year ended on that date.
Report on Other Legal and Regulatory Requirement7. As required by section 55(4) of the Regulations, we report that:
(a) We have obtained all the information and explanations which, to the best of our knowledge and belief, were necessary for the purposes of our audit; and
Independent Auditors’ Report

10
HSBC SMALL CAP FUND
Independent Auditors’ Report (Contd...)
(b) In our opinion, the Balance Sheet and Revenue Account dealt with by this report have been prepared in accordance with the accounting policies and standards specifi ed in the Ninth Schedule of the Regulations.
8. As required by clause 5 (ii)(2) of the Eleventh Schedule to the Regulations, we report that the Balance Sheet and Revenue Account dealt with by this Report are in agreement with the books of account of the Scheme.
9. In our opinion, the methods used to value non-traded securities as at March 31, 2013, as determined by HSBC Asset Management (India) Private Limited under procedures approved by the Board of Trustees of HSBC Mutual Fund in accordance with the guidelines for valuation of securities for mutual funds as mentioned in the Eighth Schedule of the Regulations issued by the Securities and Exchange Board of India, are fair and reasonable.
For PRICE WATERHOUSEFirm Registration Number: 301112EChartered Accountants
Sd/-
Vivek PrasadPartnerMembership Number: 104941
Place : MumbaiDate : July 16, 2013
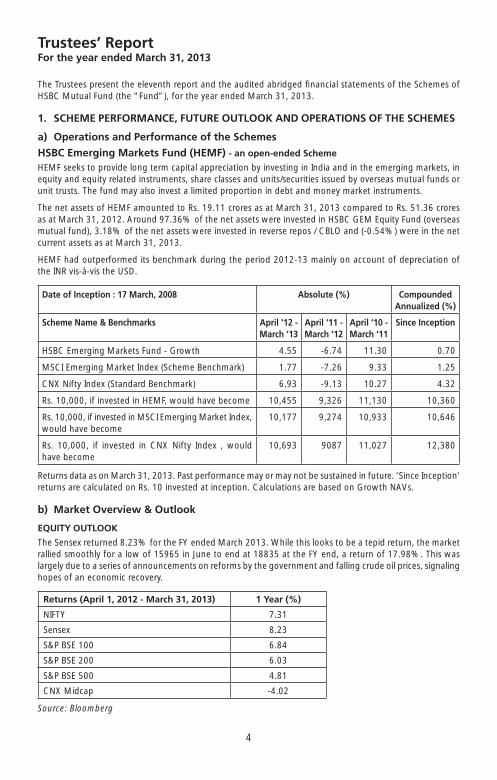
4
HSBC EMERGING MARKETS FUND
Trustees’ ReportFor the year ended March 31, 2013
The Trustees present the eleventh report and the audited abridged fi nancial statements of the Schemes of HSBC Mutual Fund (the “Fund”), for the year ended March 31, 2013.
1. SCHEME PERFORMANCE, FUTURE OUTLOOK AND OPERATIONS OF THE SCHEMES
a) Operations and Performance of the Schemes
HSBC Emerging Markets Fund (HEMF) - an open-ended Scheme
HEMF seeks to provide long term capital appreciation by investing in India and in the emerging markets, in equity and equity related instruments, share classes and units/securities issued by overseas mutual funds or unit trusts. The fund may also invest a limited proportion in debt and money market instruments.
The net assets of HEMF amounted to Rs. 19.11 crores as at March 31, 2013 compared to Rs. 51.36 crores as at March 31, 2012. Around 97.36% of the net assets were invested in HSBC GEM Equity Fund (overseas mutual fund), 3.18% of the net assets were invested in reverse repos / CBLO and (-0.54%) were in the net current assets as at March 31, 2013.
HEMF had outperformed its benchmark during the period 2012-13 mainly on account of depreciation of the INR vis-à-vis the USD.
Date of Inception : 17 March, 2008 Absolute (%) Compounded Annualized (%)
Scheme Name & Benchmarks April ‘12 - March ‘13
April ‘11 - March ‘12
April ‘10 - March ‘11
Since Inception
HSBC Emerging Markets Fund - Growth 4.55 -6.74 11.30 0.70
MSCI Emerging Market Index (Scheme Benchmark) 1.77 -7.26 9.33 1.25
CNX Nifty Index (Standard Benchmark) 6.93 -9.13 10.27 4.32
Rs. 10,000, if invested in HEMF, would have become 10,455 9,326 11,130 10,360
Rs. 10,000, if invested in MSCI Emerging Market Index, would have become
10,177 9,274 10,933 10,646
Rs. 10,000, if invested in CNX Nifty Index , would have become
10,693 9087 11,027 12,380
Returns data as on March 31, 2013. Past performance may or may not be sustained in future. ‘Since Inception’ returns are calculated on Rs. 10 invested at inception. Calculations are based on Growth NAVs.
b) Market Overview & Outlook
EQUITY OUTLOOK
The Sensex returned 8.23% for the FY ended March 2013. While this looks to be a tepid return, the market rallied smoothly for a low of 15965 in June to end at 18835 at the FY end, a return of 17.98%. This was largely due to a series of announcements on reforms by the government and falling crude oil prices, signaling hopes of an economic recovery.
Returns (April 1, 2012 - March 31, 2013) 1 Year (%)
NIFTY 7.31
Sensex 8.23
S&P BSE 100 6.84
S&P BSE 200 6.03
S&P BSE 500 4.81
CNX Midcap -4.02
Source: Bloomberg

5
HSBC EMERGING MARKETS FUND
Trustees’ ReportFor the year ended March 31, 2013 (Contd...)
Our view in respect of key issues facing equity market currently is highlighted as under, based on which we do expect a likely reversal of the prevailing negative sentiment going forward -
� Macro challenge - expect some relief in current account defi cit given likely lower gold imports and crude oil correction. Solution to fi scal defi cit may however need policy decision to reduce subsidy burden on diesel, kerosene, LPG.
� Commodities infl ation expected to decline on account of China slowdown and lower growth in western world. This may have positive impact margin expansion for corporate sector and on currency (INR) and will give room for reducing interest rates over time. Lower cost of capital should hopefully revive capex spending, though gradually (recovery from 2H12).
� Lower interest rates directionally would be the single most important variable for equity markets to rally. This will be driven by lower commodity infl ation and focus back on reviving growth through monetary policy (recent disappointing GDP/IIP numbers support this view).
� Valuations (for large Sensex companies) are attractive at close to 13x forward earnings and in the lower range of historic multiples. A large number of mid-caps available at a signifi cant discount to large cap peer.
� Structural model for India equity investment remains intact for long term returns. These include favourable demography, high savings rate, rising incomes, growing consumption demand growth, existing low penetration, etc.
DEBT OUTLOOK
Fixed Income market in FY 2013 moved towards lower yields on back of 100 bps rate cut and CRR cuts. RBI front loaded the rate cut in April and then followed it up in January 2013 and March 2013. Towards the second half rates stabilized largely as the core infl ation remained within comfort zone.
In the second half of the year expectation of rate cut and series of open market operations led to rally in rates. Government borrowing was lower than budgeted and the spending was also controlled in second half of the year. Towards the end of the year short end rates tightened substantially due to low deposit growth in banking system.
Corporate yield curve remained inverted with short end rates higher than long end rates for the large part of the year due to liquidity tightness.
Expectation is to see continuation of some easing of the rates stance from RBI in FY 14. However, there is a need to focus on key variables in the economy to judge future directions. These are:
� Liquidity: Liquidity will drive short end rates and eventually drive decisions on open market operations as well as CRR cuts.
� Infl ation: Infl ation numbers will determine future course of action for RBI and remains a critical variable for policy. We expect infl ation to ease in fi rst half of FY 14.
� Growth: GDP growth numbers as well as industrial activity will also determine the decision on policy. Weak GDP numbers may continue for couple of quarters.
� Fiscal defi cit: Fiscal defi cit and government spending will determine the government borrowing and crowding out in interest rate curve.
� Current account defi cit / BoP situation: CAD determines how the pressure on currency works and effective management of forex reserves.
� Currency levels: Level of INR will determine how the central banker reacts to the situation on the global crisis etc.

6
HSBC EMERGING MARKETS FUND
Trustees’ ReportFor the year ended March 31, 2013 (Contd...)
2. BRIEF BACKGROUND OF SPONSORS, BOARD OF TRUSTEES AND ASSET MANAGEMENT COMPANY
a) Sponsor HSBC Mutual Fund is sponsored by HSBC Securities and Capital Markets (India) Private Limited (HSCI).
The Sponsor is the Settler of the Mutual Fund Trust. The Sponsor has entrusted a sum of Rs.1,00,000 (Rupees One Lakh only) to the Trustee as the initial contribution towards the corpus of the Mutual Fund.
HSCI offers integrated investment banking services, securities and corporate fi nance & advisory. HSCI is a member of The Bombay Stock Exchange Limited and National Stock Exchange (capital and derivative market segments). HSCI holds 100% of the paid up equity share capital of HSBC Asset Management (India) Private Limited.
b) HSBC Mutual Fund HSBC Mutual Fund (“the Mutual Fund” or “the Fund”) has been constituted as a Trust in accordance with
the provisions of the Indian Trusts Act, 1882 (2 of 1882) vide a Trust Deed dated February 7, 2002 with HSBC Securities and Capital Markets (India) Private Limited, as the Sponsor and the Board of Individual Trustees. The Trustee has entered into an Investment Management Agreement dated February 7, 2002 with HSBC Asset Management (India) Private Limited (AMC) to function as the Investment Manager for all the Schemes of the Fund. The Fund was registered with SEBI vide registration number MF/046/02/5 dated May 27, 2002.
The Trust has been formed for the purpose of pooling of capital from the public for collective investment in securities/any other property for the purpose of providing facilities for participation by persons as benefi ciaries in such properties/investments and in the profi ts/income arising therefrom.
c) Board of Trustees (the Trustees) The Board of Trustees is the exclusive owner of the Trust Fund and holds the same in trust for the benefi t
of the unit holders. The Trustees have been discharging their duties and carrying out the responsibilities as provided in the SEBI (Mutual Funds) Regulations, 1996 and the Trust Deed. The Trustees seek to ensure that the Fund and the Schemes fl oated there under are managed by the AMC in accordance with the Trust Deed, the said Regulations, directions and guidelines issued by the SEBI, the Stock Exchanges, the Association of Mutual Funds in India and other regulatory agencies.
d) Asset Management Company (the AMC) HSBC Asset Management (India) Private Limited (the Investment Manager or the AMC) is a private limited
company incorporated under the Companies Act, 1956 on December 12, 2001 having its Registered Offi ce at 16, V. N. Road, Fort, Mumbai 400 001. HSBC Asset Management (India) Private Limited has been appointed as the Asset Management Company of the HSBC Mutual Fund by the Trustee vide Investment Management Agreement (IMA) dated February 7, 2002 and executed between the Trustees and the AMC. SEBI approved the AMC to act as the Investment Manager of the Fund vide its letter No. MFD/BC/163/2002 dated May 27, 2002. The paid-up equity share capital of the AMC is Rs. 54.2 crores. HSBC Securities and Capital Markets (India) Private Limited holds 100% of the paid up equity share capital of the AMC.
3. INVESTMENT OBJECTIVE OF THE SCHEMESThe investment objective of the respective Schemes has been provided above under the heading “Scheme Performance, Future Outlook and Operation of the Scheme” (Refer Section 1).
4. SIGNIFICANT ACCOUNTING POLICIESThe accounting policies are in accordance with Securities Exchange Board of India (Mutual Funds) Regulations 1996.

7
HSBC EMERGING MARKETS FUND
Trustees’ ReportFor the year ended March 31, 2013 (Contd...)
5. UNCLAIMED DIVIDENDS & REDEMPTIONSSummary of number of Investors & corresponding amount Scheme-wise as on March 31, 2013
SchemeUnclaimed Dividends Unclaimed Redemptions
Amount (Rs.)
No. of Investors
Amount (Rs.)
No. of Investors
HSBC Emerging Markets Fund – – 178,210.15 18
6. INVESTOR SERVICESThe number of offi cial points of acceptance of transactions is 197 locations. In addition to the offi ces of the Registrar & Transfer agents, the AMC has Investor Service Centres in 4 locations at its own offi ces - namely Mumbai, New Delhi, Kolkata and Chennai. With a view to enhance customer convenience, the AMC has extended the facility of priority based servicing to key distributors through the enhancement of the Interactive Voice Reponses. Call Centre number has now been converted to a single Toll Free number which can be dialed from anywhere in India. The call Centre service is being managed by the Registrar and Transfer Agents. The AMC continues to retain the outsourced back offi ce services with HOPE.
On the distribution front, the number of empanelled distributors was 2471 as on 31 March 2013. During the year, the AMC initiated tie-ups for online distribution of the Mutual Fund’s Schemes with several channel partners taking the total number of such tie-ups to 45.
7. DETAILS OF INVESTOR GRIEVANCE REDRESSALThe details of the redressal of investor complaints received against HSBC Mutual Fund during April 2012- March 2013 are as follows:
Total Number of Folios: 261694
Com-plaintCode
Type of complaint#
(a) No. ofcomplaintspendingat the
beginningof theyear
(b) No. of com-plaints
receivedduring
theyear#
Action on (a) and (b)
Resolved Non Actiona-
ble
Pending
Within 30
days
30 - 60 days
60 - 180 days
Beyond 180 days
0 - 3 months
3 - 6 months
6 - 9 months
9 - 12 months
I A Non receipt of Dividend on Units
0 3 3 0 0 0 0 0 0 0 0
I B Interest on delayed payment of Dividend
0 0 0 0 0 0 0 0 0 0 0
I C Non receipt of Redemption Proceeds
2 40 22 18 2 0 0 0 0 0 0
I D Interest on delayed payment of Redemption
0 2 1 1 0 0 0 0 0 0 0
II A Non receipt of Statement of Account/Unit Certifi cate
0 9 9 0 0 0 0 0 0 0 0
II B Discrepancy in Statement of Account
0 6 5 0 0 0 0 1 0 0 0
II C Data corrections in Investor details
0 277 277 0 0 0 0 0 0 0 0
II D Non receipt of Annual Report/Abridged Summary
0 0 0 0 0 0 0 0 0 0 0

8
HSBC EMERGING MARKETS FUND
Trustees’ ReportFor the year ended March 31, 2013 (Contd...)
Com-plaintCode
Type of complaint#
(a) No. ofcomplaintspendingat the
beginningof theyear
(b) No. of com-plaints
receivedduring
theyear#
Action on (a) and (b)
Resolved Non Actiona-
ble
Pending
Within 30
days
30 - 60 days
60 - 180 days
Beyond 180 days
0 - 3 months
3 - 6 months
6 - 9 months
9 - 12 months
III A Wrong switch between Schemes
0 0 0 0 0 0 0 0 0 0 0
III B Unauthorized switch between Schemes
0 0 0 0 0 0 0 0 0 0 0
III C Deviation from Scheme attributes
0 0 0 0 0 0 0 0 0 0 0
III D Wrong or excess charges/load
0 0 0 0 0 0 0 0 0 0 0
III E Non updation of changes viz. address, PAN, bank details, nomination, etc
0 18 18 0 0 0 0 0 0 0 0
IV Others 0 14 12 1 1 0 0 0 0 0 0
Total 2 369 347 20 3 0 0 1 0 0 0
Note:
# including against its authorized persons / distributors / employees etc.
8. STATUTORY DETAILSa) The Sponsors are not responsible or liable for any loss resulting from the operation of the Schemes of
the Fund beyond initial contribution of Rs. 1 lakh for setting up the Fund.
b) The price and redemption value of the units, and income from them, can go up as well as down with fl uctuations in the market value of its underlying investments.
c) Full Annual Report shall be disclosed on the website at www.assetmanagement.hsbc.com/in and shall be available for inspection at the Head Offi ce of the mutual fund. Present and prospective unit holder can obtain copy of the trust deed, the full Annual Report of the Scheme(s), the Annual Report of HSBC Asset Management (India) Private Limited and the text of the relevant Scheme(s) at a price.
9. ACKNOWLEDGEMENTSThe Trustees wish to thank the Unit holders of the Schemes for their support throughout the year and also thank the Government of India, the Securities and Exchange Board of India (SEBI), the Reserve Bank of India (RBI) and the Association of Mutual Funds in India (AMFI) for the guidance provided by them. The Trustees also appreciate the service provided by the Registrar and Transfer Agent, Fund Accountant, Custodian, Bankers, Distributors and Brokers. The guidance and services provided by the Auditors and advocates and the ebullience, sincerity and dedication of the employees of HSBC Asset Management (India) Private Limited is also appreciated.
The Trustees look forward to the continued support of everyone.
For and on behalf of the Board of Trustees of HSBC Mutual Fund
Sd/-
Dilip J. Thakkar
Trustee
MUMBAIJuly 16, 2013

9
HSBC EMERGING MARKETS FUND
To the Board of Trustees of
HSBC Mutual Fund
Report on the Financial Statements1. We have audited the accompanying fi nancial statements of HSBC Mutual Fund - HSBC Emerging Markets
Fund (the “Scheme”), which comprise the Balance Sheet as at March 31, 2013, and the related Revenue Account for the year then ended, and a summary of signifi cant accounting policies and other explanatory information, which we have signed under reference to this report.
Trustee’s and Management’s Responsibility for the Financial Statements2. The Board of Trustees of HSBC Mutual Fund (the “Trustee”) and the Management of HSBC Asset
Management (India) Private Limited (the “Management”) are responsible for the preparation of these fi nancial statements that give a true and fair view of the fi nancial position and fi nancial performance of the Scheme in accordance with the accounting policies and standards specifi ed in the Ninth Schedule of the Securities and Exchange Board of India (Mutual Funds) Regulations, 1996 and amendments thereto (the “Regulations”). This responsibility includes the design, implementation and maintenance of internal control relevant to the preparation and presentation of the fi nancial statements that give a true and fair view and are free from material misstatement, whether due to fraud or error.
Auditors’ Responsibility3. Our responsibility is to express an opinion on these fi nancial statements based on our audit. We conducted
our audit in accordance with the Standards on Auditing issued by the Institute of Chartered Accountants of India. Those Standards require that we comply with ethical requirements and plan and perform the audit to obtain reasonable assurance about whether the fi nancial statements are free from material misstatement.
4. An audit involves performing procedures to obtain audit evidence, about the amounts and disclosures in the fi nancial statements. The procedures selected depend on the auditors’ judgment, including the assessment of the risks of material misstatement of the fi nancial statements, whether due to fraud or error. In making those risk assessments, the auditors consider internal control relevant to the preparation and fair presentation of the fi nancial statements in order to design audit procedures that are appropriate in the circumstances. Our procedures included confi rmation of securities owned and unit capital balances as at March 31, 2013 by correspondence with the custodian/others and registrar and transfer agent, respectively. An audit also includes evaluating the appropriateness of accounting policies used and the reasonableness of the accounting estimates made by the Trustee and the Management, as well as evaluating the overall presentation of the fi nancial statements.
5. We believe that the audit evidence we have obtained is suffi cient and appropriate to provide a basis for our audit opinion.
Opinion6. In our opinion, and to the best of our information and according to the explanations given to us, the
accompanying fi nancial statements give the information required by the Regulations in the manner so required and give a true and fair view in conformity with the accounting principles generally accepted in India:
(a) in the case of the Balance Sheet, of the state of affairs of the Scheme as at March 31, 2013; and
(b) in the case of the Revenue Account, of the net surplus for the year ended on that date.
Report on Other Legal and Regulatory Requirement7. As required by section 55(4) of the Regulations, we report that:
(a) We have obtained all the information and explanations which, to the best of our knowledge and belief, were necessary for the purposes of our audit; and
Independent Auditors’ Report

10
HSBC EMERGING MARKETS FUND
(b) In our opinion, the Balance Sheet and Revenue Account dealt with by this report have been prepared in accordance with the accounting policies and standards specifi ed in the Ninth Schedule of the Regulations.
8. As required by clause 5 (ii)(2) of the Eleventh Schedule to the Regulations, we report that the Balance Sheet and Revenue Account dealt with by this Report are in agreement with the books of account of the Scheme.
For PRICE WATERHOUSEFirm Registration Number: 301112EChartered Accountants
Sd/-
Vivek PrasadPartnerMembership Number: 104941
Place : MumbaiDate : July 16, 2013
Independent Auditors’ Report (Contd...)
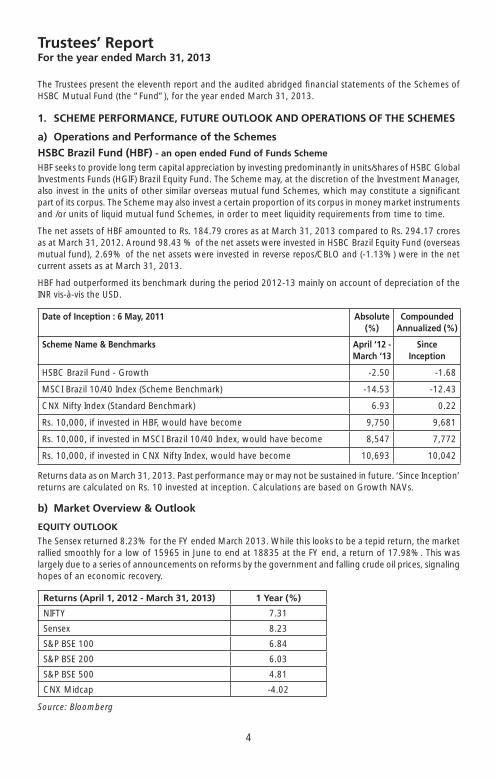
4
HSBC BRAZIL FUND#
Trustees’ ReportFor the year ended March 31, 2013
The Trustees present the eleventh report and the audited abridged fi nancial statements of the Schemes of HSBC Mutual Fund (the “Fund”), for the year ended March 31, 2013.
1. SCHEME PERFORMANCE, FUTURE OUTLOOK AND OPERATIONS OF THE SCHEMES
a) Operations and Performance of the Schemes
HSBC Brazil Fund (HBF) - an open ended Fund of Funds Scheme
HBF seeks to provide long term capital appreciation by investing predominantly in units/shares of HSBC Global Investments Funds (HGIF) Brazil Equity Fund. The Scheme may, at the discretion of the Investment Manager, also invest in the units of other similar overseas mutual fund Schemes, which may constitute a signifi cant part of its corpus. The Scheme may also invest a certain proportion of its corpus in money market instruments and /or units of liquid mutual fund Schemes, in order to meet liquidity requirements from time to time.
The net assets of HBF amounted to Rs. 184.79 crores as at March 31, 2013 compared to Rs. 294.17 crores as at March 31, 2012. Around 98.43 % of the net assets were invested in HSBC Brazil Equity Fund (overseas mutual fund), 2.69% of the net assets were invested in reverse repos/CBLO and (-1.13%) were in the net current assets as at March 31, 2013.
HBF had outperformed its benchmark during the period 2012-13 mainly on account of depreciation of the INR vis-à-vis the USD.
Date of Inception : 6 May, 2011 Absolute (%)
Compounded Annualized (%)
Scheme Name & Benchmarks April ‘12 - March ‘13
Since Inception
HSBC Brazil Fund - Growth -2.50 -1.68
MSCI Brazil 10/40 Index (Scheme Benchmark) -14.53 -12.43
CNX Nifty Index (Standard Benchmark) 6.93 0.22
Rs. 10,000, if invested in HBF, would have become 9,750 9,681
Rs. 10,000, if invested in MSCI Brazil 10/40 Index, would have become 8,547 7,772
Rs. 10,000, if invested in CNX Nifty Index, would have become 10,693 10,042
Returns data as on March 31, 2013. Past performance may or may not be sustained in future. ‘Since Inception’ returns are calculated on Rs. 10 invested at inception. Calculations are based on Growth NAVs.
b) Market Overview & Outlook
EQUITY OUTLOOK
The Sensex returned 8.23% for the FY ended March 2013. While this looks to be a tepid return, the market rallied smoothly for a low of 15965 in June to end at 18835 at the FY end, a return of 17.98%. This was largely due to a series of announcements on reforms by the government and falling crude oil prices, signaling hopes of an economic recovery.
Returns (April 1, 2012 - March 31, 2013) 1 Year (%)
NIFTY 7.31
Sensex 8.23
S&P BSE 100 6.84
S&P BSE 200 6.03
S&P BSE 500 4.81
CNX Midcap -4.02
Source: Bloomberg

5
HSBC BRAZIL FUND#
Trustees’ ReportFor the year ended March 31, 2013 (Contd...)
Our view in respect of key issues facing equity market currently is highlighted as under, based on which we do expect a likely reversal of the prevailing negative sentiment going forward -
� Macro challenge - expect some relief in current account defi cit given likely lower gold imports and crude oil correction. Solution to fi scal defi cit may however need policy decision to reduce subsidy burden on diesel, kerosene, LPG.
� Commodities infl ation expected to decline on account of China slowdown and lower growth in western world. This may have positive impact margin expansion for corporate sector and on currency (INR) and will give room for reducing interest rates over time. Lower cost of capital should hopefully revive capex spending, though gradually (recovery from 2H12).
� Lower interest rates directionally would be the single most important variable for equity markets to rally. This will be driven by lower commodity infl ation and focus back on reviving growth through monetary policy (recent disappointing GDP/IIP numbers support this view).
� Valuations (for large Sensex companies) are attractive at close to 13x forward earnings and in the lower range of historic multiples. A large number of mid-caps available at a signifi cant discount to large cap peer.
� Structural model for India equity investment remains intact for long term returns. These include favourable demography, high savings rate, rising incomes, growing consumption demand growth, existing low penetration, etc.
DEBT OUTLOOK
Fixed Income market in FY 2013 moved towards lower yields on back of 100 bps rate cut and CRR cuts. RBI front loaded the rate cut in April and then followed it up in January 2013 and March 2013. Towards the second half rates stabilized largely as the core infl ation remained within comfort zone.
In the second half of the year expectation of rate cut and series of open market operations led to rally in rates. Government borrowing was lower than budgeted and the spending was also controlled in second half of the year. Towards the end of the year short end rates tightened substantially due to low deposit growth in banking system.
Corporate yield curve remained inverted with short end rates higher than long end rates for the large part of the year due to liquidity tightness.
Expectation is to see continuation of some easing of the rates stance from RBI in FY 14. However, there is a need to focus on key variables in the economy to judge future directions. These are:
� Liquidity: Liquidity will drive short end rates and eventually drive decisions on open market operations as well as CRR cuts.
� Infl ation: Infl ation numbers will determine future course of action for RBI and remains a critical variable for policy. We expect infl ation to ease in fi rst half of FY 14.
� Growth: GDP growth numbers as well as industrial activity will also determine the decision on policy. Weak GDP numbers may continue for couple of quarters.
� Fiscal defi cit: Fiscal defi cit and government spending will determine the government borrowing and crowding out in interest rate curve.
� Current account defi cit / BoP situation: CAD determines how the pressure on currency works and effective management of forex reserves.
� Currency levels: Level of INR will determine how the central banker reacts to the situation on the global crisis etc.

6
HSBC BRAZIL FUND#
Trustees’ ReportFor the year ended March 31, 2013 (Contd...)
2. BRIEF BACKGROUND OF SPONSORS, BOARD OF TRUSTEES AND ASSET MANAGEMENT COMPANY
a) Sponsor HSBC Mutual Fund is sponsored by HSBC Securities and Capital Markets (India) Private Limited (HSCI).
The Sponsor is the Settler of the Mutual Fund Trust. The Sponsor has entrusted a sum of Rs.1,00,000 (Rupees One Lakh only) to the Trustee as the initial contribution towards the corpus of the Mutual Fund.
HSCI offers integrated investment banking services, securities and corporate fi nance & advisory. HSCI is a member of The Bombay Stock Exchange Limited and National Stock Exchange (capital and derivative market segments). HSCI holds 100% of the paid up equity share capital of HSBC Asset Management (India) Private Limited.
b) HSBC Mutual Fund HSBC Mutual Fund (“the Mutual Fund” or “the Fund”) has been constituted as a Trust in accordance with
the provisions of the Indian Trusts Act, 1882 (2 of 1882) vide a Trust Deed dated February 7, 2002 with HSBC Securities and Capital Markets (India) Private Limited, as the Sponsor and the Board of Individual Trustees. The Trustee has entered into an Investment Management Agreement dated February 7, 2002 with HSBC Asset Management (India) Private Limited (AMC) to function as the Investment Manager for all the Schemes of the Fund. The Fund was registered with SEBI vide registration number MF/046/02/5 dated May 27, 2002.
The Trust has been formed for the purpose of pooling of capital from the public for collective investment in securities/any other property for the purpose of providing facilities for participation by persons as benefi ciaries in such properties/investments and in the profi ts/income arising therefrom.
c) Board of Trustees (the Trustees) The Board of Trustees is the exclusive owner of the Trust Fund and holds the same in trust for the benefi t
of the unit holders. The Trustees have been discharging their duties and carrying out the responsibilities as provided in the SEBI (Mutual Funds) Regulations, 1996 and the Trust Deed. The Trustees seek to ensure that the Fund and the Schemes fl oated there under are managed by the AMC in accordance with the Trust Deed, the said Regulations, directions and guidelines issued by the SEBI, the Stock Exchanges, the Association of Mutual Funds in India and other regulatory agencies.
d) Asset Management Company (the AMC) HSBC Asset Management (India) Private Limited (the Investment Manager or the AMC) is a private limited
company incorporated under the Companies Act, 1956 on December 12, 2001 having its Registered Offi ce at 16, V. N. Road, Fort, Mumbai 400 001. HSBC Asset Management (India) Private Limited has been appointed as the Asset Management Company of the HSBC Mutual Fund by the Trustee vide Investment Management Agreement (IMA) dated February 7, 2002 and executed between the Trustees and the AMC. SEBI approved the AMC to act as the Investment Manager of the Fund vide its letter No. MFD/BC/163/2002 dated May 27, 2002. The paid-up equity share capital of the AMC is Rs. 54.2 crores. HSBC Securities and Capital Markets (India) Private Limited holds 100% of the paid up equity share capital of the AMC.
3. INVESTMENT OBJECTIVE OF THE SCHEMESThe investment objective of the respective Schemes has been provided above under the heading “Scheme Performance, Future Outlook and Operation of the Scheme” (Refer Section 1).
4. SIGNIFICANT ACCOUNTING POLICIESThe accounting policies are in accordance with Securities Exchange Board of India (Mutual Funds) Regulations 1996.

7
HSBC BRAZIL FUND#
Trustees’ ReportFor the year ended March 31, 2013 (Contd...)
5. UNCLAIMED DIVIDENDS & REDEMPTIONSNil
6. INVESTOR SERVICESThe number of offi cial points of acceptance of transactions is 197 locations. In addition to the offi ces of the Registrar & Transfer agents, the AMC has Investor Service Centres in 4 locations at its own offi ces - namely Mumbai, New Delhi, Kolkata and Chennai. With a view to enhance customer convenience, the AMC has extended the facility of priority based servicing to key distributors through the enhancement of the Interactive Voice Reponses. Call Centre number has now been converted to a single Toll Free number which can be dialed from anywhere in India. The call Centre service is being managed by the Registrar and Transfer Agents. The AMC continues to retain the outsourced back offi ce services with HOPE.
On the distribution front, the number of empanelled distributors was 2471 as on 31 March 2013. During the year, the AMC initiated tie-ups for online distribution of the Mutual Fund’s Schemes with several channel partners taking the total number of such tie-ups to 45.
7. DETAILS OF INVESTOR GRIEVANCE REDRESSALThe details of the redressal of investor complaints received against HSBC Mutual Fund during April 2012- March 2013 are as follows:
Total Number of Folios: 261694
Com-plaintCode
Type of complaint#
(a) No. ofcomplaintspendingat the
beginningof theyear
(b) No. of com-plaints
receivedduring
theyear#
Action on (a) and (b)
Resolved Non Actiona-
ble
Pending
Within 30
days
30 - 60 days
60 - 180 days
Beyond 180 days
0 - 3 months
3 - 6 months
6 - 9 months
9 - 12 months
I A Non receipt of Dividend on Units
0 3 3 0 0 0 0 0 0 0 0
I B Interest on delayed payment of Dividend
0 0 0 0 0 0 0 0 0 0 0
I C Non receipt of Redemption Proceeds
2 40 22 18 2 0 0 0 0 0 0
I D Interest on delayed payment of Redemption
0 2 1 1 0 0 0 0 0 0 0
II A Non receipt of Statement of Account/Unit Certifi cate
0 9 9 0 0 0 0 0 0 0 0
II B Discrepancy in Statement of Account
0 6 5 0 0 0 0 1 0 0 0
II C Data corrections in Investor details
0 277 277 0 0 0 0 0 0 0 0
II D Non receipt of Annual Report/Abridged Summary
0 0 0 0 0 0 0 0 0 0 0
III A Wrong switch between Schemes
0 0 0 0 0 0 0 0 0 0 0
III B Unauthorized switch between Schemes
0 0 0 0 0 0 0 0 0 0 0
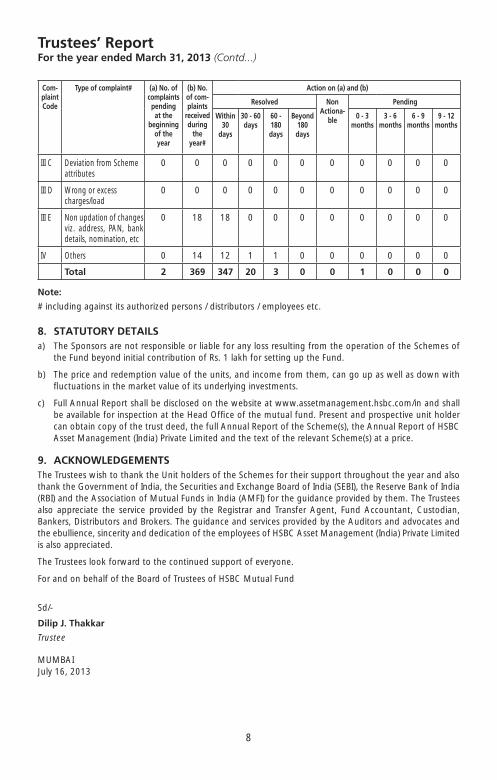
8
HSBC BRAZIL FUND#
Trustees’ ReportFor the year ended March 31, 2013 (Contd...)
Com-plaintCode
Type of complaint#
(a) No. ofcomplaintspendingat the
beginningof theyear
(b) No. of com-plaints
receivedduring
theyear#
Action on (a) and (b)
Resolved Non Actiona-
ble
Pending
Within 30
days
30 - 60 days
60 - 180 days
Beyond 180 days
0 - 3 months
3 - 6 months
6 - 9 months
9 - 12 months
III C Deviation from Scheme attributes
0 0 0 0 0 0 0 0 0 0 0
III D Wrong or excess charges/load
0 0 0 0 0 0 0 0 0 0 0
III E Non updation of changes viz. address, PAN, bank details, nomination, etc
0 18 18 0 0 0 0 0 0 0 0
IV Others 0 14 12 1 1 0 0 0 0 0 0
Total 2 369 347 20 3 0 0 1 0 0 0
Note:
# including against its authorized persons / distributors / employees etc.
8. STATUTORY DETAILSa) The Sponsors are not responsible or liable for any loss resulting from the operation of the Schemes of
the Fund beyond initial contribution of Rs. 1 lakh for setting up the Fund.
b) The price and redemption value of the units, and income from them, can go up as well as down with fl uctuations in the market value of its underlying investments.
c) Full Annual Report shall be disclosed on the website at www.assetmanagement.hsbc.com/in and shall be available for inspection at the Head Offi ce of the mutual fund. Present and prospective unit holder can obtain copy of the trust deed, the full Annual Report of the Scheme(s), the Annual Report of HSBC Asset Management (India) Private Limited and the text of the relevant Scheme(s) at a price.
9. ACKNOWLEDGEMENTSThe Trustees wish to thank the Unit holders of the Schemes for their support throughout the year and also thank the Government of India, the Securities and Exchange Board of India (SEBI), the Reserve Bank of India (RBI) and the Association of Mutual Funds in India (AMFI) for the guidance provided by them. The Trustees also appreciate the service provided by the Registrar and Transfer Agent, Fund Accountant, Custodian, Bankers, Distributors and Brokers. The guidance and services provided by the Auditors and advocates and the ebullience, sincerity and dedication of the employees of HSBC Asset Management (India) Private Limited is also appreciated.
The Trustees look forward to the continued support of everyone.
For and on behalf of the Board of Trustees of HSBC Mutual Fund
Sd/-
Dilip J. Thakkar
Trustee
MUMBAIJuly 16, 2013
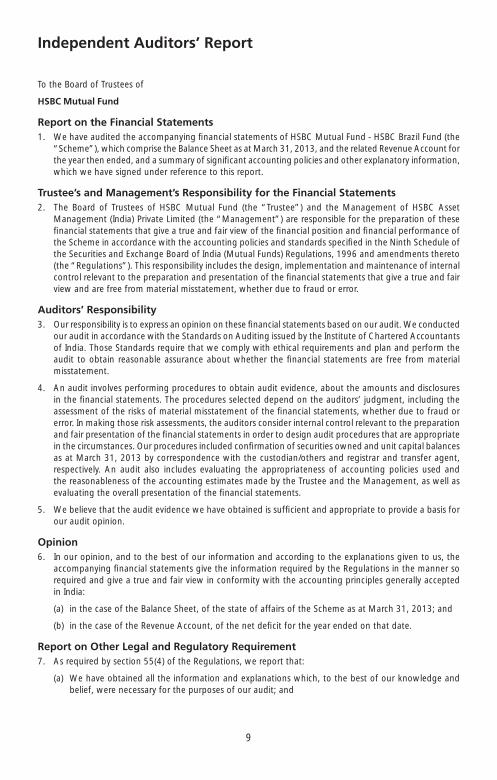
9
HSBC BRAZIL FUND#
To the Board of Trustees of
HSBC Mutual Fund
Report on the Financial Statements1. We have audited the accompanying fi nancial statements of HSBC Mutual Fund - HSBC Brazil Fund (the
“Scheme”), which comprise the Balance Sheet as at March 31, 2013, and the related Revenue Account for the year then ended, and a summary of signifi cant accounting policies and other explanatory information, which we have signed under reference to this report.
Trustee’s and Management’s Responsibility for the Financial Statements2. The Board of Trustees of HSBC Mutual Fund (the “Trustee”) and the Management of HSBC Asset
Management (India) Private Limited (the “Management”) are responsible for the preparation of these fi nancial statements that give a true and fair view of the fi nancial position and fi nancial performance of the Scheme in accordance with the accounting policies and standards specifi ed in the Ninth Schedule of the Securities and Exchange Board of India (Mutual Funds) Regulations, 1996 and amendments thereto (the “Regulations”). This responsibility includes the design, implementation and maintenance of internal control relevant to the preparation and presentation of the fi nancial statements that give a true and fair view and are free from material misstatement, whether due to fraud or error.
Auditors’ Responsibility3. Our responsibility is to express an opinion on these fi nancial statements based on our audit. We conducted
our audit in accordance with the Standards on Auditing issued by the Institute of Chartered Accountants of India. Those Standards require that we comply with ethical requirements and plan and perform the audit to obtain reasonable assurance about whether the fi nancial statements are free from material misstatement.
4. An audit involves performing procedures to obtain audit evidence, about the amounts and disclosures in the fi nancial statements. The procedures selected depend on the auditors’ judgment, including the assessment of the risks of material misstatement of the fi nancial statements, whether due to fraud or error. In making those risk assessments, the auditors consider internal control relevant to the preparation and fair presentation of the fi nancial statements in order to design audit procedures that are appropriate in the circumstances. Our procedures included confi rmation of securities owned and unit capital balances as at March 31, 2013 by correspondence with the custodian/others and registrar and transfer agent, respectively. An audit also includes evaluating the appropriateness of accounting policies used and the reasonableness of the accounting estimates made by the Trustee and the Management, as well as evaluating the overall presentation of the fi nancial statements.
5. We believe that the audit evidence we have obtained is suffi cient and appropriate to provide a basis for our audit opinion.
Opinion6. In our opinion, and to the best of our information and according to the explanations given to us, the
accompanying fi nancial statements give the information required by the Regulations in the manner so required and give a true and fair view in conformity with the accounting principles generally accepted in India:
(a) in the case of the Balance Sheet, of the state of affairs of the Scheme as at March 31, 2013; and
(b) in the case of the Revenue Account, of the net defi cit for the year ended on that date.
Report on Other Legal and Regulatory Requirement7. As required by section 55(4) of the Regulations, we report that:
(a) We have obtained all the information and explanations which, to the best of our knowledge and belief, were necessary for the purposes of our audit; and
Independent Auditors’ Report

10
HSBC BRAZIL FUND#
Independent Auditors’ Report (Contd...)
(b) In our opinion, the Balance Sheet and Revenue Account, where applicable, dealt with by this report have been prepared in accordance with the accounting policies and standards specifi ed in the Ninth Schedule of the Regulations.
8. As required by clause 5 (ii)(2) of the Eleventh Schedule to the Regulations, we report that the Balance Sheet and Revenue Account, where applicable, dealt with by this Report are in agreement with the books of account of the Scheme.
For PRICE WATERHOUSEFirm Registration Number: 301112EChartered Accountants
Sd/-
Vivek PrasadPartnerMembership Number: 104941
Place : MumbaiDate : July 16, 2013
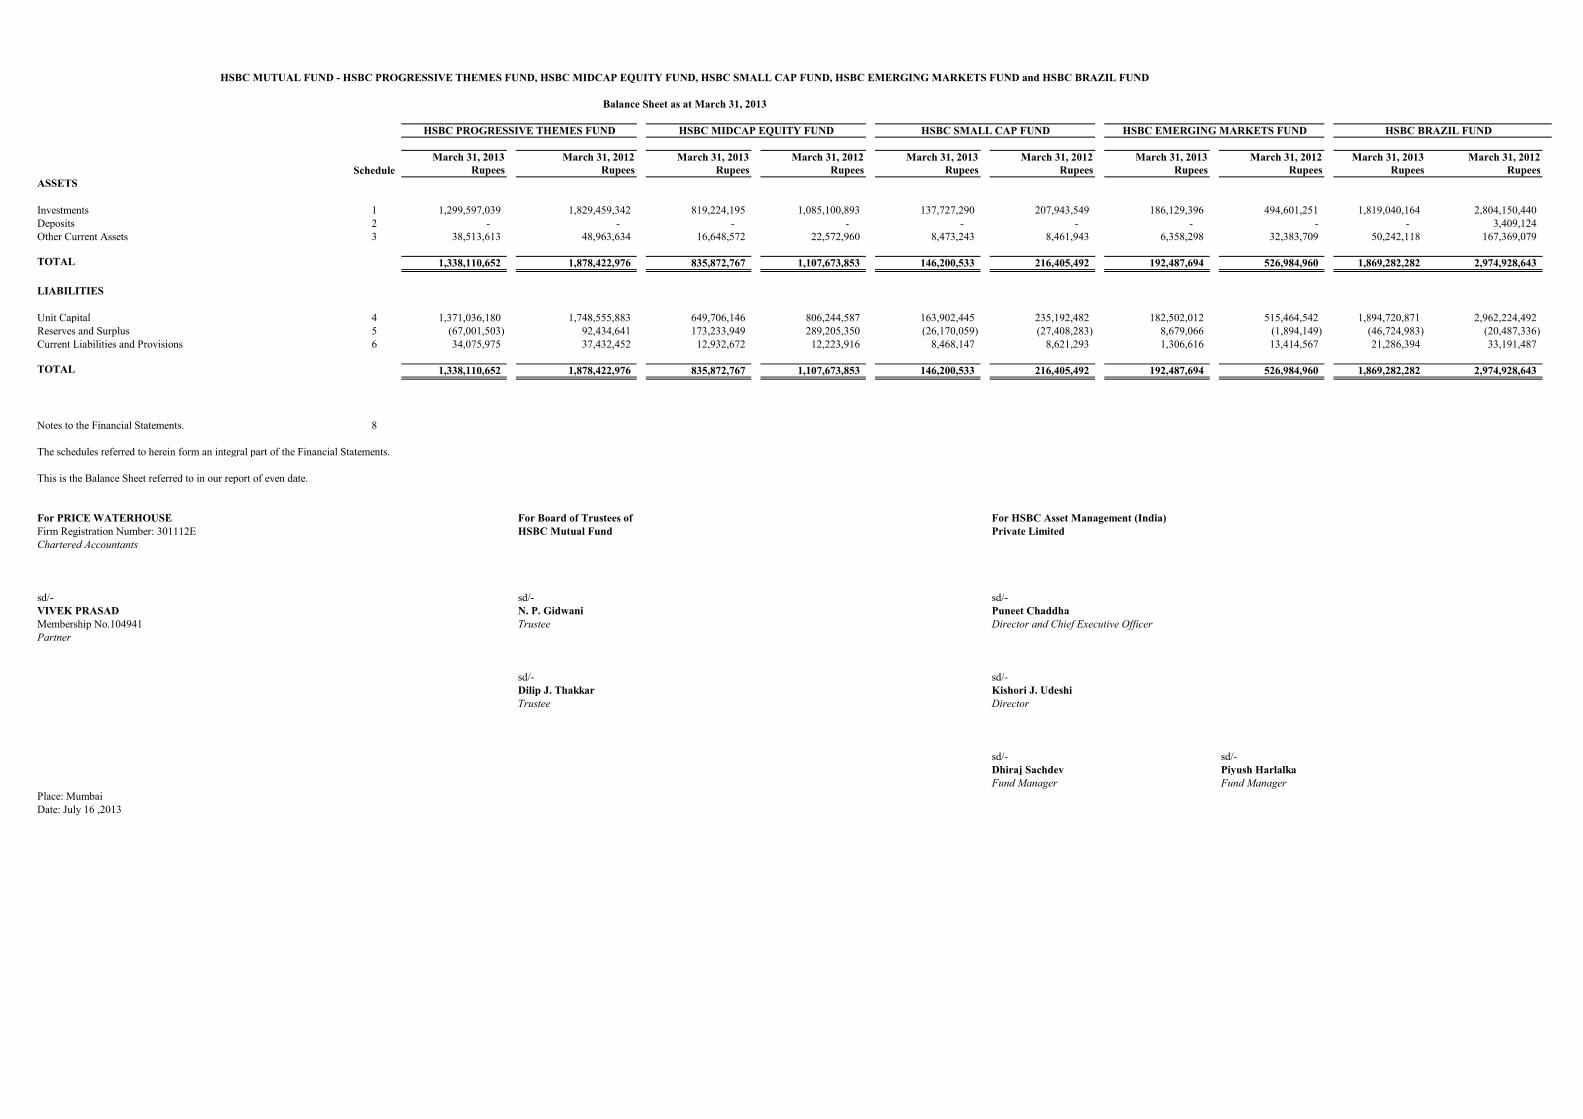
March 31, 2013 March 31, 2012 March 31, 2013 March 31, 2012 March 31, 2013 March 31, 2012 March 31, 2013 March 31, 2012 March 31, 2013 March 31, 2012Schedule Rupees Rupees Rupees Rupees Rupees Rupees Rupees Rupees Rupees Rupees
ASSETS
Investments 1 1,299,597,039 1,829,459,342 819,224,195 1,085,100,893 137,727,290 207,943,549 186,129,396 494,601,251 1,819,040,164 2,804,150,440 Deposits 2 - - - - - - - - - 3,409,124 Other Current Assets 3 38,513,613 48,963,634 16,648,572 22,572,960 8,473,243 8,461,943 6,358,298 32,383,709 50,242,118 167,369,079
TOTAL 1,338,110,652 1,878,422,976 835,872,767 1,107,673,853 146,200,533 216,405,492 192,487,694 526,984,960 1,869,282,282 2,974,928,643
LIABILITIES
Unit Capital 4 1,371,036,180 1,748,555,883 649,706,146 806,244,587 163,902,445 235,192,482 182,502,012 515,464,542 1,894,720,871 2,962,224,492 Reserves and Surplus 5 (67,001,503) 92,434,641 173,233,949 289,205,350 (26,170,059) (27,408,283) 8,679,066 (1,894,149) (46,724,983) (20,487,336) Current Liabilities and Provisions 6 34,075,975 37,432,452 12,932,672 12,223,916 8,468,147 8,621,293 1,306,616 13,414,567 21,286,394 33,191,487
TOTAL 1,338,110,652 1,878,422,976 835,872,767 1,107,673,853 146,200,533 216,405,492 192,487,694 526,984,960 1,869,282,282 2,974,928,643
Notes to the Financial Statements. 8
The schedules referred to herein form an integral part of the Financial Statements.
This is the Balance Sheet referred to in our report of even date.
For PRICE WATERHOUSE For Board of Trustees of For HSBC Asset Management (India)Firm Registration Number: 301112E HSBC Mutual Fund Private LimitedChartered Accountants
sd/- sd/- sd/-VIVEK PRASAD N. P. Gidwani Puneet ChaddhaMembership No.104941 Trustee Director and Chief Executive OfficerPartner
sd/- sd/-Dilip J. Thakkar Kishori J. UdeshiTrustee Director
sd/- sd/-Dhiraj Sachdev Piyush HarlalkaFund Manager Fund Manager
Place: MumbaiDate: July 16 ,2013
HSBC BRAZIL FUNDHSBC EMERGING MARKETS FUND
HSBC MUTUAL FUND - HSBC PROGRESSIVE THEMES FUND, HSBC MIDCAP EQUITY FUND, HSBC SMALL CAP FUND, HSBC EMERGING MARKETS FUND and HSBC BRAZIL FUND
Balance Sheet as at March 31, 2013
HSBC PROGRESSIVE THEMES FUND HSBC MIDCAP EQUITY FUND HSBC SMALL CAP FUND

H39741 H37180 H51114 H47931 H11918
April 01, 2012 to April 01, 2011 to April 01, 2012 to April 01, 2011 to April 01, 2012 to April 01, 2011 to April 01, 2012 to April 01, 2011 to April 01, 2012 to April 15, 2011 toMarch 31, 2013 March 31, 2012 March 31, 2013 March 31, 2012 March 31, 2013 March 31, 2012 March 31, 2013 March 31, 2012 March 31, 2013 March 31, 2012
Schedule Rupees Rupees Rupees Rupees Rupees Rupees Rupees Rupees Rupees Rupees
INCOME AND GAINS
Dividends (Note 2.4) 40,976,421 34,917,560 28,866,277 15,943,161 4,212,213 5,755,778 6,291,049 3,959,315 55,372,357 - Interest and Discount 7 1,475,946 10,719,273 467,005 7,022,770 563,557 662,990 986,824 1,011,798 5,581,221 10,528,016 Net Profit on Sale of Investments and Derivatives (Note 2.3, 2.5 and 13) 57,468,126 - 60,561,546 - 6,876,133 - 20,060,812 6,813,140 - - Realised Gain on Foreign Currency Transactions (Net) (Note 2.10) - - - - - - 856,168 1,225,648 - - Miscellaneous Income (Note 19) 354,038 1,249 410,045 919 83,754 - 183,257 - 462,999 3,025
TOTAL 100,274,531 45,638,082 90,304,873 22,966,850 11,735,657 6,418,768 28,378,110 13,009,901 61,416,577 10,531,041
EXPENSES AND LOSSES
Net Loss on Sale of Investments and Derivatives (Note 2.3, 2.5 and 13) - 200,383,439 - 308,573,321 - 32,217,498 - - 30,888,733 20,661,047 Realised Loss on Foreign Currency Transactions (Net) (Note 2.10) - - - - - - - - 7,031,842 3,876,081 Investment Management and Advisory Fees (Note 3) 19,997,606 20,894,475 14,447,023 14,276,558 2,744,829 3,225,615 2,203,790 3,604,366 18,482,870 19,263,103 Transfer Agent Fees and Expenses 2,499,721 3,203,217 1,585,004 2,044,076 290,289 441,802 299,148 708,715 2,537,885 3,823,627 Trusteeship Fees and Expenses (Note 4) 4,569 28,976 2,883 18,341 541 3,937 955 8,459 7,960 45,442 Custodian Fees and Expenses (Note 5) 673,015 1,038,439 427,266 685,327 80,118 105,963 433,440 291,970 360,742 273,622 Audit Fees 184,756 199,757 116,670 117,987 20,000 22,635 27,029 55,457 261,737 314,632 Investor Education Expenses 158,728 - 100,313 - 18,142 - 23,897 - 214,068 - Selling and Distribution Expenses 14,701,850 14,924,144 8,256,974 9,506,491 1,449,316 2,137,619 1,874,348 4,112,405 17,756,586 13,980,586 Other Operating Expenses 3,506,155 3,598,641 2,415,296 2,373,797 471,070 513,658 449,074 754,957 3,607,506 4,677,822
TOTAL 41,726,400 244,271,088 27,351,429 337,595,898 5,074,305 38,668,727 5,311,681 9,536,329 81,149,929 66,915,962
Less: Expenses to be Reimbursed by the Investment Manager (Note 7) - - - - - - 54,549 853,041 - -
TOTAL 41,726,400 244,271,088 27,351,429 337,595,898 5,074,305 38,668,727 5,257,132 8,683,288 81,149,929 66,915,962
Net Realised Gains/(Losses) for the Year / Period 58,548,131 (198,633,006) 62,953,444 (314,629,048) 6,661,352 (32,249,959) 23,120,978 4,326,613 (19,733,352) (56,384,921)
Net Change in Unrealised Depreciation in Value of Investments and Derivatives and Foreign Currency Denominated Assets and Liabilities (Note 2.2, 2.5 and 8) (204,149,398) 118,455,456 (121,606,469) 219,533,540 (8,942,843) (14,852,749) 22,171 (22,171) (27,951,384) -
Net Gains/(Losses) for the Year / Period (145,601,267) (80,177,550) (58,653,025) (95,095,508) (2,281,491) (47,102,708) 23,143,149 4,304,442 (47,684,736) (56,384,921)
Net Change in Unrealised Appreciation in Value of Investments and Derivatives and Foreign Currency Denominated Assets and Liabilities (Note 2.2, 2.5 and 8) - - - - - - (8,623,880) (23,264,277) (12,367,807) 12,367,807
Net Surplus/(Deficit) including Net change in Unrealised Appreciation /(Depreciation) in Value of Investments and Derivatives and Foreign Currency Denominated Assets and Liabilities (145,601,267) (80,177,550) (58,653,025) (95,095,508) (2,281,491) (47,102,708) 14,519,269 (18,959,835) (60,052,543) (44,017,114)
Net Change in Unrealised Appreciation in Value of Investments and Derivatives and Foreign Currency Denominated Assets and Liabilities transferred to Unrealised Appreciation Reserve - - - - - - 8,623,880 23,264,277 12,367,807 (12,367,807)
Net Surplus/(Deficit) for the Year / Period (145,601,267) (80,177,550) (58,653,025) (95,095,508) (2,281,491) (47,102,708) 23,143,149 4,304,442 (47,684,736) (56,384,921)
April 01, 2012 to April 01, 2011 to April 01, 2012 to April 01, 2011 to April 01, 2012 to April 01, 2011 to April 01, 2012 to April 01, 2011 to April 01, 2012 to April 15, 2011 toMarch 31, 2013 March 31, 2012 March 31, 2013 March 31, 2012 March 31, 2013 March 31, 2012 March 31, 2013 March 31, 2012 March 31, 2013 March 31, 2012
Rupees Rupees Rupees Rupees Rupees Rupees Rupees Rupees Rupees Rupees
Net Surplus/(Deficit) for the Year / Period (145,601,267) (80,177,550) (58,653,025) (95,095,508) (2,281,491) (47,102,708) 23,143,149 4,304,442 (47,684,736) (56,384,921) Transfer from Income Equalisation Reserve (Note 2.8) (497,706,946) (437,737,233) (128,204,050) (109,199,812) (11,716,666) 44,578,748 18,970,256 (8,552,349) 38,915,692 21,277,129 Transfer from Reserve Fund 2,369,307,282 2,887,219,477 651,080,485 855,375,805 22,325,082 24,849,041 (9,000,479) (4,752,572) (35,107,792) - Dividend / Distribution - 2,588 - - - - - - - -
Balance Transferred to Reserve Fund 1,725,999,069 2,369,307,282 464,223,410 651,080,485 8,326,925 22,325,081 33,112,926 (9,000,479) (43,876,836) (35,107,792)
Notes to the Financial Statements. 8The schedules referred to herein form an integral part of the Financial Statements.This is the Revenue Account referred to in our report of even date.
For PRICE WATERHOUSE For Board of Trustees of For HSBC Asset Management (India)Firm Registration Number: 301112E HSBC Mutual Fund Private LimitedChartered Accountants
sd/- sd/- sd/-VIVEK PRASAD N. P. Gidwani Puneet ChaddhaMembership No.104941 Trustee Director and Chief Executive OfficerPartner
sd/- sd/-Dilip J. Thakkar Kishori J. UdeshiTrustee Director
sd/- sd/-Dhiraj Sachdev Piyush HarlalkaFund Manager Fund Manager
Place: MumbaiDate: July 16 ,2013
HSBC MUTUAL FUND - HSBC PROGRESSIVE THEMES FUND, HSBC MIDCAP EQUITY FUND, HSBC SMALL CAP FUND, HSBC EMERGING MARKETS FUND and HSBC BRAZIL FUND
Revenue Account for the year ended March 31, 2013
HSBC EMERGING MARKETS FUNDHSBC PROGRESSIVE THEMES FUND HSBC MIDCAP EQUITY FUND HSBC SMALL CAP FUND HSBC BRAZIL FUND

Year ended Year endedMarch 31, 2013 March 31, 2012
Rupees Rupees
A. Cashflow from Operating ActivitiesNet Realised Gains/(Losses) for the Year 58,548,131 (198,633,006) Initial Issue Expenses Charged to Revenue Account - -
Adjustments for:-(Increase)/Decrease in Investments at cost 326,135,158 195,016,698 (Increase)/Decrease in Other Current Assets (1,285,931) (654,283) Increase/(Decrease) in Current Liabilities and Provisions (2,668,440) (239,870)
Net cash generated from/(used in) operations (A) 380,728,918 (4,510,461)
B. Cashflow from Financing ActivitiesIncrease/(Decrease) in Unit Capital (377,519,703) (321,401,117) Increase/(Decrease) in Unit Premium Reserve and Income Equalisation Reserve (13,834,875) (1,981,744)
Adjustments for:-Increase/(Decrease) in Redemption Payable for Units Redeemed by Investors (2,712,491) (3,528,151) (Increase)/Decrease in Subscription Receivable for Units Issued to Investors 3,493,156 (3,480,124)
Dividend Paid During the Year - 2,588
Net cash used in financing activities (B) (390,573,913) (330,388,548)
Net Increase/(Decrease) in Cash and Cash Equivalents (A+B) (9,844,995) (334,899,009)
Cash and Cash Equivalents at the beginning of the year 32,318,184 367,217,193 Cash and Cash Equivalents at the end of the year 22,473,189 32,318,184
(1) (0) Notes : -
March 31, 2013 March 31, 2012 Rupees Rupees
1. Cash and Cash Equivalents include the following :
Balances with Scheduled Banks :- In Current Account 4,484,076 14,175,090 - In Dividend Account - - - In Deposit Account - -
Temporary Book Overdraft (181,539) (150,831)
Other Collateralised Lending- Reverse Repos - - - Collateralised Borrowing and Lending Obligation 18,170,653 18,293,925 Derivative Margin Deposit - -
22,473,190 32,318,184
2.
This is the Cash Flow Statement referred to in our report of even date.
For PRICE WATERHOUSE For Board of Trustees of For HSBC Asset Management (India)Firm Registration Number: 301112E HSBC Mutual Fund Private LimitedChartered Accountants
sd/- sd/- sd/-VIVEK PRASAD N. P. Gidwani Puneet ChaddhaMembership No.104941 Trustee Director and Chief Executive OfficerPartner
sd/- sd/-Dilip J. Thakkar Kishori J. UdeshiTrustee Director
sd/- sd/-Dhiraj Sachdev Piyush HarlalkaFund Manager Fund Manager
Place: MumbaiDate: July 16 ,2013
HSBC MUTUAL FUND - HSBC PROGRESSIVE THEMES FUND, HSBC MIDCAP EQUITY FUND, HSBC SMALL CAP FUND, HSBC EMERGING MARKETS FUND and HSBC BRAZIL FUND
Cash Flow Statement for the year ended March 31, 2013
The above Cash Flow Statement has been prepared under the "Indirect Method" set out in Accounting Standard - 3 on Cash Flow Statements, issued by The Institute of Chartered Accountants of India.
HSBC PROGRESSIVE THEMES FUND
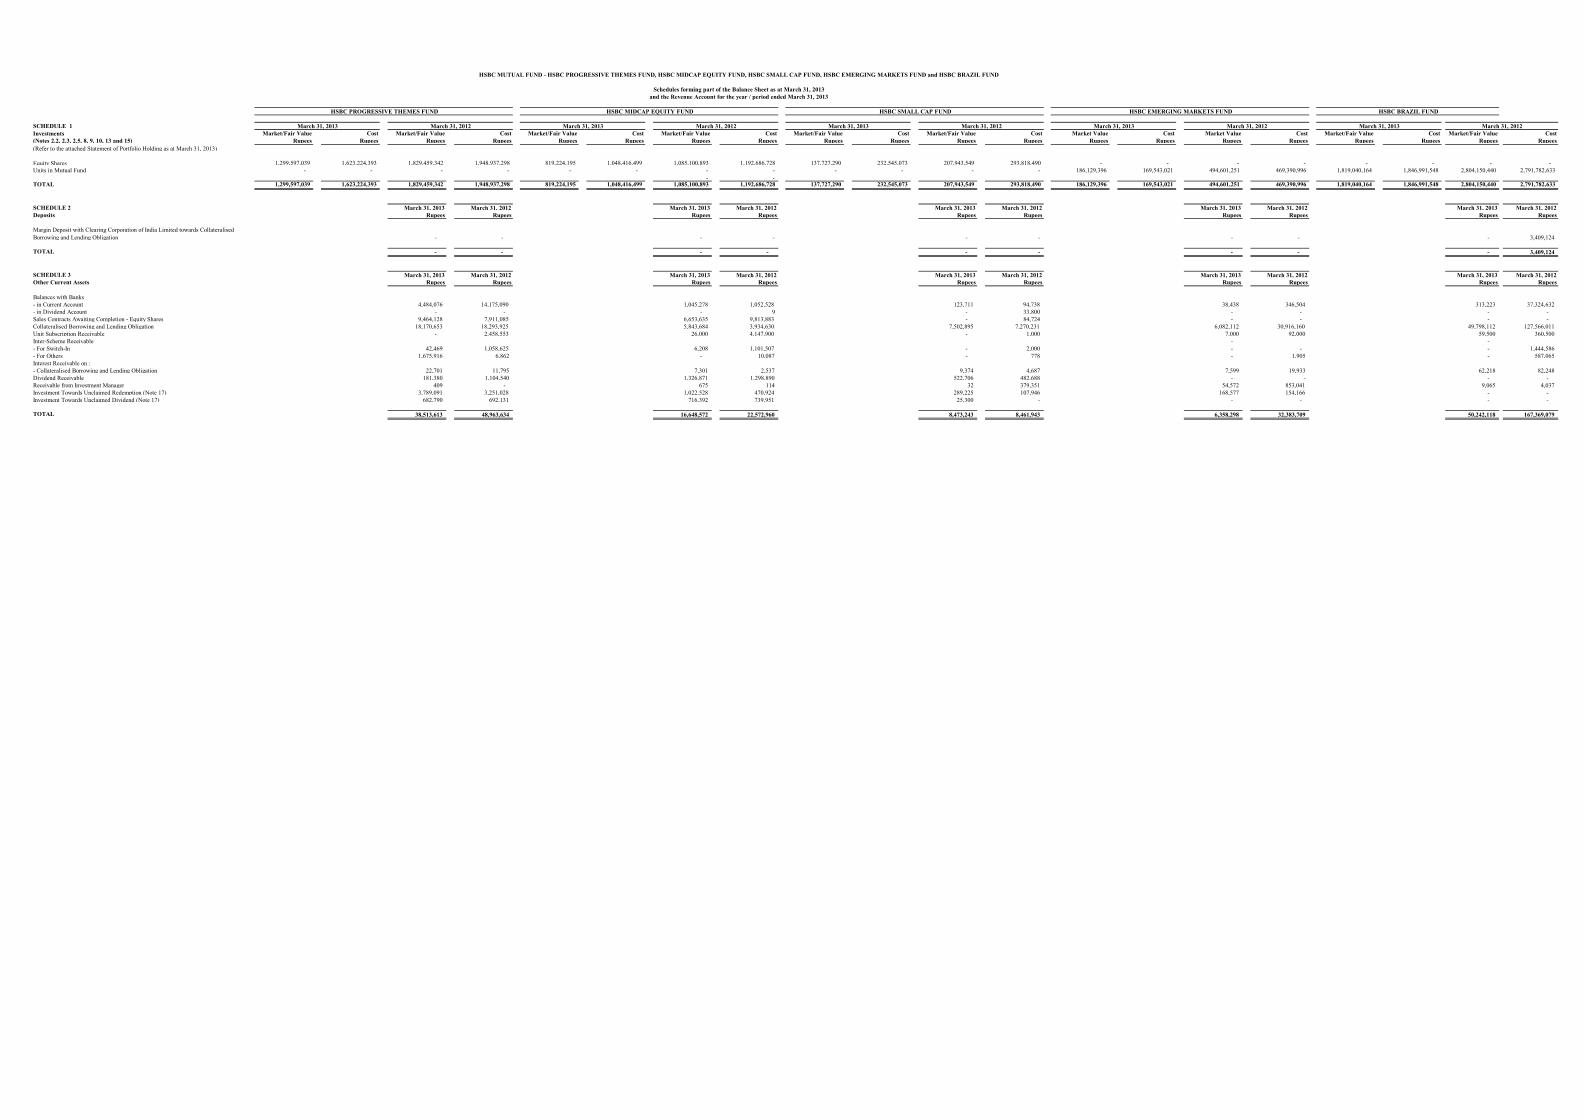
SCHEDULE 1Investments Market/Fair Value Cost Market/Fair Value Cost Market/Fair Value Cost Market/Fair Value Cost Market/Fair Value Cost Market/Fair Value Cost Market Value Cost Market Value Cost Market/Fair Value Cost Market/Fair Value Cost (Notes 2.2, 2.3, 2.5, 8, 9, 10, 13 and 15) Rupees Rupees Rupees Rupees Rupees Rupees Rupees Rupees Rupees Rupees Rupees Rupees Rupees Rupees Rupees Rupees Rupees Rupees Rupees Rupees (Refer to the attached Statement of Portfolio Holding as at March 31, 2013)
Equity Shares 1,299,597,039 1,623,224,393 1,829,459,342 1,948,937,298 819,224,195 1,048,416,499 1,085,100,893 1,192,686,728 137,727,290 232,545,073 207,943,549 293,818,490 - - - - - - - - Units in Mutual Fund - - - - - - - - - - - - 186,129,396 169,543,021 494,601,251 469,390,996 1,819,040,164 1,846,991,548 2,804,150,440 2,791,782,633
- - TOTAL 1,299,597,039 1,623,224,393 1,829,459,342 1,948,937,298 819,224,195 1,048,416,499 1,085,100,893 1,192,686,728 137,727,290 232,545,073 207,943,549 293,818,490 186,129,396 169,543,021 494,601,251 469,390,996 1,819,040,164 1,846,991,548 2,804,150,440 2,791,782,633
SCHEDULE 2 March 31, 2013 March 31, 2012 March 31, 2013 March 31, 2012 March 31, 2013 March 31, 2012 March 31, 2013 March 31, 2012 March 31, 2013 March 31, 2012Deposits Rupees Rupees Rupees Rupees Rupees Rupees Rupees Rupees Rupees Rupees
Margin Deposit with Clearing Corporation of India Limited towards Collateralised Borrowing and Lending Obligation - - - - - - - - - 3,409,124
TOTAL - - - - - - - - - 3,409,124
SCHEDULE 3 March 31, 2013 March 31, 2012 March 31, 2013 March 31, 2012 March 31, 2013 March 31, 2012 March 31, 2013 March 31, 2012 March 31, 2013 March 31, 2012Other Current Assets Rupees Rupees Rupees Rupees Rupees Rupees Rupees Rupees Rupees Rupees
Balances with Banks - in Current Account 4,484,076 14,175,090 1,045,278 1,052,528 123,711 94,738 38,438 346,504 313,223 37,324,632 - in Dividend Account - - - 9 - 33,800 - - - - Sales Contracts Awaiting Completion - Equity Shares 9,464,128 7,911,085 6,653,635 9,813,883 - 84,724 - - - - Collateralised Borrowing and Lending Obligation 18,170,653 18,293,925 5,843,684 3,934,630 7,502,895 7,270,231 6,082,112 30,916,160 49,798,112 127,566,011 Unit Subscription Receivable - 2,458,553 26,000 4,147,900 - 1,000 7,000 92,000 59,500 360,500 Inter-Scheme Receivable - - - For Switch-In 42,469 1,058,625 6,208 1,101,507 - 2,000 - - - 1,444,586 - For Others 1,675,916 6,862 - 10,087 - 778 - 1,905 - 587,065 Interest Receivable on :- Collateralised Borrowing and Lending Obligation 22,701 11,795 7,301 2,537 9,374 4,687 7,599 19,933 62,218 82,248 Dividend Receivable 181,380 1,104,540 1,326,871 1,298,890 522,706 482,688 - - - - Receivable from Investment Manager 409 - 675 114 32 379,351 54,572 853,041 9,065 4,037 Investment Towards Unclaimed Redemption (Note 17) 3,789,091 3,251,028 1,022,528 470,924 289,225 107,946 168,577 154,166 - - Investment Towards Unclaimed Dividend (Note 17) 682,790 692,131 716,392 739,951 25,300 - - - - -
TOTAL 38,513,613 48,963,634 16,648,572 22,572,960 8,473,243 8,461,943 6,358,298 32,383,709 50,242,118 167,369,079
HSBC SMALL CAP FUND HSBC EMERGING MARKETS FUND
HSBC MUTUAL FUND - HSBC PROGRESSIVE THEMES FUND, HSBC MIDCAP EQUITY FUND, HSBC SMALL CAP FUND, HSBC EMERGING MARKETS FUND and HSBC BRAZIL FUND
Schedules forming part of the Balance Sheet as at March 31, 2013and the Revenue Account for the year / period ended March 31, 2013
HSBC PROGRESSIVE THEMES FUND HSBC MIDCAP EQUITY FUND HSBC BRAZIL FUND
March 31, 2013 March 31, 2012 March 31, 2013 March 31, 2012 March 31, 2013 March 31, 2012March 31, 2012 March 31, 2013 March 31, 2012 March 31, 2013
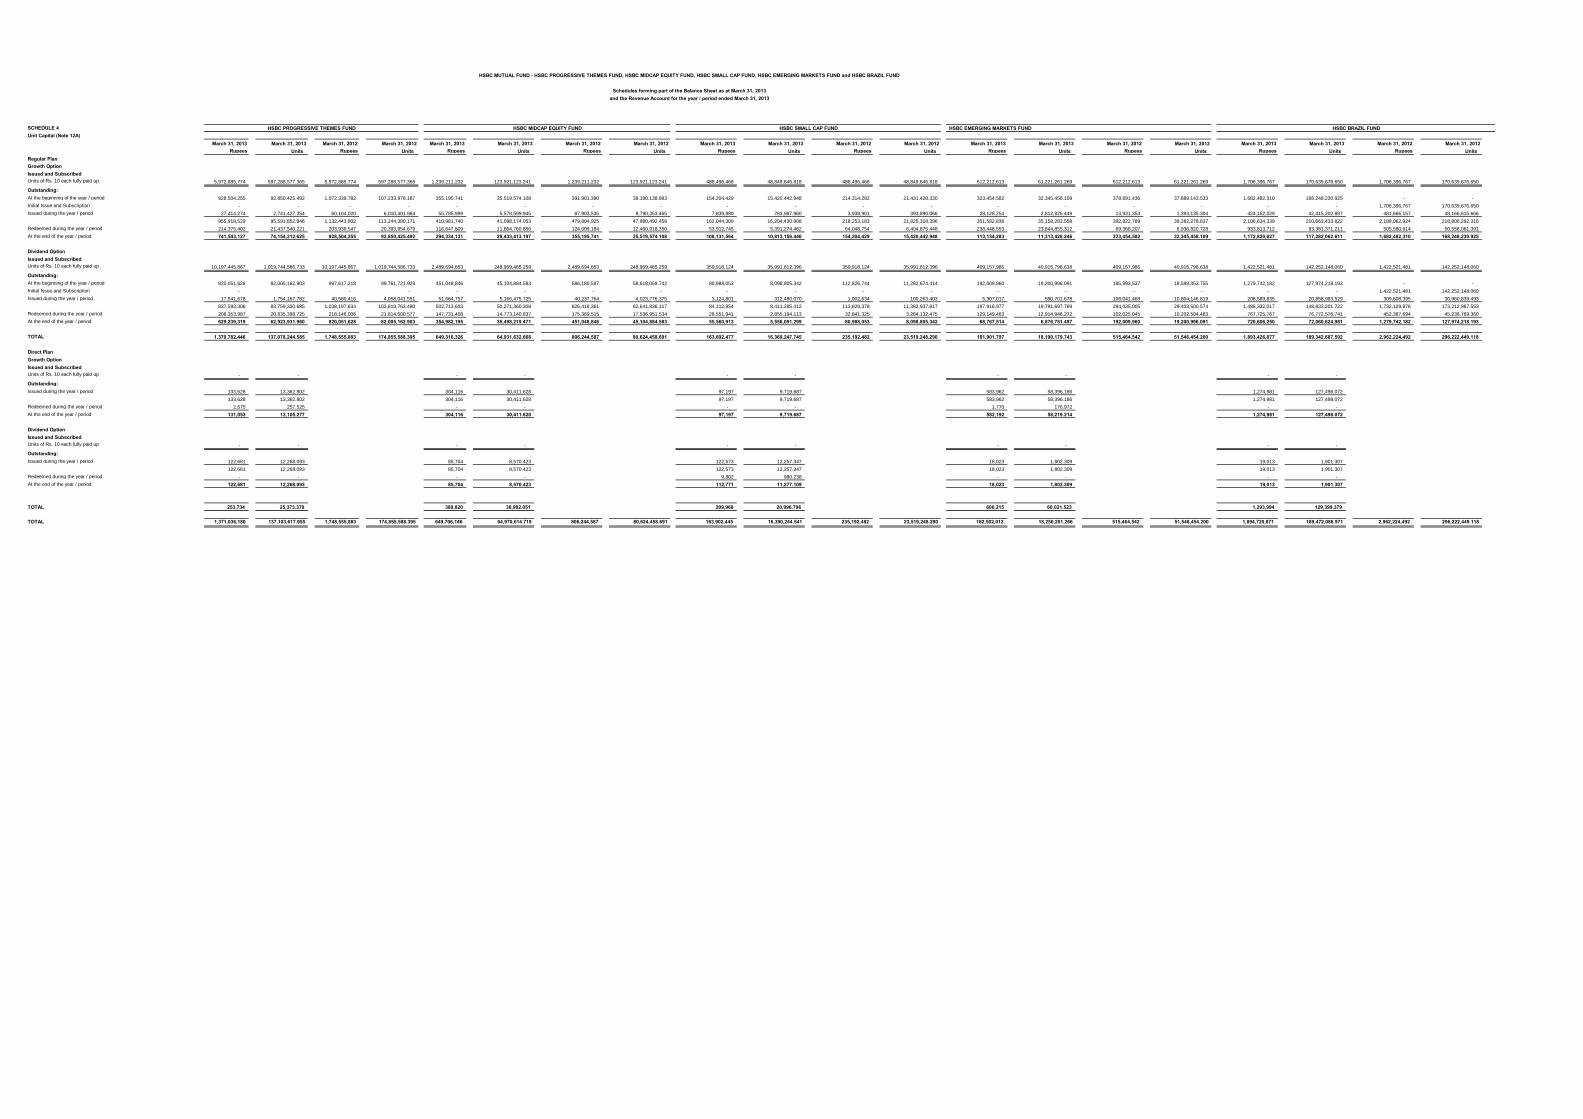
SCHEDULE 4 HSBC EMERGING MARKETS FUNDUnit Capital (Note 12A)
March 31, 2013 March 31, 2013 March 31, 2012 March 31, 2012 March 31, 2013 March 31, 2013 March 31, 2012 March 31, 2012 March 31, 2013 March 31, 2013 March 31, 2012 March 31, 2012 March 31, 2013 March 31, 2013 March 31, 2012 March 31, 2012 March 31, 2013 March 31, 2013 March 31, 2012 March 31, 2012 Rupees Units Rupees Units Rupees Units Rupees Units Rupees Units Rupees Units Rupees Units Rupees Units Rupees Units Rupees Units
Growth OptionIssued and SubscribedUnits of Rs. 10 each fully paid up 5,972,885,774 597,288,577.365 5,972,885,774 597,288,577.365 1,239,211,232 123,921,123.241 1,239,211,232 123,921,123.241 488,496,468 48,849,646.818 488,496,468 48,849,646.818 612,212,613 61,221,261.269 612,212,613 61,221,261.269 1,706,396,767 170,639,676.650 1,706,396,767 170,639,676.650
Outstanding:At the beginning of the year / period 928,504,255 92,850,425.492 1,072,339,782 107,233,978.187 355,195,741 35,519,574.108 391,901,390 39,190,138.993 154,204,429 15,420,442.948 214,314,282 21,431,428.330 323,454,582 32,345,458.109 378,891,436 37,889,143.533 1,682,482,310 168,248,230.925 - -
Initial Issue and Subscription - - - - - - - - - - - - - - - - - - 1,706,396,767 170,639,676.650
Issued during the year / period 27,414,274 2,741,427.354 60,104,020 6,010,401.984 55,785,999 5,578,599.945 87,903,535 8,790,353.465 7,839,880 783,987.960 3,938,901 393,890.066 28,128,254 2,812,825.449 13,931,353 1,393,135.304 424,152,029 42,415,202.897 481,666,157 48,166,615.666
955,918,529 95,591,852.846 1,132,443,802 113,244,380.171 410,981,740 41,098,174.053 479,804,925 47,980,492.458 162,044,309 16,204,430.908 218,253,183 21,825,318.396 351,582,836 35,158,283.558 392,822,789 39,282,278.837 2,106,634,339 210,663,433.822 2,188,062,924 218,806,292.316
Redeemed during the year / period 214,375,402 21,437,540.221 203,939,547 20,393,954.679 116,647,609 11,664,760.856 124,609,184 12,460,918.350 53,912,745 5,391,274.462 64,048,754 6,404,875.448 238,448,553 23,844,855.312 69,368,207 6,936,820.728 933,813,712 93,381,371.211 505,580,614 50,558,061.391
At the end of the year / period 741,543,127 74,154,312.625 928,504,255 92,850,425.492 294,334,131 29,433,413.197 355,195,741 35,519,574.108 108,131,564 10,813,156.446 154,204,429 15,420,442.948 113,134,283 11,313,428.246 323,454,582 32,345,458.109 1,172,820,627 117,282,062.611 1,682,482,310 168,248,230.925
Dividend OptionIssued and SubscribedUnits of Rs. 10 each fully paid up 10,197,445,867 1,019,744,586.733 10,197,445,867 1,019,744,586.733 2,489,694,653 248,969,465.259 2,489,694,653 248,969,465.259 359,918,124 35,991,812.396 359,918,124 35,991,812.396 409,157,986 40,915,798.638 409,157,986 40,915,798.638 1,422,521,481 142,252,148.060 1,422,521,481 142,252,148.060
Outstanding:At the beginning of the year / period 820,051,628 82,005,162.903 997,617,218 99,761,721.929 451,048,846 45,104,884.583 586,180,597 58,618,059.742 80,988,053 8,098,805.342 112,826,744 11,282,674.414 192,009,960 19,200,996.091 185,993,537 18,599,353.755 1,279,742,182 127,974,218.193 - -
Initial Issue and Subscription - - - - - - - - - - - - - - - - - - 1,422,521,481 142,252,148.060
Issued during the year / period 17,541,678 1,754,167.782 40,580,416 4,058,041.551 51,664,757 5,166,475.725 40,237,764 4,023,776.375 3,124,801 312,480.070 1,002,634 100,263.403 5,907,017 590,701.678 108,041,468 10,804,146.819 208,589,835 20,858,983.529 309,608,395 30,960,839.493
837,593,306 83,759,330.685 1,038,197,634 103,819,763.480 502,713,603 50,271,360.308 626,418,361 62,641,836.117 84,112,854 8,411,285.412 113,829,378 11,382,937.817 197,916,977 19,791,697.769 294,035,005 29,403,500.574 1,488,332,017 148,833,201.722 1,732,129,876 173,212,987.553
Redeemed during the year / period 208,353,987 20,835,398.725 218,146,006 21,814,600.577 147,731,408 14,773,140.837 175,369,515 17,536,951.534 28,551,941 2,855,194.113 32,841,325 3,284,132.475 129,149,463 12,914,946.272 102,025,045 10,202,504.483 767,725,767 76,772,576.741 452,387,694 45,238,769.360
At the end of the year / period 629,239,319 62,923,931.960 820,051,628 82,005,162.903 354,982,195 35,498,219.471 451,048,846 45,104,884.583 55,560,913 5,556,091.299 80,988,053 8,098,805.342 68,767,514 6,876,751.497 192,009,960 19,200,996.091 720,606,250 72,060,624.981 1,279,742,182 127,974,218.193
TOTAL 1,370,782,446 137,078,244.585 1,748,555,883 174,855,588.395 649,316,326 64,931,632.668 806,244,587 80,624,458.691 163,692,477 16,369,247.745 235,192,482 23,519,248.290 181,901,797 18,190,179.743 515,464,542 51,546,454.200 1,893,426,877 189,342,687.592 2,962,224,492 296,222,449.118
Direct PlanGrowth OptionIssued and SubscribedUnits of Rs. 10 each fully paid up - - - - - - - - - -
Outstanding:Issued during the year / period 133,628 13,362.802 304,116 30,411.628 97,197 9,719.687 583,962 58,396.186 1,274,981 127,498.072
133,628 13,362.802 304,116 30,411.628 97,197 9,719.687 583,962 58,396.186 1,274,981 127,498.072
Redeemed during the year / period 2,575 257.525 - - - - 1,770 176.972 - -
At the end of the year / period 131,053 13,105.277 304,116 30,411.628 97,197 9,719.687 582,192 58,219.214 1,274,981 127,498.072
Dividend OptionIssued and SubscribedUnits of Rs. 10 each fully paid up - - - - - - - - - -
Outstanding:Issued during the year / period 122,681 12,268.093 85,704 8,570.423 122,573 12,257.347 18,023 1,802.309 19,013 1,901.307
122,681 12,268.093 85,704 8,570.423 122,573 12,257.347 18,023 1,802.309 19,013 1,901.307
Redeemed during the year / period - - - - 9,802 980.238 - - - -
At the end of the year / period 122,681 12,268.093 85,704 8,570.423 112,771 11,277.109 18,023 1,802.309 19,013 1,901.307
TOTAL 253,734 25,373.370 389,820 38,982.051 209,968 20,996.796 600,215 60,021.523 1,293,994 129,399.379
TOTAL 1,371,036,180 137,103,617.955 1,748,555,883 174,855,588.395 649,706,146 64,970,614.719 806,244,587 80,624,458.691 163,902,445 16,390,244.541 235,192,482 23,519,248.290 182,502,012 18,250,201.266 515,464,542 51,546,454.200 1,894,720,871 189,472,086.971 2,962,224,492 296,222,449.118
HSBC MUTUAL FUND - HSBC PROGRESSIVE THEMES FUND, HSBC MIDCAP EQUITY FUND, HSBC SMALL CAP FUND, HSBC EMERGING MARKETS FUND and HSBC BRAZIL FUND
Schedules forming part of the Balance Sheet as at March 31, 2013and the Revenue Account for the year / period ended March 31, 2013
Regular Plan
HSBC PROGRESSIVE THEMES FUND HSBC SMALL CAP FUNDHSBC MIDCAP EQUITY FUND HSBC BRAZIL FUND
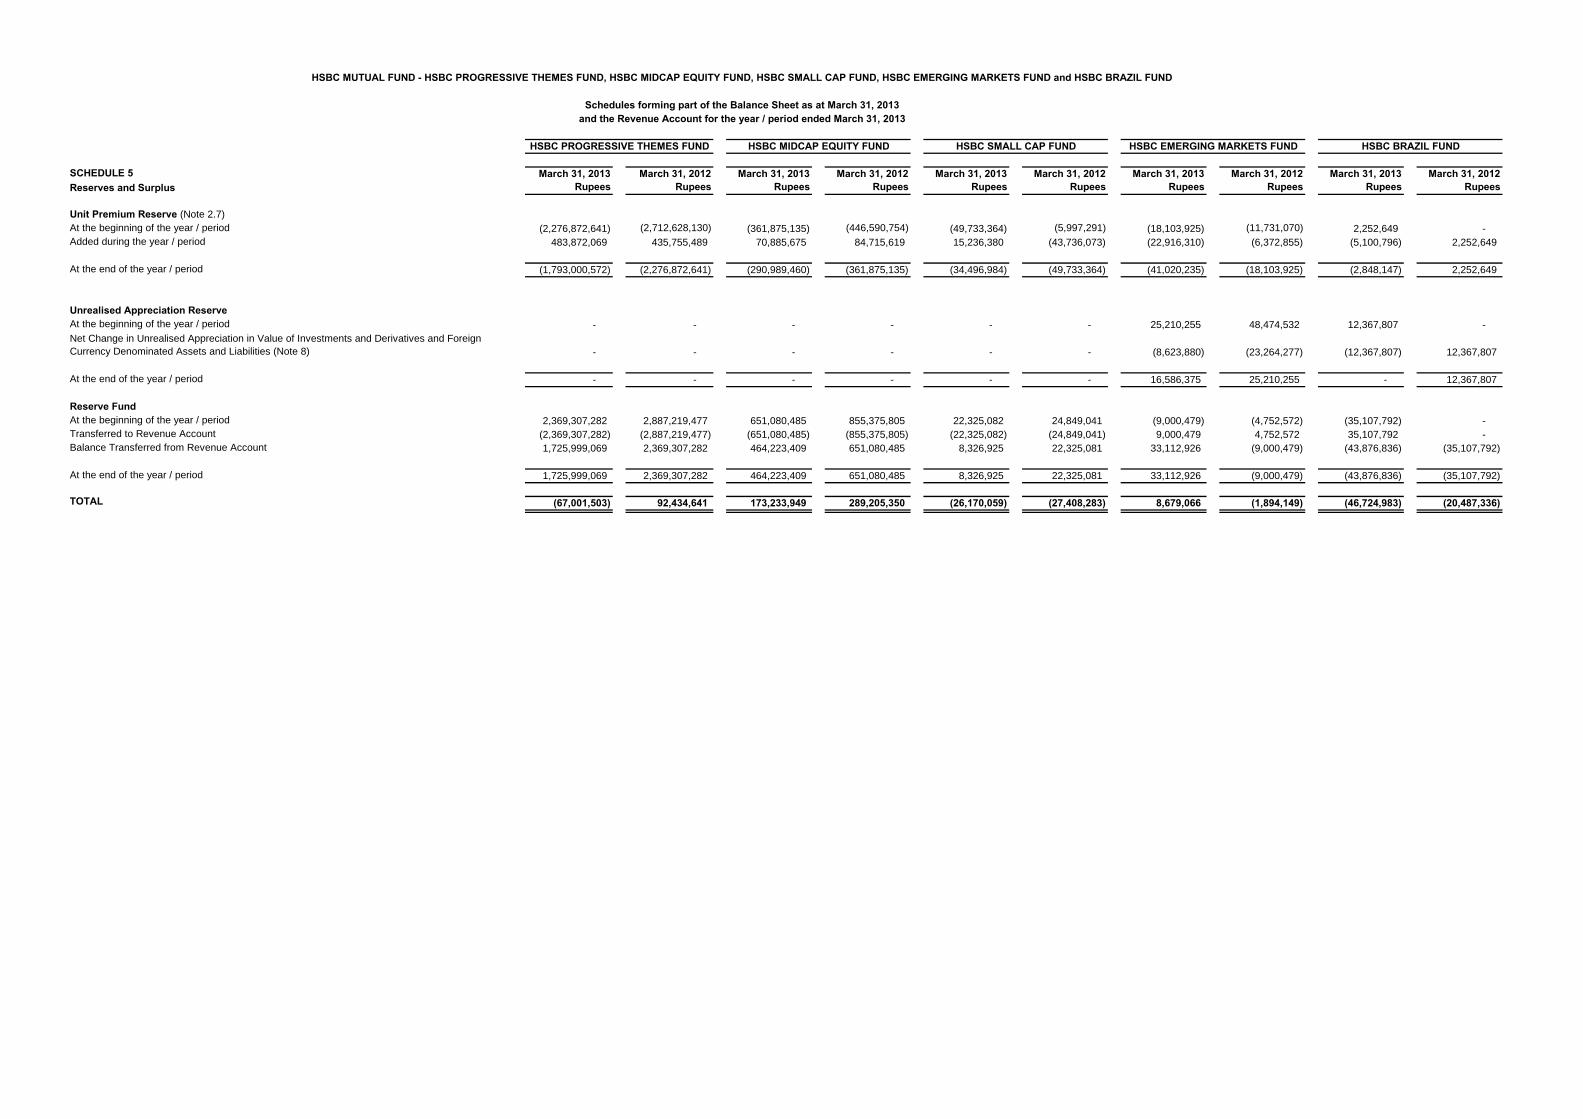
SCHEDULE 5 March 31, 2013 March 31, 2012 March 31, 2013 March 31, 2012 March 31, 2013 March 31, 2012 March 31, 2013 March 31, 2012 March 31, 2013 March 31, 2012Reserves and Surplus Rupees Rupees Rupees Rupees Rupees Rupees Rupees Rupees Rupees Rupees
Unit Premium Reserve (Note 2.7)
At the beginning of the year / period (2,276,872,641) (2,712,628,130) (361,875,135) (446,590,754) (49,733,364) (5,997,291) (18,103,925) (11,731,070) 2,252,649 -
Added during the year / period 483,872,069 435,755,489 70,885,675 84,715,619 15,236,380 (43,736,073) (22,916,310) (6,372,855) (5,100,796) 2,252,649
At the end of the year / period (1,793,000,572) (2,276,872,641) (290,989,460) (361,875,135) (34,496,984) (49,733,364) (41,020,235) (18,103,925) (2,848,147) 2,252,649
Unrealised Appreciation ReserveAt the beginning of the year / period - - - - - - 25,210,255 48,474,532 12,367,807 -
Net Change in Unrealised Appreciation in Value of Investments and Derivatives and Foreign
Currency Denominated Assets and Liabilities (Note 8) - - - - - - (8,623,880) (23,264,277) (12,367,807) 12,367,807
At the end of the year / period - - - - - - 16,586,375 25,210,255 - 12,367,807
Reserve FundAt the beginning of the year / period 2,369,307,282 2,887,219,477 651,080,485 855,375,805 22,325,082 24,849,041 (9,000,479) (4,752,572) (35,107,792) -
Transferred to Revenue Account (2,369,307,282) (2,887,219,477) (651,080,485) (855,375,805) (22,325,082) (24,849,041) 9,000,479 4,752,572 35,107,792 -
Balance Transferred from Revenue Account 1,725,999,069 2,369,307,282 464,223,409 651,080,485 8,326,925 22,325,081 33,112,926 (9,000,479) (43,876,836) (35,107,792)
At the end of the year / period 1,725,999,069 2,369,307,282 464,223,409 651,080,485 8,326,925 22,325,081 33,112,926 (9,000,479) (43,876,836) (35,107,792)
TOTAL (67,001,503) * 92,434,641 * 173,233,949 * 289,205,350 * (26,170,059) * (27,408,283) * 8,679,066 * (1,894,149) * (46,724,983) * (20,487,336)
HSBC MUTUAL FUND - HSBC PROGRESSIVE THEMES FUND, HSBC MIDCAP EQUITY FUND, HSBC SMALL CAP FUND, HSBC EMERGING MARKETS FUND and HSBC BRAZIL FUND
Schedules forming part of the Balance Sheet as at March 31, 2013and the Revenue Account for the year / period ended March 31, 2013
HSBC SMALL CAP FUND HSBC EMERGING MARKETS FUNDHSBC PROGRESSIVE THEMES FUND HSBC MIDCAP EQUITY FUND HSBC BRAZIL FUND
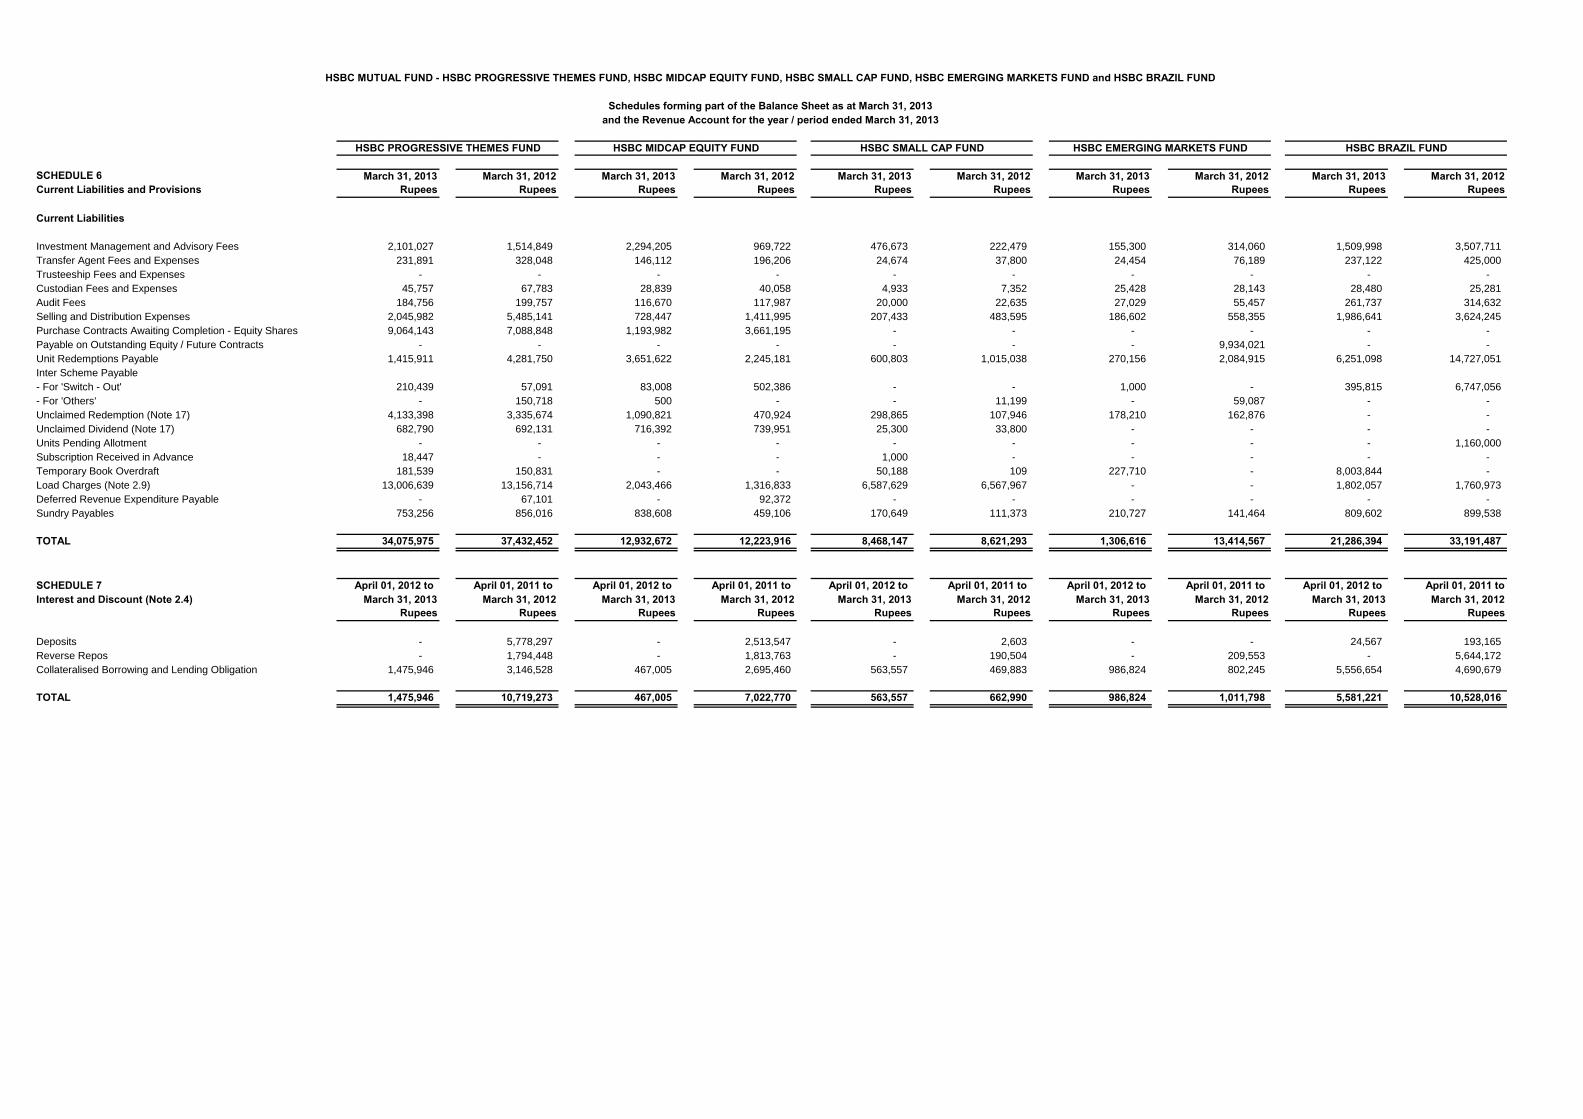
SCHEDULE 6 March 31, 2013 March 31, 2012 March 31, 2013 March 31, 2012 March 31, 2013 March 31, 2012 March 31, 2013 March 31, 2012 March 31, 2013 March 31, 2012Current Liabilities and Provisions Rupees Rupees Rupees Rupees Rupees Rupees Rupees Rupees Rupees Rupees
Current Liabilities
Investment Management and Advisory Fees 2,101,027 1,514,849 2,294,205 969,722 476,673 222,479 155,300 314,060 1,509,998 3,507,711
Transfer Agent Fees and Expenses 231,891 328,048 146,112 196,206 24,674 37,800 24,454 76,189 237,122 425,000
Trusteeship Fees and Expenses - - - - - - - - - -
Custodian Fees and Expenses 45,757 67,783 28,839 40,058 4,933 7,352 25,428 28,143 28,480 25,281
Audit Fees 184,756 199,757 116,670 117,987 20,000 22,635 27,029 55,457 261,737 314,632
Selling and Distribution Expenses 2,045,982 5,485,141 728,447 1,411,995 207,433 483,595 186,602 558,355 1,986,641 3,624,245
Purchase Contracts Awaiting Completion - Equity Shares 9,064,143 7,088,848 1,193,982 3,661,195 - - - - - -
Payable on Outstanding Equity / Future Contracts - - - - - - - 9,934,021 - -
Unit Redemptions Payable 1,415,911 4,281,750 3,651,622 2,245,181 600,803 1,015,038 270,156 2,084,915 6,251,098 14,727,051
Inter Scheme Payable
- For 'Switch - Out' 210,439 57,091 83,008 502,386 - - 1,000 - 395,815 6,747,056
- For 'Others' - 150,718 500 - - 11,199 - 59,087 - -
Unclaimed Redemption (Note 17) 4,133,398 3,335,674 1,090,821 470,924 298,865 107,946 178,210 162,876 - -
Unclaimed Dividend (Note 17) 682,790 692,131 716,392 739,951 25,300 33,800 - - - -
Units Pending Allotment - - - - - - - - - 1,160,000
Subscription Received in Advance 18,447 - - - 1,000 - - - - -
Temporary Book Overdraft 181,539 150,831 - - 50,188 109 227,710 - 8,003,844 -
Load Charges (Note 2.9) 13,006,639 13,156,714 2,043,466 1,316,833 6,587,629 6,567,967 - - 1,802,057 1,760,973
Deferred Revenue Expenditure Payable - 67,101 - 92,372 - - - - - -
Sundry Payables 753,256 856,016 838,608 459,106 170,649 111,373 210,727 141,464 809,602 899,538
TOTAL 34,075,975 37,432,452 12,932,672 12,223,916 8,468,147 8,621,293 1,306,616 13,414,567 21,286,394 33,191,487
SCHEDULE 7 April 01, 2012 to April 01, 2011 to April 01, 2012 to April 01, 2011 to April 01, 2012 to April 01, 2011 to April 01, 2012 to April 01, 2011 to April 01, 2012 to April 01, 2011 toInterest and Discount (Note 2.4) March 31, 2013 March 31, 2012 March 31, 2013 March 31, 2012 March 31, 2013 March 31, 2012 March 31, 2013 March 31, 2012 March 31, 2013 March 31, 2012
Rupees Rupees Rupees Rupees Rupees Rupees Rupees Rupees Rupees Rupees
Deposits - 5,778,297 - 2,513,547 - 2,603 - - 24,567 193,165
Reverse Repos - 1,794,448 - 1,813,763 - 190,504 - 209,553 - 5,644,172
Collateralised Borrowing and Lending Obligation 1,475,946 3,146,528 467,005 2,695,460 563,557 469,883 986,824 802,245 5,556,654 4,690,679
TOTAL 1,475,946 10,719,273 467,005 7,022,770 563,557 662,990 986,824 1,011,798 5,581,221 10,528,016 -
HSBC MUTUAL FUND - HSBC PROGRESSIVE THEMES FUND, HSBC MIDCAP EQUITY FUND, HSBC SMALL CAP FUND, HSBC EMERGING MARKETS FUND and HSBC BRAZIL FUND
Schedules forming part of the Balance Sheet as at March 31, 2013and the Revenue Account for the year / period ended March 31, 2013
HSBC SMALL CAP FUND HSBC EMERGING MARKETS FUNDHSBC PROGRESSIVE THEMES FUND HSBC MIDCAP EQUITY FUND HSBC BRAZIL FUND
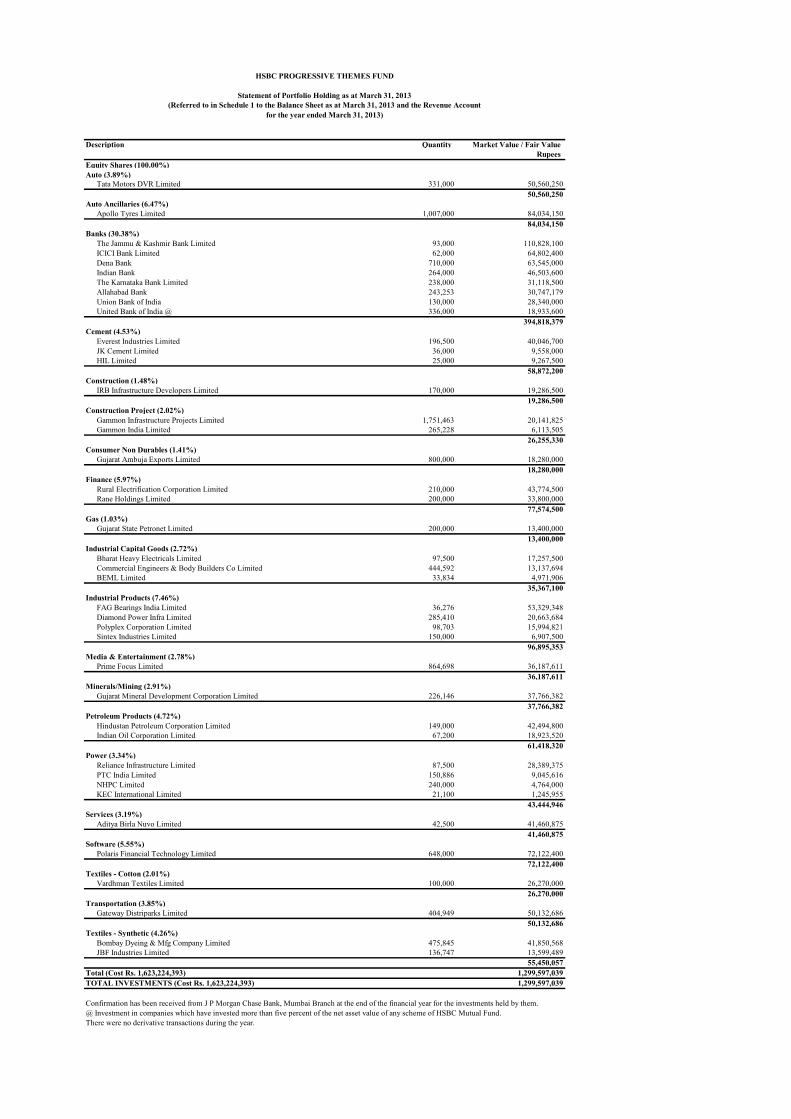
Description Quantity Market Value / Fair ValueRupees
Equity Shares (100.00%)Auto (3.89%)
Tata Motors DVR Limited 331,000 50,560,25050,560,250
Auto Ancillaries (6.47%)Apollo Tyres Limited 1,007,000 84,034,150
84,034,150Banks (30.38%)
The Jammu & Kashmir Bank Limited 93,000 110,828,100ICICI Bank Limited 62,000 64,802,400Dena Bank 710,000 63,545,000Indian Bank 264,000 46,503,600The Karnataka Bank Limited 238,000 31,118,500Allahabad Bank 243,253 30,747,179Union Bank of India 130,000 28,340,000United Bank of India @ 336,000 18,933,600
394,818,379Cement (4.53%)
Everest Industries Limited 196,500 40,046,700JK Cement Limited 36,000 9,558,000HIL Limited 25,000 9,267,500
58,872,200Construction (1.48%)
IRB Infrastructure Developers Limited 170,000 19,286,50019,286,500
Construction Project (2.02%)Gammon Infrastructure Projects Limited 1,751,463 20,141,825Gammon India Limited 265,228 6,113,505
26,255,330Consumer Non Durables (1.41%)
Gujarat Ambuja Exports Limited 800,000 18,280,00018,280,000
Finance (5.97%)Rural Electrification Corporation Limited 210,000 43,774,500Rane Holdings Limited 200,000 33,800,000
77,574,500Gas (1.03%)
Gujarat State Petronet Limited 200,000 13,400,00013,400,000
Industrial Capital Goods (2.72%)Bharat Heavy Electricals Limited 97,500 17,257,500Commercial Engineers & Body Builders Co Limited 444,592 13,137,694BEML Limited 33,834 4,971,906
35,367,100Industrial Products (7.46%)
FAG Bearings India Limited 36,276 53,329,348Diamond Power Infra Limited 285,410 20,663,684Polyplex Corporation Limited 98,703 15,994,821Sintex Industries Limited 150,000 6,907,500
96,895,353Media & Entertainment (2.78%)
Prime Focus Limited 864,698 36,187,61136,187,611
Minerals/Mining (2.91%)Gujarat Mineral Development Corporation Limited 226,146 37,766,382
37,766,382Petroleum Products (4.72%)
Hindustan Petroleum Corporation Limited 149,000 42,494,800Indian Oil Corporation Limited 67,200 18,923,520
61,418,320Power (3.34%)
Reliance Infrastructure Limited 87,500 28,389,375PTC India Limited 150,886 9,045,616NHPC Limited 240,000 4,764,000KEC International Limited 21,100 1,245,955
43,444,946Services (3.19%)
Aditya Birla Nuvo Limited 42,500 41,460,87541,460,875
Software (5.55%)Polaris Financial Technology Limited 648,000 72,122,400
72,122,400Textiles - Cotton (2.01%)
Vardhman Textiles Limited 100,000 26,270,00026,270,000
Transportation (3.85%)Gateway Distriparks Limited 404,949 50,132,686
50,132,686Textiles - Synthetic (4.26%)
Bombay Dyeing & Mfg Company Limited 475,845 41,850,568JBF Industries Limited 136,747 13,599,489
55,450,057Total (Cost Rs. 1,623,224,393) 1,299,597,039TOTAL INVESTMENTS (Cost Rs. 1,623,224,393) 1,299,597,039
There were no derivative transactions during the year.
HSBC PROGRESSIVE THEMES FUND
Statement of Portfolio Holding as at March 31, 2013(Referred to in Schedule 1 to the Balance Sheet as at March 31, 2013 and the Revenue Account
for the year ended March 31, 2013)
Confirmation has been received from J P Morgan Chase Bank, Mumbai Branch at the end of the financial year for the investments held by them.@ Investment in companies which have invested more than five percent of the net asset value of any scheme of HSBC Mutual Fund.
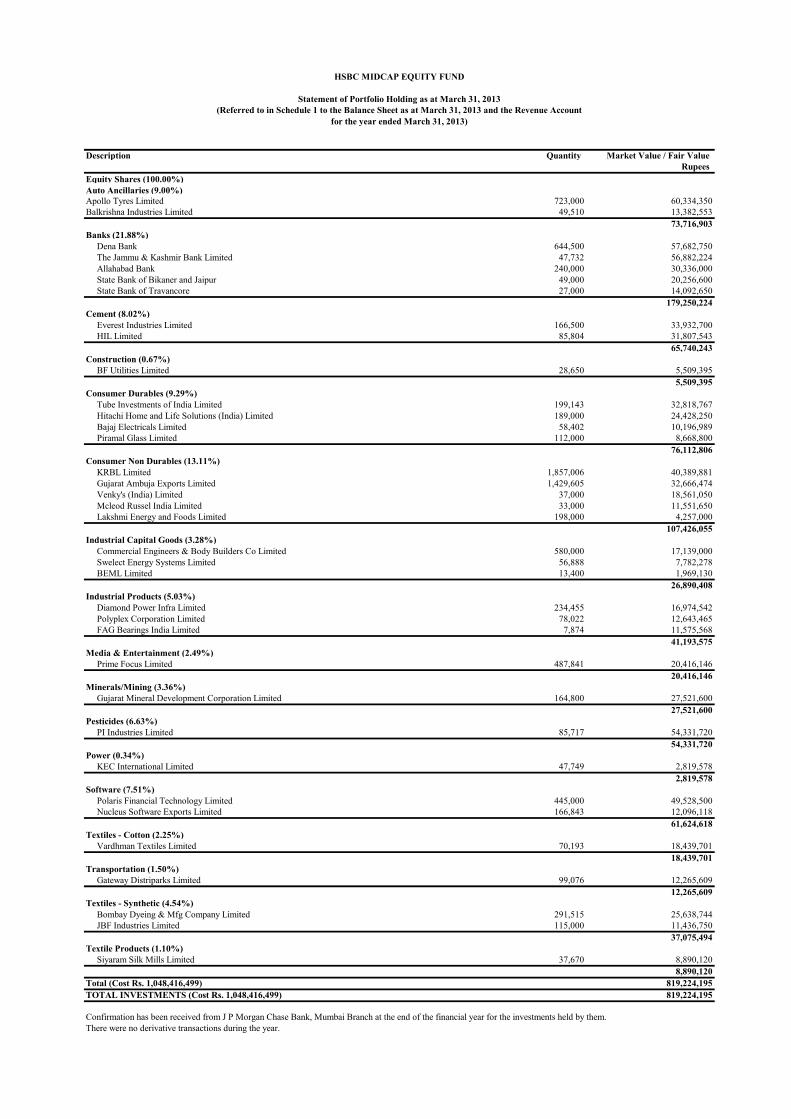
Description Quantity Market Value / Fair ValueRupees
Equity Shares (100.00%)Auto Ancillaries (9.00%)Apollo Tyres Limited 723,000 60,334,350Balkrishna Industries Limited 49,510 13,382,553
73,716,903Banks (21.88%)
Dena Bank 644,500 57,682,750The Jammu & Kashmir Bank Limited 47,732 56,882,224Allahabad Bank 240,000 30,336,000State Bank of Bikaner and Jaipur 49,000 20,256,600State Bank of Travancore 27,000 14,092,650
179,250,224Cement (8.02%)
Everest Industries Limited 166,500 33,932,700HIL Limited 85,804 31,807,543
65,740,243Construction (0.67%)
BF Utilities Limited 28,650 5,509,3955,509,395
Consumer Durables (9.29%)Tube Investments of India Limited 199,143 32,818,767Hitachi Home and Life Solutions (India) Limited 189,000 24,428,250Bajaj Electricals Limited 58,402 10,196,989Piramal Glass Limited 112,000 8,668,800
76,112,806Consumer Non Durables (13.11%)
KRBL Limited 1,857,006 40,389,881Gujarat Ambuja Exports Limited 1,429,605 32,666,474Venky's (India) Limited 37,000 18,561,050Mcleod Russel India Limited 33,000 11,551,650Lakshmi Energy and Foods Limited 198,000 4,257,000
107,426,055Industrial Capital Goods (3.28%)
Commercial Engineers & Body Builders Co Limited 580,000 17,139,000Swelect Energy Systems Limited 56,888 7,782,278BEML Limited 13,400 1,969,130
26,890,408Industrial Products (5.03%)
Diamond Power Infra Limited 234,455 16,974,542Polyplex Corporation Limited 78,022 12,643,465FAG Bearings India Limited 7,874 11,575,568
41,193,575Media & Entertainment (2.49%)
Prime Focus Limited 487,841 20,416,14620,416,146
Minerals/Mining (3.36%)Gujarat Mineral Development Corporation Limited 164,800 27,521,600
27,521,600Pesticides (6.63%)
PI Industries Limited 85,717 54,331,72054,331,720
Power (0.34%)KEC International Limited 47,749 2,819,578
2,819,578Software (7.51%)
Polaris Financial Technology Limited 445,000 49,528,500Nucleus Software Exports Limited 166,843 12,096,118
61,624,618Textiles - Cotton (2.25%)
Vardhman Textiles Limited 70,193 18,439,70118,439,701
Transportation (1.50%)Gateway Distriparks Limited 99,076 12,265,609
12,265,609Textiles - Synthetic (4.54%)
Bombay Dyeing & Mfg Company Limited 291,515 25,638,744JBF Industries Limited 115,000 11,436,750
37,075,494Textile Products (1.10%)
Siyaram Silk Mills Limited 37,670 8,890,1208,890,120
Total (Cost Rs. 1,048,416,499) 819,224,195TOTAL INVESTMENTS (Cost Rs. 1,048,416,499) 819,224,195
There were no derivative transactions during the year.
HSBC MIDCAP EQUITY FUND
Statement of Portfolio Holding as at March 31, 2013(Referred to in Schedule 1 to the Balance Sheet as at March 31, 2013 and the Revenue Account
for the year ended March 31, 2013)
Confirmation has been received from J P Morgan Chase Bank, Mumbai Branch at the end of the financial year for the investments held by them.
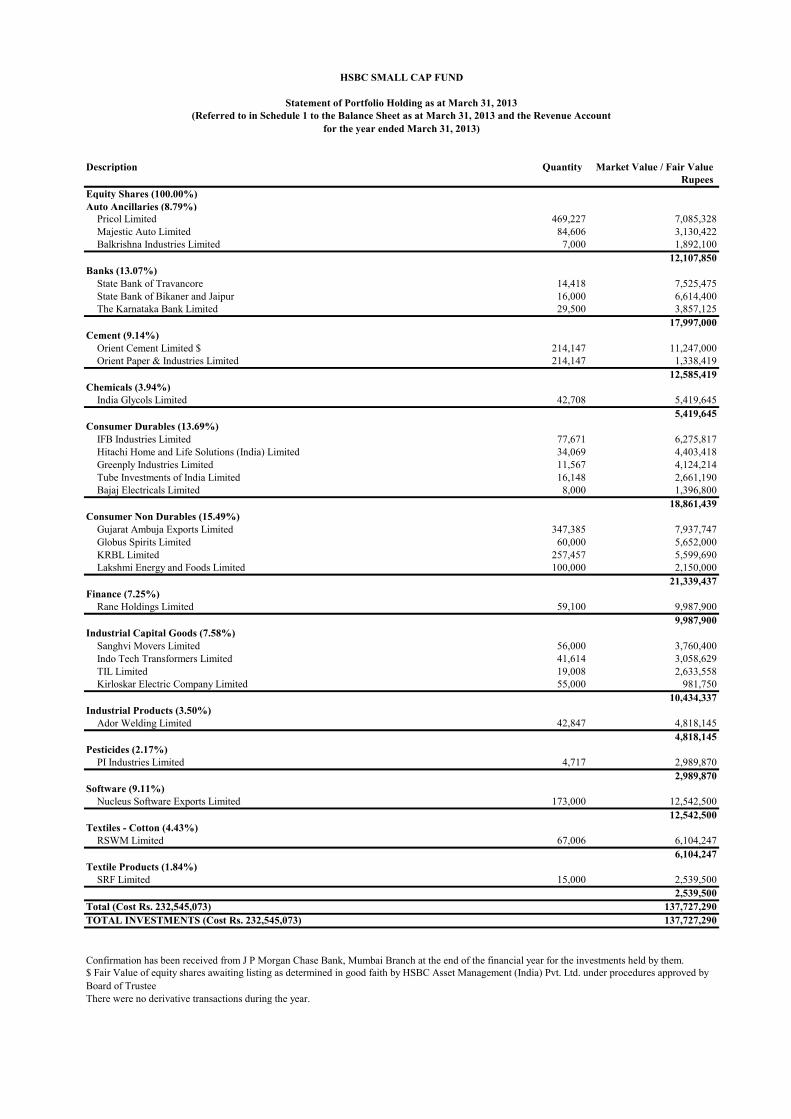
Description Quantity Market Value / Fair ValueRupees
Equity Shares (100.00%)Auto Ancillaries (8.79%)
Pricol Limited 469,227 7,085,328Majestic Auto Limited 84,606 3,130,422Balkrishna Industries Limited 7,000 1,892,100
12,107,850Banks (13.07%)
State Bank of Travancore 14,418 7,525,475State Bank of Bikaner and Jaipur 16,000 6,614,400The Karnataka Bank Limited 29,500 3,857,125
17,997,000Cement (9.14%)
Orient Cement Limited $ 214,147 11,247,000Orient Paper & Industries Limited 214,147 1,338,419
12,585,419Chemicals (3.94%)
India Glycols Limited 42,708 5,419,6455,419,645
Consumer Durables (13.69%)IFB Industries Limited 77,671 6,275,817Hitachi Home and Life Solutions (India) Limited 34,069 4,403,418Greenply Industries Limited 11,567 4,124,214Tube Investments of India Limited 16,148 2,661,190Bajaj Electricals Limited 8,000 1,396,800
18,861,439Consumer Non Durables (15.49%)
Gujarat Ambuja Exports Limited 347,385 7,937,747Globus Spirits Limited 60,000 5,652,000KRBL Limited 257,457 5,599,690Lakshmi Energy and Foods Limited 100,000 2,150,000
21,339,437Finance (7.25%)
Rane Holdings Limited 59,100 9,987,9009,987,900
Industrial Capital Goods (7.58%)Sanghvi Movers Limited 56,000 3,760,400Indo Tech Transformers Limited 41,614 3,058,629TIL Limited 19,008 2,633,558Kirloskar Electric Company Limited 55,000 981,750
10,434,337Industrial Products (3.50%)
Ador Welding Limited 42,847 4,818,1454,818,145
Pesticides (2.17%)PI Industries Limited 4,717 2,989,870
2,989,870Software (9.11%)
Nucleus Software Exports Limited 173,000 12,542,50012,542,500
Textiles - Cotton (4.43%)RSWM Limited 67,006 6,104,247
6,104,247Textile Products (1.84%)
SRF Limited 15,000 2,539,5002,539,500
Total (Cost Rs. 232,545,073) 137,727,290TOTAL INVESTMENTS (Cost Rs. 232,545,073) 137,727,290
There were no derivative transactions during the year.
HSBC SMALL CAP FUND
Statement of Portfolio Holding as at March 31, 2013(Referred to in Schedule 1 to the Balance Sheet as at March 31, 2013 and the Revenue Account
for the year ended March 31, 2013)
Confirmation has been received from J P Morgan Chase Bank, Mumbai Branch at the end of the financial year for the investments held by them.$ Fair Value of equity shares awaiting listing as determined in good faith by HSBC Asset Management (India) Pvt. Ltd. under procedures approved by Board of Trustee

Description Quantity Market ValueRupees
Mutual Fund Units (100.00%)HSBC GIF Global Emerging Markets Equity 445,508.404 186,129,396
Total (Cost Rs. 169,543,021) 186,129,396TOTAL INVESTMENTS (Cost Rs. 169,543,021) 186,129,396
There were no derivative transactions during the year.
HSBC EMERGING MARKETS FUND
Statement of Portfolio Holding as at March 31, 2013(Referred to in Schedule 1 to the Balance Sheet as at March 31, 2013 and the Revenue Account
for the year ended March 31, 2013)
Confirmation has been received from J P Morgan Chase Bank, Mumbai Branch at the end of the financial year for the investments held by them.

Description Quantity Market ValueRupees
Mutual Fund Units (100.00%)HSBC GIF Brazil Equity Fund 982,877.465 1,819,040,164
Total (Cost Rs. 1,846,991,548) 1,819,040,164TOTAL INVESTMENTS (Cost Rs. 1,846,991,548) 1,819,040,164
There were no derivative transactions during the year.
HSBC BRAZIL FUND
Statement of Portfolio Holding as at March 31, 2013(Referred to in Schedule 1 to the Balance Sheet as at March 31, 2013 and the Revenue Account
for the year ended March 31, 2013)
Confirmation has been received from J P Morgan Chase Bank, Mumbai Branch at the end of the financial year for the investments held by them.
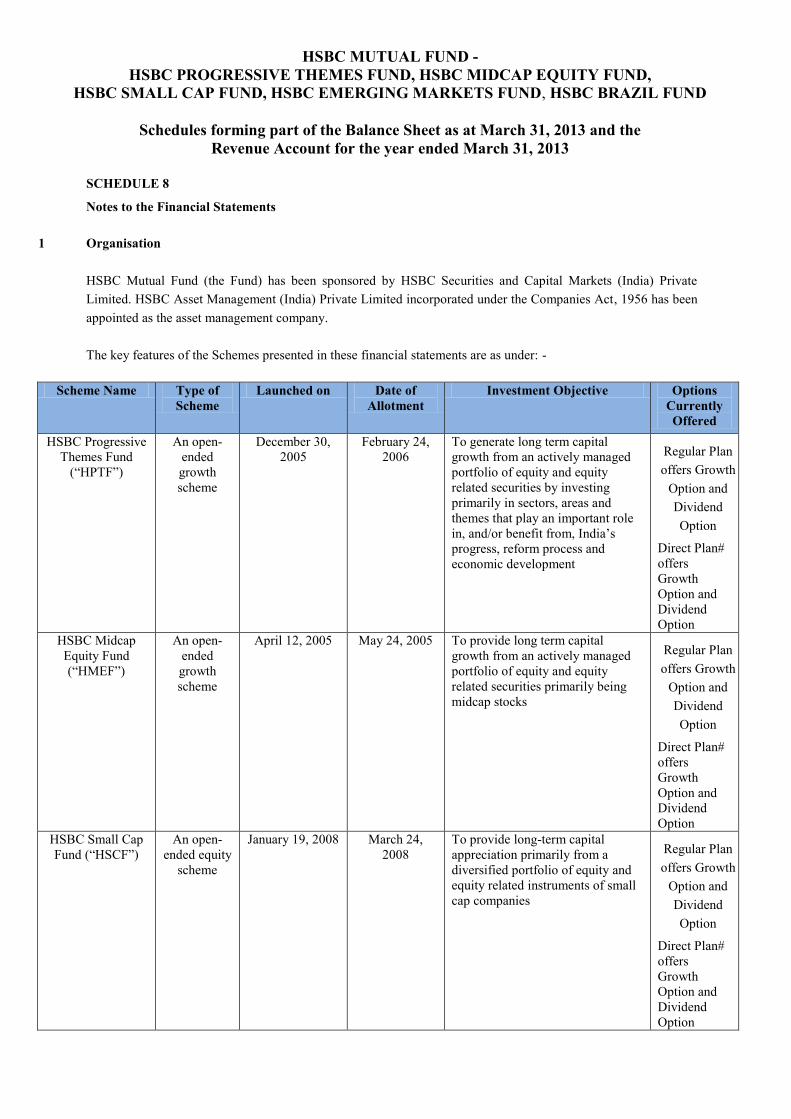
HSBC MUTUAL FUND - HSBC PROGRESSIVE THEMES FUND, HSBC MIDCAP EQUITY FUND,
HSBC SMALL CAP FUND, HSBC EMERGING MARKETS FUND, HSBC BRAZIL FUND
Schedules forming part of the Balance Sheet as at March 31, 2013 and the Revenue Account for the year ended March 31, 2013
SCHEDULE 8
Notes to the Financial Statements
1 Organisation HSBC Mutual Fund (the Fund) has been sponsored by HSBC Securities and Capital Markets (India) Private Limited. HSBC Asset Management (India) Private Limited incorporated under the Companies Act, 1956 has been appointed as the asset management company. The key features of the Schemes presented in these financial statements are as under: -
Scheme Name Type of Scheme
Launched on Date of Allotment
Investment Objective Options Currently Offered
HSBC Progressive Themes Fund
(“HPTF”)
An open-ended growth scheme
December 30, 2005
February 24, 2006
To generate long term capital growth from an actively managed portfolio of equity and equity related securities by investing primarily in sectors, areas and themes that play an important role in, and/or benefit from, India’s progress, reform process and economic development
Regular Plan offers Growth
Option and Dividend Option
Direct Plan# offers Growth Option and Dividend Option
HSBC Midcap Equity Fund (“HMEF”)
An open-ended growth scheme
April 12, 2005 May 24, 2005 To provide long term capital growth from an actively managed portfolio of equity and equity related securities primarily being midcap stocks
Regular Plan offers Growth
Option and Dividend Option
Direct Plan# offers Growth Option and Dividend Option
HSBC Small Cap Fund (“HSCF”)
An open-ended equity
scheme
January 19, 2008 March 24, 2008
To provide long-term capital appreciation primarily from a diversified portfolio of equity and equity related instruments of small cap companies
Regular Plan offers Growth
Option and Dividend Option
Direct Plan# offers Growth Option and Dividend Option
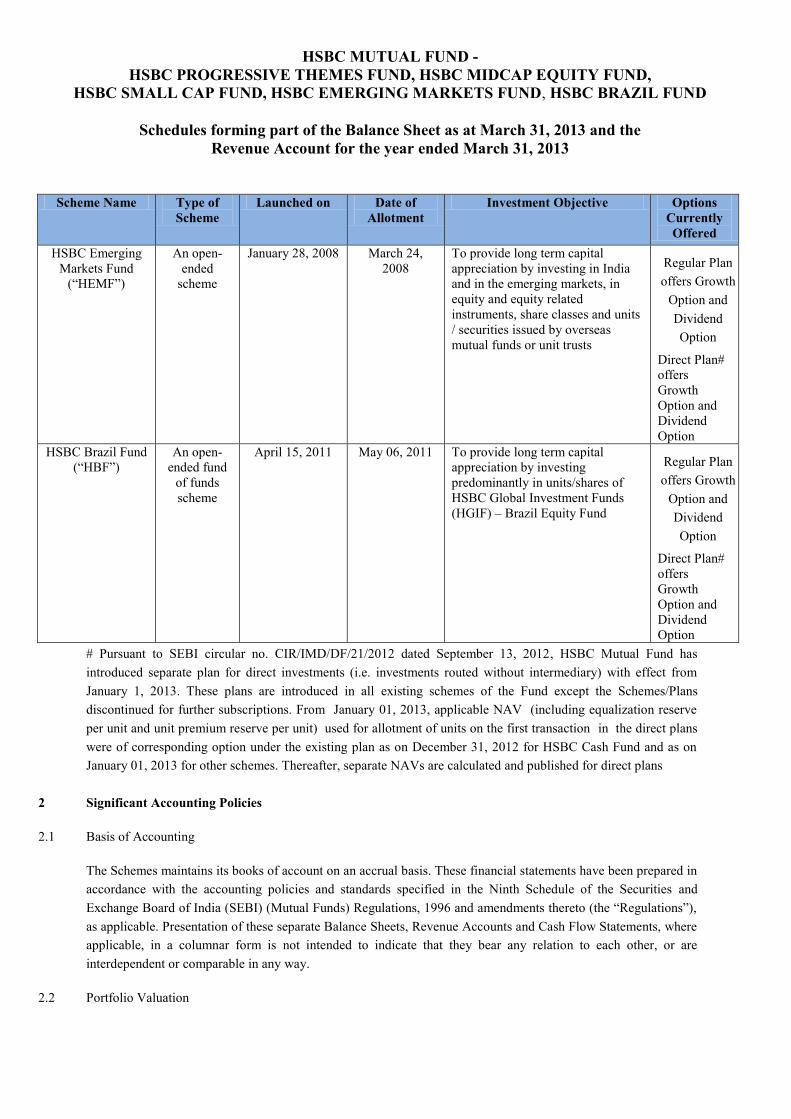
HSBC MUTUAL FUND - HSBC PROGRESSIVE THEMES FUND, HSBC MIDCAP EQUITY FUND,
HSBC SMALL CAP FUND, HSBC EMERGING MARKETS FUND, HSBC BRAZIL FUND
Schedules forming part of the Balance Sheet as at March 31, 2013 and the Revenue Account for the year ended March 31, 2013
Scheme Name Type of
Scheme Launched on Date of
Allotment Investment Objective Options
Currently Offered
HSBC Emerging Markets Fund
(“HEMF”)
An open-ended
scheme
January 28, 2008 March 24, 2008
To provide long term capital appreciation by investing in India and in the emerging markets, in equity and equity related instruments, share classes and units / securities issued by overseas mutual funds or unit trusts
Regular Plan offers Growth
Option and Dividend Option
Direct Plan# offers Growth Option and Dividend Option
HSBC Brazil Fund (“HBF”)
An open-ended fund
of funds scheme
April 15, 2011 May 06, 2011 To provide long term capital appreciation by investing predominantly in units/shares of HSBC Global Investment Funds (HGIF) – Brazil Equity Fund
Regular Plan offers Growth
Option and Dividend Option
Direct Plan# offers Growth Option and Dividend Option
# Pursuant to SEBI circular no. CIR/IMD/DF/21/2012 dated September 13, 2012, HSBC Mutual Fund has introduced separate plan for direct investments (i.e. investments routed without intermediary) with effect from January 1, 2013. These plans are introduced in all existing schemes of the Fund except the Schemes/Plans discontinued for further subscriptions. From January 01, 2013, applicable NAV (including equalization reserve per unit and unit premium reserve per unit) used for allotment of units on the first transaction in the direct plans were of corresponding option under the existing plan as on December 31, 2012 for HSBC Cash Fund and as on January 01, 2013 for other schemes. Thereafter, separate NAVs are calculated and published for direct plans
2 Significant Accounting Policies
2.1 Basis of Accounting The Schemes maintains its books of account on an accrual basis. These financial statements have been prepared in accordance with the accounting policies and standards specified in the Ninth Schedule of the Securities and Exchange Board of India (SEBI) (Mutual Funds) Regulations, 1996 and amendments thereto (the “Regulations”), as applicable. Presentation of these separate Balance Sheets, Revenue Accounts and Cash Flow Statements, where applicable, in a columnar form is not intended to indicate that they bear any relation to each other, or are interdependent or comparable in any way.
2.2 Portfolio Valuation
HSBC MUTUAL FUND - HSBC PROGRESSIVE THEMES FUND, HSBC MIDCAP EQUITY FUND,
HSBC SMALL CAP FUND, HSBC EMERGING MARKETS FUND, HSBC BRAZIL FUND
Schedules forming part of the Balance Sheet as at March 31, 2013 and the Revenue Account for the year ended March 31, 2013
Investments are stated at market / fair value at the Balance Sheet date / date of determination. In valuing the Scheme’s investments:
i. Equity securities listed on a recognized stock exchange are valued at the last quoted closing price on the National Stock Exchange of India Limited (NSE). If on a particular valuation date, a security is not traded on NSE, the value at which it is traded on Bombay Stock Exchange Limited (BSE) is used. If no sale is reported at that time, the last quoted closing price on the principal stock exchange on which the security is traded is used when it is not more than thirty days prior to the valuation date.
ii. Non-traded and thinly traded equity securities, including those not traded within thirty days prior to the
valuation date are valued at fair value as determined by HSBC Asset Management (India) Private Limited under procedures approved by the Board of Trustees of HSBC Mutual Fund (the Trustee) in accordance with the guidelines for valuation of securities specified in the Regulations.
iii. Equity shares awaiting listing are valued at fair value as determined in good faith by HSBC Asset
Management (India) Private Limited under procedures approved by the Board of Trustees of HSBC Mutual Fund.
iv. For money market securities, debt securities and floating rate securities :
a) All traded money market securities, debt securities and floating rate securities listed on the recognized stock exchange are valued at the weighted average price at which they are traded on the particular valuation day. b) Non-traded /thinly traded money market securities, debt securities and floating rate securities with residual maturity of upto 91 days are valued on amortization basis. Floating rate securities with floor and caps on coupon rate and residual maturity of upto 91 days are valued on amortization basis taking the coupon rate as floor. c) Non-traded /thinly traded money market securities, debt securities and floating rate securities with residual maturity of over 91 days are valued at fair value as per procedures determined by HSBC Asset Management (India) Private Limited and approved by the Trustee in accordance with the guidelines for valuation of securities for mutual funds, issued by SEBI from time to time. For money market securities, debt securities and floating rate securities (with effect from July 06, 2012) a) All traded money market securities and debt securities and floating rate securities are valued at the weighted average traded YTM or weighted average price at which they are traded / reported on public platform on the particular valuation day as per procedures determined by HSBC Asset Management (India) Private Limited and approved by the Trustee in accordance with the guidelines for valuation of securities for mutual funds, issued by SEBI from time to time. b) Non-traded /thinly traded money market and debt securities and floating rate securities, with residual maturity of up to 91* days are valued on amortization basis. Floating rate securities with floor and caps on coupon rate and residual maturity of up to 91* days are valued on amortization basis taking the coupon rate as floor. Amortized price as per Crisil Bond Valuer (CBV) will be compared with the reference price (as per CBV) to ascertain if the difference is within the band of +/- 10 basis points of the
HSBC MUTUAL FUND - HSBC PROGRESSIVE THEMES FUND, HSBC MIDCAP EQUITY FUND,
HSBC SMALL CAP FUND, HSBC EMERGING MARKETS FUND, HSBC BRAZIL FUND
Schedules forming part of the Balance Sheet as at March 31, 2013 and the Revenue Account for the year ended March 31, 2013
reference price. In case of amortised price falling outside the band, the YTM of the amortised price will be adjusted in order to bring the price within the band. c) Non-traded /thinly traded money market securities, debt securities and floating rate securities with residual maturity of over 91* days are valued at fair value as per procedures determined by HSBC Asset Management (India) Private Limited and approved by the Trustee in accordance with the guidelines for valuation of securities for mutual funds, issued by SEBI from time to time. Thus they are valued at benchmark yield/matrix of spread over risk free benchmark yield obtained from agencies entrusted for the said purpose by AMFI. This may be further adjusted for the illiquidity mark-up / mark-down as permitted under the regulations. *Pursuant to SEBI circular CIR/IMD/DF/6/2012 dated February 28, 2012, with effect from October 01, 2012, reference to 91 days above was changed to 60 days.
v. Instruments bought on ‘repo’ basis are valued at the resale price after deduction of applicable interest up
to the date of resale. Instruments sold on repo basis are adjusted for the difference between the repurchase price (after deduction of applicable interest upto the date of repurchase) and the value of instrument.
vi. Collateralised Borrowing and Lending Obligations (CBLO) are valued at cost plus accrued interest.
The net unrealised appreciation / depreciation in the value of investments and derivatives is determined
separately for each category of investments and derivatives. In respect of each category of investments and
derivatives, the net change in the unrealised appreciation if any, between two balance sheet dates / valuation
dates is accounted through the Revenue Account and thereafter the net change in unrealised appreciation is
transferred from the Revenue Account to the Unrealised Appreciation Reserve. The net change in unrealised
depreciation in the value of investments and derivatives between the two balance sheet dates/ valuation dates
if any, is accounted through the Revenue Account.
Net unrealised appreciation is reduced from the distributable income at the time of income distribution.
2.3 Securities Transaction
(i) Investment securities transactions are accounted for on a trade date basis. The Scheme uses the average cost
method for determining the realized gain or loss on sale of investments. The cost of investments includes
brokerage stamp charges and any other charges customarily included in the contract note but excludes
custodian safekeeping fees. Pursuant to SEBI circular no. CIR/IMD/DF/21/2012 dated September 13, 2012,
with effect from October 01, 2012, Brokerage and Transaction Costs which are incurred for the purpose of
execution of trade, is included in the cost of investment, not exceeding 0.12 per cent in case of cash market
transactions and 0.05 per cent in case of derivatives transactions. Remaining portion is charged to expenses,
within total expense ratio in line with the Regulations.
(ii) Rights entitlements are recognized as investments on the ex-rights date or during the rights offer period
depending upon the date of intention to subscribe to the rights issue.
(iii) Bonus entitlements are recognized as investments on the ex-bonus date.
HSBC MUTUAL FUND - HSBC PROGRESSIVE THEMES FUND, HSBC MIDCAP EQUITY FUND,
HSBC SMALL CAP FUND, HSBC EMERGING MARKETS FUND, HSBC BRAZIL FUND
Schedules forming part of the Balance Sheet as at March 31, 2013 and the Revenue Account for the year ended March 31, 2013
2.4 Investment Income
Interest income is recorded on accrual basis. Dividend income is recognised on ex dividend date.
2.5 Derivatives The Scheme enters into derivative transactions in stock / index futures and options for the purpose of hedging and
portfolio balancing. “Derivative margin deposits” representing the margin towards stock / index derivative contracts entered into by
the Schemes are disclosed under “Other Current Assets”. Futures
• Futures contracts are marked to market daily at the futures settlement price as determined by the exchange.
The variation margin calculated as the difference between the trade price or the previous day’s settlement
price, as the case may be, and the current day’s settlement price is recorded as a receivable or payable.
• When a contract is closed (squared off)/ settled (on expiry), the difference between the final settlement /
square-off price and the contract price is recognised in the Revenue Account. If more than one futures
contracts in respect of the same stock / index and expiry date, to which the squared off / settled contract
pertains, is outstanding at the time of square off / settlement of the contract, the weighted average method is
followed for determining the gain or loss.
• As at the Balance Sheet date / date of determination, all open futures positions are valued at the futures
settlement price as determined by the exchange where it is traded. The unrealised appreciation / depreciation
on all open positions is considered for determining the net asset value.
Options
(i) Premium paid/received on bought/written option contracts is debited / credited to “equity option premium
account” and recorded as an Asset/Liability.
(ii) When the option contracts are squared off before expiry, the difference between the premium paid and received
on the squared off transactions is recognized in the revenue account. When the option contracts are exercised
on or before expiry, the difference between the option settlement price as determined by the exchange and the
premium is recognized in the revenue account. If more than one option contracts in respect of the same
stock/index with the same strike price and expiry date to which the squared off /exercised contract pertains is
outstanding at the time of square off /exercise of the contract, the weighted average method is followed for
determining the gain or loss.
(iii) Premium asset/liability in respect of options not exercised / squared off as on expiry date is transferred to
revenue account.
As at the Balance Sheet date/date of determination, all open option positions are valued at the settlement
price as determined by the exchange where it is traded. Non traded option contracts are valued at fair value as

HSBC MUTUAL FUND - HSBC PROGRESSIVE THEMES FUND, HSBC MIDCAP EQUITY FUND,
HSBC SMALL CAP FUND, HSBC EMERGING MARKETS FUND, HSBC BRAZIL FUND
Schedules forming part of the Balance Sheet as at March 31, 2013 and the Revenue Account for the year ended March 31, 2013
determined by HSBC Asset Management (India) Private Limited and approved by the Trustee. The
unrealized appreciation/depreciation on all open positions is considered for determining the net asset value.
2.6 Net Asset Value
The net asset value of the units of the Schemes is determined separately for the units issued under the various
Plans/ Options. For reporting the net asset value of the Plans/ Options, daily income earned, including realised
and unrealised gain or loss in the value of investments and expenses incurred by the Schemes are allocated to the
Plans/ Options in proportion to the value of the net assets.
2.7 Unit Premium Reserve
Upon issue and redemption of units, the net premium or discount to the face value of units is adjusted against the
unit premium reserve of the respective Plans/ Options of the Schemes, after an appropriate portion of the issue
proceeds and redemption payout is credited or debited respectively to the income equalisation reserve.
2.8 Income Equalisation Reserve The net income relating to units issued / repurchased is transferred to / from income equalisation reserve (for open ended schemes) for determining the net surplus / deficit transferred from / to unit premium reserve. At the year end, balance in income equalisation reserve is transferred to Revenue Account.
2.9 Load Charges
Upto September 30, 2012, Exit load (Net of Service Tax) collected in the Schemes up to a maximum of 1% of
redemption proceeds is maintained in a separate account and utilized to meet marketing & selling expenses. Any
load (Net of Service Tax) collected in excess of 1% is credited to the Schemes immediately.
SEBI circular No. CIR /IMD/DF/ 4/2011 dated March 09, 2011 has mandated that there should be segregation of
load accounts into two parts, one to reflect the balance as on July 31, 2009 and the other to reflect accretions since
August 01, 2009. While the unutilized balances can be carried forward, not more than one third of the load
balances lying in the Scheme as on July 31, 2009 can be used in any financial year, starting from financial year
2010-2011. All accretions after July 31, 2009 can be used by the Schemes without any such restriction. Further,
both load balances can be used for marketing and selling expenses including distributor‟ s /agent‟ s commission.
Pursuant to SEBI (Second Amendment) (Mutual Fund) Regulations, 1996 dated September 26, 2012, with effect from October 01, 2012, entire Exit load (Net of Service Tax) is credited to the Schemes.
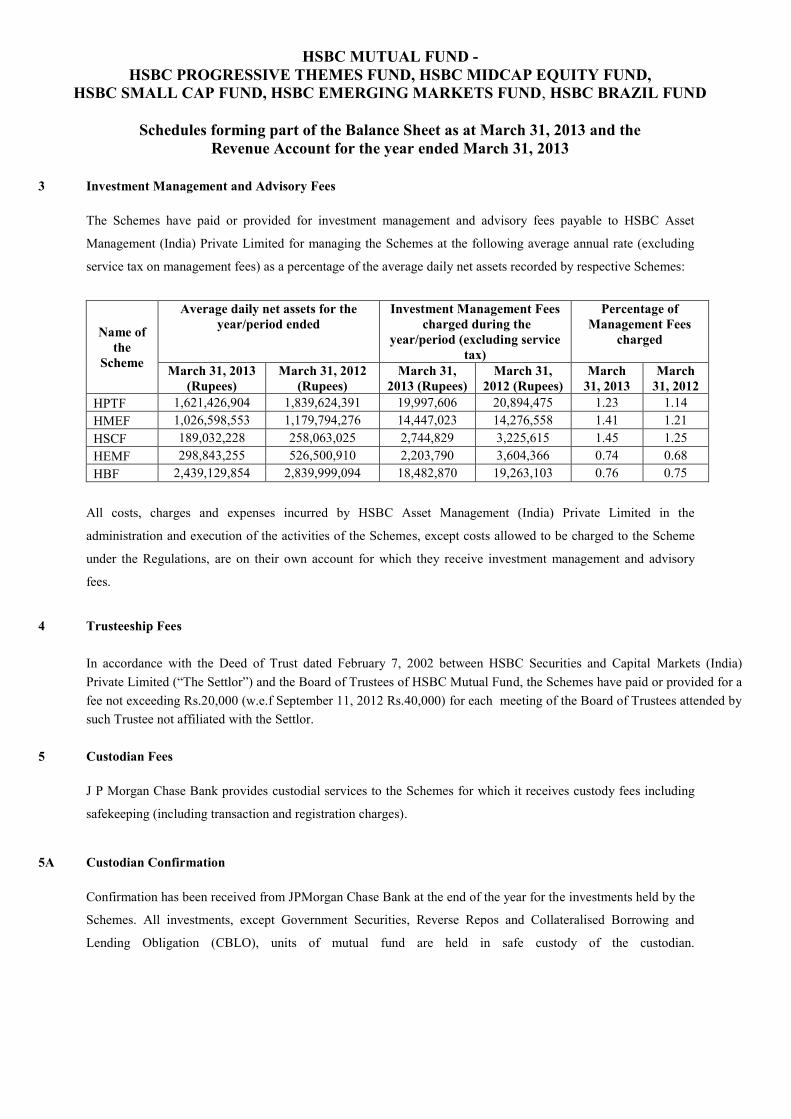
HSBC MUTUAL FUND - HSBC PROGRESSIVE THEMES FUND, HSBC MIDCAP EQUITY FUND,
HSBC SMALL CAP FUND, HSBC EMERGING MARKETS FUND, HSBC BRAZIL FUND
Schedules forming part of the Balance Sheet as at March 31, 2013 and the Revenue Account for the year ended March 31, 2013
3 Investment Management and Advisory Fees The Schemes have paid or provided for investment management and advisory fees payable to HSBC Asset
Management (India) Private Limited for managing the Schemes at the following average annual rate (excluding
service tax on management fees) as a percentage of the average daily net assets recorded by respective Schemes:
Name of the
Scheme
Average daily net assets for the year/period ended
Investment Management Fees charged during the
year/period (excluding service tax)
Percentage of Management Fees
charged
March 31, 2013 (Rupees)
March 31, 2012 (Rupees)
March 31, 2013 (Rupees)
March 31, 2012 (Rupees)
March 31, 2013
March 31, 2012
HPTF 1,621,426,904 1,839,624,391 19,997,606 20,894,475 1.23 1.14 HMEF 1,026,598,553 1,179,794,276 14,447,023 14,276,558 1.41 1.21 HSCF 189,032,228 258,063,025 2,744,829 3,225,615 1.45 1.25 HEMF 298,843,255 526,500,910 2,203,790 3,604,366 0.74 0.68 HBF 2,439,129,854 2,839,999,094 18,482,870 19,263,103 0.76 0.75
All costs, charges and expenses incurred by HSBC Asset Management (India) Private Limited in the
administration and execution of the activities of the Schemes, except costs allowed to be charged to the Scheme
under the Regulations, are on their own account for which they receive investment management and advisory
fees.
4 Trusteeship Fees
In accordance with the Deed of Trust dated February 7, 2002 between HSBC Securities and Capital Markets (India) Private Limited (“The Settlor”) and the Board of Trustees of HSBC Mutual Fund, the Schemes have paid or provided for a fee not exceeding Rs.20,000 (w.e.f September 11, 2012 Rs.40,000) for each meeting of the Board of Trustees attended by such Trustee not affiliated with the Settlor.
5 Custodian Fees J P Morgan Chase Bank provides custodial services to the Schemes for which it receives custody fees including
safekeeping (including transaction and registration charges).
5A Custodian Confirmation Confirmation has been received from JPMorgan Chase Bank at the end of the year for the investments held by the
Schemes. All investments, except Government Securities, Reverse Repos and Collateralised Borrowing and
Lending Obligation (CBLO), units of mutual fund are held in safe custody of the custodian.
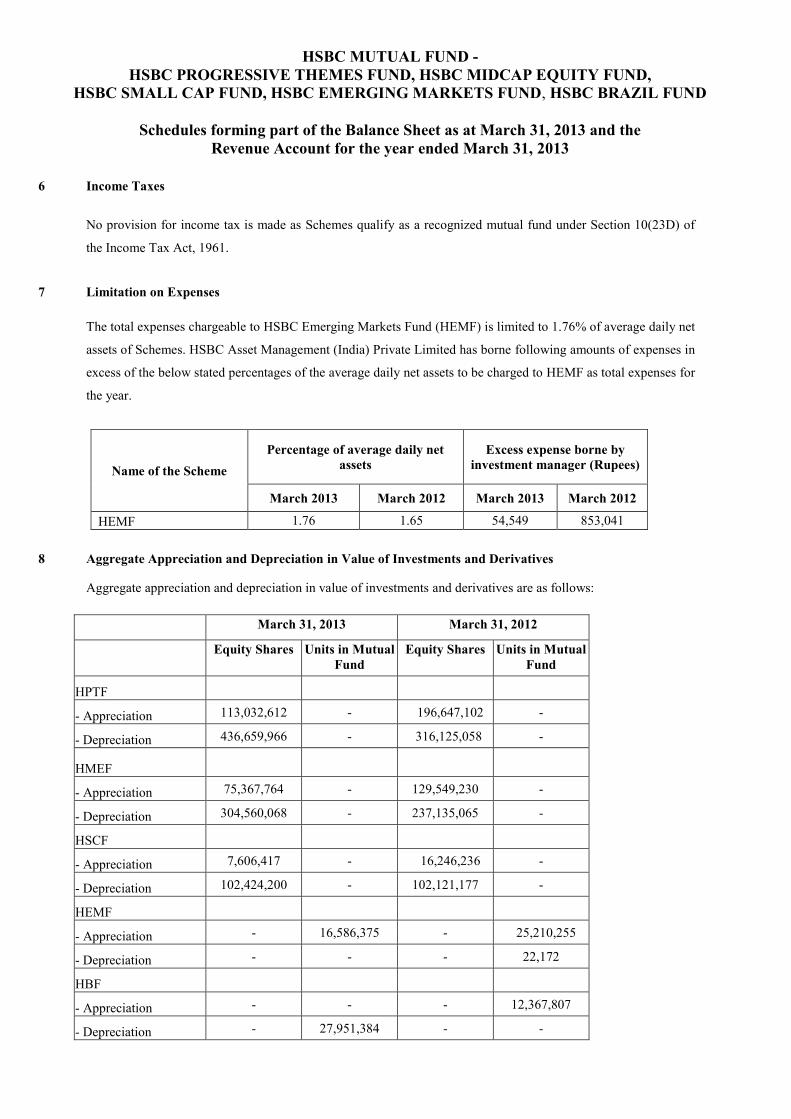
HSBC MUTUAL FUND - HSBC PROGRESSIVE THEMES FUND, HSBC MIDCAP EQUITY FUND,
HSBC SMALL CAP FUND, HSBC EMERGING MARKETS FUND, HSBC BRAZIL FUND
Schedules forming part of the Balance Sheet as at March 31, 2013 and the Revenue Account for the year ended March 31, 2013
6 Income Taxes
No provision for income tax is made as Schemes qualify as a recognized mutual fund under Section 10(23D) of
the Income Tax Act, 1961.
7 Limitation on Expenses
The total expenses chargeable to HSBC Emerging Markets Fund (HEMF) is limited to 1.76% of average daily net
assets of Schemes. HSBC Asset Management (India) Private Limited has borne following amounts of expenses in
excess of the below stated percentages of the average daily net assets to be charged to HEMF as total expenses for
the year.
Name of the Scheme Percentage of average daily net
assets Excess expense borne by
investment manager (Rupees)
March 2013 March 2012 March 2013 March 2012
HEMF 1.76 1.65 54,549 853,041 8 Aggregate Appreciation and Depreciation in Value of Investments and Derivatives
Aggregate appreciation and depreciation in value of investments and derivatives are as follows:
March 31, 2013 March 31, 2012
Equity Shares Units in Mutual Fund
Equity Shares Units in Mutual Fund
HPTF
- Appreciation 113,032,612 - 196,647,102 -
- Depreciation 436,659,966 - 316,125,058 -
HMEF
- Appreciation 75,367,764 - 129,549,230 -
- Depreciation 304,560,068 - 237,135,065 -
HSCF
- Appreciation 7,606,417 - 16,246,236 -
- Depreciation 102,424,200 - 102,121,177 -
HEMF
- Appreciation - 16,586,375 - 25,210,255
- Depreciation - - - 22,172
HBF
- Appreciation - - - 12,367,807
- Depreciation - 27,951,384 - -

HSBC MUTUAL FUND - HSBC PROGRESSIVE THEMES FUND, HSBC MIDCAP EQUITY FUND,
HSBC SMALL CAP FUND, HSBC EMERGING MARKETS FUND, HSBC BRAZIL FUND
Schedules forming part of the Balance Sheet as at March 31, 2013 and the Revenue Account for the year ended March 31, 2013
9 Aggregate Value of Purchases and Sale of Investments
The aggregate value of investment securities (excluding CBLO and Reverse Repos) purchased and sold
(including matured) during the year (excluding accretion of discount) and their percentage of the respective
average daily net assets are as follows:

HSBC MUTUAL FUND - HSBC PROGRESSIVE THEMES FUND, HSBC MIDCAP EQUITY FUND,
HSBC SMALL CAP FUND, HSBC EMERGING MARKETS FUND, HSBC BRAZIL FUND
Schedules forming part of the Balance Sheet as at March 31, 2013 and the Revenue Account for the year ended March 31, 2013
March 31, 2013 Name of the
Scheme Aggregate Purchase Aggregate Sale
Rupees
Percentage of Average Daily Net
Assets Rupees
Percentage of Average Daily Net
Assets HPTF 409,284,702 25.24 792,465,732 48.87 HMEF 358,966,528 34.97 563,798,304 54.92 HSCF 20,878,065 11.04 80,282,423 42.47 HEMF 20,876,905 6.99 340,785,692 114.03 HBF 207,241,698 8.50 1,121,144,051 45.96
March 31, 2012 Name of the
Scheme Aggregate Purchase Aggregate Sale
Rupees
Percentage of Average Daily Net
Assets Rupees
Percentage of Average Daily Net
Assets HPTF 1,031,861,963 56.09 1,132,618,152 61.57 HMEF 540,526,874 45.82 668,772,769 56.69 HSCF 37,909,079 14.69 128,834,469 49.92 HEMF 89,083,957 16.92 168,786,565 32.06 HBF 3,193,085,579 112.43 380,641,899 13.40
10 (a) Aggregate Fair Value of Non-Traded / Privately Placed Investments
Aggregate fair value of non-traded (including private placement) investments as determined by HSBC Asset
Management (India) Private Limited under the procedures approved by the Board of Trustees as at March 31,
2013 and March 31, 2012 are as follows:
March 31, 2013
Name of Scheme Company Name Fair Value (Rupees)
HSCF Orient Cement Limited 11,247,000
March 31, 2012
Name of Scheme Company Name Fair Value (Rupees)
HPTF Vardhman Special Steels Limited 1,904,473 HMEF Vardhman Special Steels Limited 951,204

HSBC MUTUAL FUND - HSBC PROGRESSIVE THEMES FUND, HSBC MIDCAP EQUITY FUND,
HSBC SMALL CAP FUND, HSBC EMERGING MARKETS FUND, HSBC BRAZIL FUND
Schedules forming part of the Balance Sheet as at March 31, 2013 and the Revenue Account for the year ended March 31, 2013
(b) Illiquid Securities The Schemes held following illiquid Securities as at March 31, 2013 and March 31, 2012:
March 31, 2013 Name of Scheme Company Name Fair Value
(Rupees) Percentage of Fair Value to
Net Assets HSCF Orient Cement Limited 11,247,000 8.17
March 31, 2012 Name of Scheme Company Name Fair Value
(Rupees) Percentage of Fair Value to
Net Assets HPTF Vardhman Special Steels Limited 1,904,473 0.10 HMEF Vardhman Special Steels Limited 951,204 0.09
11 Income and Expenses
The total income (including net profit / net of net loss on sale of investments and derivatives and including realised gain/ loss in foreign currency transactions and net change in unrealised depreciation in the value of investments and derivatives and foreign currency denominated assets and liabilities) and expenditure during the year / period are as follows:
March 31, 2013 Name of the Scheme Total Income Total Expenses
Rupees Percentage of Average Daily
Net Assets
Rupees Percentage of Average Daily Net
Assets
HPTF (103,874,868) (6.41) 41,726,400 2.57 HMEF (31,301,595) (3.05) 27,351,429 2.66 HSCF 2,792,816 1.48 5,074,305 2.68 HEMF 28,400,281 9.50 5,257,134 1.76 HBF (4,455,381) (0.18) 43,229,353 1.77
March 31, 2012
Name of the Scheme Total Income Total Expenses Rupees Percentage of
Average Daily Net Assets
Rupees Percentage of Average Daily Net
Assets
HPTF (36,289,901) (1.97) 43,887,649 2.39 HMEF (66,072,931) (5.60) 29,022,577 2.46 HSCF (40,651,479) (15.75) 6,451,229 2.50 HEMF 12,987,730 2.47 8,683,288 1.65 HBF (14,006,087) (0.54) * 42,378,834 1.65 *
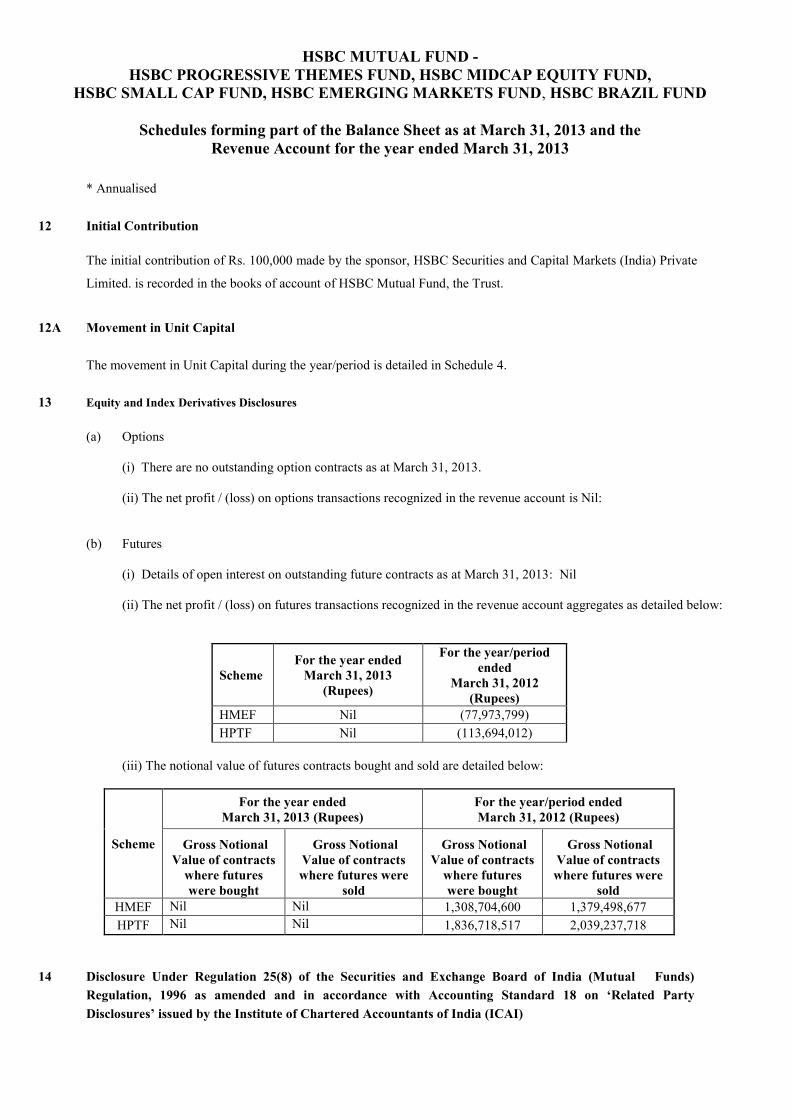
HSBC MUTUAL FUND - HSBC PROGRESSIVE THEMES FUND, HSBC MIDCAP EQUITY FUND,
HSBC SMALL CAP FUND, HSBC EMERGING MARKETS FUND, HSBC BRAZIL FUND
Schedules forming part of the Balance Sheet as at March 31, 2013 and the Revenue Account for the year ended March 31, 2013
* Annualised 12 Initial Contribution
The initial contribution of Rs. 100,000 made by the sponsor, HSBC Securities and Capital Markets (India) Private
Limited. is recorded in the books of account of HSBC Mutual Fund, the Trust.
12A Movement in Unit Capital The movement in Unit Capital during the year/period is detailed in Schedule 4. 13 Equity and Index Derivatives Disclosures
(a) Options (i) There are no outstanding option contracts as at March 31, 2013. (ii) The net profit / (loss) on options transactions recognized in the revenue account is Nil:
(b) Futures
(i) Details of open interest on outstanding future contracts as at March 31, 2013: Nil (ii) The net profit / (loss) on futures transactions recognized in the revenue account aggregates as detailed below:
Scheme For the year ended
March 31, 2013 (Rupees)
For the year/period ended
March 31, 2012 (Rupees)
HMEF Nil (77,973,799) HPTF Nil (113,694,012)
(iii) The notional value of futures contracts bought and sold are detailed below:
Scheme
For the year ended March 31, 2013 (Rupees)
For the year/period ended March 31, 2012 (Rupees)
Gross Notional Value of contracts
where futures were bought
Gross Notional Value of contracts where futures were
sold
Gross Notional Value of contracts
where futures were bought
Gross Notional Value of contracts where futures were
sold HMEF Nil Nil 1,308,704,600 1,379,498,677 HPTF Nil Nil 1,836,718,517 2,039,237,718
14 Disclosure Under Regulation 25(8) of the Securities and Exchange Board of India (Mutual Funds)
Regulation, 1996 as amended and in accordance with Accounting Standard 18 on ‘Related Party Disclosures’ issued by the Institute of Chartered Accountants of India (ICAI)
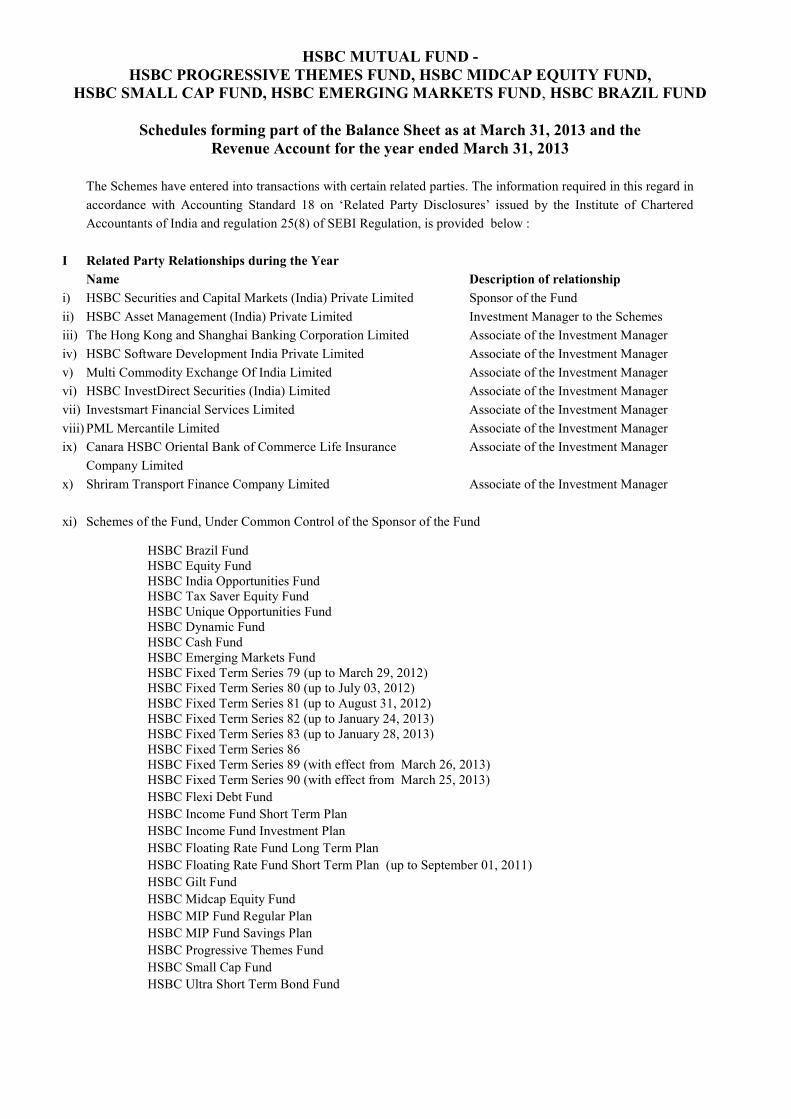
HSBC MUTUAL FUND - HSBC PROGRESSIVE THEMES FUND, HSBC MIDCAP EQUITY FUND,
HSBC SMALL CAP FUND, HSBC EMERGING MARKETS FUND, HSBC BRAZIL FUND
Schedules forming part of the Balance Sheet as at March 31, 2013 and the Revenue Account for the year ended March 31, 2013
The Schemes have entered into transactions with certain related parties. The information required in this regard in accordance with Accounting Standard 18 on ‘Related Party Disclosures’ issued by the Institute of Chartered Accountants of India and regulation 25(8) of SEBI Regulation, is provided below :
I Related Party Relationships during the Year Name Description of relationship i) HSBC Securities and Capital Markets (India) Private Limited Sponsor of the Fund ii) HSBC Asset Management (India) Private Limited Investment Manager to the Schemes iii) The Hong Kong and Shanghai Banking Corporation Limited Associate of the Investment Manager iv) HSBC Software Development India Private Limited Associate of the Investment Manager v) Multi Commodity Exchange Of India Limited Associate of the Investment Manager vi) HSBC InvestDirect Securities (India) Limited Associate of the Investment Manager vii) Investsmart Financial Services Limited Associate of the Investment Manager viii) PML Mercantile Limited Associate of the Investment Manager ix) Canara HSBC Oriental Bank of Commerce Life Insurance Associate of the Investment Manager Company Limited x) Shriram Transport Finance Company Limited Associate of the Investment Manager xi) Schemes of the Fund, Under Common Control of the Sponsor of the Fund
HSBC Brazil Fund HSBC Equity Fund HSBC India Opportunities Fund HSBC Tax Saver Equity Fund HSBC Unique Opportunities Fund HSBC Dynamic Fund HSBC Cash Fund HSBC Emerging Markets Fund HSBC Fixed Term Series 79 (up to March 29, 2012) HSBC Fixed Term Series 80 (up to July 03, 2012) HSBC Fixed Term Series 81 (up to August 31, 2012) HSBC Fixed Term Series 82 (up to January 24, 2013) HSBC Fixed Term Series 83 (up to January 28, 2013) HSBC Fixed Term Series 86 HSBC Fixed Term Series 89 (with effect from March 26, 2013) HSBC Fixed Term Series 90 (with effect from March 25, 2013) HSBC Flexi Debt Fund HSBC Income Fund Short Term Plan HSBC Income Fund Investment Plan HSBC Floating Rate Fund Long Term Plan HSBC Floating Rate Fund Short Term Plan (up to September 01, 2011) HSBC Gilt Fund HSBC Midcap Equity Fund HSBC MIP Fund Regular Plan HSBC MIP Fund Savings Plan HSBC Progressive Themes Fund HSBC Small Cap Fund HSBC Ultra Short Term Bond Fund

HSBC MUTUAL FUND - HSBC PROGRESSIVE THEMES FUND, HSBC MIDCAP EQUITY FUND,
HSBC SMALL CAP FUND, HSBC EMERGING MARKETS FUND, HSBC BRAZIL FUND
Schedules forming part of the Balance Sheet as at March 31, 2013 and the Revenue Account for the year ended March 31, 2013
xii) Key Management Personnel and their relatives:
Naina Lal Kidwai – Director and Chairman of the Investment Manager Puneet Chaddha* – Director and Chief Executive Officer of the Investment Manager Ayaz Ebrahim* – Director of the Investment Manager (up to May 13, 2011) Glen Berry* – Director of the Investment Manager (with effect from July 14, 2011 to January 11, 2012) Gaanesh Bharadhwaj* – Director of Investment Manager (with effect from May 23, 2012) Glen Berry* – Associate Trustee (with effect from March 27, 2012) Nelum P Gidwani – Associate Trustee Joanna Munro* – Associate Trustee (with effect from June 16, 2011 to December 13, 2011) Shefali Chaddha* – Relative of Key Management Personnel Rashid K Kidwai – Relative of Key Management Personnel Debra Berry* – Relative of Key Management Personnel (with effect from July 14, 2011 to January 11, 2012 and with effect from March 27, 2012) Francesca Berry* – Relative of Key Management Personnel (with effect from July 14, 2011 to January 11, 2012 and with effect from March 27, 2012) Kemaya Lal Kidwai – Relative of Key Management Personnel Devaki Chaddha* – Relative of Key Management Personnel Meera Chaddha* – Relative of Key Management Personnel Yasmin Ebrahim* – Relative of a Key Management Personnel (up to May 13, 2011) Daanyal Ebrahim* – Relative of a Key Management Personnel (up to May 13, 2011) Dominic Berry* – Relative of Key Management Personnel (with effect from July 14, 2011 to January 11, 2012 and with effect from March 27, 2012) Alexander Berry* – Relative of Key Management Personnel (with effect from July 14, 2011 to January 11, 2012 and with effect from March 27, 2012) Rahul Nelum Gidwani – Relative of Key Management Personnel Rumaan Nazir Kidwai – Relative of Key Management Personnel Avan Nelum Gidwani – Relative of Key Management Personnel Nelum Pahlaj Gidwani HUF – Relative of Key Management Personnel Birjees Kidwai – Relative of Key Management Personnel Nandini Bharadhwaj* - Relative of Key Management Personnel (with effect from May 23, 2012) * There were no transactions during the year.
II The transactions with the related parties during the year in the ordinary course of business have been listed in
Annexure I
III Details of amounts paid to associates in terms of Regulation 25 (8) are as follows Commission paid to Sponsor/AMC and its associates/related parties/group companies
Name of Scheme
Name of Sponsor/AMC and its associates/related
parties/group companies
Nature of Association / Nature of
Relation
Period Covered
Business Given [Rs. In Crores]
% of Total Business received by the Fund
Commission paid [Rs.]
% of Total commission paid by the
Fund
HPTF The Hongkong and Shanghai Banking Corporation Limited Associate 2012-2013 2.30 35.55 1,468,093 16.11
HPTF HSBC InvestDirect Securities (India) Limited Associate 2012-2013 0.00~ 0.02 21,632 0.24
HMEF The Hongkong and Shanghai Banking Corporation Limited Associate 2012-2013 10.46 60.85 1,874,815 27.09
HMEF HSBC InvestDirect Securities (India) Limited Associate 2012-2013 0.03 0.16 10,363 0.15

HSBC MUTUAL FUND - HSBC PROGRESSIVE THEMES FUND, HSBC MIDCAP EQUITY FUND,
HSBC SMALL CAP FUND, HSBC EMERGING MARKETS FUND, HSBC BRAZIL FUND
Schedules forming part of the Balance Sheet as at March 31, 2013 and the Revenue Account for the year ended March 31, 2013
Name of Scheme
Name of Sponsor/AMC and its associates/related
parties/group companies
Nature of Association / Nature of
Relation
Period Covered
Business Given [Rs. In Crores]
% of Total Business received by the Fund
Commission paid [Rs.]
% of Total commission paid by the
Fund
HSCF The Hongkong and Shanghai Banking Corporation Limited Associate 2012-2013 0.44 30.66 85,435 6.87
HSCF HSBC InvestDirect Securities (India) Limited Associate 2012-2013 - - 453 0.04
HEMF The Hongkong and Shanghai Banking Corporation Limited Associate 2012-2013 1.97 50.43 352,295 20.52
HEMF HSBC InvestDirect Securities (India) Limited Associate 2012-2013 0.00~ 0.02 1,302 0.08
HBF The Hongkong and Shanghai Banking Corporation Limited Associate 2012-2013 50.61 78.44 12,282,223 79.03
HBF HSBC InvestDirect Securities (India) Limited Associate 2012-2013 0.14 0.21 324,782 2.09
Name of Scheme
Name of Sponsor/AMC and its associates/related
parties/group companies
Nature of Association / Nature of
Relation
Period Covered
Business Given [Rs. In Crores]
% of Total Business received by the Fund
Commission paid [Rs.]
% of Total commission paid by the
Fund
HPTF The Hongkong and Shanghai Banking Corporation Limited Associate 2011-2012 0.74 9.02 1,089,732 5.76
HPTF HSBC InvestDirect Securities (India) Limited Associate 2011-2012 0.01 0.23 27,800 0.05
HMEF The Hongkong and Shanghai Banking Corporation Limited Associate 2011-2012 2.72 12.28 1,503,258 17.17
HMEF HSBC InvestDirect Securities (India) Limited Associate 2011-2012 0.01 0.06 9,967 0.11
HSCF The Hongkong and Shanghai Banking Corporation Limited Associate 2011-2012 0.03 4.00 112,303 5.90
HSCF HSBC InvestDirect Securities (India) Limited Associate 2011-2012 0.00~ 0.09 723 0.04
HEMF The Hongkong and Shanghai Banking Corporation Limited Associate 2011-2012 0.11 1.00 1,038,338 27.47
HEMF HSBC InvestDirect Securities (India) Limited Associate 2011-2012 0.01 0.10 1,952 0.05
HBF The Hongkong and Shanghai Banking Corporation Limited Associate 2011-2012 343.85 86.61 45,259,408* 83.41
HBF HSBC InvestDirect Securities (India) Limited Associate 2011-2012 10.97 2.76 1,585,497* 2.92
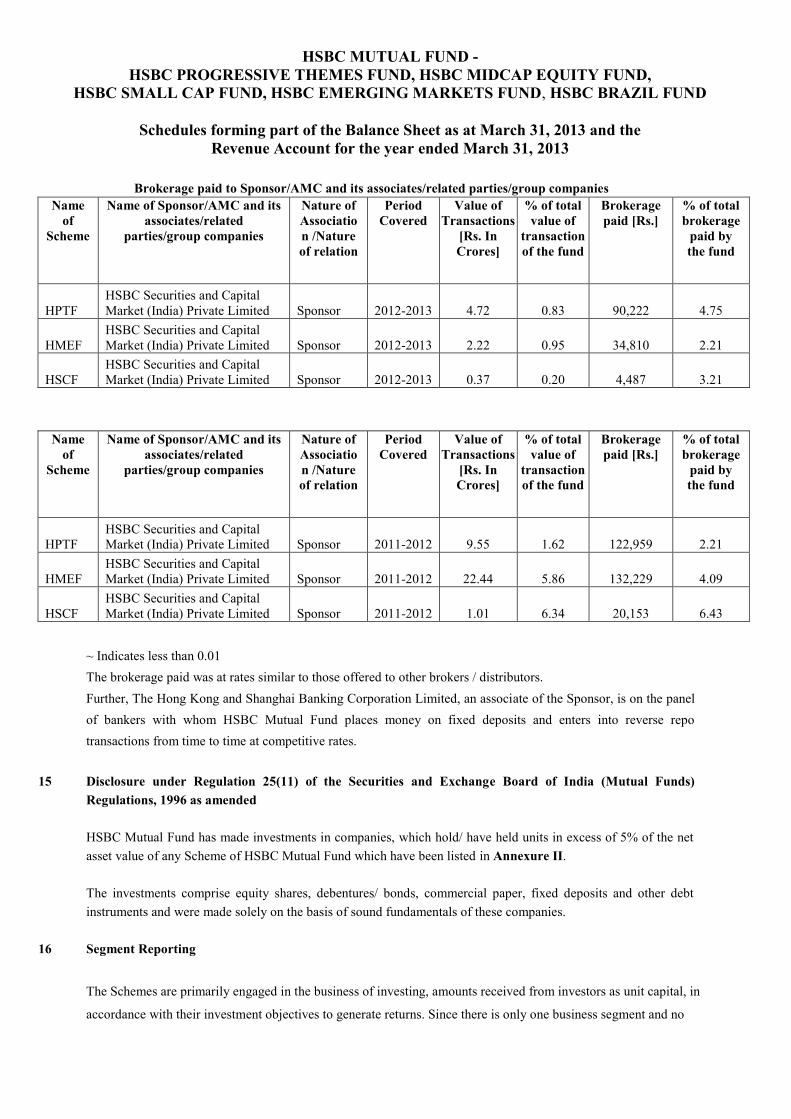
HSBC MUTUAL FUND - HSBC PROGRESSIVE THEMES FUND, HSBC MIDCAP EQUITY FUND,
HSBC SMALL CAP FUND, HSBC EMERGING MARKETS FUND, HSBC BRAZIL FUND
Schedules forming part of the Balance Sheet as at March 31, 2013 and the Revenue Account for the year ended March 31, 2013
Brokerage paid to Sponsor/AMC and its associates/related parties/group companies Name
of Scheme
Name of Sponsor/AMC and its associates/related
parties/group companies
Nature of Association /Nature of relation
Period Covered
Value of Transactions
[Rs. In Crores]
% of total value of
transaction of the fund
Brokerage paid [Rs.]
% of total brokerage
paid by the fund
HPTF HSBC Securities and Capital Market (India) Private Limited Sponsor 2012-2013 4.72 0.83 90,222 4.75
HMEF HSBC Securities and Capital Market (India) Private Limited Sponsor 2012-2013 2.22 0.95 34,810 2.21
HSCF HSBC Securities and Capital Market (India) Private Limited Sponsor 2012-2013 0.37 0.20 4,487 3.21
Name of
Scheme
Name of Sponsor/AMC and its associates/related
parties/group companies
Nature of Association /Nature of relation
Period Covered
Value of Transactions
[Rs. In Crores]
% of total value of
transaction of the fund
Brokerage paid [Rs.]
% of total brokerage
paid by the fund
HPTF HSBC Securities and Capital Market (India) Private Limited Sponsor 2011-2012 9.55 1.62 122,959 2.21
HMEF HSBC Securities and Capital Market (India) Private Limited Sponsor 2011-2012 22.44 5.86 132,229 4.09
HSCF HSBC Securities and Capital Market (India) Private Limited Sponsor 2011-2012 1.01 6.34 20,153 6.43
~ Indicates less than 0.01 The brokerage paid was at rates similar to those offered to other brokers / distributors. Further, The Hong Kong and Shanghai Banking Corporation Limited, an associate of the Sponsor, is on the panel of bankers with whom HSBC Mutual Fund places money on fixed deposits and enters into reverse repo transactions from time to time at competitive rates.
15 Disclosure under Regulation 25(11) of the Securities and Exchange Board of India (Mutual Funds) Regulations, 1996 as amended HSBC Mutual Fund has made investments in companies, which hold/ have held units in excess of 5% of the net asset value of any Scheme of HSBC Mutual Fund which have been listed in Annexure II. The investments comprise equity shares, debentures/ bonds, commercial paper, fixed deposits and other debt instruments and were made solely on the basis of sound fundamentals of these companies.
16 Segment Reporting
The Schemes are primarily engaged in the business of investing, amounts received from investors as unit capital, in
accordance with their investment objectives to generate returns. Since there is only one business segment and no
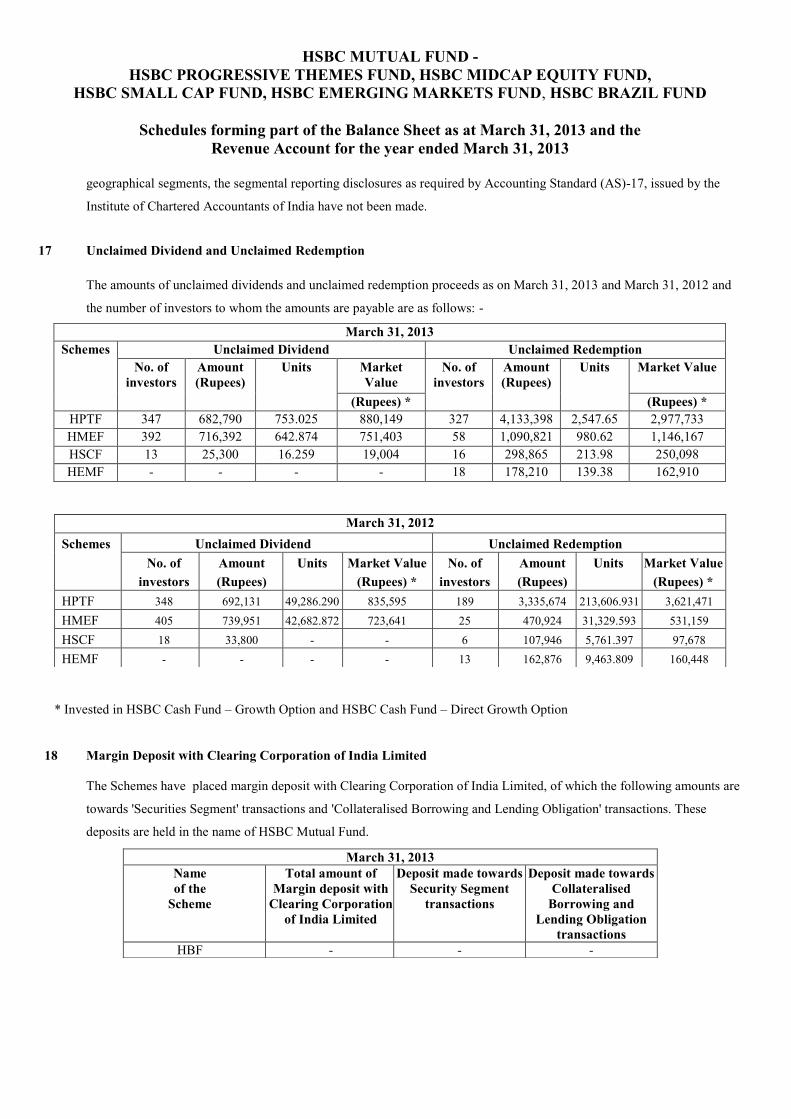
HSBC MUTUAL FUND - HSBC PROGRESSIVE THEMES FUND, HSBC MIDCAP EQUITY FUND,
HSBC SMALL CAP FUND, HSBC EMERGING MARKETS FUND, HSBC BRAZIL FUND
Schedules forming part of the Balance Sheet as at March 31, 2013 and the Revenue Account for the year ended March 31, 2013
geographical segments, the segmental reporting disclosures as required by Accounting Standard (AS)-17, issued by the
Institute of Chartered Accountants of India have not been made.
17 Unclaimed Dividend and Unclaimed Redemption
The amounts of unclaimed dividends and unclaimed redemption proceeds as on March 31, 2013 and March 31, 2012 and
the number of investors to whom the amounts are payable are as follows: -
March 31, 2013 Schemes Unclaimed Dividend Unclaimed Redemption
No. of investors
Amount (Rupees)
Units Market Value
No. of investors
Amount (Rupees)
Units Market Value
(Rupees) * (Rupees) * HPTF 347 682,790 753.025 880,149 327 4,133,398 2,547.65 2,977,733 HMEF 392 716,392 642.874 751,403 58 1,090,821 980.62 1,146,167 HSCF 13 25,300 16.259 19,004 16 298,865 213.98 250,098 HEMF - - - - 18 178,210 139.38 162,910
* Invested in HSBC Cash Fund – Growth Option and HSBC Cash Fund – Direct Growth Option 18 Margin Deposit with Clearing Corporation of India Limited
The Schemes have placed margin deposit with Clearing Corporation of India Limited, of which the following amounts are
towards 'Securities Segment' transactions and 'Collateralised Borrowing and Lending Obligation' transactions. These
deposits are held in the name of HSBC Mutual Fund.
March 31, 2012 Schemes Unclaimed Dividend Unclaimed Redemption
No. of investors
Amount (Rupees)
Units Market Value (Rupees) *
No. of investors
Amount (Rupees)
Units Market Value (Rupees) *
HPTF 348 692,131 49,286.290 835,595 189 3,335,674 213,606.931 3,621,471 HMEF 405 739,951 42,682.872 723,641 25 470,924 31,329.593 531,159 HSCF 18 33,800 - - 6 107,946 5,761.397 97,678 HEMF - - - - 13 162,876 9,463.809 160,448
March 31, 2013 Name of the
Scheme
Total amount of Margin deposit with
Clearing Corporation of India Limited
Deposit made towards Security Segment
transactions
Deposit made towards Collateralised
Borrowing and Lending Obligation
transactions HBF - - -

HSBC MUTUAL FUND - HSBC PROGRESSIVE THEMES FUND, HSBC MIDCAP EQUITY FUND,
HSBC SMALL CAP FUND, HSBC EMERGING MARKETS FUND, HSBC BRAZIL FUND
Schedules forming part of the Balance Sheet as at March 31, 2013 and the Revenue Account for the year ended March 31, 2013
19 Miscellaneous Income
Miscellaneous Income comprises of the following:
20 Net Asset Value Per Unit
The net asset value disclosed above represents the computed NAV on March 31, 2012 (non-business day), and not
the last declared NAV.
HPTF HMEF HSCF HEMF HBF Plan 2013 2012 2013 2012 2013 2012 2013 2012 2013 2012
Rupees Rupees Rupees Rupees Rupees Rupees Rupees Rupees Rupees Rupees
Growth Option
10.2116 11.3220 16.9866 18.3697 8.6077 9.0526 10.4754 9.9633 9.7534 9.9308
Dividend Option 8.6860 9.6304 9.0813 9.8208 8.0059 8.4196 10.4754 9.9633 9.7534 9.9308 Direct Plan – Growth Option 10.2383 - 17.0314 - 8.6318 - 10.5035 - 9.7767 - Direct Plan – Dividend Option 8.7084 - 9.1048 - 8.0261 - 10.5035 - 9.7767
Pursuant to SEBI circular no. CIR/IMD/DF/21/2012 dated September 13, 2012, HSBC Mutual Fund has
introduced separate plan for direct investments (i.e. investments routed without intermediary) with effect from
March 31, 2012 Name of the
Scheme
Total amount of Margin deposit with
Clearing Corporation of India Limited
Deposit made towards Security Segment
transactions
Deposit made towards Collateralised
Borrowing and Lending Obligation
transactions HBF 3,409,124 - 3,409,124
Name of the Scheme
Description of the income March 31, 2013
Amount (Rupees)
HPTF Exit load credited to the scheme 78,286 HPTF Provision for expenses written back since no longer required 208,650 HPTF IPO expenses written back 67,102 HMEF Exit load credited to the scheme 207,672 HMEF Provision for expenses written back since no longer required 110,000 HMEF IPO expenses written back 92,373 HSCF Exit load credited to the scheme 46,754 HSCF Provision for expenses written back since no longer required 37,000 HEMF Exit load credited to the scheme 183,257 HBF Exit load credited to the scheme 462,999
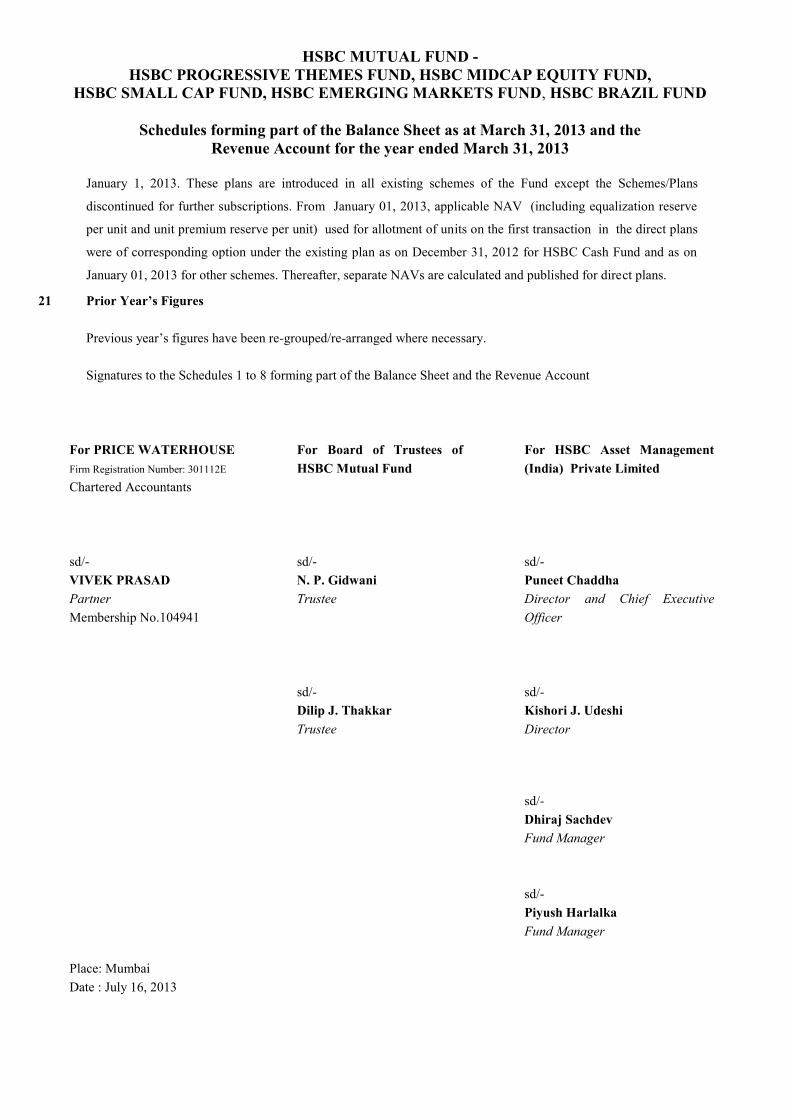
HSBC MUTUAL FUND - HSBC PROGRESSIVE THEMES FUND, HSBC MIDCAP EQUITY FUND,
HSBC SMALL CAP FUND, HSBC EMERGING MARKETS FUND, HSBC BRAZIL FUND
Schedules forming part of the Balance Sheet as at March 31, 2013 and the Revenue Account for the year ended March 31, 2013
January 1, 2013. These plans are introduced in all existing schemes of the Fund except the Schemes/Plans
discontinued for further subscriptions. From January 01, 2013, applicable NAV (including equalization reserve
per unit and unit premium reserve per unit) used for allotment of units on the first transaction in the direct plans
were of corresponding option under the existing plan as on December 31, 2012 for HSBC Cash Fund and as on
January 01, 2013 for other schemes. Thereafter, separate NAVs are calculated and published for direct plans. 21 Prior Year’s Figures
Previous year’s figures have been re-grouped/re-arranged where necessary. Signatures to the Schedules 1 to 8 forming part of the Balance Sheet and the Revenue Account
For PRICE WATERHOUSE Firm Registration Number: 301112E
Chartered Accountants
For Board of Trustees of HSBC Mutual Fund
For HSBC Asset Management (India) Private Limited
sd/- VIVEK PRASAD Partner Membership No.104941
sd/- N. P. Gidwani Trustee
sd/- Puneet Chaddha
Director and Chief Executive Officer
sd/- Dilip J. Thakkar Trustee
sd/- Kishori J. Udeshi Director
Place: Mumbai Date : July 16, 2013
sd/- Dhiraj Sachdev Fund Manager sd/- Piyush Harlalka Fund Manager
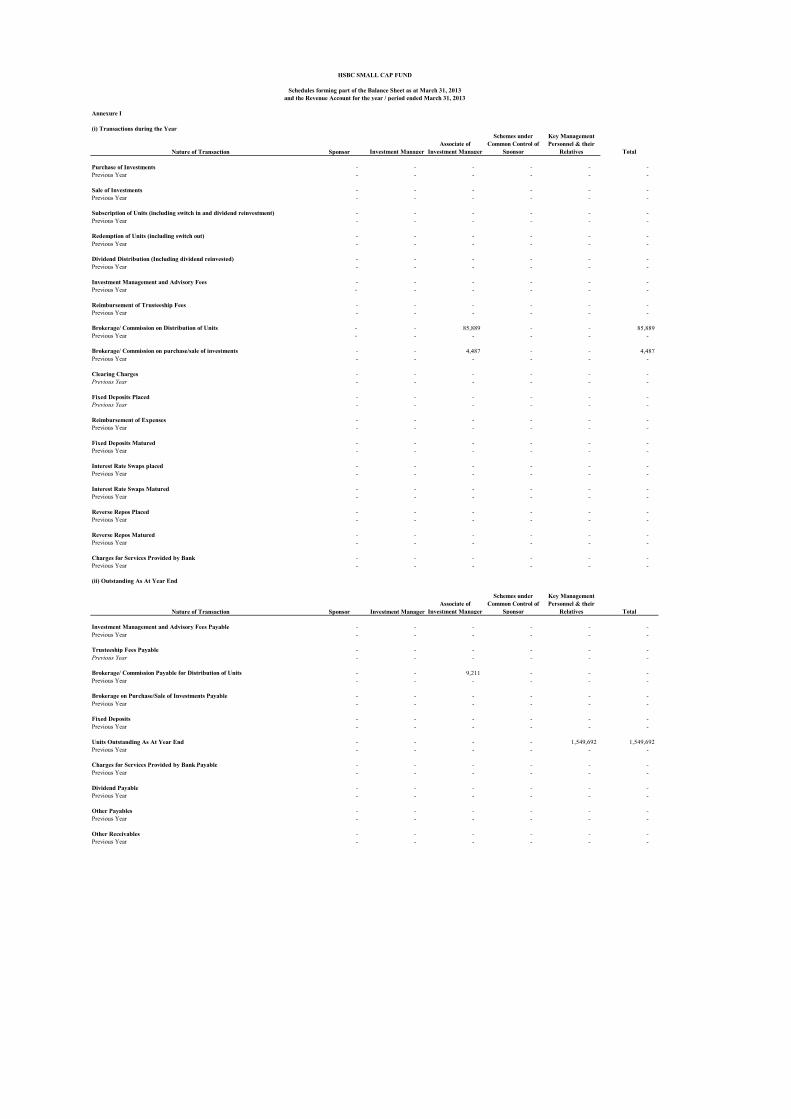
Annexure I
(i) Transactions during the Year
Nature of Transaction Sponsor Investment ManagerAssociate of
Investment Manager
Schemes under Common Control of
Sponsor
Key Management Personnel & their
Relatives Total
Purchase of Investments - - - - - - Previous Year - - - - - -
Sale of Investments - - - - - - Previous Year - - - - - -
Subscription of Units (including switch in and dividend reinvestment) - - - - - - Previous Year - - - - - -
Redemption of Units (including switch out) - - - - - - Previous Year - - - - - -
Dividend Distribution (Including dividend reinvested) - - - - - - Previous Year - - - - - -
Investment Management and Advisory Fees - - - - - - Previous Year - - - - - -
Reimbursement of Trusteeship Fees - - - - - - Previous Year - - - - - -
Brokerage/ Commission on Distribution of Units - - 85,889 - - 85,889 Previous Year - - - - - -
Brokerage/ Commission on purchase/sale of investments - - 4,487 - - 4,487 Previous Year - - - - - -
Clearing Charges - - - - - - Previous Year - - - - - -
Fixed Deposits Placed - - - - - - Previous Year - - - - - -
Reimbursement of Expenses - - - - - - Previous Year - - - - - -
Fixed Deposits Matured - - - - - - Previous Year - - - - - -
Interest Rate Swaps placed - - - - - - Previous Year - - - - - -
Interest Rate Swaps Matured - - - - - - Previous Year - - - - - -
Reverse Repos Placed - - - - - - Previous Year - - - - - -
Reverse Repos Matured - - - - - - Previous Year - - - - - -
Charges for Services Provided by Bank - - - - - - Previous Year - - - - - -
(ii) Outstanding As At Year End
Nature of Transaction Sponsor Investment ManagerAssociate of
Investment Manager
Schemes under Common Control of
Sponsor
Key Management Personnel & their
Relatives Total
Investment Management and Advisory Fees Payable - - - - - - Previous Year - - - - - -
Trusteeship Fees Payable - - - - - - Previous Year - - - - - -
Brokerage/ Commission Payable for Distribution of Units - - 9,211 - - - Previous Year - - - - - -
Brokerage on Purchase/Sale of Investments Payable - - - - - - Previous Year - - - - - -
Fixed Deposits - - - - - - Previous Year - - - - - -
Units Outstanding As At Year End - - - - 1,549,692 1,549,692 Previous Year - - - - - -
Charges for Services Provided by Bank Payable - - - - - - Previous Year - - - - - -
Dividend Payable - - - - - - Previous Year - - - - - -
Other Payables - - - - - - Previous Year - - - - - -
Other Receivables - - - - - - Previous Year - - - - - -
HSBC SMALL CAP FUND
Schedules forming part of the Balance Sheet as at March 31, 2013and the Revenue Account for the year / period ended March 31, 2013

(iii) Details of material transactions with respect to parties referred to in Note 10 (I)(iii) & (iv) for Associate of Investment Manager
April 01, 2012 to April 01, 2011 to April 01, 2011 toMarch 31, 2013 March 31, 2012 March 31, 2012
Subscription of Units (including switch in and dividend reinvestment)HSBC InvestDirect Securities (India) Limited - 0 - Investsmart Financial Services Limited - 0 -
Redemption of Units (including switch out)HSBC InvestDirect Securities (India) Limited - 0 - Investsmart Financial Services Limited - 0 -
Dividend Paid/Payable( Including dividend reinvested)HSBC Asset Management India Private Limited - 0 - HSBC Asset Management Pms Ac Signature Portfolio - 0 -
Brokerage/ Commission on Distribution of UnitsThe Hongkong and Shanghai Banking Corporation Limited 85,435 0 - HSBC InvestDirect Securities (India) Limited - 0 -
Brokerage/ Commission Payable for Distribution of UnitsThe Hongkong and Shanghai Banking Corporation Limited 9,181 0 - HSBC InvestDirect Securities (India) Limited - 0 -
Clearing ChargesThe Hongkong and Shanghai Banking Corporation Limited - 0 -
Fixed Deposits PlacedThe Hongkong and Shanghai Banking Corporation Limited - 0 -
Fixed Deposits MaturedThe Hongkong and Shanghai Banking Corporation Limited - 0 -
Fixed Deposits OutstandingThe Hongkong and Shanghai Banking Corporation Limited - 0 -
Charges for Services Provided by BankThe Hongkong and Shanghai Banking Corporation Limited - 0 -
Units Outstanding As At Year EndHSBC InvestDirect Securities (India) Limited - 0 - HSBC Asset Management India Private Limited - 0 - HSBC Asset Management PMS AC LCOP - 0 - HSBC Asset Management PMS AC Signature Portfolio - 0 -
(iv) Details of material transactions with respect to parties referred to in Note 10 (I)(v) for Schemes under common control of the Sponsor
April 01, 2012 to April 01, 2011 toMarch 31, 2013 March 31, 2012
Purchase of InvestmentsHSBC Ultra Short Term Bond Fund - - HSBC Floating Rate Fund Short Term Plan - -
Sale of InvestmentsHSBC Ultra Short Term Bond Fund - -
Subscription of Units (including switch in and dividend reinvestment)HSBC India Opportunities Fund - - HSBC Advantage India Fund - - HSBC Unique Opportunities Fund - -
Redemption of Units (including switch out)HSBC India Opportunities Fund - - HSBC Advantage India Fund - - HSBC Ultra Short Term Bond Fund (Formerly, HSBC Liquid Plus Fund) - -
Dividend Paid/Payable( Including dividend reinvested)
Clearing ChargesHSBC---- Fund - -
- - Units Outstanding As At Year EndHSBC Equity Fund - - HSBC India Opportunities Fund - - HSBC Advantage India Fund - - HSBC Unique Opportunities Fund - -
Other PayablesHSBC Equity Fund - - HSBC Floating Rate Fund - Long Term Plan - - HSBC MIP - Saving Plan - -
Other ReceivablesHSBC Unique Opportunities Fund - -
(iv) Disclosures in respect of material transactions with persons referred to in Note 10 (I)(vi) for key management personnel and their relatives
April 01, 2012 to April 01, 2011 toMarch 31, 2013 March 31, 2012
Subscription of Units (including switch in and dividend reinvestment)Sanjay Prakash - -
Redemption of Units (including switch out)Birjees Kidwai - - Naina Lal Kidwai - - Rumaan Nazir Kidwai (relative) - -
Dividend Distribution (Including dividend reinvested)Naina Lal Kidwai - - Kemaya Lal Kidwai - - Naina Lal Kidwai - - Rashid K Kidwai(Relative) - -
Units Outstanding As At Year EndPuneet Chaddha 1,549,692 -
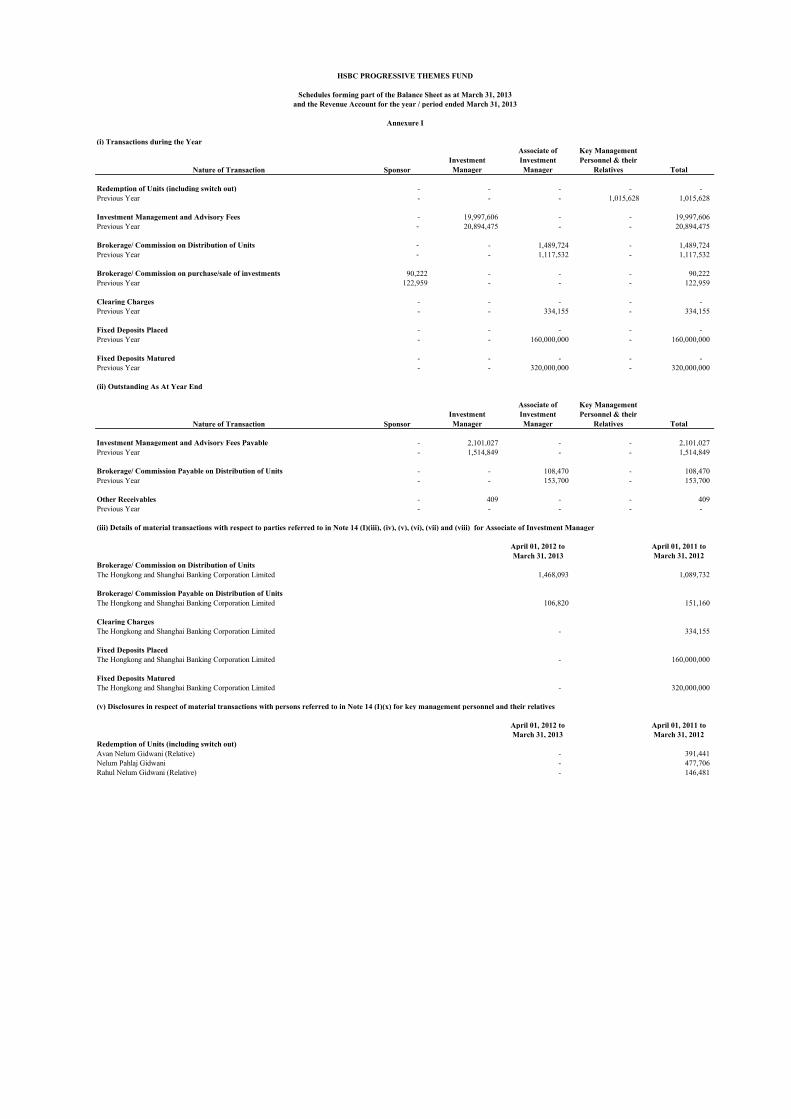
(i) Transactions during the Year
Nature of Transaction SponsorInvestment Manager
Associate of Investment Manager
Key Management Personnel & their
Relatives Total
Redemption of Units (including switch out) - - - - - Previous Year - - - 1,015,628 1,015,628
Investment Management and Advisory Fees - 19,997,606 - - 19,997,606 Previous Year - 20,894,475 - - 20,894,475
Brokerage/ Commission on Distribution of Units - - 1,489,724 - 1,489,724 Previous Year - - 1,117,532 - 1,117,532
Brokerage/ Commission on purchase/sale of investments 90,222 - - - 90,222 Previous Year 122,959 - - - 122,959
Clearing Charges - - - - - Previous Year - - 334,155 - 334,155
Fixed Deposits Placed - - - - - Previous Year - - 160,000,000 - 160,000,000
Fixed Deposits Matured - - - - - Previous Year - - 320,000,000 - 320,000,000
(ii) Outstanding As At Year End
Nature of Transaction SponsorInvestment Manager
Associate of Investment Manager
Key Management Personnel & their
Relatives Total
Investment Management and Advisory Fees Payable - 2,101,027 - - 2,101,027 Previous Year - 1,514,849 - - 1,514,849
Brokerage/ Commission Payable on Distribution of Units - - 108,470 - 108,470 Previous Year - - 153,700 - 153,700
Other Receivables - 409 - - 409 Previous Year - - - - -
(iii) Details of material transactions with respect to parties referred to in Note 14 (I)(iii), (iv), (v), (vi), (vii) and (viii) for Associate of Investment Manager
April 01, 2012 to April 01, 2011 toMarch 31, 2013 March 31, 2012
Brokerage/ Commission on Distribution of UnitsThe Hongkong and Shanghai Banking Corporation Limited 1,468,093 1,089,732
Brokerage/ Commission Payable on Distribution of UnitsThe Hongkong and Shanghai Banking Corporation Limited 106,820 151,160
Clearing ChargesThe Hongkong and Shanghai Banking Corporation Limited - 334,155
Fixed Deposits PlacedThe Hongkong and Shanghai Banking Corporation Limited - 160,000,000
Fixed Deposits MaturedThe Hongkong and Shanghai Banking Corporation Limited - 320,000,000
(v) Disclosures in respect of material transactions with persons referred to in Note 14 (I)(x) for key management personnel and their relatives
April 01, 2012 to April 01, 2011 toMarch 31, 2013 March 31, 2012
Redemption of Units (including switch out)Avan Nelum Gidwani (Relative) - 391,441 Nelum Pahlaj Gidwani - 477,706 Rahul Nelum Gidwani (Relative) - 146,481
HSBC PROGRESSIVE THEMES FUND
Schedules forming part of the Balance Sheet as at March 31, 2013and the Revenue Account for the year / period ended March 31, 2013
Annexure I
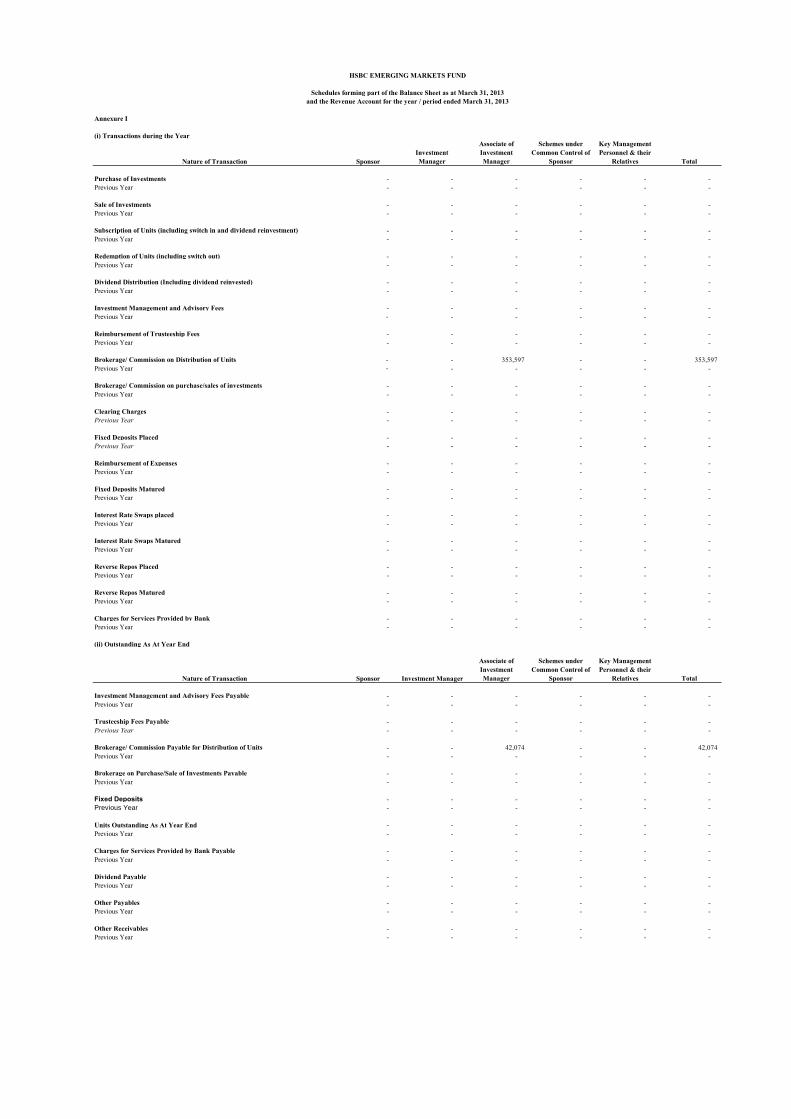
Annexure I
(i) Transactions during the Year
Nature of Transaction SponsorInvestment Manager
Associate of Investment Manager
Schemes under Common Control of
Sponsor
Key Management Personnel & their
Relatives Total
Purchase of Investments - - - - - - Previous Year - - - - - -
Sale of Investments - - - - - - Previous Year - - - - - -
Subscription of Units (including switch in and dividend reinvestment) - - - - - - Previous Year - - - - - -
Redemption of Units (including switch out) - - - - - - Previous Year - - - - - -
Dividend Distribution (Including dividend reinvested) - - - - - - Previous Year - - - - - -
Investment Management and Advisory Fees - - - - - - Previous Year - - - - - -
Reimbursement of Trusteeship Fees - - - - - - Previous Year - - - - - -
Brokerage/ Commission on Distribution of Units - - 353,597 - - 353,597 Previous Year - - - - - -
Brokerage/ Commission on purchase/sales of investments - - - - - - Previous Year - - - - - -
Clearing Charges - - - - - - Previous Year - - - - - -
Fixed Deposits Placed - - - - - - Previous Year - - - - - -
Reimbursement of Expenses - - - - - - Previous Year - - - - - -
Fixed Deposits Matured - - - - - - Previous Year - - - - - -
Interest Rate Swaps placed - - - - - - Previous Year - - - - - -
Interest Rate Swaps Matured - - - - - - Previous Year - - - - - -
Reverse Repos Placed - - - - - - Previous Year - - - - - -
Reverse Repos Matured - - - - - - Previous Year - - - - - -
Charges for Services Provided by Bank - - - - - - Previous Year - - - - - -
(ii) Outstanding As At Year End
Nature of Transaction Sponsor Investment Manager
Associate of Investment Manager
Schemes under Common Control of
Sponsor
Key Management Personnel & their
Relatives Total
Investment Management and Advisory Fees Payable - - - - - - Previous Year - - - - - -
Trusteeship Fees Payable - - - - - - Previous Year - - - - - -
Brokerage/ Commission Payable for Distribution of Units - - 42,074 - - 42,074 Previous Year - - - - - -
Brokerage on Purchase/Sale of Investments Payable - - - - - - Previous Year - - - - - -
Fixed Deposits - - - - - - Previous Year - - - - - -
Units Outstanding As At Year End - - - - - - Previous Year - - - - - -
Charges for Services Provided by Bank Payable - - - - - - Previous Year - - - - - -
Dividend Payable - - - - - - Previous Year - - - - - -
Other Payables - - - - - - Previous Year - - - - - -
Other Receivables - - - - - - Previous Year - - - - - -
HSBC EMERGING MARKETS FUND
Schedules forming part of the Balance Sheet as at March 31, 2013and the Revenue Account for the year / period ended March 31, 2013
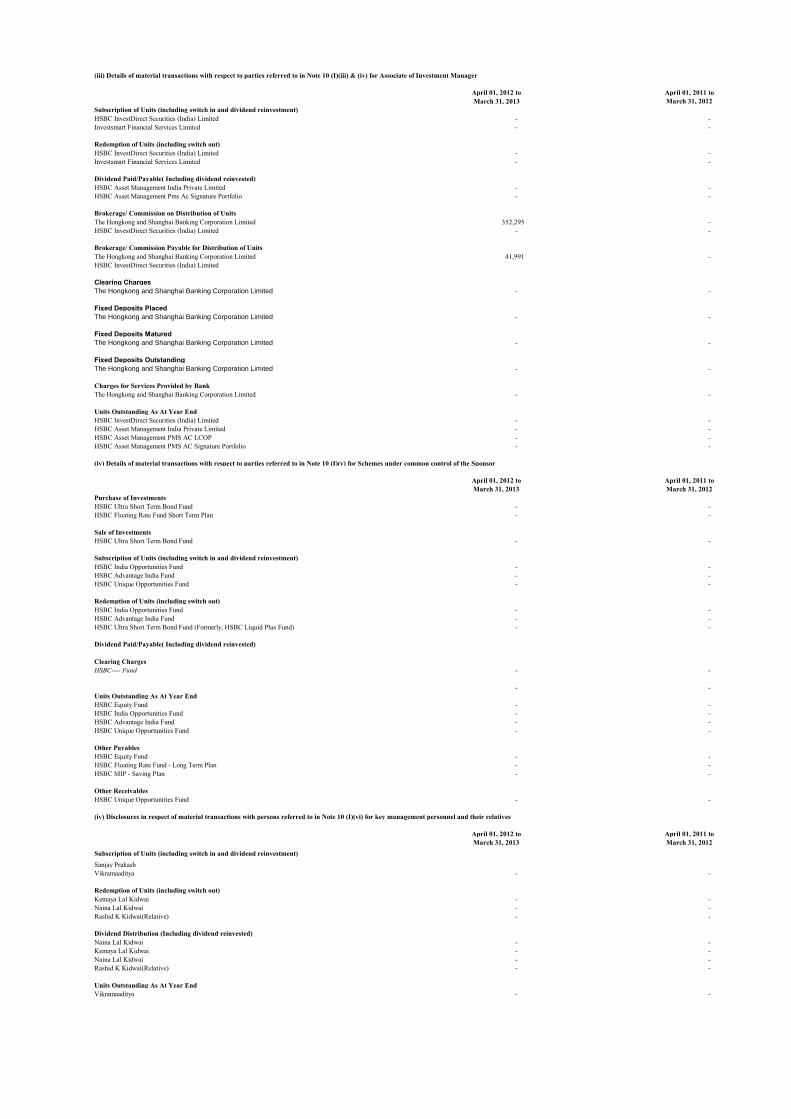
(iii) Details of material transactions with respect to parties referred to in Note 10 (I)(iii) & (iv) for Associate of Investment Manager
April 01, 2012 to April 01, 2011 toMarch 31, 2013 March 31, 2012
Subscription of Units (including switch in and dividend reinvestment)HSBC InvestDirect Securities (India) Limited - - Investsmart Financial Services Limited - -
Redemption of Units (including switch out)HSBC InvestDirect Securities (India) Limited - - Investsmart Financial Services Limited - -
Dividend Paid/Payable( Including dividend reinvested)HSBC Asset Management India Private Limited - - HSBC Asset Management Pms Ac Signature Portfolio - -
Brokerage/ Commission on Distribution of UnitsThe Hongkong and Shanghai Banking Corporation Limited 352,295 - HSBC InvestDirect Securities (India) Limited - -
Brokerage/ Commission Payable for Distribution of UnitsThe Hongkong and Shanghai Banking Corporation Limited 41,991 - HSBC InvestDirect Securities (India) Limited
Clearing ChargesThe Hongkong and Shanghai Banking Corporation Limited - -
Fixed Deposits PlacedThe Hongkong and Shanghai Banking Corporation Limited - -
Fixed Deposits MaturedThe Hongkong and Shanghai Banking Corporation Limited - -
Fixed Deposits OutstandingThe Hongkong and Shanghai Banking Corporation Limited - -
Charges for Services Provided by BankThe Hongkong and Shanghai Banking Corporation Limited - -
Units Outstanding As At Year EndHSBC InvestDirect Securities (India) Limited - - HSBC Asset Management India Private Limited - - HSBC Asset Management PMS AC LCOP - - HSBC Asset Management PMS AC Signature Portfolio - -
(iv) Details of material transactions with respect to parties referred to in Note 10 (I)(v) for Schemes under common control of the Sponsor
April 01, 2012 to April 01, 2011 toMarch 31, 2013 March 31, 2012
Purchase of InvestmentsHSBC Ultra Short Term Bond Fund - - HSBC Floating Rate Fund Short Term Plan - -
Sale of InvestmentsHSBC Ultra Short Term Bond Fund - -
Subscription of Units (including switch in and dividend reinvestment)HSBC India Opportunities Fund - - HSBC Advantage India Fund - - HSBC Unique Opportunities Fund - -
Redemption of Units (including switch out)HSBC India Opportunities Fund - - HSBC Advantage India Fund - - HSBC Ultra Short Term Bond Fund (Formerly, HSBC Liquid Plus Fund) - -
Dividend Paid/Payable( Including dividend reinvested)
Clearing ChargesHSBC---- Fund - -
- - Units Outstanding As At Year EndHSBC Equity Fund - - HSBC India Opportunities Fund - - HSBC Advantage India Fund - - HSBC Unique Opportunities Fund - -
Other PayablesHSBC Equity Fund - - HSBC Floating Rate Fund - Long Term Plan - - HSBC MIP - Saving Plan - -
Other ReceivablesHSBC Unique Opportunities Fund - -
(iv) Disclosures in respect of material transactions with persons referred to in Note 10 (I)(vi) for key management personnel and their relatives
April 01, 2012 to April 01, 2011 toMarch 31, 2013 March 31, 2012
Subscription of Units (including switch in and dividend reinvestment)Sanjay PrakashVikramaaditya - -
Redemption of Units (including switch out)Kemaya Lal Kidwai - - Naina Lal Kidwai - - Rashid K Kidwai(Relative) - -
Dividend Distribution (Including dividend reinvested)Naina Lal Kidwai - - Kemaya Lal Kidwai - - Naina Lal Kidwai - - Rashid K Kidwai(Relative) - -
Units Outstanding As At Year EndVikramaaditya - -
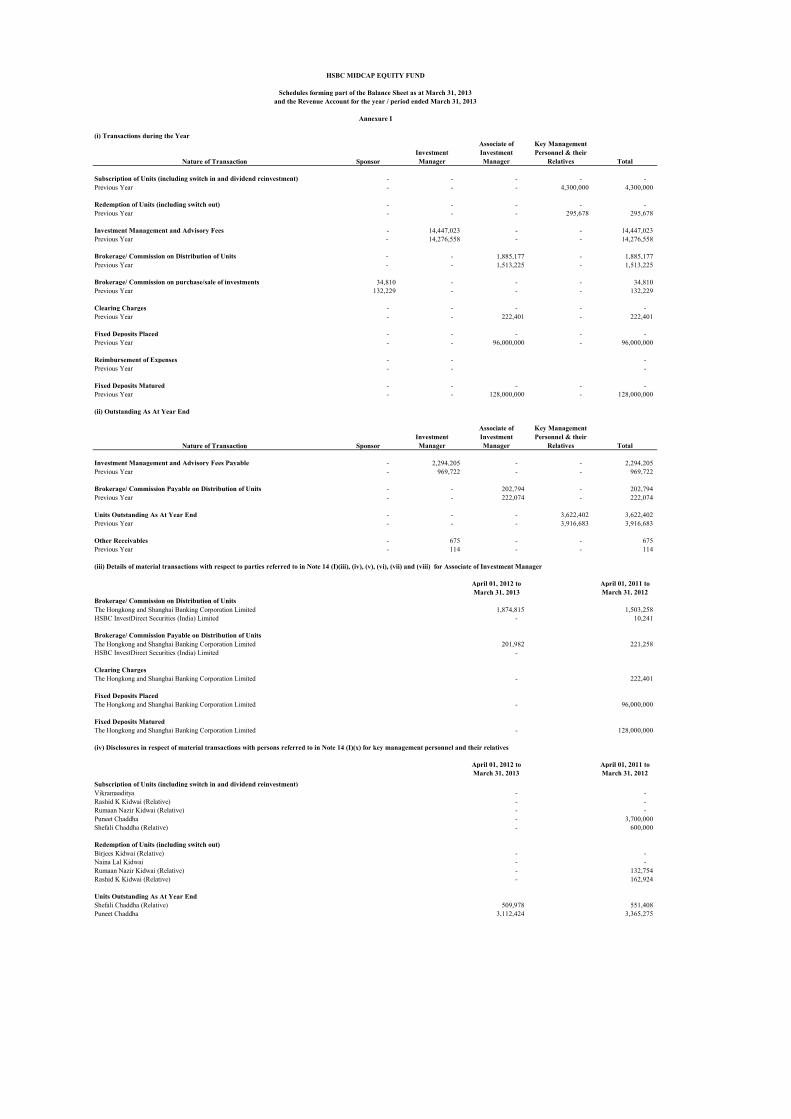
(i) Transactions during the Year
Nature of Transaction SponsorInvestment Manager
Associate of Investment Manager
Key Management Personnel & their
Relatives Total
Subscription of Units (including switch in and dividend reinvestment) - - - - - Previous Year - - - 4,300,000 4,300,000
Redemption of Units (including switch out) - - - - - Previous Year - - - 295,678 295,678
Investment Management and Advisory Fees - 14,447,023 - - 14,447,023 Previous Year - 14,276,558 - - 14,276,558
Brokerage/ Commission on Distribution of Units - - 1,885,177 - 1,885,177 Previous Year - - 1,513,225 - 1,513,225
Brokerage/ Commission on purchase/sale of investments 34,810 - - - 34,810 Previous Year 132,229 - - - 132,229
Clearing Charges - - - - - Previous Year - - 222,401 - 222,401
Fixed Deposits Placed - - - - - Previous Year - - 96,000,000 - 96,000,000
Reimbursement of Expenses - - - Previous Year - - -
Fixed Deposits Matured - - - - - Previous Year - - 128,000,000 - 128,000,000
(ii) Outstanding As At Year End
Nature of Transaction SponsorInvestment Manager
Associate of Investment Manager
Key Management Personnel & their
Relatives Total
Investment Management and Advisory Fees Payable - 2,294,205 - - 2,294,205 Previous Year - 969,722 - - 969,722
Brokerage/ Commission Payable on Distribution of Units - - 202,794 - 202,794 Previous Year - - 222,074 - 222,074
Units Outstanding As At Year End - - - 3,622,402 3,622,402 Previous Year - - - 3,916,683 3,916,683
Other Receivables - 675 - - 675 Previous Year - 114 - - 114
(iii) Details of material transactions with respect to parties referred to in Note 14 (I)(iii), (iv), (v), (vi), (vii) and (viii) for Associate of Investment Manager
April 01, 2012 to April 01, 2011 toMarch 31, 2013 March 31, 2012
Brokerage/ Commission on Distribution of UnitsThe Hongkong and Shanghai Banking Corporation Limited 1,874,815 1,503,258 HSBC InvestDirect Securities (India) Limited - 10,241
Brokerage/ Commission Payable on Distribution of UnitsThe Hongkong and Shanghai Banking Corporation Limited 201,982 221,258 HSBC InvestDirect Securities (India) Limited -
Clearing ChargesThe Hongkong and Shanghai Banking Corporation Limited - 222,401
Fixed Deposits PlacedThe Hongkong and Shanghai Banking Corporation Limited - 96,000,000
Fixed Deposits MaturedThe Hongkong and Shanghai Banking Corporation Limited - 128,000,000
(iv) Disclosures in respect of material transactions with persons referred to in Note 14 (I)(x) for key management personnel and their relatives
April 01, 2012 to April 01, 2011 toMarch 31, 2013 March 31, 2012
Subscription of Units (including switch in and dividend reinvestment)Vikramaaditya - - Rashid K Kidwai (Relative) - - Rumaan Nazir Kidwai (Relative) - - Puneet Chaddha - 3,700,000 Shefali Chaddha (Relative) - 600,000
Redemption of Units (including switch out)Birjees Kidwai (Relative) - - Naina Lal Kidwai - - Rumaan Nazir Kidwai (Relative) - 132,754 Rashid K Kidwai (Relative) - 162,924
Units Outstanding As At Year EndShefali Chaddha (Relative) 509,978 551,408 Puneet Chaddha 3,112,424 3,365,275
HSBC MIDCAP EQUITY FUND
Schedules forming part of the Balance Sheet as at March 31, 2013and the Revenue Account for the year / period ended March 31, 2013
Annexure I
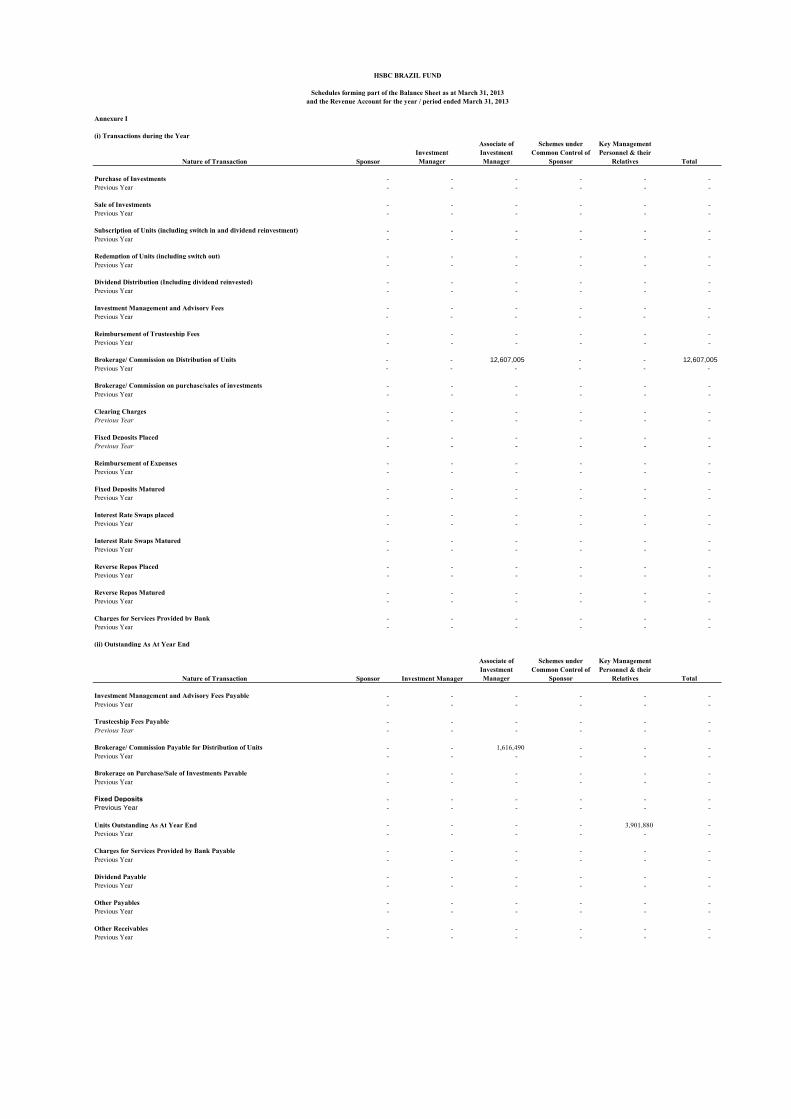
Annexure I
(i) Transactions during the Year
Nature of Transaction SponsorInvestment Manager
Associate of Investment Manager
Schemes under Common Control of
Sponsor
Key Management Personnel & their
Relatives Total
Purchase of Investments - - - - - - Previous Year - - - - - -
Sale of Investments - - - - - - Previous Year - - - - - -
Subscription of Units (including switch in and dividend reinvestment) - - - - - - Previous Year - - - - - -
Redemption of Units (including switch out) - - - - - - Previous Year - - - - - -
Dividend Distribution (Including dividend reinvested) - - - - - - Previous Year - - - - - -
Investment Management and Advisory Fees - - - - - - Previous Year - - - - - -
Reimbursement of Trusteeship Fees - - - - - - Previous Year - - - - - -
Brokerage/ Commission on Distribution of Units - - 12,607,005 - - 12,607,005
Previous Year - - - - - -
Brokerage/ Commission on purchase/sales of investments - - - - - - Previous Year - - - - - -
Clearing Charges - - - - - - Previous Year - - - - - -
Fixed Deposits Placed - - - - - - Previous Year - - - - - -
Reimbursement of Expenses - - - - - - Previous Year - - - - - -
Fixed Deposits Matured - - - - - - Previous Year - - - - - -
Interest Rate Swaps placed - - - - - - Previous Year - - - - - -
Interest Rate Swaps Matured - - - - - - Previous Year - - - - - -
Reverse Repos Placed - - - - - - Previous Year - - - - - -
Reverse Repos Matured - - - - - - Previous Year - - - - - -
Charges for Services Provided by Bank - - - - - - Previous Year - - - - - -
(ii) Outstanding As At Year End
Nature of Transaction Sponsor Investment Manager
Associate of Investment Manager
Schemes under Common Control of
Sponsor
Key Management Personnel & their
Relatives Total
Investment Management and Advisory Fees Payable - - - - - - Previous Year - - - - - -
Trusteeship Fees Payable - - - - - - Previous Year - - - - - -
Brokerage/ Commission Payable for Distribution of Units - - 1,616,490 - - - Previous Year - - - - - -
Brokerage on Purchase/Sale of Investments Payable - - - - - - Previous Year - - - - - -
Fixed Deposits - - - - - - Previous Year - - - - - -
Units Outstanding As At Year End - - - - 3,901,880 - Previous Year - - - - - -
Charges for Services Provided by Bank Payable - - - - - - Previous Year - - - - - -
Dividend Payable - - - - - - Previous Year - - - - - -
Other Payables - - - - - - Previous Year - - - - - -
Other Receivables - - - - - - Previous Year - - - - - -
HSBC BRAZIL FUND
Schedules forming part of the Balance Sheet as at March 31, 2013and the Revenue Account for the year / period ended March 31, 2013
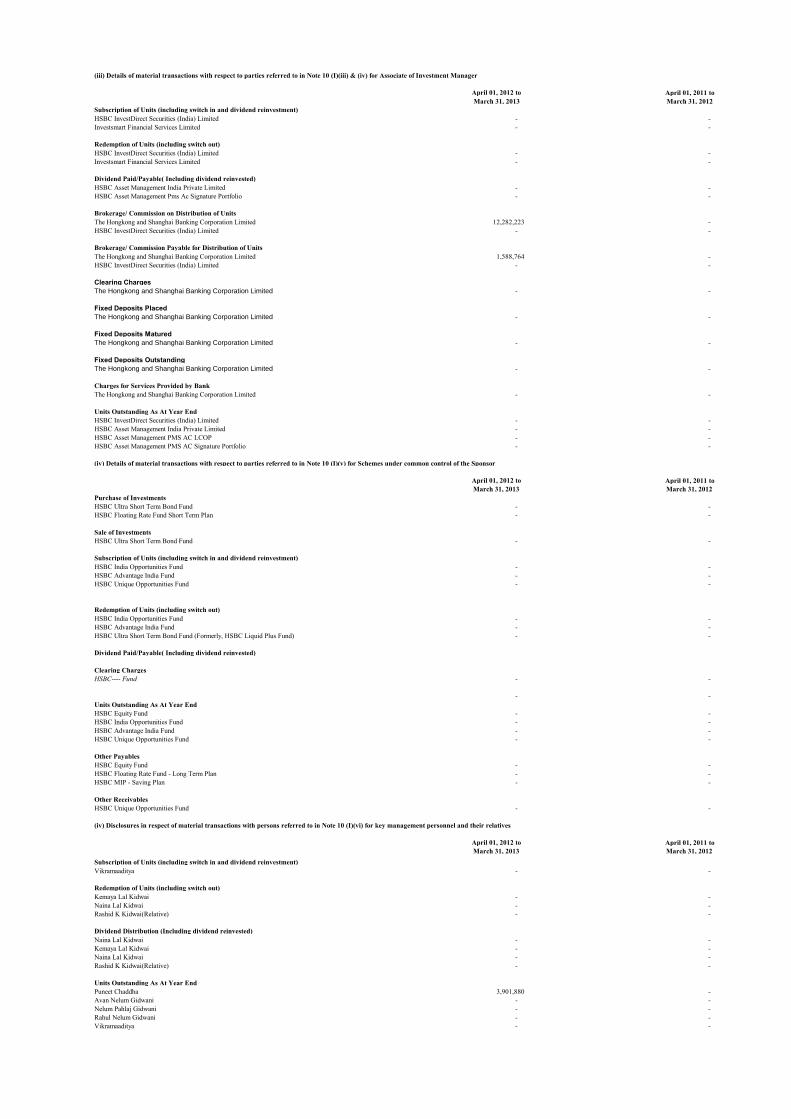
(iii) Details of material transactions with respect to parties referred to in Note 10 (I)(iii) & (iv) for Associate of Investment Manager
April 01, 2012 to April 01, 2011 toMarch 31, 2013 March 31, 2012
Subscription of Units (including switch in and dividend reinvestment)HSBC InvestDirect Securities (India) Limited - - Investsmart Financial Services Limited - -
Redemption of Units (including switch out)HSBC InvestDirect Securities (India) Limited - - Investsmart Financial Services Limited - -
Dividend Paid/Payable( Including dividend reinvested)HSBC Asset Management India Private Limited - - HSBC Asset Management Pms Ac Signature Portfolio - -
Brokerage/ Commission on Distribution of UnitsThe Hongkong and Shanghai Banking Corporation Limited 12,282,223 - HSBC InvestDirect Securities (India) Limited - -
Brokerage/ Commission Payable for Distribution of UnitsThe Hongkong and Shanghai Banking Corporation Limited 1,588,764 - HSBC InvestDirect Securities (India) Limited - -
Clearing ChargesThe Hongkong and Shanghai Banking Corporation Limited - -
Fixed Deposits PlacedThe Hongkong and Shanghai Banking Corporation Limited - -
Fixed Deposits MaturedThe Hongkong and Shanghai Banking Corporation Limited - -
Fixed Deposits OutstandingThe Hongkong and Shanghai Banking Corporation Limited - -
Charges for Services Provided by BankThe Hongkong and Shanghai Banking Corporation Limited - -
Units Outstanding As At Year EndHSBC InvestDirect Securities (India) Limited - - HSBC Asset Management India Private Limited - - HSBC Asset Management PMS AC LCOP - - HSBC Asset Management PMS AC Signature Portfolio - -
(iv) Details of material transactions with respect to parties referred to in Note 10 (I)(v) for Schemes under common control of the Sponsor
April 01, 2012 to April 01, 2011 toMarch 31, 2013 March 31, 2012
Purchase of InvestmentsHSBC Ultra Short Term Bond Fund - - HSBC Floating Rate Fund Short Term Plan - -
Sale of InvestmentsHSBC Ultra Short Term Bond Fund - -
Subscription of Units (including switch in and dividend reinvestment)HSBC India Opportunities Fund - - HSBC Advantage India Fund - - HSBC Unique Opportunities Fund - -
Redemption of Units (including switch out)HSBC India Opportunities Fund - - HSBC Advantage India Fund - - HSBC Ultra Short Term Bond Fund (Formerly, HSBC Liquid Plus Fund) - -
Dividend Paid/Payable( Including dividend reinvested)
Clearing ChargesHSBC---- Fund - -
- - Units Outstanding As At Year EndHSBC Equity Fund - - HSBC India Opportunities Fund - - HSBC Advantage India Fund - - HSBC Unique Opportunities Fund - -
Other PayablesHSBC Equity Fund - - HSBC Floating Rate Fund - Long Term Plan - - HSBC MIP - Saving Plan - -
Other ReceivablesHSBC Unique Opportunities Fund - -
(iv) Disclosures in respect of material transactions with persons referred to in Note 10 (I)(vi) for key management personnel and their relatives
April 01, 2012 to April 01, 2011 toMarch 31, 2013 March 31, 2012
Subscription of Units (including switch in and dividend reinvestment)Vikramaaditya - -
Redemption of Units (including switch out)Kemaya Lal Kidwai - - Naina Lal Kidwai - - Rashid K Kidwai(Relative) - -
Dividend Distribution (Including dividend reinvested)Naina Lal Kidwai - - Kemaya Lal Kidwai - - Naina Lal Kidwai - - Rashid K Kidwai(Relative) - -
Units Outstanding As At Year EndPuneet Chaddha 3,901,880 - Avan Nelum Gidwani - - Nelum Pahlaj Gidwani - - Rahul Nelum Gidwani - - Vikramaaditya - -

Company Name Schemes invested in by the Company
Investment made by schemes of HSBC Mutual Fund in the
company/subsidiary
Aggregate cost of acquisition during
the year ended March 31, 2013
Outstanding as at March 31, 2013(At Market / Fair
Value)
(Rupees in Lakhs) (Rupees in Lakhs)
Hindalco Industries Limited HFTS81 HDF 309.76 219.84
HIOF 514.67 366.40
HTSF 409.96 -
HUOF 93.18 64.76
Larsen & Toubro Limited HCF HDF 794.22 683.10
HFRF HEF - 1,912.68
HIOF 338.53 618.21
HMIP 365.99 -
HPTF 556.00 -
HTSF 137.77 -
HUOF 149.90 133.20
L&T Finance Limited HCF 9,110.12 -
(Subsidiary of Larsen & Toubro Limited) HFRF 4,231.84 -
HUSBF 9.87 -
Mahindra & Mahindra Limited HCF HTSF 956.77 -
Mahindra & Mahindra Financial Services Limited HCF 7,207.55 2,473.50
(Subsidiary of Mahindra & Mahindra Limited) HFRF 10,164.61 -
HIF 1,973.43 -
HMIP 2,498.35 -
HUSBF 345.73 -
Reliance Industries Limited HIF HDF 483.06 656.97
HFTS90 HEF - 2,705.15
HIOF - 699.47
HUOF - 120.57
Shriram Transport Finance Company Limited HCF HCF 1,483.40 -
HFDF 2,993.62 3,307.96
HIF 3,498.62 7,914.07
HMIP 280.88 3,080.23
Shriram Equipment Finance Company Ltd HCF 988.86 -
(Subsidiary of Shriram Transport Finance Company Limited) HFRF 1,486.31 -
United Bank of India HCF HCF 3,239.95 2,376.57
HFRF 97.33 -
HFTS80 2,498.34 -
HFTS83 1,775.75 -
HIF 3,061.35 2,578.75
HPTF 240.51 189.34
HUSBF 486.66 -
Scheme Name Scheme CodeHSBC Cash Fund HCF
HSBC Dynamic Fund HDF
HSBC Equity Fund HEF
HSBC Flexi Debt Fund HFDF
HSBC Floating Rate Fund - Long Term Plan HFRF
HSBC Fixed Term Series 79 HFTS79
HSBC Fixed Term Series 81 HFTS81
HSBC Fixed Term Series 80 HFTS80
HSBC Fixed Term Series 83 HFTS83
HSBC Income Fund HIF
HSBC India Opportunities Fund HIOF
HSBC Progressive Themes Fund HPTF
HSBC Small Cap Fund HSCF
HSBC Tax Saver Equity Fund HTSF
HSBC Ultra Short Term Bond Fund HUSBF
HSBC Fixed Term Series 90 HFTS90
HSBC MIP Fund HMIP
HSBC Unique Opportunities Fund HUOF
Annexure II
Disclosure under Regulation 25(11) of the Securities and Exchange Board of India (Mutual Funds) Regulations, 1996 as amended Investments made by the schemes of HSBC Mutual Fund in Companies or their subsidiaries that have invested more than 5%
of the net assets of any scheme
The above investments comprise equity shares, debentures / bonds, commercial papers, certificate of deposits, fixed deposits and other debt instruments. These investments have been made on account of their high credit quality and competitive yield for the investment in fixed income/ money market instruments and in case of equity shares because of
attractive valuations of these companies.

April 01, 2012 to April 01, 2011 to April 01, 2010 toMarch 31, 2013 March 31, 2012 March 31, 2011
(a) Net asset value per unit at the end of the year (Note 2.6)Growth Option 10.2116 11.3220 11.6848 Dividend Option 8.6860 9.6304 9.9391 Direct Plan - Growth Option 10.2383 N.A. N.A.Direct Plan - Dividend Option 8.7084 N.A. N.A.
(b) Gross Income
(i)income other than profit on sale of investment. 0.3122 0.2610 0.2689
(ii) income from profit on inter scheme sales/transfer of investment. - - -
(iii) income (net) from profit on sale of investments to third party 0.4192 - 3.6759
(iv) transfer of revenue account from past year’s reserve 17.2811 16.5120 -
Gross income and gains 18.0125 16.7730 3.9448
(c) Aggregate of expenses, writeoff, amortisation and charges 0.3043 1.3970 0.3820
(d) Net income 17.7082 15.3760 3.5628
(e) Net change in unrealised appreciation / (depreciation) in value (1.4890) 0.6774 (1.1495) of investments
(f) Redemption price
Highest- Growth Option 12.6761 12.4093 15.9238 - Dividend Option 10.7823 10.5553 13.5447 - Direct Plan - Growth Option 10.9785 N.A. N.A.- Direct Plan - Dividend Option - N.A. N.A.
Lowest- Growth Option 9.6862 8.1678 10.7336 - Dividend Option 8.2391 6.9475 9.1300 - Direct Plan - Growth Option 10.9785 N.A. N.A.- Direct Plan - Dividend Option - N.A. N.A.
(g) Purchase price
Highest- Growth Option 12.6761 12.4093 15.9238 - Dividend Option 10.7823 10.5553 13.5447 - Direct Plan - Growth Option 12.6088 N.A. N.A.- Direct Plan - Dividend Option 10.7021 N.A. N.A.
Lowest- Growth Option 9.6862 8.1678 10.7336 - Dividend Option 8.2687 6.9475 9.1300 - Direct Plan - Growth Option 10.0409 N.A. N.A.- Direct Plan - Dividend Option 8.5404 N.A. N.A.
(h) Price earnings ratio NA NA NA
(i) Ratio of expenses (excluding initial issue expenses ) to average daily net assets by percentageRegular 2.57% 2.39% 2.22%Direct 1.95% NA NA
(j) Ratio of gross income (including net loss on sale of -6.41% -1.97% 18.20%investments and net unrealised depreciation in value of investments) to average daily net assets by percentage
* The above per unit calculations are based on the number of units in issue at the end of the financial year
HSBC PROGRESSIVE THEMES FUND
HISTORICAL PER UNIT STATISTICS*
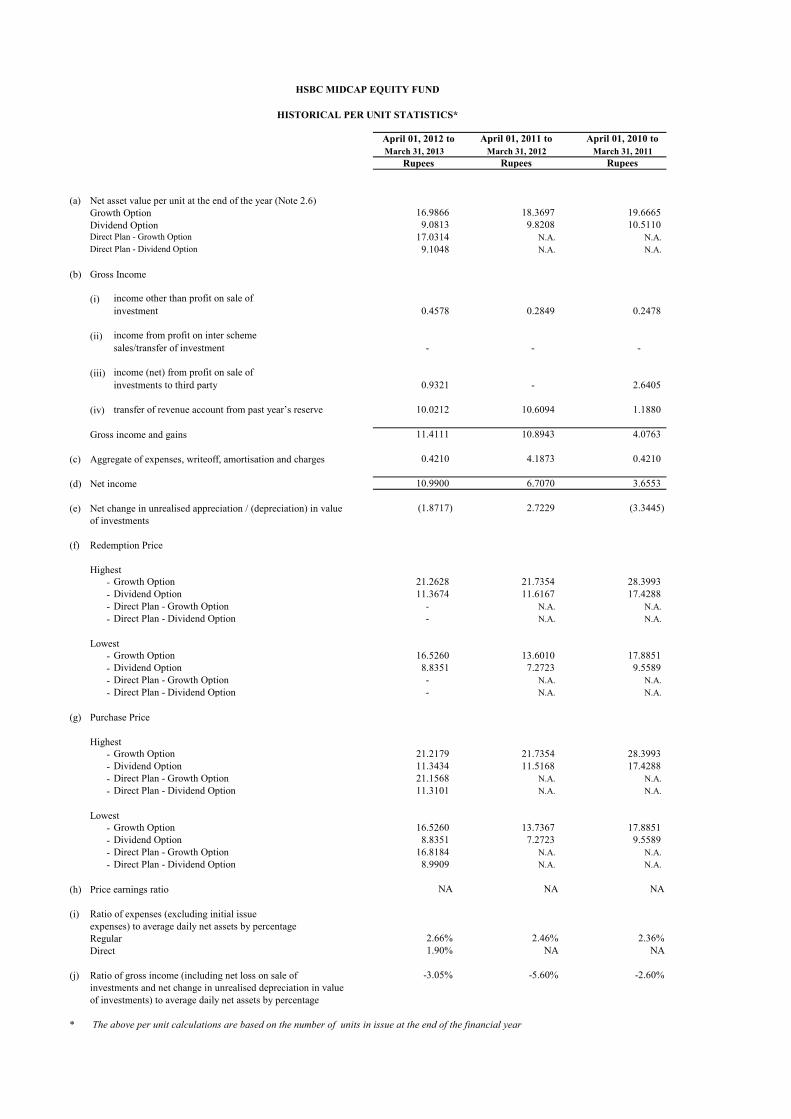
April 01, 2011 to April 01, 2010 toMarch 31, 2013 March 31, 2012 March 31, 2011
Rupees Rupees
(a) Net asset value per unit at the end of the year (Note 2.6)Growth Option 16.9866 18.3697 19.6665 Dividend Option 9.0813 9.8208 10.5110 Direct Plan - Growth Option 17.0314 N.A. N.A.Direct Plan - Dividend Option 9.1048 N.A. N.A.
(b) Gross Income
(i) income other than profit on sale of investment 0.4578 0.2849 0.2478
(ii) income from profit on inter scheme sales/transfer of investment - - -
(iii) income (net) from profit on sale of investments to third party 0.9321 - 2.6405
(iv) transfer of revenue account from past year’s reserve 10.0212 10.6094 1.1880
Gross income and gains 11.4111 10.8943 4.0763
(c) Aggregate of expenses, writeoff, amortisation and charges 0.4210 4.1873 0.4210
(d) Net income 10.9900 6.7070 3.6553
(e) Net change in unrealised appreciation / (depreciation) in value (1.8717) 2.7229 (3.3445) of investments
(f) Redemption Price
Highest- Growth Option 21.2628 21.7354 28.3993 - Dividend Option 11.3674 11.6167 17.4288 - Direct Plan - Growth Option - N.A. N.A.- Direct Plan - Dividend Option - N.A. N.A.
Lowest- Growth Option 16.5260 13.6010 17.8851 - Dividend Option 8.8351 7.2723 9.5589 - Direct Plan - Growth Option - N.A. N.A.- Direct Plan - Dividend Option - N.A. N.A.
(g) Purchase Price
Highest- Growth Option 21.2179 21.7354 28.3993 - Dividend Option 11.3434 11.5168 17.4288 - Direct Plan - Growth Option 21.1568 N.A. N.A.- Direct Plan - Dividend Option 11.3101 N.A. N.A.
Lowest- Growth Option 16.5260 13.7367 17.8851 - Dividend Option 8.8351 7.2723 9.5589 - Direct Plan - Growth Option 16.8184 N.A. N.A.- Direct Plan - Dividend Option 8.9909 N.A. N.A.
(h) Price earnings ratio NA NA NA
(i) Ratio of expenses (excluding initial issue expenses) to average daily net assets by percentageRegular 2.66% 2.46% 2.36%Direct 1.90% NA NA
(j) Ratio of gross income (including net loss on sale of -3.05% -5.60% -2.60%investments and net change in unrealised depreciation in valueof investments) to average daily net assets by percentage
* The above per unit calculations are based on the number of units in issue at the end of the financial year
HSBC MIDCAP EQUITY FUND
HISTORICAL PER UNIT STATISTICS*
April 01, 2012 to
Rupees
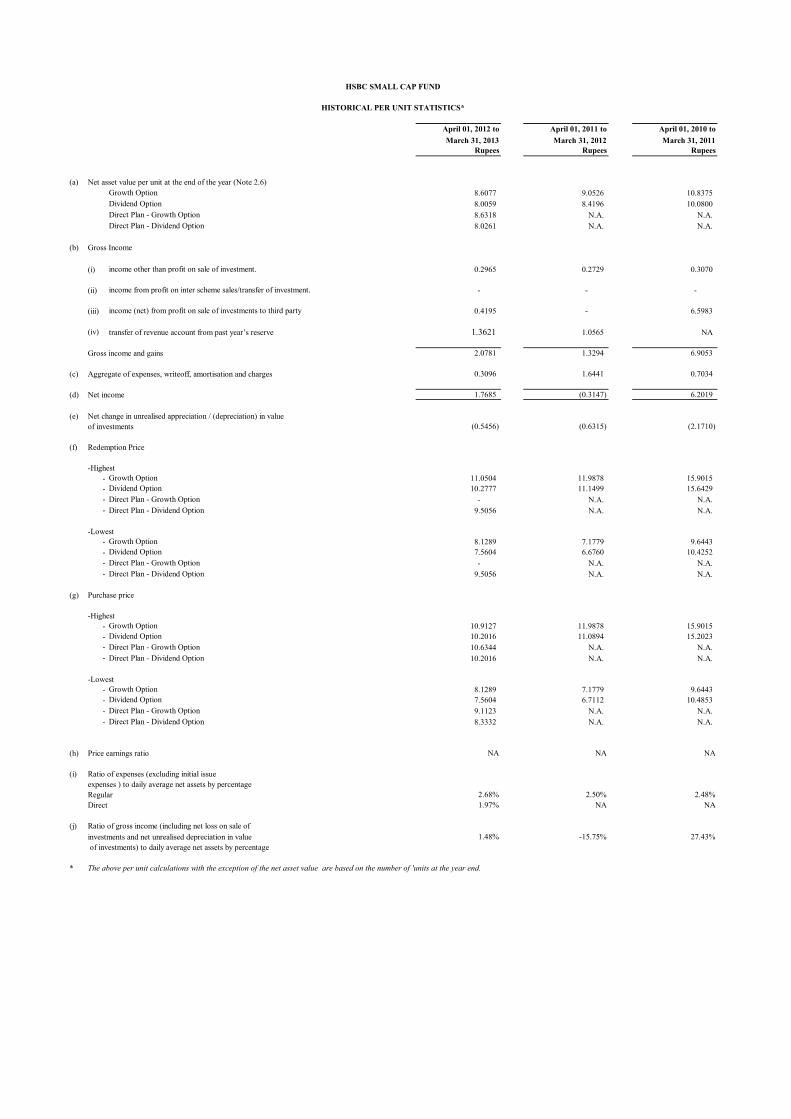
April 01, 2012 to April 01, 2011 to April 01, 2010 toMarch 31, 2013 March 31, 2012 March 31, 2011
Rupees Rupees Rupees
(a) Net asset value per unit at the end of the year (Note 2.6)Growth Option 8.6077 9.0526 10.8375 Dividend Option 8.0059 8.4196 10.0800 Direct Plan - Growth Option 8.6318 N.A. N.A.Direct Plan - Dividend Option 8.0261 N.A. N.A.
(b) Gross Income
(i) income other than profit on sale of investment. 0.2965 0.2729 0.3070
(ii) income from profit on inter scheme sales/transfer of investment. - - -
(iii) income (net) from profit on sale of investments to third party 0.4195 - 6.5983
(iv) transfer of revenue account from past year’s reserve 1.3621 1.0565 NA
Gross income and gains 2.0781 1.3294 6.9053
(c) Aggregate of expenses, writeoff, amortisation and charges 0.3096 1.6441 0.7034
(d) Net income 1.7685 (0.3147) 6.2019
(e) Net change in unrealised appreciation / (depreciation) in valueof investments (0.5456) (0.6315) (2.1710)
(f) Redemption Price
-Highest- Growth Option 11.0504 11.9878 15.9015 - Dividend Option 10.2777 11.1499 15.6429 - Direct Plan - Growth Option - N.A. N.A.- Direct Plan - Dividend Option 9.5056 N.A. N.A.
-Lowest- Growth Option 8.1289 7.1779 9.6443 - Dividend Option 7.5604 6.6760 10.4252 - Direct Plan - Growth Option - N.A. N.A.- Direct Plan - Dividend Option 9.5056 N.A. N.A.
(g) Purchase price
-Highest- Growth Option 10.9127 11.9878 15.9015 - Dividend Option 10.2016 11.0894 15.2023 - Direct Plan - Growth Option 10.6344 N.A. N.A.- Direct Plan - Dividend Option 10.2016 N.A. N.A.
-Lowest- Growth Option 8.1289 7.1779 9.6443 - Dividend Option 7.5604 6.7112 10.4853 - Direct Plan - Growth Option 9.1123 N.A. N.A.- Direct Plan - Dividend Option 8.3332 N.A. N.A.
(h) Price earnings ratio NA NA NA
(i) Ratio of expenses (excluding initial issue expenses ) to daily average net assets by percentageRegular 2.68% 2.50% 2.48%Direct 1.97% NA NA
(j) Ratio of gross income (including net loss on sale of investments and net unrealised depreciation in value 1.48% -15.75% 27.43% of investments) to daily average net assets by percentage
*
HSBC SMALL CAP FUND
HISTORICAL PER UNIT STATISTICS*
The above per unit calculations with the exception of the net asset value are based on the number of 'units at the year end.
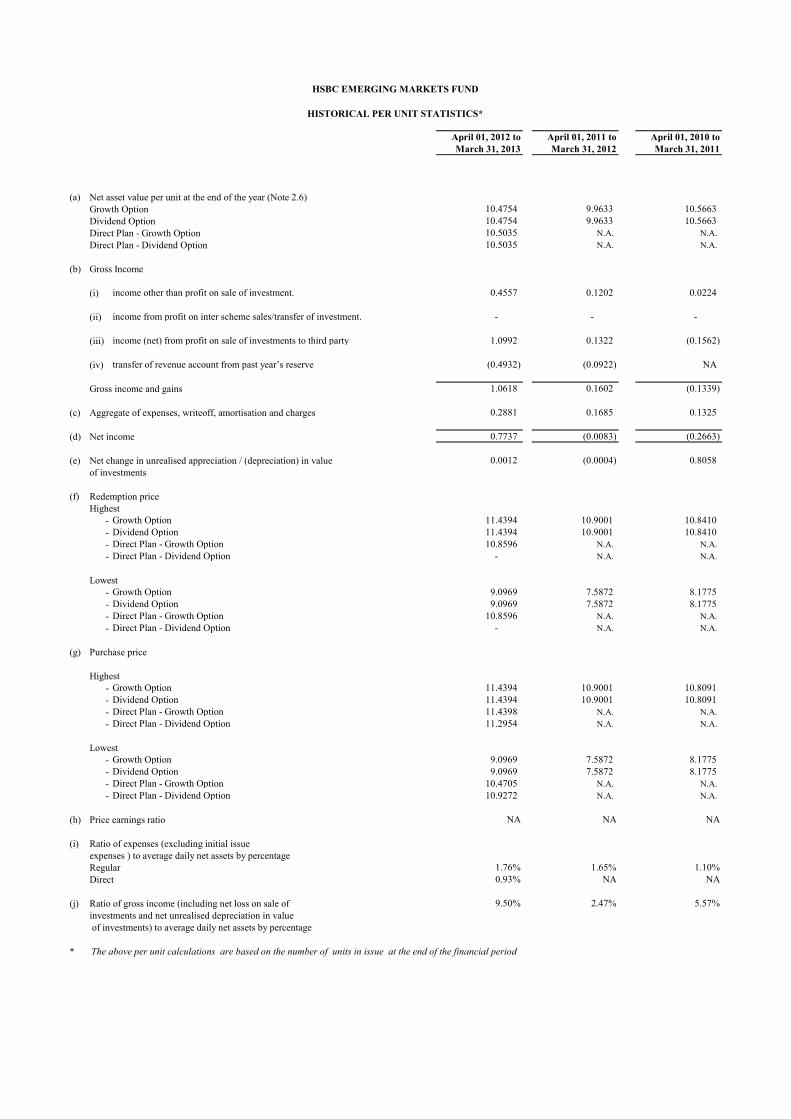
April 01, 2012 to April 01, 2011 to April 01, 2010 toMarch 31, 2013 March 31, 2012 March 31, 2011
(a) Net asset value per unit at the end of the year (Note 2.6)Growth Option 10.4754 9.9633 10.5663 Dividend Option 10.4754 9.9633 10.5663 Direct Plan - Growth Option 10.5035 N.A. N.A.Direct Plan - Dividend Option 10.5035 N.A. N.A.
(b) Gross Income
(i) income other than profit on sale of investment. 0.4557 0.1202 0.0224
(ii) income from profit on inter scheme sales/transfer of investment. - - -
(iii) income (net) from profit on sale of investments to third party 1.0992 0.1322 (0.1562)
(iv) transfer of revenue account from past year’s reserve (0.4932) (0.0922) NA
Gross income and gains 1.0618 0.1602 (0.1339)
(c) Aggregate of expenses, writeoff, amortisation and charges 0.2881 0.1685 0.1325
(d) Net income 0.7737 (0.0083) (0.2663)
(e) Net change in unrealised appreciation / (depreciation) in value 0.0012 (0.0004) 0.8058 of investments
(f) Redemption priceHighest
- Growth Option 11.4394 10.9001 10.8410 - Dividend Option 11.4394 10.9001 10.8410 - Direct Plan - Growth Option 10.8596 N.A. N.A.- Direct Plan - Dividend Option - N.A. N.A.
Lowest- Growth Option 9.0969 7.5872 8.1775 - Dividend Option 9.0969 7.5872 8.1775 - Direct Plan - Growth Option 10.8596 N.A. N.A.- Direct Plan - Dividend Option - N.A. N.A.
(g) Purchase price
Highest- Growth Option 11.4394 10.9001 10.8091 - Dividend Option 11.4394 10.9001 10.8091 - Direct Plan - Growth Option 11.4398 N.A. N.A.- Direct Plan - Dividend Option 11.2954 N.A. N.A.
Lowest- Growth Option 9.0969 7.5872 8.1775 - Dividend Option 9.0969 7.5872 8.1775 - Direct Plan - Growth Option 10.4705 N.A. N.A.- Direct Plan - Dividend Option 10.9272 N.A. N.A.
(h) Price earnings ratio NA NA NA
(i) Ratio of expenses (excluding initial issue expenses ) to average daily net assets by percentageRegular 1.76% 1.65% 1.10%Direct 0.93% NA NA
(j) Ratio of gross income (including net loss on sale of 9.50% 2.47% 5.57%investments and net unrealised depreciation in value of investments) to average daily net assets by percentage
* The above per unit calculations are based on the number of units in issue at the end of the financial period
HSBC EMERGING MARKETS FUND
HISTORICAL PER UNIT STATISTICS*
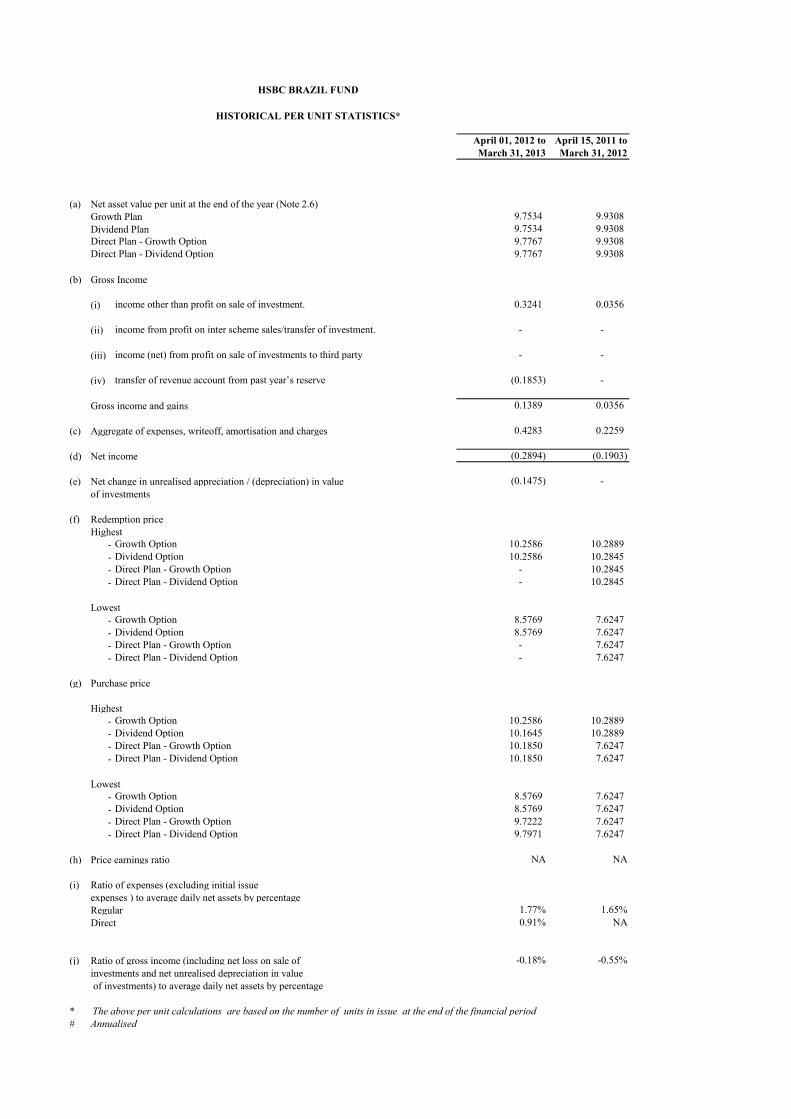
April 01, 2012 to April 15, 2011 toMarch 31, 2013 March 31, 2012
(a) Net asset value per unit at the end of the year (Note 2.6)Growth Plan 9.7534 9.9308 Dividend Plan 9.7534 9.9308 Direct Plan - Growth Option 9.7767 9.9308 Direct Plan - Dividend Option 9.7767 9.9308
(b) Gross Income
(i) income other than profit on sale of investment. 0.3241 0.0356
(ii) income from profit on inter scheme sales/transfer of investment. - -
(iii) income (net) from profit on sale of investments to third party - -
(iv) transfer of revenue account from past year’s reserve (0.1853) -
Gross income and gains 0.1389 0.0356
(c) Aggregate of expenses, writeoff, amortisation and charges 0.4283 0.2259
(d) Net income (0.2894) (0.1903)
(e) Net change in unrealised appreciation / (depreciation) in value (0.1475) - of investments
(f) Redemption priceHighest
- Growth Option 10.2586 10.2889 - Dividend Option 10.2586 10.2845 - Direct Plan - Growth Option - 10.2845 - Direct Plan - Dividend Option - 10.2845
Lowest- Growth Option 8.5769 7.6247 - Dividend Option 8.5769 7.6247 - Direct Plan - Growth Option - 7.6247 - Direct Plan - Dividend Option - 7.6247
(g) Purchase price
Highest- Growth Option 10.2586 10.2889 - Dividend Option 10.1645 10.2889 - Direct Plan - Growth Option 10.1850 7.6247 - Direct Plan - Dividend Option 10.1850 7.6247
Lowest- Growth Option 8.5769 7.6247 - Dividend Option 8.5769 7.6247 - Direct Plan - Growth Option 9.7222 7.6247 - Direct Plan - Dividend Option 9.7971 7.6247
(h) Price earnings ratio NA NA
(i) Ratio of expenses (excluding initial issue expenses ) to average daily net assets by percentageRegular 1.77% 1.65%Direct 0.91% NA
(j) Ratio of gross income (including net loss on sale of -0.18% -0.55%investments and net unrealised depreciation in value of investments) to average daily net assets by percentage
* The above per unit calculations are based on the number of units in issue at the end of the financial period# Annualised
HSBC BRAZIL FUND
HISTORICAL PER UNIT STATISTICS*

► INDEX HSBC Floating Rate Fund HSBC Ultra Short Term Bond Fund HSBC Cash Fund
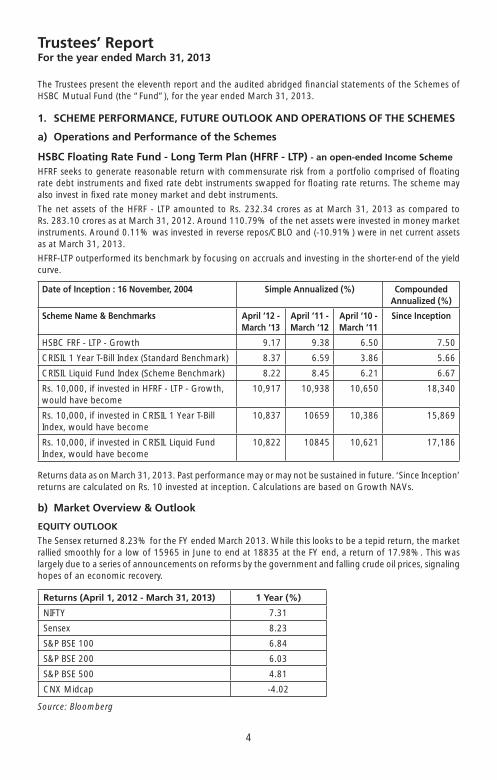
4
HSBC FLOATING RATE FUND - LONG TERM PLAN
Trustees’ ReportFor the year ended March 31, 2013
The Trustees present the eleventh report and the audited abridged fi nancial statements of the Schemes of HSBC Mutual Fund (the “Fund”), for the year ended March 31, 2013.
1. SCHEME PERFORMANCE, FUTURE OUTLOOK AND OPERATIONS OF THE SCHEMES
a) Operations and Performance of the Schemes
HSBC Floating Rate Fund - Long Term Plan (HFRF - LTP) - an open-ended Income Scheme
HFRF seeks to generate reasonable return with commensurate risk from a portfolio comprised of fl oating rate debt instruments and fi xed rate debt instruments swapped for fl oating rate returns. The scheme may also invest in fi xed rate money market and debt instruments.
The net assets of the HFRF - LTP amounted to Rs. 232.34 crores as at March 31, 2013 as compared to Rs. 283.10 crores as at March 31, 2012. Around 110.79% of the net assets were invested in money market instruments. Around 0.11% was invested in reverse repos/CBLO and (-10.91%) were in net current assets as at March 31, 2013.
HFRF-LTP outperformed its benchmark by focusing on accruals and investing in the shorter-end of the yield curve.
Date of Inception : 16 November, 2004 Simple Annualized (%) Compounded Annualized (%)
Scheme Name & Benchmarks April ‘12 - March ‘13
April ‘11 - March ‘12
April ‘10 - March ‘11
Since Inception
HSBC FRF - LTP - Growth 9.17 9.38 6.50 7.50
CRISIL 1 Year T-Bill Index (Standard Benchmark) 8.37 6.59 3.86 5.66
CRISIL Liquid Fund Index (Scheme Benchmark) 8.22 8.45 6.21 6.67
Rs. 10,000, if invested in HFRF - LTP - Growth, would have become
10,917 10,938 10,650 18,340
Rs. 10,000, if invested in CRISIL 1 Year T-Bill Index, would have become
10,837 10659 10,386 15,869
Rs. 10,000, if invested in CRISIL Liquid Fund Index, would have become
10,822 10845 10,621 17,186
Returns data as on March 31, 2013. Past performance may or may not be sustained in future. ‘Since Inception’ returns are calculated on Rs. 10 invested at inception. Calculations are based on Growth NAVs.
b) Market Overview & Outlook
EQUITY OUTLOOK
The Sensex returned 8.23% for the FY ended March 2013. While this looks to be a tepid return, the market rallied smoothly for a low of 15965 in June to end at 18835 at the FY end, a return of 17.98%. This was largely due to a series of announcements on reforms by the government and falling crude oil prices, signaling hopes of an economic recovery.
Returns (April 1, 2012 - March 31, 2013) 1 Year (%)
NIFTY 7.31
Sensex 8.23
S&P BSE 100 6.84
S&P BSE 200 6.03
S&P BSE 500 4.81
CNX Midcap -4.02
Source: Bloomberg

5
HSBC FLOATING RATE FUND - LONG TERM PLAN
Trustees’ ReportFor the year ended March 31, 2013 (Contd...)
Our view in respect of key issues facing equity market currently is highlighted as under, based on which we do expect a likely reversal of the prevailing negative sentiment going forward -
� Macro challenge - expect some relief in current account defi cit given likely lower gold imports and crude oil correction. Solution to fi scal defi cit may however need policy decision to reduce subsidy burden on diesel, kerosene, LPG.
� Commodities infl ation expected to decline on account of China slowdown and lower growth in western world. This may have positive impact margin expansion for corporate sector and on currency (INR) and will give room for reducing interest rates over time. Lower cost of capital should hopefully revive capex spending, though gradually (recovery from 2H12).
� Lower interest rates directionally would be the single most important variable for equity markets to rally. This will be driven by lower commodity infl ation and focus back on reviving growth through monetary policy (recent disappointing GDP/IIP numbers support this view).
� Valuations (for large Sensex companies) are attractive at close to 13x forward earnings and in the lower range of historic multiples. A large number of mid-caps available at a signifi cant discount to large cap peer.
� Structural model for India equity investment remains intact for long term returns. These include favourable demography, high savings rate, rising incomes, growing consumption demand growth, existing low penetration, etc.
DEBT OUTLOOK
Fixed Income market in FY 2013 moved towards lower yields on back of 100 bps rate cut and CRR cuts. RBI front loaded the rate cut in April and then followed it up in January 2013 and March 2013. Towards the second half rates stabilized largely as the core infl ation remained within comfort zone.
In the second half of the year expectation of rate cut and series of open market operations led to rally in rates. Government borrowing was lower than budgeted and the spending was also controlled in second half of the year. Towards the end of the year short end rates tightened substantially due to low deposit growth in banking system.
Corporate yield curve remained inverted with short end rates higher than long end rates for the large part of the year due to liquidity tightness.
Expectation is to see continuation of some easing of the rates stance from RBI in FY 14. However, there is a need to focus on key variables in the economy to judge future directions. These are:
� Liquidity: Liquidity will drive short end rates and eventually drive decisions on open market operations as well as CRR cuts.
� Infl ation: Infl ation numbers will determine future course of action for RBI and remains a critical variable for policy. We expect infl ation to ease in fi rst half of FY 14.
� Growth: GDP growth numbers as well as industrial activity will also determine the decision on policy. Weak GDP numbers may continue for couple of quarters.
� Fiscal defi cit: Fiscal defi cit and government spending will determine the government borrowing and crowding out in interest rate curve.
� Current account defi cit / BoP situation: CAD determines how the pressure on currency works and effective management of forex reserves
� Currency levels: Level of INR will determine how the central banker reacts to the situation on the global crisis etc.
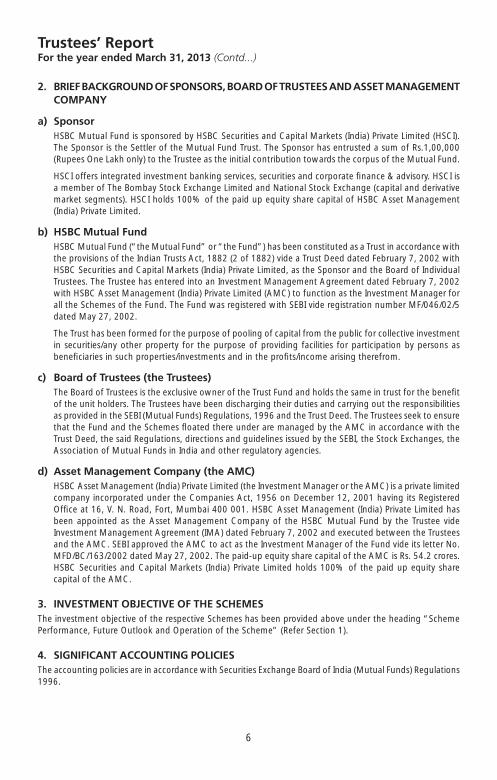
6
HSBC FLOATING RATE FUND - LONG TERM PLAN
Trustees’ ReportFor the year ended March 31, 2013 (Contd...)
2. BRIEF BACKGROUND OF SPONSORS, BOARD OF TRUSTEES AND ASSET MANAGEMENT COMPANY
a) Sponsor HSBC Mutual Fund is sponsored by HSBC Securities and Capital Markets (India) Private Limited (HSCI).
The Sponsor is the Settler of the Mutual Fund Trust. The Sponsor has entrusted a sum of Rs.1,00,000 (Rupees One Lakh only) to the Trustee as the initial contribution towards the corpus of the Mutual Fund.
HSCI offers integrated investment banking services, securities and corporate fi nance & advisory. HSCI is a member of The Bombay Stock Exchange Limited and National Stock Exchange (capital and derivative market segments). HSCI holds 100% of the paid up equity share capital of HSBC Asset Management (India) Private Limited.
b) HSBC Mutual Fund HSBC Mutual Fund (“the Mutual Fund” or “the Fund”) has been constituted as a Trust in accordance with
the provisions of the Indian Trusts Act, 1882 (2 of 1882) vide a Trust Deed dated February 7, 2002 with HSBC Securities and Capital Markets (India) Private Limited, as the Sponsor and the Board of Individual Trustees. The Trustee has entered into an Investment Management Agreement dated February 7, 2002 with HSBC Asset Management (India) Private Limited (AMC) to function as the Investment Manager for all the Schemes of the Fund. The Fund was registered with SEBI vide registration number MF/046/02/5 dated May 27, 2002.
The Trust has been formed for the purpose of pooling of capital from the public for collective investment in securities/any other property for the purpose of providing facilities for participation by persons as benefi ciaries in such properties/investments and in the profi ts/income arising therefrom.
c) Board of Trustees (the Trustees) The Board of Trustees is the exclusive owner of the Trust Fund and holds the same in trust for the benefi t
of the unit holders. The Trustees have been discharging their duties and carrying out the responsibilities as provided in the SEBI (Mutual Funds) Regulations, 1996 and the Trust Deed. The Trustees seek to ensure that the Fund and the Schemes fl oated there under are managed by the AMC in accordance with the Trust Deed, the said Regulations, directions and guidelines issued by the SEBI, the Stock Exchanges, the Association of Mutual Funds in India and other regulatory agencies.
d) Asset Management Company (the AMC) HSBC Asset Management (India) Private Limited (the Investment Manager or the AMC) is a private limited
company incorporated under the Companies Act, 1956 on December 12, 2001 having its Registered Offi ce at 16, V. N. Road, Fort, Mumbai 400 001. HSBC Asset Management (India) Private Limited has been appointed as the Asset Management Company of the HSBC Mutual Fund by the Trustee vide Investment Management Agreement (IMA) dated February 7, 2002 and executed between the Trustees and the AMC. SEBI approved the AMC to act as the Investment Manager of the Fund vide its letter No. MFD/BC/163/2002 dated May 27, 2002. The paid-up equity share capital of the AMC is Rs. 54.2 crores. HSBC Securities and Capital Markets (India) Private Limited holds 100% of the paid up equity share capital of the AMC.
3. INVESTMENT OBJECTIVE OF THE SCHEMESThe investment objective of the respective Schemes has been provided above under the heading “Scheme Performance, Future Outlook and Operation of the Scheme” (Refer Section 1).
4. SIGNIFICANT ACCOUNTING POLICIESThe accounting policies are in accordance with Securities Exchange Board of India (Mutual Funds) Regulations 1996.

7
HSBC FLOATING RATE FUND - LONG TERM PLAN
Trustees’ ReportFor the year ended March 31, 2013 (Contd...)
5. UNCLAIMED DIVIDENDS & REDEMPTIONSSummary of number of Investors & corresponding amount Scheme-wise as on March 31, 2013
SchemeUnclaimed Dividends Unclaimed Redemptions
Amount (Rs.)
No. of Investors
Amount (Rs.)
No. of Investors
HSBC Floating Rate Fund- Long Term Plan
41,940.78 60 14,800.65 5
6. INVESTOR SERVICESThe number of offi cial points of acceptance of transactions is 197 locations. In addition to the offi ces of the Registrar & Transfer agents, the AMC has Investor Service Centres in 4 locations at its own offi ces - namely Mumbai, New Delhi, Kolkata and Chennai. With a view to enhance customer convenience, the AMC has extended the facility of priority based servicing to key distributors through the enhancement of the Interactive Voice Reponses. Call Centre number has now been converted to a single Toll Free number which can be dialed from anywhere in India. The call Centre service is being managed by the Registrar and Transfer Agents. The AMC continues to retain the outsourced back offi ce services with HOPE.
On the distribution front, the number of empanelled distributors was 2471 as on 31 March 2013. During the year, the AMC initiated tie-ups for online distribution of the Mutual Fund’s Schemes with several channel partners taking the total number of such tie-ups to 45.
7. DETAILS OF INVESTOR GRIEVANCE REDRESSALThe details of the redressal of investor complaints received against HSBC Mutual Fund during April 2012- March 2013 are as follows:
Total Number of Folios: 261694
Com-plaintCode
Type of complaint#
(a) No. ofcomplaintspendingat the
beginningof theyear
(b) No. of com-plaints
receivedduring
theyear#
Action on (a) and (b)
Resolved Non Actiona-
ble
Pending
Within 30
days
30 - 60 days
60 - 180 days
Beyond 180 days
0 - 3 months
3 - 6 months
6 - 9 months
9 - 12 months
I A Non receipt of Dividend on Units
0 3 3 0 0 0 0 0 0 0 0
I B Interest on delayed payment of Dividend
0 0 0 0 0 0 0 0 0 0 0
I C Non receipt of Redemption Proceeds
2 40 22 18 2 0 0 0 0 0 0
I D Interest on delayed payment of Redemption
0 2 1 1 0 0 0 0 0 0 0
II A Non receipt of Statement of Account/Unit Certifi cate
0 9 9 0 0 0 0 0 0 0 0
II B Discrepancy in Statement of Account
0 6 5 0 0 0 0 1 0 0 0
II C Data corrections in Investor details
0 277 277 0 0 0 0 0 0 0 0
II D Non receipt of Annual Report/Abridged Summary
0 0 0 0 0 0 0 0 0 0 0
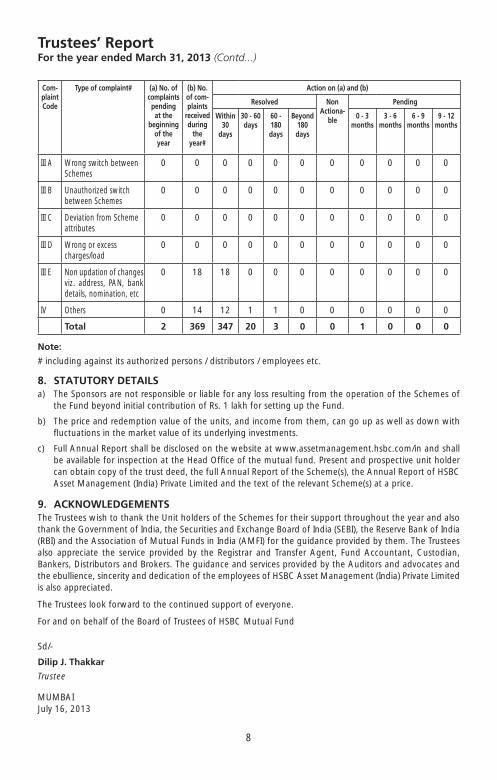
8
HSBC FLOATING RATE FUND - LONG TERM PLAN
Trustees’ ReportFor the year ended March 31, 2013 (Contd...)
Com-plaintCode
Type of complaint#
(a) No. ofcomplaintspendingat the
beginningof theyear
(b) No. of com-plaints
receivedduring
theyear#
Action on (a) and (b)
Resolved Non Actiona-
ble
Pending
Within 30
days
30 - 60 days
60 - 180 days
Beyond 180 days
0 - 3 months
3 - 6 months
6 - 9 months
9 - 12 months
III A Wrong switch between Schemes
0 0 0 0 0 0 0 0 0 0 0
III B Unauthorized switch between Schemes
0 0 0 0 0 0 0 0 0 0 0
III C Deviation from Scheme attributes
0 0 0 0 0 0 0 0 0 0 0
III D Wrong or excess charges/load
0 0 0 0 0 0 0 0 0 0 0
III E Non updation of changes viz. address, PAN, bank details, nomination, etc
0 18 18 0 0 0 0 0 0 0 0
IV Others 0 14 12 1 1 0 0 0 0 0 0
Total 2 369 347 20 3 0 0 1 0 0 0
Note:
# including against its authorized persons / distributors / employees etc.
8. STATUTORY DETAILSa) The Sponsors are not responsible or liable for any loss resulting from the operation of the Schemes of
the Fund beyond initial contribution of Rs. 1 lakh for setting up the Fund.
b) The price and redemption value of the units, and income from them, can go up as well as down with fl uctuations in the market value of its underlying investments.
c) Full Annual Report shall be disclosed on the website at www.assetmanagement.hsbc.com/in and shall be available for inspection at the Head Offi ce of the mutual fund. Present and prospective unit holder can obtain copy of the trust deed, the full Annual Report of the Scheme(s), the Annual Report of HSBC Asset Management (India) Private Limited and the text of the relevant Scheme(s) at a price.
9. ACKNOWLEDGEMENTSThe Trustees wish to thank the Unit holders of the Schemes for their support throughout the year and also thank the Government of India, the Securities and Exchange Board of India (SEBI), the Reserve Bank of India (RBI) and the Association of Mutual Funds in India (AMFI) for the guidance provided by them. The Trustees also appreciate the service provided by the Registrar and Transfer Agent, Fund Accountant, Custodian, Bankers, Distributors and Brokers. The guidance and services provided by the Auditors and advocates and the ebullience, sincerity and dedication of the employees of HSBC Asset Management (India) Private Limited is also appreciated.
The Trustees look forward to the continued support of everyone.
For and on behalf of the Board of Trustees of HSBC Mutual Fund
Sd/-
Dilip J. Thakkar
Trustee
MUMBAIJuly 16, 2013

9
HSBC FLOATING RATE FUND - LONG TERM PLAN
Independent Auditors’ Report
To the Board of Trustees of
HSBC Mutual Fund
Report on the Financial Statements1. We have audited the accompanying fi nancial statements of HSBC Mutual Fund - HSBC Floating Rate
Fund - Long Term Plan (the “Scheme”), which comprise the Balance Sheet as at March 31, 2013, and the related Revenue Account for the year then ended, and a summary of signifi cant accounting policies and other explanatory information, which we have signed under reference to this report.
Trustee’s and Management’s Responsibility for the Financial Statements2. The Board of Trustees of HSBC Mutual Fund (the “Trustee”) and the Management of HSBC Asset
Management (India) Private Limited (the “Management”) are responsible for the preparation of these fi nancial statements that give a true and fair view of the fi nancial position and fi nancial performance of the Scheme in accordance with the accounting policies and standards specifi ed in the Ninth Schedule of the Securities and Exchange Board of India (Mutual Funds) Regulations, 1996 and amendments thereto (the “Regulations”). This responsibility includes the design, implementation and maintenance of internal control relevant to the preparation and presentation of the fi nancial statements that give a true and fair view and are free from material misstatement, whether due to fraud or error.
Auditors’ Responsibility3. Our responsibility is to express an opinion on these fi nancial statements based on our audit. We conducted
our audit in accordance with the Standards on Auditing issued by the Institute of Chartered Accountants of India. Those Standards require that we comply with ethical requirements and plan and perform the audit to obtain reasonable assurance about whether the fi nancial statements are free from material misstatement.
4. An audit involves performing procedures to obtain audit evidence, about the amounts and disclosures in the fi nancial statements. The procedures selected depend on the auditors’ judgment, including the assessment of the risks of material misstatement of the fi nancial statements, whether due to fraud or error. In making those risk assessments, the auditors consider internal control relevant to the preparation and fair presentation of the fi nancial statements in order to design audit procedures that are appropriate in the circumstances. Our procedures included confi rmation of securities owned and unit capital balances as at March 31, 2013 by correspondence with the custodian/others and registrar and transfer agent, respectively. An audit also includes evaluating the appropriateness of accounting policies used and the reasonableness of the accounting estimates made by the Trustee and the Management, as well as evaluating the overall presentation of the fi nancial statements.
5. We believe that the audit evidence we have obtained is suffi cient and appropriate to provide a basis for our audit opinion.
Opinion6. In our opinion, and to the best of our information and according to the explanations given to us, the
accompanying fi nancial statements give the information required by the Regulations in the manner so required and give a true and fair view in conformity with the accounting principles generally accepted in India:
(a) in the case of the Balance Sheet, of the state of affairs of the Scheme as at March 31, 2013; and
(b) in the case of the Revenue Account, of the net surplus for the year ended on that date.
Report on Other Legal and Regulatory Requirement7. As required by section 55(4) of the Regulations, we report that:
(a) We have obtained all the information and explanations which, to the best of our knowledge and belief, were necessary for the purposes of our audit; and

10
HSBC FLOATING RATE FUND - LONG TERM PLAN
Independent Auditors’ Report (Contd...)
(b) In our opinion, the Balance Sheet and Revenue Account dealt with by this report have been prepared in accordance with the accounting policies and standards specifi ed in the Ninth Schedule of the Regulations.
8. As required by clause 5 (ii)(2) of the Eleventh Schedule to the Regulations, we report that the Balance Sheet and Revenue Account dealt with by this Report are in agreement with the books of account of the Scheme.
9. In our opinion, the methods used to value non-traded securities as at March 31, 2013, as determined by HSBC Asset Management (India) Private Limited under procedures approved by the Board of Trustees of HSBC Mutual Fund in accordance with the guidelines for valuation of securities for mutual funds as mentioned in the Eighth Schedule of the Regulations issued by the Securities and Exchange Board of India, are fair and reasonable.
For PRICE WATERHOUSEFirm Registration Number: 301112EChartered Accountants
Sd/-
Vivek PrasadPartnerMembership Number: 104941
Place : MumbaiDate : July 16, 2013

4
HSBC ULTRA SHORT TERM BOND FUND
Trustees’ ReportFor the year ended March 31, 2013
The Trustees present the eleventh report and the audited abridged fi nancial statements of the Schemes of HSBC Mutual Fund (the “Fund”), for the year ended March 31, 2013.
1. SCHEME PERFORMANCE, FUTURE OUTLOOK AND OPERATIONS OF THE SCHEMES
a) Operations and Performance of the Schemes
HSBC Ultra Short Term Bond Fund (HUSBF) - an open ended Debt Scheme
HUSBF seeks to provide liquidity and reasonable returns by investing primarily in a mix of short term debt and money market instruments.
The net assets of HUSBF amounted to Rs. 45.73 crores as at March 31, 2013 as compared to Rs. 56.88 crores as at March 31, 2012. Around 96.85% of the net assets were invested in debt and money market instruments, 3.55% were invested in reverse repos/CBLO and (-0.40%) were in net current assets as at March 31, 2013.
HUSBF outperformed its benchmark due to focus on better placed positions on the yield curve.
Date of Inception : 17 October, 2006 Simple Annualized (%)
Scheme Name & Benchmarks Since Inception(Oct 2012 - March 2013)
HSBC Ultra Short Term Bond Fund - Growth* 8.06
Customised Benchmark Index Fund (Scheme Benchmark)** 7.88
CRISIL 1 Year T-Bill Index (Standard Benchmark) 8.11
Rs. 10,000, if invested in HUSBF, would have become 10,385
Rs. 10,000, if invested in Customised Benchmark Index, would have become 10,377
Rs. 10,000, if invested in CRISIL 1 Year T-Bill Index, would have become 10,388
**Composite index of CRISIL Liquid Fund Index (90%) and CRISIL Short Term Bond Fund Index (10%).
* Pursuant to SEBI circular dated Sept 13, 2012, certain Plans/options within the schemes have been discontinued to comply with a single plan structure. Since there was no continuous NAV history available for the surviving Plan prior to October 01, 2012, returns since the said date have been considered for calculating performance. The inception date of HSBC Ultra Short Term Bond Fund however is October 17, 2006.
Returns data as on March 31, 2013. Past performance may or may not be sustained in future. ‘Since Inception’ returns are calculated on Rs. 10 invested at inception. Calculations are based on Growth NAVs.
b) Market Overview & Outlook
EQUITY OUTLOOK
The Sensex returned 8.23% for the FY ended March 2013. While this looks to be a tepid return, the market rallied smoothly for a low of 15965 in June to end at 18835 at the FY end, a return of 17.98%. This was largely due to a series of announcements on reforms by the government and falling crude oil prices, signaling hopes of an economic recovery.
Returns (April 1, 2012 - March 31, 2013) 1 Year (%)
NIFTY 7.31
Sensex 8.23
S&P BSE 100 6.84
S&P BSE 200 6.03
S&P BSE 500 4.81
CNX Midcap -4.02
Source: Bloomberg
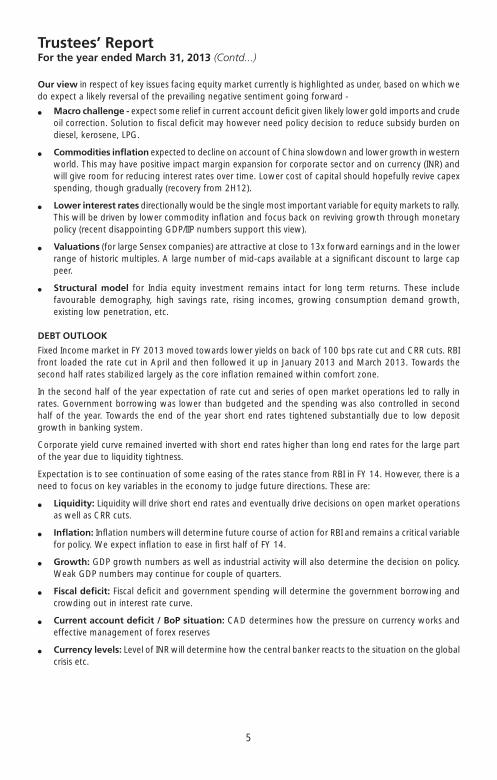
5
HSBC ULTRA SHORT TERM BOND FUND
Trustees’ ReportFor the year ended March 31, 2013 (Contd...)
Our view in respect of key issues facing equity market currently is highlighted as under, based on which we do expect a likely reversal of the prevailing negative sentiment going forward -
� Macro challenge - expect some relief in current account defi cit given likely lower gold imports and crude oil correction. Solution to fi scal defi cit may however need policy decision to reduce subsidy burden on diesel, kerosene, LPG.
� Commodities infl ation expected to decline on account of China slowdown and lower growth in western world. This may have positive impact margin expansion for corporate sector and on currency (INR) and will give room for reducing interest rates over time. Lower cost of capital should hopefully revive capex spending, though gradually (recovery from 2H12).
� Lower interest rates directionally would be the single most important variable for equity markets to rally. This will be driven by lower commodity infl ation and focus back on reviving growth through monetary policy (recent disappointing GDP/IIP numbers support this view).
� Valuations (for large Sensex companies) are attractive at close to 13x forward earnings and in the lower range of historic multiples. A large number of mid-caps available at a signifi cant discount to large cap peer.
� Structural model for India equity investment remains intact for long term returns. These include favourable demography, high savings rate, rising incomes, growing consumption demand growth, existing low penetration, etc.
DEBT OUTLOOK
Fixed Income market in FY 2013 moved towards lower yields on back of 100 bps rate cut and CRR cuts. RBI front loaded the rate cut in April and then followed it up in January 2013 and March 2013. Towards the second half rates stabilized largely as the core infl ation remained within comfort zone.
In the second half of the year expectation of rate cut and series of open market operations led to rally in rates. Government borrowing was lower than budgeted and the spending was also controlled in second half of the year. Towards the end of the year short end rates tightened substantially due to low deposit growth in banking system.
Corporate yield curve remained inverted with short end rates higher than long end rates for the large part of the year due to liquidity tightness.
Expectation is to see continuation of some easing of the rates stance from RBI in FY 14. However, there is a need to focus on key variables in the economy to judge future directions. These are:
� Liquidity: Liquidity will drive short end rates and eventually drive decisions on open market operations as well as CRR cuts.
� Infl ation: Infl ation numbers will determine future course of action for RBI and remains a critical variable for policy. We expect infl ation to ease in fi rst half of FY 14.
� Growth: GDP growth numbers as well as industrial activity will also determine the decision on policy. Weak GDP numbers may continue for couple of quarters.
� Fiscal defi cit: Fiscal defi cit and government spending will determine the government borrowing and crowding out in interest rate curve.
� Current account defi cit / BoP situation: CAD determines how the pressure on currency works and effective management of forex reserves
� Currency levels: Level of INR will determine how the central banker reacts to the situation on the global crisis etc.

6
HSBC ULTRA SHORT TERM BOND FUND
Trustees’ ReportFor the year ended March 31, 2013 (Contd...)
2. BRIEF BACKGROUND OF SPONSORS, BOARD OF TRUSTEES AND ASSET MANAGEMENT COMPANY
a) Sponsor HSBC Mutual Fund is sponsored by HSBC Securities and Capital Markets (India) Private Limited (HSCI).
The Sponsor is the Settler of the Mutual Fund Trust. The Sponsor has entrusted a sum of Rs.1,00,000 (Rupees One Lakh only) to the Trustee as the initial contribution towards the corpus of the Mutual Fund.
HSCI offers integrated investment banking services, securities and corporate fi nance & advisory. HSCI is a member of The Bombay Stock Exchange Limited and National Stock Exchange (capital and derivative market segments). HSCI holds 100% of the paid up equity share capital of HSBC Asset Management (India) Private Limited.
b) HSBC Mutual Fund HSBC Mutual Fund (“the Mutual Fund” or “the Fund”) has been constituted as a Trust in accordance with
the provisions of the Indian Trusts Act, 1882 (2 of 1882) vide a Trust Deed dated February 7, 2002 with HSBC Securities and Capital Markets (India) Private Limited, as the Sponsor and the Board of Individual Trustees. The Trustee has entered into an Investment Management Agreement dated February 7, 2002 with HSBC Asset Management (India) Private Limited (AMC) to function as the Investment Manager for all the Schemes of the Fund. The Fund was registered with SEBI vide registration number MF/046/02/5 dated May 27, 2002.
The Trust has been formed for the purpose of pooling of capital from the public for collective investment in securities/any other property for the purpose of providing facilities for participation by persons as benefi ciaries in such properties/investments and in the profi ts/income arising therefrom.
c) Board of Trustees (the Trustees) The Board of Trustees is the exclusive owner of the Trust Fund and holds the same in trust for the benefi t
of the unit holders. The Trustees have been discharging their duties and carrying out the responsibilities as provided in the SEBI (Mutual Funds) Regulations, 1996 and the Trust Deed. The Trustees seek to ensure that the Fund and the Schemes fl oated there under are managed by the AMC in accordance with the Trust Deed, the said Regulations, directions and guidelines issued by the SEBI, the Stock Exchanges, the Association of Mutual Funds in India and other regulatory agencies.
d) Asset Management Company (the AMC) HSBC Asset Management (India) Private Limited (the Investment Manager or the AMC) is a private limited
company incorporated under the Companies Act, 1956 on December 12, 2001 having its Registered Offi ce at 16, V. N. Road, Fort, Mumbai 400 001. HSBC Asset Management (India) Private Limited has been appointed as the Asset Management Company of the HSBC Mutual Fund by the Trustee vide Investment Management Agreement (IMA) dated February 7, 2002 and executed between the Trustees and the AMC. SEBI approved the AMC to act as the Investment Manager of the Fund vide its letter No. MFD/BC/163/2002 dated May 27, 2002. The paid-up equity share capital of the AMC is Rs. 54.2 crores. HSBC Securities and Capital Markets (India) Private Limited holds 100% of the paid up equity share capital of the AMC.
3. INVESTMENT OBJECTIVE OF THE SCHEMESThe investment objective of the respective Schemes has been provided above under the heading “Scheme Performance, Future Outlook and Operation of the Scheme” (Refer Section 1).
4. SIGNIFICANT ACCOUNTING POLICIESThe accounting policies are in accordance with Securities Exchange Board of India (Mutual Funds) Regulations 1996.
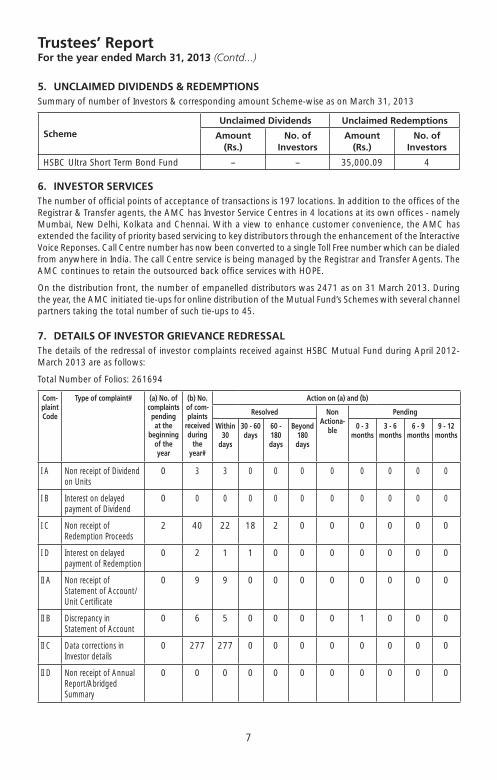
7
HSBC ULTRA SHORT TERM BOND FUND
Trustees’ ReportFor the year ended March 31, 2013 (Contd...)
5. UNCLAIMED DIVIDENDS & REDEMPTIONSSummary of number of Investors & corresponding amount Scheme-wise as on March 31, 2013
SchemeUnclaimed Dividends Unclaimed Redemptions
Amount (Rs.)
No. of Investors
Amount (Rs.)
No. of Investors
HSBC Ultra Short Term Bond Fund – – 35,000.09 4
6. INVESTOR SERVICESThe number of offi cial points of acceptance of transactions is 197 locations. In addition to the offi ces of the Registrar & Transfer agents, the AMC has Investor Service Centres in 4 locations at its own offi ces - namely Mumbai, New Delhi, Kolkata and Chennai. With a view to enhance customer convenience, the AMC has extended the facility of priority based servicing to key distributors through the enhancement of the Interactive Voice Reponses. Call Centre number has now been converted to a single Toll Free number which can be dialed from anywhere in India. The call Centre service is being managed by the Registrar and Transfer Agents. The AMC continues to retain the outsourced back offi ce services with HOPE.
On the distribution front, the number of empanelled distributors was 2471 as on 31 March 2013. During the year, the AMC initiated tie-ups for online distribution of the Mutual Fund’s Schemes with several channel partners taking the total number of such tie-ups to 45.
7. DETAILS OF INVESTOR GRIEVANCE REDRESSALThe details of the redressal of investor complaints received against HSBC Mutual Fund during April 2012- March 2013 are as follows:
Total Number of Folios: 261694
Com-plaintCode
Type of complaint#
(a) No. ofcomplaintspendingat the
beginningof theyear
(b) No. of com-plaints
receivedduring
theyear#
Action on (a) and (b)
Resolved Non Actiona-
ble
Pending
Within 30
days
30 - 60 days
60 - 180 days
Beyond 180 days
0 - 3 months
3 - 6 months
6 - 9 months
9 - 12 months
I A Non receipt of Dividend on Units
0 3 3 0 0 0 0 0 0 0 0
I B Interest on delayed payment of Dividend
0 0 0 0 0 0 0 0 0 0 0
I C Non receipt of Redemption Proceeds
2 40 22 18 2 0 0 0 0 0 0
I D Interest on delayed payment of Redemption
0 2 1 1 0 0 0 0 0 0 0
II A Non receipt of Statement of Account/Unit Certifi cate
0 9 9 0 0 0 0 0 0 0 0
II B Discrepancy in Statement of Account
0 6 5 0 0 0 0 1 0 0 0
II C Data corrections in Investor details
0 277 277 0 0 0 0 0 0 0 0
II D Non receipt of Annual Report/Abridged Summary
0 0 0 0 0 0 0 0 0 0 0

8
HSBC ULTRA SHORT TERM BOND FUND
Trustees’ ReportFor the year ended March 31, 2013 (Contd...)
Com-plaintCode
Type of complaint#
(a) No. ofcomplaintspendingat the
beginningof theyear
(b) No. of com-plaints
receivedduring
theyear#
Action on (a) and (b)
Resolved Non Actiona-
ble
Pending
Within 30
days
30 - 60 days
60 - 180 days
Beyond 180 days
0 - 3 months
3 - 6 months
6 - 9 months
9 - 12 months
III A Wrong switch between Schemes
0 0 0 0 0 0 0 0 0 0 0
III B Unauthorized switch between Schemes
0 0 0 0 0 0 0 0 0 0 0
III C Deviation from Scheme attributes
0 0 0 0 0 0 0 0 0 0 0
III D Wrong or excess charges/load
0 0 0 0 0 0 0 0 0 0 0
III E Non updation of changes viz. address, PAN, bank details, nomination, etc
0 18 18 0 0 0 0 0 0 0 0
IV Others 0 14 12 1 1 0 0 0 0 0 0
Total 2 369 347 20 3 0 0 1 0 0 0
Note:
# including against its authorized persons / distributors / employees etc.
8. STATUTORY DETAILSa) The Sponsors are not responsible or liable for any loss resulting from the operation of the Schemes of
the Fund beyond initial contribution of Rs. 1 lakh for setting up the Fund.
b) The price and redemption value of the units, and income from them, can go up as well as down with fl uctuations in the market value of its underlying investments.
c) Full Annual Report shall be disclosed on the website at www.assetmanagement.hsbc.com/in and shall be available for inspection at the Head Offi ce of the mutual fund. Present and prospective unit holder can obtain copy of the trust deed, the full Annual Report of the Scheme(s), the Annual Report of HSBC Asset Management (India) Private Limited and the text of the relevant Scheme(s) at a price.
9. ACKNOWLEDGEMENTSThe Trustees wish to thank the Unit holders of the Schemes for their support throughout the year and also thank the Government of India, the Securities and Exchange Board of India (SEBI), the Reserve Bank of India (RBI) and the Association of Mutual Funds in India (AMFI) for the guidance provided by them. The Trustees also appreciate the service provided by the Registrar and Transfer Agent, Fund Accountant, Custodian, Bankers, Distributors and Brokers. The guidance and services provided by the Auditors and advocates and the ebullience, sincerity and dedication of the employees of HSBC Asset Management (India) Private Limited is also appreciated.
The Trustees look forward to the continued support of everyone.
For and on behalf of the Board of Trustees of HSBC Mutual Fund
Sd/-
Dilip J. Thakkar
Trustee
MUMBAIJuly 16, 2013

9
HSBC ULTRA SHORT TERM BOND FUND
Independent Auditors’ Report
To the Board of Trustees of
HSBC Mutual Fund
Report on the Financial Statements1. We have audited the accompanying fi nancial statements of HSBC Mutual Fund - HSBC Ultra Short Term
Bond Fund (the “Scheme”), which comprise the Balance Sheet as at March 31, 2013, and the related Revenue Account for the year then ended, and a summary of signifi cant accounting policies and other explanatory information, which we have signed under reference to this report.
Trustee’s and Management’s Responsibility for the Financial Statements2. The Board of Trustees of HSBC Mutual Fund (the “Trustee”) and the Management of HSBC Asset
Management (India) Private Limited (the “Management”) are responsible for the preparation of these fi nancial statements that give a true and fair view of the fi nancial position and fi nancial performance of the Scheme in accordance with the accounting policies and standards specifi ed in the Ninth Schedule of the Securities and Exchange Board of India (Mutual Funds) Regulations, 1996 and amendments thereto (the “Regulations”). This responsibility includes the design, implementation and maintenance of internal control relevant to the preparation and presentation of the fi nancial statements that give a true and fair view and are free from material misstatement, whether due to fraud or error.
Auditors’ Responsibility3. Our responsibility is to express an opinion on these fi nancial statements based on our audit. We conducted
our audit in accordance with the Standards on Auditing issued by the Institute of Chartered Accountants of India. Those Standards require that we comply with ethical requirements and plan and perform the audit to obtain reasonable assurance about whether the fi nancial statements are free from material misstatement.
4. An audit involves performing procedures to obtain audit evidence, about the amounts and disclosures in the fi nancial statements. The procedures selected depend on the auditors’ judgment, including the assessment of the risks of material misstatement of the fi nancial statements, whether due to fraud or error. In making those risk assessments, the auditors consider internal control relevant to the preparation and fair presentation of the fi nancial statements in order to design audit procedures that are appropriate in the circumstances. Our procedures included confi rmation of securities owned and unit capital balances as at March 31, 2013 by correspondence with the custodian/others and registrar and transfer agent, respectively. An audit also includes evaluating the appropriateness of accounting policies used and the reasonableness of the accounting estimates made by the Trustee and the Management, as well as evaluating the overall presentation of the fi nancial statements.
5. We believe that the audit evidence we have obtained is suffi cient and appropriate to provide a basis for our audit opinion.
Opinion6. In our opinion, and to the best of our information and according to the explanations given to us, the
accompanying fi nancial statements give the information required by the Regulations in the manner so required and give a true and fair view in conformity with the accounting principles generally accepted in India:
(a) in the case of the Balance Sheet, of the state of affairs of the Scheme as at March 31, 2013; and
(b) in the case of the Revenue Account, of the net surplus for the year ended on that date.
Report on Other Legal and Regulatory Requirement7. As required by section 55(4) of the Regulations, we report that:
(a) We have obtained all the information and explanations which, to the best of our knowledge and belief, were necessary for the purposes of our audit; and

10
HSBC ULTRA SHORT TERM BOND FUND
Independent Auditors’ Report (Contd...)
(b) In our opinion, the Balance Sheet and Revenue Account dealt with by this report have been prepared in accordance with the accounting policies and standards specifi ed in the Ninth Schedule of the Regulations.
8. As required by clause 5 (ii)(2) of the Eleventh Schedule to the Regulations, we report that the Balance Sheet and Revenue Account dealt with by this Report are in agreement with the books of account of the Scheme.
9. In our opinion, the methods used to value non-traded securities as at March 31, 2013, as determined by HSBC Asset Management (India) Private Limited under procedures approved by the Board of Trustee of HSBC Mutual Fund in accordance with the guidelines for valuation of securities for mutual funds as mentioned in the Eighth Schedule of the Regulations issued by the Securities and Exchange Board of India, are fair and reasonable.
For PRICE WATERHOUSEFirm Registration Number: 301112EChartered Accountants
Sd/-
Vivek PrasadPartnerMembership Number: 104941
Place : MumbaiDate : July 16, 2013
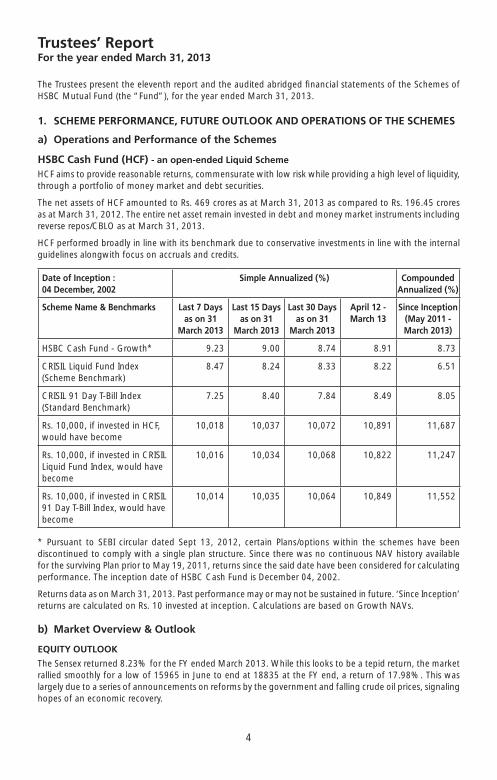
4
HSBC Cash Fund
Trustees’ ReportFor the year ended March 31, 2013
The Trustees present the eleventh report and the audited abridged fi nancial statements of the Schemes of HSBC Mutual Fund (the “Fund”), for the year ended March 31, 2013.
1. SCHEME PERFORMANCE, FUTURE OUTLOOK AND OPERATIONS OF THE SCHEMES
a) Operations and Performance of the Schemes
HSBC Cash Fund (HCF) - an open-ended Liquid Scheme
HCF aims to provide reasonable returns, commensurate with low risk while providing a high level of liquidity, through a portfolio of money market and debt securities.
The net assets of HCF amounted to Rs. 469 crores as at March 31, 2013 as compared to Rs. 196.45 crores as at March 31, 2012. The entire net asset remain invested in debt and money market instruments including reverse repos/CBLO as at March 31, 2013.
HCF performed broadly in line with its benchmark due to conservative investments in line with the internal guidelines alongwith focus on accruals and credits.
Date of Inception :04 December, 2002
Simple Annualized (%) Compounded Annualized (%)
Scheme Name & Benchmarks Last 7 Days as on 31
March 2013
Last 15 Days as on 31
March 2013
Last 30 Days as on 31
March 2013
April 12 - March 13
Since Inception (May 2011 - March 2013)
HSBC Cash Fund - Growth* 9.23 9.00 8.74 8.91 8.73
CRISIL Liquid Fund Index (Scheme Benchmark)
8.47 8.24 8.33 8.22 6.51
CRISIL 91 Day T-Bill Index (Standard Benchmark)
7.25 8.40 7.84 8.49 8.05
Rs. 10,000, if invested in HCF, would have become
10,018 10,037 10,072 10,891 11,687
Rs. 10,000, if invested in CRISIL Liquid Fund Index, would have become
10,016 10,034 10,068 10,822 11,247
Rs. 10,000, if invested in CRISIL 91 Day T-Bill Index, would have become
10,014 10,035 10,064 10,849 11,552
* Pursuant to SEBI circular dated Sept 13, 2012, certain Plans/options within the schemes have been discontinued to comply with a single plan structure. Since there was no continuous NAV history available for the surviving Plan prior to May 19, 2011, returns since the said date have been considered for calculating performance. The inception date of HSBC Cash Fund is December 04, 2002.
Returns data as on March 31, 2013. Past performance may or may not be sustained in future. ‘Since Inception’ returns are calculated on Rs. 10 invested at inception. Calculations are based on Growth NAVs.
b) Market Overview & Outlook
EQUITY OUTLOOK
The Sensex returned 8.23% for the FY ended March 2013. While this looks to be a tepid return, the market rallied smoothly for a low of 15965 in June to end at 18835 at the FY end, a return of 17.98%. This was largely due to a series of announcements on reforms by the government and falling crude oil prices, signaling hopes of an economic recovery.
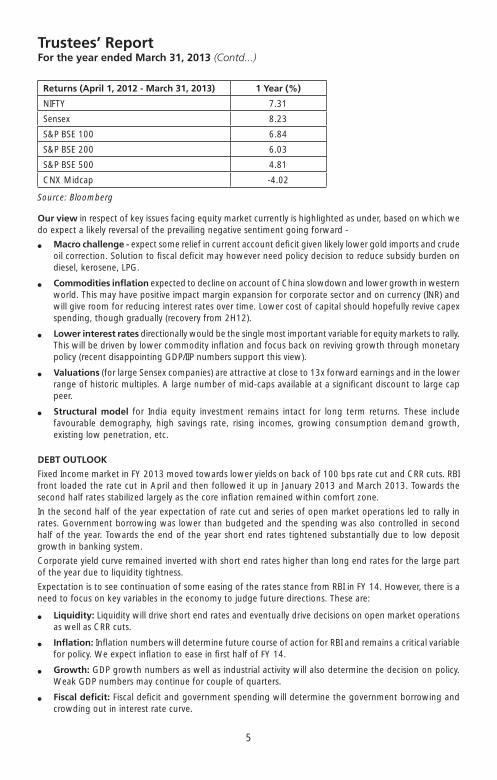
5
HSBC Cash Fund
Trustees’ ReportFor the year ended March 31, 2013 (Contd...)
Returns (April 1, 2012 - March 31, 2013) 1 Year (%)
NIFTY 7.31
Sensex 8.23
S&P BSE 100 6.84
S&P BSE 200 6.03
S&P BSE 500 4.81
CNX Midcap -4.02
Source: Bloomberg
Our view in respect of key issues facing equity market currently is highlighted as under, based on which we do expect a likely reversal of the prevailing negative sentiment going forward -
� Macro challenge - expect some relief in current account defi cit given likely lower gold imports and crude oil correction. Solution to fi scal defi cit may however need policy decision to reduce subsidy burden on diesel, kerosene, LPG.
� Commodities infl ation expected to decline on account of China slowdown and lower growth in western world. This may have positive impact margin expansion for corporate sector and on currency (INR) and will give room for reducing interest rates over time. Lower cost of capital should hopefully revive capex spending, though gradually (recovery from 2H12).
� Lower interest rates directionally would be the single most important variable for equity markets to rally. This will be driven by lower commodity infl ation and focus back on reviving growth through monetary policy (recent disappointing GDP/IIP numbers support this view).
� Valuations (for large Sensex companies) are attractive at close to 13x forward earnings and in the lower range of historic multiples. A large number of mid-caps available at a signifi cant discount to large cap peer.
� Structural model for India equity investment remains intact for long term returns. These include favourable demography, high savings rate, rising incomes, growing consumption demand growth, existing low penetration, etc.
DEBT OUTLOOK
Fixed Income market in FY 2013 moved towards lower yields on back of 100 bps rate cut and CRR cuts. RBI front loaded the rate cut in April and then followed it up in January 2013 and March 2013. Towards the second half rates stabilized largely as the core infl ation remained within comfort zone.
In the second half of the year expectation of rate cut and series of open market operations led to rally in rates. Government borrowing was lower than budgeted and the spending was also controlled in second half of the year. Towards the end of the year short end rates tightened substantially due to low deposit growth in banking system.
Corporate yield curve remained inverted with short end rates higher than long end rates for the large part of the year due to liquidity tightness.
Expectation is to see continuation of some easing of the rates stance from RBI in FY 14. However, there is a need to focus on key variables in the economy to judge future directions. These are:
� Liquidity: Liquidity will drive short end rates and eventually drive decisions on open market operations as well as CRR cuts.
� Infl ation: Infl ation numbers will determine future course of action for RBI and remains a critical variable for policy. We expect infl ation to ease in fi rst half of FY 14.
� Growth: GDP growth numbers as well as industrial activity will also determine the decision on policy. Weak GDP numbers may continue for couple of quarters.
� Fiscal defi cit: Fiscal defi cit and government spending will determine the government borrowing and crowding out in interest rate curve.

6
HSBC Cash Fund
Trustees’ ReportFor the year ended March 31, 2013 (Contd...)
� Current account defi cit / BoP situation: CAD determines how the pressure on currency works and effective management of forex reserves
� Currency levels: Level of INR will determine how the central banker reacts to the situation on the global crisis etc.
2. BRIEF BACKGROUND OF SPONSORS, BOARD OF TRUSTEES AND ASSET MANAGEMENT COMPANY
a) Sponsor HSBC Mutual Fund is sponsored by HSBC Securities and Capital Markets (India) Private Limited (HSCI).
The Sponsor is the Settler of the Mutual Fund Trust. The Sponsor has entrusted a sum of Rs.1,00,000 (Rupees One Lakh only) to the Trustee as the initial contribution towards the corpus of the Mutual Fund.
HSCI offers integrated investment banking services, securities and corporate fi nance & advisory. HSCI is a member of The Bombay Stock Exchange Limited and National Stock Exchange (capital and derivative market segments). HSCI holds 100% of the paid up equity share capital of HSBC Asset Management (India) Private Limited.
b) HSBC Mutual Fund HSBC Mutual Fund (“the Mutual Fund” or “the Fund”) has been constituted as a Trust in accordance with
the provisions of the Indian Trusts Act, 1882 (2 of 1882) vide a Trust Deed dated February 7, 2002 with HSBC Securities and Capital Markets (India) Private Limited, as the Sponsor and the Board of Individual Trustees. The Trustee has entered into an Investment Management Agreement dated February 7, 2002 with HSBC Asset Management (India) Private Limited (AMC) to function as the Investment Manager for all the Schemes of the Fund. The Fund was registered with SEBI vide registration number MF/046/02/5 dated May 27, 2002.
The Trust has been formed for the purpose of pooling of capital from the public for collective investment in securities/any other property for the purpose of providing facilities for participation by persons as benefi ciaries in such properties/investments and in the profi ts/income arising therefrom.
c) Board of Trustees (the Trustees) The Board of Trustees is the exclusive owner of the Trust Fund and holds the same in trust for the benefi t
of the unit holders. The Trustees have been discharging their duties and carrying out the responsibilities as provided in the SEBI (Mutual Funds) Regulations, 1996 and the Trust Deed. The Trustees seek to ensure that the Fund and the Schemes fl oated there under are managed by the AMC in accordance with the Trust Deed, the said Regulations, directions and guidelines issued by the SEBI, the Stock Exchanges, the Association of Mutual Funds in India and other regulatory agencies.
d) Asset Management Company (the AMC) HSBC Asset Management (India) Private Limited (the Investment Manager or the AMC) is a private limited
company incorporated under the Companies Act, 1956 on December 12, 2001 having its Registered Offi ce at 16, V. N. Road, Fort, Mumbai 400 001. HSBC Asset Management (India) Private Limited has been appointed as the Asset Management Company of the HSBC Mutual Fund by the Trustee vide Investment Management Agreement (IMA) dated February 7, 2002 and executed between the Trustees and the AMC. SEBI approved the AMC to act as the Investment Manager of the Fund vide its letter No. MFD/BC/163/2002 dated May 27, 2002. The paid-up equity share capital of the AMC is Rs. 54.2 crores. HSBC Securities and Capital Markets (India) Private Limited holds 100% of the paid up equity share capital of the AMC.
3. INVESTMENT OBJECTIVE OF THE SCHEMESThe investment objective of the respective Schemes has been provided above under the heading “Scheme Performance, Future Outlook and Operation of the Scheme” (Refer Section 1).
4. SIGNIFICANT ACCOUNTING POLICIESThe accounting policies are in accordance with Securities Exchange Board of India (Mutual Funds) Regulations 1996.

7
HSBC Cash Fund
Trustees’ ReportFor the year ended March 31, 2013 (Contd...)
5. UNCLAIMED DIVIDENDS & REDEMPTIONSSummary of number of Investors & corresponding amount Scheme-wise as on March 31, 2013
SchemeUnclaimed Dividends Unclaimed Redemptions
Amount (Rs.)
No. of Investors
Amount (Rs.)
No. of Investors
HSBC Cash Fund – – 1.45 11
6. INVESTOR SERVICESThe number of offi cial points of acceptance of transactions is 197 locations. In addition to the offi ces of the Registrar & Transfer agents, the AMC has Investor Service Centres in 4 locations at its own offi ces - namely Mumbai, New Delhi, Kolkata and Chennai. With a view to enhance customer convenience, the AMC has extended the facility of priority based servicing to key distributors through the enhancement of the Interactive Voice Reponses. Call Centre number has now been converted to a single Toll Free number which can be dialed from anywhere in India. The call Centre service is being managed by the Registrar and Transfer Agents. The AMC continues to retain the outsourced back offi ce services with HOPE.
On the distribution front, the number of empanelled distributors was 2471 as on 31 March 2013. During the year, the AMC initiated tie-ups for online distribution of the Mutual Fund’s Schemes with several channel partners taking the total number of such tie-ups to 45.
7. DETAILS OF INVESTOR GRIEVANCE REDRESSALThe details of the redressal of investor complaints received against HSBC Mutual Fund during April 2012- March 2013 are as follows:
Total Number of Folios: 261694
Com-plaintCode
Type of complaint#
(a) No. ofcomplaintspendingat the
beginningof theyear
(b) No. of com-plaints
receivedduring
theyear#
Action on (a) and (b)
Resolved Non Actiona-
ble
Pending
Within 30
days
30 - 60 days
60 - 180 days
Beyond 180 days
0 - 3 months
3 - 6 months
6 - 9 months
9 - 12 months
I A Non receipt of Dividend on Units
0 3 3 0 0 0 0 0 0 0 0
I B Interest on delayed payment of Dividend
0 0 0 0 0 0 0 0 0 0 0
I C Non receipt of Redemption Proceeds
2 40 22 18 2 0 0 0 0 0 0
I D Interest on delayed payment of Redemption
0 2 1 1 0 0 0 0 0 0 0
II A Non receipt of Statement of Account/Unit Certifi cate
0 9 9 0 0 0 0 0 0 0 0
II B Discrepancy in Statement of Account
0 6 5 0 0 0 0 1 0 0 0
II C Data corrections in Investor details
0 277 277 0 0 0 0 0 0 0 0
II D Non receipt of Annual Report/Abridged Summary
0 0 0 0 0 0 0 0 0 0 0

8
HSBC Cash Fund
Trustees’ ReportFor the year ended March 31, 2013 (Contd...)
Com-plaintCode
Type of complaint#
(a) No. ofcomplaintspendingat the
beginningof theyear
(b) No. of com-plaints
receivedduring
theyear#
Action on (a) and (b)
Resolved Non Actiona-
ble
Pending
Within 30
days
30 - 60 days
60 - 180 days
Beyond 180 days
0 - 3 months
3 - 6 months
6 - 9 months
9 - 12 months
III A Wrong switch between Schemes
0 0 0 0 0 0 0 0 0 0 0
III B Unauthorized switch between Schemes
0 0 0 0 0 0 0 0 0 0 0
III C Deviation from Scheme attributes
0 0 0 0 0 0 0 0 0 0 0
III D Wrong or excess charges/load
0 0 0 0 0 0 0 0 0 0 0
III E Non updation of changes viz. address, PAN, bank details, nomination, etc
0 18 18 0 0 0 0 0 0 0 0
IV Others 0 14 12 1 1 0 0 0 0 0 0
Total 2 369 347 20 3 0 0 1 0 0 0
Note:# including against its authorized persons / distributors / employees etc.
8. STATUTORY DETAILSa) The Sponsors are not responsible or liable for any loss resulting from the operation of the Schemes of
the Fund beyond initial contribution of Rs. 1 lakh for setting up the Fund.
b) The price and redemption value of the units, and income from them, can go up as well as down with fl uctuations in the market value of its underlying investments.
c) Full Annual Report shall be disclosed on the website at www.assetmanagement.hsbc.com/in and shall be available for inspection at the Head Offi ce of the mutual fund. Present and prospective unit holder can obtain copy of the trust deed, the full Annual Report of the Scheme(s), the Annual Report of HSBC Asset Management (India) Private Limited and the text of the relevant Scheme(s) at a price.
9. ACKNOWLEDGEMENTSThe Trustees wish to thank the Unit holders of the Schemes for their support throughout the year and also thank the Government of India, the Securities and Exchange Board of India (SEBI), the Reserve Bank of India (RBI) and the Association of Mutual Funds in India (AMFI) for the guidance provided by them. The Trustees also appreciate the service provided by the Registrar and Transfer Agent, Fund Accountant, Custodian, Bankers, Distributors and Brokers. The guidance and services provided by the Auditors and advocates and the ebullience, sincerity and dedication of the employees of HSBC Asset Management (India) Private Limited is also appreciated.
The Trustees look forward to the continued support of everyone.
For and on behalf of the Board of Trustees of HSBC Mutual Fund
Sd/-
Dilip J. Thakkar
Trustee
MUMBAIJuly 16, 2013
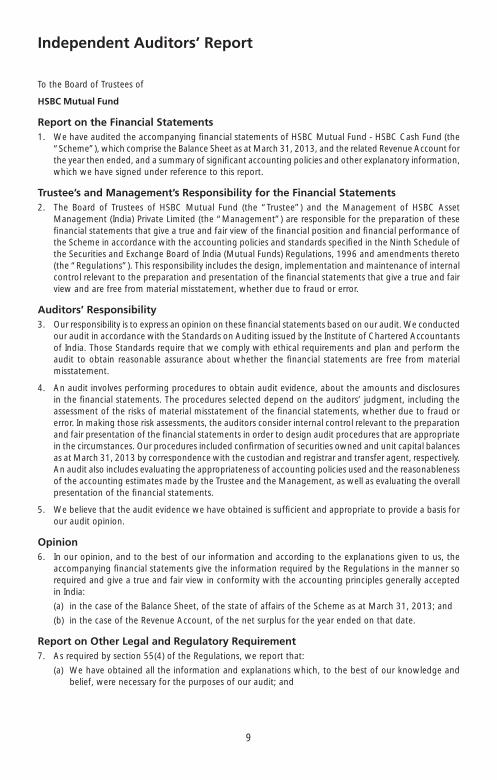
9
HSBC Cash Fund
Independent Auditors’ Report
To the Board of Trustees of
HSBC Mutual Fund
Report on the Financial Statements1. We have audited the accompanying fi nancial statements of HSBC Mutual Fund - HSBC Cash Fund (the
“Scheme”), which comprise the Balance Sheet as at March 31, 2013, and the related Revenue Account for the year then ended, and a summary of signifi cant accounting policies and other explanatory information, which we have signed under reference to this report.
Trustee’s and Management’s Responsibility for the Financial Statements2. The Board of Trustees of HSBC Mutual Fund (the “Trustee”) and the Management of HSBC Asset
Management (India) Private Limited (the “Management”) are responsible for the preparation of these fi nancial statements that give a true and fair view of the fi nancial position and fi nancial performance of the Scheme in accordance with the accounting policies and standards specifi ed in the Ninth Schedule of the Securities and Exchange Board of India (Mutual Funds) Regulations, 1996 and amendments thereto (the “Regulations”). This responsibility includes the design, implementation and maintenance of internal control relevant to the preparation and presentation of the fi nancial statements that give a true and fair view and are free from material misstatement, whether due to fraud or error.
Auditors’ Responsibility3. Our responsibility is to express an opinion on these fi nancial statements based on our audit. We conducted
our audit in accordance with the Standards on Auditing issued by the Institute of Chartered Accountants of India. Those Standards require that we comply with ethical requirements and plan and perform the audit to obtain reasonable assurance about whether the fi nancial statements are free from material misstatement.
4. An audit involves performing procedures to obtain audit evidence, about the amounts and disclosures in the fi nancial statements. The procedures selected depend on the auditors’ judgment, including the assessment of the risks of material misstatement of the fi nancial statements, whether due to fraud or error. In making those risk assessments, the auditors consider internal control relevant to the preparation and fair presentation of the fi nancial statements in order to design audit procedures that are appropriate in the circumstances. Our procedures included confi rmation of securities owned and unit capital balances as at March 31, 2013 by correspondence with the custodian and registrar and transfer agent, respectively. An audit also includes evaluating the appropriateness of accounting policies used and the reasonableness of the accounting estimates made by the Trustee and the Management, as well as evaluating the overall presentation of the fi nancial statements.
5. We believe that the audit evidence we have obtained is suffi cient and appropriate to provide a basis for our audit opinion.
Opinion6. In our opinion, and to the best of our information and according to the explanations given to us, the
accompanying fi nancial statements give the information required by the Regulations in the manner so required and give a true and fair view in conformity with the accounting principles generally accepted in India:
(a) in the case of the Balance Sheet, of the state of affairs of the Scheme as at March 31, 2013; and
(b) in the case of the Revenue Account, of the net surplus for the year ended on that date.
Report on Other Legal and Regulatory Requirement7. As required by section 55(4) of the Regulations, we report that:
(a) We have obtained all the information and explanations which, to the best of our knowledge and belief, were necessary for the purposes of our audit; and

10
HSBC Cash Fund
(b) In our opinion, the Balance Sheet and Revenue Account, dealt with by this report have been prepared in accordance with the accounting policies and standards specifi ed in the Ninth Schedule of the Regulations.
8. As required by clause 5 (ii)(2) of the Eleventh Schedule to the Regulations, we report that the Balance Sheet and Revenue Account dealt with by this Report are in agreement with the books of account of the Scheme.
9. In our opinion, the methods used to value non-traded securities where applicable as at March 31, 2013, as determined by HSBC Asset Management (India) Private Limited under procedures approved by the Board of Trustees of HSBC Mutual Fund in accordance with the guidelines for valuation of securities for mutual funds as mentioned in the Eighth Schedule of the Regulations issued by the Securities and Exchange Board of India, are fair and reasonable.
For PRICE WATERHOUSEFirm Registration Number: 301112EChartered Accountants
Sd/-
Vivek PrasadPartnerMembership Number: 104941
Place : MumbaiDate : July 16, 2013
Independent Auditors’ Report (Contd...)

March 31, 2013 March 31, 2012 March 31, 2013 March 31, 2012 March 31, 2013 March 31, 2012Schedule Rupees Rupees Rupees Rupees Rupees Rupees
ASSETS
Investments 1 2,325,651,516 2,830,668,048 442,918,256 382,280,136 4,620,323,377 857,818,960 Deposits 2 243,777 - - 53,056,141 164,100,000 94,349,208 Other Current Assets 3 252,074,848 11,934,109 16,519,908 136,664,711 62,466,328 1,020,928,192
TOTAL 2,577,970,140 2,842,602,157 459,438,164 572,000,988 4,846,889,705 1,973,096,360
LIABILITIES
Unit Capital 4 1,838,134,171 2,484,230,677 440,111,719 548,714,728 4,500,261,817 1,850,329,035 Reserves and Surplus 5 485,249,144 346,784,023 17,194,743 20,107,086 189,818,712 114,172,010 Current Liabilities and Provisions 6 254,586,825 11,587,457 2,131,703 3,179,174 156,809,176 8,595,315
TOTAL 2,577,970,140 2,842,602,157 459,438,164 572,000,988 4,846,889,705 1,973,096,360
-0.30Notes to the Financial Statements. 8
The Schedules referred to herein form an integral part of the Financial Statements.
This is the Balance Sheet referred to in our report of even date.
For PRICE WATERHOUSE For Board of Trustees of For HSBC Asset Management (India)Firm Registration Number: 301112E HSBC Mutual Fund Private LimitedChartered Accountants
sd/- sd/- sd/-VIVEK PRASAD N. P. Gidwani Puneet ChaddhaPartner Trustee Director and Chief Executive OfficerMembership No. 104941
sd/- sd/-Dilip J. Thakkar Kishori J. UdeshiTrustee Director
sd/- sd/-Sanjay Shah Ruchir ParekhFund Manager Fund Manager
Place: MumbaiDate: July 16 , 2013
HSBC MUTUAL FUND - HSBC FLOATING RATE FUND - LONG TERM PLAN, HSBC ULTRA SHORT TERM BOND FUND and HSBC CASH FUND
Balance Sheet as at March 31, 2013
HSBC FLOATING RATE FUND - LONG TERM PLAN HSBC ULTRA SHORT TERM BOND FUND HSBC CASH FUND

H35858 H43299 H27335
April 01, 2012 to April 01, 2011 to April 01, 2012 to April 01, 2011 to April 01, 2012 to April 01, 2011 toMarch 31, 2013 March 31, 2012 March 31, 2013 March 31, 2012 March 31, 2013 March 31, 2012
Schedule Rupees Rupees Rupees Rupees Rupees Rupees
INCOME AND GAINS
Interest and Discount 7 349,695,379 394,880,077 52,817,681 90,853,532 340,134,905 294,853,395 Net Profit on Sale of Investments (Note 2.3) - - 75,120 - 212,527 - Miscellaneous Income (Note 17) - 111,671 23,667 55 - -
TOTAL 349,695,379 394,991,748 52,916,468 90,853,587 340,347,432 294,853,395
EXPENSES AND LOSSES
Net Loss on Sale of Investments (Note 2.3) 1,841,177 627,096 - 3,651,060 - 475,223 Investment Management and Advisory Fees (Note 3) 8,226,676 8,495,941 3,756,173 7,606,479 3,322,293 9,730,078 Transfer Agent Fees and Expenses 1,755,565 2,326,318 240,873 540,094 1,756,671 1,796,932 Trusteeship Fees and Expenses (Note 4) 2,858 6,584 318 1,613 2,180 5,480 Custodian Fees and Expenses (Note 5) 730,847 805,626 78,563 102,722 455,431 266,570 Audit Fees 37,293 89,976 20,000 20,000 157,042 79,224 Investor Education Expenses 328,112 - 61,824 - 509,312 - Selling and Distribution Expenses 4,513,152 3,561,719 1,427,316 1,952,878 3,990,246 3,440,676 Other Operating Expenses 1,286,158 1,222,461 536,557 939,756 969,784 1,546,414
TOTAL 18,721,838 17,135,721 6,121,624 14,814,602 11,162,959 17,340,597
Less: Expenses to be Reimbursed by the Investment Manager (Note 7) - - - - 758,927 243,507
TOTAL 18,721,838 17,135,721 6,121,624 14,814,602 10,404,032 17,097,090
Net Realised Gains for the Year 330,973,541 377,856,027 46,794,844 76,038,985 329,943,400 277,756,305
Net Change in Unrealised Depreciation in Value of Investments (Note 2.2 and 8) - - - 5,761,295 - -
Net Gains for the Year 330,973,541 377,856,027 46,794,844 81,800,280 329,943,400 277,756,305
Net Change in Unrealised Appreciation in Value of Investments (Note 2.2 and 8) 252,446 - 191,621 - 77,953 -
Net Surplus including Net change in Unrealised Appreciation / Depreciation in Value of Investments 331,225,987 377,856,027 46,986,465 81,800,280 330,021,353 277,756,305
Net Change in Unrealised Appreciation in Value of Investments transferred to Unrealised Appreciation Reserve (252,446) - (191,621) - (77,953) -
Net Surplus for the Year 330,973,541 377,856,027 46,794,844 81,800,280 329,943,400 277,756,305
April 01, 2012 to April 01, 2011 to April 01, 2012 to April 01, 2011 to April 01, 2012 to April 01, 2011 toMarch 31, 2013 March 31, 2012 March 31, 2013 March 31, 2012 March 31, 2013 March 31, 2012
Rupees Rupees Rupees Rupees Rupees Rupees
Net Surplus for the Year 330,973,541 377,856,027 46,794,844 81,800,280 329,943,400 277,756,305 Transfer from Income Equalisation Reserve (Note 2.7) 137,056,753 (930,433) (7,216,662) (25,712,602) 219,794,760 (373,170,101) Transfer from Reserve Fund 130,829,979 62,797,961 24,816,519 40,087,097 (305,950,704) 36,648,748 Dividend / Distribution (207,074,315) (243,578,447) (36,460,213) (59,950,502) (178,661,727) (189,182,979) Dividend / Distribution Tax thereon (58,667,192) (65,315,129) (6,231,377) (11,407,754) (55,160,420) (58,002,677)
Balance Transferred to Reserve Fund 333,118,766 130,829,979 21,703,111 24,816,519 9,965,309 (305,950,704)
Notes to the Financial Statements. 8The schedules referred to herein form an integral part of the Financial Statements.This is the Revenue Account referred to in our report of even date.
287,966 For PRICE WATERHOUSE 207072126.1 For Board of Trustees of For HSBC Asset Management (India)Firm Registration Number: 301112E 207,245,883 HSBC Mutual Fund Private LimitedChartered Accountants -206957916.6
sd/- sd/- sd/-VIVEK PRASAD N. P. Gidwani Puneet ChaddhaPartner Trustee Director and Chief Executive OfficerMembership No. 104941
sd/- sd/-Dilip J. Thakkar Kishori J. UdeshiTrustee Director
sd/- sd/-Sanjay Shah Ruchir ParekhFund Manager Fund Manager
Place: MumbaiDate: July 16 , 2013
HSBC MUTUAL FUND - HSBC FLOATING RATE FUND - LONG TERM PLAN, HSBC ULTRA SHORT TERM BOND FUND and HSBC CASH FUND
Revenue Account for the year ended March 31, 2013
HSBC FLOATING RATE FUND - LONG TERM PLAN HSBC ULTRA SHORT TERM BOND FUND HSBC CASH FUND

SCHEDULE 1Investments Market/Fair Value Cost Market/Fair Value Cost Market/Fair Value Cost Market/Fair Value Cost Market/Fair Value Cost Market/Fair Value Cost (Notes 2.2, 2.3, 5A, 8, 9, 10 and 14) Rupees Rupees Rupees Rupees Rupees Rupees Rupees Rupees Rupees Rupees Rupees Rupees (Refer to the attached Statement of Portfolio Holding as at March 31, 2013)
Commercial Paper / Certificate of Deposit 2,325,651,516 2,325,399,070 2,830,668,048 2,830,668,048 442,918,256 442,726,635 382,280,136 382,280,136 4,620,323,377 4,620,245,424 857,818,960 857,818,960
TOTAL 2,325,651,516 2,325,399,070 2,830,668,048 2,830,668,048 442,918,256 442,726,635 382,280,136 382,280,136 4,620,323,377 4,620,245,424 857,818,960 857,818,960
SCHEDULE 2 March 31, 2013 March 31, 2012 March 31, 2013 March 31, 2012 March 31, 2013 March 31, 2012Deposits Rupees Rupees Rupees Rupees Rupees Rupees
Deposits with Scheduled Bank - - - - 164,000,000 - Margin Deposit for National Depository Service - - - - 100,000 100,000 Margin Deposit with Clearing Corporation of India Limited towards Collateralised Borrowing and Lending Obligation - - - 6,411,618 - 15,607,892 Margin Deposit with Clearing Corporation of India Limited towards Reverse Repos and Government Securities 243,777 - - 46,644,523 - 78,641,316
TOTAL 243,777 - - 53,056,141 164,100,000 94,349,208
SCHEDULE 3 March 31, 2013 March 31, 2012 March 31, 2013 March 31, 2012 March 31, 2013 March 31, 2012Other Current Assets Rupees Rupees Rupees Rupees Rupees Rupees
Balances with Banks - in Current Account 853,260 136,711 73,622 1,353,832 10,147,409 15,876,114 - in Dividend Account 9,749 41,747 22 22 - - Securities Pending Allotment - Certificate of Deposit 248,520,000 - - - Reverse Repos 2,004,729 - 12,468,778 - 32,428,546 - Collateralised Borrowing and Lending Obligation 606,055 7,624,375 3,769,020 133,404,187 18,696,840 1,002,260,326 Unit Subscription Receivable 30,001 2,150,000 - 418,000 - - Inter-Scheme Receivable- For 'Switch-In' - 1,976,360 50,001 29,639 - - - For 'Others' - - - - - 434 Interest Receivable on :- Debentures / Bonds - - 5,445 5,445 868 - - Deposits - - - 365,571 265,282 1,110,665 - Reverse Repos 3,250 - 20,207 - 52,554 - - Collateralised Borrowing and Lending Obligation 757 4,916 4,709 86,012 15,902 646,202 Receivable from Investment Manager - - 7,971 633,480 858,927 933,583 Investment Towards Unclaimed Redemption (Note 15) 14,801 - 35,000 368,523 - - Investment Towards Unclaimed Dividend (Note 15) 32,246 - - - - - Miscellaneous Receivables - - 85,133 - - 100,868
TOTAL 252,074,848 11,934,109 16,519,908 136,664,711 62,466,328 1,020,928,192
March 31, 2012March 31, 2013 March 31, 2012 March 31, 2013 March 31, 2012 March 31, 2013
HSBC CASH FUND
HSBC MUTUAL FUND - HSBC FLOATING RATE FUND - LONG TERM PLAN, HSBC ULTRA SHORT TERM BOND FUND and HSBC CASH FUND
Schedules forming part of the Balance Sheet as at March 31, 2013and the Revenue Account for the year ended March 31, 2013
HSBC FLOATING RATE FUND - LONG TERM PLAN HSBC ULTRA SHORT TERM BOND FUND
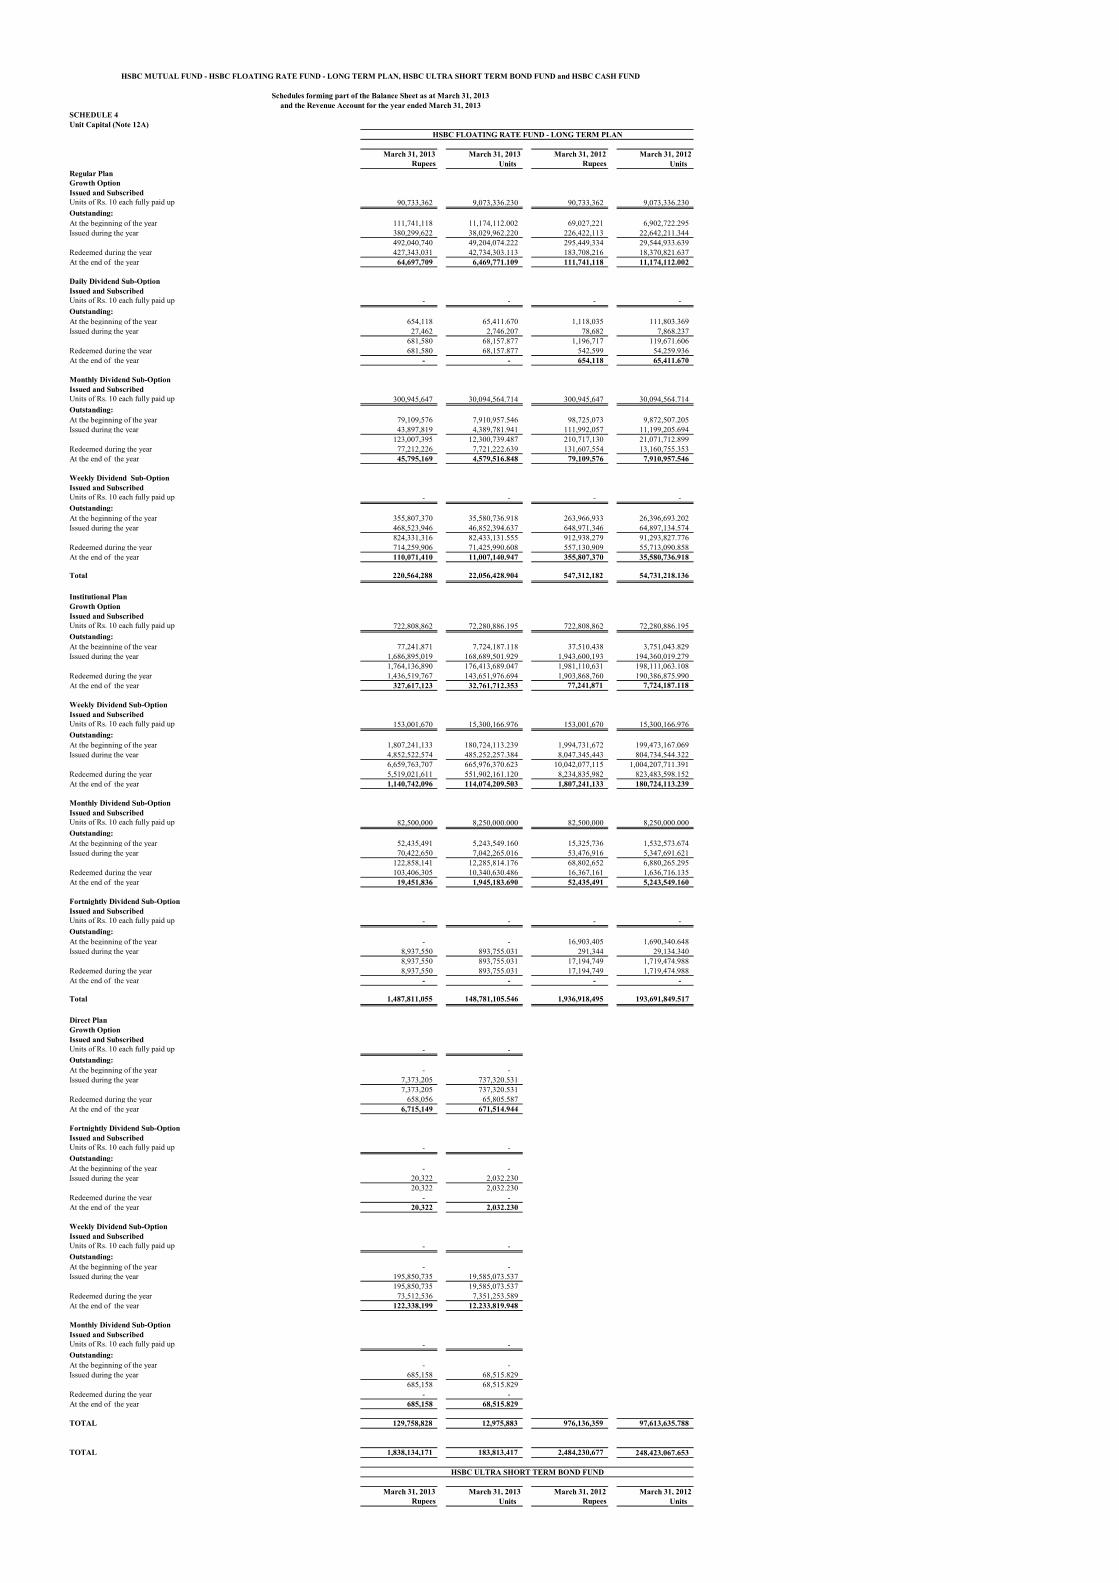
SCHEDULE 4Unit Capital (Note 12A)
March 31, 2013 March 31, 2013 March 31, 2012 March 31, 2012 Rupees Units Rupees Units
Growth OptionIssued and SubscribedUnits of Rs. 10 each fully paid up 90,733,362 9,073,336.230 90,733,362 9,073,336.230 Outstanding:At the beginning of the year 111,741,118 11,174,112.002 69,027,221 6,902,722.295 Issued during the year 380,299,622 38,029,962.220 226,422,113 22,642,211.344
492,040,740 49,204,074.222 295,449,334 29,544,933.639 Redeemed during the year 427,343,031 42,734,303.113 183,708,216 18,370,821.637 At the end of the year 64,697,709 6,469,771.109 111,741,118 11,174,112.002
Daily Dividend Sub-Option Issued and SubscribedUnits of Rs. 10 each fully paid up - - - - Outstanding:At the beginning of the year 654,118 65,411.670 1,118,035 111,803.369 Issued during the year 27,462 2,746.207 78,682 7,868.237
681,580 68,157.877 1,196,717 119,671.606 Redeemed during the year 681,580 68,157.877 542,599 54,259.936 At the end of the year - - 654,118 65,411.670
Monthly Dividend Sub-OptionIssued and SubscribedUnits of Rs. 10 each fully paid up 300,945,647 30,094,564.714 300,945,647 30,094,564.714 Outstanding:At the beginning of the year 79,109,576 7,910,957.546 98,725,073 9,872,507.205 Issued during the year 43,897,819 4,389,781.941 111,992,057 11,199,205.694
123,007,395 12,300,739.487 210,717,130 21,071,712.899 Redeemed during the year 77,212,226 7,721,222.639 131,607,554 13,160,755.353 At the end of the year 45,795,169 4,579,516.848 79,109,576 7,910,957.546
Weekly Dividend Sub-OptionIssued and SubscribedUnits of Rs. 10 each fully paid up - - - - Outstanding:At the beginning of the year 355,807,370 35,580,736.918 263,966,933 26,396,693.202 Issued during the year 468,523,946 46,852,394.637 648,971,346 64,897,134.574
824,331,316 82,433,131.555 912,938,279 91,293,827.776 Redeemed during the year 714,259,906 71,425,990.608 557,130,909 55,713,090.858 At the end of the year 110,071,410 11,007,140.947 355,807,370 35,580,736.918
Total 220,564,288 22,056,428.904 547,312,182 54,731,218.136
Institutional PlanGrowth OptionIssued and SubscribedUnits of Rs. 10 each fully paid up 722,808,862 72,280,886.195 722,808,862 72,280,886.195 Outstanding:At the beginning of the year 77,241,871 7,724,187.118 37,510,438 3,751,043.829 Issued during the year 1,686,895,019 168,689,501.929 1,943,600,193 194,360,019.279
1,764,136,890 176,413,689.047 1,981,110,631 198,111,063.108 Redeemed during the year 1,436,519,767 143,651,976.694 1,903,868,760 190,386,875.990 At the end of the year 327,617,123 32,761,712.353 77,241,871 7,724,187.118
Weekly Dividend Sub-OptionIssued and SubscribedUnits of Rs. 10 each fully paid up 153,001,670 15,300,166.976 153,001,670 15,300,166.976 Outstanding:At the beginning of the year 1,807,241,133 180,724,113.239 1,994,731,672 199,473,167.069 Issued during the year 4,852,522,574 485,252,257.384 8,047,345,443 804,734,544.322
6,659,763,707 665,976,370.623 10,042,077,115 1,004,207,711.391 Redeemed during the year 5,519,021,611 551,902,161.120 8,234,835,982 823,483,598.152 At the end of the year 1,140,742,096 114,074,209.503 1,807,241,133 180,724,113.239
Monthly Dividend Sub-OptionIssued and SubscribedUnits of Rs. 10 each fully paid up 82,500,000 8,250,000.000 82,500,000 8,250,000.000 Outstanding:At the beginning of the year 52,435,491 5,243,549.160 15,325,736 1,532,573.674 Issued during the year 70,422,650 7,042,265.016 53,476,916 5,347,691.621
122,858,141 12,285,814.176 68,802,652 6,880,265.295 Redeemed during the year 103,406,305 10,340,630.486 16,367,161 1,636,716.135 At the end of the year 19,451,836 1,945,183.690 52,435,491 5,243,549.160
Fortnightly Dividend Sub-OptionIssued and SubscribedUnits of Rs. 10 each fully paid up - - - - Outstanding:At the beginning of the year - - 16,903,405 1,690,340.648 Issued during the year 8,937,550 893,755.031 291,344 29,134.340
8,937,550 893,755.031 17,194,749 1,719,474.988 Redeemed during the year 8,937,550 893,755.031 17,194,749 1,719,474.988 At the end of the year - - - -
Total 1,487,811,055 148,781,105.546 1,936,918,495 193,691,849.517
Direct PlanGrowth OptionIssued and SubscribedUnits of Rs. 10 each fully paid up - - Outstanding:At the beginning of the year - - Issued during the year 7,373,205 737,320.531
7,373,205 737,320.531 Redeemed during the year 658,056 65,805.587 At the end of the year 6,715,149 671,514.944
Fortnightly Dividend Sub-OptionIssued and SubscribedUnits of Rs. 10 each fully paid up - - Outstanding:At the beginning of the year - - Issued during the year 20,322 2,032.230
20,322 2,032.230 Redeemed during the year - - At the end of the year 20,322 2,032.230
Weekly Dividend Sub-OptionIssued and SubscribedUnits of Rs. 10 each fully paid up - - Outstanding:At the beginning of the year - - Issued during the year 195,850,735 19,585,073.537
195,850,735 19,585,073.537 Redeemed during the year 73,512,536 7,351,253.589 At the end of the year 122,338,199 12,233,819.948
Monthly Dividend Sub-OptionIssued and SubscribedUnits of Rs. 10 each fully paid up - - Outstanding:At the beginning of the year - - Issued during the year 685,158 68,515.829
685,158 68,515.829 Redeemed during the year - - At the end of the year 685,158 68,515.829
TOTAL 129,758,828 12,975,883 976,136,359 97,613,635.788
TOTAL 1,838,134,171 183,813,417 2,484,230,677 248,423,067.653
March 31, 2013 March 31, 2013 March 31, 2012 March 31, 2012 Rupees Units Rupees Units
HSBC MUTUAL FUND - HSBC FLOATING RATE FUND - LONG TERM PLAN, HSBC ULTRA SHORT TERM BOND FUND and HSBC CASH FUND
Schedules forming part of the Balance Sheet as at March 31, 2013and the Revenue Account for the year ended March 31, 2013
Regular Plan
HSBC FLOATING RATE FUND - LONG TERM PLAN
HSBC ULTRA SHORT TERM BOND FUND
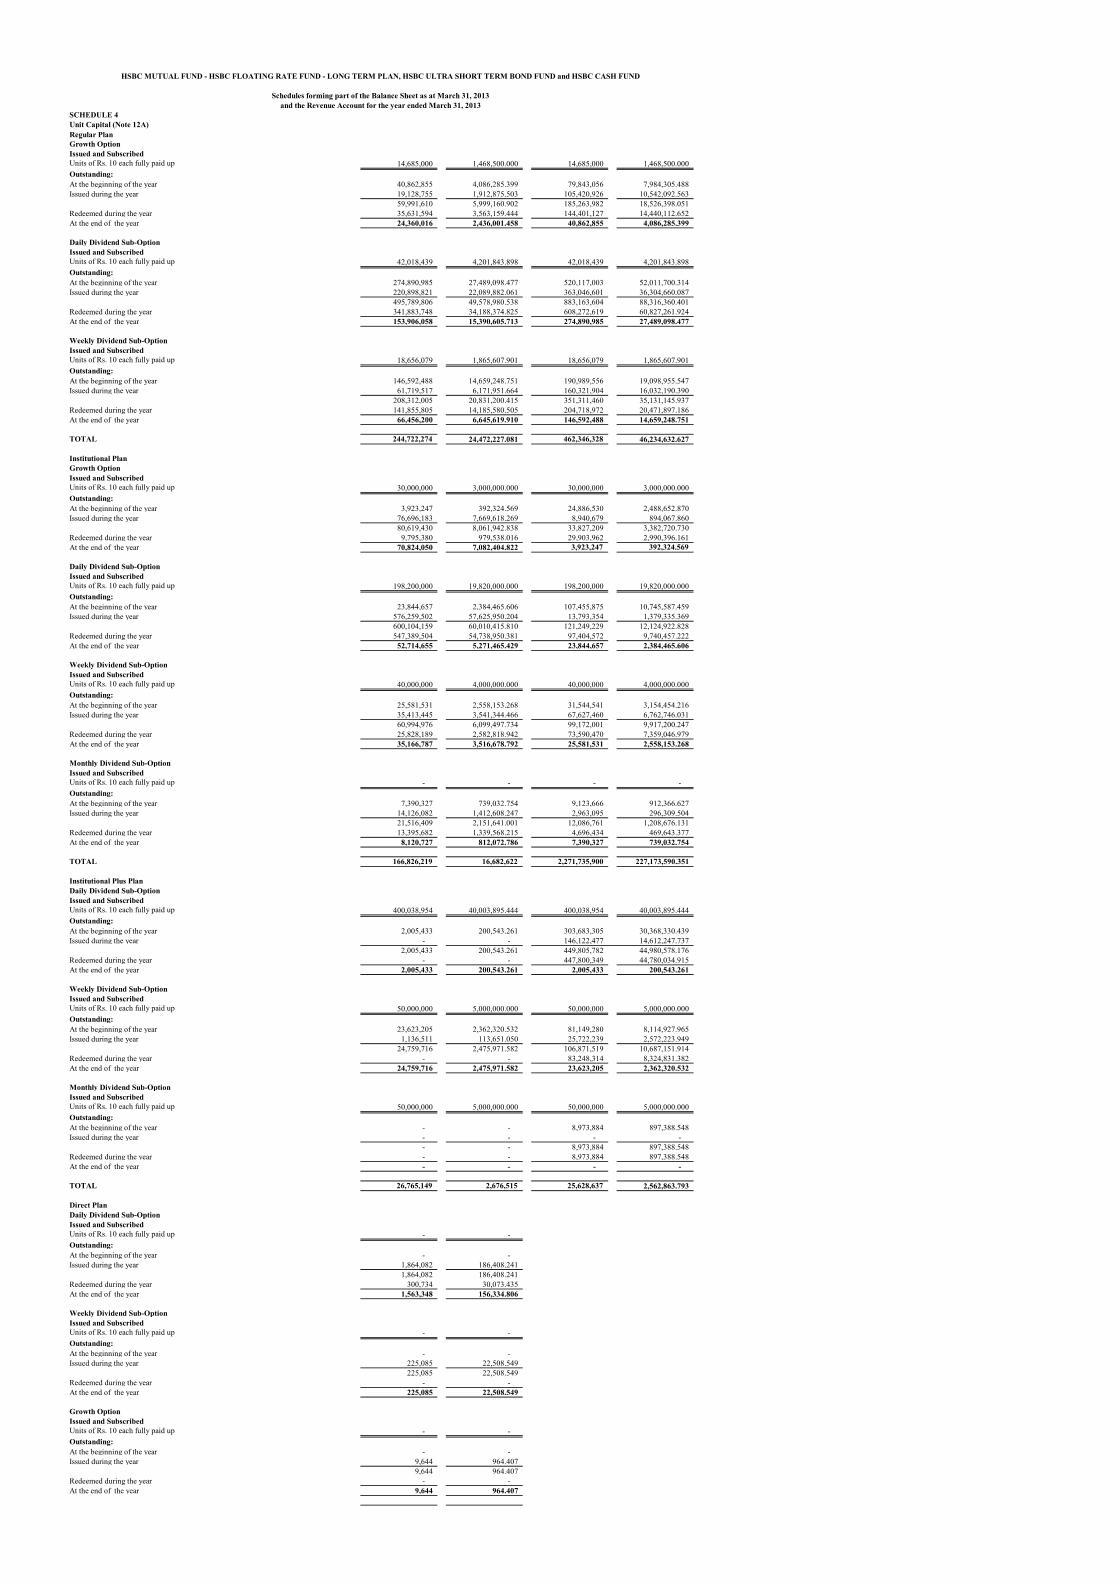
SCHEDULE 4Unit Capital (Note 12A)
HSBC MUTUAL FUND - HSBC FLOATING RATE FUND - LONG TERM PLAN, HSBC ULTRA SHORT TERM BOND FUND and HSBC CASH FUND
Schedules forming part of the Balance Sheet as at March 31, 2013and the Revenue Account for the year ended March 31, 2013
Growth OptionIssued and SubscribedUnits of Rs. 10 each fully paid up 14,685,000 1,468,500.000 14,685,000 1,468,500.000 Outstanding:At the beginning of the year 40,862,855 4,086,285.399 79,843,056 7,984,305.488 Issued during the year 19,128,755 1,912,875.503 105,420,926 10,542,092.563
59,991,610 5,999,160.902 185,263,982 18,526,398.051 Redeemed during the year 35,631,594 3,563,159.444 144,401,127 14,440,112.652 At the end of the year 24,360,016 2,436,001.458 40,862,855 4,086,285.399
Daily Dividend Sub-OptionIssued and SubscribedUnits of Rs. 10 each fully paid up 42,018,439 4,201,843.898 42,018,439 4,201,843.898 Outstanding:At the beginning of the year 274,890,985 27,489,098.477 520,117,003 52,011,700.314 Issued during the year 220,898,821 22,089,882.061 363,046,601 36,304,660.087
495,789,806 49,578,980.538 883,163,604 88,316,360.401 Redeemed during the year 341,883,748 34,188,374.825 608,272,619 60,827,261.924 At the end of the year 153,906,058 15,390,605.713 274,890,985 27,489,098.477
Weekly Dividend Sub-OptionIssued and SubscribedUnits of Rs. 10 each fully paid up 18,656,079 1,865,607.901 18,656,079 1,865,607.901 Outstanding:At the beginning of the year 146,592,488 14,659,248.751 190,989,556 19,098,955.547 Issued during the year 61,719,517 6,171,951.664 160,321,904 16,032,190.390
208,312,005 20,831,200.415 351,311,460 35,131,145.937 Redeemed during the year 141,855,805 14,185,580.505 204,718,972 20,471,897.186 At the end of the year 66,456,200 6,645,619.910 146,592,488 14,659,248.751
TOTAL 244,722,274 24,472,227.081 462,346,328 46,234,632.627
Institutional PlanGrowth OptionIssued and SubscribedUnits of Rs. 10 each fully paid up 30,000,000 3,000,000.000 30,000,000 3,000,000.000 Outstanding:At the beginning of the year 3,923,247 392,324.569 24,886,530 2,488,652.870 Issued during the year 76,696,183 7,669,618.269 8,940,679 894,067.860
80,619,430 8,061,942.838 33,827,209 3,382,720.730 Redeemed during the year 9,795,380 979,538.016 29,903,962 2,990,396.161 At the end of the year 70,824,050 7,082,404.822 3,923,247 392,324.569
Daily Dividend Sub-OptionIssued and SubscribedUnits of Rs. 10 each fully paid up 198,200,000 19,820,000.000 198,200,000 19,820,000.000 Outstanding:At the beginning of the year 23,844,657 2,384,465.606 107,455,875 10,745,587.459 Issued during the year 576,259,502 57,625,950.204 13,793,354 1,379,335.369
600,104,159 60,010,415.810 121,249,229 12,124,922.828 Redeemed during the year 547,389,504 54,738,950.381 97,404,572 9,740,457.222 At the end of the year 52,714,655 5,271,465.429 23,844,657 2,384,465.606
Weekly Dividend Sub-OptionIssued and SubscribedUnits of Rs. 10 each fully paid up 40,000,000 4,000,000.000 40,000,000 4,000,000.000 Outstanding:At the beginning of the year 25,581,531 2,558,153.268 31,544,541 3,154,454.216 Issued during the year 35,413,445 3,541,344.466 67,627,460 6,762,746.031
60,994,976 6,099,497.734 99,172,001 9,917,200.247 Redeemed during the year 25,828,189 2,582,818.942 73,590,470 7,359,046.979 At the end of the year 35,166,787 3,516,678.792 25,581,531 2,558,153.268
Monthly Dividend Sub-OptionIssued and SubscribedUnits of Rs. 10 each fully paid up - - - - Outstanding:At the beginning of the year 7,390,327 739,032.754 9,123,666 912,366.627 Issued during the year 14,126,082 1,412,608.247 2,963,095 296,309.504
21,516,409 2,151,641.001 12,086,761 1,208,676.131 Redeemed during the year 13,395,682 1,339,568.215 4,696,434 469,643.377 At the end of the year 8,120,727 812,072.786 7,390,327 739,032.754
TOTAL 166,826,219 16,682,622 2,271,735,900 227,173,590.351
Institutional Plus PlanDaily Dividend Sub-Option Issued and SubscribedUnits of Rs. 10 each fully paid up 400,038,954 40,003,895.444 400,038,954 40,003,895.444 Outstanding:At the beginning of the year 2,005,433 200,543.261 303,683,305 30,368,330.439 Issued during the year - - 146,122,477 14,612,247.737
2,005,433 200,543.261 449,805,782 44,980,578.176 Redeemed during the year - - 447,800,349 44,780,034.915 At the end of the year 2,005,433 200,543.261 2,005,433 200,543.261
Weekly Dividend Sub-Option Issued and SubscribedUnits of Rs. 10 each fully paid up 50,000,000 5,000,000.000 50,000,000 5,000,000.000 Outstanding:At the beginning of the year 23,623,205 2,362,320.532 81,149,280 8,114,927.965 Issued during the year 1,136,511 113,651.050 25,722,239 2,572,223.949
24,759,716 2,475,971.582 106,871,519 10,687,151.914 Redeemed during the year - - 83,248,314 8,324,831.382 At the end of the year 24,759,716 2,475,971.582 23,623,205 2,362,320.532
Monthly Dividend Sub-Option Issued and SubscribedUnits of Rs. 10 each fully paid up 50,000,000 5,000,000.000 50,000,000 5,000,000.000 Outstanding:At the beginning of the year - - 8,973,884 897,388.548 Issued during the year - - - -
- - 8,973,884 897,388.548 Redeemed during the year - - 8,973,884 897,388.548 At the end of the year - - - -
TOTAL 26,765,149 2,676,515 25,628,637 2,562,863.793
Direct PlanDaily Dividend Sub-OptionIssued and SubscribedUnits of Rs. 10 each fully paid up - - Outstanding:At the beginning of the year - - Issued during the year 1,864,082 186,408.241
1,864,082 186,408.241 Redeemed during the year 300,734 30,073.435 At the end of the year 1,563,348 156,334.806
Weekly Dividend Sub-OptionIssued and SubscribedUnits of Rs. 10 each fully paid up - - Outstanding:At the beginning of the year - - Issued during the year 225,085 22,508.549
225,085 22,508.549 Redeemed during the year - - At the end of the year 225,085 22,508.549
Growth OptionIssued and SubscribedUnits of Rs. 10 each fully paid up - - Outstanding:At the beginning of the year - - Issued during the year 9,644 964.407
9,644 964.407 Redeemed during the year - - At the end of the year 9,644 964.407
Regular Plan

SCHEDULE 4Unit Capital (Note 12A)
HSBC MUTUAL FUND - HSBC FLOATING RATE FUND - LONG TERM PLAN, HSBC ULTRA SHORT TERM BOND FUND and HSBC CASH FUND
Schedules forming part of the Balance Sheet as at March 31, 2013and the Revenue Account for the year ended March 31, 2013
TOTAL 1,798,077 179,808
TOTAL 440,111,719 44,011,172 548,714,728 54,871,473
March 31, 2013 March 31, 2013 March 31, 2012 March 31, 2012 Rupees Units Rupees Units
Growth OptionIssued and SubscribedUnits of Rs. 10 each fully paid up 1,087,475,000 108,747,500.000 1,087,475,000 108,747,500.000 Outstanding:At the beginning of the year 109,317,864 10,931,786.294 102,609,994 10,260,999.241
Transferred on account of merger with HSBC Floating Rate Fund - Short Term Plan ## 27,529,378 2,752,937.847 Issued during the year 487,742,491 48,774,249.104 297,790,156 29,779,015.576
597,060,355 59,706,035.398 427,929,528 42,792,952.664 Redeemed during the year 544,903,142 54,490,314.171 318,611,664 31,861,166.370 Balance prior to Face Value change on December 30, 2012 52,157,213 5,215,721.227 Change in Face Value From Rs 10 to Rs. 1000Switch-outs to facilitate change in Face Value 52,157,213 5,215,721.227
- - Switch-ins at Rs. 1000/- Face Value 52,157,213 52,157.212 Issued during the period post face value change - -
52,157,213 52,157.212 Redeemed during the period post face value change 7,282,194 7,282.194 At the end of the year 44,875,019 44,875.018 109,317,864 10,931,786.294
Daily Dividend Sub-OptionIssued and SubscribedUnits of Rs. 10 each fully paid up - - - - Outstanding:At the beginning of the year 344,224,272 34,422,427.234 578,251,503 57,825,150.324
Transferred on account of merger with HSBC Floating Rate Fund - Short Term Plan ## 42,847,448 4,284,744.827 Issued during the year 416,928,998 41,692,899.753 762,677,211 76,267,721.099
761,153,269 76,115,326.987 1,383,776,162 138,377,616.250 Redeemed during the year 452,779,211 45,277,921.116 1,039,551,890 103,955,189.016 Balance prior to Face Value change on December 30, 2012 308,374,058 30,837,405.871 Change in Face Value From Rs 10 to Rs. 1000Switch-outs to facilitate change in Face Value 308,374,058 30,837,405.871
- - Switch-ins at Rs. 1000/- Face Value 308,374,058 308,374.059 Issued during the period post face value change - -
308,374,058 308,374.059 Redeemed during the period post face value change 20,918,959 20,918.959 At the end of the year 287,455,099 287,455.100 344,224,272 34,422,427.234
Weekly Dividend Sub-OptionIssued and SubscribedUnits of Rs. 10 each fully paid up 450,000 45,000.000 450,000 45,000.000 Outstanding:At the beginning of the year 172,201,533 17,220,153.452 71,717,278 7,171,727.950
Transferred on account of merger with HSBC Floating Rate Fund - Short Term Plan ## 8,336,772 833,677.180 Issued during the year 112,350,786 11,235,078.559 268,288,632 26,828,863.244
284,552,319 28,455,232.011 348,342,682 34,834,268.374 Redeemed during the year 281,347,289 28,134,728.896 176,141,149 17,614,114.922 Balance prior to Face Value change on December 30, 2012 3,205,030 320,503.115 Change in Face Value From Rs 10 to Rs. 1000Switch-outs to facilitate change in Face Value 3,205,030 320,503.115
- (0.000) Switch-ins at Rs. 1000/- Face Value 3,205,030 3,205.031 Issued during the period post face value change 146,291,023 146,291.023
149,496,053 149,496.054 Redeemed during the period post face value change 6,368,958 6,368.958 At the end of the year 143,127,095 143,127.096 172,201,533 17,220,153.452
TOTAL 475,457,213 475,457.214 625,743,669 62,574,366.980
Institutional PlanGrowth OptionIssued and SubscribedUnits of Rs. 10 each fully paid up 47,916,128 4,791,612.761 47,916,128 4,791,612.761 Outstanding:At the beginning of the year 19,372,826 1,937,282.591 3,167,723 316,772.289
Transferred on account of merger with HSBC Floating Rate Fund - Short Term Plan ## 142,639 14,263.900 Issued during the year 54,051,284 5,405,128.376 138,536,493 13,853,649.265
73,424,110 7,342,410.967 141,846,855 14,184,685.454 Redeemed during the year 70,219,079 7,021,907.853 122,474,029 12,247,402.863 Balance prior to Face Value change on December 30, 2012 3,205,032 320,503.114 Change in Face Value From Rs 10 to Rs. 1000Switch-outs to facilitate change in Face Value 3,205,032 320,503.114
- - Switch-ins at Rs. 1000/- Face Value 3,205,032 3,205.031 Issued during the period post face value change - -
3,205,032 3,205.031 Redeemed during the period post face value change - - At the end of the year 3,205,032 3,205.031 19,372,826 1,937,282.591
Daily Dividend Sub-OptionIssued and SubscribedUnits of Rs. 10 each fully paid up 257,272,623 25,727,262.274 257,272,623 25,727,262.274 Outstanding:At the beginning of the year 246,775,054 24,677,505.509 433,295,638 43,329,563.958 Issued during the year 230,471,699 23,047,169.914 1,121,714,047 112,171,404.696
477,246,753 47,724,675.423 1,555,009,685 155,500,968.654 Redeemed during the year 468,361,230 46,836,123.045 1,308,234,631 130,823,463.145 Balance prior to Face Value change on December 30, 2012 8,885,523 888,552.378 Change in Face Value From Rs 10 to Rs. 1000Switch-outs to facilitate change in Face Value 8,885,523 888,552.378
- - Switch-ins at Rs. 1000/- Face Value 8,885,523 8,885.524 Issued during the period post face value change - -
8,885,523 8,885.524 Redeemed during the period post face value change 208,897 208.897 At the end of the year 8,676,626 8,676.627 246,775,054 24,677,505.509
Weekly Dividend Sub-OptionIssued and SubscribedUnits of Rs. 10 each fully paid up 9,581,848 958,184.815 9,581,848 958,184.815 Outstanding:At the beginning of the year 4,748,390 474,839.089 13,836 1,383.633 Issued during the year 369,417,671 36,941,767.053 21,534,739 2,153,473.936
374,166,061 37,416,606.142 21,548,575 2,154,857.569 Redeemed during the year 374,166,061 37,416,606.142 16,800,185 1,680,018.480 Balance prior to Face Value change on December 30, 2012 - - Change in Face Value From Rs 10 to Rs. 1000Switch-outs to facilitate change in Face Value - -
- - Switch-ins at Rs. 1000/- Face Value - - Issued during the period post face value change -
- - Redeemed during the period post face value change - At the end of the year - - 4,748,390 474,839.089
Monthly Dividend Sub-OptionIssued and SubscribedUnits of Rs. 10 each fully paid up 239,580,638 23,958,063.805 239,580,638 23,958,063.805 Outstanding:At the beginning of the year 3,181,374 318,137.448 5,547,812 554,781.271 Issued during the year - - 18,894,305 1,889,430.526
3,181,374 318,137.448 24,442,117 2,444,211.797 Redeemed during the year 3,181,374 318,137.448 21,260,743 2,126,074.349 Balance prior to Face Value change on December 30, 2012 - - Change in Face Value From Rs 10 to Rs. 1000
HSBC CASH FUND
Regular Plan
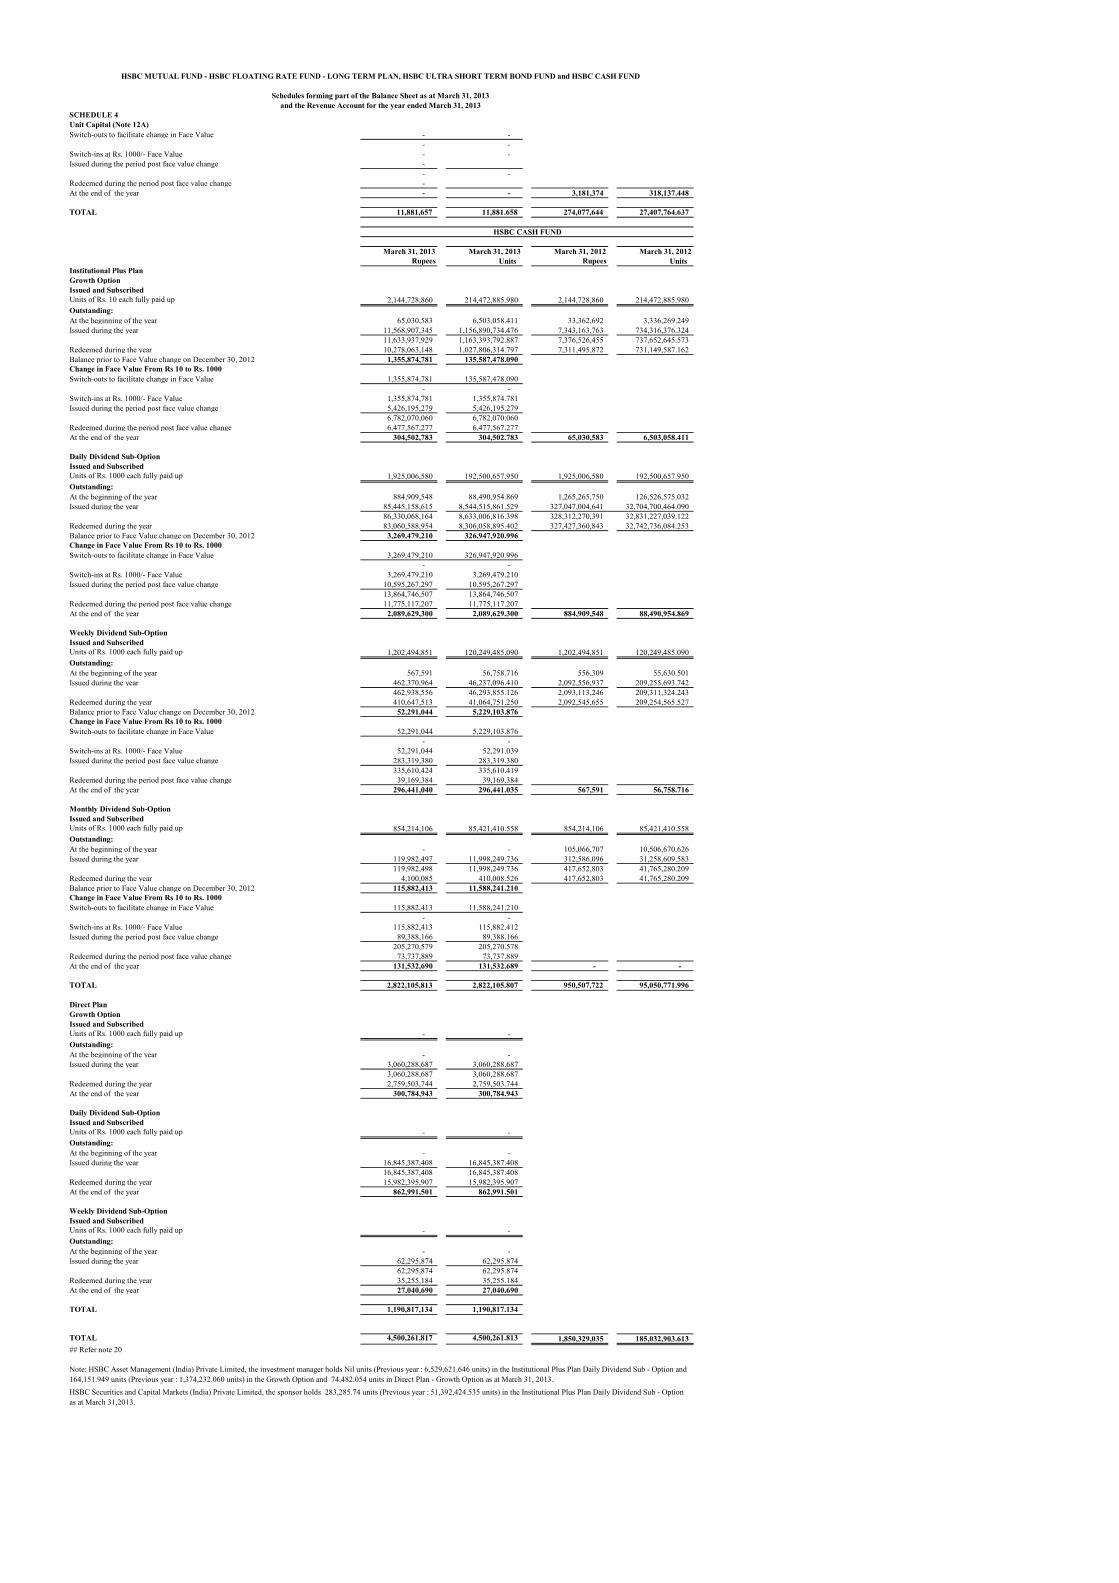
SCHEDULE 4Unit Capital (Note 12A)
HSBC MUTUAL FUND - HSBC FLOATING RATE FUND - LONG TERM PLAN, HSBC ULTRA SHORT TERM BOND FUND and HSBC CASH FUND
Schedules forming part of the Balance Sheet as at March 31, 2013and the Revenue Account for the year ended March 31, 2013
Switch-outs to facilitate change in Face Value - - - -
Switch-ins at Rs. 1000/- Face Value - - Issued during the period post face value change -
- - Redeemed during the period post face value change - At the end of the year - - 3,181,374 318,137.448
TOTAL 11,881,657 11,881.658 274,077,644 27,407,764.637
March 31, 2013 March 31, 2013 March 31, 2012 March 31, 2012 Rupees Units Rupees Units
Institutional Plus PlanGrowth Option Issued and SubscribedUnits of Rs. 10 each fully paid up 2,144,728,860 214,472,885.980 2,144,728,860 214,472,885.980 Outstanding:At the beginning of the year 65,030,583 6,503,058.411 33,362,692 3,336,269.249 Issued during the year 11,568,907,345 1,156,890,734.476 7,343,163,763 734,316,376.324
11,633,937,929 1,163,393,792.887 7,376,526,455 737,652,645.573 Redeemed during the year 10,278,063,148 1,027,806,314.797 7,311,495,872 731,149,587.162 Balance prior to Face Value change on December 30, 2012 1,355,874,781 135,587,478.090 Change in Face Value From Rs 10 to Rs. 1000Switch-outs to facilitate change in Face Value 1,355,874,781 135,587,478.090
- - Switch-ins at Rs. 1000/- Face Value 1,355,874,781 1,355,874.781 Issued during the period post face value change 5,426,195,279 5,426,195.279
6,782,070,060 6,782,070.060 Redeemed during the period post face value change 6,477,567,277 6,477,567.277 At the end of the year 304,502,783 304,502.783 65,030,583 6,503,058.411
Daily Dividend Sub-Option Issued and SubscribedUnits of Rs. 1000 each fully paid up 1,925,006,580 192,500,657.950 1,925,006,580 192,500,657.950 Outstanding:At the beginning of the year 884,909,548 88,490,954.869 1,265,265,750 126,526,575.032 Issued during the year 85,445,158,615 8,544,515,861.529 327,047,004,641 32,704,700,464.090
86,330,068,164 8,633,006,816.398 328,312,270,391 32,831,227,039.122 Redeemed during the year 83,060,588,954 8,306,058,895.402 327,427,360,843 32,742,736,084.253 Balance prior to Face Value change on December 30, 2012 3,269,479,210 326,947,920.996 Change in Face Value From Rs 10 to Rs. 1000Switch-outs to facilitate change in Face Value 3,269,479,210 326,947,920.996
- - Switch-ins at Rs. 1000/- Face Value 3,269,479,210 3,269,479.210 Issued during the period post face value change 10,595,267,297 10,595,267.297
13,864,746,507 13,864,746.507 Redeemed during the period post face value change 11,775,117,207 11,775,117.207 At the end of the year 2,089,629,300 2,089,629.300 884,909,548 88,490,954.869
Weekly Dividend Sub-Option Issued and SubscribedUnits of Rs. 1000 each fully paid up 1,202,494,851 120,249,485.090 1,202,494,851 120,249,485.090 Outstanding:At the beginning of the year 567,591 56,758.716 556,309 55,630.501 Issued during the year 462,370,964 46,237,096.410 2,092,556,937 209,255,693.742
462,938,556 46,293,855.126 2,093,113,246 209,311,324.243 Redeemed during the year 410,647,513 41,064,751.250 2,092,545,655 209,254,565.527 Balance prior to Face Value change on December 30, 2012 52,291,044 5,229,103.876 Change in Face Value From Rs 10 to Rs. 1000Switch-outs to facilitate change in Face Value 52,291,044 5,229,103.876
- - Switch-ins at Rs. 1000/- Face Value 52,291,044 52,291.039 Issued during the period post face value change 283,319,380 283,319.380
335,610,424 335,610.419 Redeemed during the period post face value change 39,169,384 39,169.384 At the end of the year 296,441,040 296,441.035 567,591 56,758.716
Monthly Dividend Sub-Option Issued and SubscribedUnits of Rs. 1000 each fully paid up 854,214,106 85,421,410.558 854,214,106 85,421,410.558 Outstanding:At the beginning of the year - - 105,066,707 10,506,670.626 Issued during the year 119,982,497 11,998,249.736 312,586,096 31,258,609.583
119,982,498 11,998,249.736 417,652,803 41,765,280.209 Redeemed during the year 4,100,085 410,008.526 417,652,803 41,765,280.209 Balance prior to Face Value change on December 30, 2012 115,882,413 11,588,241.210 Change in Face Value From Rs 10 to Rs. 1000Switch-outs to facilitate change in Face Value 115,882,413 11,588,241.210
- - Switch-ins at Rs. 1000/- Face Value 115,882,413 115,882.412 Issued during the period post face value change 89,388,166 89,388.166
205,270,579 205,270.578 Redeemed during the period post face value change 73,737,889 73,737.889 At the end of the year 131,532,690 131,532.689 - -
TOTAL 2,822,105,813 2,822,105.807 950,507,722 95,050,771.996
Direct PlanGrowth Option Issued and SubscribedUnits of Rs. 1000 each fully paid up - - Outstanding:At the beginning of the year - - Issued during the year 3,060,288,687 3,060,288.687
3,060,288,687 3,060,288.687 Redeemed during the year 2,759,503,744 2,759,503.744 At the end of the year 300,784,943 300,784.943
Daily Dividend Sub-Option Issued and SubscribedUnits of Rs. 1000 each fully paid up - - Outstanding:At the beginning of the year - - Issued during the year 16,845,387,408 16,845,387.408
16,845,387,408 16,845,387.408 Redeemed during the year 15,982,395,907 15,982,395.907 At the end of the year 862,991,501 862,991.501
Weekly Dividend Sub-OptionIssued and SubscribedUnits of Rs. 1000 each fully paid up - - Outstanding:At the beginning of the year - - Issued during the year 62,295,874 62,295.874
62,295,874 62,295.874 Redeemed during the year 35,255,184 35,255.184 At the end of the year 27,040,690 27,040.690
TOTAL 1,190,817,134 1,190,817.134
TOTAL 4,500,261,817 4,500,261.813 1,850,329,035 185,032,903.613 ## Refer note 20
Note: HSBC Asset Management (India) Private Limited, the investment manager holds Nil units (Previous year : 6,529,621.646 units) in the Institutional Plus Plan Daily Dividend Sub - Option and 164,151.949 units (Previous year : 1,374,232.060 units) in the Growth Option and 74,482.054 units in Direct Plan - Growth Option as at March 31, 2013.HSBC Securities and Capital Markets (India) Private Limited, the sponsor holds 283,285.74 units (Previous year : 51,392,424.535 units) in the Institutional Plus Plan Daily Dividend Sub - Option as at March 31,2013.
HSBC CASH FUND

H35858 H43299 H27335
SCHEDULE 5 March 31, 2013 March 31, 2012 March 31, 2013 March 31, 2012 March 31, 2013 March 31, 2012Reserves and Surplus Rupees Rupees Rupees Rupees Rupees Rupees
Unit Premium Reserve (Note 2.6)At the beginning of the year 215,954,044 237,856,519 (4,709,433) (222,218) 420,122,714 72,720,559
Added during the year (64,076,112) (21,902,475) 9,444 (4,487,215) (240,347,264) 166,210,981
Transferred on account of merger with HSBC Floating Rate Fund - Short Term Plan (Refer Note
20) - - - - - 181,191,174
At the end of the year 151,877,932 215,954,044 (4,699,989) (4,709,433) 179,775,450 420,122,714
Unrealised Appreciation ReserveAt the beginning of the year - - - - - -
Transferred from Revenue Reserve - - - - - -
Net Change in Unrealised Appreciation in Value of Investments Transferred from Revenue
Account (Note 8) 252,446 - 191,621 - 77,953 -
At the end of the year 252,446 - 191,621 - 77,953 -
Reserve FundAt the beginning of the year 130,829,979 62,797,961 24,816,519 40,087,097 (305,950,704) 36,648,748
Transferred to Revenue Account (130,829,979) (62,797,961) (24,816,519) (40,087,097) 305,950,704 (36,648,748)
Transferred to Unrealised Appreciation Reserve - - - - - -
Balance Transferred from Revenue Account 333,118,766 130,829,979 21,703,111 24,816,519 9,965,309 (305,950,704)
At the end of the year 333,118,766 130,829,979 21,703,111 24,816,519 9,965,309 (305,950,704)
TOTAL 485,249,144 * 346,784,023 * 17,194,743 * 20,107,086 * 189,818,712 * 114,172,010 *
HSBC MUTUAL FUND - HSBC FLOATING RATE FUND - LONG TERM PLAN, HSBC ULTRA SHORT TERM BOND FUND and HSBC CASH FUND
Schedules forming part of the Balance Sheet as at March 31, 2013and the Revenue Account for the year ended March 31, 2013
HSBC CASH FUNDHSBC FLOATING RATE FUND - LONG TERM PLAN HSBC ULTRA SHORT TERM BOND FUND
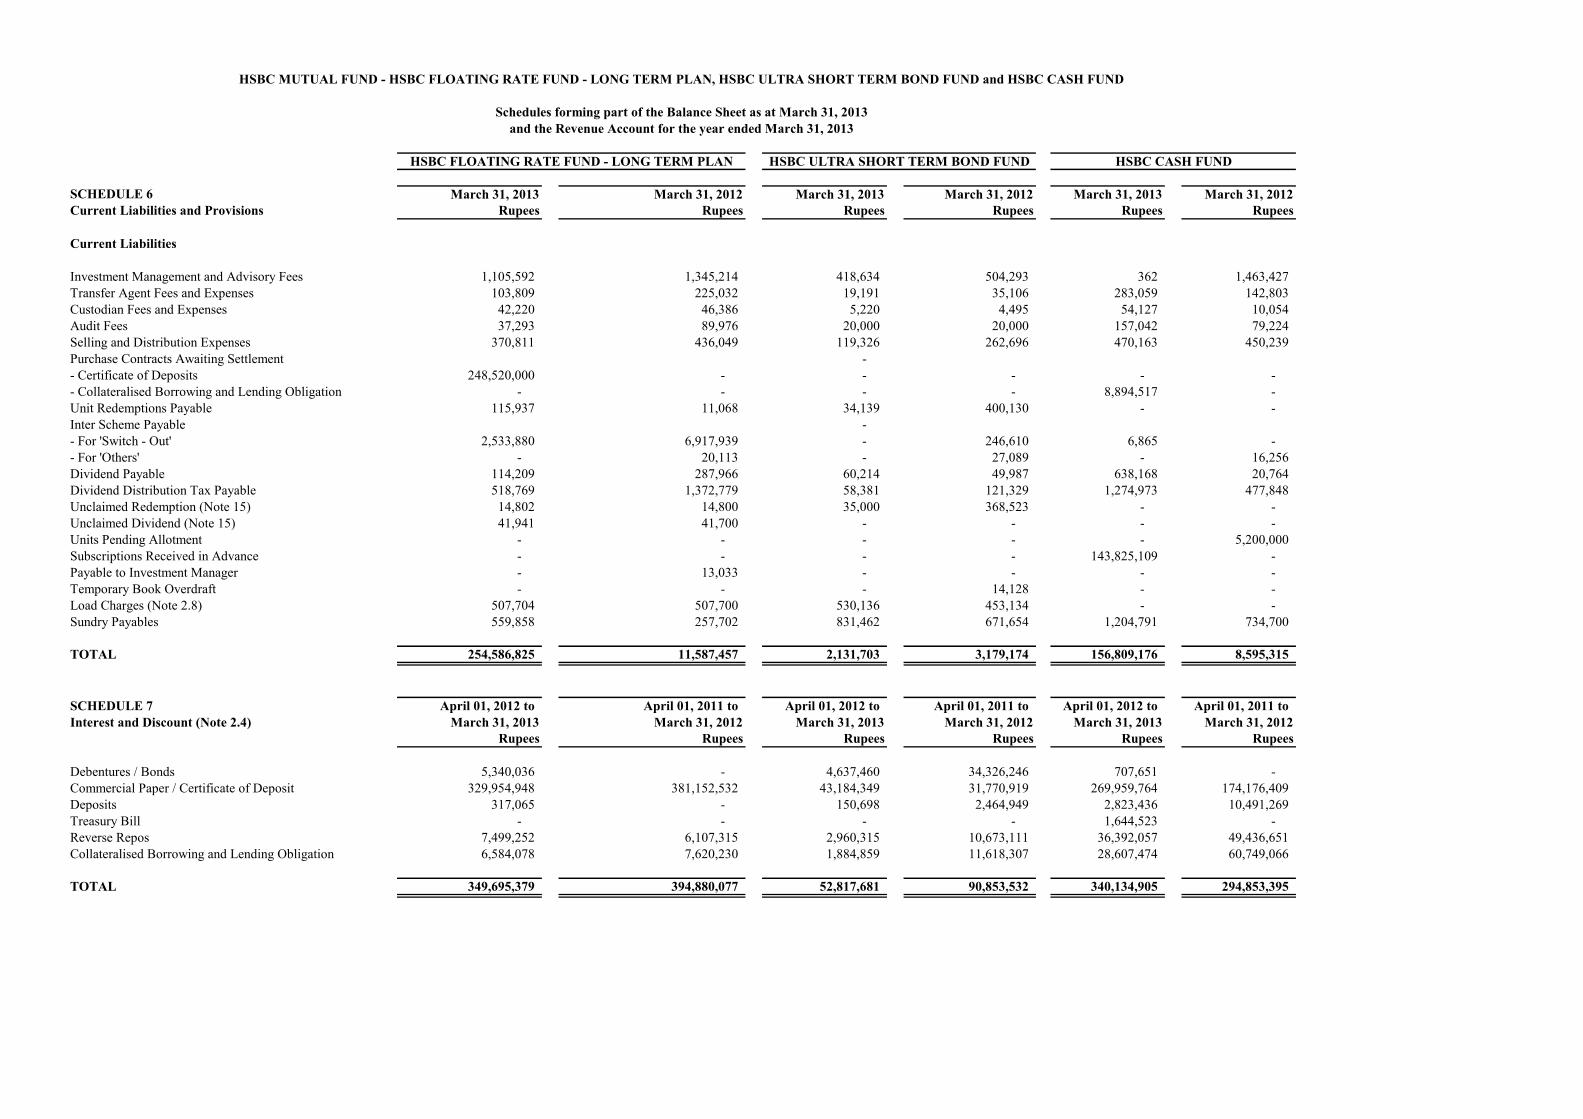
SCHEDULE 6 March 31, 2013 March 31, 2012 March 31, 2013 March 31, 2012 March 31, 2013 March 31, 2012Current Liabilities and Provisions Rupees Rupees Rupees Rupees Rupees Rupees
Current Liabilities
Investment Management and Advisory Fees 1,105,592 1,345,214 418,634 504,293 362 1,463,427 Transfer Agent Fees and Expenses 103,809 225,032 19,191 35,106 283,059 142,803 Custodian Fees and Expenses 42,220 46,386 5,220 4,495 54,127 10,054 Audit Fees 37,293 89,976 20,000 20,000 157,042 79,224 Selling and Distribution Expenses 370,811 436,049 119,326 262,696 470,163 450,239 Purchase Contracts Awaiting Settlement - - Certificate of Deposits 248,520,000 - - - - - - Collateralised Borrowing and Lending Obligation - - - - 8,894,517 - Unit Redemptions Payable 115,937 11,068 34,139 400,130 - - Inter Scheme Payable - - For 'Switch - Out' 2,533,880 6,917,939 - 246,610 6,865 - - For 'Others' - 20,113 - 27,089 - 16,256 Dividend Payable 114,209 287,966 60,214 49,987 638,168 20,764 Dividend Distribution Tax Payable 518,769 1,372,779 58,381 121,329 1,274,973 477,848 Unclaimed Redemption (Note 15) 14,802 14,800 35,000 368,523 - - Unclaimed Dividend (Note 15) 41,941 41,700 - - - - Units Pending Allotment - - - - - 5,200,000 Subscriptions Received in Advance - - - - 143,825,109 - Payable to Investment Manager - 13,033 - - - - Temporary Book Overdraft - - - 14,128 - - Load Charges (Note 2.8) 507,704 507,700 530,136 453,134 - - Sundry Payables 559,858 257,702 831,462 671,654 1,204,791 734,700
TOTAL 254,586,825 11,587,457 2,131,703 3,179,174 156,809,176 8,595,315
SCHEDULE 7 April 01, 2012 to April 01, 2011 to April 01, 2012 to April 01, 2011 to April 01, 2012 to April 01, 2011 toInterest and Discount (Note 2.4) March 31, 2013 March 31, 2012 March 31, 2013 March 31, 2012 March 31, 2013 March 31, 2012
Rupees Rupees Rupees Rupees Rupees Rupees
Debentures / Bonds 5,340,036 - 4,637,460 34,326,246 707,651 - Commercial Paper / Certificate of Deposit 329,954,948 381,152,532 43,184,349 31,770,919 269,959,764 174,176,409 Deposits 317,065 - 150,698 2,464,949 2,823,436 10,491,269 Treasury Bill - - - - 1,644,523 - Reverse Repos 7,499,252 6,107,315 2,960,315 10,673,111 36,392,057 49,436,651 Collateralised Borrowing and Lending Obligation 6,584,078 7,620,230 1,884,859 11,618,307 28,607,474 60,749,066
TOTAL 349,695,379 394,880,077 52,817,681 90,853,532 340,134,905 294,853,395
HSBC MUTUAL FUND - HSBC FLOATING RATE FUND - LONG TERM PLAN, HSBC ULTRA SHORT TERM BOND FUND and HSBC CASH FUND
Schedules forming part of the Balance Sheet as at March 31, 2013and the Revenue Account for the year ended March 31, 2013
HSBC CASH FUNDHSBC FLOATING RATE FUND - LONG TERM PLAN HSBC ULTRA SHORT TERM BOND FUND
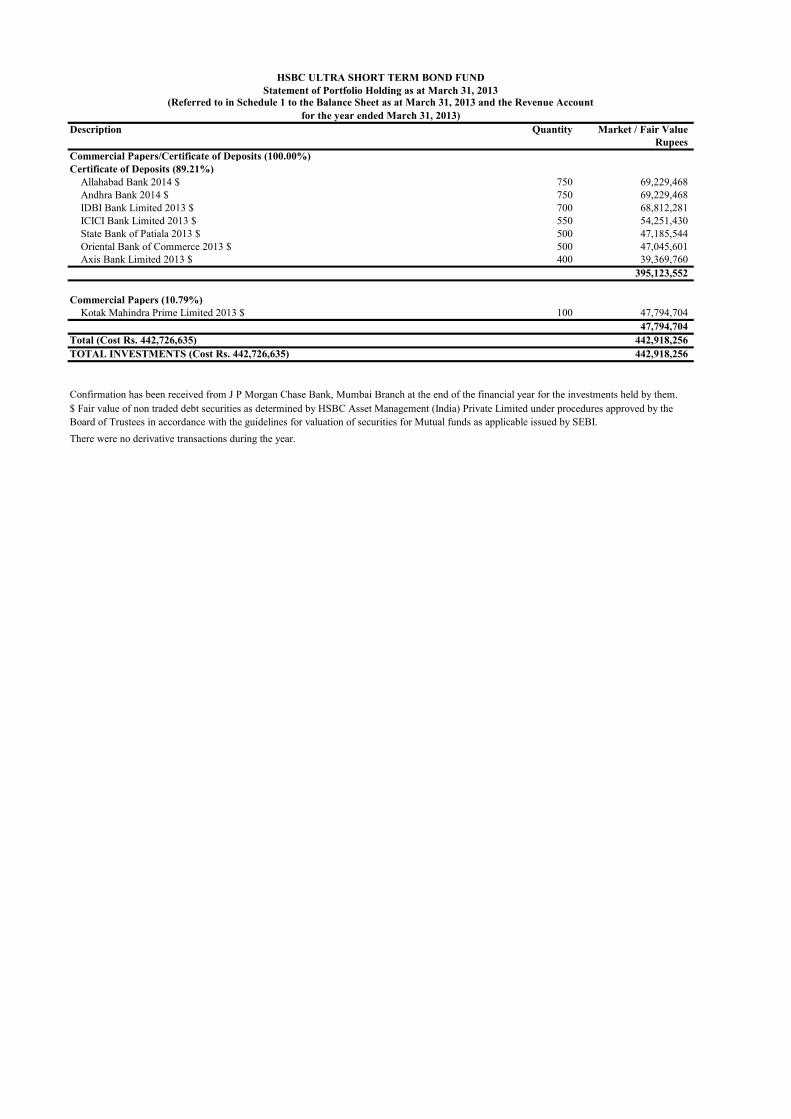
Description Quantity Market / Fair ValueRupees
Commercial Papers/Certificate of Deposits (100.00%)Certificate of Deposits (89.21%)
Allahabad Bank 2014 $ 750 69,229,468 Andhra Bank 2014 $ 750 69,229,468 IDBI Bank Limited 2013 $ 700 68,812,281 ICICI Bank Limited 2013 $ 550 54,251,430 State Bank of Patiala 2013 $ 500 47,185,544 Oriental Bank of Commerce 2013 $ 500 47,045,601 Axis Bank Limited 2013 $ 400 39,369,760
395,123,552
Commercial Papers (10.79%)Kotak Mahindra Prime Limited 2013 $ 100 47,794,704
47,794,704 Total (Cost Rs. 442,726,635) 442,918,256 TOTAL INVESTMENTS (Cost Rs. 442,726,635) 442,918,256
There were no derivative transactions during the year.
$ Fair value of non traded debt securities as determined by HSBC Asset Management (India) Private Limited under procedures approved by the Board of Trustees in accordance with the guidelines for valuation of securities for Mutual funds as applicable issued by SEBI.
HSBC ULTRA SHORT TERM BOND FUNDStatement of Portfolio Holding as at March 31, 2013
(Referred to in Schedule 1 to the Balance Sheet as at March 31, 2013 and the Revenue Accountfor the year ended March 31, 2013)
Confirmation has been received from J P Morgan Chase Bank, Mumbai Branch at the end of the financial year for the investments held by them.
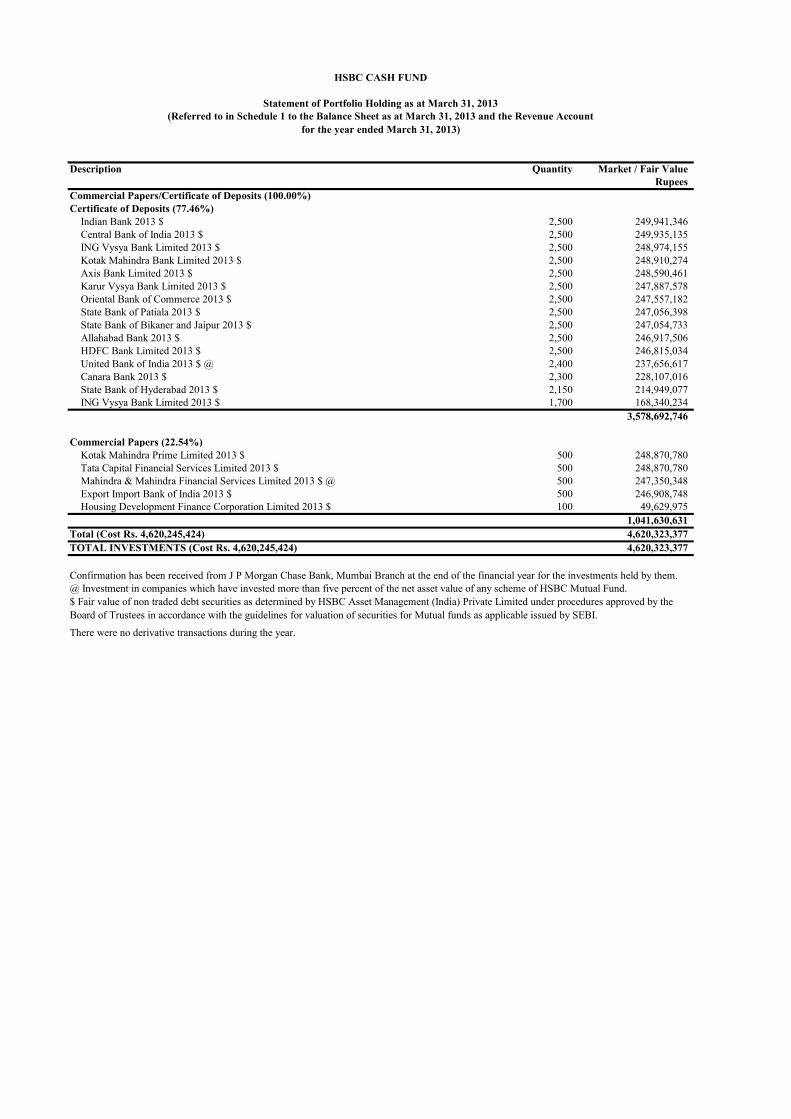
Description Quantity Market / Fair ValueRupees
Commercial Papers/Certificate of Deposits (100.00%)Certificate of Deposits (77.46%)
Indian Bank 2013 $ 2,500 249,941,346 Central Bank of India 2013 $ 2,500 249,935,135 ING Vysya Bank Limited 2013 $ 2,500 248,974,155 Kotak Mahindra Bank Limited 2013 $ 2,500 248,910,274 Axis Bank Limited 2013 $ 2,500 248,590,461 Karur Vysya Bank Limited 2013 $ 2,500 247,887,578 Oriental Bank of Commerce 2013 $ 2,500 247,557,182 State Bank of Patiala 2013 $ 2,500 247,056,398 State Bank of Bikaner and Jaipur 2013 $ 2,500 247,054,733 Allahabad Bank 2013 $ 2,500 246,917,506 HDFC Bank Limited 2013 $ 2,500 246,815,034 United Bank of India 2013 $ @ 2,400 237,656,617 Canara Bank 2013 $ 2,300 228,107,016 State Bank of Hyderabad 2013 $ 2,150 214,949,077 ING Vysya Bank Limited 2013 $ 1,700 168,340,234
3,578,692,746
Commercial Papers (22.54%)Kotak Mahindra Prime Limited 2013 $ 500 248,870,780 Tata Capital Financial Services Limited 2013 $ 500 248,870,780 Mahindra & Mahindra Financial Services Limited 2013 $ @ 500 247,350,348 Export Import Bank of India 2013 $ 500 246,908,748 Housing Development Finance Corporation Limited 2013 $ 100 49,629,975
1,041,630,631 Total (Cost Rs. 4,620,245,424) 4,620,323,377 TOTAL INVESTMENTS (Cost Rs. 4,620,245,424) 4,620,323,377
There were no derivative transactions during the year.
$ Fair value of non traded debt securities as determined by HSBC Asset Management (India) Private Limited under procedures approved by the Board of Trustees in accordance with the guidelines for valuation of securities for Mutual funds as applicable issued by SEBI.
HSBC CASH FUND
Statement of Portfolio Holding as at March 31, 2013(Referred to in Schedule 1 to the Balance Sheet as at March 31, 2013 and the Revenue Account
for the year ended March 31, 2013)
Confirmation has been received from J P Morgan Chase Bank, Mumbai Branch at the end of the financial year for the investments held by them.@ Investment in companies which have invested more than five percent of the net asset value of any scheme of HSBC Mutual Fund.
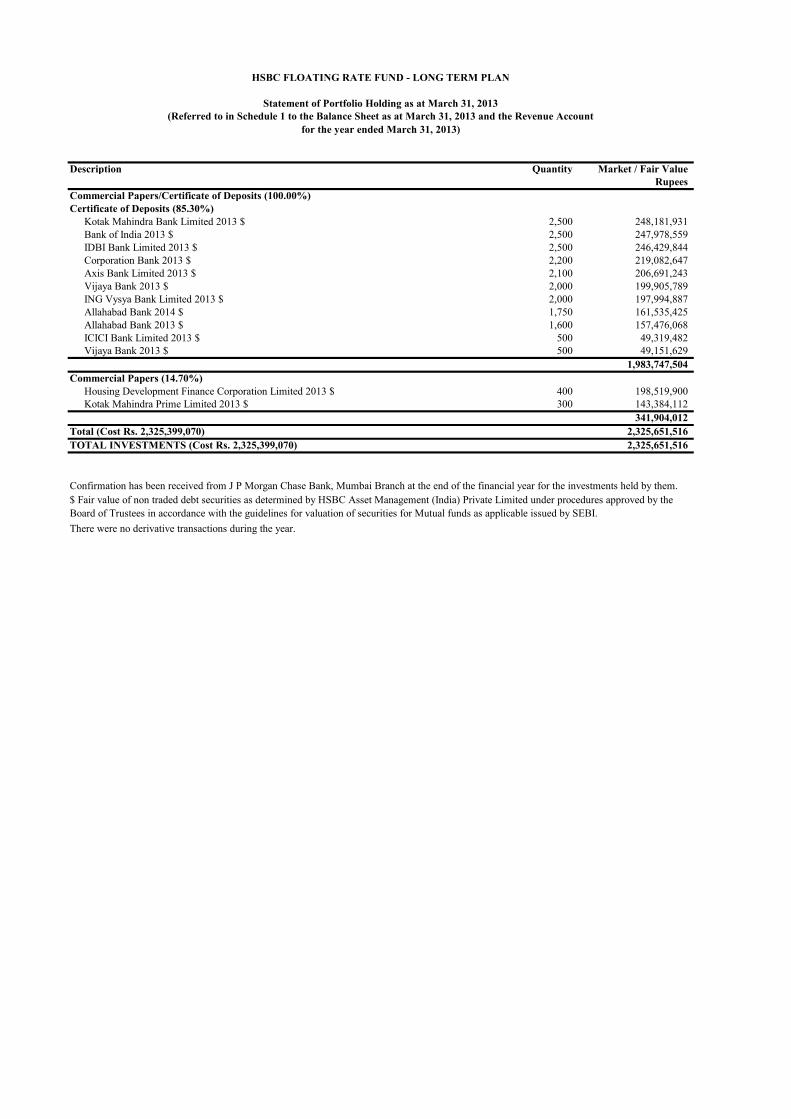
Description Quantity Market / Fair ValueRupees
Commercial Papers/Certificate of Deposits (100.00%)Certificate of Deposits (85.30%)
Kotak Mahindra Bank Limited 2013 $ 2,500 248,181,931 Bank of India 2013 $ 2,500 247,978,559 IDBI Bank Limited 2013 $ 2,500 246,429,844 Corporation Bank 2013 $ 2,200 219,082,647 Axis Bank Limited 2013 $ 2,100 206,691,243 Vijaya Bank 2013 $ 2,000 199,905,789 ING Vysya Bank Limited 2013 $ 2,000 197,994,887 Allahabad Bank 2014 $ 1,750 161,535,425 Allahabad Bank 2013 $ 1,600 157,476,068 ICICI Bank Limited 2013 $ 500 49,319,482 Vijaya Bank 2013 $ 500 49,151,629
1,983,747,504 Commercial Papers (14.70%)
Housing Development Finance Corporation Limited 2013 $ 400 198,519,900 Kotak Mahindra Prime Limited 2013 $ 300 143,384,112
341,904,012 Total (Cost Rs. 2,325,399,070) 2,325,651,516 TOTAL INVESTMENTS (Cost Rs. 2,325,399,070) 2,325,651,516
There were no derivative transactions during the year.
$ Fair value of non traded debt securities as determined by HSBC Asset Management (India) Private Limited under procedures approved by the Board of Trustees in accordance with the guidelines for valuation of securities for Mutual funds as applicable issued by SEBI.
HSBC FLOATING RATE FUND - LONG TERM PLAN
Statement of Portfolio Holding as at March 31, 2013(Referred to in Schedule 1 to the Balance Sheet as at March 31, 2013 and the Revenue Account
for the year ended March 31, 2013)
Confirmation has been received from J P Morgan Chase Bank, Mumbai Branch at the end of the financial year for the investments held by them.
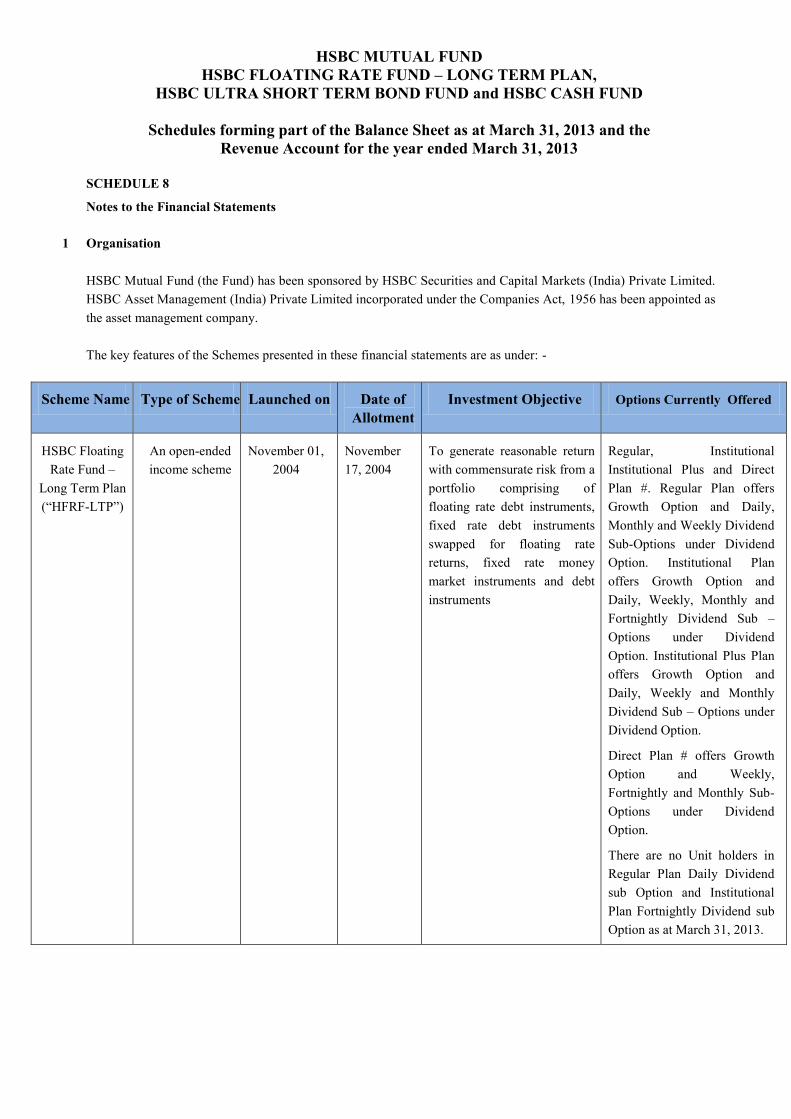
HSBC MUTUAL FUND HSBC FLOATING RATE FUND – LONG TERM PLAN,
HSBC ULTRA SHORT TERM BOND FUND and HSBC CASH FUND
Schedules forming part of the Balance Sheet as at March 31, 2013 and the
Revenue Account for the year ended March 31, 2013
SCHEDULE 8
Notes to the Financial Statements
1 Organisation
HSBC Mutual Fund (the Fund) has been sponsored by HSBC Securities and Capital Markets (India) Private Limited. HSBC Asset Management (India) Private Limited incorporated under the Companies Act, 1956 has been appointed as the asset management company. The key features of the Schemes presented in these financial statements are as under: -
Scheme Name Type of Scheme Launched on Date of Allotment
Investment Objective Options Currently Offered
HSBC Floating Rate Fund –
Long Term Plan (“HFRF-LTP”)
An open-ended income scheme
November 01, 2004
November 17, 2004
To generate reasonable return with commensurate risk from a portfolio comprising of floating rate debt instruments, fixed rate debt instruments swapped for floating rate returns, fixed rate money market instruments and debt instruments
Regular, Institutional Institutional Plus and Direct Plan #. Regular Plan offers Growth Option and Daily, Monthly and Weekly Dividend Sub-Options under Dividend Option. Institutional Plan offers Growth Option and Daily, Weekly, Monthly and Fortnightly Dividend Sub – Options under Dividend Option. Institutional Plus Plan offers Growth Option and Daily, Weekly and Monthly Dividend Sub – Options under Dividend Option.
Direct Plan # offers Growth Option and Weekly, Fortnightly and Monthly Sub- Options under Dividend Option.
There are no Unit holders in Regular Plan Daily Dividend sub Option and Institutional Plan Fortnightly Dividend sub Option as at March 31, 2013.
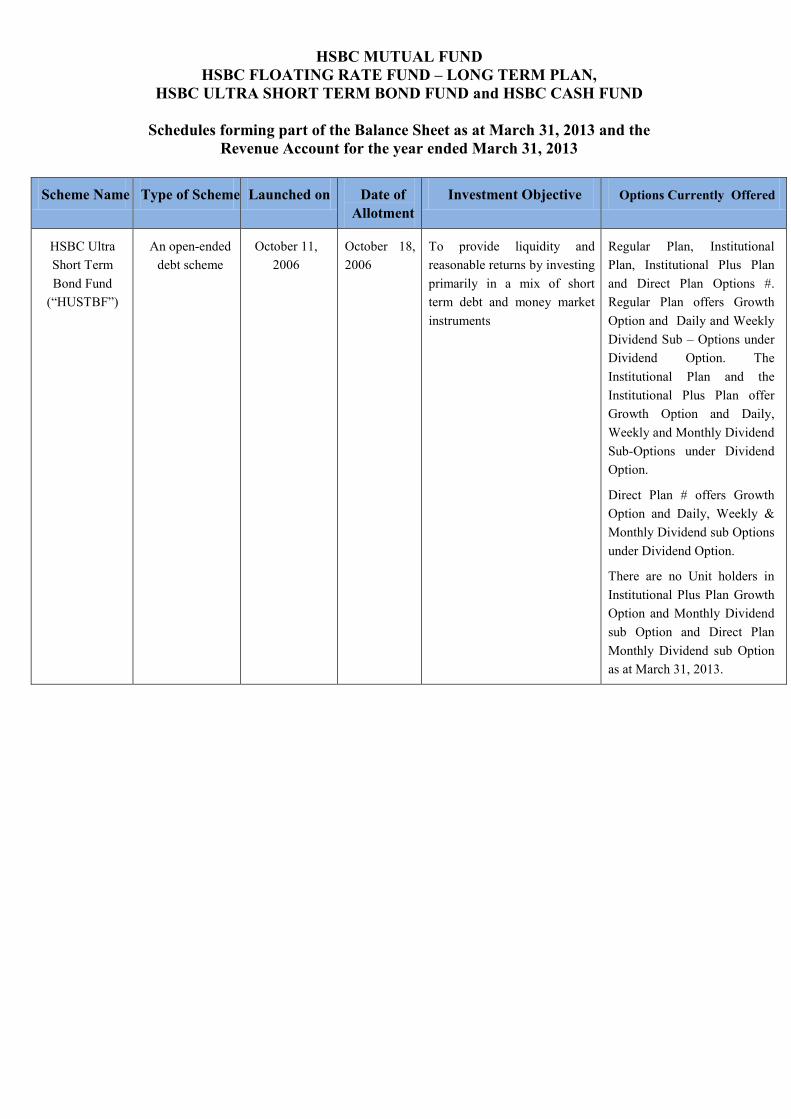
HSBC MUTUAL FUND HSBC FLOATING RATE FUND – LONG TERM PLAN,
HSBC ULTRA SHORT TERM BOND FUND and HSBC CASH FUND
Schedules forming part of the Balance Sheet as at March 31, 2013 and the
Revenue Account for the year ended March 31, 2013
Scheme Name Type of Scheme Launched on Date of Allotment
Investment Objective Options Currently Offered
HSBC Ultra Short Term Bond Fund
(“HUSTBF”)
An open-ended debt scheme
October 11, 2006
October 18, 2006
To provide liquidity and reasonable returns by investing primarily in a mix of short term debt and money market instruments
Regular Plan, Institutional Plan, Institutional Plus Plan and Direct Plan Options #. Regular Plan offers Growth Option and Daily and Weekly Dividend Sub – Options under Dividend Option. The Institutional Plan and the Institutional Plus Plan offer Growth Option and Daily, Weekly and Monthly Dividend Sub-Options under Dividend Option.
Direct Plan # offers Growth Option and Daily, Weekly & Monthly Dividend sub Options under Dividend Option.
There are no Unit holders in Institutional Plus Plan Growth Option and Monthly Dividend sub Option and Direct Plan Monthly Dividend sub Option as at March 31, 2013.
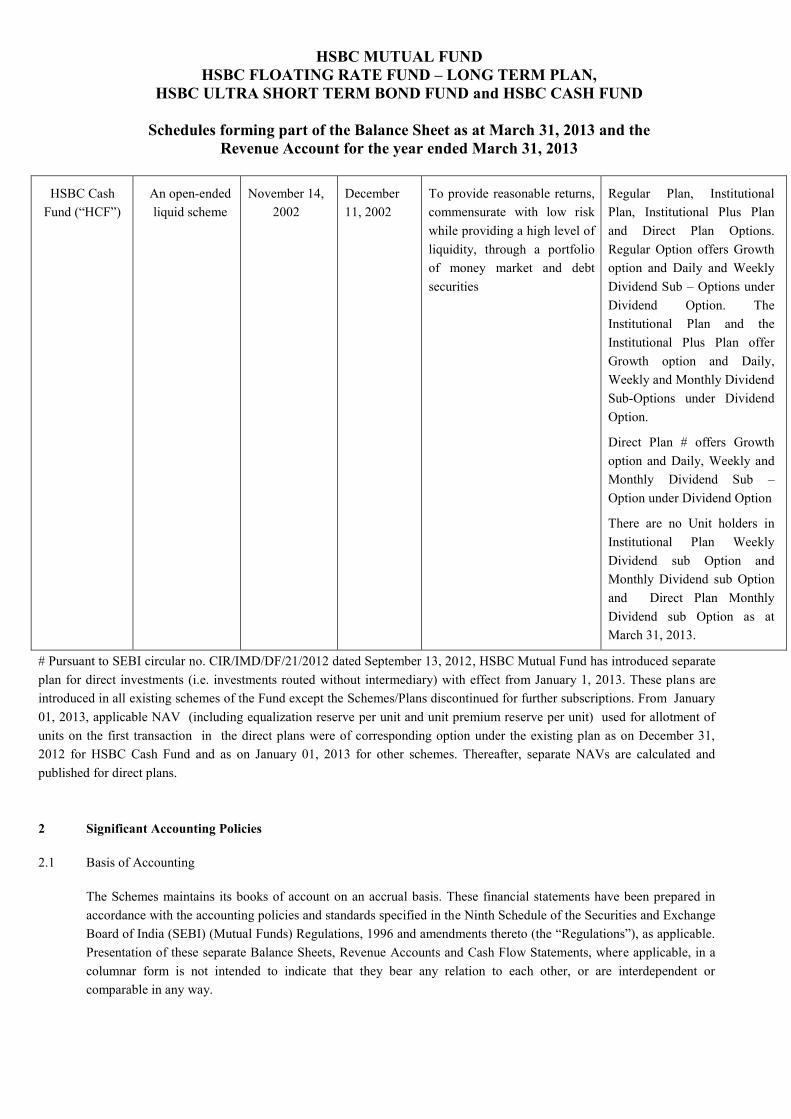
HSBC MUTUAL FUND HSBC FLOATING RATE FUND – LONG TERM PLAN,
HSBC ULTRA SHORT TERM BOND FUND and HSBC CASH FUND
Schedules forming part of the Balance Sheet as at March 31, 2013 and the
Revenue Account for the year ended March 31, 2013
HSBC Cash Fund (“HCF”)
An open-ended liquid scheme
November 14, 2002
December 11, 2002
To provide reasonable returns, commensurate with low risk while providing a high level of liquidity, through a portfolio of money market and debt securities
Regular Plan, Institutional Plan, Institutional Plus Plan and Direct Plan Options. Regular Option offers Growth option and Daily and Weekly Dividend Sub – Options under Dividend Option. The Institutional Plan and the Institutional Plus Plan offer Growth option and Daily, Weekly and Monthly Dividend Sub-Options under Dividend Option.
Direct Plan # offers Growth option and Daily, Weekly and Monthly Dividend Sub – Option under Dividend Option
There are no Unit holders in Institutional Plan Weekly Dividend sub Option and Monthly Dividend sub Option and Direct Plan Monthly Dividend sub Option as at March 31, 2013.
# Pursuant to SEBI circular no. CIR/IMD/DF/21/2012 dated September 13, 2012, HSBC Mutual Fund has introduced separate plan for direct investments (i.e. investments routed without intermediary) with effect from January 1, 2013. These plans are introduced in all existing schemes of the Fund except the Schemes/Plans discontinued for further subscriptions. From January 01, 2013, applicable NAV (including equalization reserve per unit and unit premium reserve per unit) used for allotment of units on the first transaction in the direct plans were of corresponding option under the existing plan as on December 31, 2012 for HSBC Cash Fund and as on January 01, 2013 for other schemes. Thereafter, separate NAVs are calculated and published for direct plans.
2 Significant Accounting Policies
2.1 Basis of Accounting
The Schemes maintains its books of account on an accrual basis. These financial statements have been prepared in accordance with the accounting policies and standards specified in the Ninth Schedule of the Securities and Exchange Board of India (SEBI) (Mutual Funds) Regulations, 1996 and amendments thereto (the “Regulations”), as applicable. Presentation of these separate Balance Sheets, Revenue Accounts and Cash Flow Statements, where applicable, in a columnar form is not intended to indicate that they bear any relation to each other, or are interdependent or comparable in any way.
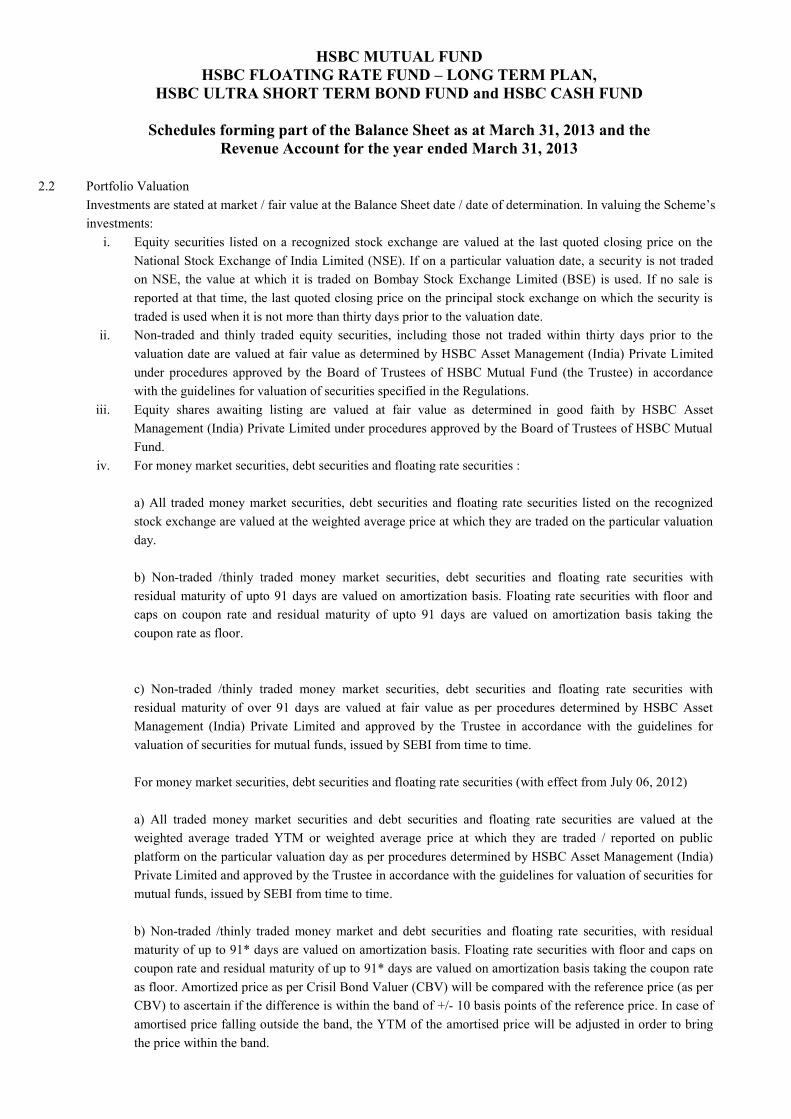
HSBC MUTUAL FUND HSBC FLOATING RATE FUND – LONG TERM PLAN,
HSBC ULTRA SHORT TERM BOND FUND and HSBC CASH FUND
Schedules forming part of the Balance Sheet as at March 31, 2013 and the
Revenue Account for the year ended March 31, 2013
2.2 Portfolio Valuation Investments are stated at market / fair value at the Balance Sheet date / date of determination. In valuing the Scheme’s investments:
i. Equity securities listed on a recognized stock exchange are valued at the last quoted closing price on the National Stock Exchange of India Limited (NSE). If on a particular valuation date, a security is not traded on NSE, the value at which it is traded on Bombay Stock Exchange Limited (BSE) is used. If no sale is reported at that time, the last quoted closing price on the principal stock exchange on which the security is traded is used when it is not more than thirty days prior to the valuation date.
ii. Non-traded and thinly traded equity securities, including those not traded within thirty days prior to the valuation date are valued at fair value as determined by HSBC Asset Management (India) Private Limited under procedures approved by the Board of Trustees of HSBC Mutual Fund (the Trustee) in accordance with the guidelines for valuation of securities specified in the Regulations.
iii. Equity shares awaiting listing are valued at fair value as determined in good faith by HSBC Asset Management (India) Private Limited under procedures approved by the Board of Trustees of HSBC Mutual Fund.
iv. For money market securities, debt securities and floating rate securities : a) All traded money market securities, debt securities and floating rate securities listed on the recognized stock exchange are valued at the weighted average price at which they are traded on the particular valuation day. b) Non-traded /thinly traded money market securities, debt securities and floating rate securities with residual maturity of upto 91 days are valued on amortization basis. Floating rate securities with floor and caps on coupon rate and residual maturity of upto 91 days are valued on amortization basis taking the coupon rate as floor. c) Non-traded /thinly traded money market securities, debt securities and floating rate securities with residual maturity of over 91 days are valued at fair value as per procedures determined by HSBC Asset Management (India) Private Limited and approved by the Trustee in accordance with the guidelines for valuation of securities for mutual funds, issued by SEBI from time to time. For money market securities, debt securities and floating rate securities (with effect from July 06, 2012) a) All traded money market securities and debt securities and floating rate securities are valued at the weighted average traded YTM or weighted average price at which they are traded / reported on public platform on the particular valuation day as per procedures determined by HSBC Asset Management (India) Private Limited and approved by the Trustee in accordance with the guidelines for valuation of securities for mutual funds, issued by SEBI from time to time. b) Non-traded /thinly traded money market and debt securities and floating rate securities, with residual maturity of up to 91* days are valued on amortization basis. Floating rate securities with floor and caps on coupon rate and residual maturity of up to 91* days are valued on amortization basis taking the coupon rate as floor. Amortized price as per Crisil Bond Valuer (CBV) will be compared with the reference price (as per CBV) to ascertain if the difference is within the band of +/- 10 basis points of the reference price. In case of amortised price falling outside the band, the YTM of the amortised price will be adjusted in order to bring the price within the band.

HSBC MUTUAL FUND HSBC FLOATING RATE FUND – LONG TERM PLAN,
HSBC ULTRA SHORT TERM BOND FUND and HSBC CASH FUND
Schedules forming part of the Balance Sheet as at March 31, 2013 and the
Revenue Account for the year ended March 31, 2013
c) Non-traded /thinly traded money market securities, debt securities and floating rate securities with residual maturity of over 91* days are valued at fair value as per procedures determined by HSBC Asset Management (India) Private Limited and approved by the Trustee in accordance with the guidelines for valuation of securities for mutual funds, issued by SEBI from time to time. Thus they are valued at benchmark yield/matrix of spread over risk free benchmark yield obtained from agencies entrusted for the said purpose by AMFI. This may be further adjusted for the illiquidity mark-up / mark-down as permitted under the regulations. *Pursuant to SEBI circular CIR/IMD/DF/6/2012 dated February 28, 2012, with effect from October 01, 2012, reference to 91 days above was changed to 60 days.
v. Instruments bought on ‘repo’ basis are valued at the resale price after deduction of applicable interest up to the date of resale. Instruments sold on repo basis are adjusted for the difference between the repurchase price (after deduction of applicable interest upto the date of repurchase) and the value of instrument.
vi. Collateralised Borrowing and Lending Obligations (CBLO) are valued at cost plus accrued interest.
The net unrealised appreciation / depreciation in the value of investments and derivatives is determined
separately for each category of investments and derivatives. In respect of each category of investments and
derivatives, the net change in the unrealised appreciation if any, between two balance sheet dates / valuation
dates is accounted through the Revenue Account and thereafter the net change in unrealised appreciation is
transferred from the Revenue Account to the Unrealised Appreciation Reserve. The net change in unrealised
depreciation in the value of investments and derivatives between the two balance sheet dates/ valuation
dates if any, is accounted through the Revenue Account.
Net unrealised appreciation is reduced from the distributable income at the time of income distribution.
2.3 Securities Transaction
Investment securities transactions are accounted for on a trade date basis. The Schemes uses the average cost method
for determining the realized gain or loss on sale of investments. The cost of investments includes brokerage stamp
charges and any other charges customarily included in the contract note but excludes custodian safekeeping fees.
Pursuant to SEBI circular no. CIR/IMD/DF/21/2012 dated September 13, 2012, with effect from October 01, 2012,
Brokerage and Transaction Costs which are incurred for the purpose of execution of trade, is included in the cost of
investment, not exceeding 0.12 per cent in case of cash market transactions and 0.05 per cent in case of derivatives
transactions. Remaining portion is charged to expenses, within total expense ratio in line with Regulations.
2.4 Investment Income
Interest income is recorded on an accrual basis.
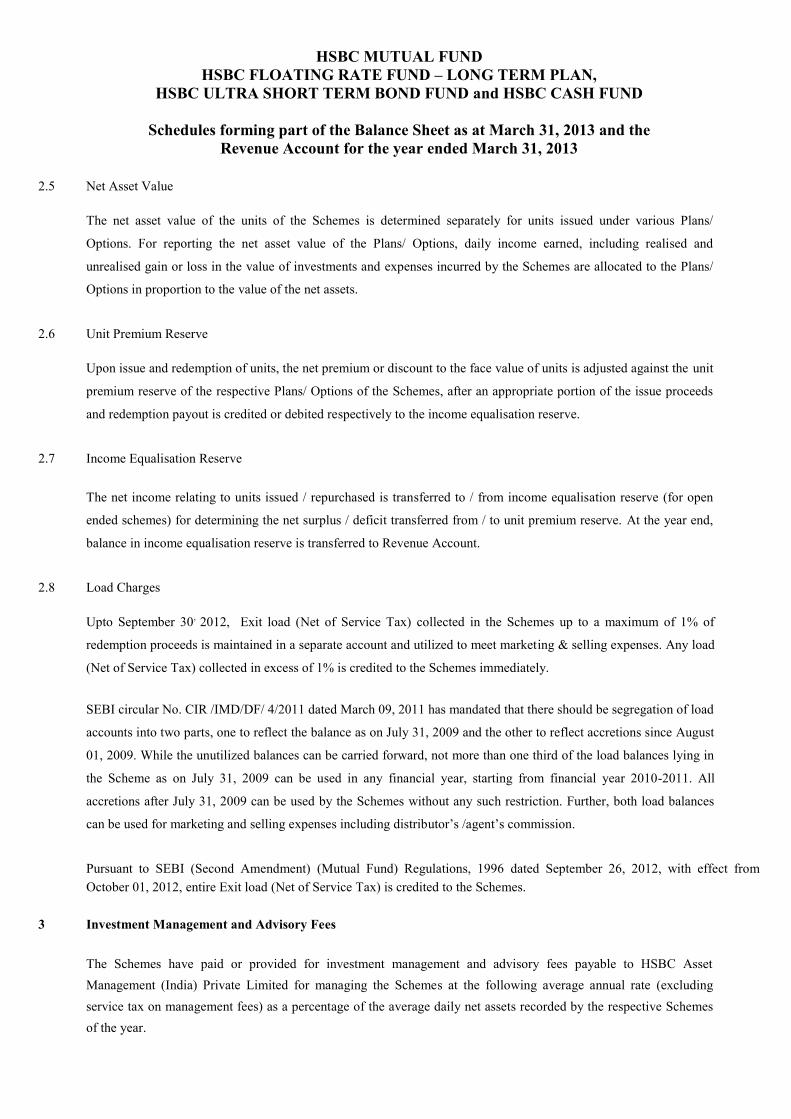
HSBC MUTUAL FUND HSBC FLOATING RATE FUND – LONG TERM PLAN,
HSBC ULTRA SHORT TERM BOND FUND and HSBC CASH FUND
Schedules forming part of the Balance Sheet as at March 31, 2013 and the
Revenue Account for the year ended March 31, 2013
2.5 Net Asset Value
The net asset value of the units of the Schemes is determined separately for units issued under various Plans/
Options. For reporting the net asset value of the Plans/ Options, daily income earned, including realised and
unrealised gain or loss in the value of investments and expenses incurred by the Schemes are allocated to the Plans/
Options in proportion to the value of the net assets.
2.6 Unit Premium Reserve
Upon issue and redemption of units, the net premium or discount to the face value of units is adjusted against the unit
premium reserve of the respective Plans/ Options of the Schemes, after an appropriate portion of the issue proceeds
and redemption payout is credited or debited respectively to the income equalisation reserve.
2.7 Income Equalisation Reserve
The net income relating to units issued / repurchased is transferred to / from income equalisation reserve (for open
ended schemes) for determining the net surplus / deficit transferred from / to unit premium reserve. At the year end,
balance in income equalisation reserve is transferred to Revenue Account.
2.8 Load Charges
Upto September 30, 2012, Exit load (Net of Service Tax) collected in the Schemes up to a maximum of 1% of
redemption proceeds is maintained in a separate account and utilized to meet marketing & selling expenses. Any load
(Net of Service Tax) collected in excess of 1% is credited to the Schemes immediately.
SEBI circular No. CIR /IMD/DF/ 4/2011 dated March 09, 2011 has mandated that there should be segregation of load
accounts into two parts, one to reflect the balance as on July 31, 2009 and the other to reflect accretions since August
01, 2009. While the unutilized balances can be carried forward, not more than one third of the load balances lying in
the Scheme as on July 31, 2009 can be used in any financial year, starting from financial year 2010-2011. All
accretions after July 31, 2009 can be used by the Schemes without any such restriction. Further, both load balances
can be used for marketing and selling expenses including distributor’s /agent’s commission.
Pursuant to SEBI (Second Amendment) (Mutual Fund) Regulations, 1996 dated September 26, 2012, with effect from October 01, 2012, entire Exit load (Net of Service Tax) is credited to the Schemes.
3 Investment Management and Advisory Fees
The Schemes have paid or provided for investment management and advisory fees payable to HSBC Asset Management (India) Private Limited for managing the Schemes at the following average annual rate (excluding service tax on management fees) as a percentage of the average daily net assets recorded by the respective Schemes of the year.
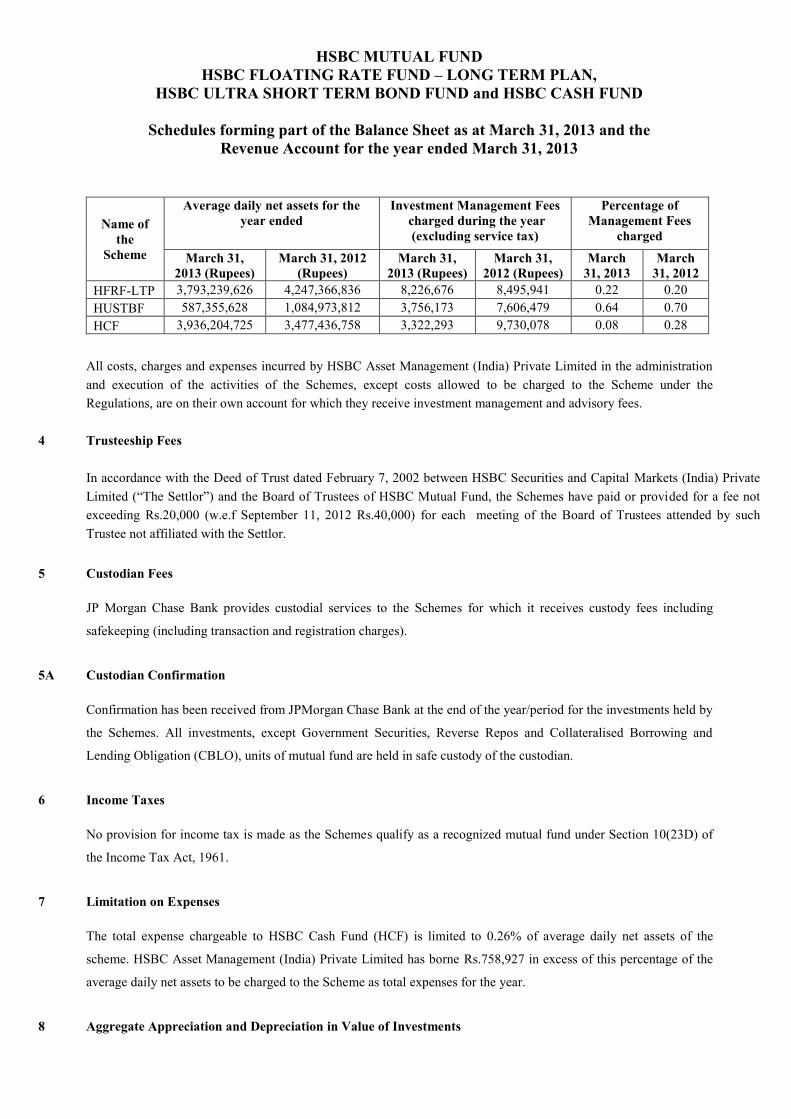
HSBC MUTUAL FUND HSBC FLOATING RATE FUND – LONG TERM PLAN,
HSBC ULTRA SHORT TERM BOND FUND and HSBC CASH FUND
Schedules forming part of the Balance Sheet as at March 31, 2013 and the
Revenue Account for the year ended March 31, 2013
Name of the
Scheme
Average daily net assets for the year ended
Investment Management Fees charged during the year
(excluding service tax)
Percentage of Management Fees
charged
March 31, 2013 (Rupees)
March 31, 2012 (Rupees)
March 31, 2013 (Rupees)
March 31, 2012 (Rupees)
March 31, 2013
March 31, 2012
HFRF-LTP 3,793,239,626 4,247,366,836 8,226,676 8,495,941 0.22 0.20 HUSTBF 587,355,628 1,084,973,812 3,756,173 7,606,479 0.64 0.70 HCF 3,936,204,725 3,477,436,758 3,322,293 9,730,078 0.08 0.28
All costs, charges and expenses incurred by HSBC Asset Management (India) Private Limited in the administration and execution of the activities of the Schemes, except costs allowed to be charged to the Scheme under the Regulations, are on their own account for which they receive investment management and advisory fees.
4 Trusteeship Fees
In accordance with the Deed of Trust dated February 7, 2002 between HSBC Securities and Capital Markets (India) Private Limited (“The Settlor”) and the Board of Trustees of HSBC Mutual Fund, the Schemes have paid or provided for a fee not exceeding Rs.20,000 (w.e.f September 11, 2012 Rs.40,000) for each meeting of the Board of Trustees attended by such Trustee not affiliated with the Settlor.
5 Custodian Fees
JP Morgan Chase Bank provides custodial services to the Schemes for which it receives custody fees including
safekeeping (including transaction and registration charges).
5A Custodian Confirmation
Confirmation has been received from JPMorgan Chase Bank at the end of the year/period for the investments held by
the Schemes. All investments, except Government Securities, Reverse Repos and Collateralised Borrowing and
Lending Obligation (CBLO), units of mutual fund are held in safe custody of the custodian.
6 Income Taxes
No provision for income tax is made as the Schemes qualify as a recognized mutual fund under Section 10(23D) of
the Income Tax Act, 1961.
7 Limitation on Expenses
The total expense chargeable to HSBC Cash Fund (HCF) is limited to 0.26% of average daily net assets of the
scheme. HSBC Asset Management (India) Private Limited has borne Rs.758,927 in excess of this percentage of the
average daily net assets to be charged to the Scheme as total expenses for the year.
8 Aggregate Appreciation and Depreciation in Value of Investments
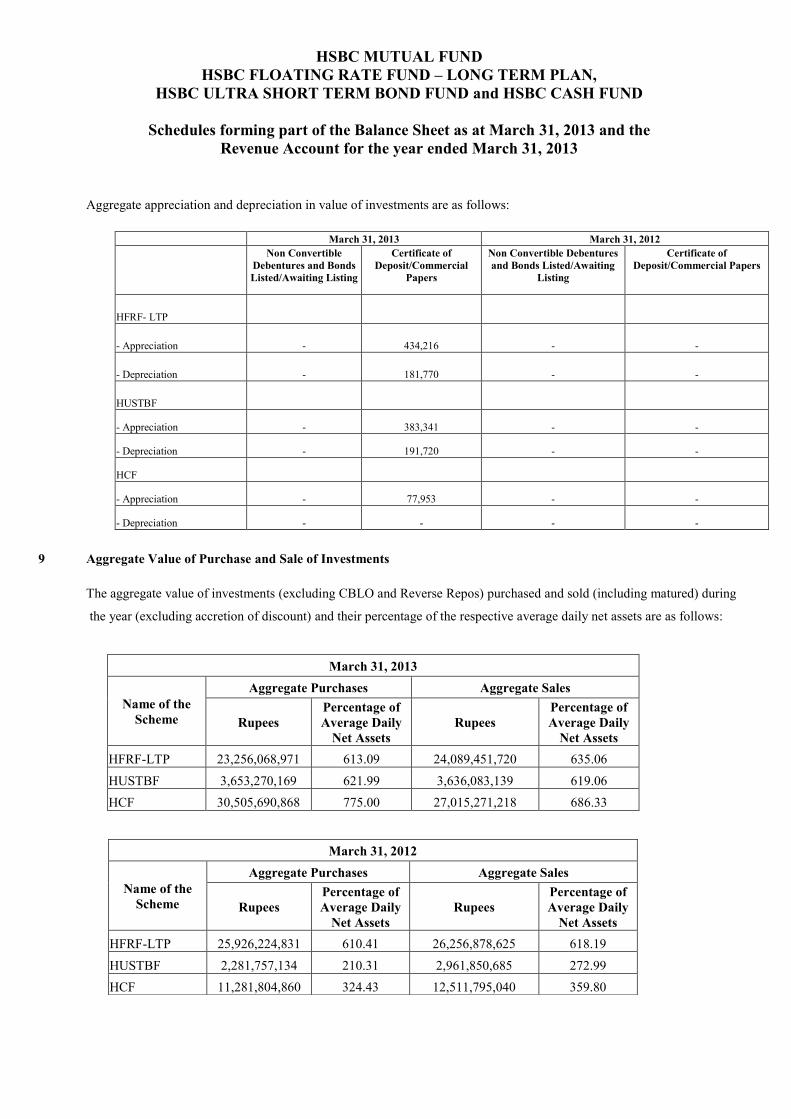
HSBC MUTUAL FUND HSBC FLOATING RATE FUND – LONG TERM PLAN,
HSBC ULTRA SHORT TERM BOND FUND and HSBC CASH FUND
Schedules forming part of the Balance Sheet as at March 31, 2013 and the
Revenue Account for the year ended March 31, 2013
Aggregate appreciation and depreciation in value of investments are as follows:
March 31, 2013 March 31, 2012 Non Convertible
Debentures and Bonds Listed/Awaiting Listing
Certificate of Deposit/Commercial
Papers
Non Convertible Debentures and Bonds Listed/Awaiting
Listing
Certificate of Deposit/Commercial Papers
HFRF- LTP
- Appreciation - 434,216 - -
- Depreciation - 181,770 - -
HUSTBF
- Appreciation - 383,341 - -
- Depreciation - 191,720 - -
HCF
- Appreciation - 77,953 - -
- Depreciation - - - -
9 Aggregate Value of Purchase and Sale of Investments
The aggregate value of investments (excluding CBLO and Reverse Repos) purchased and sold (including matured) during
the year (excluding accretion of discount) and their percentage of the respective average daily net assets are as follows:
March 31, 2013
Name of the Scheme
Aggregate Purchases Aggregate Sales
Rupees Percentage of Average Daily
Net Assets Rupees
Percentage of Average Daily
Net Assets HFRF-LTP 23,256,068,971 613.09 24,089,451,720 635.06 HUSTBF 3,653,270,169 621.99 3,636,083,139 619.06 HCF 30,505,690,868 775.00 27,015,271,218 686.33
March 31, 2012
Name of the Scheme
Aggregate Purchases Aggregate Sales
Rupees Percentage of Average Daily
Net Assets Rupees
Percentage of Average Daily
Net Assets HFRF-LTP 25,926,224,831 610.41 26,256,878,625 618.19 HUSTBF 2,281,757,134 210.31 2,961,850,685 272.99 HCF 11,281,804,860 324.43 12,511,795,040 359.80

HSBC MUTUAL FUND HSBC FLOATING RATE FUND – LONG TERM PLAN,
HSBC ULTRA SHORT TERM BOND FUND and HSBC CASH FUND
Schedules forming part of the Balance Sheet as at March 31, 2013 and the
Revenue Account for the year ended March 31, 2013
10 Aggregate Fair Value of Non-Traded / Privately Placed Investments
Aggregate fair values of non-traded (including private placement) investments as determined by HSBC Asset Management (India) Private Limited under the procedures approved by the Board of Trustees as at March 31, 2013 and March 31, 2012 are as follows:
Name of Scheme Fair Value (Rupees) March 31, 2013 March 31, 2012
HFRF-LTP 2,325,651,516 2,830,668,048 HUSTBF 442,918,256 382,280,136 HCF 4,620,323,377 857,818,960
11 Income and Expenses
The total income (including net profit/ net of net loss on sale of investments and net change in unrealized depreciation in the value of investments) and expenditure during the year are as follows:
12 Initial Contribution
The initial contribution of Rs. 100,000 made by the sponsor, HSBC Securities and Capital Markets (India) Private
Limited is recorded in the books of account of HSBC Mutual Fund the Trust.
March 31, 2013
Name of the Scheme
Total Income Total Expenses
Rupees Percentage of
Average Daily Net Assets
Rupees Percentage of
Average Daily Net Assets
HFRF-LTP 347,854,202 9.17 16,880,661 0.45
HUSTBF 52,916,468 9.01 6,121,624 1.04
HCF 340,347,432 8.65 10,404,032 0.26
March 31, 2012
Name of the Scheme
Total Income Total Expenses
Rupees Percentage of
Average Daily Net Assets
Rupees Percentage of
Average Daily Net Assets
HFRF-LTP 394,364,652 9.28 16,508,625 0.39
HUSTBF 92,963,822 8.57 11,163,542 1.03
HCF 294,378,172 8.47 16,621,867 0.48

HSBC MUTUAL FUND HSBC FLOATING RATE FUND – LONG TERM PLAN,
HSBC ULTRA SHORT TERM BOND FUND and HSBC CASH FUND
Schedules forming part of the Balance Sheet as at March 31, 2013 and the
Revenue Account for the year ended March 31, 2013
12A Movement in Unit Capital The movement in Unit Capital during the year/period is detailed in Schedule 4.
13 Disclosure Under Regulation 25(8) of the Securities and Exchange Board of India (Mutual Funds)
Regulation, 1996 as amended and in accordance with Accounting Standard 18 on ‘Related Party Disclosures’ issued by the Institute of Chartered Accountants of India (ICAI)
Details of amounts paid to associates in terms of Regulation 25 (8) are as follows
Commission paid to Sponsor/AMC and its associates/related parties/group companies Name of Scheme
Name of Sponsor/AMC and its associates/related parties/group
companies
Nature of Association /Nature of relation
Period Covered
Business Given [Rs. In Crores]
% of Total
Business received by the Fund
Commission paid [Rs.]
% of Total commission paid by the Fund
HFRF-LTP The Hongkong and Shanghai Banking Corporation Limited Associate 2012-2013 144.39 14.61 725,878 18.81
HFRF-LTP HSBC InvestDirect Securities (India) Limited Associate 2012-2013 3.05 0.31 21,286 0.55
HUSTBF The Hongkong and Shanghai Banking Corporation Limited Associate 2012-2013 39.96 38.97 423,316 35.38
HUSTBF HSBC InvestDirect Securities (India) Limited Associate 2012-2013 0.03 0.03 756 0.06
HCF The Hongkong and Shanghai Banking Corporation Limited Associate 2012-2013 661.49 4.58 1,479,963 48.26
HCF HSBC InvestDirect Securities (India) Limited Associate 2012-2013 1225 8.48 123,911 4.04
Name of Scheme
Name of Sponsor/AMC and its associates/related parties/group
companies
Nature of Association /Nature of
relation
Period Covered
Business Given [Rs. In Crores]
% of Total
Business received by the Fund
Commission paid [Rs.]
% of Total commission paid by the
Fund
HFRF-LTP The Hongkong and Shanghai Banking Corporation Limited Associate 2011-2012 140.16 10.38 469,206 15.39
HFRF-LTP HSBC InvestDirect Securities (India) Limited Associate 2011-2012 22.04 1.63 40,524 1.33
HUSTBF The Hongkong and Shanghai Banking Corporation Limited Associate 2011-2012 31.31 32.31 707,017 38.08
HUSTBF HSBC InvestDirect Securities (India) Limited Associate 2011-2012 0.01 0.02 245 0.01
HCF The Hongkong and Shanghai Banking Corporation Limited Associate 2011-2012 133.93 0.39 1,540,299 53.01
HCF HSBC InvestDirect Securities (India) Limited Associate 2011-2012 515.04 1.51 59,609 2.05
~ Indicates less than 0.01
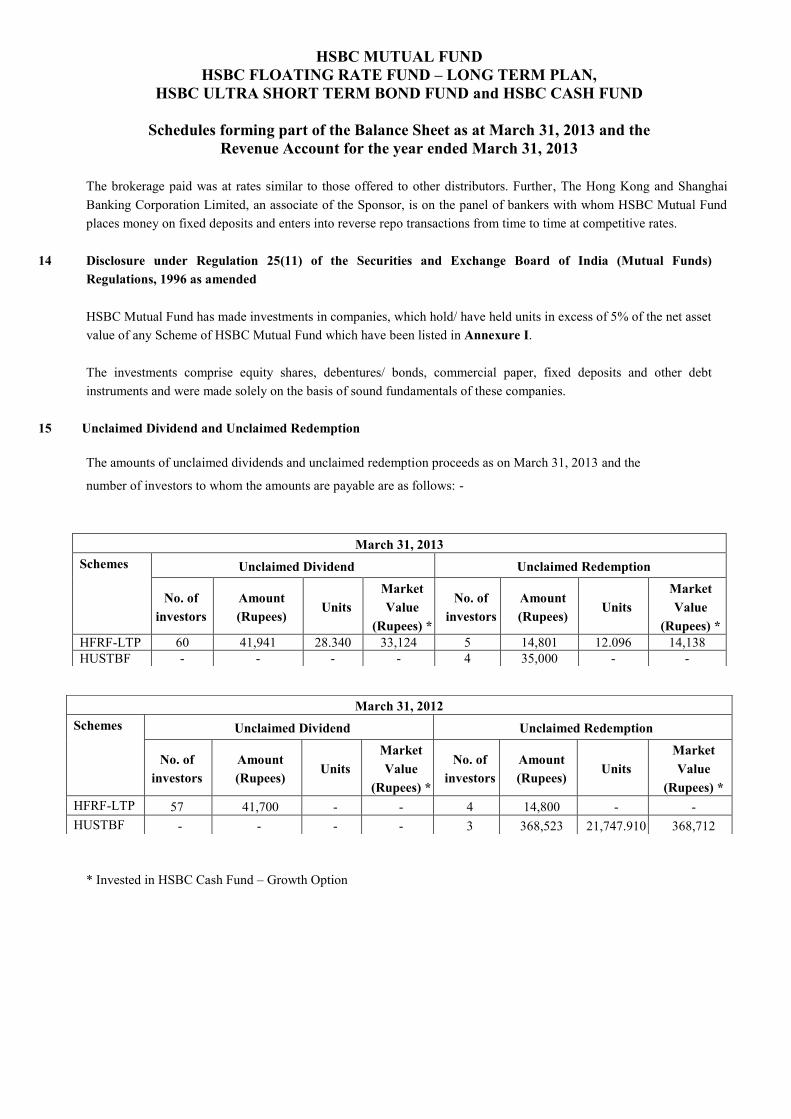
HSBC MUTUAL FUND HSBC FLOATING RATE FUND – LONG TERM PLAN,
HSBC ULTRA SHORT TERM BOND FUND and HSBC CASH FUND
Schedules forming part of the Balance Sheet as at March 31, 2013 and the
Revenue Account for the year ended March 31, 2013
The brokerage paid was at rates similar to those offered to other distributors. Further, The Hong Kong and Shanghai Banking Corporation Limited, an associate of the Sponsor, is on the panel of bankers with whom HSBC Mutual Fund places money on fixed deposits and enters into reverse repo transactions from time to time at competitive rates.
14 Disclosure under Regulation 25(11) of the Securities and Exchange Board of India (Mutual Funds)
Regulations, 1996 as amended
HSBC Mutual Fund has made investments in companies, which hold/ have held units in excess of 5% of the net asset value of any Scheme of HSBC Mutual Fund which have been listed in Annexure I.
The investments comprise equity shares, debentures/ bonds, commercial paper, fixed deposits and other debt instruments and were made solely on the basis of sound fundamentals of these companies.
15 Unclaimed Dividend and Unclaimed Redemption
The amounts of unclaimed dividends and unclaimed redemption proceeds as on March 31, 2013 and the
number of investors to whom the amounts are payable are as follows: -
* Invested in HSBC Cash Fund – Growth Option
March 31, 2013 Schemes Unclaimed Dividend Unclaimed Redemption
No. of investors
Amount (Rupees)
Units Market Value
(Rupees) *
No. of investors
Amount (Rupees)
Units Market Value
(Rupees) * HFRF-LTP 60 41,941 28.340 33,124 5 14,801 12.096 14,138 HUSTBF - - - - 4 35,000 - -
March 31, 2012 Schemes Unclaimed Dividend Unclaimed Redemption
No. of investors
Amount (Rupees)
Units Market Value
(Rupees) *
No. of investors
Amount (Rupees)
Units Market Value
(Rupees) * HFRF-LTP 57 41,700 - - 4 14,800 - - HUSTBF - - - - 3 368,523 21,747.910 368,712
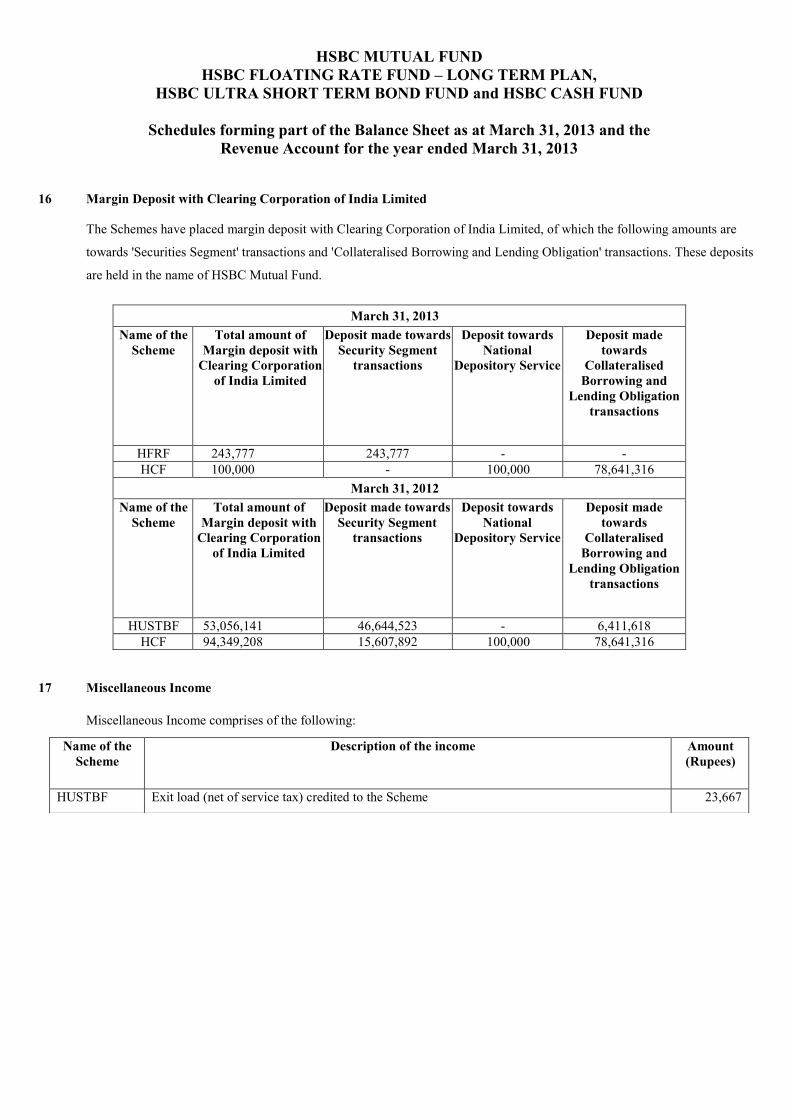
HSBC MUTUAL FUND HSBC FLOATING RATE FUND – LONG TERM PLAN,
HSBC ULTRA SHORT TERM BOND FUND and HSBC CASH FUND
Schedules forming part of the Balance Sheet as at March 31, 2013 and the
Revenue Account for the year ended March 31, 2013
16 Margin Deposit with Clearing Corporation of India Limited
The Schemes have placed margin deposit with Clearing Corporation of India Limited, of which the following amounts are
towards 'Securities Segment' transactions and 'Collateralised Borrowing and Lending Obligation' transactions. These deposits
are held in the name of HSBC Mutual Fund.
17 Miscellaneous Income
Miscellaneous Income comprises of the following:
March 31, 2013 Name of the
Scheme Total amount of
Margin deposit with Clearing Corporation
of India Limited
Deposit made towards Security Segment
transactions
Deposit towards National
Depository Service
Deposit made towards
Collateralised Borrowing and
Lending Obligation transactions
HFRF 243,777 243,777 - - HCF 100,000 - 100,000 78,641,316
March 31, 2012 Name of the
Scheme Total amount of
Margin deposit with Clearing Corporation
of India Limited
Deposit made towards Security Segment
transactions
Deposit towards National
Depository Service
Deposit made towards
Collateralised Borrowing and
Lending Obligation transactions
HUSTBF 53,056,141 46,644,523 - 6,411,618 HCF 94,349,208 15,607,892 100,000 78,641,316
Name of the Scheme
Description of the income Amount (Rupees)
HUSTBF Exit load (net of service tax) credited to the Scheme 23,667

HSBC MUTUAL FUND HSBC FLOATING RATE FUND – LONG TERM PLAN,
HSBC ULTRA SHORT TERM BOND FUND and HSBC CASH FUND
Schedules forming part of the Balance Sheet as at March 31, 2013 and the
Revenue Account for the year ended March 31, 2013
18 Net Asset Value Per Unit
The net asset value disclosed below represents the computed NAV on March 31, 2013 (non-business day), and not the last declared NAV.
Plan/Option HFRF-LTP HUSBF HCF
2013 2012 2013 2012 2013 2012
Rupees Rupees Rupees Rupees Rupees Rupees
Regular Plan – Growth Sub Option 17.6333 16.3062 15.3224 14.1772 1,832.4527 16.9586 Regular Plan - Daily Dividend Option - 10.1111 10.0083 10.0046 1,020.0183 10.1958 Regular Plan - Weekly Dividend Option 10.0110 10.0073 10.0393 10.0356 1,002.3966 10.0197 Regular Plan - Monthly Dividend Option 10.0064 10.0028 - - - - Institutional Plan Growth Option 18.3376 16.7933 10.4003 14.3440 1,866.8709 17.1827 Institutional Plan Daily Dividend Option - - 10.0077 10.0035 1,086.0890 10.4430 Institutional Plan Weekly Dividend Option 11.2390 11.2330 10.0410 10.0368 - 10.8656 Institutional Plan Fortnightly Dividend Option - - - - - - Institutional Plan Monthly Dividend Option 10.2196 10.1380 10.1454 10.1411 - 10.5243 Institutional Plus Plan – Growth Sub Option - - - - 1,169.7318 10.7376 Institutional Plus Plan - Daily Dividend Option - - 11.3786 10.4233 1,001.3459 10.0085 Institutional Plus Plan - Weekly Dividend Option - - 10.1708 10.1665 1,111.3623 10.8389 Institutional Plus Plan - Monthly Dividend Option - - -
- 1,000.7958 -
Direct Plan – Growth Sub Option 18.3444 N.A. 10.4016 N.A. 1,169.7357 N.A. Direct Plan - Daily Dividend Option N.A. N.A. 10.0119 N.A. 1,001.3457 N.A. Direct Plan - Weekly Dividend Option 11.2402 N.A. 10.0413 N.A. 1,111.3632 N.A. Direct Plan - Fortnightly Dividend Option 10.0083 N.A. N.A. N.A. N.A. N.A. Direct Plan - Monthly Dividend Option 10.1840 N.A. N.A. N.A. N.A. N.A.
Pursuant to SEBI circular no. CIR/IMD/DF/21/2012 dated September 13, 2012, HSBC Mutual Fund has introduced separate plan for direct investments (i.e. investments routed without intermediary) with effect from January 1, 2013. These plans are introduced in all existing schemes of the Fund except the Schemes/Plans discontinued for further subscriptions. From January 01, 2013, applicable NAV (including equalization reserve per unit and unit premium reserve per unit) used for allotment of units on the first transaction in the direct plans were of corresponding option under the existing plan as on December 31, 2012 for HSBC Cash Fund and as on January 01, 2013 for other schemes. Thereafter, separate NAVs are calculated and published for direct plans. 19 Change in the Face Value of Units of HSBC Cash Fund (HCF)
Pursuant to approval from Board of Directors of HSBC Asset Management (India) Private Limited and Trustees of
the Fund, the following changes were effected in HSBC Cash fund during the financial year ended March 31, 2013.
The Net Asset Value (NAV) per unit under all the Plans / Options of the Scheme was reset to reflect the change in
face value of units of the Scheme from Rs. 10/- to Rs. 1000/- and the balance unit holding of existing investors under
all the plans / options of the Scheme was also adjusted with effect from December 30, 2012. The change did not
impact the current value of the unit holder’s investments in the Scheme. Further, unit holders did not incur any tax
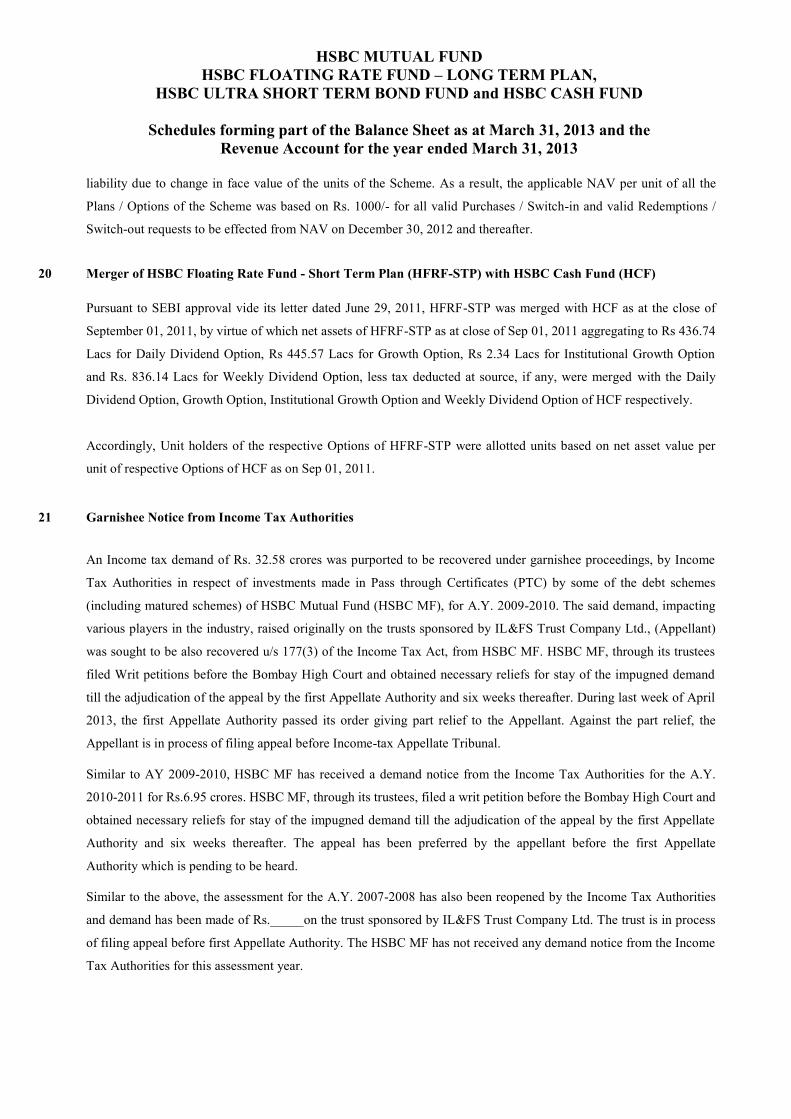
HSBC MUTUAL FUND HSBC FLOATING RATE FUND – LONG TERM PLAN,
HSBC ULTRA SHORT TERM BOND FUND and HSBC CASH FUND
Schedules forming part of the Balance Sheet as at March 31, 2013 and the
Revenue Account for the year ended March 31, 2013
liability due to change in face value of the units of the Scheme. As a result, the applicable NAV per unit of all the
Plans / Options of the Scheme was based on Rs. 1000/- for all valid Purchases / Switch-in and valid Redemptions /
Switch-out requests to be effected from NAV on December 30, 2012 and thereafter.
20 Merger of HSBC Floating Rate Fund - Short Term Plan (HFRF-STP) with HSBC Cash Fund (HCF)
Pursuant to SEBI approval vide its letter dated June 29, 2011, HFRF-STP was merged with HCF as at the close of
September 01, 2011, by virtue of which net assets of HFRF-STP as at close of Sep 01, 2011 aggregating to Rs 436.74
Lacs for Daily Dividend Option, Rs 445.57 Lacs for Growth Option, Rs 2.34 Lacs for Institutional Growth Option
and Rs. 836.14 Lacs for Weekly Dividend Option, less tax deducted at source, if any, were merged with the Daily
Dividend Option, Growth Option, Institutional Growth Option and Weekly Dividend Option of HCF respectively.
Accordingly, Unit holders of the respective Options of HFRF-STP were allotted units based on net asset value per
unit of respective Options of HCF as on Sep 01, 2011.
21 Garnishee Notice from Income Tax Authorities
An Income tax demand of Rs. 32.58 crores was purported to be recovered under garnishee proceedings, by Income
Tax Authorities in respect of investments made in Pass through Certificates (PTC) by some of the debt schemes
(including matured schemes) of HSBC Mutual Fund (HSBC MF), for A.Y. 2009-2010. The said demand, impacting
various players in the industry, raised originally on the trusts sponsored by IL&FS Trust Company Ltd., (Appellant)
was sought to be also recovered u/s 177(3) of the Income Tax Act, from HSBC MF. HSBC MF, through its trustees
filed Writ petitions before the Bombay High Court and obtained necessary reliefs for stay of the impugned demand
till the adjudication of the appeal by the first Appellate Authority and six weeks thereafter. During last week of April
2013, the first Appellate Authority passed its order giving part relief to the Appellant. Against the part relief, the
Appellant is in process of filing appeal before Income-tax Appellate Tribunal.
Similar to AY 2009-2010, HSBC MF has received a demand notice from the Income Tax Authorities for the A.Y.
2010-2011 for Rs.6.95 crores. HSBC MF, through its trustees, filed a writ petition before the Bombay High Court and
obtained necessary reliefs for stay of the impugned demand till the adjudication of the appeal by the first Appellate
Authority and six weeks thereafter. The appeal has been preferred by the appellant before the first Appellate
Authority which is pending to be heard.
Similar to the above, the assessment for the A.Y. 2007-2008 has also been reopened by the Income Tax Authorities
and demand has been made of Rs._____on the trust sponsored by IL&FS Trust Company Ltd. The trust is in process
of filing appeal before first Appellate Authority. The HSBC MF has not received any demand notice from the Income
Tax Authorities for this assessment year.
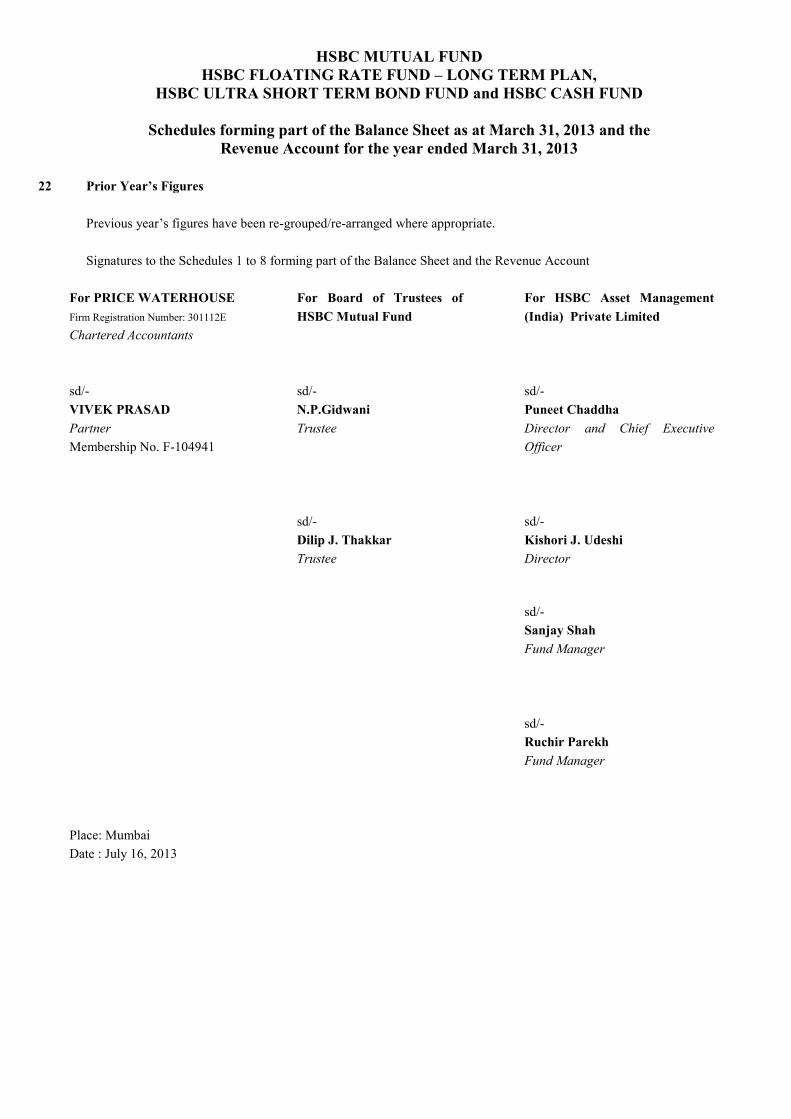
HSBC MUTUAL FUND HSBC FLOATING RATE FUND – LONG TERM PLAN,
HSBC ULTRA SHORT TERM BOND FUND and HSBC CASH FUND
Schedules forming part of the Balance Sheet as at March 31, 2013 and the
Revenue Account for the year ended March 31, 2013
22 Prior Year’s Figures
Previous year’s figures have been re-grouped/re-arranged where appropriate. Signatures to the Schedules 1 to 8 forming part of the Balance Sheet and the Revenue Account
For PRICE WATERHOUSE Firm Registration Number: 301112E
Chartered Accountants
For Board of Trustees of HSBC Mutual Fund
For HSBC Asset Management (India) Private Limited
sd/- VIVEK PRASAD Partner Membership No. F-104941
sd/- N.P.Gidwani Trustee
sd/- Puneet Chaddha
Director and Chief Executive Officer
sd/- Dilip J. Thakkar Trustee
sd/- Kishori J. Udeshi Director
Place: Mumbai Date : July 16, 2013
sd/- Sanjay Shah Fund Manager sd/- Ruchir Parekh Fund Manager
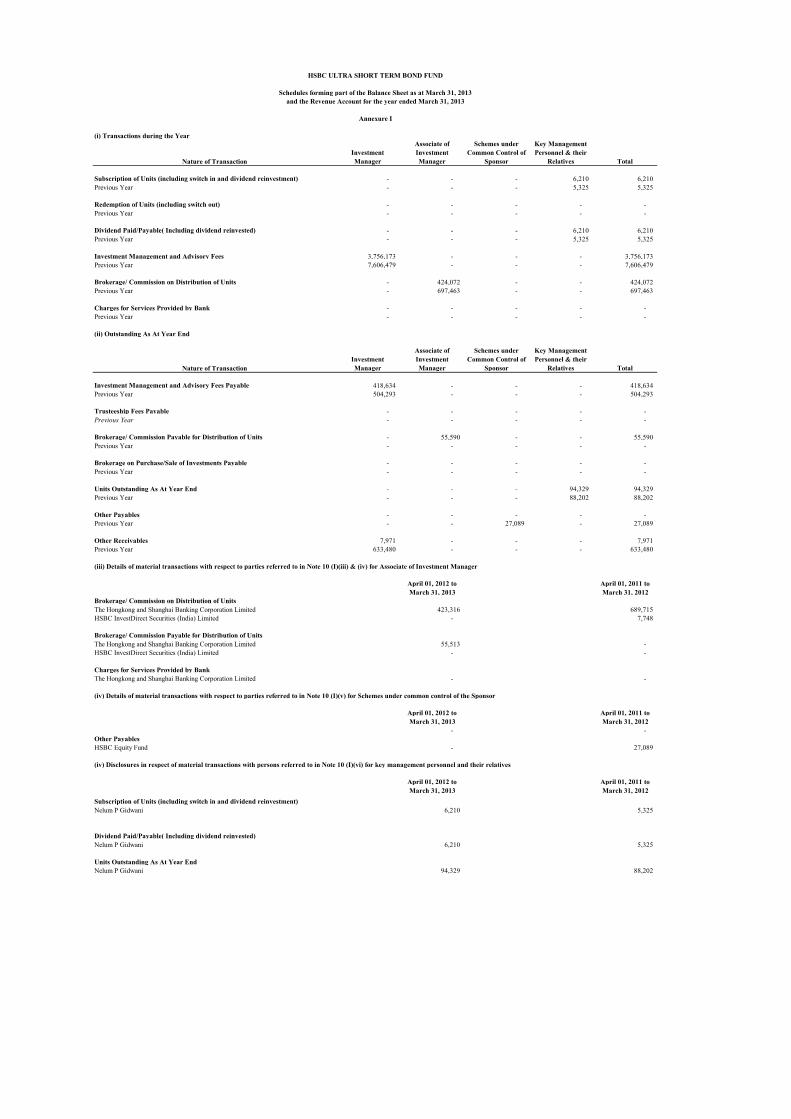
(i) Transactions during the Year
Nature of TransactionInvestment Manager
Associate of Investment Manager
Schemes under Common Control of
Sponsor
Key Management Personnel & their
Relatives Total
Subscription of Units (including switch in and dividend reinvestment) - - - 6,210 6,210 Previous Year - - - 5,325 5,325
Redemption of Units (including switch out) - - - - - Previous Year - - - - -
Dividend Paid/Payable( Including dividend reinvested) - - - 6,210 6,210 Previous Year - - - 5,325 5,325
Investment Management and Advisory Fees 3,756,173 - - - 3,756,173 Previous Year 7,606,479 - - - 7,606,479
Brokerage/ Commission on Distribution of Units - 424,072 - - 424,072 Previous Year - 697,463 - - 697,463
Charges for Services Provided by Bank - - - - - Previous Year - - - - -
(ii) Outstanding As At Year End
Nature of TransactionInvestment Manager
Associate of Investment Manager
Schemes under Common Control of
Sponsor
Key Management Personnel & their
Relatives Total
Investment Management and Advisory Fees Payable 418,634 - - - 418,634 Previous Year 504,293 - - - 504,293
Trusteeship Fees Payable - - - - - Previous Year - - - - -
Brokerage/ Commission Payable for Distribution of Units - 55,590 - - 55,590 Previous Year - - - - -
Brokerage on Purchase/Sale of Investments Payable - - - - - Previous Year - - - - -
Units Outstanding As At Year End - - - 94,329 94,329 Previous Year - - - 88,202 88,202
Other Payables - - - - - Previous Year - - 27,089 - 27,089
Other Receivables 7,971 - - - 7,971 Previous Year 633,480 - - - 633,480
(iii) Details of material transactions with respect to parties referred to in Note 10 (I)(iii) & (iv) for Associate of Investment Manager
April 01, 2012 to April 01, 2011 toMarch 31, 2013 March 31, 2012
Brokerage/ Commission on Distribution of UnitsThe Hongkong and Shanghai Banking Corporation Limited 423,316 689,715 HSBC InvestDirect Securities (India) Limited - 7,748
Brokerage/ Commission Payable for Distribution of UnitsThe Hongkong and Shanghai Banking Corporation Limited 55,513 - HSBC InvestDirect Securities (India) Limited - -
Charges for Services Provided by BankThe Hongkong and Shanghai Banking Corporation Limited - -
(iv) Details of material transactions with respect to parties referred to in Note 10 (I)(v) for Schemes under common control of the Sponsor
April 01, 2012 to April 01, 2011 toMarch 31, 2013 March 31, 2012
- - Other PayablesHSBC Equity Fund - 27,089
(iv) Disclosures in respect of material transactions with persons referred to in Note 10 (I)(vi) for key management personnel and their relatives
April 01, 2012 to April 01, 2011 toMarch 31, 2013 March 31, 2012
Subscription of Units (including switch in and dividend reinvestment)Nelum P Gidwani 6,210 5,325
Dividend Paid/Payable( Including dividend reinvested)Nelum P Gidwani 6,210 5,325
Units Outstanding As At Year EndNelum P Gidwani 94,329 88,202
HSBC ULTRA SHORT TERM BOND FUND
Schedules forming part of the Balance Sheet as at March 31, 2013and the Revenue Account for the year ended March 31, 2013
Annexure I

Annexure I
(i) Transactions during the Year
Nature of Transaction SponsorInvestment Manager
Associate of Investment Manager
Schemes under Common Control of
Sponsor
Key Management Personnel & their
Relatives Total
Subscription of Units (including switch in and dividend reinvestment) 87,373,894,421 1,192,863,966 18,125,448,631 - 6,000,000 106,698,207,018 Previous Year - 592,113,029 328,670,434,452 - - 329,262,547,481
Redemption of Units (including switch out) 87,604,662,079 1,015,650,748 17,596,421,105 - - 106,216,733,933 Previous Year - 773,680,000 328,685,553,747 - - 329,459,233,747
Dividend Distribution (Including dividend reinvested) 37,877,039 587,316 12,576,764 - - 51,041,119 Previous Year - 11,653,029 84,434,452 - - 96,087,481
Investment Management and Advisory Fees - 3,322,293 - - - 3,322,293 Previous Year - 9,730,078 - - - 9,730,078
Brokerage/ Commission on Distribution of Units - - 1,603,874 - - 1,603,874 Previous Year - - 1,747,957 - - 1,747,957
Brokerage/ Commission on purchase/sales of investments - - - - - - Previous Year - - - - - -
Clearing Charges - - - - - - Previous Year - - - - - -
Fixed Deposits Placed - - - - - - Previous Year - - - - - -
Reimbursement of Expenses - 758,927 - - - 758,927 Previous Year - 243,507 - - - 243,507
Charges for Services Provided by Bank - - 86,325 - - 86,325 Previous Year - - 86,325 - - 86,325
(ii) Outstanding As At Year End
Nature of Transaction SponsorInvestment Manager
Associate of Investment Manager
Schemes under Common Control of
Sponsor
Key Management Personnel & their
Relatives Total
Investment Management and Advisory Fees Payable - 362 - - - 362 Previous Year - 1,463,427 - - - 1,463,427
Brokerage/ Commission Payable for Distribution of Units - - 278,523 - - 278,523 Previous Year - - 100,326 - - 100,326
Units Outstanding As At Year End - 80,084,614 514,212,043 - 6,024,590 600,321,247 Previous Year - 80,084,614 514,212,043 - - 594,296,657
Other Payables - - - - - - Previous Year - - - 16,256 - 16,256
Other Receivables - 858,927 - - - 858,927 Previous Year - 933,583 - 434 - 934,016
(iii) Details of material transactions with respect to parties referred to in Note 10 (I)(iii) & (iv) for Associate of Investment Manager
April 01, 2012 to April 01, 2011 toMarch 31, 2013 March 31, 2012
Subscription of Units (including switch in and dividend reinvestment)HSBC InvestDirect Securities (India) Limited 5,074,764,092 - Investsmart Financial Services Limited 7,175,148,972 - HSBC Software Development India Private Limited 1,151,580,426 - Multi Commodity Exchange of India Limited 1,921,262,351 - Shriram Transport Finance Company Limited 2,339,999,700 - HSBC Securities And Capital Markets India Private Limited - 323,322,899,392
Redemption of Units (including switch out)HSBC InvestDirect Securities (India) Limited 5,081,345,678 - HSBC Software Development India Private Limited 811,892,646 - Investsmart Financial Services Limited 7,182,705,503 - Multi Commodity Exchange of India Limited 1,873,547,071 - Shriram Transport Finance Company Limited 2,345,700,143 - HSBC Securities And Capital Markets India Private Limited - 323,333,185,420
Dividend Paid/Payable( Including dividend reinvested)HSBC Asset Management India Private Limited - - HSBC Securities And Capital Markets India Private Limited - 84,399,392 HSBC Software Development India Private Limited 10,282,181 - Multi Commodity Exchange of India Limited 2,294,583 -
Brokerage/ Commission on Distribution of UnitsThe Hongkong and Shanghai Banking Corporation Limited 1,479,963 1,689,554 HSBC InvestDirect Securities (India) Limited - 58,403
Brokerage/ Commission Payable for Distribution of UnitsThe Hongkong and Shanghai Banking Corporation Limited 269,494 100,326 HSBC InvestDirect Securities (India) Limited - -
Charges for Services Provided by BankThe Hongkong and Shanghai Banking Corporation Limited 86,325 86,325
Units Outstanding As At Year EndHSBC Asset Management India Private Limited - - HSBC Securities And Capital Markets India Private Limited 514,212,043 514,212,043
(iv) Disclosures in respect of material transactions with persons referred to in Note 10 (I)(vi) for key management personnel and their relatives
April 01, 2012 to April 01, 2011 toMarch 31, 2013 March 31, 2012
Subscription of Units (including switch in and dividend reinvestment)Puneet Chaddha 6,000,000 - Kemaya Lal Kidwai - 9,137,830 Naina Lal Kidwai - - Rashid K Kidwai(Relative) - -
Redemption of Units (including switch out)Kemaya Lal Kidwai - 10,541,330 Naina Lal Kidwai - - Rashid K Kidwai(Relative) - -
Dividend Distribution (Including dividend reinvested)Kemaya Lal Kidwai - 19,803 Naina Lal Kidwai - - Rashid K Kidwai(Relative) - -
Units Outstanding As At Year EndKemaya Lal Kidwai - - Rashid K Kidwai(Relative) - - Naina Lal Kidwai - - Rumaan Nazir Kidwai - - Puneet Chaddha 6,024,590 -
HSBC CASH FUND
Schedules forming part of the Balance Sheet as at March 31, 2013and the Revenue Account for the year ended March 31, 2013

(i) Transactions during the Year
Nature of Transaction Investment ManagerAssociate of
Investment Manager
Key Management Personnel & their
Relatives Total
Subscription of Units (including switch in and dividend reinvestment) - 550,000,000 - 550,000,000 Previous Year - 351,460,717 101,727 351,562,444
Redemption of Units (including switch out) - 251,993,298 102,109 252,095,406 Previous Year - 351,581,273 - 351,581,273
Dividend Distribution (including dividend reinvested) - 20,407,543 - 20,407,543 Previous Year - 1,460,717 1,939 1,462,656
Investment Management and Advisory Fees 8,226,676 - - 8,226,676 Previous Year 8,495,941 - - 8,495,941
Brokerage/ Commission on Distribution of Units - 747,164 - 747,164 Previous Year - 509,731 - 509,731
Brokerage/ Commission on purchase/sales of investments - - - - Previous Year - - - -
Charges for Services Provided by Bank - - - - Previous Year - - - -
(ii) Outstanding As At Year End
Nature of Transaction Investment ManagerAssociate of
Investment Manager
Key Management Personnel & their
Relatives Total
Investment Management and Advisory Fees Payable 1,105,592 - - 1,105,592 Previous Year 1,345,214 - - 1,345,214
Brokerage/ Commission Payable on Distribution of Units - 110,460 - 110,460 Previous Year - 104,928 - 104,928
Units Outstanding As At Year End - - 102,520 102,520 Previous Year - - 102,520 102,520
(iii) Details of material transactions with respect to parties referred to in Note 13 (I)(iii), (iv), (v), (vi), (vii) and (viii) for Associate of Investment Manager
April 01, 2012 to April 01, 2011 toMarch 31, 2013 March 31, 2012
Subscription of Units (including switch in and dividend reinvestment)Multi Commodity Exchange of India Limited 250,000,000 351,460,717 HSBC Software Development India Private Limited 300,000,000 -
Redemption of Units (including switch out)Multi Commodity Exchange of India Limited 251,993,298 351,581,273
Dividend Distribution (including dividend reinvested)HSBC Software Development India Private Limited 18,477,819 - Multi Commodity Exchange of India Limited 1,929,724 1,460,717
Brokerage / Commission on Distribution of UnitsThe Hongkong and Shanghai Banking Corporation Limited 725,878 469,206 HSBC InvestDirect Securities (India) Limited - 44,719
Brokerage / Commission Payable on Distribution of UnitsThe Hongkong and Shanghai Banking Corporation Limited 110,192 99,589 HSBC InvestDirect Securities (India) Limited - -
(iv) Disclosures in respect of material transactions with persons referred to in Note 13 (I)(x) for key management personnel and their relatives
April 01, 2012 to April 01, 2011 toMarch 31, 2013 March 31, 2012
Subscription of Units (including switch in and dividend reinvestment)Rashid K Kidwai (Relative) - 101,727 Manu Tandon 2,573,774 2,573,774
Redemption of Units (including switch out)Manu Tandon - 2,581,689 Rashid K Kidwai (Relative) 102,109 -
Dividend Distribution (including dividend reinvested)Manu Tandon - 6,751 Kemaya Lal Kidwai - - Rashid K Kidwai (Relative) - 1,939 Rumaan Nazir Kidwai (Relative) - -
Units Outstanding As At Year EndNaina Lal Kidwai - - Kemaya Lal Kidwai - - Rashid K Kidwai (Relative) - 102,520 Rumaan Nazir Kidwai - -
HSBC FLOATING RATE FUND - LONG TERM PLAN
Schedules forming part of the Balance Sheet as at March 31, 2013and the Revenue Account for the year ended March 31, 2013
Annexure I

Company Name Schemes invested in by the Company
Investment made by schemes of HSBC Mutual Fund in the
company/subsidiary
Aggregate cost of acquisition during
the year ended March 31, 2013
Outstanding as at March 31, 2013(At Market / Fair
Value)
(Rupees in Lakhs) (Rupees in Lakhs)
Hindalco Industries Limited HFTS81 HDF 309.76 219.84
HIOF 514.67 366.40
HTSF 409.96 -
HUOF 93.18 64.76
Larsen & Toubro Limited HCF HDF 794.22 683.10
HFRF HEF - 1,912.68
HIOF 338.53 618.21
HMIP 365.99 -
HPTF 556.00 -
HTSF 137.77 -
HUOF 149.90 133.20
L&T Finance Limited HCF 9,110.12 -
(Subsidiary of Larsen & Toubro Limited) HFRF 4,231.84 -
HUSBF 9.87 -
Mahindra & Mahindra Limited HCF HTSF 956.77 -
Mahindra & Mahindra Financial Services Limited HCF 7,207.55 2,473.50
(Subsidiary of Mahindra & Mahindra Limited) HFRF 10,164.61 -
HIF 1,973.43 -
HMIP 2,498.35 -
HUSBF 345.73 -
Reliance Industries Limited HIF HDF 483.06 656.97
HFTS90 HEF - 2,705.15
HIOF - 699.47
HUOF - 120.57
Shriram Transport Finance Company Limited HCF HCF 1,483.40 -
HFDF 2,993.62 3,307.96
HIF 3,498.62 7,914.07
HMIP 280.88 3,080.23
Shriram Equipment Finance Company Ltd HCF 988.86 -
(Subsidiary of Shriram Transport Finance Company Limited) HFRF 1,486.31 -
United Bank of India HCF HCF 3,239.95 2,376.57
HFRF 97.33 -
HFTS80 2,498.34 -
HFTS83 1,775.75 -
HIF 3,061.35 2,578.75
HPTF 240.51 189.34
HUSBF 486.66 -
Scheme Name Scheme CodeHSBC Cash Fund HCF
HSBC Dynamic Fund HDF
HSBC Equity Fund HEF
HSBC Flexi Debt Fund HFDF
HSBC Floating Rate Fund - Long Term Plan HFRF
HSBC Fixed Term Series 79 HFTS79
HSBC Fixed Term Series 81 HFTS81
HSBC Fixed Term Series 80 HFTS80
HSBC Fixed Term Series 83 HFTS83
HSBC Income Fund HIF
HSBC India Opportunities Fund HIOF
HSBC Progressive Themes Fund HPTF
HSBC Small Cap Fund HSCF
HSBC Tax Saver Equity Fund HTSF
HSBC Ultra Short Term Bond Fund HUSBF
HSBC Fixed Term Series 90 HFTS90
HSBC MIP Fund HMIP
HSBC Unique Opportunities Fund HUOF
Annexure II
Disclosure under Regulation 25(11) of the Securities and Exchange Board of India (Mutual Funds) Regulations, 1996 as amended Investments made by the schemes of HSBC Mutual Fund in Companies or their subsidiaries that have invested more than 5%
of the net assets of any scheme
The above investments comprise equity shares, debentures / bonds, commercial papers, certificate of deposits, fixed deposits and other debt instruments. These investments have been made on account of their high credit quality and competitive yield for the investment in fixed income/ money market instruments and in case of equity shares because of
attractive valuations of these companies.

April 01, 2012 April 01, 2011 April 01, 2010to March 31, 2013 to March 31, 2012 to March 31, 2011
Rupees Rupees Rupees
(a) Net asset value per unit at the end of the year (Note 2.5)
Regular Option
Growth Sub Option 1,832.4527 16.9586 15.6956 Daily Dividend Sub Option 1,020.0185 10.1958 10.1930 Weekly Dividend Sub Option 1,002.3966 10.0197 10.0169
Institutional Option
Growth Sub Option 1,866.8709 17.1827 15.8794 Daily Dividend Sub Option 1,086.0890 10.4430 10.4401 Weekly Dividend Sub Option - 10.8656 10.4777 Monthly Dividend Sub Option - 10.5243 10.5355
Institutional Plus Option
Growth Option 1,169.7318 10.7376 15.0184 Daily Dividend Option 1,001.3459 10.0085 10.0056 Weekly Dividend Option 1,111.3623 10.8389 10.2489 Monthly Dividend Option 1,000.7958 - 10.0905
Direct Plan - Growth Option 1,169.7357 N.A. N.A. Direct Plan - Daily Dividend Option 1,001.3457 N.A. N.A. Direct Plan - Weekly Dividend Option 1,111.3632 N.A. N.A. Direct Plan - Monthly Dividend Option N.A. N.A. N.A.
(b) Gross Income
(i) income other than profit on sale of investment 75.5811 1.5935 0.9165
(ii) income from profit on inter scheme sales/transfer of investment - - -
(iii) income (net) from profit on sale of investments to third party 212,527.0000 - 0.0003
(iv) transfer of revenue account from past year’s reserve (67.9851) 0.1981 0.0361
Gross income and gains 212,534.5960 1.7916 0.9528
(c) Aggregate of expenses, writeoff, amortisation and charges 2.3119 0.0898 0.0781
(d) Net income 212,532.2842 1.7018 0.8747
(e) Net change in unrealised appreciation / (depreciation) in valueof investments - - -
(f) Redemption priceHighest
- Regular Option Growth Sub Option 1,830.7279 16.9492 15.6921 - Regular Option Daily Dividend Sub Option 1,019.3000 10.1930 10.1930 - Regular Option Weekly Dividend Sub Option 1,002.9720 10.0333 10.0287 - Institutional Option Growth Sub Option - 17.1607 15.5206 - Institutional Option Daily Dividend Sub Option 1,083.4295 10.4401 10.4401 - Institutional Option Weekly Dividend Sub Option 10.9655 10.8788 10.4763 - Institutional Option Monthly Dividend Sub Option 10.5525 10.5644 10.5832 - Growth Option 1,168.5125 15.1246 15.0148 - Daily Dividend Option 1,000.5600 10.0056 10.0056 - Weekly Dividend Option 1,112.0376 10.6410 10.2474 - Monthly Dividend Option 1,007.8298 10.1395 10.1066
J - Direct Plan - Growth Option 1,167.9227 N.A. N.A. J - Direct Plan - Daily Dividend Option 1,000.5600 N.A. N.A. J - Direct Plan - Weekly Dividend Option 1,112.0934 N.A. N.A. J - Direct Plan - Monthly Dividend Option 1,002.9646 N.A. N.A.
Lowest- Regular Option Growth Sub Option 1,798.4486 15.7132 14.8955 - Regular Option Daily Dividend Sub Option 1,019.3000 10.1930 10.1930 - Regular Option Weekly Dividend Sub Option 1,002.0847 10.0203 10.0184 - Institutional Option Growth Sub Option - 16.0112 15.0978 - Institutional Option Daily Dividend Sub Option 1,077.3676 10.4401 10.4401 - Institutional Option Weekly Dividend Sub Option 10.8722 10.8371 10.4680 - Institutional Option Monthly Dividend Sub Option 10.5525 10.5260 10.5213 - Growth Option 1,145.2041 10.0207 14.1616 - Daily Dividend Option 1,000.5600 10.0056 10.0056 - Weekly Dividend Option 1,110.9877 10.3040 10.2367 - Monthly Dividend Option 1,000.4707 10.0853 10.0818
J - Direct Plan - Growth Option 1,146.2713 N.A. N.A. J - Direct Plan - Daily Dividend Option 1,000.5600 N.A. N.A. J - Direct Plan - Weekly Dividend Option 1,111.8692 N.A. N.A. J - Direct Plan - Monthly Dividend Option 1,002.9646 N.A. N.A.
(g) Purchase priceHighest
- Regular Option Growth Sub Option 1,797.7027 16.9492 15.6921 - Regular Option Daily Dividend Sub Option 1,019.3000 10.1930 10.1930 - Regular Option Weekly Dividend Sub Option 10.8625 10.0305 10.0286 - Institutional Option Growth Sub Option 1,828.4336 17.1730 15.8757 - Institutional Option Daily Dividend Sub Option 1,063.7191 10.4401 10.4401 - Institutional Option Weekly Dividend Sub Option 10.9499 10.8788 10.4700 - Institutional Option Monthly Dividend Sub Option - 10.5852 10.5832 - Growth Option 1,168.5125 15.1214 15.0075 - Daily Dividend Option 1,000.5600 10.0056 10.0056 - Weekly Dividend Option 1,112.2726 10.6482 10.2459 - Monthly Dividend Option 1,006.3647 10.1395 10.1312
J - Direct Plan - Growth Option 1,168.5126 N.A. N.A. J - Direct Plan - Daily Dividend Option 1,000.5600 N.A. N.A. J - Direct Plan - Weekly Dividend Option 1,112.0513 N.A. N.A. J - Direct Plan - Monthly Dividend Option 1,001.4053 N.A. N.A.
Lowest- Regular Option Growth Sub Option 1,797.7027 15.7099 14.8955 - Regular Option Daily Dividend Sub Option 1,019.3000 10.1930 10.1930 - Regular Option Weekly Dividend Sub Option 1,001.6900 10.0169 10.0169 - Institutional Option Growth Sub Option 1,828.4336 16.2803 15.2380 - Institutional Option Daily Dividend Sub Option 1,063.7191 10.4401 10.4401 - Institutional Option Weekly Dividend Sub Option 10.8625 10.8237 10.4635 - Institutional Option Monthly Dividend Sub Option - 10.5852 10.5213 - Growth Option 1,144.6666 10.0000 14.1616 - Daily Dividend Option 1,000.5600 10.0056 10.0056 - Weekly Dividend Option 1,110.4900 10.2609 10.2343 - Monthly Dividend Option 1,000.0034 10.0806 10.0762
J - Direct Plan - Growth Option 1,145.4750 N.A. N.A. J - Direct Plan - Daily Dividend Option 1,000.5600 N.A. N.A. J - Direct Plan - Weekly Dividend Option 1,110.4900 N.A. N.A. J - Direct Plan - Monthly Dividend Option 1,000.0050 N.A. N.A.
(h) Price earnings ratio NA NA NA
(i) Ratio of expenses (excluding initial issue expenses) to average daily net assets by percentageRegular Option 0.98% 0.75% 1.00%Institutional Option 0.39% 0.60% 0.75%Institutional Plus Option 0.11% 0.34% 0.35%Direct 0.01% NA NA
(j) Ratio of gross income (including net profit / loss on sale of investments and net change in 8.65% 8.47% 6.33%unrealised depreciation in value of investments) to average daily net assets by percentage
* The above per unit calculations are based on the number of units in issue at the end of the financial year# Below 0.01 per unit@ The ratio of expenses and gross income to average daily net assets by percentage have been annualised for
the period April 1, 2005 to March 31, 2006.
HSBC CASH FUND
HISTORICAL PER UNIT STATISTICS*
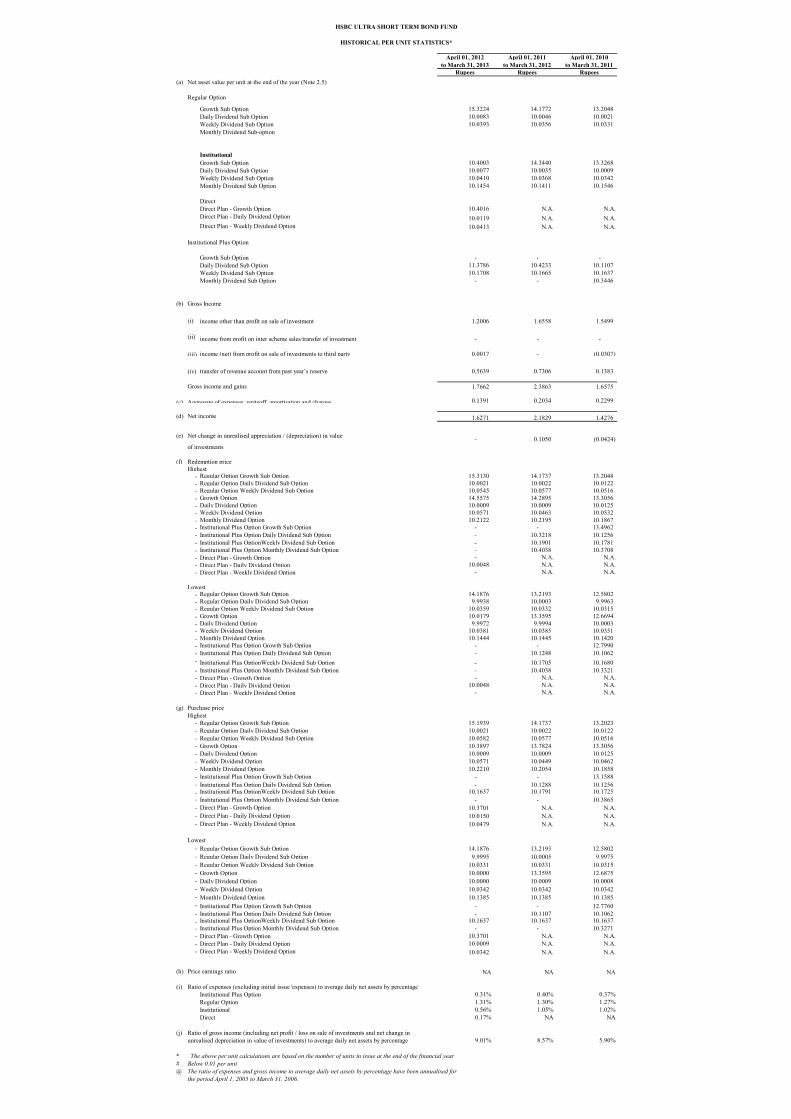
April 01, 2012 April 01, 2011 April 01, 2010to March 31, 2013 to March 31, 2012 to March 31, 2011
Rupees Rupees Rupees(a) Net asset value per unit at the end of the year (Note 2.5)
Regular Option
Growth Sub Option 15.3224 14.1772 13.2048 Daily Dividend Sub Option 10.0083 10.0046 10.0021 Weekly Dividend Sub Option 10.0393 10.0356 10.0331 Monthly Dividend Sub-option
InstitutionalGrowth Sub Option 10.4003 14.3440 13.3268 Daily Dividend Sub Option 10.0077 10.0035 10.0009 Weekly Dividend Sub Option 10.0410 10.0368 10.0342 Monthly Dividend Sub Option 10.1454 10.1411 10.1546
DirectDirect Plan - Growth Option 10.4016 N.A. N.A. Direct Plan - Daily Dividend Option 10.0119 N.A. N.A. Direct Plan - Weekly Dividend Option 10.0413 N.A. N.A.
Institutional Plus Option
Growth Sub Option - - - Daily Dividend Sub Option 11.3786 10.4233 10.1107 Weekly Dividend Sub Option 10.1708 10.1665 10.1637 Monthly Dividend Sub Option - - 10.3446
(b) Gross Income
(i) income other than profit on sale of investment 1.2006 1.6558 1.5499
(ii) income from profit on inter scheme sales/transfer of investment - - -
(iii) income (net) from profit on sale of investments to third party 0.0017 - (0.0307)
(iv) transfer of revenue account from past year’s reserve 0.5639 0.7306 0.1383
Gross income and gains 1.7662 2.3863 1.6575
(c) Aggregate of expenses, writeoff, amortisation and charges 0.1391 0.2034 0.2299
(d) Net income 1.6271 2.1829 1.4276
(e) Net change in unrealised appreciation / (depreciation) in value - 0.1050 (0.0424) of investments
(f) Redemption priceHighest
B - Regular Option Growth Sub Option 15.3130 14.1737 13.2048 A - Regular Option Daily Dividend Sub Option 10.0021 10.0022 10.0122 K - Regular Option Weekly Dividend Sub Option 10.0545 10.0577 10.0516 C - Growth Option 14.5575 14.2895 13.3056 D - Daily Dividend Option 10.0009 10.0009 10.0125 E - Weekly Dividend Option 10.0571 10.0463 10.0532 F - Monthly Dividend Option 10.2122 10.2195 10.1867 G - Institutional Plus Option Growth Sub Option - - 13.4962 H - Institutional Plus Option Daily Dividend Sub Option - 10.3218 10.1256 I - Institutional Plus OptionWeekly Dividend Sub Option - 10.1901 10.1781 J - Institutional Plus Option Monthly Dividend Sub Option - 10.4038 10.3708 J - Direct Plan - Growth Option - N.A. N.A. J - Direct Plan - Daily Dividend Option 10.0048 N.A. N.A. J - Direct Plan - Weekly Dividend Option - N.A. N.A.
LowestB - Regular Option Growth Sub Option 14.1876 13.2193 12.5802 A - Regular Option Daily Dividend Sub Option 9.9938 10.0003 9.9963 K - Regular Option Weekly Dividend Sub Option 10.0359 10.0332 10.0315 C - Growth Option 10.0179 13.3595 12.6694 D - Daily Dividend Option 9.9972 9.9994 10.0003 E - Weekly Dividend Option 10.0381 10.0385 10.0351 F - Monthly Dividend Option 10.1444 10.1445 10.1420 G - Institutional Plus Option Growth Sub Option - - 12.7990 H - Institutional Plus Option Daily Dividend Sub Option - 10.1248 10.1062 I - Institutional Plus OptionWeekly Dividend Sub Option - 10.1705 10.1680 J - Institutional Plus Option Monthly Dividend Sub Option - 10.4038 10.3321 J - Direct Plan - Growth Option - N.A. N.A. J - Direct Plan - Daily Dividend Option 10.0048 N.A. N.A. J - Direct Plan - Weekly Dividend Option - N.A. N.A.
(g) Purchase priceHighest
B - Regular Option Growth Sub Option 15.1939 14.1737 13.2023 A - Regular Option Daily Dividend Sub Option 10.0021 10.0022 10.0122 K - Regular Option Weekly Dividend Sub Option 10.0582 10.0577 10.0516 C - Growth Option 10.3897 13.7824 13.3056 D - Daily Dividend Option 10.0009 10.0009 10.0125 E - Weekly Dividend Option 10.0571 10.0449 10.0462 F - Monthly Dividend Option 10.2210 10.2054 10.1858 G - Institutional Plus Option Growth Sub Option - - 13.1588 H - Institutional Plus Option Daily Dividend Sub Option - 10.1288 10.1256 I - Institutional Plus OptionWeekly Dividend Sub Option 10.1637 10.1791 10.1725 J - Institutional Plus Option Monthly Dividend Sub Option - - 10.3865 J - Direct Plan - Growth Option 10.3701 N.A. N.A. J - Direct Plan - Daily Dividend Option 10.0150 N.A. N.A. J - Direct Plan - Weekly Dividend Option 10.0479 N.A. N.A.
LowestB - Regular Option Growth Sub Option 14.1876 13.2193 12.5802 A - Regular Option Daily Dividend Sub Option 9.9995 10.0005 9.9975 K - Regular Option Weekly Dividend Sub Option 10.0331 10.0331 10.0315 C - Growth Option 10.0000 13.3595 12.6875 D - Daily Dividend Option 10.0000 10.0009 10.0008 E - Weekly Dividend Option 10.0342 10.0342 10.0342 F - Monthly Dividend Option 10.1385 10.1385 10.1385 G - Institutional Plus Option Growth Sub Option - - 12.7760 H - Institutional Plus Option Daily Dividend Sub Option - 10.1107 10.1062 I - Institutional Plus OptionWeekly Dividend Sub Option 10.1637 10.1637 10.1637 J - Institutional Plus Option Monthly Dividend Sub Option - - 10.3271 J - Direct Plan - Growth Option 10.3701 N.A. N.A. J - Direct Plan - Daily Dividend Option 10.0009 N.A. N.A. J - Direct Plan - Weekly Dividend Option 10.0342 N.A. N.A.
(h) Price earnings ratio NA NA NA
(i) Ratio of expenses (excluding initial issue 'expenses) to average daily net assets by percentageInstitutional Plus Option 0.31% 0.40% 0.37%Regular Option 1.31% 1.30% 1.27%Institutional 0.56% 1.05% 1.02%Direct 0.17% NA NA
(j) Ratio of gross income (including net profit / loss on sale of investments and net change in unrealised depreciation in value of investments) to average daily net assets by percentage 9.01% 8.57% 5.90%
* The above per unit calculations are based on the number of units in issue at the end of the financial year# Below 0.01 per unit@ The ratio of expenses and gross income to average daily net assets by percentage have been annualised for
the period April 1, 2005 to March 31, 2006.
HSBC ULTRA SHORT TERM BOND FUND
HISTORICAL PER UNIT STATISTICS*
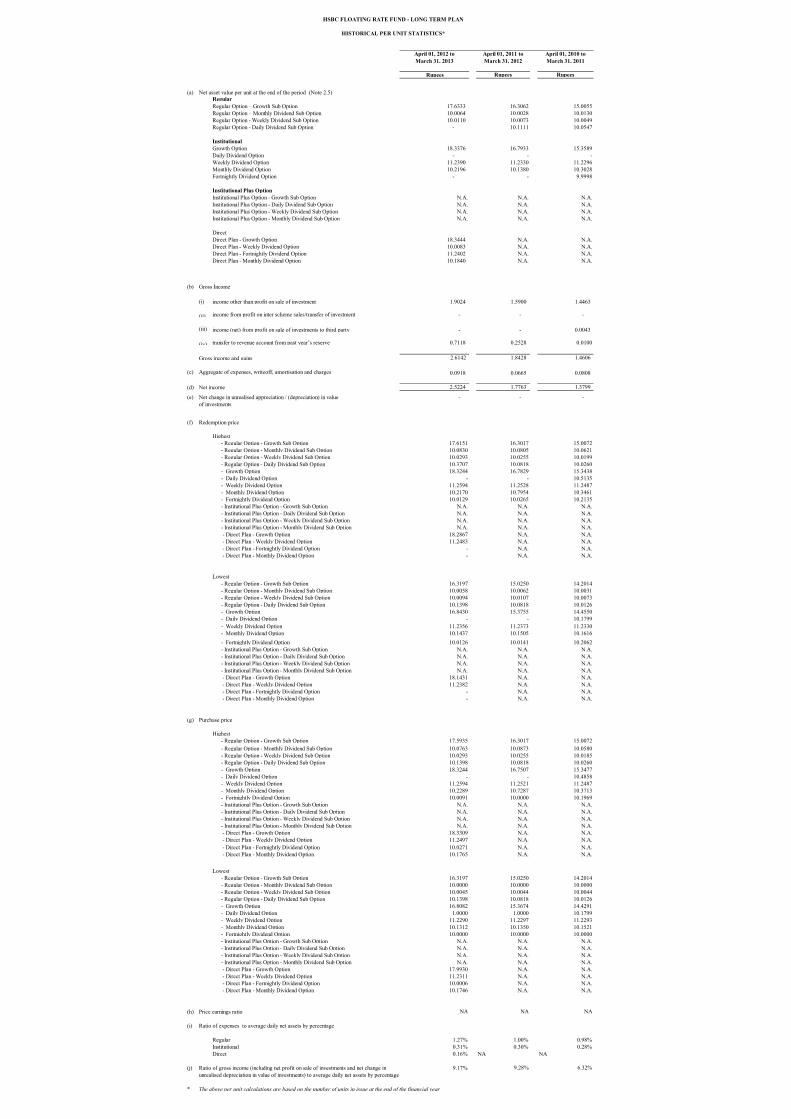
H35858
April 01, 2012 toMarch 31, 2013
April 01, 2011 toMarch 31, 2012
April 01, 2010 toMarch 31, 2011
Rupees Rupees Rupees
(a) Net asset value per unit at the end of the period (Note 2.5)RegularRegular Option – Growth Sub Option 17.6333 16.3062 15.0055 Regular Option – Monthly Dividend Sub Option 10.0064 10.0028 10.0130 Regular Option - Weekly Dividend Sub Option 10.0110 10.0073 10.0049 Regular Option - Daily Dividend Sub Option - 10.1111 10.0547
InstitutionalGrowth Option 18.3376 16.7933 15.3589 Daily Dividend Option - - - Weekly Dividend Option 11.2390 11.2330 11.2296 Monthly Dividend Option 10.2196 10.1380 10.3028 Fortnightly Dividend Option - - 9.9998
Institutional Plus Option Institutional Plus Option - Growth Sub Option N.A. N.A. N.A. Institutional Plus Option - Daily Dividend Sub Option N.A. N.A. N.A. Institutional Plus Option - Weekly Dividend Sub Option N.A. N.A. N.A. Institutional Plus Option - Monthly Dividend Sub Option N.A. N.A. N.A.
DirectDirect Plan - Growth Option 18.3444 N.A. N.A. Direct Plan - Weekly Dividend Option 10.0083 N.A. N.A. Direct Plan - Fortnightly Dividend Option 11.2402 N.A. N.A. Direct Plan - Monthly Dividend Option 10.1840 N.A. N.A.
(b) Gross Income
(i) income other than profit on sale of investment 1.9024 1.5900 1.4463
(ii) income from profit on inter scheme sales/transfer of investment - - -
(iii) income (net) from profit on sale of investments to third party - - 0.0043
(iv) transfer to revenue account from past year’s reserve 0.7118 0.2528 0.0100
Gross income and gains 2.6142 1.8428 1.4606
(c) Aggregate of expenses, writeoff, amortisation and charges 0.0918 0.0665 0.0808
(d) Net income 2.5224 1.7763 1.3799
(e) Net change in unrealised appreciation / (depreciation) in value - - - of investments
(f) Redemption price
Highest - Regular Option - Growth Sub Option 17.6151 16.3017 15.0072 - Regular Option - Monthly Dividend Sub Option 10.0830 10.0805 10.0621 - Regular Option - Weekly Dividend Sub Option 10.0293 10.0255 10.0199 - Regular Option - Daily Dividend Sub Option 10.3707 10.0818 10.0260 - Growth Option 18.3244 16.7829 15.3438 - Daily Dividend Option - - 10.5135 - Weekly Dividend Option 11.2594 11.2528 11.2487 - Monthly Dividend Option 10.2170 10.7954 10.3461 - Fortnightly Dividend Option 10.0129 10.0265 10.2135 - Institutional Plus Option - Growth Sub Option N.A. N.A. N.A. - Institutional Plus Option - Daily Dividend Sub Option N.A. N.A. N.A. - Institutional Plus Option - Weekly Dividend Sub Option N.A. N.A. N.A. - Institutional Plus Option - Monthly Dividend Sub Option N.A. N.A. N.A. - Direct Plan - Growth Option 18.2867 N.A. N.A. - Direct Plan - Weekly Dividend Option 11.2483 N.A. N.A. - Direct Plan - Fortnightly Dividend Option - N.A. N.A. - Direct Plan - Monthly Dividend Option - N.A. N.A.
Lowest - Regular Option - Growth Sub Option 16.3197 15.0250 14.2014 - Regular Option - Monthly Dividend Sub Option 10.0058 10.0062 10.0031 - Regular Option - Weekly Dividend Sub Option 10.0094 10.0107 10.0073 - Regular Option - Daily Dividend Sub Option 10.1398 10.0818 10.0126 - Growth Option 16.8430 15.3755 14.4550 - Daily Dividend Option - - 10.1799 - Weekly Dividend Option 11.2356 11.2373 11.2330 - Monthly Dividend Option 10.1437 10.1505 10.1616 - Fortnightly Dividend Option 10.0126 10.0141 10.2062 - Institutional Plus Option - Growth Sub Option N.A. N.A. N.A. - Institutional Plus Option - Daily Dividend Sub Option N.A. N.A. N.A. - Institutional Plus Option - Weekly Dividend Sub Option N.A. N.A. N.A. - Institutional Plus Option - Monthly Dividend Sub Option N.A. N.A. N.A. - Direct Plan - Growth Option 18.1431 N.A. N.A. - Direct Plan - Weekly Dividend Option 11.2382 N.A. N.A. - Direct Plan - Fortnightly Dividend Option - N.A. N.A. - Direct Plan - Monthly Dividend Option - N.A. N.A.
(g) Purchase price
Highest - Regular Option - Growth Sub Option 17.5935 16.3017 15.0072 - Regular Option - Monthly Dividend Sub Option 10.0763 10.0873 10.0580 - Regular Option - Weekly Dividend Sub Option 10.0293 10.0255 10.0185 - Regular Option - Daily Dividend Sub Option 10.1398 10.0818 10.0260 - Growth Option 18.3244 16.7507 15.3477 - Daily Dividend Option - - 10.4858 - Weekly Dividend Option 11.2594 11.2521 11.2487 - Monthly Dividend Option 10.2289 10.7287 10.3713 - Fortnightly Dividend Option 10.0091 10.0000 10.1969 - Institutional Plus Option - Growth Sub Option N.A. N.A. N.A. - Institutional Plus Option - Daily Dividend Sub Option N.A. N.A. N.A. - Institutional Plus Option - Weekly Dividend Sub Option N.A. N.A. N.A. - Institutional Plus Option - Monthly Dividend Sub Option N.A. N.A. N.A. - Direct Plan - Growth Option 18.3309 N.A. N.A. - Direct Plan - Weekly Dividend Option 11.2497 N.A. N.A. - Direct Plan - Fortnightly Dividend Option 10.0271 N.A. N.A. - Direct Plan - Monthly Dividend Option 10.1765 N.A. N.A.
Lowest - Regular Option - Growth Sub Option 16.3197 15.0250 14.2014 - Regular Option - Monthly Dividend Sub Option 10.0000 10.0000 10.0000 - Regular Option - Weekly Dividend Sub Option 10.0045 10.0044 10.0044 - Regular Option - Daily Dividend Sub Option 10.1398 10.0818 10.0126 - Growth Option 16.8082 15.3674 14.4291 - Daily Dividend Option 1.0000 1.0000 10.1799 - Weekly Dividend Option 11.2290 11.2297 11.2293 - Monthly Dividend Option 10.1312 10.1350 10.1521 - Fortnightly Dividend Option 10.0000 10.0000 10.0000 - Institutional Plus Option - Growth Sub Option N.A. N.A. N.A. - Institutional Plus Option - Daily Dividend Sub Option N.A. N.A. N.A. - Institutional Plus Option - Weekly Dividend Sub Option N.A. N.A. N.A. - Institutional Plus Option - Monthly Dividend Sub Option N.A. N.A. N.A. - Direct Plan - Growth Option 17.9930 N.A. N.A. - Direct Plan - Weekly Dividend Option 11.2311 N.A. N.A. - Direct Plan - Fortnightly Dividend Option 10.0006 N.A. N.A. - Direct Plan - Monthly Dividend Option 10.1746 N.A. N.A.
(h) Price earnings ratio NA NA NA
(i) Ratio of expenses to average daily net assets by percentage
Regular 1.27% 1.00% 0.98%Institutional 0.31% 0.30% 0.28%Direct 0.16% NA NA
(j) Ratio of gross income (including net profit on sale of investments and net change in 9.17% 9.28% 6.32%unrealised depreciation in value of investments) to average daily net assets by percentage
* The above per unit calculations are based on the number of units in issue at the end of the financial year
HSBC FLOATING RATE FUND - LONG TERM PLAN
HISTORICAL PER UNIT STATISTICS*
► INDEX HSBC Fixed Term Series 80 HSBC Fixed Term Series 81 HSBC Fixed Term Series 82 HSBC Fixed Term Series 83

4
HSBC FTP Series
Trustees’ ReportFor the year ended March 31, 2013
The Trustees present the eleventh report and the audited abridged fi nancial statements of the Schemes of HSBC Mutual Fund (the “Fund”), for the year ended March 31, 2013.
1. SCHEME PERFORMANCE, FUTURE OUTLOOK AND OPERATIONS OF THE SCHEMES
a) Operations and Performance of the Schemes
HSBC Fixed Term Series - a close ended Income Scheme with fi ve plans i.e. Series 82 and 86
The Scheme seeks to generate returns by investing in a portfolio of fi xed income instruments which mature on or before the maturity date of the Plans under the Scheme.
The Scheme launched three Plans i.e. Series 82, Series 83 each having tenure of 370 days and Series 86 having tenure of 375 days. Series 82 was launched on January 17, 2012, Series 83 was launched on January 18, 2012 and Series 86 was launched on March 19, 2012. The performance of the plans is benchmarked against CRISIL Short Term Bond Fund Index. Being closed ended fi xed maturity plans, the performance of the Schemes is not provided.
HSBC Fixed Term Series - a close ended Income Scheme - Series 89 and 90
The Scheme seeks to generate returns by investing in a portfolio of fi xed income instruments which mature on or before the maturity date of the Plans under the Scheme.
The Scheme launched two Plans i.e. Series 89 & Series 90 during the year, each having tenure of 374 days and 375 days respectively. Series 89 and Series 90 were launched on March 22, 2013. The performance of the plans is benchmarked against CRISIL Short Term Bond Fund Index. Being closed ended fi xed maturity plans, the performance of the Schemes is not provided.
b) Market Overview & Outlook
EQUITY OUTLOOK
The Sensex returned 8.23% for the FY ended March 2013. While this looks to be a tepid return, the market rallied smoothly for a low of 15965 in June to end at 18835 at the FY end, a return of 17.98%. This was largely due to a series of announcements on reforms by the government and falling crude oil prices, signaling hopes of an economic recovery.
Returns (April 1, 2012 - March 31, 2013) 1 Year (%)
NIFTY 7.31
Sensex 8.23
S&P BSE 100 6.84
S&P BSE 200 6.03
S&P BSE 500 4.81
CNX Midcap -4.02
Source: Bloomberg
Our view in respect of key issues facing equity market currently is highlighted as under, based on which we do expect a likely reversal of the prevailing negative sentiment going forward -
� Macro challenge - expect some relief in current account defi cit given likely lower gold imports and crude oil correction. Solution to fi scal defi cit may however need policy decision to reduce subsidy burden on diesel, kerosene, LPG.
� Commodities infl ation expected to decline on account of China slowdown and lower growth in western world. This may have positive impact margin expansion for corporate sector and on currency (INR) and will give room for reducing interest rates over time. Lower cost of capital should hopefully revive capex spending, though gradually (recovery from 2H12).
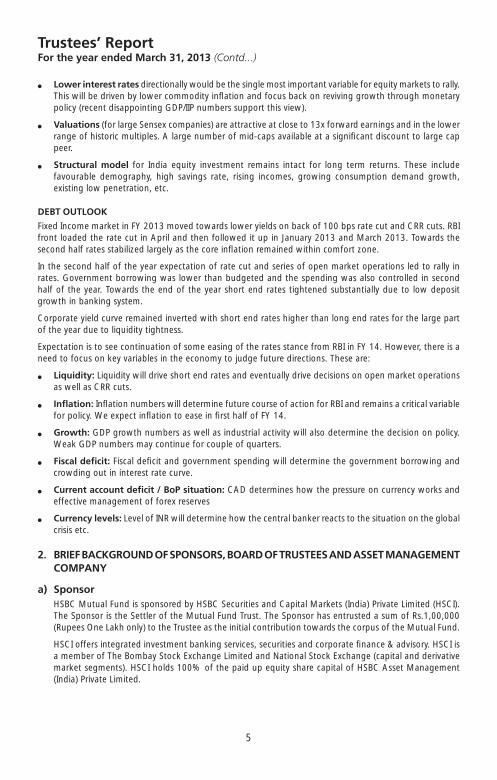
5
HSBC FTP Series
Trustees’ ReportFor the year ended March 31, 2013 (Contd...)
� Lower interest rates directionally would be the single most important variable for equity markets to rally. This will be driven by lower commodity infl ation and focus back on reviving growth through monetary policy (recent disappointing GDP/IIP numbers support this view).
� Valuations (for large Sensex companies) are attractive at close to 13x forward earnings and in the lower range of historic multiples. A large number of mid-caps available at a signifi cant discount to large cap peer.
� Structural model for India equity investment remains intact for long term returns. These include favourable demography, high savings rate, rising incomes, growing consumption demand growth, existing low penetration, etc.
DEBT OUTLOOK
Fixed Income market in FY 2013 moved towards lower yields on back of 100 bps rate cut and CRR cuts. RBI front loaded the rate cut in April and then followed it up in January 2013 and March 2013. Towards the second half rates stabilized largely as the core infl ation remained within comfort zone.
In the second half of the year expectation of rate cut and series of open market operations led to rally in rates. Government borrowing was lower than budgeted and the spending was also controlled in second half of the year. Towards the end of the year short end rates tightened substantially due to low deposit growth in banking system.
Corporate yield curve remained inverted with short end rates higher than long end rates for the large part of the year due to liquidity tightness.
Expectation is to see continuation of some easing of the rates stance from RBI in FY 14. However, there is a need to focus on key variables in the economy to judge future directions. These are:
� Liquidity: Liquidity will drive short end rates and eventually drive decisions on open market operations as well as CRR cuts.
� Infl ation: Infl ation numbers will determine future course of action for RBI and remains a critical variable for policy. We expect infl ation to ease in fi rst half of FY 14.
� Growth: GDP growth numbers as well as industrial activity will also determine the decision on policy. Weak GDP numbers may continue for couple of quarters.
� Fiscal defi cit: Fiscal defi cit and government spending will determine the government borrowing and crowding out in interest rate curve.
� Current account defi cit / BoP situation: CAD determines how the pressure on currency works and effective management of forex reserves
� Currency levels: Level of INR will determine how the central banker reacts to the situation on the global crisis etc.
2. BRIEF BACKGROUND OF SPONSORS, BOARD OF TRUSTEES AND ASSET MANAGEMENT COMPANY
a) Sponsor HSBC Mutual Fund is sponsored by HSBC Securities and Capital Markets (India) Private Limited (HSCI).
The Sponsor is the Settler of the Mutual Fund Trust. The Sponsor has entrusted a sum of Rs.1,00,000 (Rupees One Lakh only) to the Trustee as the initial contribution towards the corpus of the Mutual Fund.
HSCI offers integrated investment banking services, securities and corporate fi nance & advisory. HSCI is a member of The Bombay Stock Exchange Limited and National Stock Exchange (capital and derivative market segments). HSCI holds 100% of the paid up equity share capital of HSBC Asset Management (India) Private Limited.
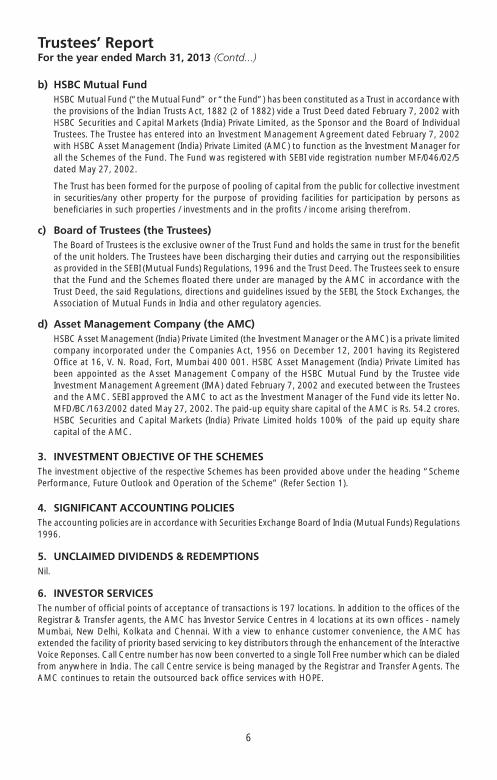
6
HSBC FTP Series
Trustees’ ReportFor the year ended March 31, 2013 (Contd...)
b) HSBC Mutual Fund HSBC Mutual Fund (“the Mutual Fund” or “the Fund”) has been constituted as a Trust in accordance with
the provisions of the Indian Trusts Act, 1882 (2 of 1882) vide a Trust Deed dated February 7, 2002 with HSBC Securities and Capital Markets (India) Private Limited, as the Sponsor and the Board of Individual Trustees. The Trustee has entered into an Investment Management Agreement dated February 7, 2002 with HSBC Asset Management (India) Private Limited (AMC) to function as the Investment Manager for all the Schemes of the Fund. The Fund was registered with SEBI vide registration number MF/046/02/5 dated May 27, 2002.
The Trust has been formed for the purpose of pooling of capital from the public for collective investment in securities/any other property for the purpose of providing facilities for participation by persons as benefi ciaries in such properties / investments and in the profi ts / income arising therefrom.
c) Board of Trustees (the Trustees) The Board of Trustees is the exclusive owner of the Trust Fund and holds the same in trust for the benefi t
of the unit holders. The Trustees have been discharging their duties and carrying out the responsibilities as provided in the SEBI (Mutual Funds) Regulations, 1996 and the Trust Deed. The Trustees seek to ensure that the Fund and the Schemes fl oated there under are managed by the AMC in accordance with the Trust Deed, the said Regulations, directions and guidelines issued by the SEBI, the Stock Exchanges, the Association of Mutual Funds in India and other regulatory agencies.
d) Asset Management Company (the AMC) HSBC Asset Management (India) Private Limited (the Investment Manager or the AMC) is a private limited
company incorporated under the Companies Act, 1956 on December 12, 2001 having its Registered Offi ce at 16, V. N. Road, Fort, Mumbai 400 001. HSBC Asset Management (India) Private Limited has been appointed as the Asset Management Company of the HSBC Mutual Fund by the Trustee vide Investment Management Agreement (IMA) dated February 7, 2002 and executed between the Trustees and the AMC. SEBI approved the AMC to act as the Investment Manager of the Fund vide its letter No. MFD/BC/163/2002 dated May 27, 2002. The paid-up equity share capital of the AMC is Rs. 54.2 crores. HSBC Securities and Capital Markets (India) Private Limited holds 100% of the paid up equity share capital of the AMC.
3. INVESTMENT OBJECTIVE OF THE SCHEMESThe investment objective of the respective Schemes has been provided above under the heading “Scheme Performance, Future Outlook and Operation of the Scheme” (Refer Section 1).
4. SIGNIFICANT ACCOUNTING POLICIESThe accounting policies are in accordance with Securities Exchange Board of India (Mutual Funds) Regulations 1996.
5. UNCLAIMED DIVIDENDS & REDEMPTIONSNil.
6. INVESTOR SERVICESThe number of offi cial points of acceptance of transactions is 197 locations. In addition to the offi ces of the Registrar & Transfer agents, the AMC has Investor Service Centres in 4 locations at its own offi ces - namely Mumbai, New Delhi, Kolkata and Chennai. With a view to enhance customer convenience, the AMC has extended the facility of priority based servicing to key distributors through the enhancement of the Interactive Voice Reponses. Call Centre number has now been converted to a single Toll Free number which can be dialed from anywhere in India. The call Centre service is being managed by the Registrar and Transfer Agents. The AMC continues to retain the outsourced back offi ce services with HOPE.

7
HSBC FTP Series
Trustees’ ReportFor the year ended March 31, 2013 (Contd...)
On the distribution front, the number of empanelled distributors was 2471 as on 31 March 2013. During the year, the AMC initiated tie-ups for online distribution of the Mutual Fund’s Schemes with several channel partners taking the total number of such tie-ups to 45.
7. DETAILS OF INVESTOR GRIEVANCE REDRESSALThe details of the redressal of investor complaints received against HSBC Mutual Fund during April 2012- March 2013 are as follows:
Total Number of Folios: 261694
Com-plaintCode
Type of complaint#
(a) No. ofcomplaintspendingat the
beginningof theyear
(b) No. of com-plaints
receivedduring
theyear#
Action on (a) and (b)
Resolved Non Actiona-
ble
Pending
Within 30
days
30 - 60 days
60 - 180 days
Beyond 180 days
0 - 3 months
3 - 6 months
6 - 9 months
9 - 12 months
I A Non receipt of Dividend on Units
0 3 3 0 0 0 0 0 0 0 0
I B Interest on delayed payment of Dividend
0 0 0 0 0 0 0 0 0 0 0
I C Non receipt of Redemption Proceeds
2 40 22 18 2 0 0 0 0 0 0
I D Interest on delayed payment of Redemption
0 2 1 1 0 0 0 0 0 0 0
II A Non receipt of Statement of Account/Unit Certifi cate
0 9 9 0 0 0 0 0 0 0 0
II B Discrepancy in Statement of Account
0 6 5 0 0 0 0 1 0 0 0
II C Data corrections in Investor details
0 277 277 0 0 0 0 0 0 0 0
II D Non receipt of Annual Report/Abridged Summary
0 0 0 0 0 0 0 0 0 0 0
III A Wrong switch between Schemes
0 0 0 0 0 0 0 0 0 0 0
III B Unauthorized switch between Schemes
0 0 0 0 0 0 0 0 0 0 0
III C Deviation from Scheme attributes
0 0 0 0 0 0 0 0 0 0 0
III D Wrong or excess charges/load
0 0 0 0 0 0 0 0 0 0 0
III E Non updation of changes viz. address, PAN, bank details, nomination, etc
0 18 18 0 0 0 0 0 0 0 0
IV Others 0 14 12 1 1 0 0 0 0 0 0
Total 2 369 347 20 3 0 0 1 0 0 0
Note:
# including against its authorized persons / distributors / employees etc.
8
HSBC FTP Series
Trustees’ ReportFor the year ended March 31, 2013 (Contd...)
8. STATUTORY DETAILSa) The Sponsors are not responsible or liable for any loss resulting from the operation of the Schemes of
the Fund beyond initial contribution of Rs. 1 lakh for setting up the Fund.
b) The price and redemption value of the units, and income from them, can go up as well as down with fl uctuations in the market value of its underlying investments.
c) Full Annual Report shall be disclosed on the website at www.assetmanagement.hsbc.com/in and shall be available for inspection at the Head Offi ce of the mutual fund. Present and prospective unit holder can obtain copy of the trust deed, the full Annual Report of the Scheme(s), the Annual Report of HSBC Asset Management (India) Private Limited and the text of the relevant Scheme(s) at a price.
9. ACKNOWLEDGEMENTSThe Trustees wish to thank the Unit holders of the Schemes for their support throughout the year and also thank the Government of India, the Securities and Exchange Board of India (SEBI), the Reserve Bank of India (RBI) and the Association of Mutual Funds in India (AMFI) for the guidance provided by them. The Trustees also appreciate the service provided by the Registrar and Transfer Agent, Fund Accountant, Custodian, Bankers, Distributors and Brokers. The guidance and services provided by the Auditors and advocates and the ebullience, sincerity and dedication of the employees of HSBC Asset Management (India) Private Limited is also appreciated.
The Trustees look forward to the continued support of everyone.
For and on behalf of the Board of Trustees of HSBC Mutual Fund
Sd/-
Dilip J. Thakkar
Trustee
MUMBAIJuly 16, 2013.
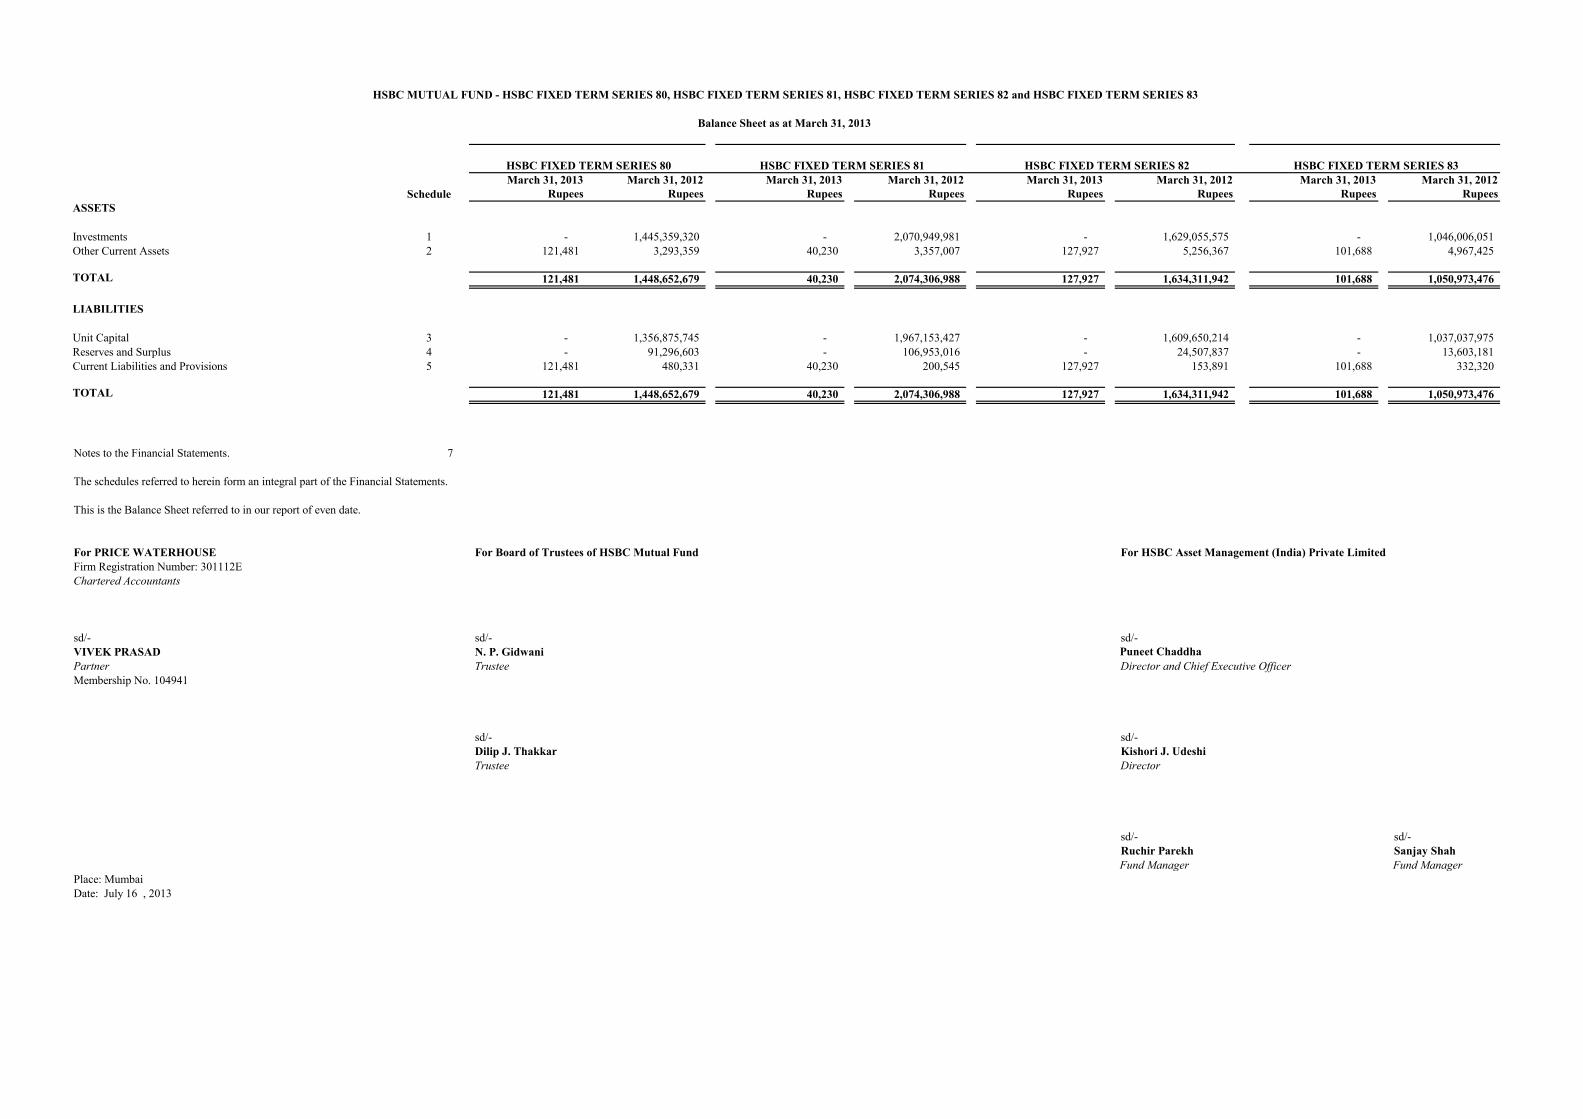
March 31, 2013 March 31, 2012 March 31, 2013 March 31, 2012 March 31, 2013 March 31, 2012 March 31, 2013 March 31, 2012Schedule Rupees Rupees Rupees Rupees Rupees Rupees Rupees Rupees
ASSETS
Investments 1 - 1,445,359,320 - 2,070,949,981 - 1,629,055,575 - 1,046,006,051 Other Current Assets 2 121,481 3,293,359 40,230 3,357,007 127,927 5,256,367 101,688 4,967,425
TOTAL 121,481 1,448,652,679 40,230 2,074,306,988 127,927 1,634,311,942 101,688 1,050,973,476
LIABILITIES
Unit Capital 3 - 1,356,875,745 - 1,967,153,427 - 1,609,650,214 - 1,037,037,975 Reserves and Surplus 4 - 91,296,603 - 106,953,016 - 24,507,837 - 13,603,181 Current Liabilities and Provisions 5 121,481 480,331 40,230 200,545 127,927 153,891 101,688 332,320
TOTAL 121,481 1,448,652,679 40,230 2,074,306,988 127,927 1,634,311,942 101,688 1,050,973,476
0 2,074,106,443
Notes to the Financial Statements. 7
The schedules referred to herein form an integral part of the Financial Statements.
This is the Balance Sheet referred to in our report of even date.
For PRICE WATERHOUSE For Board of Trustees of HSBC Mutual Fund For HSBC Asset Management (India) Private LimitedFirm Registration Number: 301112EChartered Accountants
sd/- sd/- sd/-VIVEK PRASAD N. P. Gidwani Puneet Chaddha Partner Trustee Director and Chief Executive OfficerMembership No. 104941
sd/- sd/-Dilip J. Thakkar Kishori J. UdeshiTrustee Director
sd/- sd/-Ruchir Parekh Sanjay Shah
Fund Manager Fund Manager Place: MumbaiDate: July 16 , 2013
HSBC MUTUAL FUND - HSBC FIXED TERM SERIES 80, HSBC FIXED TERM SERIES 81, HSBC FIXED TERM SERIES 82 and HSBC FIXED TERM SERIES 83
Balance Sheet as at March 31, 2013
HSBC FIXED TERM SERIES 83 HSBC FIXED TERM SERIES 82 HSBC FIXED TERM SERIES 80 HSBC FIXED TERM SERIES 81
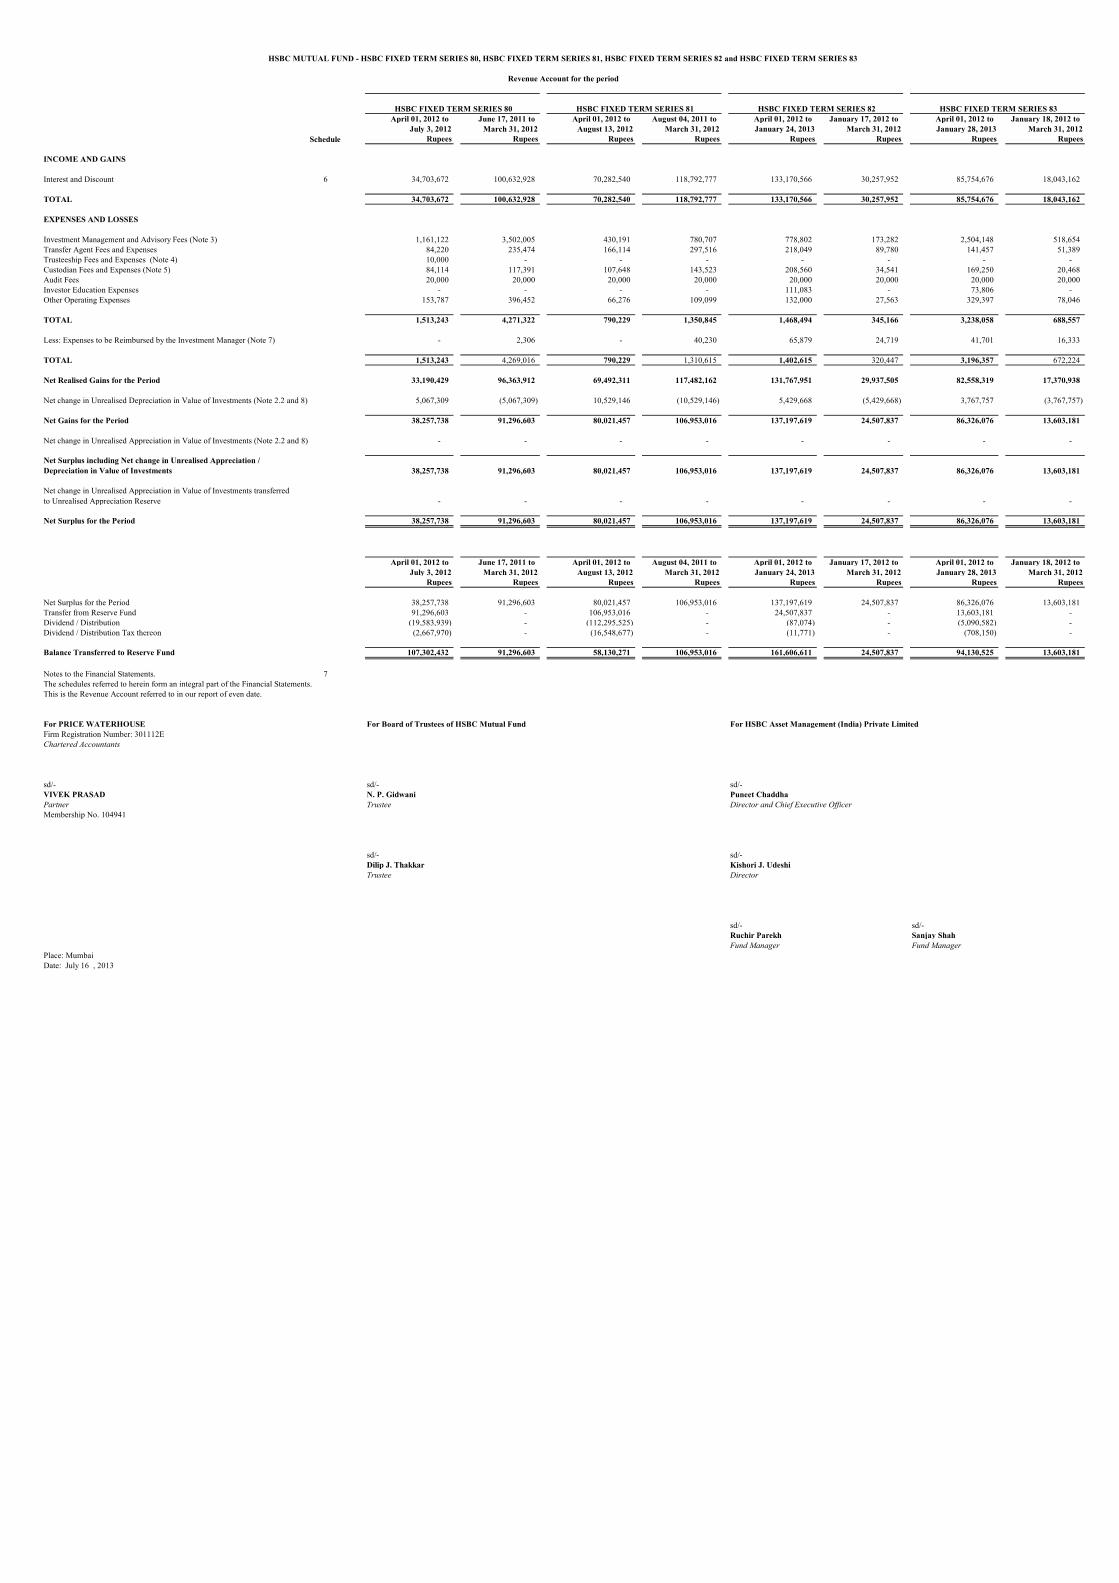
H73451 H81350 H82248 H82249
April 01, 2012 to June 17, 2011 to April 01, 2012 to August 04, 2011 to April 01, 2012 to January 17, 2012 to April 01, 2012 to January 18, 2012 toJuly 3, 2012 March 31, 2012 August 13, 2012 March 31, 2012 January 24, 2013 March 31, 2012 January 28, 2013 March 31, 2012
Schedule Rupees Rupees Rupees Rupees Rupees Rupees Rupees Rupees
INCOME AND GAINS
Interest and Discount 6 34,703,672 100,632,928 70,282,540 118,792,777 133,170,566 30,257,952 85,754,676 18,043,162
TOTAL 34,703,672 100,632,928 70,282,540 118,792,777 133,170,566 30,257,952 85,754,676 18,043,162
EXPENSES AND LOSSES
Investment Management and Advisory Fees (Note 3) 1,161,122 3,502,005 430,191 780,707 778,802 173,282 2,504,148 518,654 Transfer Agent Fees and Expenses 84,220 235,474 166,114 297,516 218,049 89,780 141,457 51,389 Trusteeship Fees and Expenses (Note 4) 10,000 - - - - - - - Custodian Fees and Expenses (Note 5) 84,114 117,391 107,648 143,523 208,560 34,541 169,250 20,468 Audit Fees 20,000 20,000 20,000 20,000 20,000 20,000 20,000 20,000 Investor Education Expenses - - - - 111,083 - 73,806 - Other Operating Expenses 153,787 396,452 66,276 109,099 132,000 27,563 329,397 78,046
TOTAL 1,513,243 4,271,322 790,229 1,350,845 1,468,494 345,166 3,238,058 688,557
Less: Expenses to be Reimbursed by the Investment Manager (Note 7) - 2,306 - 40,230 65,879 24,719 41,701 16,333
TOTAL 1,513,243 4,269,016 790,229 1,310,615 1,402,615 320,447 3,196,357 672,224
Net Realised Gains for the Period 33,190,429 96,363,912 69,492,311 117,482,162 131,767,951 29,937,505 82,558,319 17,370,938
Net change in Unrealised Depreciation in Value of Investments (Note 2.2 and 8) 5,067,309 (5,067,309) 10,529,146 (10,529,146) 5,429,668 (5,429,668) 3,767,757 (3,767,757)
Net Gains for the Period 38,257,738 91,296,603 80,021,457 106,953,016 137,197,619 24,507,837 86,326,076 13,603,181
Net change in Unrealised Appreciation in Value of Investments (Note 2.2 and 8) - - - - - - - -
Net Surplus including Net change in Unrealised Appreciation / Depreciation in Value of Investments 38,257,738 91,296,603 80,021,457 106,953,016 137,197,619 24,507,837 86,326,076 13,603,181
Net change in Unrealised Appreciation in Value of Investments transferred to Unrealised Appreciation Reserve - - - - - - - -
Net Surplus for the Period 38,257,738 91,296,603 80,021,457 106,953,016 137,197,619 24,507,837 86,326,076 13,603,181
April 01, 2012 to June 17, 2011 to April 01, 2012 to August 04, 2011 to April 01, 2012 to January 17, 2012 to April 01, 2012 to January 18, 2012 toJuly 3, 2012 March 31, 2012 August 13, 2012 March 31, 2012 January 24, 2013 March 31, 2012 January 28, 2013 March 31, 2012
Rupees Rupees Rupees Rupees Rupees Rupees Rupees Rupees
Net Surplus for the Period 38,257,738 91,296,603 80,021,457 106,953,016 137,197,619 24,507,837 86,326,076 13,603,181 Transfer from Reserve Fund 91,296,603 - 106,953,016 - 24,507,837 - 13,603,181 - Dividend / Distribution (19,583,939) - (112,295,525) - (87,074) - (5,090,582) - Dividend / Distribution Tax thereon (2,667,970) - (16,548,677) - (11,771) - (708,150) -
Balance Transferred to Reserve Fund 107,302,432 91,296,603 58,130,271 106,953,016 161,606,611 24,507,837 94,130,525 13,603,181
Notes to the Financial Statements. 7The schedules referred to herein form an integral part of the Financial Statements.This is the Revenue Account referred to in our report of even date.
For PRICE WATERHOUSE For Board of Trustees of HSBC Mutual Fund For HSBC Asset Management (India) Private LimitedFirm Registration Number: 301112EChartered Accountants
sd/- sd/- sd/-VIVEK PRASAD N. P. Gidwani Puneet ChaddhaPartner Trustee Director and Chief Executive OfficerMembership No. 104941
sd/- sd/-Dilip J. Thakkar Kishori J. UdeshiTrustee Director
sd/- sd/-Ruchir Parekh Sanjay ShahFund Manager Fund Manager
Place: MumbaiDate: July 16 , 2013
HSBC MUTUAL FUND - HSBC FIXED TERM SERIES 80, HSBC FIXED TERM SERIES 81, HSBC FIXED TERM SERIES 82 and HSBC FIXED TERM SERIES 83
Revenue Account for the period
HSBC FIXED TERM SERIES 83 HSBC FIXED TERM SERIES 82 HSBC FIXED TERM SERIES 80 HSBC FIXED TERM SERIES 81

April 01, 2012 to June 17, 2011 to April 01, 2012 to August 04, 2011 to April 01, 2012 to January 17, 2012 to April 01, 2012 to January 18, 2012 toMarch 31, 2013 March 31, 2012 March 31, 2013 March 31, 2012 March 31, 2013 March 31, 2012 March 31, 2013 March 31, 2012
Rupees Rupees Rupees Rupees Rupees Rupees Rupees Rupees
A. Cashflow from Operating ActivitiesNet Realised Gains for the Period 33,190,429 96,363,912 69,492,311 117,482,162 131,767,951 29,937,505 82,558,319 17,370,938
Adjustments for:-(Increase)/Decrease in Investments at cost 1,450,426,629 (1,450,426,629) 2,081,479,127 (2,081,479,127) 1,634,485,243 (1,634,485,243) 1,049,773,808 (1,049,773,808) (Increase)/Decrease in Other Current Assets 8,072 (8,072) 42,347 (42,347) (37,822) (28,058) (22,208) (19,493) Increase/(Decrease) in Current Liabilities (358,850) 480,331 (160,315) 200,545 (25,966) 153,891 (230,633) 332,320
Net cash generated from/(used in) operations (A) 1,483,266,280 (1,353,590,458) 2,150,853,470 (1,963,838,767) 1,766,189,406 (1,604,421,905) 1,132,079,286 (1,032,090,043)
B. Cashflow from Financing Activities(Decrease)/Increase in Unit Capital (1,356,875,745) 1,356,875,745 (1,967,153,427) 1,967,153,427 (1,609,650,214) 1,609,650,214 (1,037,037,975) 1,037,037,975 Increase/(Decrease) in Unit Premium Reserve and Income Equalisation Reserve (107,302,432) - (58,130,271) - (161,606,611) - (94,130,525) -
Dividend Paid During the Period (19,583,939) - (112,295,525) - (87,074) - (5,090,582) - Dividend Tax Paid During the Period (2,667,970) - (16,548,677) - (11,771) - (708,150) -
Net cash generated from/(used in) financing activities (B) (1,486,430,086) 1,356,875,745 (2,154,127,900) 1,967,153,427 (1,771,355,670) 1,609,650,214 (1,136,967,232) 1,037,037,975
Net Increase/(Decrease) in Cash and Cash Equivalents (A+B) (3,163,806) 3,285,287 (3,274,430) 3,314,660 (5,166,264) 5,228,309 (4,887,946) 4,947,932
Cash and Cash Equivalents at the beginning of the period 3,285,287 - 3,314,660 - 5,228,309 - 4,947,932 - Cash and Cash Equivalents at the end of the period 121,481 3,285,287 40,230 3,314,660 62,045 5,228,309 59,986 4,947,932
0 1 (0) (0) 0 (0) (1) 0 Notes : -
March 31, 2013 March 31, 2012 March 31, 2013 March 31, 2012 March 31, 2013 March 31, 2012 March 31, 2013 March 31, 2012 Rupees Rupees Rupees Rupees Rupees Rupees Rupees Rupees
1. Cash and Cash Equivalents include the following :
Balances with Scheduled Banks in Current Account 121,481 32,079 40,230 31,391 62,045 49,483 59,986 46,748 Collateralised Borrowing and Lending Obligation - 3,253,208 - 3,283,269 - 5,178,826 - 4,901,184
121,481 3,285,287 40,230 3,314,660 62,045 5,228,309 59,986 4,947,932
2. The above Cash Flow Statement has been prepared under the "Indirect Method" set out in Accounting Standard - 3 on Cash Flow Statements, issued by The Institute of Chartered Accountants of India.
This is the Cash Flow Statement referred to in our report of even date.
For PRICE WATERHOUSE For Board of Trustees of HSBC Mutual Fund For HSBC Asset Management (India) Private LimitedFirm Registration Number: 301112EChartered Accountants
sd/- sd/- sd/-VIVEK PRASAD N. P. Gidwani Puneet ChaddhaPartner Trustee Director and Chief Executive OfficerMembership No. 104941
sd/- sd/-Dilip J. Thakkar Kishori J. UdeshiTrustee Director
sd/- sd/-Ruchir Parekh Sanjay ShahFund Manager Fund Manager
Place: MumbaiDate: July 16 , 2013
HSBC MUTUAL FUND - HSBC FIXED TERM SERIES 80, HSBC FIXED TERM SERIES 81, HSBC FIXED TERM SERIES 82 and HSBC FIXED TERM SERIES 83
Cash Flow Statement for the year ended March 31, 2013
HSBC FIXED TERM SERIES 80 HSBC FIXED TERM SERIES 81 HSBC FIXED TERM SERIES 82 HSBC FIXED TERM SERIES 83

SCHEDULE 1 Investments Market/Fair Value Cost Market/Fair Value Cost Market/Fair Value Cost Market/Fair Value Cost Market/Fair Value Cost Market/Fair Value Cost Market/Fair Value Cost Market/Fair Value Cost
(Notes 2.2, 2.3, 5A, 8, 9, 10 and 14) Rupees Rupees Rupees Rupees Rupees Rupees Rupees Rupees Rupees Rupees Rupees Rupees Rupees Rupees Rupees Rupees '(Refer to the attached Statement of Portfolio Holding as at March 31, 2013)
Certificate of Deposit - - 1,445,359,320 1,450,426,629 - - 2,070,949,981 2,081,479,127 - - 1,629,055,575 1,634,485,243 - - 1,046,006,051 1,049,773,808
TOTAL - - 1,445,359,320 1,450,426,629 - - 2,070,949,981 2,081,479,127 - - 1,629,055,575 1,634,485,243 - - 1,046,006,051 1,049,773,808
SCHEDULE 2 March 31, 2013 March 31, 2012 March 31, 2013 March 31, 2012 March 31, 2013 April 01, 2012 to March 31, 2013 March 31, 2012 Other Current Assets Rupees Rupees Rupees Rupees Rupees Rupees Rupees Rupees
Balances with Banks in Current Account 121,481 32,079 40,230 31,391 62,048 49,483 59,987 46,748 Collateralised Borrowing and Lending Obligation - 3,253,208 - 3,283,269 - 5,178,826 - 4,901,184 Interest Receivable on : - Collateralised Borrowing and Lending Obligation - 2,097 - 2,117 - 3,339 - 3,160 Receivable from Investment Manager - 5,975 - 40,230 65,879 24,719 41,701 16,333
TOTAL 121,481 3,293,359 40,230 3,357,007 127,927 5,256,367 101,688 4,967,425
HSBC MUTUAL FUND - HSBC FIXED TERM SERIES 80, HSBC FIXED TERM SERIES 81, HSBC FIXED TERM SERIES 82 and HSBC FIXED TERM SERIES 83
March 31, 2013 March 31, 2013March 31, 2012 HSBC FIXED TERM SERIES 80
and the Revenue Account for the periodSchedules forming part of the Balance Sheet as at March 31, 2013
March 31, 2013 March 31, 2013March 31, 2012 HSBC FIXED TERM SERIES 82
March 31, 2012 HSBC FIXED TERM SERIES 81
March 31, 2012 HSBC FIXED TERM SERIES 83
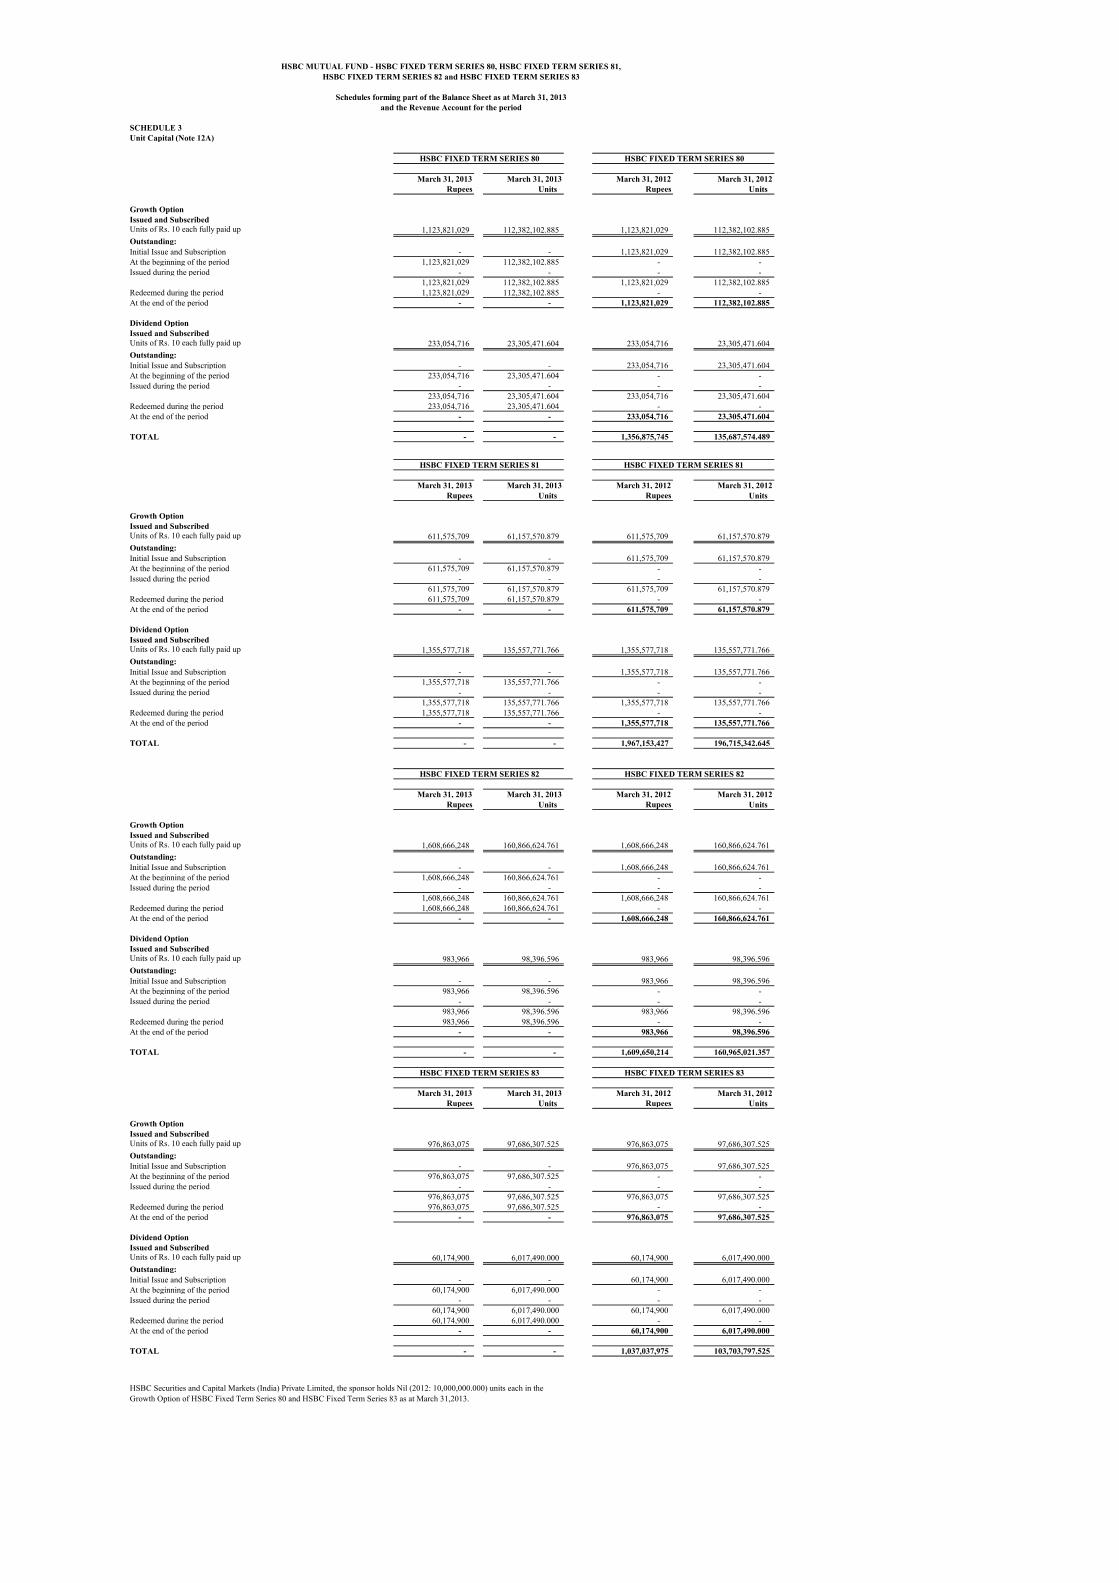
SCHEDULE 3Unit Capital (Note 12A)
March 31, 2013 March 31, 2013 March 31, 2012 March 31, 2012 Rupees Units Rupees Units
Growth OptionIssued and SubscribedUnits of Rs. 10 each fully paid up 1,123,821,029 112,382,102.885 1,123,821,029 112,382,102.885 Outstanding:Initial Issue and Subscription - - 1,123,821,029 112,382,102.885 At the beginning of the period 1,123,821,029 112,382,102.885 - - Issued during the period - - - -
1,123,821,029 112,382,102.885 1,123,821,029 112,382,102.885 Redeemed during the period 1,123,821,029 112,382,102.885 - - At the end of the period - - 1,123,821,029 112,382,102.885
Dividend OptionIssued and SubscribedUnits of Rs. 10 each fully paid up 233,054,716 23,305,471.604 233,054,716 23,305,471.604 Outstanding:Initial Issue and Subscription - - 233,054,716 23,305,471.604 At the beginning of the period 233,054,716 23,305,471.604 - - Issued during the period - - - -
233,054,716 23,305,471.604 233,054,716 23,305,471.604 Redeemed during the period 233,054,716 23,305,471.604 - - At the end of the period - - 233,054,716 23,305,471.604
TOTAL - - 1,356,875,745 135,687,574.489
March 31, 2013 March 31, 2013 March 31, 2012 March 31, 2012 Rupees Units Rupees Units
Growth OptionIssued and SubscribedUnits of Rs. 10 each fully paid up 611,575,709 61,157,570.879 611,575,709 61,157,570.879 Outstanding:Initial Issue and Subscription - - 611,575,709 61,157,570.879 At the beginning of the period 611,575,709 61,157,570.879 - - Issued during the period - - - -
611,575,709 61,157,570.879 611,575,709 61,157,570.879 Redeemed during the period 611,575,709 61,157,570.879 - - At the end of the period - - 611,575,709 61,157,570.879
Dividend OptionIssued and SubscribedUnits of Rs. 10 each fully paid up 1,355,577,718 135,557,771.766 1,355,577,718 135,557,771.766 Outstanding:Initial Issue and Subscription - - 1,355,577,718 135,557,771.766 At the beginning of the period 1,355,577,718 135,557,771.766 - - Issued during the period - - - -
1,355,577,718 135,557,771.766 1,355,577,718 135,557,771.766 Redeemed during the period 1,355,577,718 135,557,771.766 - - At the end of the period - - 1,355,577,718 135,557,771.766
TOTAL - - 1,967,153,427 196,715,342.645
March 31, 2013 March 31, 2013 March 31, 2012 March 31, 2012 Rupees Units Rupees Units
Growth OptionIssued and SubscribedUnits of Rs. 10 each fully paid up 1,608,666,248 160,866,624.761 1,608,666,248 160,866,624.761 Outstanding:Initial Issue and Subscription - - 1,608,666,248 160,866,624.761 At the beginning of the period 1,608,666,248 160,866,624.761 - - Issued during the period - - - -
1,608,666,248 160,866,624.761 1,608,666,248 160,866,624.761 Redeemed during the period 1,608,666,248 160,866,624.761 - - At the end of the period - - 1,608,666,248 160,866,624.761
Dividend OptionIssued and SubscribedUnits of Rs. 10 each fully paid up 983,966 98,396.596 983,966 98,396.596 Outstanding:Initial Issue and Subscription - - 983,966 98,396.596 At the beginning of the period 983,966 98,396.596 - - Issued during the period - - - -
983,966 98,396.596 983,966 98,396.596 Redeemed during the period 983,966 98,396.596 - - At the end of the period - - 983,966 98,396.596
TOTAL - - 1,609,650,214 160,965,021.357
March 31, 2013 March 31, 2013 March 31, 2012 March 31, 2012 Rupees Units Rupees Units
Growth OptionIssued and SubscribedUnits of Rs. 10 each fully paid up 976,863,075 97,686,307.525 976,863,075 97,686,307.525 Outstanding:Initial Issue and Subscription - - 976,863,075 97,686,307.525 At the beginning of the period 976,863,075 97,686,307.525 - - Issued during the period - - - -
976,863,075 97,686,307.525 976,863,075 97,686,307.525 Redeemed during the period 976,863,075 97,686,307.525 - - At the end of the period - - 976,863,075 97,686,307.525
Dividend OptionIssued and SubscribedUnits of Rs. 10 each fully paid up 60,174,900 6,017,490.000 60,174,900 6,017,490.000 Outstanding:Initial Issue and Subscription - - 60,174,900 6,017,490.000 At the beginning of the period 60,174,900 6,017,490.000 - - Issued during the period - - - -
60,174,900 6,017,490.000 60,174,900 6,017,490.000 Redeemed during the period 60,174,900 6,017,490.000 - - At the end of the period - - 60,174,900 6,017,490.000
TOTAL - - 1,037,037,975 103,703,797.525
HSBC FIXED TERM SERIES 80
HSBC FIXED TERM SERIES 81
HSBC FIXED TERM SERIES 82
HSBC FIXED TERM SERIES 83
HSBC MUTUAL FUND - HSBC FIXED TERM SERIES 80, HSBC FIXED TERM SERIES 81, HSBC FIXED TERM SERIES 82 and HSBC FIXED TERM SERIES 83
Schedules forming part of the Balance Sheet as at March 31, 2013and the Revenue Account for the period
HSBC FIXED TERM SERIES 80
HSBC FIXED TERM SERIES 81
HSBC FIXED TERM SERIES 82
HSBC FIXED TERM SERIES 83
HSBC Securities and Capital Markets (India) Private Limited, the sponsor holds Nil (2012: 10,000,000.000) units each in the Growth Option of HSBC Fixed Term Series 80 and HSBC Fixed Term Series 83 as at March 31,2013.
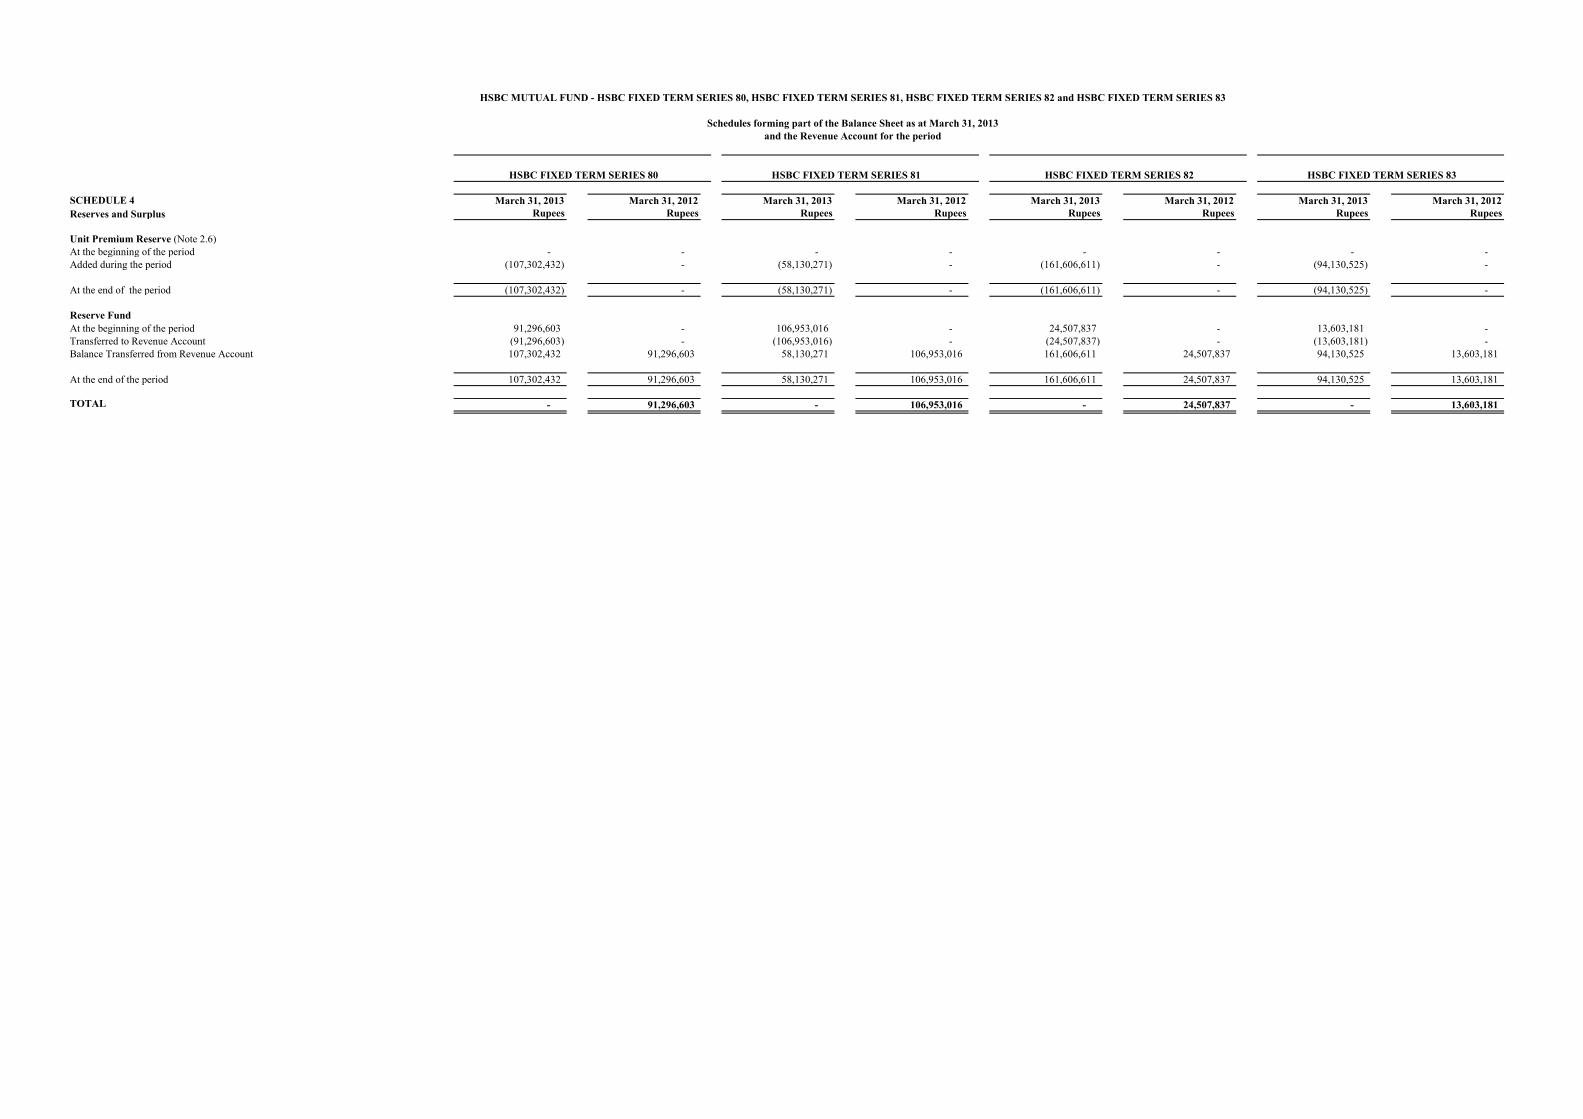
SCHEDULE 4 March 31, 2013 March 31, 2012 March 31, 2013 March 31, 2012 March 31, 2013 March 31, 2012 March 31, 2013 March 31, 2012Reserves and Surplus Rupees Rupees Rupees Rupees Rupees Rupees Rupees Rupees
Unit Premium Reserve (Note 2.6)At the beginning of the period - - - - - - - - Added during the period (107,302,432) - (58,130,271) - (161,606,611) - (94,130,525) -
At the end of the period (107,302,432) - (58,130,271) - (161,606,611) - (94,130,525) -
Reserve FundAt the beginning of the period 91,296,603 - 106,953,016 - 24,507,837 - 13,603,181 - Transferred to Revenue Account (91,296,603) - (106,953,016) - (24,507,837) - (13,603,181) - Balance Transferred from Revenue Account 107,302,432 91,296,603 58,130,271 106,953,016 161,606,611 24,507,837 94,130,525 13,603,181
At the end of the period 107,302,432 91,296,603 58,130,271 106,953,016 161,606,611 24,507,837 94,130,525 13,603,181
TOTAL - * 91,296,603 * - * 106,953,016 * - * 24,507,837 * - * 13,603,181
HSBC MUTUAL FUND - HSBC FIXED TERM SERIES 80, HSBC FIXED TERM SERIES 81, HSBC FIXED TERM SERIES 82 and HSBC FIXED TERM SERIES 83
Schedules forming part of the Balance Sheet as at March 31, 2013and the Revenue Account for the period
HSBC FIXED TERM SERIES 80 HSBC FIXED TERM SERIES 81 HSBC FIXED TERM SERIES 82 HSBC FIXED TERM SERIES 83

SCHEDULE 5 March 31, 2013 March 31, 2012 March 31, 2013 March 31, 2012 March 31, 2013 March 31, 2012 March 31, 2013 March 31, 2012Current Liabilities and Provisions Rupees Rupees Rupees Rupees Rupees Rupees Rupees Rupees
Current Liabilities
Investment Management and Advisory Fees 88,118 357,165 15,805 95,025 - 74,776 - 240,392 Transfer Agent Fees and Expenses - 26,991 - 38,623 - 30,392 - 19,541 Custodian Fees and Expenses - 13,529 - 19,386 - 15,249 - 9,792 Audit Fees 20,000 20,000 20,000 20,000 20,000 20,000 20,000 20,000 Sundry Payables 13,363 62,646 4,425 27,511 107,927 13,474 81,688 42,595
TOTAL 121,481 480,331 40,230 200,545 127,927 153,891 101,688 332,320
SCHEDULE 6 April 01, 2012 to June 17, 2011 to April 01, 2012 to August 04, 2011 to April 01, 2012 to January 17, 2012 to April 01, 2012 to January 18, 2012 toInterest and Discount (Note 2.4) July 3, 2012 March 31, 2012 August 13, 2012 March 31, 2012 January 24, 2013 March 31, 2012 January 28, 2013 March 31, 2012
Rupees Rupees Rupees Rupees Rupees Rupees Rupees Rupees
Commercial Paper / Certificate of Deposit 33,776,560 99,739,919 68,699,273 117,409,477 130,514,757 28,907,908 85,226,191 16,695,864 Treasury Bill 396,155 - - - - - - - Reverse Repos 165,990 335,222 1,198,556 788,906 625,423 83,736 412,563 658,708 Collateralised Borrowing and Lending Obligation 364,967 557,787 384,711 594,394 2,030,386 1,266,308 115,922 688,590
TOTAL 34,703,672 100,632,928 70,282,540 118,792,777 133,170,566 30,257,952 85,754,676 18,043,162
HSBC MUTUAL FUND - HSBC FIXED TERM SERIES 80, HSBC FIXED TERM SERIES 81, HSBC FIXED TERM SERIES 82 and HSBC FIXED TERM SERIES 83
Schedules forming part of the Balance Sheet as at March 31, 2013and the Revenue Account for the period
HSBC FIXED TERM SERIES 80 HSBC FIXED TERM SERIES 81 HSBC FIXED TERM SERIES 82 HSBC FIXED TERM SERIES 83
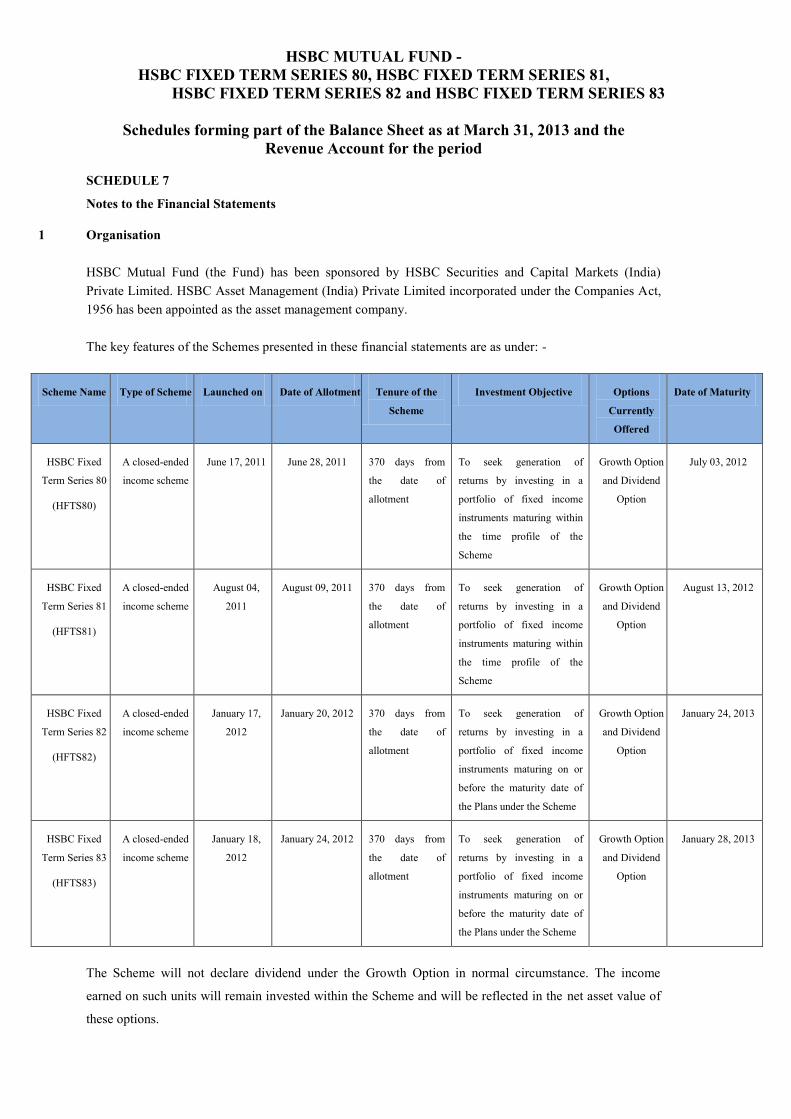
HSBC MUTUAL FUND - HSBC FIXED TERM SERIES 80, HSBC FIXED TERM SERIES 81,
HSBC FIXED TERM SERIES 82 and HSBC FIXED TERM SERIES 83
Schedules forming part of the Balance Sheet as at March 31, 2013 and the Revenue Account for the period
SCHEDULE 7
Notes to the Financial Statements 1 Organisation
HSBC Mutual Fund (the Fund) has been sponsored by HSBC Securities and Capital Markets (India) Private Limited. HSBC Asset Management (India) Private Limited incorporated under the Companies Act, 1956 has been appointed as the asset management company. The key features of the Schemes presented in these financial statements are as under: -
Scheme Name Type of Scheme Launched on Date of Allotment Tenure of the
Scheme
Investment Objective Options
Currently
Offered
Date of Maturity
HSBC Fixed
Term Series 80
(HFTS80)
A closed-ended
income scheme
June 17, 2011 June 28, 2011 370 days from
the date of
allotment
To seek generation of
returns by investing in a
portfolio of fixed income
instruments maturing within
the time profile of the
Scheme
Growth Option
and Dividend
Option
July 03, 2012
HSBC Fixed
Term Series 81
(HFTS81)
A closed-ended
income scheme
August 04,
2011
August 09, 2011 370 days from
the date of
allotment
To seek generation of
returns by investing in a
portfolio of fixed income
instruments maturing within
the time profile of the
Scheme
Growth Option
and Dividend
Option
August 13, 2012
HSBC Fixed
Term Series 82
(HFTS82)
A closed-ended
income scheme
January 17,
2012
January 20, 2012 370 days from
the date of
allotment
To seek generation of
returns by investing in a
portfolio of fixed income
instruments maturing on or
before the maturity date of
the Plans under the Scheme
Growth Option
and Dividend
Option
January 24, 2013
HSBC Fixed
Term Series 83
(HFTS83)
A closed-ended
income scheme
January 18,
2012
January 24, 2012 370 days from
the date of
allotment
To seek generation of
returns by investing in a
portfolio of fixed income
instruments maturing on or
before the maturity date of
the Plans under the Scheme
Growth Option
and Dividend
Option
January 28, 2013
The Scheme will not declare dividend under the Growth Option in normal circumstance. The income
earned on such units will remain invested within the Scheme and will be reflected in the net asset value of
these options.
HSBC MUTUAL FUND - HSBC FIXED TERM SERIES 80, HSBC FIXED TERM SERIES 81,
HSBC FIXED TERM SERIES 82 and HSBC FIXED TERM SERIES 83
Schedules forming part of the Balance Sheet as at March 31, 2013 and the Revenue Account for the period
In respect of the Scheme matured during the year, investments have been liquidated on the maturity date and the unit capital has been liquidated on the business date immediately following the date of maturity. Accordingly, the Balance Sheet as at March 31, 2013 in respect of Scheme matured does not have investments and outstanding unit capital balance and has been prepared after payment of unit proceeds and other liabilities and liquidation of assets.
2 Significant Accounting Policies 2.1 Basis of Accounting
The Schemes maintain their books of account on an accrual basis. These financial statements have been
prepared in accordance with the accounting policies and standards specified in the Ninth Schedule of the
Securities and Exchange Board of India (SEBI) (Mutual Funds) Regulations, 1996 and amendments thereto
(the “Regulations”), as applicable. Presentation of these separate Balance Sheets, Revenue Accounts and
Cash Flow Statements, where applicable, in a columnar form is not intended to indicate that they bear any
relation to each other, or are interdependent or comparable in any way.
2.2 Portfolio Valuation
Investments are stated at market/fair value at the Balance Sheet date/date of determination. In valuing the Schemes investments:
i. For money market securities, debt securities and floating rate securities:
a) All traded money market securities, debt securities and floating rate securities listed on the recognized exchange are valued at the weighted average price at which they are traded on the particular valuation day. b) Non-traded /thinly traded money market securities, debt securities and floating rate securities with residual maturity of upto 91 days are valued on amortization basis. Floating rate securities with floor and caps on coupon rate and residual maturity of upto 91 days are valued on amortization basis taking the coupon rate as floor.
c) Non-traded /thinly traded money market securities, debt securities and floating rate securities with residual maturity of over 91 days are valued at fair value as per procedures determined by HSBC Asset Management (India) Private Limited and approved by the Trustee in accordance with the guidelines for valuation of securities for mutual funds, issued by SEBI from time to time.
For money market securities, debt securities and floating rate securities (with effect from July 06, 2012) a) All traded money market securities and debt securities and floating rate securities are valued at the weighted average traded YTM or weighted average price at which they are traded / reported on public platform on the particular valuation day as per procedures determined by HSBC Asset Management (India) Private Limited and approved by the Trustee in accordance with the guidelines for valuation of securities for mutual funds, issued by SEBI from time to time.

HSBC MUTUAL FUND - HSBC FIXED TERM SERIES 80, HSBC FIXED TERM SERIES 81,
HSBC FIXED TERM SERIES 82 and HSBC FIXED TERM SERIES 83
Schedules forming part of the Balance Sheet as at March 31, 2013 and the Revenue Account for the period
b) Non-traded /thinly traded money market and debt securities and floating rate securities, with residual maturity of up to 91* days are valued on amortization basis. Floating rate securities with floor and caps on coupon rate and residual maturity of up to 91* days are valued on amortization basis taking the coupon rate as floor. Amortized price as per Crisil Bond Valuer (CBV) will be compared with the reference price (as per CBV) to ascertain if the difference is within the band of +/- 10 basis points of the reference price. In case of amortised price falling outside the band, the YTM of the amortised price will be adjusted in order to bring the price within the band. c) Non-traded /thinly traded money market securities, debt securities and floating rate securities with residual maturity of over 91* days are valued at fair value as per procedures determined by HSBC Asset Management (India) Private Limited and approved by the Trustee in accordance with the guidelines for valuation of securities for mutual funds, issued by SEBI from time to time. Thus they are valued at benchmark yield/matrix of spread over risk free benchmark yield obtained from agencies entrusted for the said purpose by AMFI. This may be further adjusted for the illiquidity mark-up / mark-down as permitted under the regulations.
*Pursuant to SEBI circular CIR/IMD/DF/6/2012 dated February 28, 2012, with effect from October 01, 2012, reference to 91 days above was changed to 60 days.
ii. Instruments bought on ‘repo’ basis are valued at the resale price after deduction of applicable interest up to the date of resale. Instruments sold on repo basis are adjusted for the difference between the
repurchase price (after deduction of applicable interest upto the date of repurchase) and the value of the instrument.
iii. Collateralised Borrowing and Lending Obligations (CBLO) are valued at cost plus accrued interest. iv. Treasury Bills are valued at the average of prices obtained from The Credit Rating Information Services
of India Limited (CRISIL) and ICRA Limited in accordance with the guidelines for valuation of securities for mutual funds dated September 18, 2000 and amendments thereto, as applicable, issued by SEBI. If no price is reported at that time, such security is valued at fair value as determined in good faith by HSBC Asset Management (India) Private Limited under procedures approved by the Board of Trustees of HSBC Mutual Fund.
The net unrealised appreciation / depreciation in the value of investments is determined separately for each
category of investments. In respect of each category of investments, the net change in the unrealised
appreciation if any, between two balance sheet dates / valuation dates is accounted through the Revenue
Account and thereafter the net change in unrealised appreciation is transferred from the Revenue Account to the
Unrealised Appreciation Reserve. The net change in unrealised depreciation in the value of investments
between the two balance sheet dates / valuation dates if any, is accounted through the Revenue Account.
Net unrealised appreciation is reduced from the distributable income at the time of income distribution.
2.3 Securities Transaction
Investment securities transactions are accounted for on a trade date basis. The Scheme uses the average cost
method for determining the realized gain or loss on sale of investments. The cost of investments includes
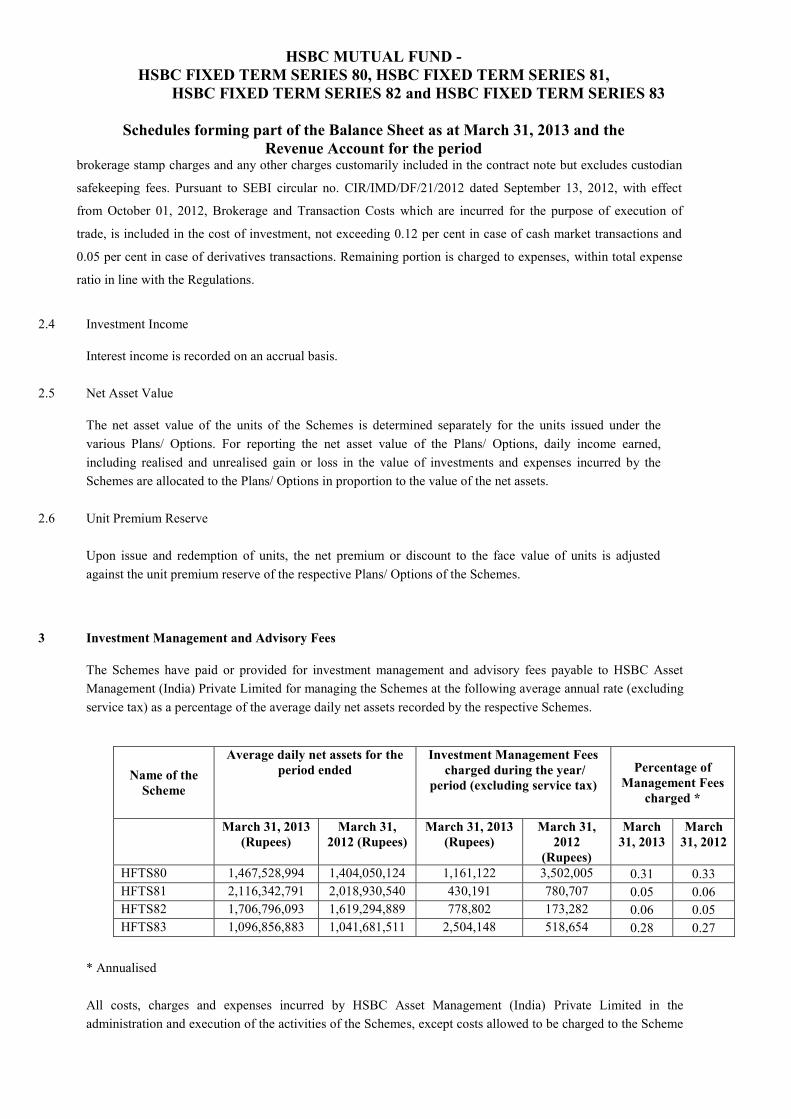
HSBC MUTUAL FUND - HSBC FIXED TERM SERIES 80, HSBC FIXED TERM SERIES 81,
HSBC FIXED TERM SERIES 82 and HSBC FIXED TERM SERIES 83
Schedules forming part of the Balance Sheet as at March 31, 2013 and the Revenue Account for the period
brokerage stamp charges and any other charges customarily included in the contract note but excludes custodian
safekeeping fees. Pursuant to SEBI circular no. CIR/IMD/DF/21/2012 dated September 13, 2012, with effect
from October 01, 2012, Brokerage and Transaction Costs which are incurred for the purpose of execution of
trade, is included in the cost of investment, not exceeding 0.12 per cent in case of cash market transactions and
0.05 per cent in case of derivatives transactions. Remaining portion is charged to expenses, within total expense
ratio in line with the Regulations.
2.4 Investment Income
Interest income is recorded on an accrual basis.
2.5 Net Asset Value
The net asset value of the units of the Schemes is determined separately for the units issued under the various Plans/ Options. For reporting the net asset value of the Plans/ Options, daily income earned, including realised and unrealised gain or loss in the value of investments and expenses incurred by the Schemes are allocated to the Plans/ Options in proportion to the value of the net assets.
2.6 Unit Premium Reserve Upon issue and redemption of units, the net premium or discount to the face value of units is adjusted
against the unit premium reserve of the respective Plans/ Options of the Schemes.
3 Investment Management and Advisory Fees
The Schemes have paid or provided for investment management and advisory fees payable to HSBC Asset Management (India) Private Limited for managing the Schemes at the following average annual rate (excluding service tax) as a percentage of the average daily net assets recorded by the respective Schemes.
* Annualised All costs, charges and expenses incurred by HSBC Asset Management (India) Private Limited in the administration and execution of the activities of the Schemes, except costs allowed to be charged to the Scheme
Name of the Scheme
Average daily net assets for the period ended
Investment Management Fees charged during the year/
period (excluding service tax) Percentage of
Management Fees charged *
March 31, 2013 (Rupees)
March 31, 2012 (Rupees)
March 31, 2013 (Rupees)
March 31, 2012
(Rupees)
March 31, 2013
March 31, 2012
HFTS80 1,467,528,994 1,404,050,124 1,161,122 3,502,005 0.31 0.33 HFTS81 2,116,342,791 2,018,930,540 430,191 780,707 0.05 0.06 HFTS82 1,706,796,093 1,619,294,889 778,802 173,282 0.06 0.05 HFTS83 1,096,856,883 1,041,681,511 2,504,148 518,654 0.28 0.27
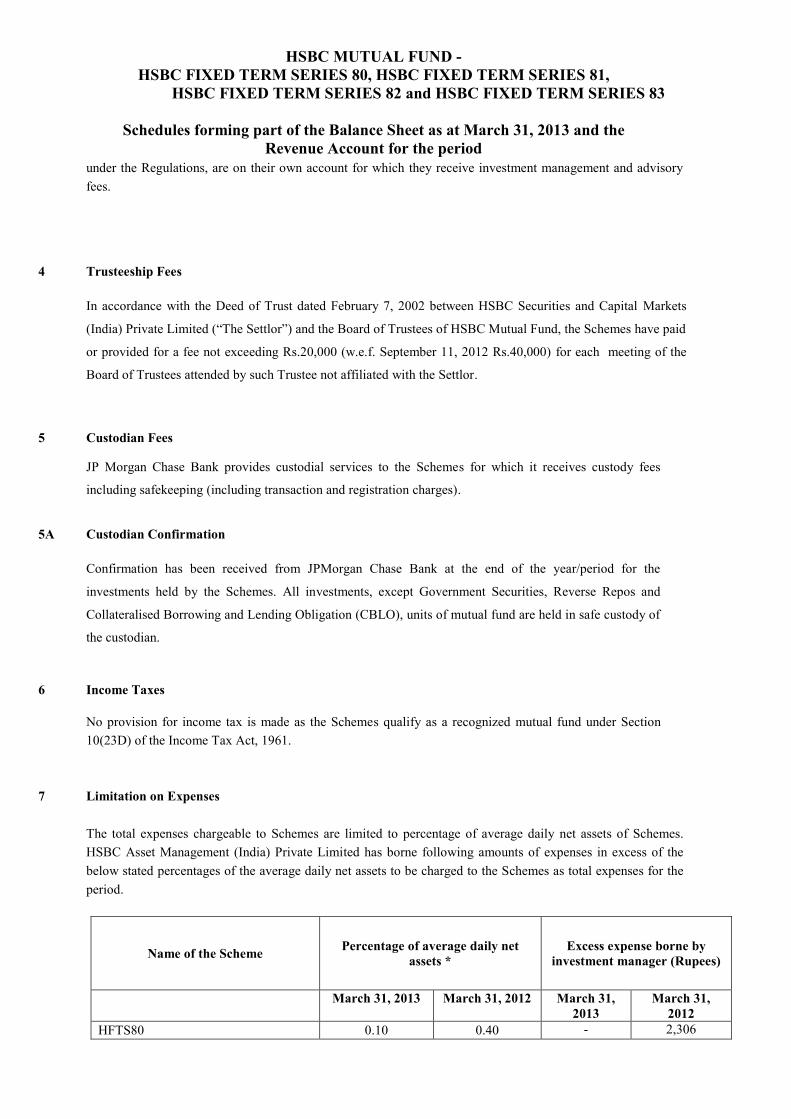
HSBC MUTUAL FUND - HSBC FIXED TERM SERIES 80, HSBC FIXED TERM SERIES 81,
HSBC FIXED TERM SERIES 82 and HSBC FIXED TERM SERIES 83
Schedules forming part of the Balance Sheet as at March 31, 2013 and the Revenue Account for the period
under the Regulations, are on their own account for which they receive investment management and advisory fees.
4 Trusteeship Fees
In accordance with the Deed of Trust dated February 7, 2002 between HSBC Securities and Capital Markets
(India) Private Limited (“The Settlor”) and the Board of Trustees of HSBC Mutual Fund, the Schemes have paid
or provided for a fee not exceeding Rs.20,000 (w.e.f. September 11, 2012 Rs.40,000) for each meeting of the
Board of Trustees attended by such Trustee not affiliated with the Settlor.
5 Custodian Fees
JP Morgan Chase Bank provides custodial services to the Schemes for which it receives custody fees
including safekeeping (including transaction and registration charges).
5A Custodian Confirmation
Confirmation has been received from JPMorgan Chase Bank at the end of the year/period for the
investments held by the Schemes. All investments, except Government Securities, Reverse Repos and
Collateralised Borrowing and Lending Obligation (CBLO), units of mutual fund are held in safe custody of
the custodian. 6 Income Taxes
No provision for income tax is made as the Schemes qualify as a recognized mutual fund under Section 10(23D) of the Income Tax Act, 1961.
7 Limitation on Expenses
The total expenses chargeable to Schemes are limited to percentage of average daily net assets of Schemes. HSBC Asset Management (India) Private Limited has borne following amounts of expenses in excess of the below stated percentages of the average daily net assets to be charged to the Schemes as total expenses for the period.
Name of the Scheme Percentage of average daily net assets *
Excess expense borne by investment manager (Rupees)
March 31, 2013 March 31, 2012 March 31, 2013
March 31, 2012
HFTS80 0.10 0.40 - 2,306
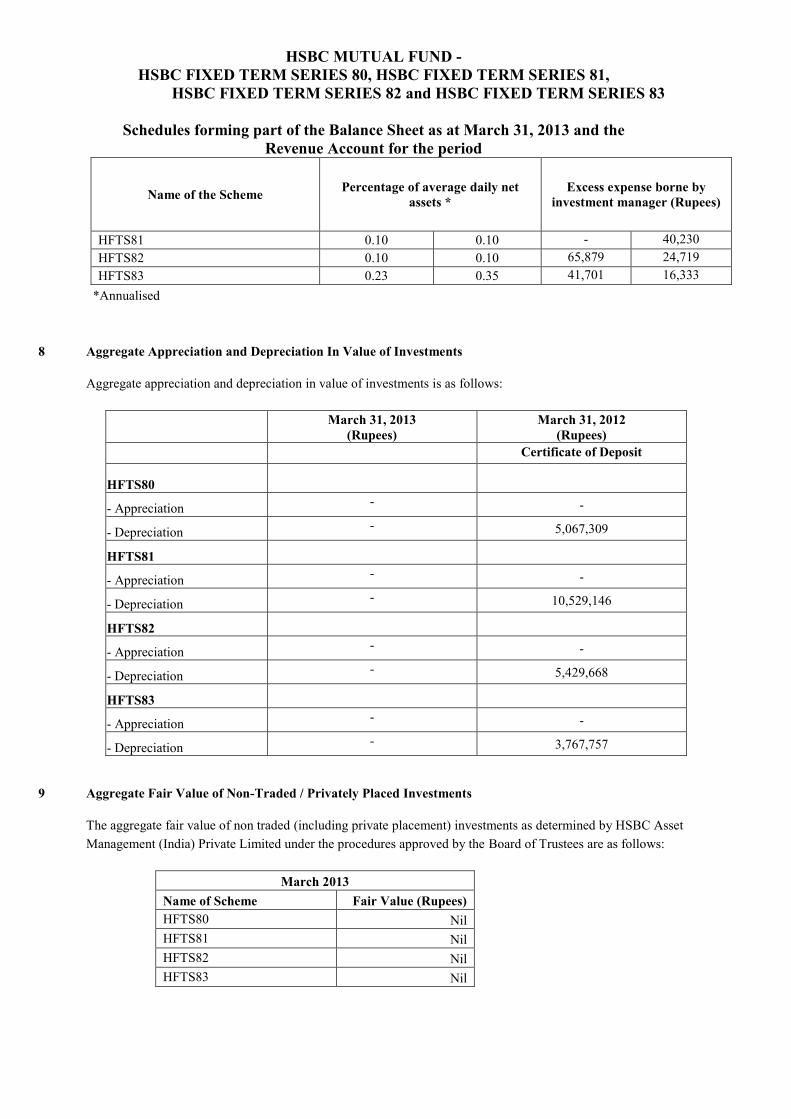
HSBC MUTUAL FUND - HSBC FIXED TERM SERIES 80, HSBC FIXED TERM SERIES 81,
HSBC FIXED TERM SERIES 82 and HSBC FIXED TERM SERIES 83
Schedules forming part of the Balance Sheet as at March 31, 2013 and the Revenue Account for the period
Name of the Scheme Percentage of average daily net assets *
Excess expense borne by investment manager (Rupees)
HFTS81 0.10 0.10 - 40,230 HFTS82 0.10 0.10 65,879 24,719 HFTS83 0.23 0.35 41,701 16,333
*Annualised 8 Aggregate Appreciation and Depreciation In Value of Investments Aggregate appreciation and depreciation in value of investments is as follows:
March 31, 2013
(Rupees) March 31, 2012
(Rupees) Certificate of Deposit
HFTS80
- Appreciation - -
- Depreciation - 5,067,309
HFTS81
- Appreciation - -
- Depreciation - 10,529,146
HFTS82
- Appreciation - -
- Depreciation - 5,429,668
HFTS83
- Appreciation - -
- Depreciation - 3,767,757 9 Aggregate Fair Value of Non-Traded / Privately Placed Investments
The aggregate fair value of non traded (including private placement) investments as determined by HSBC Asset Management (India) Private Limited under the procedures approved by the Board of Trustees are as follows:
March 2013 Name of Scheme Fair Value (Rupees) HFTS80 Nil HFTS81 Nil HFTS82 Nil HFTS83 Nil

HSBC MUTUAL FUND - HSBC FIXED TERM SERIES 80, HSBC FIXED TERM SERIES 81,
HSBC FIXED TERM SERIES 82 and HSBC FIXED TERM SERIES 83
Schedules forming part of the Balance Sheet as at March 31, 2013 and the Revenue Account for the period
March 2012
Name of Scheme Fair Value (Rupees) HFTS80 1,445,359,320 HFTS81 2,070,949,981 HFTS82 1,629,055,575 HFTS83 1,046,006,051
10 Aggregate Value of Purchase and Sale of Investments
The aggregate value of investment securities (excluding CBLO and Reverse Repos) purchased and sold (including matured) during the period (excluding accretion of discount) and their percentage of the respective average daily net assets are as follows:
March 2013 Name of the Scheme Aggregate Purchase Aggregate Sale
Rupees
Percentage of Average Daily
Net Assets Rupees
Percentage of Average Daily
Net Assets HFTS80 2,817,680,961 192.00 4,302,279,500 293.16 HFTS81 3,99,830,285 18.89 2,550,000,000 120.49 HFTS82 Nil 0.00 1,765,000,000 103.41 HFTS83 Nil 0.00 1,135,000,000 68.98
March 2012 Name of the Scheme Aggregate Purchase Aggregate Sale
Rupees
Percentage of Average Daily
Net Assets Rupees
Percentage of Average Daily
Net Assets HFTS80 1,350,689,838 96.20 Nil 0.00 HFTS81 1,964,078,398 97.28 Nil 0.00 HFTS82 1,605,579,231 99.15 Nil 0.00 HFTS83 1,033,082,747 99.17 Nil 0.00
11 Income and Expenses
The total income (net of net loss on sale of investments and net change in unrealized depreciation in the value of investments) and expenditure during the period are as follows:

HSBC MUTUAL FUND - HSBC FIXED TERM SERIES 80, HSBC FIXED TERM SERIES 81,
HSBC FIXED TERM SERIES 82 and HSBC FIXED TERM SERIES 83
Schedules forming part of the Balance Sheet as at March 31, 2013 and the Revenue Account for the period
March 2013 Name of the Scheme Total Income Total Expenses
Rupees Percentage of Average Daily Net Assets *
Rupees Percentage of Average Daily Net Assets *
HFTS80 39,770,981 10.52 1,511,243 0.40 HFTS81 80,811,686 10.32 790,229 0.10 HFTS82 138,600,234 9.91 1,402,615 0.10 HFTS83 89,522,433 9.83 3,196,357 0.35
March 2012 Name of the Scheme Total Income Total Expenses
Rupees Percentage of Average Daily Net Assets *
Rupees Percentage of Average Daily Net Assets *
HFTS80 95,565,619 8.96 4,269,016 0.40 HFTS81 108,263,631 8.32 1,310,615 0.10 HFTS82 24,828,284 7.79 320,447 0.10 HFTS83 14,275,405 7.38 672,224 0.35
* Annualised 12 Initial Contribution
The initial contribution of Rs. 100,000 made by the sponsor, HSBC Securities and Capital Markets (India) Private Limited is recorded in the books of account of HSBC Mutual Fund, the Trust.
12A Movement in Unit Capital The movement in Unit Capital during the period is detailed in Schedule 3.
13 Disclosure Under Regulation 25(8) of the Securities and Exchange Board of India (Mutual Funds)
Regulation, 1996 as amended and in accordance with Accounting Standard 18 on ‘Related Party Disclosures’ issued by the Institute of Chartered Accountants of India (ICAI)
The Scheme has entered into transactions with certain related parties. The information required in this regard in accordance with Accounting Standard 18 on ‘Related Party Disclosures’ issued by the Institute of Chartered Accountants of India and regulation 25(8) of SEBI Regulation, is provided below :
I Related Party Relationships During the Period Name Description of relationship i) HSBC Securities and Capital Markets (India) Private Limited Sponsor of the Fund ii) HSBC Asset Management (India) Private Limited Investment Manager to the Schemes iii) The Hong Kong and Shanghai Banking Corporation Limited Associate of the Investment Manager iv) HSBC Software Development India Private Limited Associate of the Investment Manager v) Multi Commodity Exchange Of India Limited Associate of the Investment Manager vi) HSBC InvestDirect Securities (India) Limited Associate of the Investment Manager
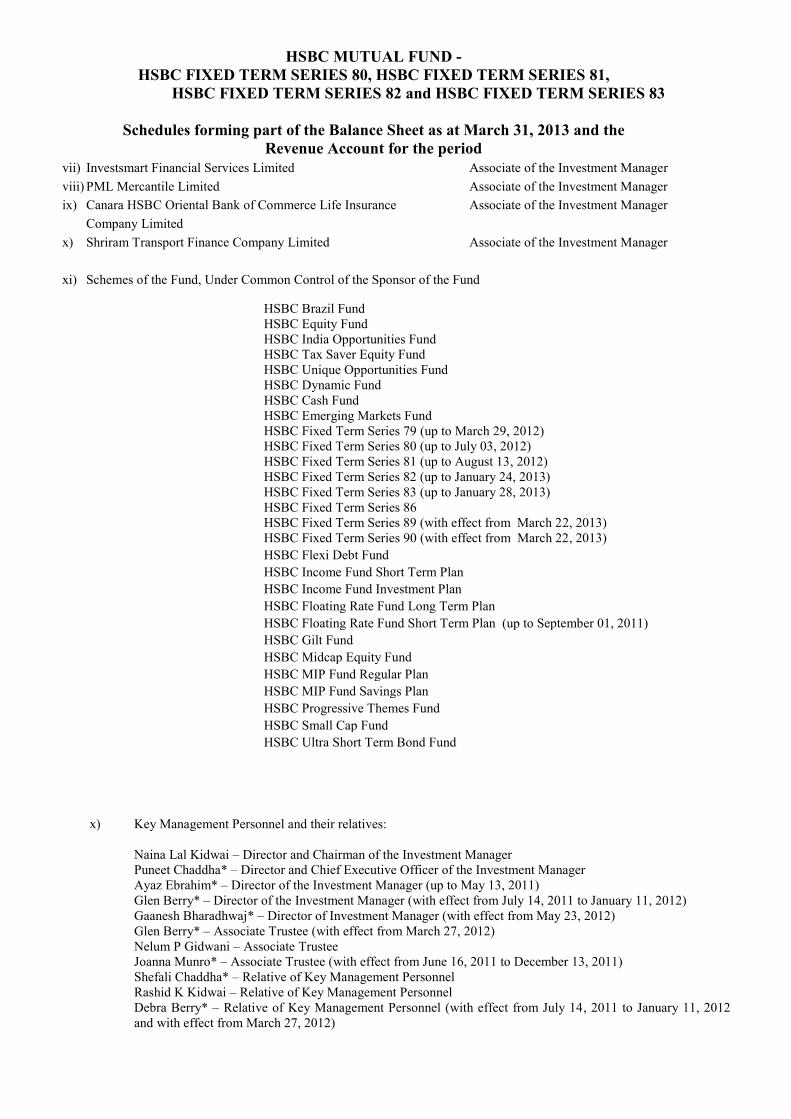
HSBC MUTUAL FUND - HSBC FIXED TERM SERIES 80, HSBC FIXED TERM SERIES 81,
HSBC FIXED TERM SERIES 82 and HSBC FIXED TERM SERIES 83
Schedules forming part of the Balance Sheet as at March 31, 2013 and the Revenue Account for the period
vii) Investsmart Financial Services Limited Associate of the Investment Manager viii) PML Mercantile Limited Associate of the Investment Manager ix) Canara HSBC Oriental Bank of Commerce Life Insurance Associate of the Investment Manager Company Limited x) Shriram Transport Finance Company Limited Associate of the Investment Manager xi) Schemes of the Fund, Under Common Control of the Sponsor of the Fund
HSBC Brazil Fund HSBC Equity Fund HSBC India Opportunities Fund HSBC Tax Saver Equity Fund HSBC Unique Opportunities Fund HSBC Dynamic Fund HSBC Cash Fund HSBC Emerging Markets Fund HSBC Fixed Term Series 79 (up to March 29, 2012) HSBC Fixed Term Series 80 (up to July 03, 2012) HSBC Fixed Term Series 81 (up to August 13, 2012) HSBC Fixed Term Series 82 (up to January 24, 2013) HSBC Fixed Term Series 83 (up to January 28, 2013) HSBC Fixed Term Series 86 HSBC Fixed Term Series 89 (with effect from March 22, 2013) HSBC Fixed Term Series 90 (with effect from March 22, 2013) HSBC Flexi Debt Fund HSBC Income Fund Short Term Plan HSBC Income Fund Investment Plan HSBC Floating Rate Fund Long Term Plan HSBC Floating Rate Fund Short Term Plan (up to September 01, 2011) HSBC Gilt Fund HSBC Midcap Equity Fund HSBC MIP Fund Regular Plan HSBC MIP Fund Savings Plan HSBC Progressive Themes Fund HSBC Small Cap Fund HSBC Ultra Short Term Bond Fund
x) Key Management Personnel and their relatives:
Naina Lal Kidwai – Director and Chairman of the Investment Manager Puneet Chaddha* – Director and Chief Executive Officer of the Investment Manager Ayaz Ebrahim* – Director of the Investment Manager (up to May 13, 2011) Glen Berry* – Director of the Investment Manager (with effect from July 14, 2011 to January 11, 2012) Gaanesh Bharadhwaj* – Director of Investment Manager (with effect from May 23, 2012) Glen Berry* – Associate Trustee (with effect from March 27, 2012) Nelum P Gidwani – Associate Trustee Joanna Munro* – Associate Trustee (with effect from June 16, 2011 to December 13, 2011) Shefali Chaddha* – Relative of Key Management Personnel Rashid K Kidwai – Relative of Key Management Personnel Debra Berry* – Relative of Key Management Personnel (with effect from July 14, 2011 to January 11, 2012 and with effect from March 27, 2012)
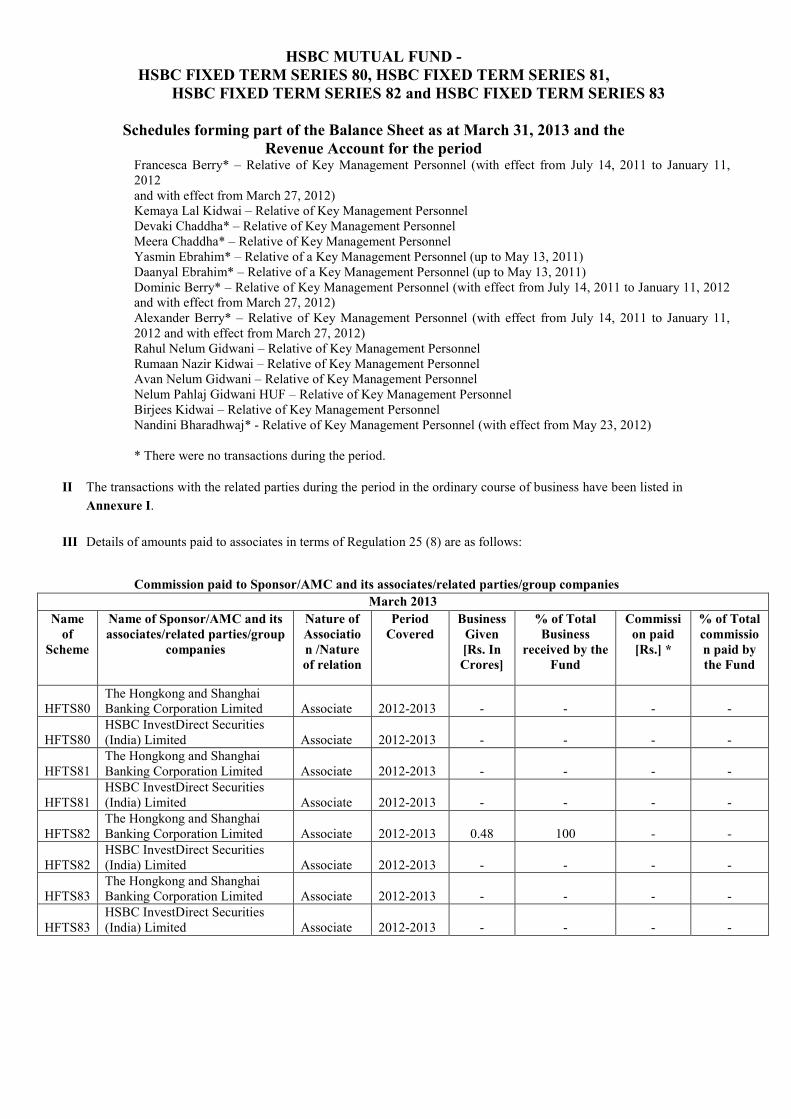
HSBC MUTUAL FUND - HSBC FIXED TERM SERIES 80, HSBC FIXED TERM SERIES 81,
HSBC FIXED TERM SERIES 82 and HSBC FIXED TERM SERIES 83
Schedules forming part of the Balance Sheet as at March 31, 2013 and the Revenue Account for the period
Francesca Berry* – Relative of Key Management Personnel (with effect from July 14, 2011 to January 11, 2012 and with effect from March 27, 2012) Kemaya Lal Kidwai – Relative of Key Management Personnel Devaki Chaddha* – Relative of Key Management Personnel Meera Chaddha* – Relative of Key Management Personnel Yasmin Ebrahim* – Relative of a Key Management Personnel (up to May 13, 2011) Daanyal Ebrahim* – Relative of a Key Management Personnel (up to May 13, 2011) Dominic Berry* – Relative of Key Management Personnel (with effect from July 14, 2011 to January 11, 2012 and with effect from March 27, 2012) Alexander Berry* – Relative of Key Management Personnel (with effect from July 14, 2011 to January 11, 2012 and with effect from March 27, 2012) Rahul Nelum Gidwani – Relative of Key Management Personnel Rumaan Nazir Kidwai – Relative of Key Management Personnel Avan Nelum Gidwani – Relative of Key Management Personnel Nelum Pahlaj Gidwani HUF – Relative of Key Management Personnel Birjees Kidwai – Relative of Key Management Personnel Nandini Bharadhwaj* - Relative of Key Management Personnel (with effect from May 23, 2012) * There were no transactions during the period.
II The transactions with the related parties during the period in the ordinary course of business have been listed in
Annexure I.
III Details of amounts paid to associates in terms of Regulation 25 (8) are as follows:
Commission paid to Sponsor/AMC and its associates/related parties/group companies March 2013
Name of
Scheme
Name of Sponsor/AMC and its associates/related parties/group
companies
Nature of Association /Nature of relation
Period Covered
Business Given [Rs. In Crores]
% of Total Business
received by the Fund
Commission paid [Rs.] *
% of Total commission paid by the Fund
HFTS80 The Hongkong and Shanghai Banking Corporation Limited Associate 2012-2013 - - - -
HFTS80 HSBC InvestDirect Securities (India) Limited Associate 2012-2013 - - - -
HFTS81 The Hongkong and Shanghai Banking Corporation Limited Associate 2012-2013 - - - -
HFTS81 HSBC InvestDirect Securities (India) Limited Associate 2012-2013 - - - -
HFTS82 The Hongkong and Shanghai Banking Corporation Limited Associate 2012-2013 0.48 100 - -
HFTS82 HSBC InvestDirect Securities (India) Limited Associate 2012-2013 - - - -
HFTS83 The Hongkong and Shanghai Banking Corporation Limited Associate 2012-2013 - - - -
HFTS83 HSBC InvestDirect Securities (India) Limited Associate 2012-2013 - - - -
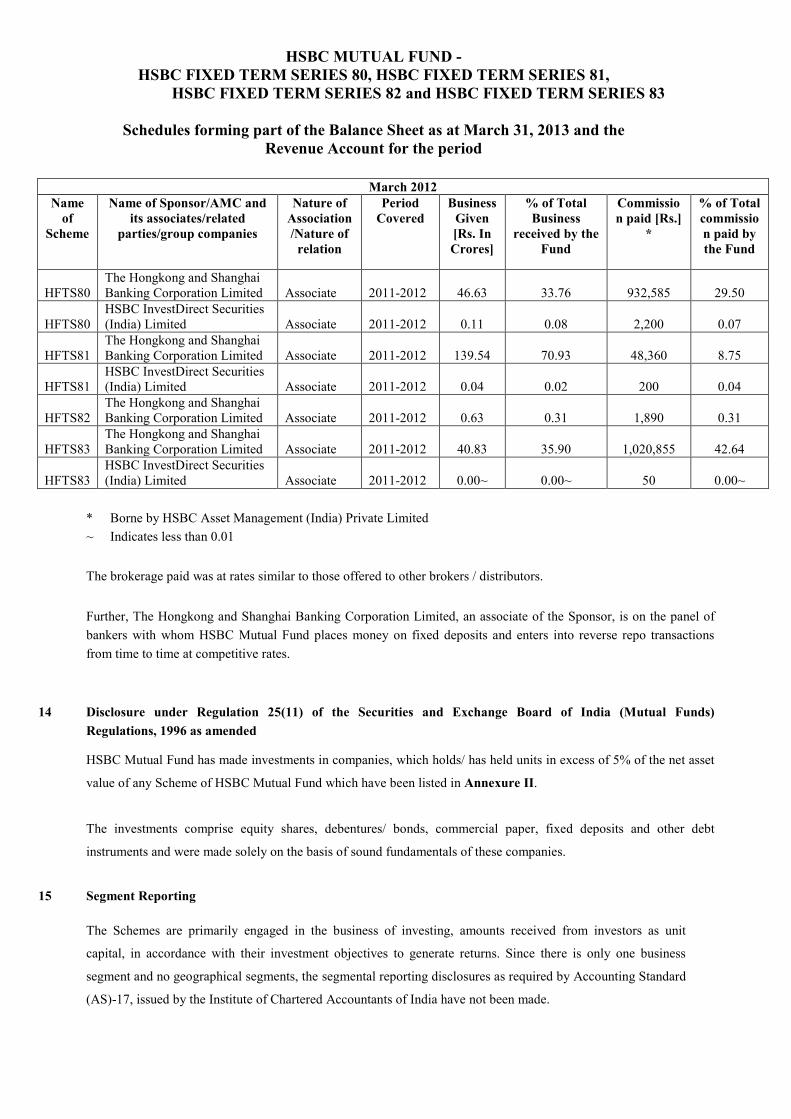
HSBC MUTUAL FUND - HSBC FIXED TERM SERIES 80, HSBC FIXED TERM SERIES 81,
HSBC FIXED TERM SERIES 82 and HSBC FIXED TERM SERIES 83
Schedules forming part of the Balance Sheet as at March 31, 2013 and the Revenue Account for the period
March 2012
Name of
Scheme
Name of Sponsor/AMC and its associates/related
parties/group companies
Nature of Association /Nature of
relation
Period Covered
Business Given [Rs. In Crores]
% of Total Business
received by the Fund
Commission paid [Rs.]
*
% of Total commission paid by the Fund
HFTS80 The Hongkong and Shanghai Banking Corporation Limited Associate 2011-2012 46.63 33.76 932,585 29.50
HFTS80 HSBC InvestDirect Securities (India) Limited Associate 2011-2012 0.11 0.08 2,200 0.07
HFTS81 The Hongkong and Shanghai Banking Corporation Limited Associate 2011-2012 139.54 70.93 48,360 8.75
HFTS81 HSBC InvestDirect Securities (India) Limited Associate 2011-2012 0.04 0.02 200 0.04
HFTS82 The Hongkong and Shanghai Banking Corporation Limited Associate 2011-2012 0.63 0.31 1,890 0.31
HFTS83 The Hongkong and Shanghai Banking Corporation Limited Associate 2011-2012 40.83 35.90 1,020,855 42.64
HFTS83 HSBC InvestDirect Securities (India) Limited Associate 2011-2012 0.00~ 0.00~ 50 0.00~
* Borne by HSBC Asset Management (India) Private Limited ~ Indicates less than 0.01 The brokerage paid was at rates similar to those offered to other brokers / distributors. Further, The Hongkong and Shanghai Banking Corporation Limited, an associate of the Sponsor, is on the panel of bankers with whom HSBC Mutual Fund places money on fixed deposits and enters into reverse repo transactions from time to time at competitive rates.
14 Disclosure under Regulation 25(11) of the Securities and Exchange Board of India (Mutual Funds)
Regulations, 1996 as amended
HSBC Mutual Fund has made investments in companies, which holds/ has held units in excess of 5% of the net asset
value of any Scheme of HSBC Mutual Fund which have been listed in Annexure II.
The investments comprise equity shares, debentures/ bonds, commercial paper, fixed deposits and other debt
instruments and were made solely on the basis of sound fundamentals of these companies.
15 Segment Reporting The Schemes are primarily engaged in the business of investing, amounts received from investors as unit
capital, in accordance with their investment objectives to generate returns. Since there is only one business
segment and no geographical segments, the segmental reporting disclosures as required by Accounting Standard
(AS)-17, issued by the Institute of Chartered Accountants of India have not been made.
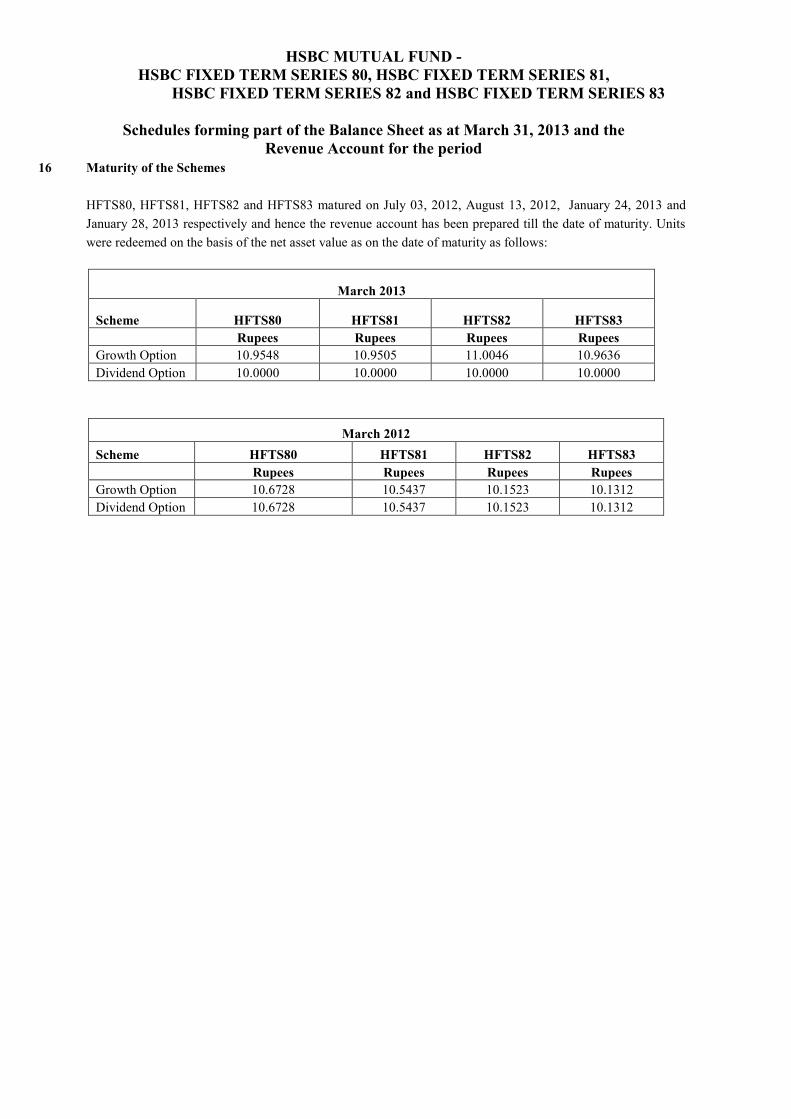
HSBC MUTUAL FUND - HSBC FIXED TERM SERIES 80, HSBC FIXED TERM SERIES 81,
HSBC FIXED TERM SERIES 82 and HSBC FIXED TERM SERIES 83
Schedules forming part of the Balance Sheet as at March 31, 2013 and the Revenue Account for the period
16 Maturity of the Schemes HFTS80, HFTS81, HFTS82 and HFTS83 matured on July 03, 2012, August 13, 2012, January 24, 2013 and
January 28, 2013 respectively and hence the revenue account has been prepared till the date of maturity. Units were redeemed on the basis of the net asset value as on the date of maturity as follows:
March 2013
Scheme HFTS80 HFTS81 HFTS82 HFTS83
Rupees Rupees Rupees Rupees
Growth Option 10.9548 10.9505 11.0046 10.9636 Dividend Option 10.0000 10.0000 10.0000 10.0000
March 2012 Scheme HFTS80 HFTS81 HFTS82 HFTS83
Rupees Rupees Rupees Rupees
Growth Option 10.6728 10.5437 10.1523 10.1312 Dividend Option 10.6728 10.5437 10.1523 10.1312

HSBC MUTUAL FUND - HSBC FIXED TERM SERIES 80, HSBC FIXED TERM SERIES 81,
HSBC FIXED TERM SERIES 82 and HSBC FIXED TERM SERIES 83
Schedules forming part of the Balance Sheet as at March 31, 2013 and the Revenue Account for the period
17 Prior Period Figures
Previous period’s figures have been re-grouped/re-arranged where necessary. Signatures to the Schedules 1 to 7 forming part of the Balance Sheet and the Revenue Account
For PRICE WATERHOUSE Firm Registration Number: 301112E
Chartered Accountants
For Board of Trustees of HSBC Mutual Fund
For HSBC Asset Management (India) Private Limited
sd/- VIVEK PRASAD Partner Membership No. 104941
sd/- N. P. Gidwani Trustee
sd/- Puneet Chaddha
Director and Chief Executive Officer
sd/- Dilip J. Thakkar Trustee
sd/- Kishori J. Udeshi Director
Place: Mumbai Date : July 16, 2013
sd/- Ruchir Parekh Fund Manager sd/- Sanjay Shah Fund Manager
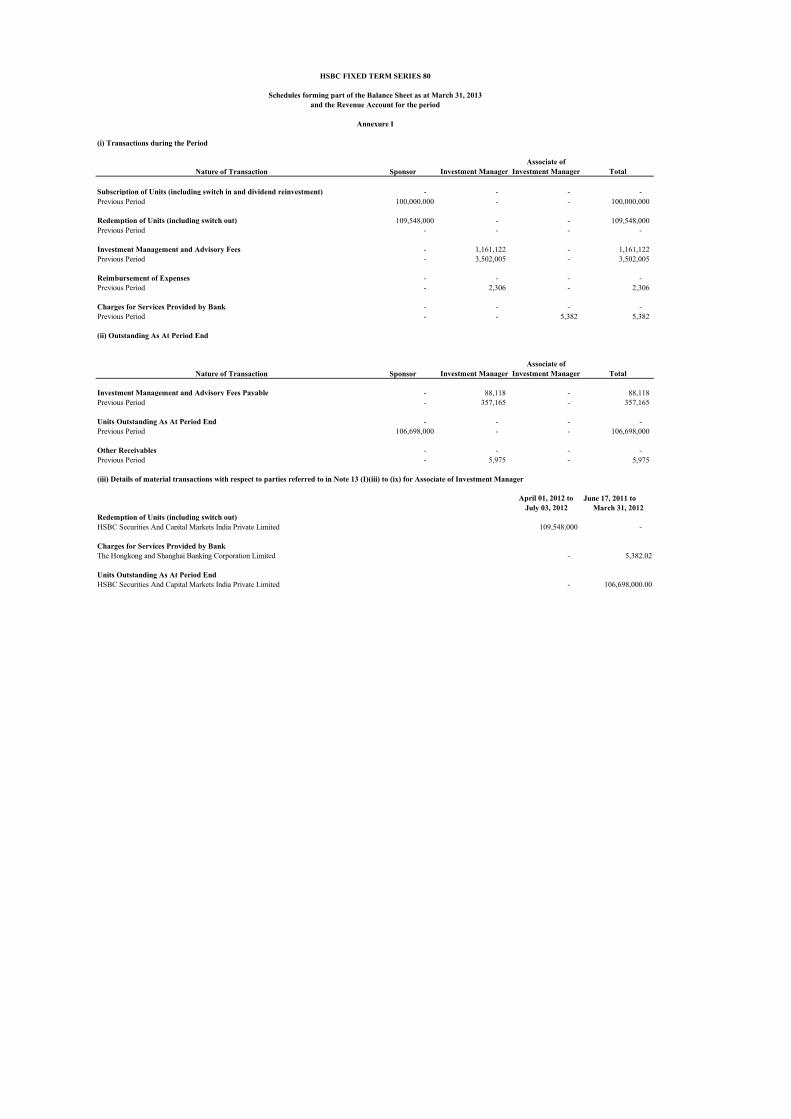
(i) Transactions during the Period
Nature of Transaction Sponsor Investment ManagerAssociate of
Investment Manager Total
Subscription of Units (including switch in and dividend reinvestment) - - - - Previous Period 100,000,000 - - 100,000,000
Redemption of Units (including switch out) 109,548,000 - - 109,548,000 Previous Period - - - -
Investment Management and Advisory Fees - 1,161,122 - 1,161,122 Previous Period - 3,502,005 - 3,502,005
Reimbursement of Expenses - - - - Previous Period - 2,306 - 2,306
Charges for Services Provided by Bank - - - - Previous Period - - 5,382 5,382
(ii) Outstanding As At Period End
Nature of Transaction Sponsor Investment ManagerAssociate of
Investment Manager Total
Investment Management and Advisory Fees Payable - 88,118 - 88,118 Previous Period - 357,165 - 357,165
Units Outstanding As At Period End - - - - Previous Period 106,698,000 - - 106,698,000
Other Receivables - - - - Previous Period - 5,975 - 5,975
(iii) Details of material transactions with respect to parties referred to in Note 13 (I)(iii) to (ix) for Associate of Investment Manager
April 01, 2012 to June 17, 2011 toJuly 03, 2012 March 31, 2012
Redemption of Units (including switch out)HSBC Securities And Capital Markets India Private Limited 109,548,000 -
Charges for Services Provided by BankThe Hongkong and Shanghai Banking Corporation Limited - 5,382.02
Units Outstanding As At Period EndHSBC Securities And Capital Markets India Private Limited - 106,698,000.00
HSBC FIXED TERM SERIES 80
Schedules forming part of the Balance Sheet as at March 31, 2013and the Revenue Account for the period
Annexure I

(i) Transactions during the Period
Nature of Transaction Investment ManagerAssociate of
Investment Manager Total
Subscription of Units (including switch in and dividend reinvestment) - - - Previous Period - 100,000,000 100,000,000
Redemption of Units (including switch out) - 100,000,000 100,000,000 Previous Period - - -
Dividend Distribution (Including dividend reinvested) - 7,176,371 7,176,371 Previous Period - - -
Investment Management and Advisory Fees 430,191 - 430,191 Previous Period 780,707 - 780,707
Reimbursement of Expenses - - - Previous Period 40,230 - 40,230
(ii) Outstanding As At Period End
Nature of Transaction Investment ManagerAssociate of
Investment Manager Total
Investment Management and Advisory Fees Payable 15,805 - 15,805 Previous Period 95,025 - 95,025
Units Outstanding As At Period End - - - Previous Period - 105,408,000 105,408,000
Other Receivables - - - Previous Period 40,230 - 40,230
(iii) Details of material transactions with respect to parties referred to in Note 13 (I)(iii) to (ix) for Associate of Investment Manager
April 01, 2012 to August 04, 2011 toAugust 13, 2012 March 31, 2012
Subscription of Units (including switch in and dividend reinvestment)Multi Commodity Exchange Of India Limited - 100,000,000
Redemption of Units (including switch out)Multi Commodity Exchange Of India Limited 100,000,000 -
Dividend Paid/Payable( Including dividend reinvested)Multi Commodity Exchange Of India Limited 7,176,371 -
Units Outstanding As At Period EndMulti Commodity Exchange Of India Limited - 105,408,000
HSBC FIXED TERM SERIES 81
Schedules forming part of the Balance Sheet as at March 31, 2013and the Revenue Account for the period
Annexure I

(i) Transactions during the Period
Nature of TransactionInvestment Manager
Associate of Investment Manager Total
Subscription of Units (including switch in and dividend reinvestment) - - - Previous Period - 50,000,000 50,000,000
Redemption of Units (including switch out) - 55,023,000 55,023,000 Previous Period - - -
Investment Management and Advisory Fees 778,802 - 778,802 Previous Period 173,282 - 173,282
Reimbursement of Expenses 65,879 - 65,879 Previous Period 24,719 - 24,719
(ii) Outstanding As At Period End
Nature of TransactionInvestment Manager
Associate of Investment Manager Total
Investment Management and Advisory Fees Payable - - - Previous Period 74,776 - 74,776
Units Outstanding As At Period End - - - Previous Period - 50,748,000 50,748,000
Other Receivables 65,879 - 65,879 Previous Period 24,719 - 24,719
(iii) Details of material transactions with respect to parties referred to in Note 13 (I)(iii) to (ix) for Associate of Investment Manager
April 01, 2012 to January 17, 2012 toJanuary 24, 2013 March 31, 2012
Subscription of Units (including switch in and dividend reinvestment)Multi Commodity Exchange Of India Limited - 50,000,000.00
Redemption of Units (including switch out)Multi Commodity Exchange Of India Limited 55,023,000.00 -
Units Outstanding As At Period EndMulti Commodity Exchange Of India Limited - 50,748,000.00
HSBC FIXED TERM SERIES 82
Schedules forming part of the Balance Sheet as at March 31, 2013and the Revenue Account for the period
Annexure I

(i) Transactions during the Period
Nature of Transaction SponsorInvestment Manager
Associate of Investment Manager Total
Subscription of Units (including switch in and dividend reinvestment) - - - - Previous Period 100,000,000 - - 100,000,000
Redemption of Units (including switch out) 109,636,000 - - 109,636,000 Previous Period - - - -
Investment Management and Advisory Fees - 2,504,148 - 2,504,148 Previous Period - 518,654 - 518,654
Reimbursement of Expenses - 41,701 - 41,701 Previous Period - 16,333 - 16,333
(ii) Outstanding As At Period End
Nature of Transaction SponsorInvestment Manager
Associate of Investment Manager Total
Investment Management and Advisory Fees Payable - - - - Previous Period - 240,392 - 240,392
Units Outstanding As At Period End - - - - Previous Period - - 101,286,000 101,286,000
Other Receivables - 41,701 - 41,701 Previous Period - 16,333 - 16,333
(iii) Details of material transactions with respect to parties referred to in Note 13 (I)(iii) to (ix) for Associate of Investment Manager
April 01, 2012 to January 18, 2012 toJanuary 28, 2013 March 31, 2012
Redemption of Units (including switch out)HSBC Securities And Capital Markets India Private Limited 109,636,000 -
HSBC FIXED TERM SERIES 83
Schedules forming part of the Balance Sheet as at March 31, 2013and the Revenue Account for the period
Annexure I

Company Name Schemes invested in by the Company
Investment made by schemes of HSBC Mutual Fund in the
company/subsidiary
Aggregate cost of acquisition during
the year ended March 31, 2013
Outstanding as at March 31, 2013(At Market / Fair
Value)
(Rupees in Lakhs) (Rupees in Lakhs)
Hindalco Industries Limited HFTS81 HDF 309.76 219.84
HIOF 514.67 366.40
HTSF 409.96 -
HUOF 93.18 64.76
Larsen & Toubro Limited HCF HDF 794.22 683.10
HFRF HEF - 1,912.68
HIOF 338.53 618.21
HMIP 365.99 -
HPTF 556.00 -
HTSF 137.77 -
HUOF 149.90 133.20
L&T Finance Limited HCF 9,110.12 -
(Subsidiary of Larsen & Toubro Limited) HFRF 4,231.84 -
HUSBF 9.87 -
Mahindra & Mahindra Limited HCF HTSF 956.77 -
Mahindra & Mahindra Financial Services Limited HCF 7,207.55 2,473.50
(Subsidiary of Mahindra & Mahindra Limited) HFRF 10,164.61 -
HIF 1,973.43 -
HMIP 2,498.35 -
HUSBF 345.73 -
Reliance Industries Limited HIF HDF 483.06 656.97
HFTS90 HEF - 2,705.15
HIOF - 699.47
HUOF - 120.57
Shriram Transport Finance Company Limited HCF HCF 1,483.40 -
HFDF 2,993.62 3,307.96
HIF 3,498.62 7,914.07
HMIP 280.88 3,080.23
Shriram Equipment Finance Company Ltd HCF 988.86 -
(Subsidiary of Shriram Transport Finance Company Limited) HFRF 1,486.31 -
United Bank of India HCF HCF 3,239.95 2,376.57
HFRF 97.33 -
HFTS80 2,498.34 -
HFTS83 1,775.75 -
HIF 3,061.35 2,578.75
HPTF 240.51 189.34
HUSBF 486.66 -
Scheme Name Scheme CodeHSBC Cash Fund HCF
HSBC Dynamic Fund HDF
HSBC Equity Fund HEF
HSBC Flexi Debt Fund HFDF
HSBC Floating Rate Fund - Long Term Plan HFRF
HSBC Fixed Term Series 79 HFTS79
HSBC Fixed Term Series 81 HFTS81
HSBC Fixed Term Series 80 HFTS80
HSBC Fixed Term Series 83 HFTS83
HSBC Income Fund HIF
HSBC India Opportunities Fund HIOF
HSBC Progressive Themes Fund HPTF
HSBC Small Cap Fund HSCF
HSBC Tax Saver Equity Fund HTSF
HSBC Ultra Short Term Bond Fund HUSBF
HSBC Fixed Term Series 90 HFTS90
HSBC MIP Fund HMIP
HSBC Unique Opportunities Fund HUOF
Annexure II
Disclosure under Regulation 25(11) of the Securities and Exchange Board of India (Mutual Funds) Regulations, 1996 as amended Investments made by the schemes of HSBC Mutual Fund in Companies or their subsidiaries that have invested more than 5%
of the net assets of any scheme
The above investments comprise equity shares, debentures / bonds, commercial papers, certificate of deposits, fixed deposits and other debt instruments. These investments have been made on account of their high credit quality and competitive yield for the investment in fixed income/ money market instruments and in case of equity shares because of
attractive valuations of these companies.

April 01, 2012to March 31, 2013
June 17, 2011to March 31, 2012
Rupees Rupees
(a) Net asset value per unit at the end of the period (Note 2.5)Growth Option 10.9548 $ 10.6728 Dividend Option 10.0000 $ 10.6728
(b) Gross Income
(i) income other than profit on sale of investment - 0.7417
(ii) income from profit on inter scheme sales/transfer of investment - -
(iii) income (net) from profit on sale of investments to third party - -
(iv) transfer to revenue account from past year’s reserve - -
Gross income and gains - 0.7417
(c) Aggregate of expenses, writeoff, amortisation and charges - 0.0315
(d) Net income - 0.7102
(e) Net change in unrealised appreciation / (depreciation) in value of investments - (0.0373)
(f) Redemption price
Highest - Growth Option 10.5896 10.5896 - Dividend Option 10.2586 10.2586
Lowest - Growth Option 10.1826 10.1826 - Dividend Option 10.2586 10.2586
(g) Purchase price
Highest - Growth Option 10.5896 10.5896 - Dividend Option 10.2586 10.2586
Lowest - Growth Option 10.0000 10.0000 - Dividend Option 10.0000 10.0000
(h) Price earnings ratio NA NA
(i) Ratio of expenses to average daily net assets by percentage 0.14% 0.40%
(j) Ratio of gross income (including net profit / loss on sale of investments and net change in 3.57% 8.96%unrealised depreciation in value of investments) to average daily net assets by percentage
* The above per unit calculations are based on the number of units in issue at the end of the financial period# Annualised $ Net asset value per unit is as of July 03, 2012
HSBC MUTUAL FUND - HSBC FIXED TERM SERIES 80
HISTORICAL PER UNIT STATISTICS*
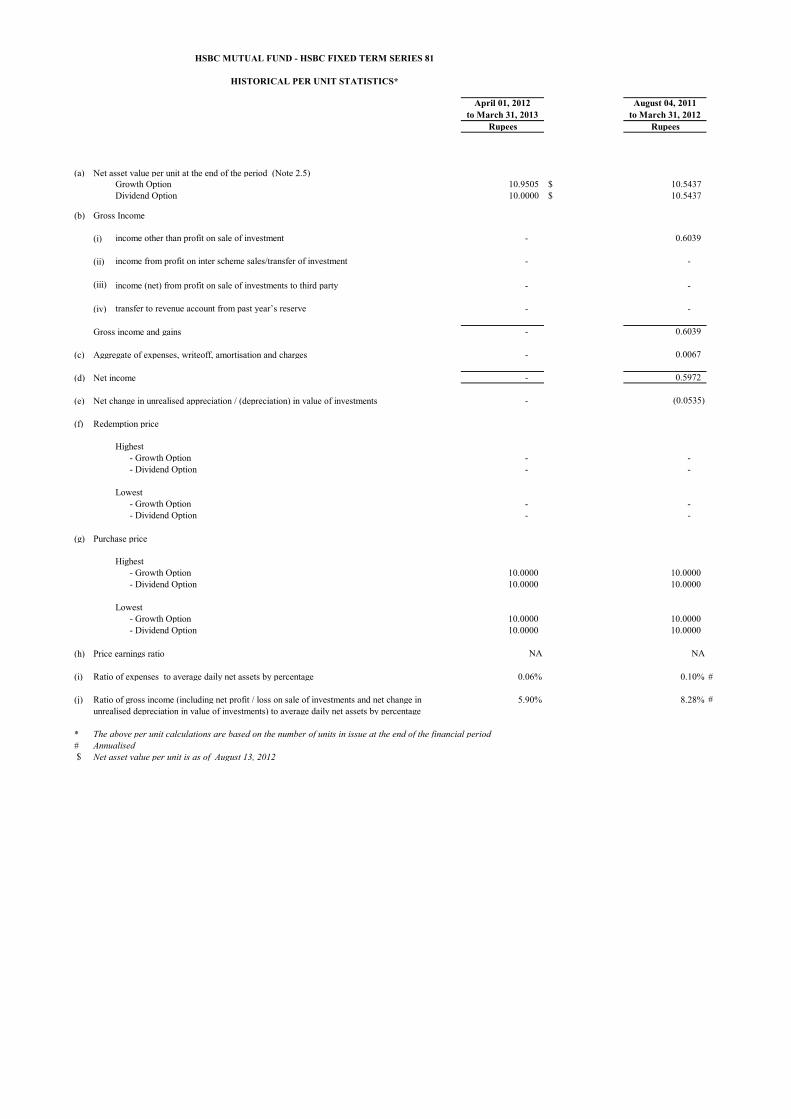
0.00
April 01, 2012to March 31, 2013
August 04, 2011to March 31, 2012
Rupees Rupees
(a) Net asset value per unit at the end of the period (Note 2.5)Growth Option 10.9505 $ 10.5437 Dividend Option 10.0000 $ 10.5437
(b) Gross Income
(i) income other than profit on sale of investment - 0.6039
(ii) income from profit on inter scheme sales/transfer of investment - -
(iii) income (net) from profit on sale of investments to third party - -
(iv) transfer to revenue account from past year’s reserve - -
Gross income and gains - 0.6039
(c) Aggregate of expenses, writeoff, amortisation and charges - 0.0067
(d) Net income - 0.5972
(e) Net change in unrealised appreciation / (depreciation) in value of investments - (0.0535)
(f) Redemption price
Highest - Growth Option - - - Dividend Option - -
Lowest - Growth Option - - - Dividend Option - -
(g) Purchase price
Highest - Growth Option 10.0000 10.0000 - Dividend Option 10.0000 10.0000
Lowest - Growth Option 10.0000 10.0000 - Dividend Option 10.0000 10.0000
(h) Price earnings ratio NA NA
(i) Ratio of expenses to average daily net assets by percentage 0.06% # 80,811,686.15 0.10% ##############
(j) Ratio of gross income (including net profit / loss on sale of investments and net change in 5.90% # 6.18% 8.28% #unrealised depreciation in value of investments) to average daily net assets by percentage
* The above per unit calculations are based on the number of units in issue at the end of the financial period# Annualised $ Net asset value per unit is as of August 13, 2012
HSBC MUTUAL FUND - HSBC FIXED TERM SERIES 81
HISTORICAL PER UNIT STATISTICS*
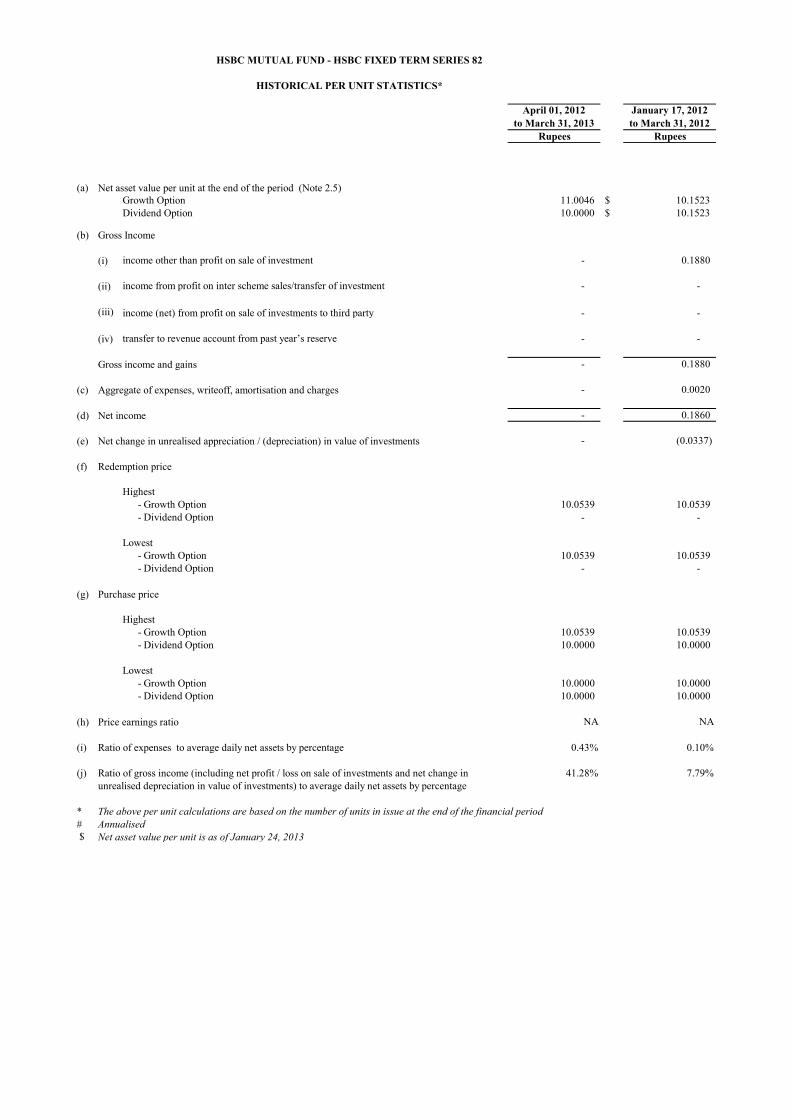
April 01, 2012to March 31, 2013
January 17, 2012to March 31, 2012
Rupees Rupees
(a) Net asset value per unit at the end of the period (Note 2.5)Growth Option 11.0046 $ 10.1523 Dividend Option 10.0000 $ 10.1523
(b) Gross Income
(i) income other than profit on sale of investment - 0.1880
(ii) income from profit on inter scheme sales/transfer of investment - -
(iii) income (net) from profit on sale of investments to third party - -
(iv) transfer to revenue account from past year’s reserve - -
Gross income and gains - 0.1880
(c) Aggregate of expenses, writeoff, amortisation and charges - 0.0020
(d) Net income - 0.1860
(e) Net change in unrealised appreciation / (depreciation) in value of investments - (0.0337)
(f) Redemption price
Highest - Growth Option 10.0539 10.0539 - Dividend Option - -
Lowest - Growth Option 10.0539 10.0539 - Dividend Option - -
(g) Purchase price
Highest - Growth Option 10.0539 10.0539 - Dividend Option 10.0000 10.0000
Lowest - Growth Option 10.0000 10.0000 - Dividend Option 10.0000 10.0000
(h) Price earnings ratio NA NA
(i) Ratio of expenses to average daily net assets by percentage 0.43% # 0.10%
(j) Ratio of gross income (including net profit / loss on sale of investments and net change in 41.28% # 7.79%unrealised depreciation in value of investments) to average daily net assets by percentage
* The above per unit calculations are based on the number of units in issue at the end of the financial period# Annualised $ Net asset value per unit is as of January 24, 2013
HSBC MUTUAL FUND - HSBC FIXED TERM SERIES 82
HISTORICAL PER UNIT STATISTICS*
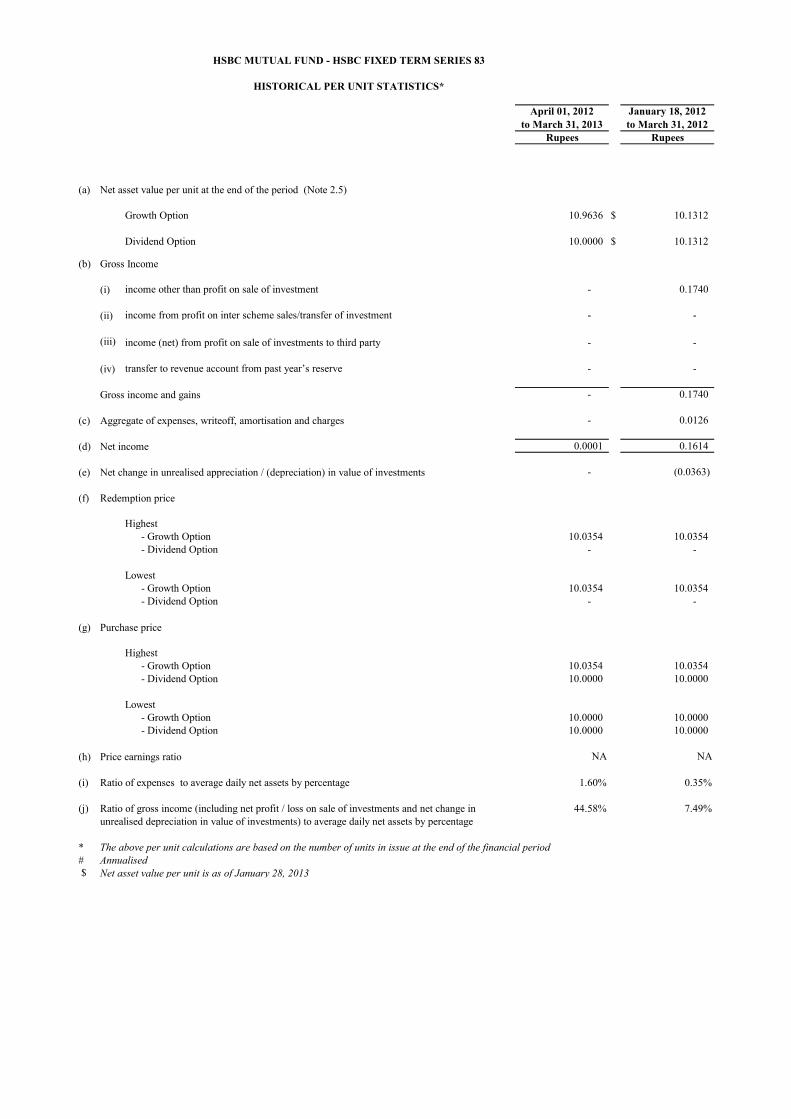
April 01, 2012to March 31, 2013
January 18, 2012to March 31, 2012
Rupees Rupees
(a) Net asset value per unit at the end of the period (Note 2.5)
Growth Option 10.9636 $ 10.1312
Dividend Option 10.0000 $ 10.1312
(b) Gross Income
(i) income other than profit on sale of investment - 0.1740
(ii) income from profit on inter scheme sales/transfer of investment - -
(iii) income (net) from profit on sale of investments to third party - -
(iv) transfer to revenue account from past year’s reserve - -
Gross income and gains - 0.1740
(c) Aggregate of expenses, writeoff, amortisation and charges - 0.0126
(d) Net income 0.0001 0.1614
(e) Net change in unrealised appreciation / (depreciation) in value of investments - (0.0363)
(f) Redemption price
Highest - Growth Option 10.0354 10.0354 - Dividend Option - -
Lowest - Growth Option 10.0354 10.0354 - Dividend Option - -
(g) Purchase price
Highest - Growth Option 10.0354 10.0354 - Dividend Option 10.0000 10.0000
Lowest - Growth Option 10.0000 10.0000 - Dividend Option 10.0000 10.0000
(h) Price earnings ratio NA NA
(i) Ratio of expenses to average daily net assets by percentage 1.60% # 0.35%
(j) Ratio of gross income (including net profit / loss on sale of investments and net change in 44.58% # 7.49%unrealised depreciation in value of investments) to average daily net assets by percentage
* The above per unit calculations are based on the number of units in issue at the end of the financial period# Annualised $ Net asset value per unit is as of January 28, 2013
HSBC MUTUAL FUND - HSBC FIXED TERM SERIES 83
HISTORICAL PER UNIT STATISTICS*

► INDEX HSBC Flexi Debt Fund HSBC Income Fund HSBC Gilt Fund
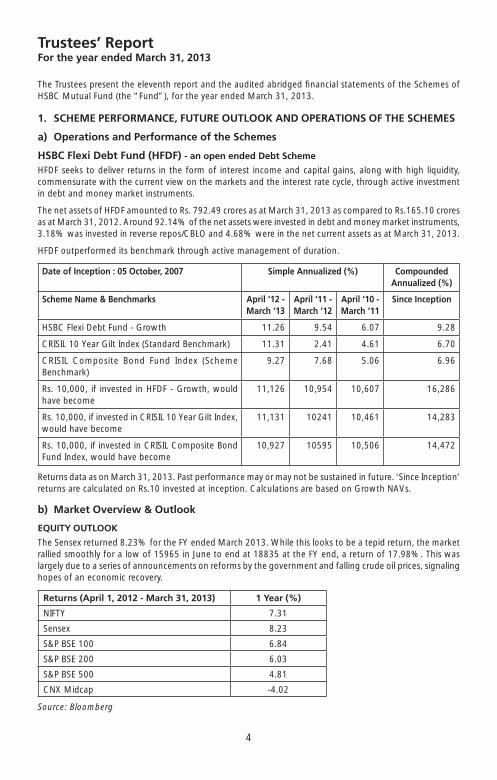
4
HSBC FLEXI DEBT FUND
Trustees’ ReportFor the year ended March 31, 2013
The Trustees present the eleventh report and the audited abridged fi nancial statements of the Schemes of HSBC Mutual Fund (the “Fund”), for the year ended March 31, 2013.
1. SCHEME PERFORMANCE, FUTURE OUTLOOK AND OPERATIONS OF THE SCHEMES
a) Operations and Performance of the Schemes
HSBC Flexi Debt Fund (HFDF) - an open ended Debt Scheme
HFDF seeks to deliver returns in the form of interest income and capital gains, along with high liquidity, commensurate with the current view on the markets and the interest rate cycle, through active investment in debt and money market instruments.
The net assets of HFDF amounted to Rs. 792.49 crores as at March 31, 2013 as compared to Rs.165.10 crores as at March 31, 2012. Around 92.14% of the net assets were invested in debt and money market instruments, 3.18% was invested in reverse repos/CBLO and 4.68% were in the net current assets as at March 31, 2013.
HFDF outperformed its benchmark through active management of duration.
Date of Inception : 05 October, 2007 Simple Annualized (%) Compounded Annualized (%)
Scheme Name & Benchmarks April ‘12 - March ‘13
April ‘11 - March ‘12
April ‘10 - March ‘11
Since Inception
HSBC Flexi Debt Fund - Growth 11.26 9.54 6.07 9.28
CRISIL 10 Year Gilt Index (Standard Benchmark) 11.31 2.41 4.61 6.70
CRISIL Composite Bond Fund Index (Scheme Benchmark)
9.27 7.68 5.06 6.96
Rs. 10,000, if invested in HFDF - Growth, would have become
11,126 10,954 10,607 16,286
Rs. 10,000, if invested in CRISIL 10 Year Gilt Index, would have become
11,131 10241 10,461 14,283
Rs. 10,000, if invested in CRISIL Composite Bond Fund Index, would have become
10,927 10595 10,506 14,472
Returns data as on March 31, 2013. Past performance may or may not be sustained in future. ‘Since Inception’ returns are calculated on Rs.10 invested at inception. Calculations are based on Growth NAVs.
b) Market Overview & Outlook
EQUITY OUTLOOK
The Sensex returned 8.23% for the FY ended March 2013. While this looks to be a tepid return, the market rallied smoothly for a low of 15965 in June to end at 18835 at the FY end, a return of 17.98%. This was largely due to a series of announcements on reforms by the government and falling crude oil prices, signaling hopes of an economic recovery.
Returns (April 1, 2012 - March 31, 2013) 1 Year (%)
NIFTY 7.31
Sensex 8.23
S&P BSE 100 6.84
S&P BSE 200 6.03
S&P BSE 500 4.81
CNX Midcap -4.02
Source: Bloomberg

5
HSBC FLEXI DEBT FUND
Trustees’ ReportFor the year ended March 31, 2013 (Contd...)
Our view in respect of key issues facing equity market currently is highlighted as under, based on which we do expect a likely reversal of the prevailing negative sentiment going forward -
� Macro challenge - expect some relief in current account defi cit given likely lower gold imports and crude oil correction. Solution to fi scal defi cit may however need policy decision to reduce subsidy burden on diesel, kerosene, LPG.
� Commodities infl ation expected to decline on account of China slowdown and lower growth in western world. This may have positive impact margin expansion for corporate sector and on currency (INR) and will give room for reducing interest rates over time. Lower cost of capital should hopefully revive capex spending, though gradually (recovery from 2H12).
� Lower interest rates directionally would be the single most important variable for equity markets to rally. This will be driven by lower commodity infl ation and focus back on reviving growth through monetary policy (recent disappointing GDP/IIP numbers support this view).
� Valuations (for large Sensex companies) are attractive at close to 13x forward earnings and in the lower range of historic multiples. A large number of mid-caps available at a signifi cant discount to large cap peer.
� Structural model for India equity investment remains intact for long term returns. These include favourable demography, high savings rate, rising incomes, growing consumption demand growth, existing low penetration, etc.
DEBT OUTLOOK
Fixed Income market in FY 2013 moved towards lower yields on back of 100 bps rate cut and CRR cuts. RBI front loaded the rate cut in April and then followed it up in January 2013 and March 2013. Towards the second half rates stabilized largely as the core infl ation remained within comfort zone.
In the second half of the year expectation of rate cut and series of open market operations led to rally in rates. Government borrowing was lower than budgeted and the spending was also controlled in second half of the year. Towards the end of the year short end rates tightened substantially due to low deposit growth in banking system.
Corporate yield curve remained inverted with short end rates higher than long end rates for the large part of the year due to liquidity tightness.
Expectation is to see continuation of some easing of the rates stance from RBI in FY 14. However, there is a need to focus on key variables in the economy to judge future directions. These are:
� Liquidity: Liquidity will drive short end rates and eventually drive decisions on open market operations as well as CRR cuts.
� Infl ation: Infl ation numbers will determine future course of action for RBI and remains a critical variable for policy. We expect infl ation to ease in fi rst half of FY 14.
� Growth: GDP growth numbers as well as industrial activity will also determine the decision on policy. Weak GDP numbers may continue for couple of quarters.
� Fiscal defi cit: Fiscal defi cit and government spending will determine the government borrowing and crowding out in interest rate curve.
� Current account defi cit / BoP situation: CAD determines how the pressure on currency works and effective management of forex reserves
� Currency levels: Level of INR will determine how the central banker reacts to the situation on the global crisis etc.

6
HSBC FLEXI DEBT FUND
Trustees’ ReportFor the year ended March 31, 2013 (Contd...)
2. BRIEF BACKGROUND OF SPONSORS, BOARD OF TRUSTEES AND ASSET MANAGEMENT COMPANY
a) Sponsor HSBC Mutual Fund is sponsored by HSBC Securities and Capital Markets (India) Private Limited (HSCI).
The Sponsor is the Settler of the Mutual Fund Trust. The Sponsor has entrusted a sum of Rs.1,00,000 (Rupees One Lakh only) to the Trustee as the initial contribution towards the corpus of the Mutual Fund.
HSCI offers integrated investment banking services, securities and corporate fi nance & advisory. HSCI is a member of The Bombay Stock Exchange Limited and National Stock Exchange (capital and derivative market segments). HSCI holds 100% of the paid up equity share capital of HSBC Asset Management (India) Private Limited.
b) HSBC Mutual Fund HSBC Mutual Fund (“the Mutual Fund” or “the Fund”) has been constituted as a Trust in accordance with
the provisions of the Indian Trusts Act, 1882 (2 of 1882) vide a Trust Deed dated February 7, 2002 with HSBC Securities and Capital Markets (India) Private Limited, as the Sponsor and the Board of Individual Trustees. The Trustee has entered into an Investment Management Agreement dated February 7, 2002 with HSBC Asset Management (India) Private Limited (AMC) to function as the Investment Manager for all the Schemes of the Fund. The Fund was registered with SEBI vide registration number MF/046/02/5 dated May 27, 2002.
The Trust has been formed for the purpose of pooling of capital from the public for collective investment in securities/any other property for the purpose of providing facilities for participation by persons as benefi ciaries in such properties/investments and in the profi ts/income arising therefrom.
c) Board of Trustees (the Trustees) The Board of Trustees is the exclusive owner of the Trust Fund and holds the same in trust for the benefi t
of the unit holders. The Trustees have been discharging their duties and carrying out the responsibilities as provided in the SEBI (Mutual Funds) Regulations, 1996 and the Trust Deed. The Trustees seek to ensure that the Fund and the Schemes fl oated there under are managed by the AMC in accordance with the Trust Deed, the said Regulations, directions and guidelines issued by the SEBI, the Stock Exchanges, the Association of Mutual Funds in India and other regulatory agencies.
d) Asset Management Company (the AMC) HSBC Asset Management (India) Private Limited (the Investment Manager or the AMC) is a private limited
company incorporated under the Companies Act, 1956 on December 12, 2001 having its Registered Offi ce at 16, V. N. Road, Fort, Mumbai 400 001. HSBC Asset Management (India) Private Limited has been appointed as the Asset Management Company of the HSBC Mutual Fund by the Trustee vide Investment Management Agreement (IMA) dated February 7, 2002 and executed between the Trustees and the AMC. SEBI approved the AMC to act as the Investment Manager of the Fund vide its letter No. MFD/BC/163/2002 dated May 27, 2002. The paid-up equity share capital of the AMC is Rs. 54.2 crores. HSBC Securities and Capital Markets (India) Private Limited holds 100% of the paid up equity share capital of the AMC.
3. INVESTMENT OBJECTIVE OF THE SCHEMESThe investment objective of the respective Schemes has been provided above under the heading “Scheme Performance, Future Outlook and Operation of the Scheme” (Refer Section 1).
4. SIGNIFICANT ACCOUNTING POLICIESThe accounting policies are in accordance with Securities Exchange Board of India (Mutual Funds) Regulations 1996.

7
HSBC FLEXI DEBT FUND
Trustees’ ReportFor the year ended March 31, 2013 (Contd...)
5. UNCLAIMED DIVIDENDS & REDEMPTIONSSummary of number of Investors & corresponding amount Scheme-wise as on March 31, 2013
SchemeUnclaimed Dividends Unclaimed Redemptions
Amount (Rs.)
No. of Investors
Amount (Rs.)
No. of Investors
HSBC Flexi Debt Fund 17,383.59 2 – –
6. INVESTOR SERVICESThe number of offi cial points of acceptance of transactions is 197 locations. In addition to the offi ces of the Registrar & Transfer agents, the AMC has Investor Service Centres in 4 locations at its own offi ces - namely Mumbai, New Delhi, Kolkata and Chennai. With a view to enhance customer convenience, the AMC has extended the facility of priority based servicing to key distributors through the enhancement of the Interactive Voice Reponses. Call Centre number has now been converted to a single Toll Free number which can be dialed from anywhere in India. The call Centre service is being managed by the Registrar and Transfer Agents. The AMC continues to retain the outsourced back offi ce services with HOPE.
On the distribution front, the number of empanelled distributors was 2471 as on 31 March 2013. During the year, the AMC initiated tie-ups for online distribution of the Mutual Fund’s Schemes with several channel partners taking the total number of such tie-ups to 45.
7. DETAILS OF INVESTOR GRIEVANCE REDRESSALThe details of the redressal of investor complaints received against HSBC Mutual Fund during April 2012- March 2013 are as follows:
Total Number of Folios: 261694
Com-plaintCode
Type of complaint#
(a) No. ofcomplaintspendingat the
beginningof theyear
(b) No. of com-plaints
receivedduring
theyear#
Action on (a) and (b)
Resolved Non Actiona-
ble
Pending
Within 30
days
30 - 60 days
60 - 180 days
Beyond 180 days
0 - 3 months
3 - 6 months
6 - 9 months
9 - 12 months
I A Non receipt of Dividend on Units
0 3 3 0 0 0 0 0 0 0 0
I B Interest on delayed payment of Dividend
0 0 0 0 0 0 0 0 0 0 0
I C Non receipt of Redemption Proceeds
2 40 22 18 2 0 0 0 0 0 0
I D Interest on delayed payment of Redemption
0 2 1 1 0 0 0 0 0 0 0
II A Non receipt of Statement of Account/Unit Certifi cate
0 9 9 0 0 0 0 0 0 0 0
II B Discrepancy in Statement of Account
0 6 5 0 0 0 0 1 0 0 0
II C Data corrections in Investor details
0 277 277 0 0 0 0 0 0 0 0
II D Non receipt of Annual Report/Abridged Summary
0 0 0 0 0 0 0 0 0 0 0

8
HSBC FLEXI DEBT FUND
Trustees’ ReportFor the year ended March 31, 2013 (Contd...)
Com-plaintCode
Type of complaint#
(a) No. ofcomplaintspendingat the
beginningof theyear
(b) No. of com-plaints
receivedduring
theyear#
Action on (a) and (b)
Resolved Non Actiona-
ble
Pending
Within 30
days
30 - 60 days
60 - 180 days
Beyond 180 days
0 - 3 months
3 - 6 months
6 - 9 months
9 - 12 months
III A Wrong switch between Schemes
0 0 0 0 0 0 0 0 0 0 0
III B Unauthorized switch between Schemes
0 0 0 0 0 0 0 0 0 0 0
III C Deviation from Scheme attributes
0 0 0 0 0 0 0 0 0 0 0
III D Wrong or excess charges/load
0 0 0 0 0 0 0 0 0 0 0
III E Non updation of changes viz. address, PAN, bank details, nomination, etc
0 18 18 0 0 0 0 0 0 0 0
IV Others 0 14 12 1 1 0 0 0 0 0 0
Total 2 369 347 20 3 0 0 1 0 0 0
Note:
# including against its authorized persons / distributors / employees etc.
8. STATUTORY DETAILSa) The Sponsors are not responsible or liable for any loss resulting from the operation of the Schemes of
the Fund beyond initial contribution of Rs. 1 lakh for setting up the Fund.
b) The price and redemption value of the units, and income from them, can go up as well as down with fl uctuations in the market value of its underlying investments.
c) Full Annual Report shall be disclosed on the website at www.assetmanagement.hsbc.com/in and shall be available for inspection at the Head Offi ce of the mutual fund. Present and prospective unit holder can obtain copy of the trust deed, the full Annual Report of the Scheme(s), the Annual Report of HSBC Asset Management (India) Private Limited and the text of the relevant Scheme(s) at a price.
9. ACKNOWLEDGEMENTSThe Trustees wish to thank the Unit holders of the Schemes for their support throughout the year and also thank the Government of India, the Securities and Exchange Board of India (SEBI), the Reserve Bank of India (RBI) and the Association of Mutual Funds in India (AMFI) for the guidance provided by them. The Trustees also appreciate the service provided by the Registrar and Transfer Agent, Fund Accountant, Custodian, Bankers, Distributors and Brokers. The guidance and services provided by the Auditors and advocates and the ebullience, sincerity and dedication of the employees of HSBC Asset Management (India) Private Limited is also appreciated.
The Trustees look forward to the continued support of everyone.
For and on behalf of the Board of Trustees of HSBC Mutual Fund
Sd/-
Dilip J. Thakkar
Trustee
MUMBAIJuly 16, 2013
9
HSBC FLEXI DEBT FUND
Auditors’ Report
To the Board of Trustees of
HSBC Mutual Fund
Report on the Financial Statements1. We have audited the accompanying fi nancial statements of HSBC Mutual Fund - HSBC Flexi Debt Fund
(the “Scheme”), which comprise the Balance Sheet as at March 31, 2013, and the related Revenue Account for the year then ended, and a summary of signifi cant accounting policies and other explanatory information, which we have signed under reference to this report.
Trustee’s and Management’s Responsibility for the Financial Statements2. The Board of Trustees of HSBC Mutual Fund (the “Trustee”) and the Management of HSBC Asset
Management (India) Private Limited (the “Management”) are responsible for the preparation of these fi nancial statements that give a true and fair view of the fi nancial position and fi nancial performance of the Scheme in accordance with the accounting policies and standards specifi ed in the Ninth Schedule of the Securities and Exchange Board of India (Mutual Funds) Regulations, 1996 and amendments thereto (the “Regulations”). This responsibility includes the design, implementation and maintenance of internal control relevant to the preparation and presentation of the fi nancial statements that give a true and fair view and are free from material misstatement, whether due to fraud or error.
Auditors’ Responsibility3. Our responsibility is to express an opinion on these fi nancial statements based on our audit. We conducted
our audit in accordance with the Standards on Auditing issued by the Institute of Chartered Accountants of India. Those Standards require that we comply with ethical requirements and plan and perform the audit to obtain reasonable assurance about whether the fi nancial statements are free from material misstatement.
4. An audit involves performing procedures to obtain audit evidence, about the amounts and disclosures in the fi nancial statements. The procedures selected depend on the auditors’ judgment, including the assessment of the risks of material misstatement of the fi nancial statements, whether due to fraud or error. In making those risk assessments, the auditors consider internal control relevant to the preparation and fair presentation of the fi nancial statements in order to design audit procedures that are appropriate in the circumstances. Our procedures included confi rmation of securities owned and unit capital balances as at March 31, 2013 by correspondence with the custodian/others and registrar and transfer agent, respectively. An audit also includes evaluating the appropriateness of accounting policies used and the reasonableness of the accounting estimates made by the Trustee and the Management, as well as evaluating the overall presentation of the fi nancial statements.
5. We believe that the audit evidence we have obtained is suffi cient and appropriate to provide a basis for our audit opinion.
Opinion6. In our opinion, and to the best of our information and according to the explanations given to us, the
accompanying fi nancial statements give the information required by the Regulations in the manner so required and give a true and fair view in conformity with the accounting principles generally accepted in India:
(a) in the case of the Balance Sheet, of the state of affairs of the Scheme as at March 31, 2013; and
(b) in the case of the Revenue Account, of the net surplus for the year ended on that date.
Report on Other Legal and Regulatory Requirement7. As required by section 55(4) of the Regulations, we report that:
(a) We have obtained all the information and explanations which, to the best of our knowledge and belief, were necessary for the purposes of our audit; and

10
HSBC FLEXI DEBT FUND
Independent Auditors’ Report (Contd...)
(b) In our opinion, the Balance Sheet and Revenue Account dealt with by this report have been prepared in accordance with the accounting policies and standards specifi ed in the Ninth Schedule of the Regulations.
8. As required by clause 5 (ii)(2) of the Eleventh Schedule to the Regulations, we report that the Balance Sheet and Revenue Account dealt with by this Report are in agreement with the books of account of the Scheme.
9. In our opinion, the methods used to value non-traded securities as at March 31, 2013, as determined by HSBC Asset Management (India) Private Limited under procedures approved by the Board of Trustees of HSBC Mutual Fund in accordance with the guidelines for valuation of securities for mutual funds as mentioned in the Eighth Schedule of the Regulations issued by the Securities and Exchange Board of India, are fair and reasonable.
For PRICE WATERHOUSEFirm Registration Number: 301112EChartered Accountants
Sd/-
Vivek PrasadPartnerMembership Number: 104941
Place : MumbaiDate : July 16, 2013

4
HSBC INCOME FUND
Trustees’ ReportFor the year ended March 31, 2013
The Trustees present the eleventh report and the audited abridged fi nancial statements of the Schemes of HSBC Mutual Fund (the “Fund”), for the year ended March 31, 2013.
1. SCHEME PERFORMANCE, FUTURE OUTLOOK AND OPERATIONS OF THE SCHEMES
a) Operations and Performance of the Schemes
HSBC Income Fund (HIF) - an open-ended Income Scheme
HIF seeks to generate reasonable income through a diversifi ed portfolio of fi xed income securities. The AMC’s view of interest rate trends and the nature of the Plans will be refl ected in the type and maturities of securities in which the Short Term and Investment Plans are invested.
The Scheme has two Plans - the Investment Plan and the Short Term Plan. The net assets of HSBC Income Fund - Investment Plan (HIF - IP) amounted to Rs. 89.77 crores as at March 31, 2013 as compared to Rs. 32.66 crores as at March 31, 2012. Around 92.35% of the net assets were invested in debt and money market instruments, 1.77% of the net assets were invested in reverse repos/CBLO and 5.88 % were in net current assets as at March 31, 2013. The net assets of HSBC Income Fund - Short Term Plan (HIF - STP) amounted to Rs. 1035.16 crores as at March 31, 2013 as compared to Rs. 494.14 crores as at March 31, 2012. Around 97.06 % of the net assets were invested in debt and money market instruments, 0.88 % of the net assets were invested in reverse repos/CBLO and 2.06 % were in net current assets as at March 31, 2013.
HIF-IP outperformed its benchmark through active management of duration.
HIF - IP
Date of Inception : 10 December, 2002 Simple Annualized (%) Compounded Annualized (%)
Scheme Name & Benchmarks April ‘12 - March ‘13
April ‘11 - March ‘12
April ‘10 - March ‘11
Since Inception
HSBC Income Fund - Investment Plan - Growth 11.19 8.86 5.51 7.15
CRISIL 10 Year Gilt Index (Standard Benchmark) 11.31 2.41 4.61 5.63
CRISIL Composite Bond Fund Index (Scheme Benchmark) 9.27 7.68 5.06 5.86
Rs. 10,000, if invested in HIF-IP - Growth, would have become
11,119 10,886 10,551 20,404
Rs. 10,000, if invested in CRISIL 10 Year Gilt Index, would have become
11,131 10241 10,461 17,606
Rs. 10,000, if invested in CRISIL Composite Bond Fund Index, would have become
10,927 10768 10,506 18,006
Returns data as on March 31, 2013. Past performance may or may not be sustained in future. ‘Since Inception’ returns are calculated on Rs. 10 invested at inception. Calculations are based on Growth NAVs.
HIF-STP outperformed its benchmark through focus on accrual and active calls.
HIF - STP
Date of Inception : 10 December, 2002 Simple Annualized (%) Compounded Annualized (%)
Scheme Name & Benchmarks April ‘12 - March ‘13
April ‘11 - March ‘12
April ‘10 - March ‘11
Since Inception
HSBC Income Fund - STP - Growth 9.26 8.41 5.80 6.76
CRISIL 1 Year T-Bill Index (Standard Benchmark) 8.37 6.59 3.86 5.41
CRISIL Short-Term Bond Fund Index (Scheme Benchmark) 9.09 8.28 5.13 6.44

5
HSBC INCOME FUND
Trustees’ ReportFor the year ended March 31, 2013 (Contd...)
Date of Inception : 10 December, 2002 Simple Annualized (%) Compounded Annualized (%)
Scheme Name & Benchmarks April ‘12 - March ‘13
April ‘11 - March ‘12
April ‘10 - March ‘11
Since Inception
Rs. 10,000, if invested in HIF - STP - Growth, would have become
10,926 10,841 10,580 19,652
Rs. 10,000, if invested in CRISIL 1 Year T-Bill Index, would have become
10,837 10659 10,386 17,221
Rs. 10,000, if invested in CRISIL Short-Term Bond Fund Index, would have become
10,909 10828 10,513 19,048
Returns data as on March 31, 2013. Past performance may or may not be sustained in future. ‘Since inception’ returns are calculated on Rs. 10 invested at inception. Calculations are based on Growth NAVs.
b) Market Overview & Outlook
EQUITY OUTLOOK
The Sensex returned 8.23% for the FY ended March 2013. While this looks to be a tepid return, the market rallied smoothly for a low of 15965 in June to end at 18835 at the FY end, a return of 17.98%. This was largely due to a series of announcements on reforms by the government and falling crude oil prices, signaling hopes of an economic recovery.
Returns (April 1, 2012 - March 31, 2013) 1 Year (%)
NIFTY 7.31
Sensex 8.23
S&P BSE 100 6.84
S&P BSE 200 6.03
S&P BSE 500 4.81
CNX Midcap -4.02
Source: Bloomberg
Our view in respect of key issues facing equity market currently is highlighted as under, based on which we do expect a likely reversal of the prevailing negative sentiment going forward -
� Macro challenge - expect some relief in current account defi cit given likely lower gold imports and crude oil correction. Solution to fi scal defi cit may however need policy decision to reduce subsidy burden on diesel, kerosene, LPG.
� Commodities infl ation expected to decline on account of China slowdown and lower growth in western world. This may have positive impact margin expansion for corporate sector and on currency (INR) and will give room for reducing interest rates over time. Lower cost of capital should hopefully revive capex spending, though gradually (recovery from 2H12).
� Lower interest rates directionally would be the single most important variable for equity markets to rally. This will be driven by lower commodity infl ation and focus back on reviving growth through monetary policy (recent disappointing GDP/IIP numbers support this view).
� Valuations (for large Sensex companies) are attractive at close to 13x forward earnings and in the lower range of historic multiples. A large number of mid-caps available at a signifi cant discount to large cap peer.
� Structural model for India equity investment remains intact for long term returns. These include favourable demography, high savings rate, rising incomes, growing consumption demand growth, existing low penetration, etc.
6
HSBC INCOME FUND
Trustees’ ReportFor the year ended March 31, 2013 (Contd...)
DEBT OUTLOOK
Fixed Income market in FY 2013 moved towards lower yields on back of 100 bps rate cut and CRR cuts. RBI front loaded the rate cut in April and then followed it up in January 2013 and March 2013. Towards the second half rates stabilized largely as the core infl ation remained within comfort zone.
In the second half of the year expectation of rate cut and series of open market operations led to rally in rates. Government borrowing was lower than budgeted and the spending was also controlled in second half of the year. Towards the end of the year short end rates tightened substantially due to low deposit growth in banking system.
Corporate yield curve remained inverted with short end rates higher than long end rates for the large part of the year due to liquidity tightness.
Expectation is to see continuation of some easing of the rates stance from RBI in FY 14. However, there is a need to focus on key variables in the economy to judge future directions. These are:
� Liquidity: Liquidity will drive short end rates and eventually drive decisions on open market operations as well as CRR cuts.
� Infl ation: Infl ation numbers will determine future course of action for RBI and remains a critical variable for policy. We expect infl ation to ease in fi rst half of FY 14.
� Growth: GDP growth numbers as well as industrial activity will also determine the decision on policy. Weak GDP numbers may continue for couple of quarters.
� Fiscal defi cit: Fiscal defi cit and government spending will determine the government borrowing and crowding out in interest rate curve.
� Current account defi cit / BoP situation: CAD determines how the pressure on currency works and effective management of forex reserves
� Currency levels: Level of INR will determine how the central banker reacts to the situation on the global crisis etc.
2. BRIEF BACKGROUND OF SPONSORS, BOARD OF TRUSTEES AND ASSET MANAGEMENT COMPANY
a) Sponsor HSBC Mutual Fund is sponsored by HSBC Securities and Capital Markets (India) Private Limited (HSCI).
The Sponsor is the Settler of the Mutual Fund Trust. The Sponsor has entrusted a sum of Rs.1,00,000 (Rupees One Lakh only) to the Trustee as the initial contribution towards the corpus of the Mutual Fund.
HSCI offers integrated investment banking services, securities and corporate fi nance & advisory. HSCI is a member of The Bombay Stock Exchange Limited and National Stock Exchange (capital and derivative market segments). HSCI holds 100% of the paid up equity share capital of HSBC Asset Management (India) Private Limited.
b) HSBC Mutual Fund HSBC Mutual Fund (“the Mutual Fund” or “the Fund”) has been constituted as a Trust in accordance with
the provisions of the Indian Trusts Act, 1882 (2 of 1882) vide a Trust Deed dated February 7, 2002 with HSBC Securities and Capital Markets (India) Private Limited, as the Sponsor and the Board of Individual Trustees. The Trustee has entered into an Investment Management Agreement dated February 7, 2002 with HSBC Asset Management (India) Private Limited (AMC) to function as the Investment Manager for all the Schemes of the Fund. The Fund was registered with SEBI vide registration number MF/046/02/5 dated May 27, 2002.
The Trust has been formed for the purpose of pooling of capital from the public for collective investment in securities/any other property for the purpose of providing facilities for participation by persons as benefi ciaries in such properties/investments and in the profi ts/income arising therefrom.
7
HSBC INCOME FUND
Trustees’ ReportFor the year ended March 31, 2013 (Contd...)
c) Board of Trustees (the Trustees) The Board of Trustees is the exclusive owner of the Trust Fund and holds the same in trust for the benefi t
of the unit holders. The Trustees have been discharging their duties and carrying out the responsibilities as provided in the SEBI (Mutual Funds) Regulations, 1996 and the Trust Deed. The Trustees seek to ensure that the Fund and the Schemes fl oated there under are managed by the AMC in accordance with the Trust Deed, the said Regulations, directions and guidelines issued by the SEBI, the Stock Exchanges, the Association of Mutual Funds in India and other regulatory agencies.
d) Asset Management Company (the AMC) HSBC Asset Management (India) Private Limited (the Investment Manager or the AMC) is a private limited
company incorporated under the Companies Act, 1956 on December 12, 2001 having its Registered Offi ce at 16, V. N. Road, Fort, Mumbai 400 001. HSBC Asset Management (India) Private Limited has been appointed as the Asset Management Company of the HSBC Mutual Fund by the Trustee vide Investment Management Agreement (IMA) dated February 7, 2002 and executed between the Trustees and the AMC. SEBI approved the AMC to act as the Investment Manager of the Fund vide its letter No. MFD/BC/163/2002 dated May 27, 2002. The paid-up equity share capital of the AMC is Rs. 54.2 crores. HSBC Securities and Capital Markets (India) Private Limited holds 100% of the paid up equity share capital of the AMC.
3. INVESTMENT OBJECTIVE OF THE SCHEMESThe investment objective of the respective Schemes has been provided above under the heading “Scheme Performance, Future Outlook and Operation of the Scheme” (Refer Section 1).
4. SIGNIFICANT ACCOUNTING POLICIESThe accounting policies are in accordance with Securities Exchange Board of India (Mutual Funds) Regulations 1996.
5. UNCLAIMED DIVIDENDS & REDEMPTIONSSummary of number of Investors & corresponding amount Scheme-wise as on March 31, 2013
Scheme
Unclaimed Dividends Unclaimed Redemptions
Amount (Rs.)
No. of Investors
Amount (Rs.)
No. of Investors
HSBC Income Fund - Investment Plan 389,081.02 774 258,385.87 26
HSBC Income Fund - Short Term Plan 57,430.30 24 – –
6. INVESTOR SERVICESThe number of offi cial points of acceptance of transactions is 197 locations. In addition to the offi ces of the Registrar & Transfer agents, the AMC has Investor Service Centres in 4 locations at its own offi ces - namely Mumbai, New Delhi, Kolkata and Chennai. With a view to enhance customer convenience, the AMC has extended the facility of priority based servicing to key distributors through the enhancement of the Interactive Voice Reponses. Call Centre number has now been converted to a single Toll Free number which can be dialed from anywhere in India. The call Centre service is being managed by the Registrar and Transfer Agents. The AMC continues to retain the outsourced back offi ce services with HOPE.
On the distribution front, the number of empanelled distributors was 2471 as on 31 March 2013. During the year, the AMC initiated tie-ups for online distribution of the Mutual Fund’s Schemes with several channel partners taking the total number of such tie-ups to 45.

8
HSBC INCOME FUND
Trustees’ ReportFor the year ended March 31, 2013 (Contd...)
7. DETAILS OF INVESTOR GRIEVANCE REDRESSALThe details of the redressal of investor complaints received against HSBC Mutual Fund during April 2012- March 2013 are as follows:
Total Number of Folios: 261694
Com-plaintCode
Type of complaint#
(a) No. ofcomplaintspendingat the
beginningof theyear
(b) No. of com-plaints
receivedduring
theyear#
Action on (a) and (b)
Resolved Non Actiona-
ble
Pending
Within 30
days
30 - 60 days
60 - 180 days
Beyond 180 days
0 - 3 months
3 - 6 months
6 - 9 months
9 - 12 months
I A Non receipt of Dividend on Units
0 3 3 0 0 0 0 0 0 0 0
I B Interest on delayed payment of Dividend
0 0 0 0 0 0 0 0 0 0 0
I C Non receipt of Redemption Proceeds
2 40 22 18 2 0 0 0 0 0 0
I D Interest on delayed payment of Redemption
0 2 1 1 0 0 0 0 0 0 0
II A Non receipt of Statement of Account/Unit Certifi cate
0 9 9 0 0 0 0 0 0 0 0
II B Discrepancy in Statement of Account
0 6 5 0 0 0 0 1 0 0 0
II C Data corrections in Investor details
0 277 277 0 0 0 0 0 0 0 0
II D Non receipt of Annual Report/Abridged Summary
0 0 0 0 0 0 0 0 0 0 0
III A Wrong switch between Schemes
0 0 0 0 0 0 0 0 0 0 0
III B Unauthorized switch between Schemes
0 0 0 0 0 0 0 0 0 0 0
III C Deviation from Scheme attributes
0 0 0 0 0 0 0 0 0 0 0
III D Wrong or excess charges/load
0 0 0 0 0 0 0 0 0 0 0
III E Non updation of changes viz. address, PAN, bank details, nomination, etc
0 18 18 0 0 0 0 0 0 0 0
IV Others 0 14 12 1 1 0 0 0 0 0 0
Total 2 369 347 20 3 0 0 1 0 0 0
Note:
# including against its authorized persons / distributors / employees etc.

9
HSBC INCOME FUND
Trustees’ ReportFor the year ended March 31, 2013 (Contd...)
8. STATUTORY DETAILSa) The Sponsors are not responsible or liable for any loss resulting from the operation of the Schemes of
the Fund beyond initial contribution of Rs. 1 lakh for setting up the Fund.
b) The price and redemption value of the units, and income from them, can go up as well as down with fl uctuations in the market value of its underlying investments.
c) Full Annual Report shall be disclosed on the website at www.assetmanagement.hsbc.com/in and shall be available for inspection at the Head Offi ce of the mutual fund. Present and prospective unit holder can obtain copy of the trust deed, the full Annual Report of the Scheme(s), the Annual Report of HSBC Asset Management (India) Private Limited and the text of the relevant Scheme(s) at a price.
9. ACKNOWLEDGEMENTSThe Trustees wish to thank the Unit holders of the Schemes for their support throughout the year and also thank the Government of India, the Securities and Exchange Board of India (SEBI), the Reserve Bank of India (RBI) and the Association of Mutual Funds in India (AMFI) for the guidance provided by them. The Trustees also appreciate the service provided by the Registrar and Transfer Agent, Fund Accountant, Custodian, Bankers, Distributors and Brokers. The guidance and services provided by the Auditors and advocates and the ebullience, sincerity and dedication of the employees of HSBC Asset Management (India) Private Limited is also appreciated.
The Trustees look forward to the continued support of everyone.
For and on behalf of the Board of Trustees of HSBC Mutual Fund
Sd/-
Dilip J. Thakkar
Trustee
MUMBAIJuly 16, 2013

10
HSBC INCOME FUND
Independent Auditors’ Report
To the Board of Trustees of
HSBC Mutual Fund
Report on the Financial Statements1. We have audited the accompanying fi nancial statements of HSBC Mutual Fund - HSBC Income Fund
(the “Scheme”), which comprise the Balance Sheet as at March 31, 2013, and the related Revenue Account for the year then ended, and a summary of signifi cant accounting policies and other explanatory information, which we have signed under reference to this report.
Trustee’s and Management’s Responsibility for the Financial Statements2. The Board of Trustees of HSBC Mutual Fund (the “Trustee”) and the Management of HSBC Asset
Management (India) Private Limited (the “Management”) are responsible for the preparation of these fi nancial statements that give a true and fair view of the fi nancial position and fi nancial performance of the Scheme in accordance with the accounting policies and standards specifi ed in the Ninth Schedule of the Securities and Exchange Board of India (Mutual Funds) Regulations, 1996 and amendments thereto (the “Regulations”). This responsibility includes the design, implementation and maintenance of internal control relevant to the preparation and presentation of the fi nancial statements that give a true and fair view and are free from material misstatement, whether due to fraud or error.
Auditors’ Responsibility3. Our responsibility is to express an opinion on these fi nancial statements based on our audit. We conducted
our audit in accordance with the Standards on Auditing issued by the Institute of Chartered Accountants of India. Those Standards require that we comply with ethical requirements and plan and perform the audit to obtain reasonable assurance about whether the fi nancial statements are free from material misstatement.
4. An audit involves performing procedures to obtain audit evidence, about the amounts and disclosures in the fi nancial statements. The procedures selected depend on the auditors’ judgment, including the assessment of the risks of material misstatement of the fi nancial statements, whether due to fraud or error. In making those risk assessments, the auditors consider internal control relevant to the preparation and fair presentation of the fi nancial statements in order to design audit procedures that are appropriate in the circumstances. Our procedures included confi rmation of securities owned and unit capital balances as at March 31, 2013 by correspondence with the custodian/others and registrar and transfer agent, respectively. An audit also includes evaluating the appropriateness of accounting policies used and the reasonableness of the accounting estimates made by the Trustee and the Management, as well as evaluating the overall presentation of the fi nancial statements.
5. We believe that the audit evidence we have obtained is suffi cient and appropriate to provide a basis for our audit opinion.
Opinion6. In our opinion, and to the best of our information and according to the explanations given to us, the
accompanying fi nancial statements give the information required by the Regulations in the manner so required and give a true and fair view in conformity with the accounting principles generally accepted in India:
(a) in the case of the Balance Sheet, of the state of affairs of the Scheme as at March 31, 2013; and
(b) in the case of the Revenue Account, of the net surplus for the year ended on that date.
Report on Other Legal and Regulatory Requirement7. As required by section 55(4) of the Regulations, we report that:
(a) We have obtained all the information and explanations which, to the best of our knowledge and belief, were necessary for the purposes of our audit; and

11
HSBC INCOME FUND
Independent Auditors’ Report (Contd...)
(b) In our opinion, the Balance Sheet and Revenue Account dealt with by this report have been prepared in accordance with the accounting policies and standards specifi ed in the Ninth Schedule of the Regulations.
8. As required by clause 5 (ii)(2) of the Eleventh Schedule to the Regulations, we report that the Balance Sheet and Revenue Account dealt with by this Report are in agreement with the books of account of the Scheme.
9. In our opinion, the methods used to value non-traded securities as at March 31, 2013, as determined by HSBC Asset Management (India) Private Limited under procedures approved by the Board of Trustees of HSBC Mutual Fund in accordance with the guidelines for valuation of securities for mutual funds as mentioned in the Eighth Schedule of the Regulations issued by the Securities and Exchange Board of India, are fair and reasonable.
For PRICE WATERHOUSEFirm Registration Number: 301112EChartered Accountants
Sd/-
Vivek PrasadPartnerMembership Number: 104941
Place : MumbaiDate : July 16, 2013
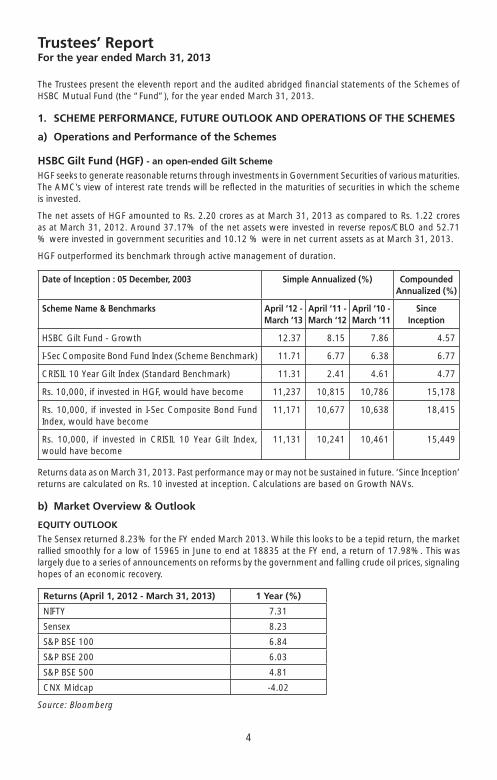
4
HSBC GILT FUND
Trustees’ ReportFor the year ended March 31, 2013
The Trustees present the eleventh report and the audited abridged fi nancial statements of the Schemes of HSBC Mutual Fund (the “Fund”), for the year ended March 31, 2013.
1. SCHEME PERFORMANCE, FUTURE OUTLOOK AND OPERATIONS OF THE SCHEMES
a) Operations and Performance of the Schemes
HSBC Gilt Fund (HGF) - an open-ended Gilt Scheme
HGF seeks to generate reasonable returns through investments in Government Securities of various maturities. The AMC’s view of interest rate trends will be refl ected in the maturities of securities in which the scheme is invested.
The net assets of HGF amounted to Rs. 2.20 crores as at March 31, 2013 as compared to Rs. 1.22 crores as at March 31, 2012. Around 37.17% of the net assets were invested in reverse repos/CBLO and 52.71 % were invested in government securities and 10.12 % were in net current assets as at March 31, 2013.
HGF outperformed its benchmark through active management of duration.
Date of Inception : 05 December, 2003 Simple Annualized (%) Compounded Annualized (%)
Scheme Name & Benchmarks April ‘12 - March ‘13
April ‘11 - March ‘12
April ‘10 - March ‘11
Since Inception
HSBC Gilt Fund - Growth 12.37 8.15 7.86 4.57
I-Sec Composite Bond Fund Index (Scheme Benchmark) 11.71 6.77 6.38 6.77
CRISIL 10 Year Gilt Index (Standard Benchmark) 11.31 2.41 4.61 4.77
Rs. 10,000, if invested in HGF, would have become 11,237 10,815 10,786 15,178
Rs. 10,000, if invested in I-Sec Composite Bond Fund Index, would have become
11,171 10,677 10,638 18,415
Rs. 10,000, if invested in CRISIL 10 Year Gilt Index, would have become
11,131 10,241 10,461 15,449
Returns data as on March 31, 2013. Past performance may or may not be sustained in future. ‘Since Inception’ returns are calculated on Rs. 10 invested at inception. Calculations are based on Growth NAVs.
b) Market Overview & Outlook
EQUITY OUTLOOK
The Sensex returned 8.23% for the FY ended March 2013. While this looks to be a tepid return, the market rallied smoothly for a low of 15965 in June to end at 18835 at the FY end, a return of 17.98%. This was largely due to a series of announcements on reforms by the government and falling crude oil prices, signaling hopes of an economic recovery.
Returns (April 1, 2012 - March 31, 2013) 1 Year (%)
NIFTY 7.31
Sensex 8.23
S&P BSE 100 6.84
S&P BSE 200 6.03
S&P BSE 500 4.81
CNX Midcap -4.02
Source: Bloomberg

5
HSBC GILT FUND
Trustees’ ReportFor the year ended March 31, 2013 (Contd...)
Our view in respect of key issues facing equity market currently is highlighted as under, based on which we do expect a likely reversal of the prevailing negative sentiment going forward -
� Macro challenge - expect some relief in current account defi cit given likely lower gold imports and crude oil correction. Solution to fi scal defi cit may however need policy decision to reduce subsidy burden on diesel, kerosene, LPG.
� Commodities infl ation expected to decline on account of China slowdown and lower growth in western world. This may have positive impact margin expansion for corporate sector and on currency (INR) and will give room for reducing interest rates over time. Lower cost of capital should hopefully revive capex spending, though gradually (recovery from 2H12).
� Lower interest rates directionally would be the single most important variable for equity markets to rally. This will be driven by lower commodity infl ation and focus back on reviving growth through monetary policy (recent disappointing GDP/IIP numbers support this view).
� Valuations (for large Sensex companies) are attractive at close to 13x forward earnings and in the lower range of historic multiples. A large number of mid-caps available at a signifi cant discount to large cap peer.
� Structural model for India equity investment remains intact for long term returns. These include favourable demography, high savings rate, rising incomes, growing consumption demand growth, existing low penetration, etc.
DEBT OUTLOOK
Fixed Income market in FY 2013 moved towards lower yields on back of 100 bps rate cut and CRR cuts. RBI front loaded the rate cut in April and then followed it up in January 2013 and March 2013. Towards the second half rates stabilized largely as the core infl ation remained within comfort zone.
In the second half of the year expectation of rate cut and series of open market operations led to rally in rates. Government borrowing was lower than budgeted and the spending was also controlled in second half of the year. Towards the end of the year short end rates tightened substantially due to low deposit growth in banking system.
Corporate yield curve remained inverted with short end rates higher than long end rates for the large part of the year due to liquidity tightness.
Expectation is to see continuation of some easing of the rates stance from RBI in FY 14. However, there is a need to focus on key variables in the economy to judge future directions. These are:
� Liquidity: Liquidity will drive short end rates and eventually drive decisions on open market operations as well as CRR cuts.
� Infl ation: Infl ation numbers will determine future course of action for RBI and remains a critical variable for policy. We expect infl ation to ease in fi rst half of FY 14.
� Growth: GDP growth numbers as well as industrial activity will also determine the decision on policy. Weak GDP numbers may continue for couple of quarters.
� Fiscal defi cit: Fiscal defi cit and government spending will determine the government borrowing and crowding out in interest rate curve.
� Current account defi cit / BoP situation: CAD determines how the pressure on currency works and effective management of forex reserves
� Currency levels: Level of INR will determine how the central banker reacts to the situation on the global crisis etc.

6
HSBC GILT FUND
Trustees’ ReportFor the year ended March 31, 2013 (Contd...)
2. BRIEF BACKGROUND OF SPONSORS, BOARD OF TRUSTEES AND ASSET MANAGEMENT COMPANY
a) Sponsor HSBC Mutual Fund is sponsored by HSBC Securities and Capital Markets (India) Private Limited (HSCI).
The Sponsor is the Settler of the Mutual Fund Trust. The Sponsor has entrusted a sum of Rs.1,00,000 (Rupees One Lakh only) to the Trustee as the initial contribution towards the corpus of the Mutual Fund.
HSCI offers integrated investment banking services, securities and corporate fi nance & advisory. HSCI is a member of The Bombay Stock Exchange Limited and National Stock Exchange (capital and derivative market segments). HSCI holds 100% of the paid up equity share capital of HSBC Asset Management (India) Private Limited.
b) HSBC Mutual Fund HSBC Mutual Fund (“the Mutual Fund” or “the Fund”) has been constituted as a Trust in accordance with
the provisions of the Indian Trusts Act, 1882 (2 of 1882) vide a Trust Deed dated February 7, 2002 with HSBC Securities and Capital Markets (India) Private Limited, as the Sponsor and the Board of Individual Trustees. The Trustee has entered into an Investment Management Agreement dated February 7, 2002 with HSBC Asset Management (India) Private Limited (AMC) to function as the Investment Manager for all the Schemes of the Fund. The Fund was registered with SEBI vide registration number MF/046/02/5 dated May 27, 2002.
The Trust has been formed for the purpose of pooling of capital from the public for collective investment in securities/any other property for the purpose of providing facilities for participation by persons as benefi ciaries in such properties/investments and in the profi ts/income arising therefrom.
c) Board of Trustees (the Trustees) The Board of Trustees is the exclusive owner of the Trust Fund and holds the same in trust for the benefi t
of the unit holders. The Trustees have been discharging their duties and carrying out the responsibilities as provided in the SEBI (Mutual Funds) Regulations, 1996 and the Trust Deed. The Trustees seek to ensure that the Fund and the Schemes fl oated there under are managed by the AMC in accordance with the Trust Deed, the said Regulations, directions and guidelines issued by the SEBI, the Stock Exchanges, the Association of Mutual Funds in India and other regulatory agencies.
d) Asset Management Company (the AMC) HSBC Asset Management (India) Private Limited (the Investment Manager or the AMC) is a private limited
company incorporated under the Companies Act, 1956 on December 12, 2001 having its Registered Offi ce at 16, V. N. Road, Fort, Mumbai 400 001. HSBC Asset Management (India) Private Limited has been appointed as the Asset Management Company of the HSBC Mutual Fund by the Trustee vide Investment Management Agreement (IMA) dated February 7, 2002 and executed between the Trustees and the AMC. SEBI approved the AMC to act as the Investment Manager of the Fund vide its letter No. MFD/BC/163/2002 dated May 27, 2002. The paid-up equity share capital of the AMC is Rs. 54.2 crores. HSBC Securities and Capital Markets (India) Private Limited holds 100% of the paid up equity share capital of the AMC.
3. INVESTMENT OBJECTIVE OF THE SCHEMESThe investment objective of the respective Schemes has been provided above under the heading “Scheme Performance, Future Outlook and Operation of the Scheme” (Refer Section 1).
4. SIGNIFICANT ACCOUNTING POLICIESThe accounting policies are in accordance with Securities Exchange Board of India (Mutual Funds) Regulations 1996.

7
HSBC GILT FUND
Trustees’ ReportFor the year ended March 31, 2013 (Contd...)
5. UNCLAIMED DIVIDENDS & REDEMPTIONSSummary of number of Investors & corresponding amount Scheme-wise as on March 31, 2013
SchemeUnclaimed Dividends Unclaimed Redemptions
Amount (Rs.)
No. of Investors
Amount (Rs.)
No. of Investors
HSBC Gilt Fund 7,395.57 2 – –
6. INVESTOR SERVICESThe number of offi cial points of acceptance of transactions is 197 locations. In addition to the offi ces of the Registrar & Transfer agents, the AMC has Investor Service Centres in 4 locations at its own offi ces - namely Mumbai, New Delhi, Kolkata and Chennai. With a view to enhance customer convenience, the AMC has extended the facility of priority based servicing to key distributors through the enhancement of the Interactive Voice Reponses. Call Centre number has now been converted to a single Toll Free number which can be dialed from anywhere in India. The call Centre service is being managed by the Registrar and Transfer Agents. The AMC continues to retain the outsourced back offi ce services with HOPE.
On the distribution front, the number of empanelled distributors was 2471 as on 31 March 2013. During the year, the AMC initiated tie-ups for online distribution of the Mutual Fund’s Schemes with several channel partners taking the total number of such tie-ups to 45.
7. DETAILS OF INVESTOR GRIEVANCE REDRESSALThe details of the redressal of investor complaints received against HSBC Mutual Fund during April 2012- March 2013 are as follows:
Total Number of Folios: 261694
Com-plaintCode
Type of complaint#
(a) No. ofcomplaintspendingat the
beginningof theyear
(b) No. of com-plaints
receivedduring
theyear#
Action on (a) and (b)
Resolved Non Actiona-
ble
Pending
Within 30
days
30 - 60 days
60 - 180 days
Beyond 180 days
0 - 3 months
3 - 6 months
6 - 9 months
9 - 12 months
I A Non receipt of Dividend on Units
0 3 3 0 0 0 0 0 0 0 0
I B Interest on delayed payment of Dividend
0 0 0 0 0 0 0 0 0 0 0
I C Non receipt of Redemption Proceeds
2 40 22 18 2 0 0 0 0 0 0
I D Interest on delayed payment of Redemption
0 2 1 1 0 0 0 0 0 0 0
II A Non receipt of Statement of Account/Unit Certifi cate
0 9 9 0 0 0 0 0 0 0 0
II B Discrepancy in Statement of Account
0 6 5 0 0 0 0 1 0 0 0
II C Data corrections in Investor details
0 277 277 0 0 0 0 0 0 0 0
II D Non receipt of Annual Report/Abridged Summary
0 0 0 0 0 0 0 0 0 0 0

8
HSBC GILT FUND
Trustees’ ReportFor the year ended March 31, 2013 (Contd...)
Com-plaintCode
Type of complaint#
(a) No. ofcomplaintspendingat the
beginningof theyear
(b) No. of com-plaints
receivedduring
theyear#
Action on (a) and (b)
Resolved Non Actiona-
ble
Pending
Within 30
days
30 - 60 days
60 - 180 days
Beyond 180 days
0 - 3 months
3 - 6 months
6 - 9 months
9 - 12 months
III A Wrong switch between Schemes
0 0 0 0 0 0 0 0 0 0 0
III B Unauthorized switch between Schemes
0 0 0 0 0 0 0 0 0 0 0
III C Deviation from Scheme attributes
0 0 0 0 0 0 0 0 0 0 0
III D Wrong or excess charges/load
0 0 0 0 0 0 0 0 0 0 0
III E Non updation of changes viz. address, PAN, bank details, nomination, etc
0 18 18 0 0 0 0 0 0 0 0
IV Others 0 14 12 1 1 0 0 0 0 0 0
Total 2 369 347 20 3 0 0 1 0 0 0
Note:
# including against its authorized persons / distributors / employees etc.
8. STATUTORY DETAILSa) The Sponsors are not responsible or liable for any loss resulting from the operation of the Schemes of
the Fund beyond initial contribution of Rs. 1 lakh for setting up the Fund.
b) The price and redemption value of the units, and income from them, can go up as well as down with fl uctuations in the market value of its underlying investments.
c) Full Annual Report shall be disclosed on the website at www.assetmanagement.hsbc.com/in and shall be available for inspection at the Head Offi ce of the mutual fund. Present and prospective unit holder can obtain copy of the trust deed, the full Annual Report of the Scheme(s), the Annual Report of HSBC Asset Management (India) Private Limited and the text of the relevant Scheme(s) at a price.
9. ACKNOWLEDGEMENTSThe Trustees wish to thank the Unit holders of the Schemes for their support throughout the year and also thank the Government of India, the Securities and Exchange Board of India (SEBI), the Reserve Bank of India (RBI) and the Association of Mutual Funds in India (AMFI) for the guidance provided by them. The Trustees also appreciate the service provided by the Registrar and Transfer Agent, Fund Accountant, Custodian, Bankers, Distributors and Brokers. The guidance and services provided by the Auditors and advocates and the ebullience, sincerity and dedication of the employees of HSBC Asset Management (India) Private Limited is also appreciated.
The Trustees look forward to the continued support of everyone.
For and on behalf of the Board of Trustees of HSBC Mutual Fund
Sd/-
Dilip J. Thakkar
Trustee
MUMBAIJuly 16, 2013

9
HSBC GILT FUND
To the Board of Trustees of
HSBC Mutual Fund
Report on the Financial Statements1. We have audited the accompanying fi nancial statements of HSBC Mutual Fund - HSBC Gilt Fund (the
“Scheme”), which comprise the Balance Sheet as at March 31, 2013, and the related Revenue Account for the year then ended, and a summary of signifi cant accounting policies and other explanatory information, which we have signed under reference to this report.
Trustee’s and Management’s Responsibility for the Financial Statements2. The Board of Trustees of HSBC Mutual Fund (the “Trustee”) and the Management of HSBC Asset
Management (India) Private Limited (the “Management”) are responsible for the preparation of these fi nancial statements that give a true and fair view of the fi nancial position and fi nancial performance of the Scheme in accordance with the accounting policies and standards specifi ed in the Ninth Schedule of the Securities and Exchange Board of India (Mutual Funds) Regulations, 1996 and amendments thereto (the “Regulations”). This responsibility includes the design, implementation and maintenance of internal control relevant to the preparation and presentation of the fi nancial statements that give a true and fair view and are free from material misstatement, whether due to fraud or error.
Auditors’ Responsibility3. Our responsibility is to express an opinion on these fi nancial statements based on our audit. We conducted
our audit in accordance with the Standards on Auditing issued by the Institute of Chartered Accountants of India. Those Standards require that we comply with ethical requirements and plan and perform the audit to obtain reasonable assurance about whether the fi nancial statements are free from material misstatement.
4. An audit involves performing procedures to obtain audit evidence, about the amounts and disclosures in the fi nancial statements. The procedures selected depend on the auditors’ judgment, including the assessment of the risks of material misstatement of the fi nancial statements, whether due to fraud or error. In making those risk assessments, the auditors consider internal control relevant to the preparation and fair presentation of the fi nancial statements in order to design audit procedures that are appropriate in the circumstances. Our procedures included confi rmation of securities owned and unit capital balances as at March 31, 2013 by correspondence with the custodian/others and registrar and transfer agent, respectively. An audit also includes evaluating the appropriateness of accounting policies used and the reasonableness of the accounting estimates made by the Trustee and the Management, as well as evaluating the overall presentation of the fi nancial statements.
5. We believe that the audit evidence we have obtained is suffi cient and appropriate to provide a basis for our audit opinion.
Opinion6. In our opinion, and to the best of our information and according to the explanations given to us, the
accompanying fi nancial statements give the information required by the Regulations in the manner so required and give a true and fair view in conformity with the accounting principles generally accepted in India:
(a) in the case of the Balance Sheet, of the state of affairs of the Scheme as at March 31, 2013; and
(b) in the case of the Revenue Account, of the net surplus for the year ended on that date.
Report on Other Legal and Regulatory Requirement7. As required by section 55(4) of the Regulations, we report that:
(a) We have obtained all the information and explanations which, to the best of our knowledge and belief, were necessary for the purposes of our audit; and
Independent Auditors’ Report

10
HSBC GILT FUND
Independent Auditors’ Report (Contd...)
(b) In our opinion, the Balance Sheet and Revenue Account dealt with by this report have been prepared in accordance with the accounting policies and standards specifi ed in the Ninth Schedule of the Regulations.
8. As required by clause 5 (ii)(2) of the Eleventh Schedule to the Regulations, we report that the Balance Sheet and Revenue Account dealt with by this Report are in agreement with the books of account of the Scheme.
9. In our opinion, the methods used to value non-traded securities as at March 31, 2013, as determined by HSBC Asset Management (India) Private Limited under procedures approved by the Board of Trustees of HSBC Mutual Fund in accordance with the guidelines for valuation of securities for mutual funds as mentioned in the Eighth Schedule of the Regulations issued by the Securities and Exchange Board of India, are fair and reasonable.
For PRICE WATERHOUSEFirm Registration Number: 301112EChartered Accountants
Sd/-
Vivek PrasadPartnerMembership Number: 104941
Place : MumbaiDate : July 16, 2013

March 31, 2013 March 31, 2012 March 31, 2013 March 31, 2012 March 31, 2013 March 31, 2012 March 31, 2013 March 31, 2012Schedule Rupees Rupees Rupees Rupees Rupees Rupees Rupees Rupees
ASSETS
Investments 1 7,302,188,713 1,553,183,076 829,150,317 314,068,262 10,047,417,245 4,729,472,393 11,640,700 2,027,800 Deposits 2 - - 959,616 - 1,245,423 25,347,296 - - Other Current Assets 3 895,487,688 103,986,012 99,234,953 43,994,626 362,944,471 246,119,124 11,046,092 10,283,282
TOTAL 8,197,676,401 1,657,169,088 929,344,886 358,062,888 10,411,607,139 5,000,938,813 22,686,792 12,311,082
LIABILITIES
Unit Capital 4 5,864,047,747 1,282,817,125 527,004,050 238,008,895 8,906,457,788 4,407,139,944 15,449,730 9,569,474 Reserves and Surplus 5 2,060,854,083 368,172,679 370,757,994 108,614,103 1,445,105,189 534,245,747 6,632,964 2,650,901 Current Liabilities and Provisions 6 272,774,571 6,179,284 31,582,842 11,439,890 60,044,162 59,553,122 604,098 90,707
TOTAL 8,197,676,401 1,657,169,088 929,344,886 358,062,888 10,411,607,139 5,000,938,813 22,686,792 12,311,082
0 0 (0) (0) 0 (0)
Notes to the Financial Statements. 8 7,924,901,830 897,762,045 10,351,562,978 22,082,694 7,924,901,827 897,762,044 10,351,562,977 22,082,693
The schedules referred to herein form an integral part of the Financial Statements. 3 1 0.40 1
This is the Balance Sheet referred to in our report of even date.
For PRICE WATERHOUSE For Board of Trustees of For HSBC Asset Management (India)Firm Registration Number: 301112E HSBC Mutual Fund Private LimitedChartered Accountants
sd/- sd/- sd/-VIVEK PRASAD N. P. Gidwani Puneet ChaddhaPartner Trustee Director and Chief Executive OfficerMembership No.104941
sd/- sd/-Dilip J. Thakkar Kishori J. UdeshiTrustee Director
sd/- sd/-Place: Mumbai Sanjay Shah Ruchir ParekhDate: July 16, 2013 Fund Manager Fund Manager
HSBC GILT FUND
HSBC MUTUAL FUND - HSBC FLEXI DEBT FUND, HSBC INCOME FUND - INVESTMENT PLAN, HSBC INCOME FUND - SHORT TERM PLAN and HSBC GILT FUND
Balance Sheet as at March 31, 2013
HSBC FLEXI DEBT FUND HSBC INCOME FUND - INVESTMENT PLAN HSBC INCOME FUND - SHORT TERM PLAN
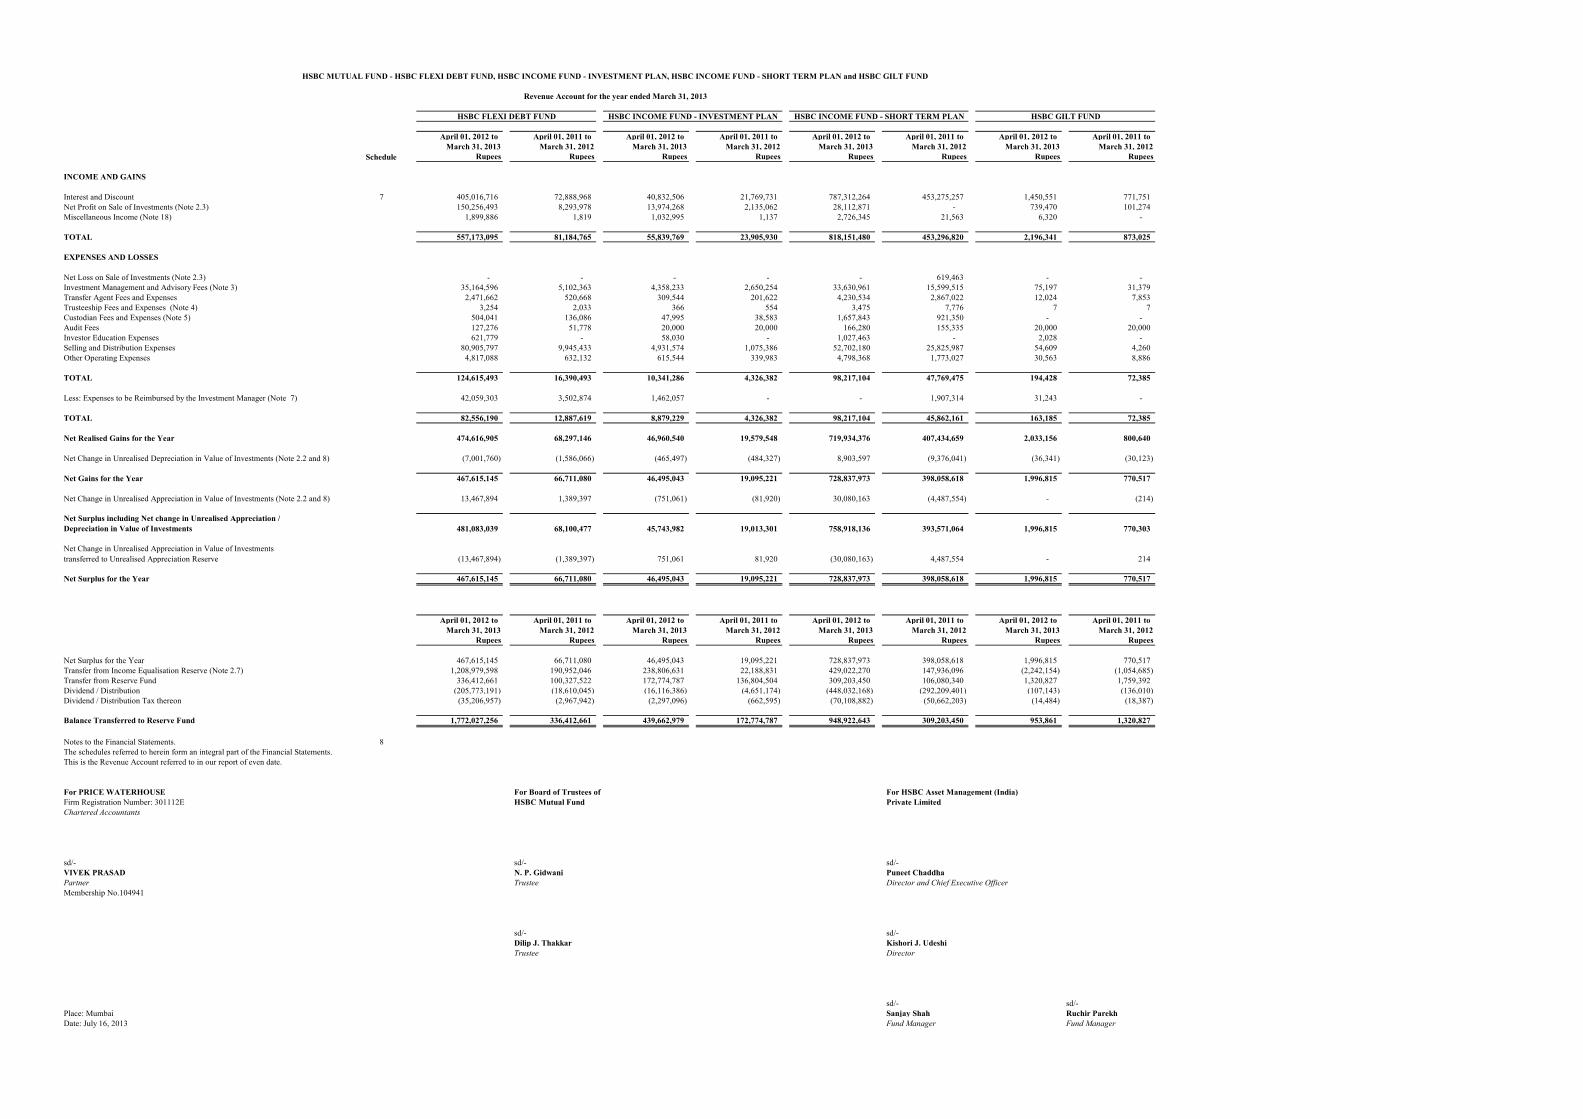
H48384 H27332 H27334 H31995
April 01, 2012 to April 01, 2011 to April 01, 2012 to April 01, 2011 to April 01, 2012 to April 01, 2011 to April 01, 2012 to April 01, 2011 toMarch 31, 2013 March 31, 2012 March 31, 2013 March 31, 2012 March 31, 2013 March 31, 2012 March 31, 2013 March 31, 2012
Schedule Rupees Rupees Rupees Rupees Rupees Rupees Rupees Rupees
INCOME AND GAINS
Interest and Discount 7 405,016,716 72,888,968 40,832,506 21,769,731 787,312,264 453,275,257 1,450,551 771,751 Net Profit on Sale of Investments (Note 2.3) 150,256,493 8,293,978 13,974,268 2,135,062 28,112,871 - 739,470 101,274 Miscellaneous Income (Note 18) 1,899,886 1,819 1,032,995 1,137 2,726,345 21,563 6,320 -
TOTAL 557,173,095 81,184,765 55,839,769 23,905,930 818,151,480 453,296,820 2,196,341 873,025
EXPENSES AND LOSSES
Net Loss on Sale of Investments (Note 2.3) - - - - - 619,463 - - Investment Management and Advisory Fees (Note 3) 35,164,596 5,102,363 4,358,233 2,650,254 33,630,961 15,599,515 75,197 31,379 Transfer Agent Fees and Expenses 2,471,662 520,668 309,544 201,622 4,230,534 2,867,022 12,024 7,853 Trusteeship Fees and Expenses (Note 4) 3,254 2,033 366 554 3,475 7,776 7 7 Custodian Fees and Expenses (Note 5) 504,041 136,086 47,995 38,583 1,657,843 921,350 - - Audit Fees 127,276 51,778 20,000 20,000 166,280 155,335 20,000 20,000 Investor Education Expenses 621,779 - 58,030 - 1,027,463 - 2,028 - Selling and Distribution Expenses 80,905,797 9,945,433 4,931,574 1,075,386 52,702,180 25,825,987 54,609 4,260 Other Operating Expenses 4,817,088 632,132 615,544 339,983 4,798,368 1,773,027 30,563 8,886
TOTAL 124,615,493 16,390,493 10,341,286 4,326,382 98,217,104 47,769,475 194,428 72,385
Less: Expenses to be Reimbursed by the Investment Manager (Note 7) 42,059,303 3,502,874 1,462,057 - - 1,907,314 31,243 -
TOTAL 82,556,190 12,887,619 8,879,229 4,326,382 98,217,104 45,862,161 163,185 72,385
Net Realised Gains for the Year 474,616,905 68,297,146 46,960,540 19,579,548 719,934,376 407,434,659 2,033,156 800,640
Net Change in Unrealised Depreciation in Value of Investments (Note 2.2 and 8) (7,001,760) (1,586,066) (465,497) (484,327) 8,903,597 (9,376,041) (36,341) (30,123)
Net Gains for the Year 467,615,145 66,711,080 46,495,043 19,095,221 728,837,973 398,058,618 1,996,815 770,517
Net Change in Unrealised Appreciation in Value of Investments (Note 2.2 and 8) 13,467,894 1,389,397 (751,061) (81,920) 30,080,163 (4,487,554) - (214)
Net Surplus including Net change in Unrealised Appreciation / Depreciation in Value of Investments 481,083,039 68,100,477 45,743,982 19,013,301 758,918,136 393,571,064 1,996,815 770,303
Net Change in Unrealised Appreciation in Value of Investments transferred to Unrealised Appreciation Reserve (13,467,894) (1,389,397) 751,061 81,920 (30,080,163) 4,487,554 - 214
Net Surplus for the Year 467,615,145 66,711,080 46,495,043 19,095,221 728,837,973 398,058,618 1,996,815 770,517
April 01, 2012 to April 01, 2011 to April 01, 2012 to April 01, 2011 to April 01, 2012 to April 01, 2011 to April 01, 2012 to April 01, 2011 toMarch 31, 2013 March 31, 2012 March 31, 2013 March 31, 2012 March 31, 2013 March 31, 2012 March 31, 2013 March 31, 2012
Rupees Rupees Rupees Rupees Rupees Rupees Rupees Rupees
Net Surplus for the Year 467,615,145 66,711,080 46,495,043 19,095,221 728,837,973 398,058,618 1,996,815 770,517 Transfer from Income Equalisation Reserve (Note 2.7) 1,208,979,598 190,952,046 238,806,631 22,188,831 429,022,270 147,936,096 (2,242,154) (1,054,685) Transfer from Reserve Fund 336,412,661 100,327,522 172,774,787 136,804,504 309,203,450 106,080,340 1,320,827 1,759,392 Dividend / Distribution (205,773,191) (18,610,045) (16,116,386) (4,651,174) (448,032,168) (292,209,401) (107,143) (136,010) Dividend / Distribution Tax thereon (35,206,957) (2,967,942) (2,297,096) (662,595) (70,108,882) (50,662,203) (14,484) (18,387)
Balance Transferred to Reserve Fund 1,772,027,256 336,412,661 439,662,979 172,774,787 948,922,643 309,203,450 953,861 1,320,827
Notes to the Financial Statements. 8The schedules referred to herein form an integral part of the Financial Statements.This is the Revenue Account referred to in our report of even date.
For PRICE WATERHOUSE For Board of Trustees of For HSBC Asset Management (India)Firm Registration Number: 301112E HSBC Mutual Fund Private LimitedChartered Accountants
sd/- sd/- sd/-VIVEK PRASAD N. P. Gidwani Puneet ChaddhaPartner Trustee Director and Chief Executive OfficerMembership No.104941
sd/- sd/-Dilip J. Thakkar Kishori J. UdeshiTrustee Director
sd/- sd/-Place: Mumbai Sanjay Shah Ruchir ParekhDate: July 16, 2013 Fund Manager Fund Manager
HSBC MUTUAL FUND - HSBC FLEXI DEBT FUND, HSBC INCOME FUND - INVESTMENT PLAN, HSBC INCOME FUND - SHORT TERM PLAN and HSBC GILT FUND
Revenue Account for the year ended March 31, 2013
HSBC GILT FUNDHSBC FLEXI DEBT FUND HSBC INCOME FUND - INVESTMENT PLAN HSBC INCOME FUND - SHORT TERM PLAN

SCHEDULE 1Investments Market/Fair Value Cost Market/Fair Value Cost Market/Fair Value Cost Market/Fair Value Cost Market/Fair Value Cost Market/Fair Value Cost Market Value Cost Market Value Cost (Notes 2.2, 2.3, 5A, 8, 9, 10, 11 and 15) Rupees Rupees Rupees Rupees Rupees Rupees Rupees Rupees Rupees Rupees Rupees Rupees Rupees Rupees Rupees Rupees (Refer to the attached Statement of Portfolio Holding as at March 31, 2013)
Non Convertible Debentures and Bonds Listed / Awaiting Listing 3,341,653,270 3,329,283,834 477,150,298 477,838,520 426,057,016 425,016,866 140,852,156 141,084,350 5,184,927,860 5,156,844,348 2,214,945,929 2,218,596,950 - - - -
Privately Placed Non Convertible Debentures / Bonds - - 99,781,473 100,000,000 - - 19,956,295 20,000,000 283,496,301 281,499,650 179,606,652 180,000,000 - - - -
Asset Backed Securities - - - - 2,819,596 2,964,060 4,008,912 4,318,135 - - - - - - - -
Commercial Paper / Certificate of Deposit 2,516,124,243 2,512,804,580 916,155,155 913,933,950 183,816,745 183,703,231 120,474,343 120,071,740 4,578,993,084 4,579,467,027 2,334,919,812 2,340,252,983 - - - -
Government of India Securities 1,444,411,200 1,453,008,907 60,096,150 60,785,348 216,456,960 217,746,071 28,776,556 29,159,512 - - - - 11,640,700 11,707,164 2,027,800 2,057,923
TOTAL 7,302,188,713 7,295,097,321 1,553,183,076 1,552,557,818 829,150,317 829,430,229 314,068,262 314,633,737 10,047,417,245 10,017,811,025 4,729,472,393 4,738,849,933 11,640,700 11,707,164 2,027,800 2,057,923
SCHEDULE 2 March 31, 2013 March 31, 2012 March 31, 2013 March 31, 2012 March 31, 2013 March 31, 2012 March 31, 2013 March 31, 2012Deposits Rupees Rupees Rupees Rupees Rupees Rupees Rupees Rupees
Margin Deposit with Clearing Corporation of India Limited towards Collateralised Borrowing and
Lending Obligation - - - - - 5,278,001 - -
Margin Deposit with Clearing Corporation of India Limited towards Reverse Repos and Government
Securities - - 959,616 - 1,245,423 20,069,295 - -
TOTAL - - 959,616 - 1,245,423 25,347,296 - -
SCHEDULE 3 March 31, 2013 March 31, 2012 March 31, 2013 March 31, 2012 March 31, 2013 March 31, 2012 March 31, 2013 March 31, 2012Other Current Assets Rupees Rupees Rupees Rupees Rupees Rupees Rupees Rupees
Balances with Banks
- in Current Account 132,629,057 6,580,565 13,255,997 2,716,992 6,455,476 1,228,114 54,410 130,497
- in Dividend Account 17,393 26 83,914 73,703 907 891 7,396 7,396
Reverse Repos 128,383,769 - 9,559,344 - 69,797,325 - 6,302,720 -
Collateralised Borrowing and Lending Obligation 123,755,370 28,831,471 6,287,403 4,927,650 21,098,385 157,262,760 1,905,228 7,995,297
Unit Subscription Receivable - 850,000 - - - 400,000 - -
Inter-Scheme Receivable
- For 'Switch-In' 198,733 683,913 - - 18,801 502,386 - -
- For 'Others' - - 500,000 - 100,000 1,470 - -
Receivable on Outstanding Equity Future Contracts - - - - - - - -
Interest Receivable on : - -
- Debentures and Bonds 95,846,558 14,779,221 7,124,647 6,541,890 265,259,342 84,320,789 - -
- Certificate of Deposit - - - - - - - -
- Government of India Securities 16,902,750 1,520,299 3,251,293 910,230 - - 169,789 68,872
- Deposits 31,757 300,076 - 40,658 14,591 330,503 - -
- Reverse Repos 208,060 - 15,492 - 113,114 - 10,214 -
- Collateralised Borrowing and Lending Obligation 83,645 10,357 5,006 3,177 26,360 60,030 2,380 5,155
Receivable from Investment Manager 42,059,731 3,502,874 1,462,122 - 3,647 1,955,658 7 -
Investment Towards Unclaimed Redemption (Note 16) - - 258,386 226,083 - - - -
Investment Towards Unclaimed Dividend (Note 16) - - 364,495 282,147 56,523 56,523 - -
TOTAL 895,487,688 103,986,012 99,234,953 43,994,626 362,944,471 246,119,124 11,046,092 10,283,282
HSBC INCOME FUND - SHORT TERM PLAN HSBC GILT FUND
HSBC MUTUAL FUND - HSBC FLEXI DEBT FUND, HSBC INCOME FUND - INVESTMENT PLAN, HSBC INCOME FUND - SHORT TERM PLAN and HSBC GILT FUND
Schedules forming part of the Balance Sheet as at March 31, 2013and the Revenue Account for the year ended March 31, 2013
HSBC FLEXI DEBT FUND HSBC INCOME FUND - INVESTMENT PLAN
March 31, 2012 March 31, 2013 March 31, 2012March 31, 2013 March 31, 2012 March 31, 2013 March 31, 2012 March 31, 2013
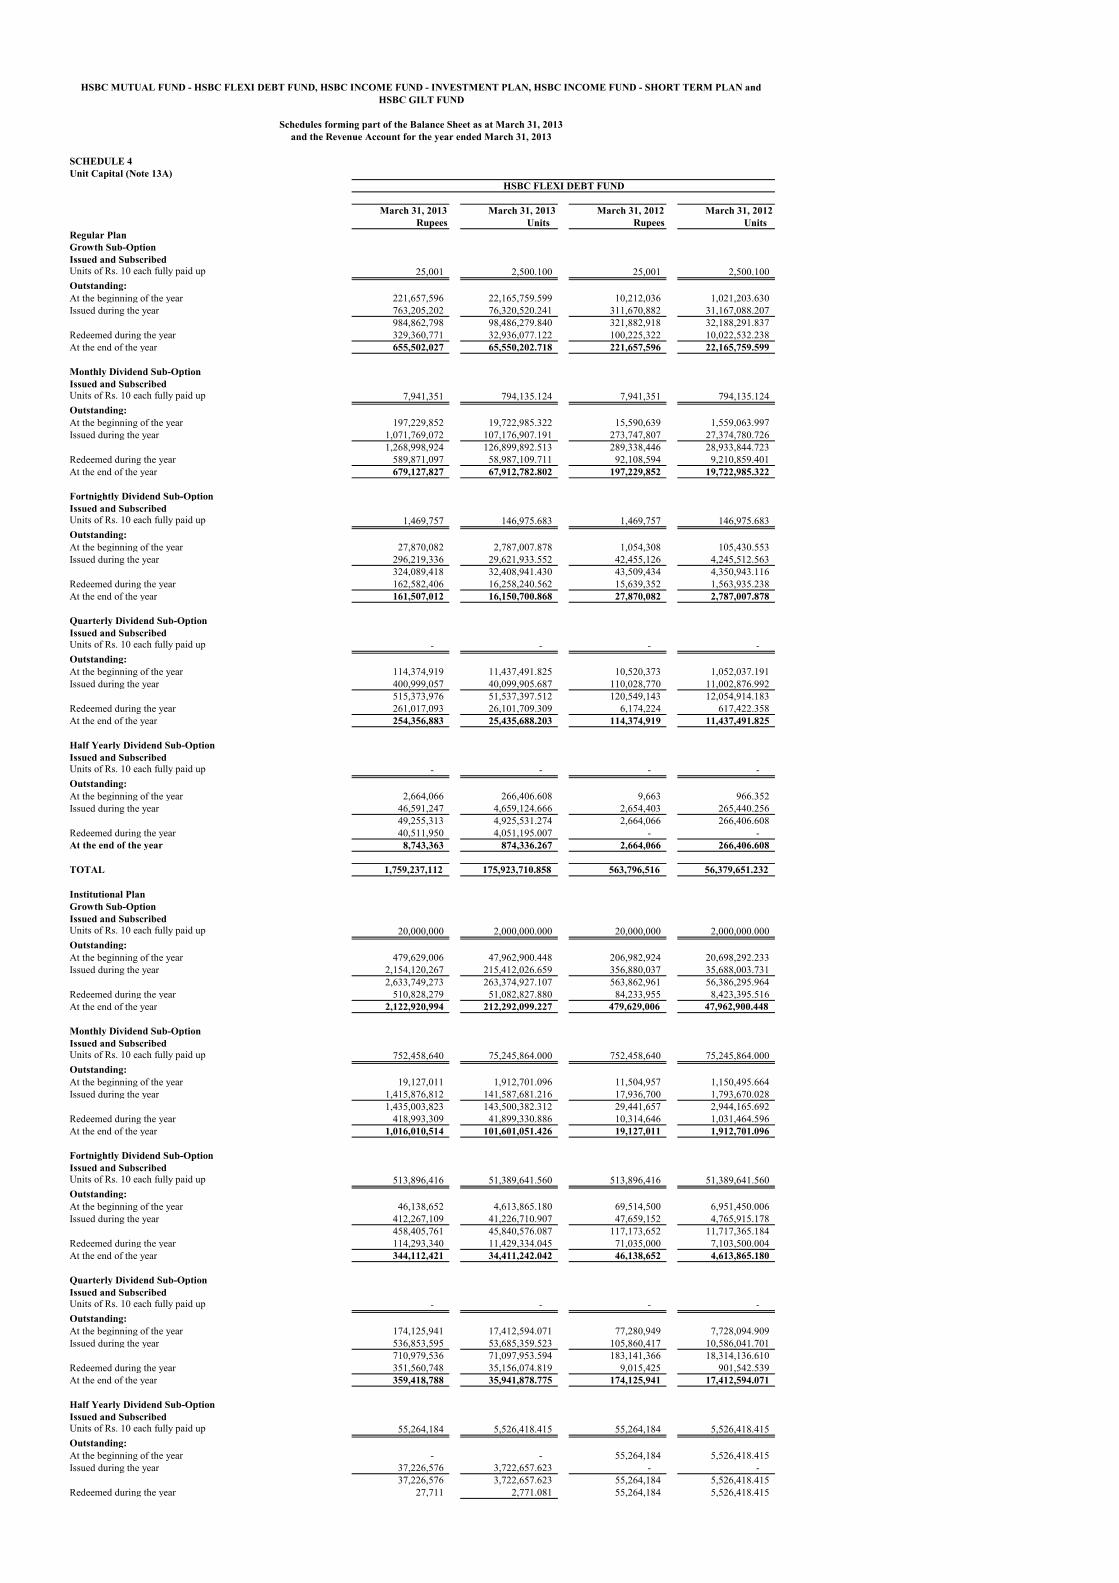
SCHEDULE 4Unit Capital (Note 13A)
March 31, 2013 March 31, 2013 March 31, 2012 March 31, 2012 Rupees Units Rupees Units
Growth Sub-Option Issued and SubscribedUnits of Rs. 10 each fully paid up 25,001 2,500.100 25,001 2,500.100 Outstanding:At the beginning of the year 221,657,596 22,165,759.599 10,212,036 1,021,203.630 Issued during the year 763,205,202 76,320,520.241 311,670,882 31,167,088.207
984,862,798 98,486,279.840 321,882,918 32,188,291.837 Redeemed during the year 329,360,771 32,936,077.122 100,225,322 10,022,532.238 At the end of the year 655,502,027 65,550,202.718 221,657,596 22,165,759.599
Monthly Dividend Sub-OptionIssued and SubscribedUnits of Rs. 10 each fully paid up 7,941,351 794,135.124 7,941,351 794,135.124 Outstanding:At the beginning of the year 197,229,852 19,722,985.322 15,590,639 1,559,063.997 Issued during the year 1,071,769,072 107,176,907.191 273,747,807 27,374,780.726
1,268,998,924 126,899,892.513 289,338,446 28,933,844.723 Redeemed during the year 589,871,097 58,987,109.711 92,108,594 9,210,859.401 At the end of the year 679,127,827 67,912,782.802 197,229,852 19,722,985.322
Fortnightly Dividend Sub-OptionIssued and SubscribedUnits of Rs. 10 each fully paid up 1,469,757 146,975.683 1,469,757 146,975.683 Outstanding:At the beginning of the year 27,870,082 2,787,007.878 1,054,308 105,430.553 Issued during the year 296,219,336 29,621,933.552 42,455,126 4,245,512.563
324,089,418 32,408,941.430 43,509,434 4,350,943.116 Redeemed during the year 162,582,406 16,258,240.562 15,639,352 1,563,935.238 At the end of the year 161,507,012 16,150,700.868 27,870,082 2,787,007.878
Quarterly Dividend Sub-OptionIssued and SubscribedUnits of Rs. 10 each fully paid up - - - - Outstanding:At the beginning of the year 114,374,919 11,437,491.825 10,520,373 1,052,037.191 Issued during the year 400,999,057 40,099,905.687 110,028,770 11,002,876.992
515,373,976 51,537,397.512 120,549,143 12,054,914.183 Redeemed during the year 261,017,093 26,101,709.309 6,174,224 617,422.358 At the end of the year 254,356,883 25,435,688.203 114,374,919 11,437,491.825
Half Yearly Dividend Sub-OptionIssued and SubscribedUnits of Rs. 10 each fully paid up - - - - Outstanding:At the beginning of the year 2,664,066 266,406.608 9,663 966.352 Issued during the year 46,591,247 4,659,124.666 2,654,403 265,440.256
49,255,313 4,925,531.274 2,664,066 266,406.608 Redeemed during the year 40,511,950 4,051,195.007 - - At the end of the year 8,743,363 874,336.267 2,664,066 266,406.608
TOTAL 1,759,237,112 175,923,710.858 563,796,516 56,379,651.232
Institutional PlanGrowth Sub-Option Issued and SubscribedUnits of Rs. 10 each fully paid up 20,000,000 2,000,000.000 20,000,000 2,000,000.000 Outstanding:At the beginning of the year 479,629,006 47,962,900.448 206,982,924 20,698,292.233 Issued during the year 2,154,120,267 215,412,026.659 356,880,037 35,688,003.731
2,633,749,273 263,374,927.107 563,862,961 56,386,295.964 Redeemed during the year 510,828,279 51,082,827.880 84,233,955 8,423,395.516 At the end of the year 2,122,920,994 212,292,099.227 479,629,006 47,962,900.448
Monthly Dividend Sub-OptionIssued and SubscribedUnits of Rs. 10 each fully paid up 752,458,640 75,245,864.000 752,458,640 75,245,864.000 Outstanding:At the beginning of the year 19,127,011 1,912,701.096 11,504,957 1,150,495.664 Issued during the year 1,415,876,812 141,587,681.216 17,936,700 1,793,670.028
1,435,003,823 143,500,382.312 29,441,657 2,944,165.692 Redeemed during the year 418,993,309 41,899,330.886 10,314,646 1,031,464.596 At the end of the year 1,016,010,514 101,601,051.426 19,127,011 1,912,701.096
Fortnightly Dividend Sub-OptionIssued and SubscribedUnits of Rs. 10 each fully paid up 513,896,416 51,389,641.560 513,896,416 51,389,641.560 Outstanding:At the beginning of the year 46,138,652 4,613,865.180 69,514,500 6,951,450.006 Issued during the year 412,267,109 41,226,710.907 47,659,152 4,765,915.178
458,405,761 45,840,576.087 117,173,652 11,717,365.184 Redeemed during the year 114,293,340 11,429,334.045 71,035,000 7,103,500.004 At the end of the year 344,112,421 34,411,242.042 46,138,652 4,613,865.180
Quarterly Dividend Sub-OptionIssued and SubscribedUnits of Rs. 10 each fully paid up - - - - Outstanding:At the beginning of the year 174,125,941 17,412,594.071 77,280,949 7,728,094.909 Issued during the year 536,853,595 53,685,359.523 105,860,417 10,586,041.701
710,979,536 71,097,953.594 183,141,366 18,314,136.610 Redeemed during the year 351,560,748 35,156,074.819 9,015,425 901,542.539 At the end of the year 359,418,788 35,941,878.775 174,125,941 17,412,594.071
Half Yearly Dividend Sub-OptionIssued and SubscribedUnits of Rs. 10 each fully paid up 55,264,184 5,526,418.415 55,264,184 5,526,418.415 Outstanding:At the beginning of the year - - 55,264,184 5,526,418.415 Issued during the year 37,226,576 3,722,657.623 - -
37,226,576 3,722,657.623 55,264,184 5,526,418.415 Redeemed during the year 27,711 2,771.081 55,264,184 5,526,418.415
HSBC MUTUAL FUND - HSBC FLEXI DEBT FUND, HSBC INCOME FUND - INVESTMENT PLAN, HSBC INCOME FUND - SHORT TERM PLAN and HSBC GILT FUND
Schedules forming part of the Balance Sheet as at March 31, 2013and the Revenue Account for the year ended March 31, 2013
Regular Plan
HSBC FLEXI DEBT FUND

SCHEDULE 4Unit Capital (Note 13A)
HSBC MUTUAL FUND - HSBC FLEXI DEBT FUND, HSBC INCOME FUND - INVESTMENT PLAN, HSBC INCOME FUND - SHORT TERM PLAN and HSBC GILT FUND
Schedules forming part of the Balance Sheet as at March 31, 2013and the Revenue Account for the year ended March 31, 2013
At the end of the year 37,198,865 3,719,886.542 - -
TOTAL 3,879,661,582 387,966,158.012 719,020,610 71,902,060.795
March 31, 2013 March 31, 2013 March 31, 2012 March 31, 2012 Rupees Units Rupees Units
Growth Sub-Option Issued and SubscribedUnits of Rs. 10 each fully paid up - - Outstanding:Initial Issue and Subscription - - At the beginning of the year - - Issued during the year 222,308,983 22,230,898.287
222,308,983 22,230,898.287 Redeemed during the year - - At the end of the year 222,308,983 22,230,898.287
Fortnightly Dividend Sub-OptionIssued and SubscribedUnits of Rs. 10 each fully paid up - - Outstanding:Initial Issue and Subscription - - At the beginning of the year - - Issued during the year 1,547,531 154,753.120
1,547,531 154,753.120 Redeemed during the year - - At the end of the year 1,547,531 154,753.120
Monthly Dividend Sub-OptionIssued and SubscribedUnits of Rs. 10 each fully paid up - - Outstanding:Initial Issue and Subscription - - At the beginning of the year - - Issued during the year 1,082,289 108,228.854
1,082,289 108,228.854 Redeemed during the year - - At the end of the year 1,082,289 108,228.854
Quarterly Dividend Sub-OptionIssued and SubscribedUnits of Rs. 10 each fully paid upOutstanding:At the beginning of the year - - Issued during the year 85,451 8,545.110
85,451 8,545.110 Redeemed during the year - - At the end of the year 85,451 8,545.110
Half Yearly Dividend Sub-OptionIssued and SubscribedUnits of Rs. 10 each fully paid up - - Outstanding:Initial Issue and Subscription - - At the beginning of the year - - Issued during the year 124,799 12,479.863
124,799 12,479.863 Redeemed during the year - - At the end of the year 124,799 12,479.863
TOTAL 225,149,053 22,514,905.234
TOTAL 5,864,047,747 586,404,774.104 1,282,817,125 128,281,712.027
March 31, 2013 March 31, 2013 March 31, 2012 March 31, 2012 Rupees Units Rupees Units
Growth Sub-Option Issued and SubscribedUnits of Rs. 10 each fully paid up 1,964,242,544 196,424,254.400 1,964,242,544 196,424,254.400 Outstanding:At the beginning of the year 112,891,776 11,289,177.633 96,597,767 9,659,776.707 Issued during the year 281,078,727 28,107,872.695 32,298,187 3,229,818.718
393,970,503 39,397,050.328 128,895,954 12,889,595.425 Redeemed during the year 63,617,927 6,361,792.710 16,004,178 1,600,417.792 At the end of the year 330,352,576 33,035,257.618 112,891,776 11,289,177.633
Quarterly Dividend Sub-OptionIssued and SubscribedUnits of Rs. 10 each fully paid up 108,128,820 10,812,882.000 108,128,820 10,812,882.000 Outstanding:At the beginning of the year 125,117,119 12,511,711.693 44,462,715 4,446,271.358 Issued during the year 322,464,315 32,246,431.523 104,693,421 10,469,342.072
447,581,434 44,758,143.216 149,156,136 14,915,613.430 Redeemed during the year 253,639,606 25,363,960.559 24,039,017 2,403,901.737 At the end of the year 193,941,828 19,394,182.657 125,117,119 12,511,711.693
TOTAL 524,294,404 52,429,440.275 238,008,895 23,800,889.326
Issued and SubscribedUnits of Rs. 10 each fully paid up - - Outstanding:At the beginning of the year - - Issued during the year 2,709,646 270,964.576
2,709,646 270,964.576 Redeemed during the year - - At the end of the year 2,709,646 270,964.576
HSBC INCOME FUND - INVESTMENT PLAN
Regular Plan
Growth Sub-Option
HSBC FLEXI DEBT FUND
Direct Plan
Direct Plan
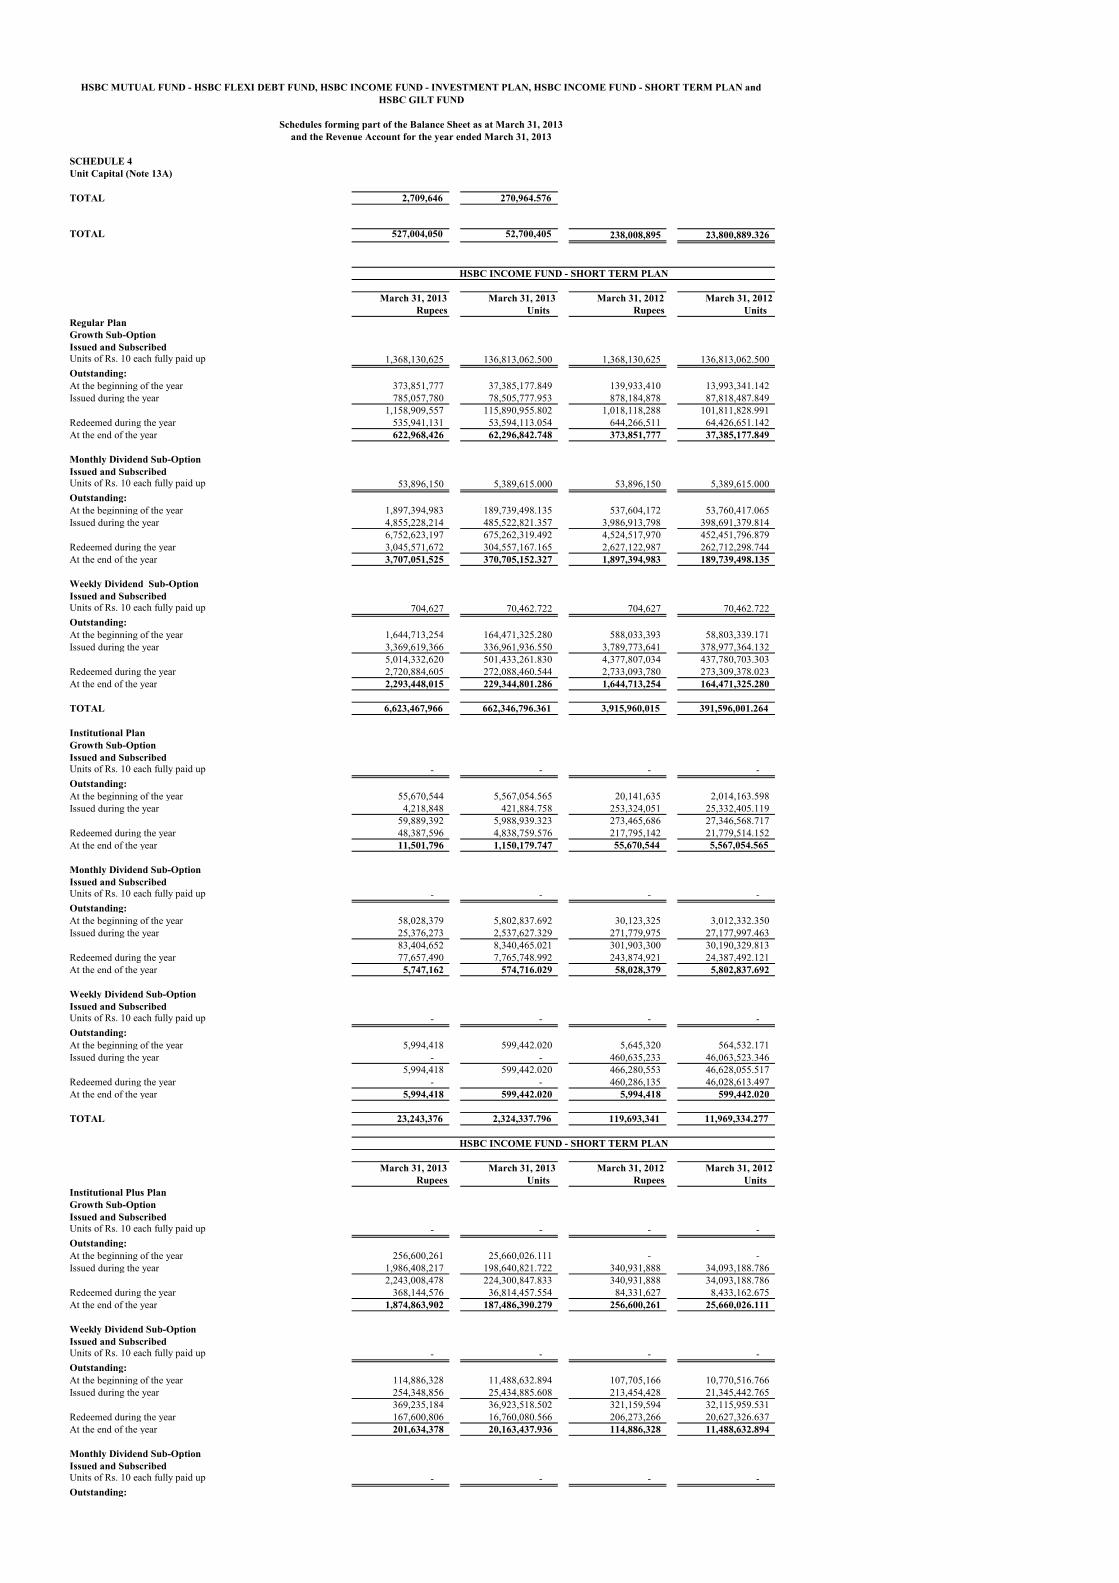
SCHEDULE 4Unit Capital (Note 13A)
HSBC MUTUAL FUND - HSBC FLEXI DEBT FUND, HSBC INCOME FUND - INVESTMENT PLAN, HSBC INCOME FUND - SHORT TERM PLAN and HSBC GILT FUND
Schedules forming part of the Balance Sheet as at March 31, 2013and the Revenue Account for the year ended March 31, 2013
TOTAL 2,709,646 270,964.576
TOTAL 527,004,050 52,700,405 238,008,895 23,800,889.326
March 31, 2013 March 31, 2013 March 31, 2012 March 31, 2012 Rupees Units Rupees Units
Growth Sub-Option Issued and SubscribedUnits of Rs. 10 each fully paid up 1,368,130,625 136,813,062.500 1,368,130,625 136,813,062.500 Outstanding:At the beginning of the year 373,851,777 37,385,177.849 139,933,410 13,993,341.142 Issued during the year 785,057,780 78,505,777.953 878,184,878 87,818,487.849
1,158,909,557 115,890,955.802 1,018,118,288 101,811,828.991 Redeemed during the year 535,941,131 53,594,113.054 644,266,511 64,426,651.142 At the end of the year 622,968,426 62,296,842.748 373,851,777 37,385,177.849
Monthly Dividend Sub-OptionIssued and SubscribedUnits of Rs. 10 each fully paid up 53,896,150 5,389,615.000 53,896,150 5,389,615.000 Outstanding:At the beginning of the year 1,897,394,983 189,739,498.135 537,604,172 53,760,417.065 Issued during the year 4,855,228,214 485,522,821.357 3,986,913,798 398,691,379.814
6,752,623,197 675,262,319.492 4,524,517,970 452,451,796.879 Redeemed during the year 3,045,571,672 304,557,167.165 2,627,122,987 262,712,298.744 At the end of the year 3,707,051,525 370,705,152.327 1,897,394,983 189,739,498.135
Weekly Dividend Sub-OptionIssued and SubscribedUnits of Rs. 10 each fully paid up 704,627 70,462.722 704,627 70,462.722 Outstanding:At the beginning of the year 1,644,713,254 164,471,325.280 588,033,393 58,803,339.171 Issued during the year 3,369,619,366 336,961,936.550 3,789,773,641 378,977,364.132
5,014,332,620 501,433,261.830 4,377,807,034 437,780,703.303 Redeemed during the year 2,720,884,605 272,088,460.544 2,733,093,780 273,309,378.023 At the end of the year 2,293,448,015 229,344,801.286 1,644,713,254 164,471,325.280
TOTAL 6,623,467,966 662,346,796.361 3,915,960,015 391,596,001.264
Institutional PlanGrowth Sub-Option Issued and SubscribedUnits of Rs. 10 each fully paid up - - - - Outstanding:At the beginning of the year 55,670,544 5,567,054.565 20,141,635 2,014,163.598 Issued during the year 4,218,848 421,884.758 253,324,051 25,332,405.119
59,889,392 5,988,939.323 273,465,686 27,346,568.717 Redeemed during the year 48,387,596 4,838,759.576 217,795,142 21,779,514.152 At the end of the year 11,501,796 1,150,179.747 55,670,544 5,567,054.565
Monthly Dividend Sub-OptionIssued and SubscribedUnits of Rs. 10 each fully paid up - - - - Outstanding:At the beginning of the year 58,028,379 5,802,837.692 30,123,325 3,012,332.350 Issued during the year 25,376,273 2,537,627.329 271,779,975 27,177,997.463
83,404,652 8,340,465.021 301,903,300 30,190,329.813 Redeemed during the year 77,657,490 7,765,748.992 243,874,921 24,387,492.121 At the end of the year 5,747,162 574,716.029 58,028,379 5,802,837.692
Weekly Dividend Sub-OptionIssued and SubscribedUnits of Rs. 10 each fully paid up - - - - Outstanding:At the beginning of the year 5,994,418 599,442.020 5,645,320 564,532.171 Issued during the year - - 460,635,233 46,063,523.346
5,994,418 599,442.020 466,280,553 46,628,055.517 Redeemed during the year - - 460,286,135 46,028,613.497 At the end of the year 5,994,418 599,442.020 5,994,418 599,442.020
TOTAL 23,243,376 2,324,337.796 119,693,341 11,969,334.277
March 31, 2013 March 31, 2013 March 31, 2012 March 31, 2012 Rupees Units Rupees Units
Institutional Plus PlanGrowth Sub-Option Issued and SubscribedUnits of Rs. 10 each fully paid up - - - - Outstanding:At the beginning of the year 256,600,261 25,660,026.111 - - Issued during the year 1,986,408,217 198,640,821.722 340,931,888 34,093,188.786
2,243,008,478 224,300,847.833 340,931,888 34,093,188.786 Redeemed during the year 368,144,576 36,814,457.554 84,331,627 8,433,162.675 At the end of the year 1,874,863,902 187,486,390.279 256,600,261 25,660,026.111
Weekly Dividend Sub-Option Issued and SubscribedUnits of Rs. 10 each fully paid up - - - - Outstanding:At the beginning of the year 114,886,328 11,488,632.894 107,705,166 10,770,516.766 Issued during the year 254,348,856 25,434,885.608 213,454,428 21,345,442.765
369,235,184 36,923,518.502 321,159,594 32,115,959.531 Redeemed during the year 167,600,806 16,760,080.566 206,273,266 20,627,326.637 At the end of the year 201,634,378 20,163,437.936 114,886,328 11,488,632.894
Monthly Dividend Sub-Option Issued and SubscribedUnits of Rs. 10 each fully paid up - - - - Outstanding:
HSBC INCOME FUND - SHORT TERM PLAN
Regular Plan
HSBC INCOME FUND - SHORT TERM PLAN
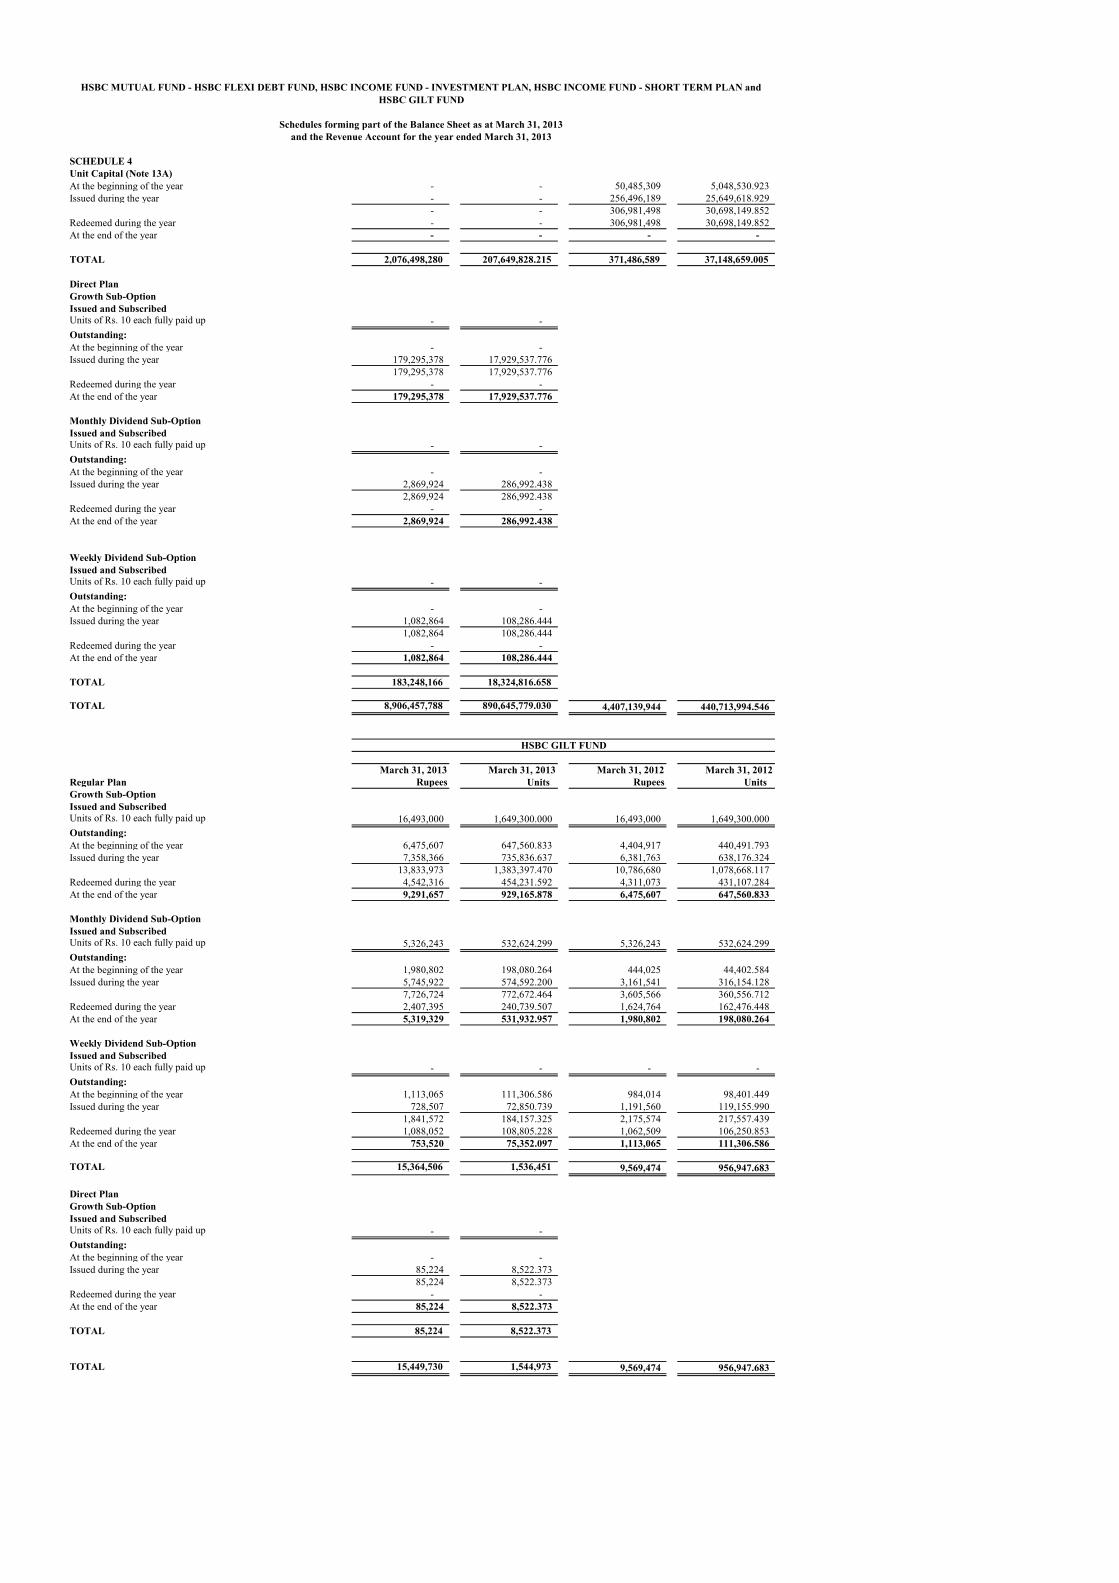
SCHEDULE 4Unit Capital (Note 13A)
HSBC MUTUAL FUND - HSBC FLEXI DEBT FUND, HSBC INCOME FUND - INVESTMENT PLAN, HSBC INCOME FUND - SHORT TERM PLAN and HSBC GILT FUND
Schedules forming part of the Balance Sheet as at March 31, 2013and the Revenue Account for the year ended March 31, 2013
At the beginning of the year - - 50,485,309 5,048,530.923 Issued during the year - - 256,496,189 25,649,618.929
- - 306,981,498 30,698,149.852 Redeemed during the year - - 306,981,498 30,698,149.852 At the end of the year - - - -
TOTAL 2,076,498,280 207,649,828.215 371,486,589 37,148,659.005
Direct PlanGrowth Sub-Option Issued and SubscribedUnits of Rs. 10 each fully paid up - - Outstanding:At the beginning of the year - - Issued during the year 179,295,378 17,929,537.776
179,295,378 17,929,537.776 Redeemed during the year - - At the end of the year 179,295,378 17,929,537.776
Monthly Dividend Sub-Option Issued and SubscribedUnits of Rs. 10 each fully paid up - - Outstanding:At the beginning of the year - - Issued during the year 2,869,924 286,992.438
2,869,924 286,992.438 Redeemed during the year - - At the end of the year 2,869,924 286,992.438
Weekly Dividend Sub-Option Issued and SubscribedUnits of Rs. 10 each fully paid up - - Outstanding:At the beginning of the year - - Issued during the year 1,082,864 108,286.444
1,082,864 108,286.444 Redeemed during the year - - At the end of the year 1,082,864 108,286.444
TOTAL 183,248,166 18,324,816.658
TOTAL 8,906,457,788 890,645,779.030 4,407,139,944 440,713,994.546
March 31, 2013 March 31, 2013 March 31, 2012 March 31, 2012Regular Plan Rupees Units Rupees Units Growth Sub-Option Issued and SubscribedUnits of Rs. 10 each fully paid up 16,493,000 1,649,300.000 16,493,000 1,649,300.000 Outstanding:At the beginning of the year 6,475,607 647,560.833 4,404,917 440,491.793 Issued during the year 7,358,366 735,836.637 6,381,763 638,176.324
13,833,973 1,383,397.470 10,786,680 1,078,668.117 Redeemed during the year 4,542,316 454,231.592 4,311,073 431,107.284 At the end of the year 9,291,657 929,165.878 6,475,607 647,560.833
Monthly Dividend Sub-OptionIssued and SubscribedUnits of Rs. 10 each fully paid up 5,326,243 532,624.299 5,326,243 532,624.299 Outstanding:At the beginning of the year 1,980,802 198,080.264 444,025 44,402.584 Issued during the year 5,745,922 574,592.200 3,161,541 316,154.128
7,726,724 772,672.464 3,605,566 360,556.712 Redeemed during the year 2,407,395 240,739.507 1,624,764 162,476.448 At the end of the year 5,319,329 531,932.957 1,980,802 198,080.264
Weekly Dividend Sub-OptionIssued and SubscribedUnits of Rs. 10 each fully paid up - - - - Outstanding:At the beginning of the year 1,113,065 111,306.586 984,014 98,401.449 Issued during the year 728,507 72,850.739 1,191,560 119,155.990
1,841,572 184,157.325 2,175,574 217,557.439 Redeemed during the year 1,088,052 108,805.228 1,062,509 106,250.853 At the end of the year 753,520 75,352.097 1,113,065 111,306.586
TOTAL 15,364,506 1,536,451 9,569,474 956,947.683
Direct PlanGrowth Sub-Option Issued and SubscribedUnits of Rs. 10 each fully paid up - - Outstanding:At the beginning of the year - - Issued during the year 85,224 8,522.373
85,224 8,522.373 Redeemed during the year - - At the end of the year 85,224 8,522.373
TOTAL 85,224 8,522.373
TOTAL 15,449,730 1,544,973 9,569,474 956,947.683
HSBC GILT FUND
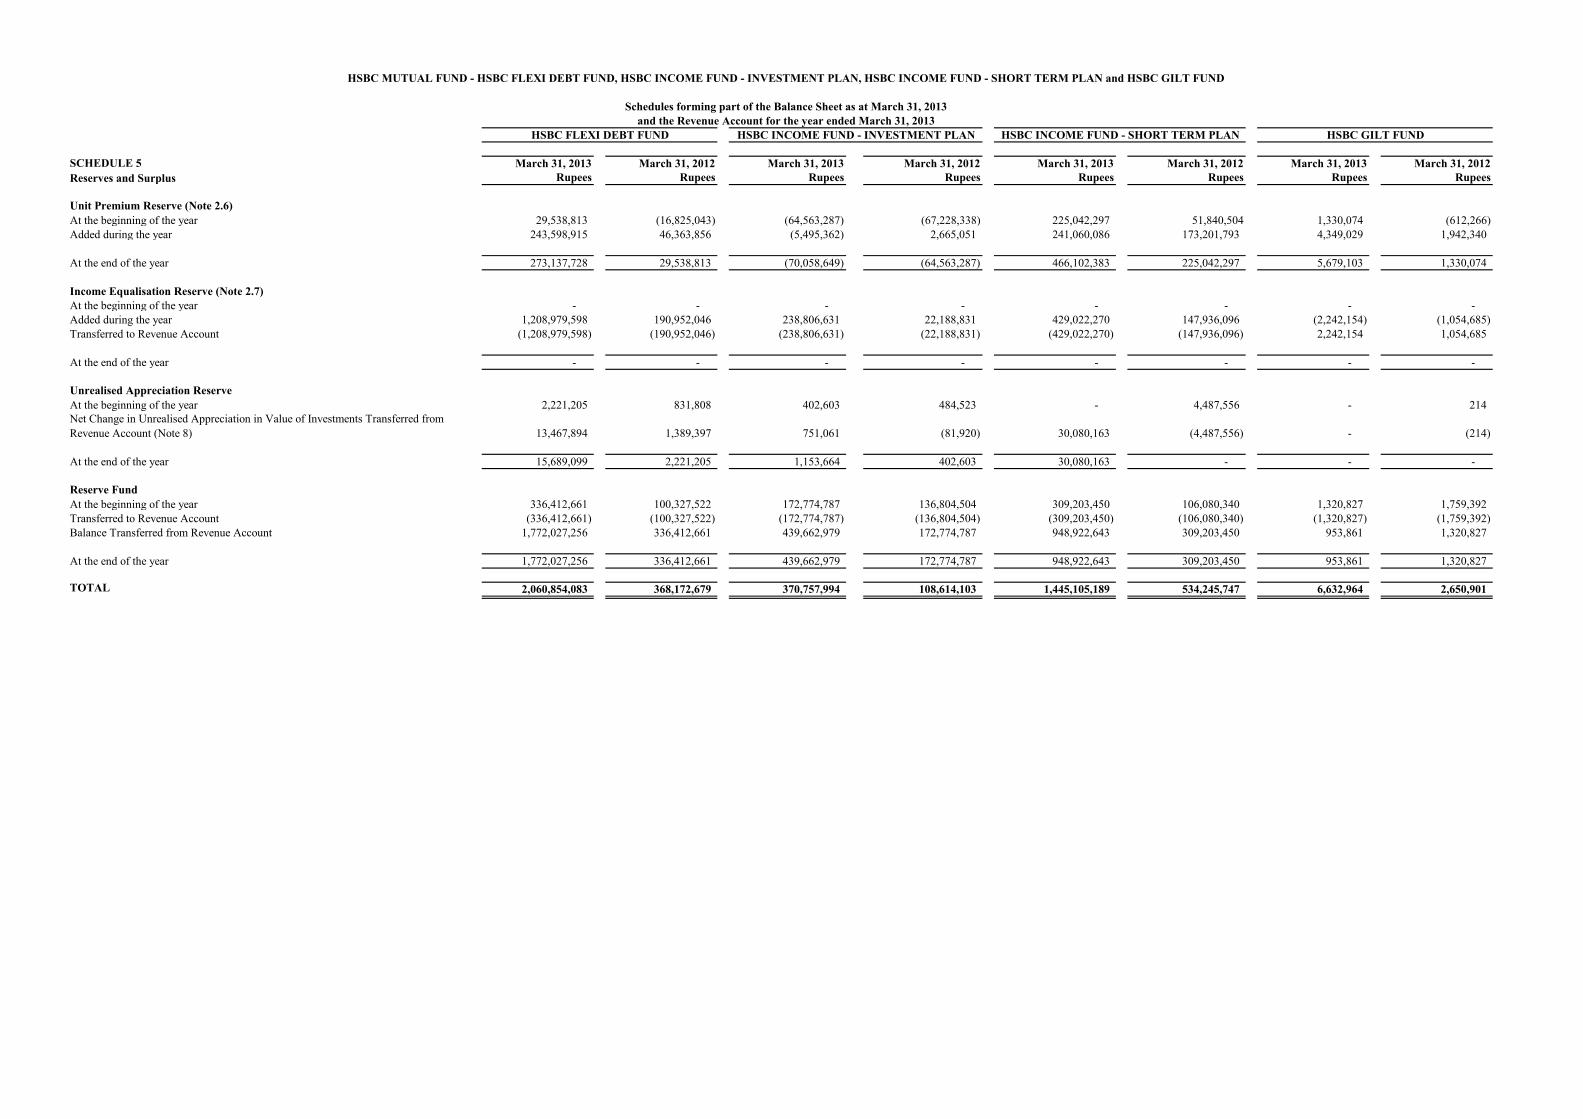
SCHEDULE 5 March 31, 2013 March 31, 2012 March 31, 2013 March 31, 2012 March 31, 2013 March 31, 2012 March 31, 2013 March 31, 2012Reserves and Surplus Rupees Rupees Rupees Rupees Rupees Rupees Rupees Rupees
Unit Premium Reserve (Note 2.6)At the beginning of the year 29,538,813 (16,825,043) (64,563,287) (67,228,338) 225,042,297 51,840,504 1,330,074 (612,266)Added during the year 243,598,915 46,363,856 (5,495,362) 2,665,051 241,060,086 173,201,793 4,349,029 1,942,340
At the end of the year 273,137,728 29,538,813 (70,058,649) (64,563,287) 466,102,383 225,042,297 5,679,103 1,330,074
Income Equalisation Reserve (Note 2.7)At the beginning of the year - - - - - - - - Added during the year 1,208,979,598 190,952,046 238,806,631 22,188,831 429,022,270 147,936,096 (2,242,154) (1,054,685) Transferred to Revenue Account (1,208,979,598) (190,952,046) (238,806,631) (22,188,831) (429,022,270) (147,936,096) 2,242,154 1,054,685
At the end of the year - - - - - - - -
Unrealised Appreciation ReserveAt the beginning of the year 2,221,205 831,808 402,603 484,523 - 4,487,556 - 214 Net Change in Unrealised Appreciation in Value of Investments Transferred from Revenue Account (Note 8) 13,467,894 1,389,397 751,061 (81,920) 30,080,163 (4,487,556) - (214)
At the end of the year 15,689,099 2,221,205 1,153,664 402,603 30,080,163 - - -
Reserve FundAt the beginning of the year 336,412,661 100,327,522 172,774,787 136,804,504 309,203,450 106,080,340 1,320,827 1,759,392 Transferred to Revenue Account (336,412,661) (100,327,522) (172,774,787) (136,804,504) (309,203,450) (106,080,340) (1,320,827) (1,759,392) Balance Transferred from Revenue Account 1,772,027,256 336,412,661 439,662,979 172,774,787 948,922,643 309,203,450 953,861 1,320,827
At the end of the year 1,772,027,256 336,412,661 439,662,979 172,774,787 948,922,643 309,203,450 953,861 1,320,827
TOTAL 2,060,854,083 * 368,172,679 * 370,757,994 * 108,614,103 * 1,445,105,189 * 534,245,747 * 6,632,964 * 2,650,901 *
HSBC MUTUAL FUND - HSBC FLEXI DEBT FUND, HSBC INCOME FUND - INVESTMENT PLAN, HSBC INCOME FUND - SHORT TERM PLAN and HSBC GILT FUND
Schedules forming part of the Balance Sheet as at March 31, 2013and the Revenue Account for the year ended March 31, 2013
HSBC INCOME FUND - SHORT TERM PLAN HSBC GILT FUNDHSBC FLEXI DEBT FUND HSBC INCOME FUND - INVESTMENT PLAN

SCHEDULE 6 March 31, 2013 March 31, 2012 March 31, 2013 March 31, 2012 March 31, 2013 March 31, 2012 March 31, 2013 March 31, 2012Current Liabilities and Provisions Rupees Rupees Rupees Rupees Rupees Rupees Rupees Rupees
Current Liabilities
Investment Management and Advisory Fees 2,936,022 3,681 385,234 329,175 3,276,078 39,989 7,523 7,209
Transfer Agent Fees and Expenses 314,848 119,078 44,354 30,660 456,670 313,889 1,230 1,032
Custodian Fees and Expenses 96,001 24,473 10,049 4,674 164,712 77,542 - -
Audit Fees 127,276 51,778 20,000 20,000 166,280 155,335 20,000 20,000
Selling and Distribution Expenses 20,159,449 5,180,188 3,065,519 924,304 7,865,826 6,470,549 24,048 21,924
Purchase Contracts Awaiting Completion
- Collateralised Borrowing and Lending Obligation 84,947,262 - 3,397,905 - - - - -
- Government of India Securities 89,053,570 - 14,581,871 - - - 520,781 -
Unit Redemptions Payable 17,883,905 - 1,755,919 1,419,243 12,610,572 20,598,672 - -
Inter Scheme Payable
- For 'Switch - Out' 6,871,895 2,000 - - 1,048,169 21,448,202 - -
- For 'Others' 500,000 21,731 100,000 99,532 - 31,873 - 6,358
Dividend Payable 5,030,773 290,144 190 - 14,676,261 7,239,279 - -
Dividend Distribution Tax Payable 2,010,610 166,843 - - 4,652,974 2,834,291 - -
Unclaimed Redemption (Note 16) - - 258,386 226,083 - - - -
Unclaimed Dividend (Note 16) 17,384 17 389,081 296,712 57,430 57,414 7,396 7,396
Subscriptions Received in Advance 41,230,000 - 5,699,998 - 6,999,996 - - -
Temporary Book Overdraft - - - - 822,971 - - -
Load Charges (Note 2.8) - 205,685 1,689,921 8,005,239 5,283,356 - 5,719 14,087
Sundry Payables 1,595,576 113,666 184,415 84,268 1,962,867 286,087 17,401 12,701
TOTAL 272,774,571 6,179,284 31,582,842 11,439,890 60,044,162 59,553,122 604,098 90,707
SCHEDULE 7 April 01, 2012 to April 01, 2011 to April 01, 2012 to April 01, 2011 to April 01, 2012 to April 01, 2011 to April 01, 2012 to April 01, 2011 toInterest and Discount (Note 2.4) March 31, 2013 March 31, 2012 March 31, 2013 March 31, 2012 March 31, 2013 March 31, 2012 March 31, 2013 March 31, 2012
Rupees Rupees Rupees Rupees Rupees Rupees Rupees Rupees
Debentures / Bonds 163,108,701 31,820,014 18,227,137 12,291,284 485,000,969 162,601,130 - -
Asset Backed Securities - - 197,427 272,914 - - - -
Commercial Paper / Certificate of Deposit 56,186,244 25,972,557 2,742,821 5,276,332 285,030,270 275,640,603 - -
Deposits 1,077,372 442,412 29,918 40,658 510,081 806,888 - -
Government of India Securities 166,703,733 8,514,415 16,678,220 2,329,578 - - 1,084,709 370,505
Treasury Bills - - 179,943 - - - - -
Reverse Repos 9,779,187 2,989,581 1,573,162 730,620 9,314,186 6,189,900 188,057 183,619
Collateralised Borrowing and Lending Obligation 8,161,479 3,149,989 1,203,878 828,345 7,456,759 8,036,736 177,785 217,627
TOTAL 405,016,716 72,888,968 40,832,506 21,769,731 787,312,264 453,275,257 1,450,551 771,751
HSBC MUTUAL FUND - HSBC FLEXI DEBT FUND, HSBC INCOME FUND - INVESTMENT PLAN, HSBC INCOME FUND - SHORT TERM PLAN and HSBC GILT FUND
Schedules forming part of the Balance Sheet as at March 31, 2013and the Revenue Account for the year ended March 31, 2013
HSBC INCOME FUND - SHORT TERM PLAN HSBC GILT FUNDHSBC FLEXI DEBT FUND HSBC INCOME FUND - INVESTMENT PLAN

Description Quantity Market / Fair ValueRupees
Non-Convertible Debentures / Bonds Listed / Awaiting listing (45.76%)Banks (27.97%)
8.85% State Bank of India 2021 $ 380 381,148,672
8.94% Export Import Bank of India 2022 $ 150 151,088,468
8.93% Export Import Bank of India 2022 $ 150 150,975,992
8.90% Union Bank of India 2022 $ 90 90,566,554
8.95% Bank of Baroda 2016 $ 60 60,251,188
9.32% Export Import Bank of India 2015 $ 50 50,475,029
8.88% Export Import Bank of India 2022 $ 50 50,133,250
934,639,152Finance (58.82%)
9.20% Housing Development Finance Corporation Limited 2018 $ 350 350,356,449
8.95% Power Finance Corporation Limited 2018 $ 300 301,099,644
10.05% Bajaj Finance Limited 2014 $ 23 231,588,842
10.10% Shriram Transport Finance Company Limited 2014 $ @ 200 200,457,540
9.62% LIC Housing Finance Limited 2015 $ 150 151,115,714
9.64% LIC Housing Finance Limited 2014 $ 150 150,644,230
8.90% Power Finance Corporation Limited 2018 $ 105 105,189,315
8.90% Power Finance Corporation Limited 2023 $ 105 105,188,368
9.85% Housing Development Finance Corporation Limited 2015 $ 100 101,168,429
10.15% Shriram Transport Finance Company Limited 2014 $ @ 100 100,312,060
8.70% Rural Electrification Corporation Limited 2018 $ 90 89,595,886
10.20% Shriram Transport Finance Company Limited 2013 $ @ 30 30,026,837
0.00% Housing Development Finance Corporation Limited 2017 $ 25 28,395,746
9.38% Rural Electrification Corporation Limited 2016 $ 20 20,303,221
1,965,442,281Finance & Term Lending (2.74%)
9.40% National Bank for Agriculture and Rural Development 2016 $ 90 91,409,096
91,409,096Power (10.48%)
8.80% Power Grid Corporation of India Limited 2023 $ 350 350,162,741
350,162,741Total (Cost Rs. 3,329,283,834) 3,341,653,270Commercial Papers/Certificate of Deposits (34.46%)Certificate of Deposits (88.30%)
Oriental Bank of Commerce 2014 $ 4,500 415,914,391
Axis Bank Limited 2013 $ 3,200 315,286,956
ING Vysya Bank Limited 2013 $ 2,500 246,561,032
Canara Bank 2013 $ 2,500 246,175,844
State Bank of Patiala 2013 $ 2,500 235,927,719
Canara Bank 2014 $ 2,500 231,063,551
Corporation Bank 2013 $ 2,000 196,416,079
IDBI Bank Limited 2013 $ 1,800 176,945,866
IDBI Bank Limited 2013 $ 1,600 157,333,360
2,221,624,798Commercial Papers (11.70%)
Export Import Bank of India 2013 $ 500 245,675,108
Sundaram Finance Limited 2013 $ 100 48,824,337
294,499,445Total (Cost Rs. 2,512,804,580) 2,516,124,243Government of India Securities (19.78%)
8.20% Government Stock-M- 24-Sep-2025 8,040,000 811,959,600
8.12% Government Stock-M- 10-Dec-2020 3,070,000 311,819,900
8.15% Government Stock-M- 11-Jun-2022 2,745,000 277,958,700
8.97% Government Stock-M- 05-Dec-2030 400,000 42,673,000
Total (Cost Rs. 1,453,008,907) 1,444,411,200TOTAL INVESTMENTS (Cost Rs. 7,295,097,321) 7,302,188,713
There were no derivative transactions during the year.
$ Fair value of non traded debt securities as determined by HSBC Asset Management (India) Private Limited under procedures approved by the Board of Trustees in accordance with the guidelines for valuation of securities for Mutual funds as applicable issued by the SEBI.
HSBC FLEXI DEBT FUND
Statement of Portfolio Holding as at March 31, 2013(Referred to in Schedule 1 to the Balance Sheet as at March 31, 2013 and the Revenue Account
for the year ended March 31, 2013)
Confirmation has been received from J P Morgan Chase Bank, Mumbai Branch at the end of the financial year for the investments held by them.@ Investment in companies which have invested more than five percent of the net asset value of any scheme of HSBC Mutual Fund.
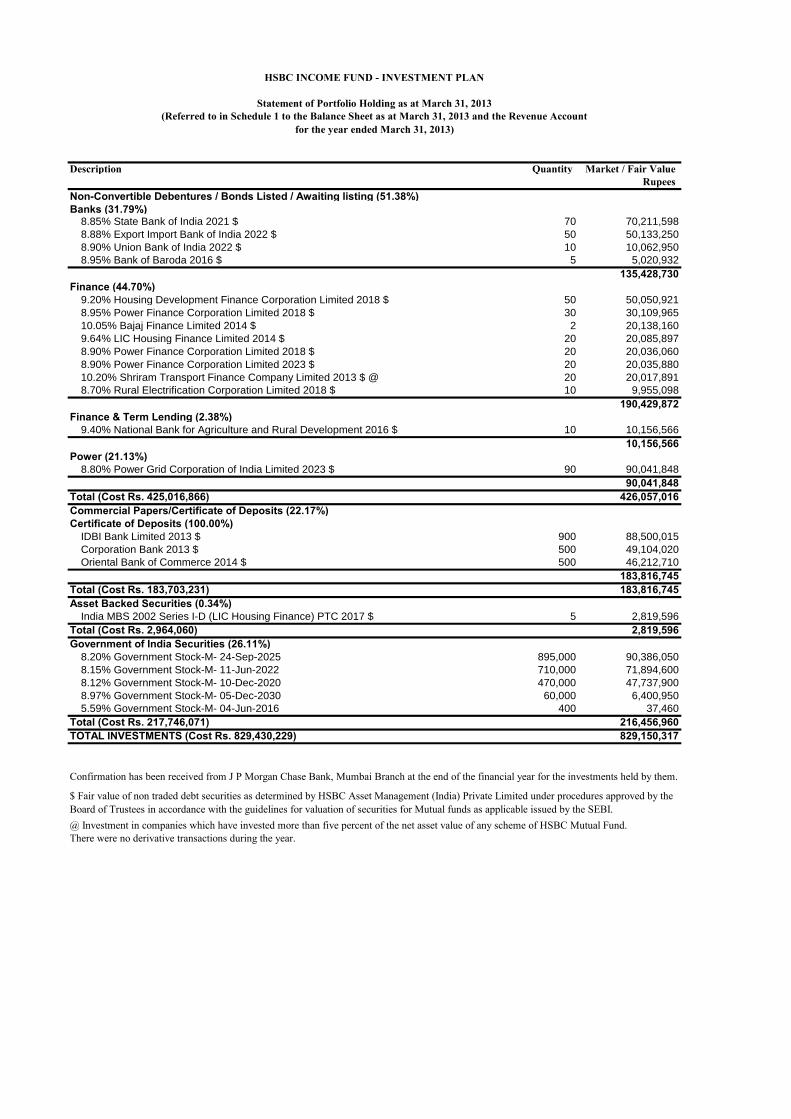
Description Quantity Market / Fair ValueRupees
Non-Convertible Debentures / Bonds Listed / Awaiting listing (51.38%)Banks (31.79%)
8.85% State Bank of India 2021 $ 70 70,211,598
8.88% Export Import Bank of India 2022 $ 50 50,133,250
8.90% Union Bank of India 2022 $ 10 10,062,950
8.95% Bank of Baroda 2016 $ 5 5,020,932
135,428,730Finance (44.70%)
9.20% Housing Development Finance Corporation Limited 2018 $ 50 50,050,921
8.95% Power Finance Corporation Limited 2018 $ 30 30,109,965
10.05% Bajaj Finance Limited 2014 $ 2 20,138,160
9.64% LIC Housing Finance Limited 2014 $ 20 20,085,897
8.90% Power Finance Corporation Limited 2018 $ 20 20,036,060
8.90% Power Finance Corporation Limited 2023 $ 20 20,035,880
10.20% Shriram Transport Finance Company Limited 2013 $ @ 20 20,017,891
8.70% Rural Electrification Corporation Limited 2018 $ 10 9,955,098
190,429,872Finance & Term Lending (2.38%)
9.40% National Bank for Agriculture and Rural Development 2016 $ 10 10,156,566
10,156,566Power (21.13%)
8.80% Power Grid Corporation of India Limited 2023 $ 90 90,041,848
90,041,848Total (Cost Rs. 425,016,866) 426,057,016Commercial Papers/Certificate of Deposits (22.17%)Certificate of Deposits (100.00%)
IDBI Bank Limited 2013 $ 900 88,500,015
Corporation Bank 2013 $ 500 49,104,020
Oriental Bank of Commerce 2014 $ 500 46,212,710
183,816,745Total (Cost Rs. 183,703,231) 183,816,745Asset Backed Securities (0.34%)
India MBS 2002 Series I-D (LIC Housing Finance) PTC 2017 $ 5 2,819,596
Total (Cost Rs. 2,964,060) 2,819,596Government of India Securities (26.11%)
8.20% Government Stock-M- 24-Sep-2025 895,000 90,386,050
8.15% Government Stock-M- 11-Jun-2022 710,000 71,894,600
8.12% Government Stock-M- 10-Dec-2020 470,000 47,737,900
8.97% Government Stock-M- 05-Dec-2030 60,000 6,400,950
5.59% Government Stock-M- 04-Jun-2016 400 37,460
Total (Cost Rs. 217,746,071) 216,456,960TOTAL INVESTMENTS (Cost Rs. 829,430,229) 829,150,317
@ Investment in companies which have invested more than five percent of the net asset value of any scheme of HSBC Mutual Fund.There were no derivative transactions during the year.
$ Fair value of non traded debt securities as determined by HSBC Asset Management (India) Private Limited under procedures approved by the Board of Trustees in accordance with the guidelines for valuation of securities for Mutual funds as applicable issued by the SEBI.
HSBC INCOME FUND - INVESTMENT PLAN
Statement of Portfolio Holding as at March 31, 2013(Referred to in Schedule 1 to the Balance Sheet as at March 31, 2013 and the Revenue Account
for the year ended March 31, 2013)
Confirmation has been received from J P Morgan Chase Bank, Mumbai Branch at the end of the financial year for the investments held by them.
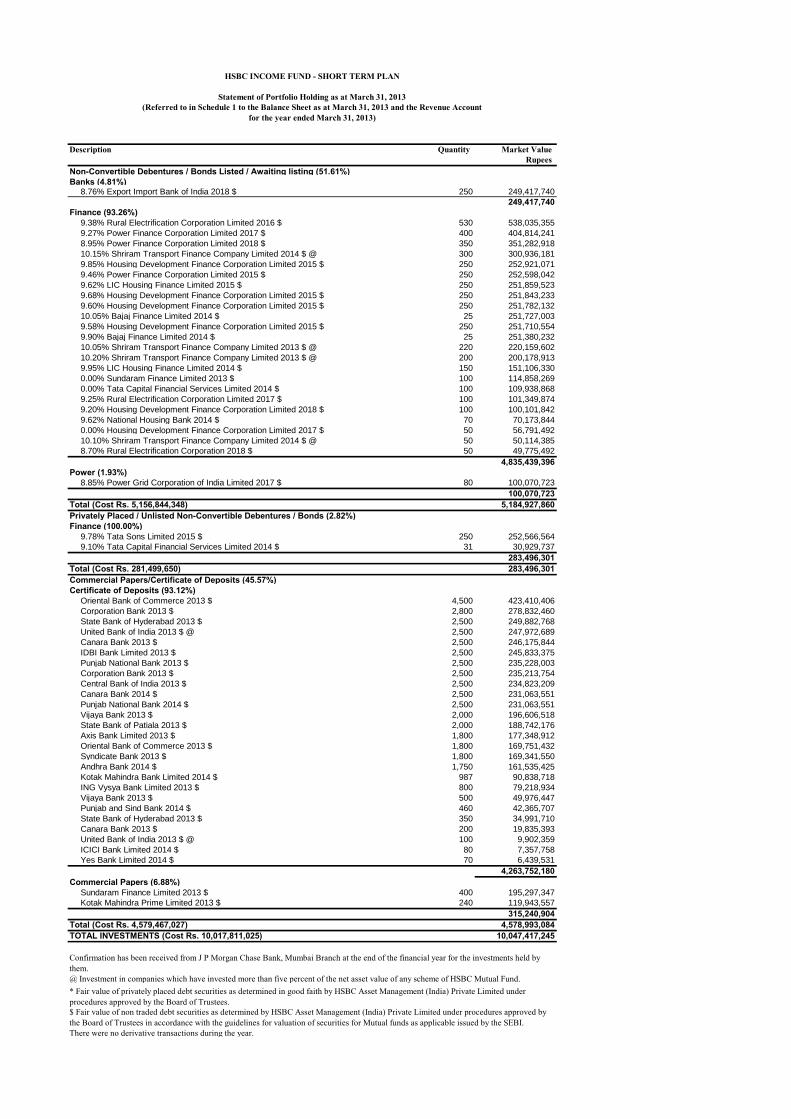
Description Quantity Market ValueRupees
Non-Convertible Debentures / Bonds Listed / Awaiting listing (51.61%)Banks (4.81%)
8.76% Export Import Bank of India 2018 $ 250 249,417,740
249,417,740Finance (93.26%)
9.38% Rural Electrification Corporation Limited 2016 $ 530 538,035,355
9.27% Power Finance Corporation Limited 2017 $ 400 404,814,241
8.95% Power Finance Corporation Limited 2018 $ 350 351,282,918
10.15% Shriram Transport Finance Company Limited 2014 $ @ 300 300,936,181
9.85% Housing Development Finance Corporation Limited 2015 $ 250 252,921,071
9.46% Power Finance Corporation Limited 2015 $ 250 252,598,042
9.62% LIC Housing Finance Limited 2015 $ 250 251,859,523
9.68% Housing Development Finance Corporation Limited 2015 $ 250 251,843,233
9.60% Housing Development Finance Corporation Limited 2015 $ 250 251,782,132
10.05% Bajaj Finance Limited 2014 $ 25 251,727,003
9.58% Housing Development Finance Corporation Limited 2015 $ 250 251,710,554
9.90% Bajaj Finance Limited 2014 $ 25 251,380,232
10.05% Shriram Transport Finance Company Limited 2013 $ @ 220 220,159,602
10.20% Shriram Transport Finance Company Limited 2013 $ @ 200 200,178,913
9.95% LIC Housing Finance Limited 2014 $ 150 151,106,330
0.00% Sundaram Finance Limited 2013 $ 100 114,858,269
0.00% Tata Capital Financial Services Limited 2014 $ 100 109,938,868
9.25% Rural Electrification Corporation Limited 2017 $ 100 101,349,874
9.20% Housing Development Finance Corporation Limited 2018 $ 100 100,101,842
9.62% National Housing Bank 2014 $ 70 70,173,844
0.00% Housing Development Finance Corporation Limited 2017 $ 50 56,791,492
10.10% Shriram Transport Finance Company Limited 2014 $ @ 50 50,114,385
8.70% Rural Electrification Corporation 2018 $ 50 49,775,492
4,835,439,396Power (1.93%)
8.85% Power Grid Corporation of India Limited 2017 $ 80 100,070,723
100,070,723Total (Cost Rs. 5,156,844,348) 5,184,927,860Privately Placed / Unlisted Non-Convertible Debentures / Bonds (2.82%)Finance (100.00%)
9.78% Tata Sons Limited 2015 $ 250 252,566,564
9.10% Tata Capital Financial Services Limited 2014 $ 31 30,929,737
283,496,301Total (Cost Rs. 281,499,650) 283,496,301Commercial Papers/Certificate of Deposits (45.57%)Certificate of Deposits (93.12%)
Oriental Bank of Commerce 2013 $ 4,500 423,410,406
Corporation Bank 2013 $ 2,800 278,832,460
State Bank of Hyderabad 2013 $ 2,500 249,882,768
United Bank of India 2013 $ @ 2,500 247,972,689
Canara Bank 2013 $ 2,500 246,175,844
IDBI Bank Limited 2013 $ 2,500 245,833,375
Punjab National Bank 2013 $ 2,500 235,228,003
Corporation Bank 2013 $ 2,500 235,213,754
Central Bank of India 2013 $ 2,500 234,823,209
Canara Bank 2014 $ 2,500 231,063,551
Punjab National Bank 2014 $ 2,500 231,063,551
Vijaya Bank 2013 $ 2,000 196,606,518
State Bank of Patiala 2013 $ 2,000 188,742,176
Axis Bank Limited 2013 $ 1,800 177,348,912
Oriental Bank of Commerce 2013 $ 1,800 169,751,432
Syndicate Bank 2013 $ 1,800 169,341,550
Andhra Bank 2014 $ 1,750 161,535,425
Kotak Mahindra Bank Limited 2014 $ 987 90,838,718
ING Vysya Bank Limited 2013 $ 800 79,218,934
Vijaya Bank 2013 $ 500 49,976,447
Punjab and Sind Bank 2014 $ 460 42,365,707
State Bank of Hyderabad 2013 $ 350 34,991,710
Canara Bank 2013 $ 200 19,835,393
United Bank of India 2013 $ @ 100 9,902,359
ICICI Bank Limited 2014 $ 80 7,357,758
Yes Bank Limited 2014 $ 70 6,439,531
4,263,752,180Commercial Papers (6.88%)
Sundaram Finance Limited 2013 $ 400 195,297,347
Kotak Mahindra Prime Limited 2013 $ 240 119,943,557
315,240,904Total (Cost Rs. 4,579,467,027) 4,578,993,084TOTAL INVESTMENTS (Cost Rs. 10,017,811,025) 10,047,417,245
There were no derivative transactions during the year.
$ Fair value of non traded debt securities as determined by HSBC Asset Management (India) Private Limited under procedures approved by the Board of Trustees in accordance with the guidelines for valuation of securities for Mutual funds as applicable issued by the SEBI.
* Fair value of privately placed debt securities as determined in good faith by HSBC Asset Management (India) Private Limited under procedures approved by the Board of Trustees.
@ Investment in companies which have invested more than five percent of the net asset value of any scheme of HSBC Mutual Fund.
Confirmation has been received from J P Morgan Chase Bank, Mumbai Branch at the end of the financial year for the investments held by them.
HSBC INCOME FUND - SHORT TERM PLAN
Statement of Portfolio Holding as at March 31, 2013(Referred to in Schedule 1 to the Balance Sheet as at March 31, 2013 and the Revenue Account
for the year ended March 31, 2013)

Statement of Portfolio Holding as at March 31, 2013
Description Quantity Market ValueRupees
Government of India Securities (100.00%)8.20% Government Stock-M- 24-Sep-2025 50,000 5,049,500
8.15% Government Stock-M- 11-Jun-2022 35,000 3,544,100
8.12% Government Stock-M- 10-Dec-2020 30,000 3,047,100
Total (Cost Rs. 11,707,164) 11,640,700TOTAL INVESTMENTS (Cost Rs. 11,707,164) 11,640,700
HSBC GILT FUND
(Referred to in Schedule 1 to the Balance Sheet as at March 31, 2013 and the Revenue Accountfor the year ended March 31, 2013)
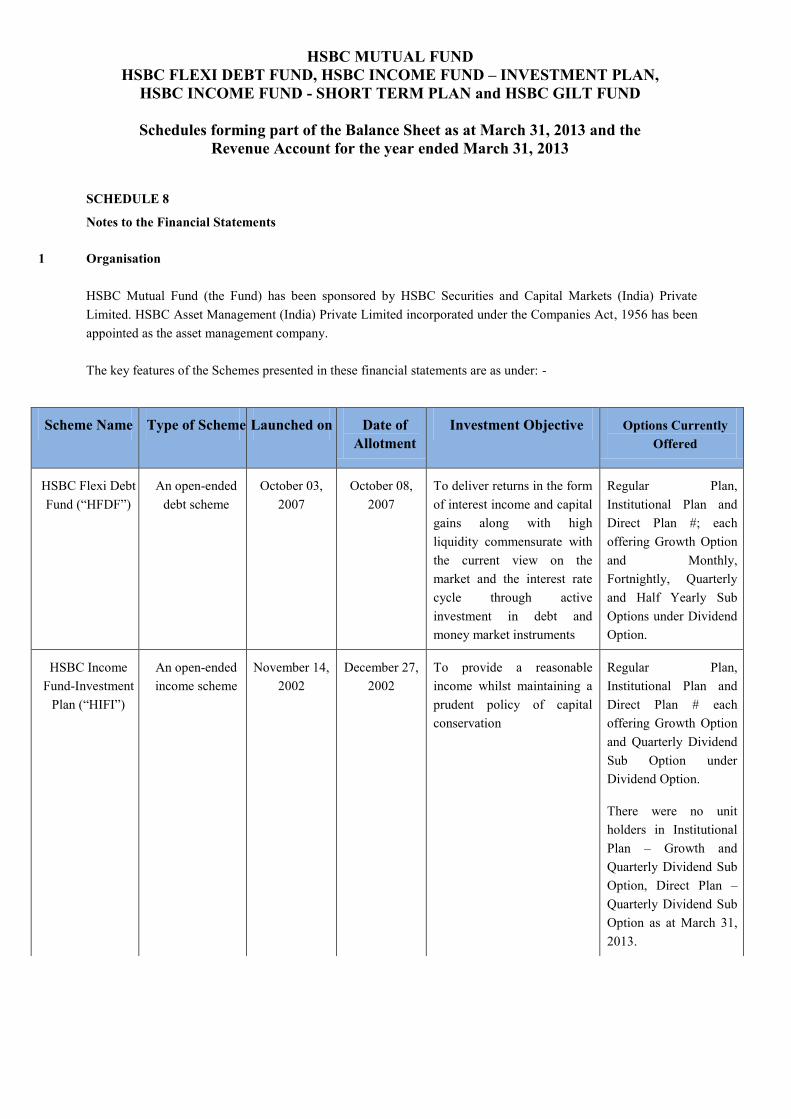
HSBC MUTUAL FUND HSBC FLEXI DEBT FUND, HSBC INCOME FUND – INVESTMENT PLAN,
HSBC INCOME FUND - SHORT TERM PLAN and HSBC GILT FUND
Schedules forming part of the Balance Sheet as at March 31, 2013 and the Revenue Account for the year ended March 31, 2013
SCHEDULE 8
Notes to the Financial Statements
1 Organisation HSBC Mutual Fund (the Fund) has been sponsored by HSBC Securities and Capital Markets (India) Private Limited. HSBC Asset Management (India) Private Limited incorporated under the Companies Act, 1956 has been appointed as the asset management company. The key features of the Schemes presented in these financial statements are as under: -
Scheme Name Type of Scheme Launched on Date of Allotment
Investment Objective Options Currently Offered
HSBC Flexi Debt Fund (“HFDF”)
An open-ended debt scheme
October 03, 2007
October 08, 2007
To deliver returns in the form of interest income and capital gains along with high liquidity commensurate with the current view on the market and the interest rate cycle through active investment in debt and money market instruments
Regular Plan, Institutional Plan and Direct Plan #; each offering Growth Option and Monthly, Fortnightly, Quarterly and Half Yearly Sub Options under Dividend Option.
HSBC Income Fund-Investment
Plan (“HIFI”)
An open-ended income scheme
November 14, 2002
December 27, 2002
To provide a reasonable income whilst maintaining a prudent policy of capital conservation
Regular Plan, Institutional Plan and Direct Plan # each offering Growth Option and Quarterly Dividend Sub Option under Dividend Option.
There were no unit holders in Institutional Plan – Growth and Quarterly Dividend Sub Option, Direct Plan –Quarterly Dividend Sub Option as at March 31, 2013.
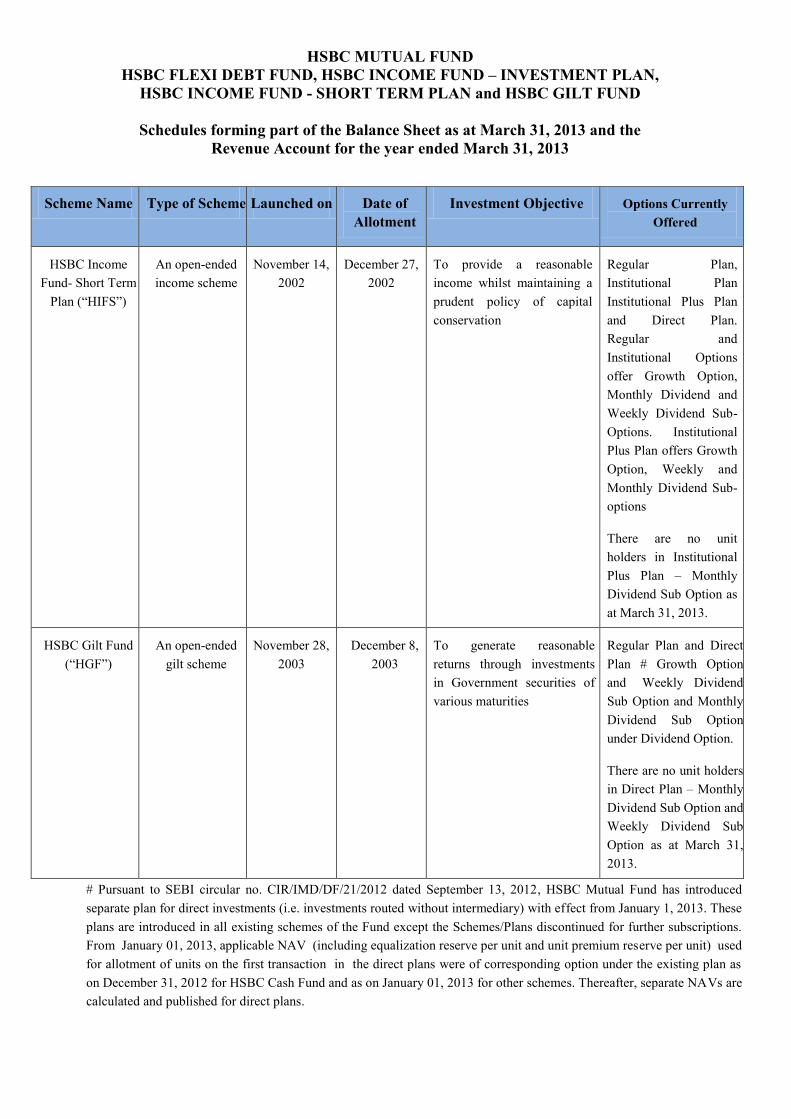
HSBC MUTUAL FUND HSBC FLEXI DEBT FUND, HSBC INCOME FUND – INVESTMENT PLAN,
HSBC INCOME FUND - SHORT TERM PLAN and HSBC GILT FUND
Schedules forming part of the Balance Sheet as at March 31, 2013 and the Revenue Account for the year ended March 31, 2013
# Pursuant to SEBI circular no. CIR/IMD/DF/21/2012 dated September 13, 2012, HSBC Mutual Fund has introduced separate plan for direct investments (i.e. investments routed without intermediary) with effect from January 1, 2013. These plans are introduced in all existing schemes of the Fund except the Schemes/Plans discontinued for further subscriptions. From January 01, 2013, applicable NAV (including equalization reserve per unit and unit premium reserve per unit) used for allotment of units on the first transaction in the direct plans were of corresponding option under the existing plan as on December 31, 2012 for HSBC Cash Fund and as on January 01, 2013 for other schemes. Thereafter, separate NAVs are calculated and published for direct plans.
Scheme Name Type of Scheme Launched on Date of Allotment
Investment Objective Options Currently Offered
HSBC Income Fund- Short Term
Plan (“HIFS”)
An open-ended income scheme
November 14, 2002
December 27, 2002
To provide a reasonable income whilst maintaining a prudent policy of capital conservation
Regular Plan, Institutional Plan Institutional Plus Plan and Direct Plan. Regular and Institutional Options offer Growth Option, Monthly Dividend and Weekly Dividend Sub-Options. Institutional Plus Plan offers Growth Option, Weekly and Monthly Dividend Sub-options
There are no unit holders in Institutional Plus Plan – Monthly Dividend Sub Option as at March 31, 2013.
HSBC Gilt Fund (“HGF”)
An open-ended gilt scheme
November 28, 2003
December 8, 2003
To generate reasonable returns through investments in Government securities of various maturities
Regular Plan and Direct Plan # Growth Option and Weekly Dividend Sub Option and Monthly Dividend Sub Option under Dividend Option.
There are no unit holders in Direct Plan – Monthly Dividend Sub Option and Weekly Dividend Sub Option as at March 31, 2013.

HSBC MUTUAL FUND HSBC FLEXI DEBT FUND, HSBC INCOME FUND – INVESTMENT PLAN,
HSBC INCOME FUND - SHORT TERM PLAN and HSBC GILT FUND
Schedules forming part of the Balance Sheet as at March 31, 2013 and the Revenue Account for the year ended March 31, 2013
2 Significant Accounting Policies
2.1 Basis of Accounting
The Schemes maintains its books of account on an accrual basis. These financial statements have been prepared in accordance with the accounting policies and standards specified in the Ninth Schedule of the Securities and Exchange Board of India (SEBI) (Mutual Funds) Regulations, 1996 and amendments thereto (the “Regulations”), as applicable. Presentation of these separate Balance Sheets, Revenue Accounts and Cash Flow Statements, where applicable, in a columnar form is not intended to indicate that they bear any relation to each other, or are interdependent or comparable in any way.
2.2 Portfolio Valuation Investments are stated at market / fair value at the Balance Sheet date / date of determination. In valuing the Scheme’s investments: i. For money market securities, debt securities and floating rate securities :
a) All traded money market securities, debt securities and floating rate securities listed on the recognized stock exchange are valued at the weighted average price at which they are traded on the particular valuation day. b) Non-traded /thinly traded money market securities, debt securities and floating rate securities with residual maturity of upto 91 days are valued on amortization basis. Floating rate securities with floor and caps on coupon rate and residual maturity of upto 91 days are valued on amortization basis taking the coupon rate as floor. c) Non-traded /thinly traded money market securities, debt securities and floating rate securities with residual maturity of over 91 days are valued at fair value as per procedures determined by HSBC Asset Management (India) Private Limited and approved by the Trustee in accordance with the guidelines for valuation of securities for mutual funds, issued by SEBI from time to time.
For money market securities, debt securities and floating rate securities (with effect from July 06, 2012) a) All traded money market securities and debt securities and floating rate securities are valued at the weighted average traded YTM or weighted average price at which they are traded / reported on public platform on the particular valuation day as per procedures determined by HSBC Asset Management (India) Private Limited and approved by the Trustee in accordance with the guidelines for valuation of securities for mutual funds, issued by SEBI from time to time. b) Non-traded /thinly traded money market and debt securities and floating rate securities, with residual maturity of up to 91* days are valued on amortization basis. Floating rate securities with floor and caps on coupon rate and residual maturity of up to 91* days are valued on amortization basis taking the coupon rate as floor. Amortized price as per Crisil Bond Valuer (CBV) will be compared with the reference price (as per CBV) to ascertain if the difference is within the band of +/- 10 basis points of the reference price. In case of amortised price falling outside the band, the YTM of the amortised price will be adjusted in order to bring the price within the band.

HSBC MUTUAL FUND HSBC FLEXI DEBT FUND, HSBC INCOME FUND – INVESTMENT PLAN,
HSBC INCOME FUND - SHORT TERM PLAN and HSBC GILT FUND
Schedules forming part of the Balance Sheet as at March 31, 2013 and the Revenue Account for the year ended March 31, 2013
c) Non-traded /thinly traded money market securities, debt securities and floating rate securities with residual maturity of over 91* days are valued at fair value as per procedures determined by HSBC Asset Management (India) Private Limited and approved by the Trustee in accordance with the guidelines for valuation of securities for mutual funds, issued by SEBI from time to time. Thus they are valued at benchmark yield/matrix of spread over risk free benchmark yield obtained from agencies entrusted for the said purpose by AMFI. This may be further adjusted for the illiquidity mark-up / mark-down as permitted under the regulations. *Pursuant to SEBI circular CIR/IMD/DF/6/2012 dated February 28, 2012, with effect from October 01, 2012, reference to 91 days above was changed to 60 days.
ii. Asset backed securities are valued at fair value as determined in good faith by HSBC Asset Management
(India) Private Limited under procedures approved by the Board of Trustees of HSBC Mutual Fund. iii. Government securities and Treasury Bills are valued at the average of prices obtained from The Credit Rating
Information Services of India Limited (CRISIL) and ICRA Limited in accordance with the guidelines for valuation of securities for mutual funds dated September 18, 2000 and amendments thereto, as applicable, issued by SEBI. If no price is reported at that time, such security is valued at fair value as determined in good faith by HSBC Asset Management (India) Private Limited under procedures approved by the Board of Trustees of HSBC Mutual Fund.
iv. Instruments bought on ‘repo’ basis are valued at the resale price after deduction of applicable interest up to
the date of resale. Instruments sold on repo basis are adjusted for the difference between the repurchase price (after deduction of applicable interest upto the date of repurchase) and the value of the instrument.
v. Collateralised Borrowing and Lending Obligations (CBLO) are valued at cost plus accrued interest. The net unrealised appreciation / depreciation in the value of investments is determined separately for each
category of investments. In respect of each category of investments, the net change in the unrealised
appreciation if any, between two balance sheet dates / valuation dates is accounted through the Revenue
Account and thereafter the net change in unrealised appreciation is transferred from the Revenue Account to
the Unrealised Appreciation Reserve. The net change in unrealised depreciation in the value of investments
between the two balance sheet dates/ valuation dates if any, is accounted through the Revenue Account.
Net unrealised appreciation is reduced from the distributable income at the time of income distribution.
2.3 Securities Transaction
Investment securities transactions are accounted for on a trade date basis. The Scheme uses the average cost
method for determining the realized gain or loss on sale of investments. The cost of investments includes
brokerage stamp charges and any other charges customarily included in the contract note but excludes custodian
safekeeping fees. Pursuant to SEBI circular no. CIR/IMD/DF/21/2012 dated September 13, 2012, with effect
from October 01, 2012, Brokerage and Transaction Costs which are incurred for the purpose of execution of
trade, is included in the cost of investment not exceeding 0.12 per cent in case of cash market transactions and
HSBC MUTUAL FUND HSBC FLEXI DEBT FUND, HSBC INCOME FUND – INVESTMENT PLAN,
HSBC INCOME FUND - SHORT TERM PLAN and HSBC GILT FUND
Schedules forming part of the Balance Sheet as at March 31, 2013 and the Revenue Account for the year ended March 31, 2013
0.05 per cent in case of derivatives transactions. Remaining portion is charged to expenses, within total expense
ratio in line with Regulations.
2.4 Investment Income
Interest income is recorded on accrual basis.
2.5 Net Asset Value
The net asset value of the units of the Schemes is determined separately for units issued under various Plans/
Options. For reporting the net asset value of the Plans/ Options, daily income earned, including realised and
unrealised gain or loss in the value of investments and expenses incurred by the Schemes are allocated to the
Plans/ Options in proportion to the value of the net assets.
2.6 Unit Premium Reserve
Upon issue and redemption of units, the net premium or discount to the face value of units is adjusted against the
unit premium reserve of the respective Plans/ Options of the Schemes, after an appropriate portion of the issue
proceeds and redemption payout is credited or debited respectively to the income equalisation reserve.
2.7 Income Equalisation Reserve The net income relating to units issued / repurchased is transferred to/ from income equalisation reserve (for open
ended schemes) for determining the net surplus / deficit transferred from / to unit premium reserve. At the year
end, balance in income equalisation reserve is transferred to Revenue Account.
2.8 Load Charges
Upto September 30, 2012, Exit load (Net of Service Tax) collected in the Schemes up to a maximum of 1% of
redemption proceeds is maintained in a separate account and utilized to meet marketing & selling expenses. Any
load (Net of Service Tax) collected in excess of 1% is credited to the Schemes immediately.
SEBI circular No. CIR /IMD/DF/ 4/2011 dated March 09, 2011 has mandated that there should be segregation of
load accounts into two parts, one to reflect the balance as on July 31, 2009 and the other to reflect accretions since
August 01, 2009. While the unutilized balances can be carried forward, not more than one third of the load
balances lying in the Scheme as on July 31, 2009 can be used in any financial year, starting from financial year
2010-2011. All accretions after July 31, 2009 can be used by the Schemes without any such restriction. Further,
both load balances can be used for marketing and selling expenses including distributor’s /agent’s commission.
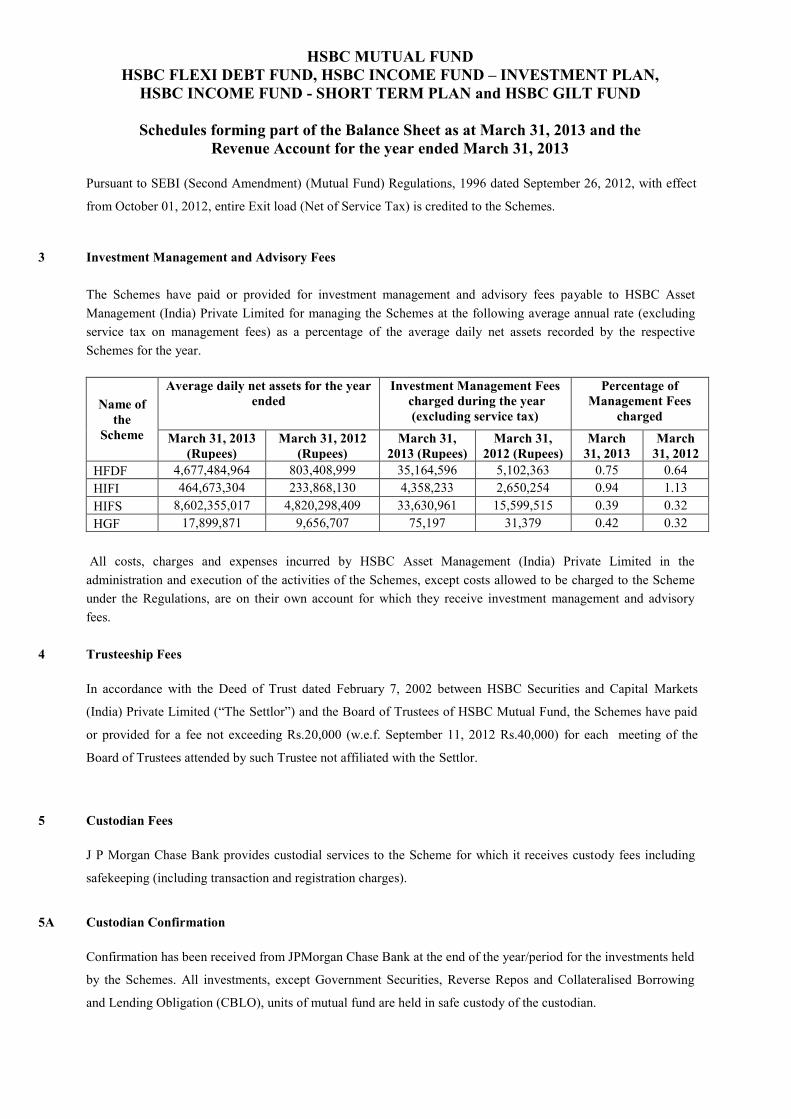
HSBC MUTUAL FUND HSBC FLEXI DEBT FUND, HSBC INCOME FUND – INVESTMENT PLAN,
HSBC INCOME FUND - SHORT TERM PLAN and HSBC GILT FUND
Schedules forming part of the Balance Sheet as at March 31, 2013 and the Revenue Account for the year ended March 31, 2013
Pursuant to SEBI (Second Amendment) (Mutual Fund) Regulations, 1996 dated September 26, 2012, with effect
from October 01, 2012, entire Exit load (Net of Service Tax) is credited to the Schemes.
3 Investment Management and Advisory Fees
The Schemes have paid or provided for investment management and advisory fees payable to HSBC Asset Management (India) Private Limited for managing the Schemes at the following average annual rate (excluding service tax on management fees) as a percentage of the average daily net assets recorded by the respective Schemes for the year.
Name of the
Scheme
Average daily net assets for the year ended
Investment Management Fees charged during the year
(excluding service tax)
Percentage of Management Fees
charged
March 31, 2013 (Rupees)
March 31, 2012 (Rupees)
March 31, 2013 (Rupees)
March 31, 2012 (Rupees)
March 31, 2013
March 31, 2012
HFDF 4,677,484,964 803,408,999 35,164,596 5,102,363 0.75 0.64 HIFI 464,673,304 233,868,130 4,358,233 2,650,254 0.94 1.13 HIFS 8,602,355,017 4,820,298,409 33,630,961 15,599,515 0.39 0.32 HGF 17,899,871 9,656,707 75,197 31,379 0.42 0.32
All costs, charges and expenses incurred by HSBC Asset Management (India) Private Limited in the administration and execution of the activities of the Schemes, except costs allowed to be charged to the Scheme under the Regulations, are on their own account for which they receive investment management and advisory fees.
4 Trusteeship Fees In accordance with the Deed of Trust dated February 7, 2002 between HSBC Securities and Capital Markets
(India) Private Limited (“The Settlor”) and the Board of Trustees of HSBC Mutual Fund, the Schemes have paid
or provided for a fee not exceeding Rs.20,000 (w.e.f. September 11, 2012 Rs.40,000) for each meeting of the
Board of Trustees attended by such Trustee not affiliated with the Settlor.
5 Custodian Fees
J P Morgan Chase Bank provides custodial services to the Scheme for which it receives custody fees including
safekeeping (including transaction and registration charges).
5A Custodian Confirmation
Confirmation has been received from JPMorgan Chase Bank at the end of the year/period for the investments held
by the Schemes. All investments, except Government Securities, Reverse Repos and Collateralised Borrowing
and Lending Obligation (CBLO), units of mutual fund are held in safe custody of the custodian.
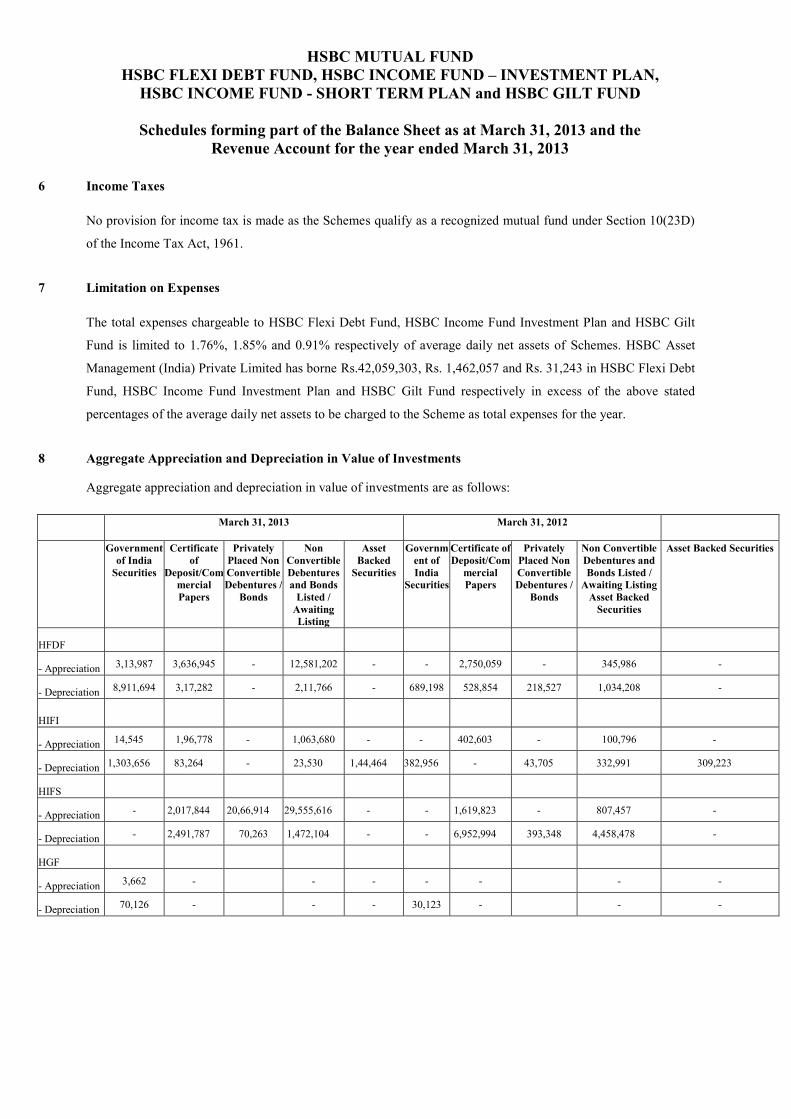
HSBC MUTUAL FUND HSBC FLEXI DEBT FUND, HSBC INCOME FUND – INVESTMENT PLAN,
HSBC INCOME FUND - SHORT TERM PLAN and HSBC GILT FUND
Schedules forming part of the Balance Sheet as at March 31, 2013 and the Revenue Account for the year ended March 31, 2013
6 Income Taxes
No provision for income tax is made as the Schemes qualify as a recognized mutual fund under Section 10(23D)
of the Income Tax Act, 1961.
7 Limitation on Expenses
The total expenses chargeable to HSBC Flexi Debt Fund, HSBC Income Fund Investment Plan and HSBC Gilt
Fund is limited to 1.76%, 1.85% and 0.91% respectively of average daily net assets of Schemes. HSBC Asset
Management (India) Private Limited has borne Rs.42,059,303, Rs. 1,462,057 and Rs. 31,243 in HSBC Flexi Debt
Fund, HSBC Income Fund Investment Plan and HSBC Gilt Fund respectively in excess of the above stated
percentages of the average daily net assets to be charged to the Scheme as total expenses for the year.
8 Aggregate Appreciation and Depreciation in Value of Investments
Aggregate appreciation and depreciation in value of investments are as follows:
March 31, 2013
March 31, 2012
Government of India
Securities
Certificate of
Deposit/Commercial Papers
Privately Placed Non Convertible Debentures /
Bonds
Non Convertible Debentures and Bonds
Listed / Awaiting Listing
Asset Backed
Securities
Government of India
Securities
Certificate of Deposit/Com
mercial Papers
Privately Placed Non Convertible Debentures /
Bonds
Non Convertible Debentures and Bonds Listed /
Awaiting Listing Asset Backed
Securities
Asset Backed Securities
HFDF
- Appreciation 3,13,987 3,636,945 - 12,581,202 - - 2,750,059 - 345,986 -
- Depreciation 8,911,694 3,17,282 - 2,11,766 - 689,198 528,854 218,527 1,034,208 -
HIFI
- Appreciation 14,545 1,96,778 - 1,063,680 - - 402,603 - 100,796 -
- Depreciation 1,303,656 83,264 - 23,530 1,44,464 382,956 - 43,705 332,991 309,223
HIFS
- Appreciation - 2,017,844 20,66,914 29,555,616 - - 1,619,823 - 807,457 -
- Depreciation - 2,491,787 70,263 1,472,104 - - 6,952,994 393,348 4,458,478 -
HGF
- Appreciation 3,662 - - - - - - -
- Depreciation 70,126 - - - 30,123 - - -
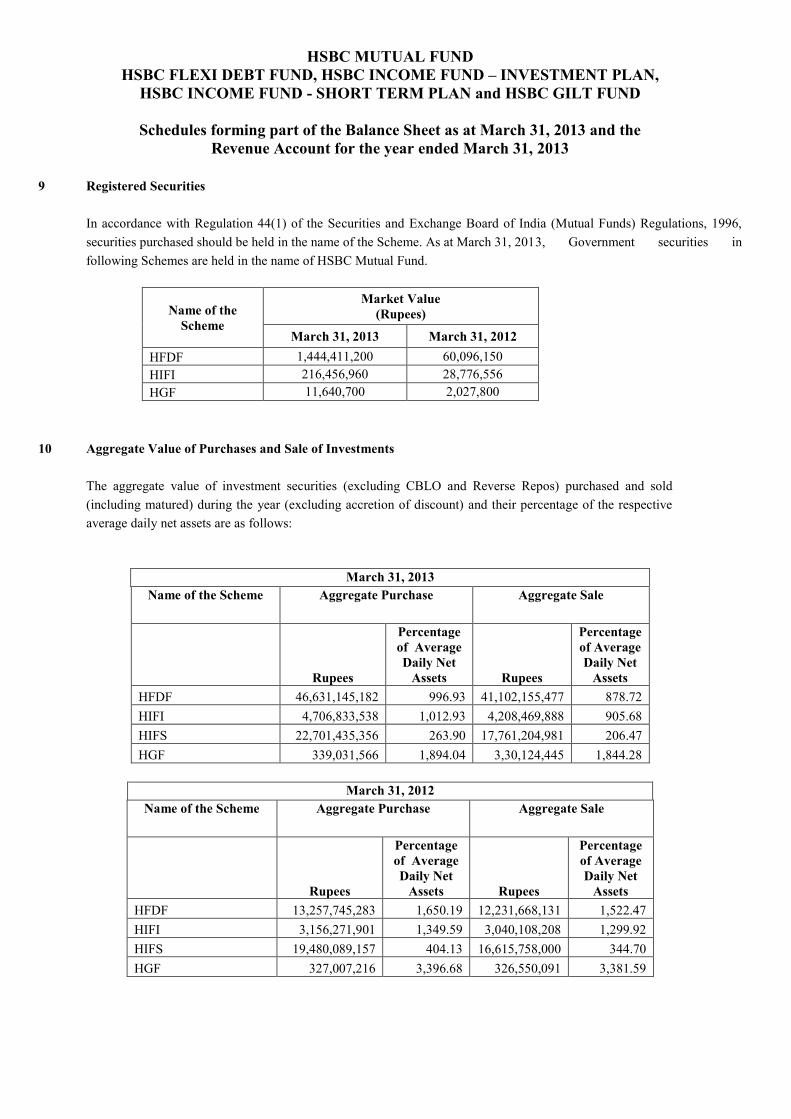
HSBC MUTUAL FUND HSBC FLEXI DEBT FUND, HSBC INCOME FUND – INVESTMENT PLAN,
HSBC INCOME FUND - SHORT TERM PLAN and HSBC GILT FUND
Schedules forming part of the Balance Sheet as at March 31, 2013 and the Revenue Account for the year ended March 31, 2013
9 Registered Securities
In accordance with Regulation 44(1) of the Securities and Exchange Board of India (Mutual Funds) Regulations, 1996, securities purchased should be held in the name of the Scheme. As at March 31, 2013, Government securities in following Schemes are held in the name of HSBC Mutual Fund.
Name of the Scheme
Market Value (Rupees)
March 31, 2013 March 31, 2012 HFDF 1,444,411,200 60,096,150 HIFI 216,456,960 28,776,556 HGF 11,640,700 2,027,800
10 Aggregate Value of Purchases and Sale of Investments The aggregate value of investment securities (excluding CBLO and Reverse Repos) purchased and sold (including matured) during the year (excluding accretion of discount) and their percentage of the respective average daily net assets are as follows:
March 31, 2013
Name of the Scheme Aggregate Purchase Aggregate Sale
Rupees
Percentage of Average Daily Net
Assets Rupees
Percentage of Average Daily Net
Assets HFDF 46,631,145,182 996.93 41,102,155,477 878.72 HIFI 4,706,833,538 1,012.93 4,208,469,888 905.68 HIFS 22,701,435,356 263.90 17,761,204,981 206.47 HGF 339,031,566 1,894.04 3,30,124,445 1,844.28
March 31, 2012
Name of the Scheme Aggregate Purchase Aggregate Sale
Rupees
Percentage of Average Daily Net
Assets Rupees
Percentage of Average Daily Net
Assets HFDF 13,257,745,283 1,650.19 12,231,668,131 1,522.47 HIFI 3,156,271,901 1,349.59 3,040,108,208 1,299.92 HIFS 19,480,089,157 404.13 16,615,758,000 344.70 HGF 327,007,216 3,396.68 326,550,091 3,381.59

HSBC MUTUAL FUND HSBC FLEXI DEBT FUND, HSBC INCOME FUND – INVESTMENT PLAN,
HSBC INCOME FUND - SHORT TERM PLAN and HSBC GILT FUND
Schedules forming part of the Balance Sheet as at March 31, 2013 and the Revenue Account for the year ended March 31, 2013
11 Aggregate Fair Value of Non-Traded / Privately Placed Investments
Aggregate fair value of non-traded (including private placement) investments as determined by HSBC Asset Management (India) Private Limited under the procedures approved by the Board of Trustees as at March 31, 2013 and March 31, 2012 are as follows:
Name of Scheme
Fair Value (Rupees)
March 31, 2013 March 31, 2012 HFDF 5,857,777,513 1,493,086,926 HIFI 612,693,357 285,291,705 HIFS 10,047,417,245 4,729,472,394
12 Income and Expenses
The total income (including net profit / net of net loss on sale of investments and net change in unrealised depreciation in the value of investments) and expenditure during the year are as follows:
March 31, 2013 Name of the
Scheme Total Income Total Expenses
Rupees Percentage of Average Daily Net
Assets
Rupees Percentage of Average Daily Net
Assets HFDF 550,171,335 11.76 82,556,190 1.76 HIFI 55,374,272 11.92 8,879,229 1.91 HIFS 827,055,077 9.61 98,217,104 1.14 HGF 2,160,000 12.07 163,185 0.91
March 31, 2012 Name of the
Scheme Total Income Total Expenses
Rupees Percentage of Average Daily Net
Assets
Rupees Percentage of Average Daily Net
Assets HFDF 79,598,699 9.91 12,887,619 1.60 HIFI 23,421,603 10.01 4,326,382 1.85 HIFS 443,301,316 9.20 45,242,698 0.94 HGF 842,902 8.73 72,385 0.75
13 Initial Contribution
The initial contribution of Rs. 100,000 made by the sponsor, HSBC Securities and Capital Markets (India) Private
Limited is recorded in the books of account of HSBC Mutual Fund the Trust.
13A Movement in Unit Capital The movement in Unit Capital during the year/period is detailed in Schedule 4.
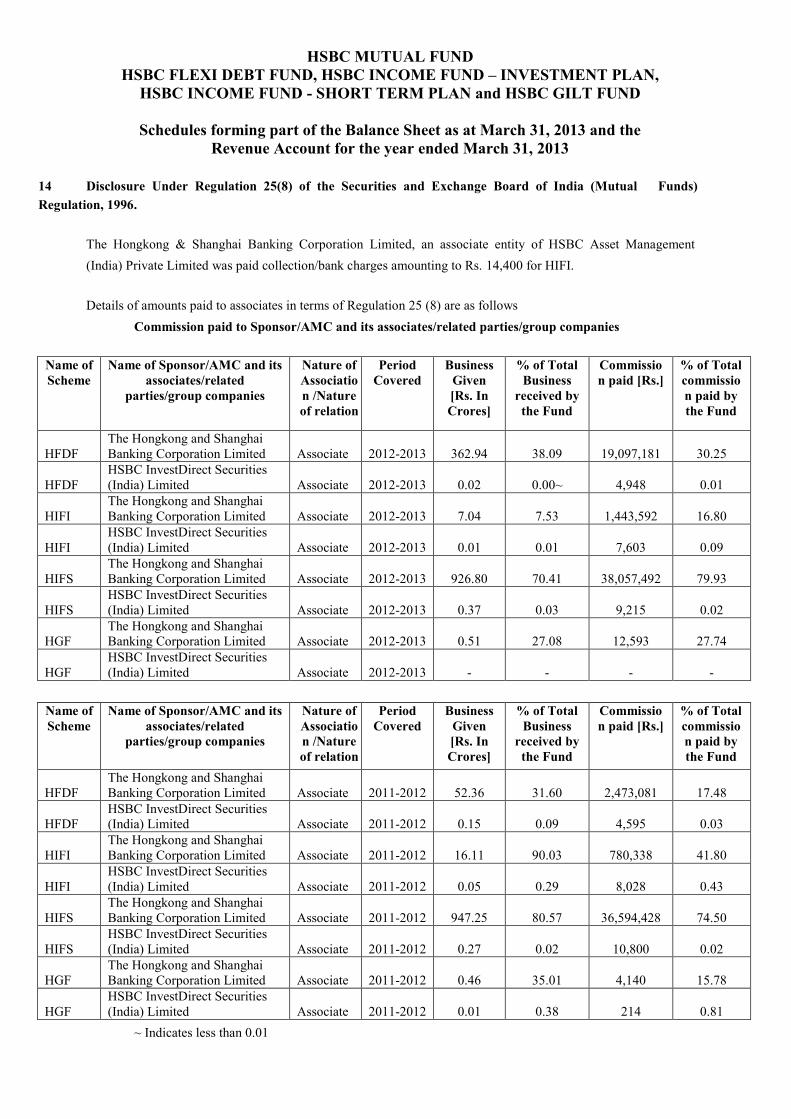
HSBC MUTUAL FUND HSBC FLEXI DEBT FUND, HSBC INCOME FUND – INVESTMENT PLAN,
HSBC INCOME FUND - SHORT TERM PLAN and HSBC GILT FUND
Schedules forming part of the Balance Sheet as at March 31, 2013 and the Revenue Account for the year ended March 31, 2013
14 Disclosure Under Regulation 25(8) of the Securities and Exchange Board of India (Mutual Funds) Regulation, 1996.
The Hongkong & Shanghai Banking Corporation Limited, an associate entity of HSBC Asset Management (India) Private Limited was paid collection/bank charges amounting to Rs. 14,400 for HIFI.
Details of amounts paid to associates in terms of Regulation 25 (8) are as follows
Commission paid to Sponsor/AMC and its associates/related parties/group companies
Name of Scheme
Name of Sponsor/AMC and its associates/related
parties/group companies
Nature of Association /Nature of relation
Period Covered
Business Given [Rs. In Crores]
% of Total Business
received by the Fund
Commission paid [Rs.]
% of Total commission paid by the Fund
HFDF The Hongkong and Shanghai Banking Corporation Limited Associate 2012-2013 362.94 38.09 19,097,181 30.25
HFDF HSBC InvestDirect Securities (India) Limited Associate 2012-2013 0.02 0.00~ 4,948 0.01
HIFI The Hongkong and Shanghai Banking Corporation Limited Associate 2012-2013 7.04 7.53 1,443,592 16.80
HIFI HSBC InvestDirect Securities (India) Limited Associate 2012-2013 0.01 0.01 7,603 0.09
HIFS The Hongkong and Shanghai Banking Corporation Limited Associate 2012-2013 926.80 70.41 38,057,492 79.93
HIFS HSBC InvestDirect Securities (India) Limited Associate 2012-2013 0.37 0.03 9,215 0.02
HGF The Hongkong and Shanghai Banking Corporation Limited Associate 2012-2013 0.51 27.08 12,593 27.74
HGF HSBC InvestDirect Securities (India) Limited Associate 2012-2013 - - - -
Name of Scheme
Name of Sponsor/AMC and its associates/related
parties/group companies
Nature of Association /Nature of relation
Period Covered
Business Given [Rs. In Crores]
% of Total Business
received by the Fund
Commission paid [Rs.]
% of Total commission paid by the Fund
HFDF The Hongkong and Shanghai Banking Corporation Limited Associate 2011-2012 52.36 31.60 2,473,081 17.48
HFDF HSBC InvestDirect Securities (India) Limited Associate 2011-2012 0.15 0.09 4,595 0.03
HIFI The Hongkong and Shanghai Banking Corporation Limited Associate 2011-2012 16.11 90.03 780,338 41.80
HIFI HSBC InvestDirect Securities (India) Limited Associate 2011-2012 0.05 0.29 8,028 0.43
HIFS The Hongkong and Shanghai Banking Corporation Limited Associate 2011-2012 947.25 80.57 36,594,428 74.50
HIFS HSBC InvestDirect Securities (India) Limited Associate 2011-2012 0.27 0.02 10,800 0.02
HGF The Hongkong and Shanghai Banking Corporation Limited Associate 2011-2012 0.46 35.01 4,140 15.78
HGF HSBC InvestDirect Securities (India) Limited Associate 2011-2012 0.01 0.38 214 0.81
~ Indicates less than 0.01
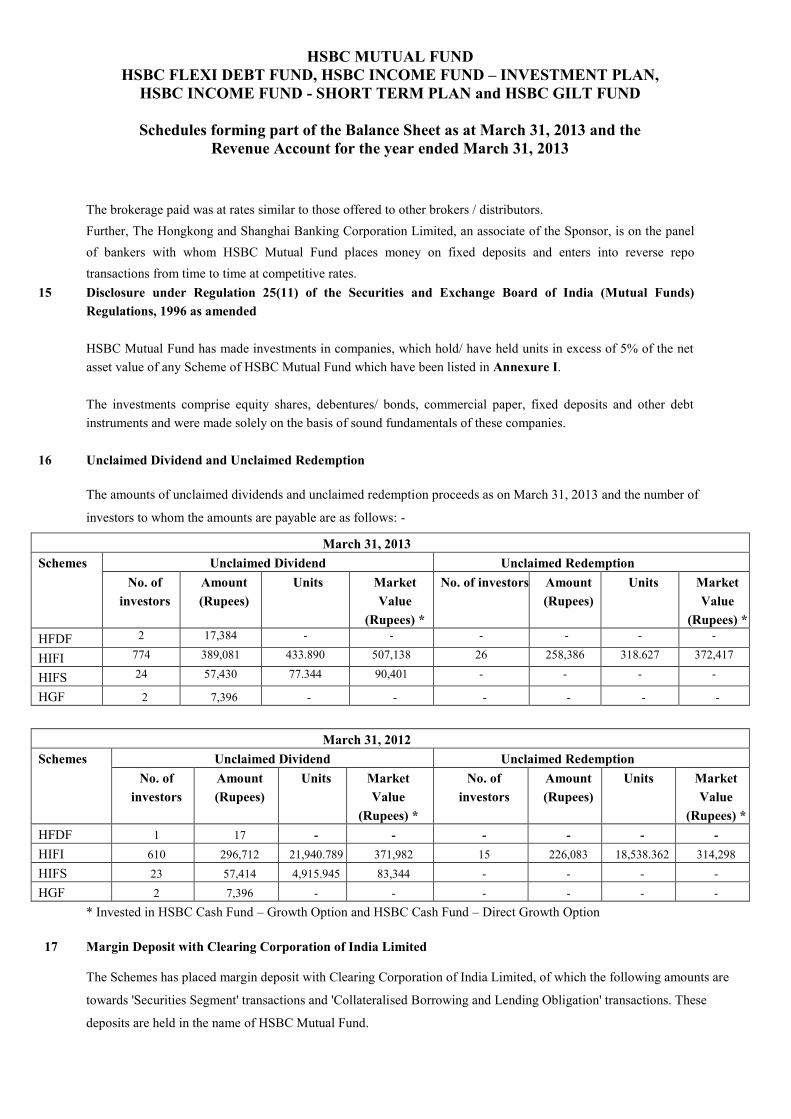
HSBC MUTUAL FUND HSBC FLEXI DEBT FUND, HSBC INCOME FUND – INVESTMENT PLAN,
HSBC INCOME FUND - SHORT TERM PLAN and HSBC GILT FUND
Schedules forming part of the Balance Sheet as at March 31, 2013 and the Revenue Account for the year ended March 31, 2013
The brokerage paid was at rates similar to those offered to other brokers / distributors. Further, The Hongkong and Shanghai Banking Corporation Limited, an associate of the Sponsor, is on the panel of bankers with whom HSBC Mutual Fund places money on fixed deposits and enters into reverse repo transactions from time to time at competitive rates.
15 Disclosure under Regulation 25(11) of the Securities and Exchange Board of India (Mutual Funds) Regulations, 1996 as amended HSBC Mutual Fund has made investments in companies, which hold/ have held units in excess of 5% of the net asset value of any Scheme of HSBC Mutual Fund which have been listed in Annexure I. The investments comprise equity shares, debentures/ bonds, commercial paper, fixed deposits and other debt instruments and were made solely on the basis of sound fundamentals of these companies.
16 Unclaimed Dividend and Unclaimed Redemption The amounts of unclaimed dividends and unclaimed redemption proceeds as on March 31, 2013 and the number of
investors to whom the amounts are payable are as follows: -
March 31, 2013 Schemes Unclaimed Dividend Unclaimed Redemption
No. of investors
Amount (Rupees)
Units Market Value
(Rupees) *
No. of investors Amount (Rupees)
Units Market Value
(Rupees) * HFDF 2 17,384 - - - - - -
HIFI 774 389,081 433.890 507,138 26 258,386 318.627 372,417
HIFS 24 57,430 77.344 90,401 - - - -
HGF 2 7,396 - - - - - -
March 31, 2012 Schemes Unclaimed Dividend Unclaimed Redemption
No. of investors
Amount (Rupees)
Units Market Value
(Rupees) *
No. of investors
Amount (Rupees)
Units Market Value
(Rupees) * HFDF 1 17 - - - - - - HIFI 610 296,712 21,940.789 371,982 15 226,083 18,538.362 314,298 HIFS 23 57,414 4,915.945 83,344 - - - - HGF 2 7,396 - - - - - - * Invested in HSBC Cash Fund – Growth Option and HSBC Cash Fund – Direct Growth Option 17 Margin Deposit with Clearing Corporation of India Limited
The Schemes has placed margin deposit with Clearing Corporation of India Limited, of which the following amounts are
towards 'Securities Segment' transactions and 'Collateralised Borrowing and Lending Obligation' transactions. These
deposits are held in the name of HSBC Mutual Fund.
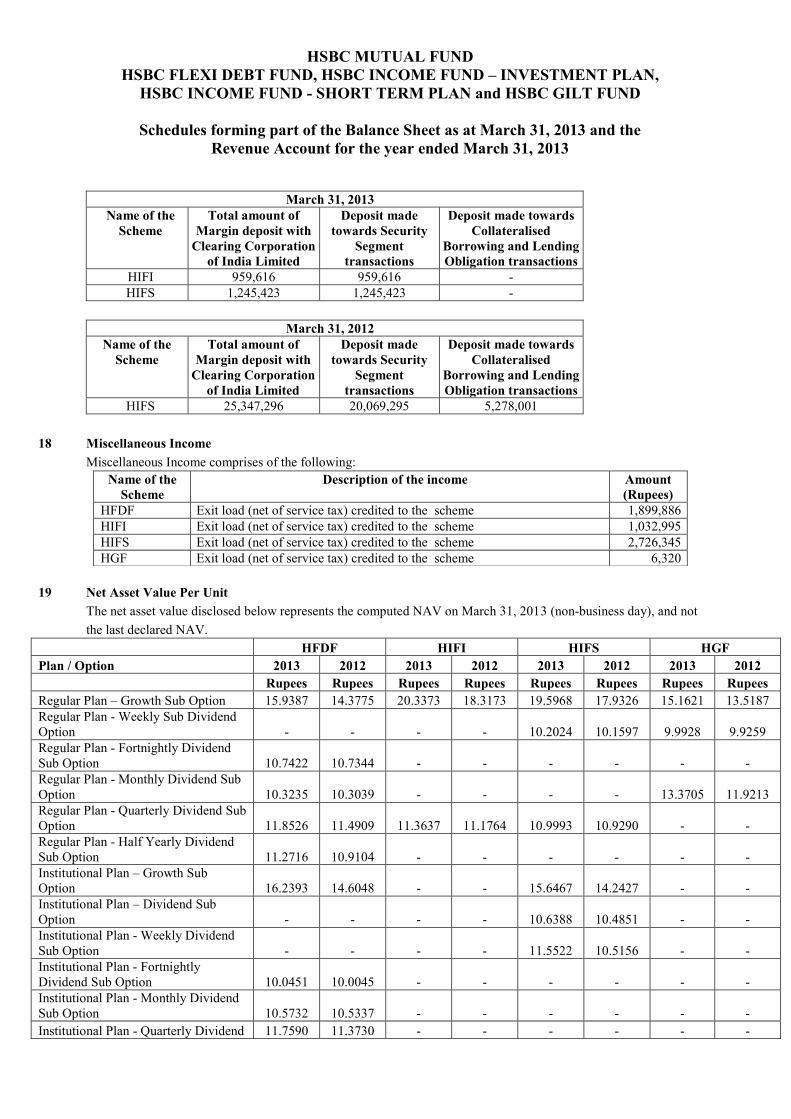
HSBC MUTUAL FUND HSBC FLEXI DEBT FUND, HSBC INCOME FUND – INVESTMENT PLAN,
HSBC INCOME FUND - SHORT TERM PLAN and HSBC GILT FUND
Schedules forming part of the Balance Sheet as at March 31, 2013 and the Revenue Account for the year ended March 31, 2013
March 31, 2013 Name of the
Scheme Total amount of
Margin deposit with Clearing Corporation
of India Limited
Deposit made towards Security
Segment transactions
Deposit made towards Collateralised
Borrowing and Lending Obligation transactions
HIFI 959,616 959,616 - HIFS 1,245,423 1,245,423 -
March 31, 2012
Name of the Scheme
Total amount of Margin deposit with
Clearing Corporation of India Limited
Deposit made towards Security
Segment transactions
Deposit made towards Collateralised
Borrowing and Lending Obligation transactions
HIFS 25,347,296 20,069,295 5,278,001 18 Miscellaneous Income
Miscellaneous Income comprises of the following: 19 Net Asset Value Per Unit
The net asset value disclosed below represents the computed NAV on March 31, 2013 (non-business day), and not the last declared NAV.
HFDF HIFI HIFS HGF Plan / Option 2013 2012 2013 2012 2013 2012 2013 2012
Rupees Rupees Rupees Rupees Rupees Rupees Rupees Rupees
Regular Plan – Growth Sub Option 15.9387 14.3775 20.3373 18.3173 19.5968 17.9326 15.1621 13.5187 Regular Plan - Weekly Sub Dividend Option - - - - 10.2024 10.1597 9.9928 9.9259 Regular Plan - Fortnightly Dividend Sub Option 10.7422 10.7344 - - - - - - Regular Plan - Monthly Dividend Sub Option 10.3235 10.3039 - - - - 13.3705 11.9213 Regular Plan - Quarterly Dividend Sub Option 11.8526 11.4909 11.3637 11.1764 10.9993 10.9290 - - Regular Plan - Half Yearly Dividend Sub Option 11.2716 10.9104 - - - - - - Institutional Plan – Growth Sub Option 16.2393 14.6048 - - 15.6467 14.2427 - - Institutional Plan – Dividend Sub Option - - - - 10.6388 10.4851 - - Institutional Plan - Weekly Dividend Sub Option - - - - 11.5522 10.5156 - - Institutional Plan - Fortnightly Dividend Sub Option 10.0451 10.0045 - - - - - - Institutional Plan - Monthly Dividend Sub Option 10.5732 10.5337 - - - - - - Institutional Plan - Quarterly Dividend 11.7590 11.3730 - - - - - -
Name of the Scheme
Description of the income Amount (Rupees)
HFDF Exit load (net of service tax) credited to the scheme 1,899,886 HIFI Exit load (net of service tax) credited to the scheme 1,032,995 HIFS Exit load (net of service tax) credited to the scheme 2,726,345 HGF Exit load (net of service tax) credited to the scheme 6,320
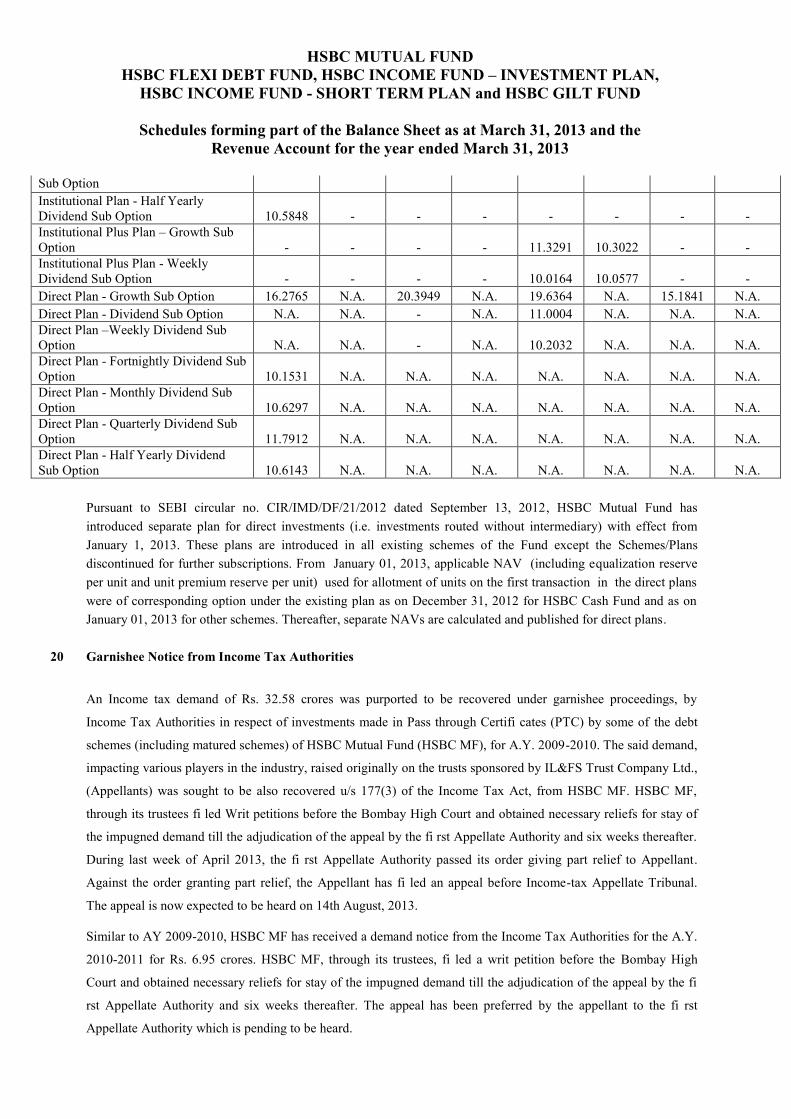
HSBC MUTUAL FUND HSBC FLEXI DEBT FUND, HSBC INCOME FUND – INVESTMENT PLAN,
HSBC INCOME FUND - SHORT TERM PLAN and HSBC GILT FUND
Schedules forming part of the Balance Sheet as at March 31, 2013 and the Revenue Account for the year ended March 31, 2013
Sub Option Institutional Plan - Half Yearly Dividend Sub Option 10.5848 - - - - - - - Institutional Plus Plan – Growth Sub Option - - - - 11.3291 10.3022 - - Institutional Plus Plan - Weekly Dividend Sub Option - - - - 10.0164 10.0577 - - Direct Plan - Growth Sub Option 16.2765 N.A. 20.3949 N.A. 19.6364 N.A. 15.1841 N.A. Direct Plan - Dividend Sub Option N.A. N.A. - N.A. 11.0004 N.A. N.A. N.A. Direct Plan –Weekly Dividend Sub Option N.A. N.A. - N.A. 10.2032 N.A. N.A. N.A. Direct Plan - Fortnightly Dividend Sub Option 10.1531 N.A. N.A. N.A. N.A. N.A. N.A. N.A. Direct Plan - Monthly Dividend Sub Option 10.6297 N.A. N.A. N.A. N.A. N.A. N.A. N.A. Direct Plan - Quarterly Dividend Sub Option 11.7912 N.A. N.A. N.A. N.A. N.A. N.A. N.A. Direct Plan - Half Yearly Dividend Sub Option 10.6143 N.A. N.A. N.A. N.A. N.A. N.A. N.A.
Pursuant to SEBI circular no. CIR/IMD/DF/21/2012 dated September 13, 2012, HSBC Mutual Fund has introduced separate plan for direct investments (i.e. investments routed without intermediary) with effect from January 1, 2013. These plans are introduced in all existing schemes of the Fund except the Schemes/Plans discontinued for further subscriptions. From January 01, 2013, applicable NAV (including equalization reserve per unit and unit premium reserve per unit) used for allotment of units on the first transaction in the direct plans were of corresponding option under the existing plan as on December 31, 2012 for HSBC Cash Fund and as on January 01, 2013 for other schemes. Thereafter, separate NAVs are calculated and published for direct plans.
20 Garnishee Notice from Income Tax Authorities
An Income tax demand of Rs. 32.58 crores was purported to be recovered under garnishee proceedings, by
Income Tax Authorities in respect of investments made in Pass through Certifi cates (PTC) by some of the debt
schemes (including matured schemes) of HSBC Mutual Fund (HSBC MF), for A.Y. 2009-2010. The said demand,
impacting various players in the industry, raised originally on the trusts sponsored by IL&FS Trust Company Ltd.,
(Appellants) was sought to be also recovered u/s 177(3) of the Income Tax Act, from HSBC MF. HSBC MF,
through its trustees fi led Writ petitions before the Bombay High Court and obtained necessary reliefs for stay of
the impugned demand till the adjudication of the appeal by the fi rst Appellate Authority and six weeks thereafter.
During last week of April 2013, the fi rst Appellate Authority passed its order giving part relief to Appellant.
Against the order granting part relief, the Appellant has fi led an appeal before Income-tax Appellate Tribunal.
The appeal is now expected to be heard on 14th August, 2013.
Similar to AY 2009-2010, HSBC MF has received a demand notice from the Income Tax Authorities for the A.Y.
2010-2011 for Rs. 6.95 crores. HSBC MF, through its trustees, fi led a writ petition before the Bombay High
Court and obtained necessary reliefs for stay of the impugned demand till the adjudication of the appeal by the fi
rst Appellate Authority and six weeks thereafter. The appeal has been preferred by the appellant to the fi rst
Appellate Authority which is pending to be heard.
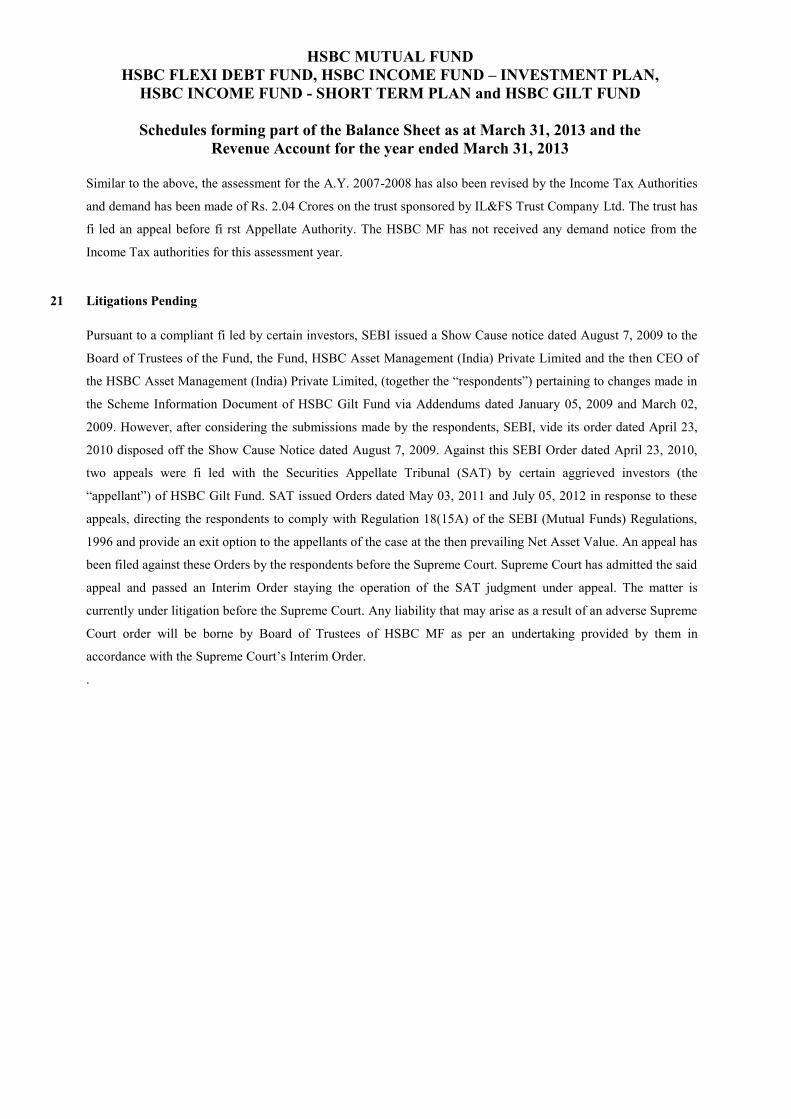
HSBC MUTUAL FUND HSBC FLEXI DEBT FUND, HSBC INCOME FUND – INVESTMENT PLAN,
HSBC INCOME FUND - SHORT TERM PLAN and HSBC GILT FUND
Schedules forming part of the Balance Sheet as at March 31, 2013 and the Revenue Account for the year ended March 31, 2013
Similar to the above, the assessment for the A.Y. 2007-2008 has also been revised by the Income Tax Authorities
and demand has been made of Rs. 2.04 Crores on the trust sponsored by IL&FS Trust Company Ltd. The trust has
fi led an appeal before fi rst Appellate Authority. The HSBC MF has not received any demand notice from the
Income Tax authorities for this assessment year.
21 Litigations Pending
Pursuant to a compliant fi led by certain investors, SEBI issued a Show Cause notice dated August 7, 2009 to the
Board of Trustees of the Fund, the Fund, HSBC Asset Management (India) Private Limited and the then CEO of
the HSBC Asset Management (India) Private Limited, (together the “respondents”) pertaining to changes made in
the Scheme Information Document of HSBC Gilt Fund via Addendums dated January 05, 2009 and March 02,
2009. However, after considering the submissions made by the respondents, SEBI, vide its order dated April 23,
2010 disposed off the Show Cause Notice dated August 7, 2009. Against this SEBI Order dated April 23, 2010,
two appeals were fi led with the Securities Appellate Tribunal (SAT) by certain aggrieved investors (the
“appellant”) of HSBC Gilt Fund. SAT issued Orders dated May 03, 2011 and July 05, 2012 in response to these
appeals, directing the respondents to comply with Regulation 18(15A) of the SEBI (Mutual Funds) Regulations,
1996 and provide an exit option to the appellants of the case at the then prevailing Net Asset Value. An appeal has
been filed against these Orders by the respondents before the Supreme Court. Supreme Court has admitted the said
appeal and passed an Interim Order staying the operation of the SAT judgment under appeal. The matter is
currently under litigation before the Supreme Court. Any liability that may arise as a result of an adverse Supreme
Court order will be borne by Board of Trustees of HSBC MF as per an undertaking provided by them in
accordance with the Supreme Court’s Interim Order.
.
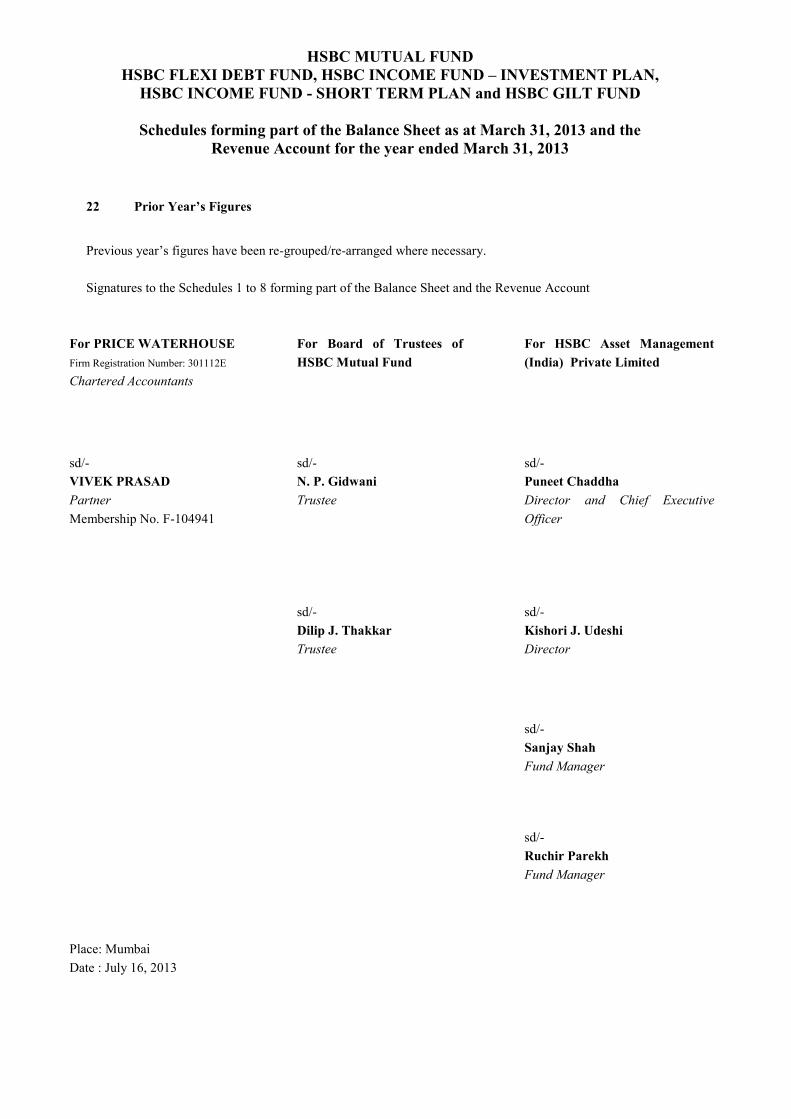
HSBC MUTUAL FUND HSBC FLEXI DEBT FUND, HSBC INCOME FUND – INVESTMENT PLAN,
HSBC INCOME FUND - SHORT TERM PLAN and HSBC GILT FUND
Schedules forming part of the Balance Sheet as at March 31, 2013 and the Revenue Account for the year ended March 31, 2013
22 Prior Year’s Figures
Previous year’s figures have been re-grouped/re-arranged where necessary. Signatures to the Schedules 1 to 8 forming part of the Balance Sheet and the Revenue Account
For PRICE WATERHOUSE Firm Registration Number: 301112E
Chartered Accountants
For Board of Trustees of HSBC Mutual Fund
For HSBC Asset Management (India) Private Limited
sd/- VIVEK PRASAD Partner Membership No. F-104941
sd/- N. P. Gidwani Trustee
sd/- Puneet Chaddha
Director and Chief Executive Officer
sd/- Dilip J. Thakkar Trustee
sd/- Kishori J. Udeshi Director sd/- Sanjay Shah Fund Manager
Place: Mumbai Date : July 16, 2013
sd/- Ruchir Parekh Fund Manager

Annexure I
(i) Transactions during the Year
Nature of Transaction Sponsor Investment ManagerAssociate of
Investment Manager
Schemes under Common Control of
Sponsor
Key Management Personnel & their
Relatives Total
Purchase of Investments - - - - - - Previous Year - - - - - -
Sale of Investments - - - - - - Previous Year - - - - - -
Subscription of Units (including switch in and dividend reinvestment) - - - - - - Previous Year - - - - - -
Redemption of Units (including switch out) - - - - - - Previous Year - - - - - -
Dividend Distribution (Including dividend reinvested) - - - - - - Previous Year - - - - - -
Investment Management and Advisory Fees - - - - - - Previous Year - - - - - -
Reimbursement of Trusteeship Fees - - - - - - Previous Year - - - - - -
Brokerage/ Commission on Distribution of Units - - 19,102,129 - - 19,102,129 Previous Year - - - - - -
Brokerage/ Commission on purchase/sales of investments - - - - - - Previous Year - - - - - -
Clearing Charges - - - - - - Previous Year - - - - - -
Fixed Deposits Placed - - - - - - Previous Year - - - - - -
Reimbursement of Expenses - - - - - - Previous Year - - - - - -
Fixed Deposits Matured - - - - - - Previous Year - - - - - -
Interest Rate Swaps placed - - - - - - Previous Year - - - - - -
Interest Rate Swaps Matured - - - - - - Previous Year - - - - - -
Reverse Repos Placed - - - - - - Previous Year - - - - - -
Reverse Repos Matured - - - - - - Previous Year - - - - - -
Charges for Services Provided by Bank - - - - - - Previous Year - - - - - -
(ii) Outstanding As At Year End
Nature of Transaction Sponsor Investment ManagerAssociate of
Investment Manager
Schemes under Common Control of
Sponsor
Key Management Personnel & their
Relatives Total
Investment Management and Advisory Fees Payable - - - - - - Previous Year - - - - - -
Trusteeship Fees Payable - - - - - - Previous Year - - - - - -
Brokerage/ Commission Payable for Distribution of Units - - 4,195,515 - - 4,195,515 Previous Year - - - - - -
Brokerage on Purchase/Sale of Investments Payable - - - - - - Previous Year - - - - - -
Units Outstanding As At Year End - - - - - - Previous Year - - - - - -
Charges for Services Provided by Bank Payable - - - - - - Previous Year - - - - - -
Dividend Payable - - - - - - Previous Year - - - - - -
Other Payables - - - - - - Previous Year - - - - - -
Other Receivables - - - - - - Previous Year - - - - - -
HSBC FLEXI DEBT FUND
Schedules forming part of the Balance Sheet as at March 31, 2013and the Revenue Account for the year ended March 31, 2013

(iii) Details of material transactions with respect to parties referred to in Note 10 (I)(iii) & (iv) for Associate of Investment Manager
April 01, 2012 to April 01, 2011 toMarch 31, 2013 March 31, 2012
Subscription of Units (including switch in and dividend reinvestment)HSBC InvestDirect Securities (India) Limited - - Investsmart Financial Services Limited - -
Redemption of Units (including switch out)HSBC InvestDirect Securities (India) Limited - - Investsmart Financial Services Limited - -
Dividend Paid/Payable( Including dividend reinvested)HSBC Asset Management India Private Limited - - HSBC Asset Management Pms Ac Signature Portfolio - -
Brokerage/ Commission on Distribution of UnitsThe Hongkong and Shanghai Banking Corporation Limited 19,097,181 - HSBC InvestDirect Securities (India) Limited - -
Brokerage/ Commission Payable for Distribution of UnitsThe Hongkong and Shanghai Banking Corporation Limited 4,194,933 -
Charges for Services Provided by BankThe Hongkong and Shanghai Banking Corporation Limited - -
Units Outstanding As At Year EndHSBC InvestDirect Securities (India) Limited - - HSBC Asset Management India Private Limited - - HSBC Asset Management PMS AC LCOP - - HSBC Asset Management PMS AC Signature Portfolio - -
(iv) Details of material transactions with respect to parties referred to in Note 10 (I)(v) for Schemes under common control of the Sponsor
April 01, 2012 to April 01, 2011 toMarch 31, 2013 March 31, 2012
Purchase of InvestmentsHSBC Ultra Short Term Bond Fund - - HSBC Floating Rate Fund Short Term Plan - -
Sale of InvestmentsHSBC Ultra Short Term Bond Fund - -
Subscription of Units (including switch in and dividend reinvestment)HSBC India Opportunities Fund - - HSBC Advantage India Fund - - HSBC Unique Opportunities Fund - -
Redemption of Units (including switch out)HSBC India Opportunities Fund - - HSBC Advantage India Fund - - HSBC Ultra Short Term Bond Fund (Formerly, HSBC Liquid Plus Fund) - -
Dividend Paid/Payable( Including dividend reinvested)
Clearing ChargesHSBC---- Fund - -
- - Units Outstanding As At Year EndHSBC Equity Fund - - HSBC India Opportunities Fund - - HSBC Advantage India Fund - - HSBC Unique Opportunities Fund - -
Other PayablesHSBC Equity Fund - - HSBC Floating Rate Fund - Long Term Plan - - HSBC MIP - Saving Plan - -
Other ReceivablesHSBC Progressive Themes Fund (Formerly, HSBC Advantage India Fund) - -
(iv) Disclosures in respect of material transactions with persons referred to in Note 10 (I)(vi) for key management personnel and their relatives
April 01, 2012 to April 01, 2011 toMarch 31, 2013 March 31, 2012
Subscription of Units (including switch in and dividend reinvestment)Kemaya Lal Kidwai - - Naina Lal Kidwai - - Nelum P Gidwani - - Rashid K Kidwai(Relative) - -
Redemption of Units (including switch out)Kemaya Lal Kidwai - - Naina Lal Kidwai - - Rashid K Kidwai(Relative) - -
Dividend Distribution (Including dividend reinvested)Naina Lal Kidwai - - Kemaya Lal Kidwai - - Naina Lal Kidwai - - Rashid K Kidwai(Relative) - -
Units Outstanding As At Year EndKemaya Lal Kidwai - - Rashid K Kidwai(Relative) - - Naina Lal Kidwai - - Rumaan Nazir Kidwai - -

Annexure I
(i) Transactions during the Year
Nature of Transaction SponsorInvestment Manager
Associate of Investment Manager
Schemes under Common Control of
Sponsor
Key Management Personnel & their
Relatives Total
Purchase of Investments - - - - - - Previous Year - - - - - -
Sale of Investments - - - - - - Previous Year - - - - - -
Subscription of Units (including switch in and dividend reinvestment) - - - - - - Previous Year - - - - - -
Redemption of Units (including switch out) - - - - - - Previous Year - - - - - -
Dividend Distribution (Including dividend reinvested) - - - - - - Previous Year - - - - - -
Investment Management and Advisory Fees - - - - - - Previous Year - - - - - -
Reimbursement of Trusteeship Fees - - - - - - Previous Year - - - - - -
Brokerage/ Commission on Distribution of Units - - 1,451,195 - - 1,451,195 Previous Year - - - - - -
Brokerage/ Commission on purchase/sales of investments - - - - - - Previous Year - - - - - -
Clearing Charges - - - - - - Previous Year - - - - - -
Fixed Deposits Placed - - - - - - Previous Year - - - - - -
Reimbursement of Expenses - - - - - - Previous Year - - - - - -
Fixed Deposits Matured - - - - - - Previous Year - - - - - -
Interest Rate Swaps placed - - - - - - Previous Year - - - - - -
Interest Rate Swaps Matured - - - - - - Previous Year - - - - - -
Reverse Repos Placed - - - - - - Previous Year - - - - - -
Reverse Repos Matured - - - - - - Previous Year - - - - - -
Charges for Services Provided by Bank - - 14,400 - - 14,400 Previous Year - - - - - -
(ii) Outstanding As At Year End
Nature of Transaction Sponsor Investment Manager
Associate of Investment Manager
Schemes under Common Control of
Sponsor
Key Management Personnel & their
Relatives Total
Investment Management and Advisory Fees Payable - - - - - - Previous Year - - - - - -
Trusteeship Fees Payable - - - - - - Previous Year - - - - - -
Brokerage/ Commission Payable on Distribution of Units - - 156,461 - - 156,461 Previous Year - - - - - -
Brokerage on Purchase/Sale of Investments Payable - - - - - - Previous Year - - - - - -
Units Outstanding As At Year End - - - - - - Previous Year - - - - - -
Charges for Services Provided by Bank Payable - - - - - - Previous Year - - - - - -
Dividend Payable - - - - - - Previous Year - - - - - -
Other Payables - - - - - - Previous Year - - - - - -
Other Receivables - - - - - - Previous Year - - - - - -
HSBC INCOME FUND - INVESTMENT PLAN
Schedules forming part of the Balance Sheet as at March 31, 2013and the Revenue Account for the year ended March 31, 2013
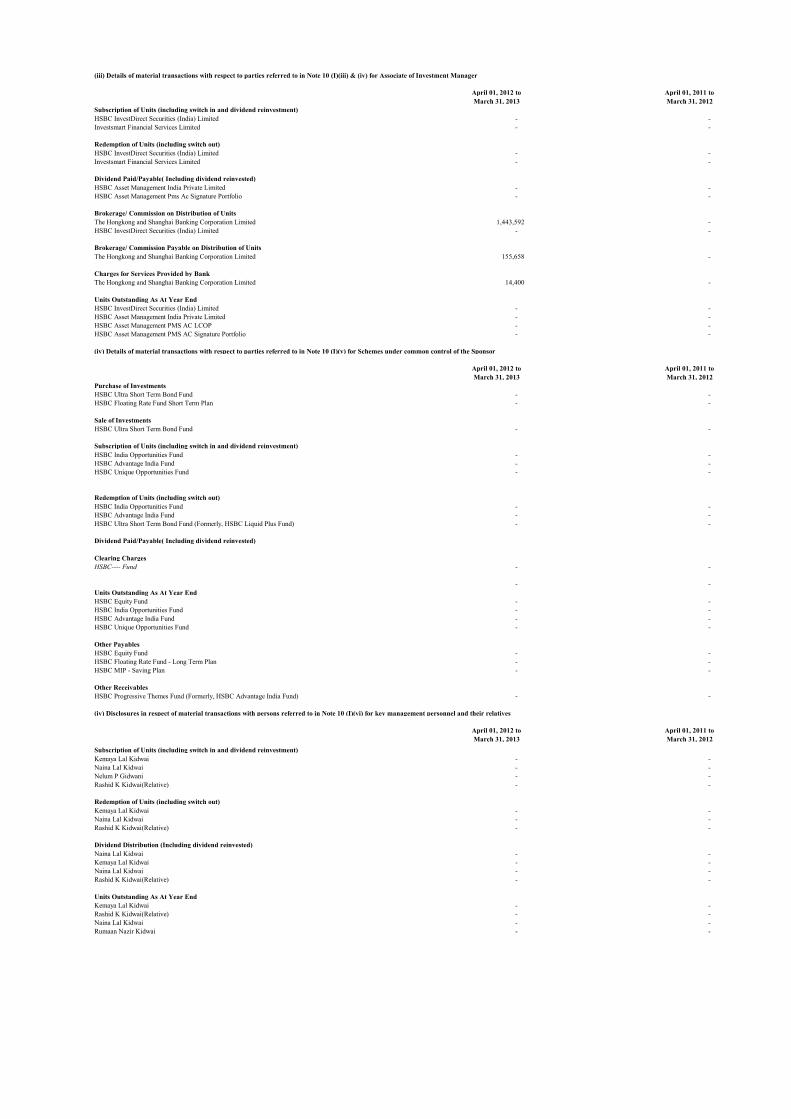
(iii) Details of material transactions with respect to parties referred to in Note 10 (I)(iii) & (iv) for Associate of Investment Manager
April 01, 2012 to April 01, 2011 toMarch 31, 2013 March 31, 2012
Subscription of Units (including switch in and dividend reinvestment)HSBC InvestDirect Securities (India) Limited - - Investsmart Financial Services Limited - -
Redemption of Units (including switch out)HSBC InvestDirect Securities (India) Limited - - Investsmart Financial Services Limited - -
Dividend Paid/Payable( Including dividend reinvested)HSBC Asset Management India Private Limited - - HSBC Asset Management Pms Ac Signature Portfolio - -
Brokerage/ Commission on Distribution of UnitsThe Hongkong and Shanghai Banking Corporation Limited 1,443,592 - HSBC InvestDirect Securities (India) Limited - -
Brokerage/ Commission Payable on Distribution of UnitsThe Hongkong and Shanghai Banking Corporation Limited 155,658 -
Charges for Services Provided by BankThe Hongkong and Shanghai Banking Corporation Limited 14,400 -
Units Outstanding As At Year EndHSBC InvestDirect Securities (India) Limited - - HSBC Asset Management India Private Limited - - HSBC Asset Management PMS AC LCOP - - HSBC Asset Management PMS AC Signature Portfolio - -
(iv) Details of material transactions with respect to parties referred to in Note 10 (I)(v) for Schemes under common control of the Sponsor
April 01, 2012 to April 01, 2011 toMarch 31, 2013 March 31, 2012
Purchase of InvestmentsHSBC Ultra Short Term Bond Fund - - HSBC Floating Rate Fund Short Term Plan - -
Sale of InvestmentsHSBC Ultra Short Term Bond Fund - -
Subscription of Units (including switch in and dividend reinvestment)HSBC India Opportunities Fund - - HSBC Advantage India Fund - - HSBC Unique Opportunities Fund - -
Redemption of Units (including switch out)HSBC India Opportunities Fund - - HSBC Advantage India Fund - - HSBC Ultra Short Term Bond Fund (Formerly, HSBC Liquid Plus Fund) - -
Dividend Paid/Payable( Including dividend reinvested)
Clearing ChargesHSBC---- Fund - -
- - Units Outstanding As At Year EndHSBC Equity Fund - - HSBC India Opportunities Fund - - HSBC Advantage India Fund - - HSBC Unique Opportunities Fund - -
Other PayablesHSBC Equity Fund - - HSBC Floating Rate Fund - Long Term Plan - - HSBC MIP - Saving Plan - -
Other ReceivablesHSBC Progressive Themes Fund (Formerly, HSBC Advantage India Fund) - -
(iv) Disclosures in respect of material transactions with persons referred to in Note 10 (I)(vi) for key management personnel and their relatives
April 01, 2012 to April 01, 2011 toMarch 31, 2013 March 31, 2012
Subscription of Units (including switch in and dividend reinvestment)Kemaya Lal Kidwai - - Naina Lal Kidwai - - Nelum P Gidwani - - Rashid K Kidwai(Relative) - -
Redemption of Units (including switch out)Kemaya Lal Kidwai - - Naina Lal Kidwai - - Rashid K Kidwai(Relative) - -
Dividend Distribution (Including dividend reinvested)Naina Lal Kidwai - - Kemaya Lal Kidwai - - Naina Lal Kidwai - - Rashid K Kidwai(Relative) - -
Units Outstanding As At Year EndKemaya Lal Kidwai - - Rashid K Kidwai(Relative) - - Naina Lal Kidwai - - Rumaan Nazir Kidwai - -

Annexure I
(i) Transactions during the Year
Nature of Transaction SponsorInvestment Manager
Associate of Investment Manager
Schemes under Common Control of
Sponsor
Key Management Personnel & their
Relatives Total
Purchase of Investments - - - - - - Previous Year - - - - - -
Sale of Investments - - - - - - Previous Year - - - - - -
Subscription of Units (including switch in and dividend reinvestment) - - 52,118,451 - - 52,118,451 Previous Year - - - - - -
Redemption of Units (including switch out) - - 52,213,761 - - 52,213,761 Previous Year - - - - - -
Dividend Distribution (Including dividend reinvested) - - 2,118,451 - - 2,118,451 Previous Year - - - - - -
Investment Management and Advisory Fees - - - - - - Previous Year - - - - - -
Reimbursement of Trusteeship Fees - - - - - - Previous Year - - - - - -
Brokerage/ Commission on Distribution of Units - - 38,066,707 - - 38,066,707 Previous Year - - - - - -
Brokerage/ Commission on purchase/sales of investments - - - - - - Previous Year - - - - - -
Clearing Charges - - - - - - Previous Year - - - - - -
Fixed Deposits Placed - - - - - - Previous Year - - - - - -
Reimbursement of Expenses - - - - - - Previous Year - - - - - -
Fixed Deposits Matured - - - - - - Previous Year - - - - - -
Interest Rate Swaps placed - - - - - - Previous Year - - - - - -
Interest Rate Swaps Matured - - - - - - Previous Year - - - - - -
Reverse Repos Placed - - - - - - Previous Year - - - - - -
Reverse Repos Matured - - - - - - Previous Year - - - - - -
Charges for Services Provided by Bank - - - - - - Previous Year - - - - - -
(ii) Outstanding As At Year End
Nature of Transaction Sponsor Investment Manager
Associate of Investment Manager
Schemes under Common Control of
Sponsor
Key Management Personnel & their
Relatives Total
Investment Management and Advisory Fees Payable - - - - - - Previous Year - - - - - -
Trusteeship Fees Payable - - - - - - Previous Year - - - - - -
Brokerage/ Commission Payable on Distribution of Units - - 4,932,559 - - 4,932,559 Previous Year - - - - - -
Brokerage on Purchase/Sale of Investments Payable - - - - - - Previous Year - - - - - -
Units Outstanding As At Year End - - - - 7,983,183 7,983,183 Previous Year - - - - - -
Charges for Services Provided by Bank Payable - - - - - - Previous Year - - - - - -
Dividend Payable - - - - - - Previous Year - - - - - -
Other Payables - - - - - - Previous Year - - - - - -
Other Receivables - - - - - - Previous Year - - - - - -
HSBC INCOME FUND - SHORT TERM PLAN
Schedules forming part of the Balance Sheet as at March 31, 2013and the Revenue Account for the year ended March 31, 2013
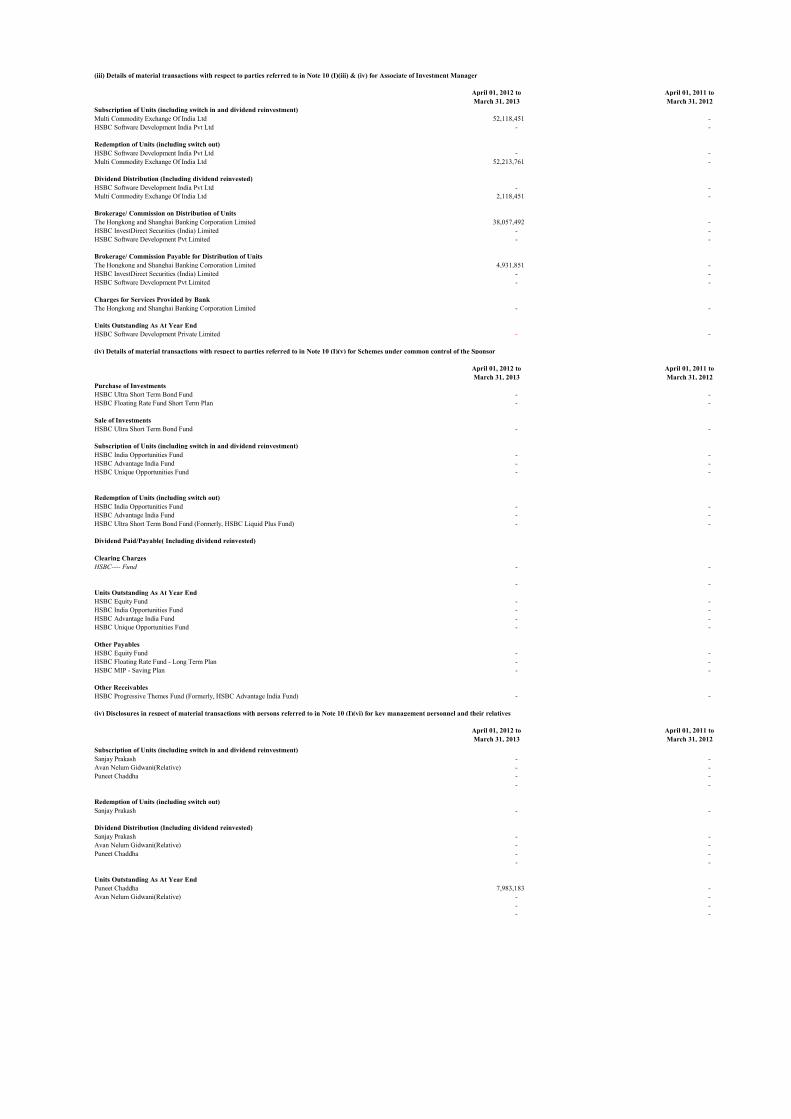
(iii) Details of material transactions with respect to parties referred to in Note 10 (I)(iii) & (iv) for Associate of Investment Manager
April 01, 2012 to April 01, 2011 toMarch 31, 2013 March 31, 2012
Subscription of Units (including switch in and dividend reinvestment)Multi Commodity Exchange Of India Ltd 52,118,451 - HSBC Software Development India Pvt Ltd - -
Redemption of Units (including switch out)HSBC Software Development India Pvt Ltd - - Multi Commodity Exchange Of India Ltd 52,213,761 -
Dividend Distribution (Including dividend reinvested)HSBC Software Development India Pvt Ltd - - Multi Commodity Exchange Of India Ltd 2,118,451 -
Brokerage/ Commission on Distribution of UnitsThe Hongkong and Shanghai Banking Corporation Limited 38,057,492 - HSBC InvestDirect Securities (India) Limited - - HSBC Software Development Pvt Limited - -
Brokerage/ Commission Payable for Distribution of UnitsThe Hongkong and Shanghai Banking Corporation Limited 4,931,851 - HSBC InvestDirect Securities (India) Limited - - HSBC Software Development Pvt Limited - -
Charges for Services Provided by BankThe Hongkong and Shanghai Banking Corporation Limited - -
Units Outstanding As At Year EndHSBC Software Development Private Limited - -
(iv) Details of material transactions with respect to parties referred to in Note 10 (I)(v) for Schemes under common control of the Sponsor
April 01, 2012 to April 01, 2011 toMarch 31, 2013 March 31, 2012
Purchase of InvestmentsHSBC Ultra Short Term Bond Fund - - HSBC Floating Rate Fund Short Term Plan - -
Sale of InvestmentsHSBC Ultra Short Term Bond Fund - -
Subscription of Units (including switch in and dividend reinvestment)HSBC India Opportunities Fund - - HSBC Advantage India Fund - - HSBC Unique Opportunities Fund - -
Redemption of Units (including switch out)HSBC India Opportunities Fund - - HSBC Advantage India Fund - - HSBC Ultra Short Term Bond Fund (Formerly, HSBC Liquid Plus Fund) - -
Dividend Paid/Payable( Including dividend reinvested)
Clearing ChargesHSBC---- Fund - -
- - Units Outstanding As At Year EndHSBC Equity Fund - - HSBC India Opportunities Fund - - HSBC Advantage India Fund - - HSBC Unique Opportunities Fund - -
Other PayablesHSBC Equity Fund - - HSBC Floating Rate Fund - Long Term Plan - - HSBC MIP - Saving Plan - -
Other ReceivablesHSBC Progressive Themes Fund (Formerly, HSBC Advantage India Fund) - -
(iv) Disclosures in respect of material transactions with persons referred to in Note 10 (I)(vi) for key management personnel and their relatives
April 01, 2012 to April 01, 2011 toMarch 31, 2013 March 31, 2012
Subscription of Units (including switch in and dividend reinvestment)Sanjay Prakash - - Avan Nelum Gidwani(Relative) - - Puneet Chaddha - -
- -
Redemption of Units (including switch out)Sanjay Prakash - -
Dividend Distribution (Including dividend reinvested)Sanjay Prakash - - Avan Nelum Gidwani(Relative) - - Puneet Chaddha - -
- -
Units Outstanding As At Year EndPuneet Chaddha 7,983,183 - Avan Nelum Gidwani(Relative) - -
- - - -

Annexure I
(i) Transactions during the Year
Nature of Transaction SponsorInvestment Manager
Associate of Investment Manager
Schemes under Common Control of
Sponsor
Key Management Personnel & their
Relatives Total
Purchase of Investments - - - - - - Previous Year - - - - - -
Sale of Investments - - - - - - Previous Year - - - - - -
Subscription of Units (including switch in and dividend reinvestment) - - - - - - Previous Year - - - - - -
Redemption of Units (including switch out) - - - - - - Previous Year - - - - - -
Dividend Distribution (Including dividend reinvested) - - - - - - Previous Year - - - - - -
Investment Management and Advisory Fees - - - - - - Previous Year - - - - - -
Reimbursement of Trusteeship Fees - - - - - - Previous Year - - - - - -
Brokerage/ Commission on Distribution of Units - - 12,593 - - 12,593 Previous Year - - - - - -
Brokerage/ Commission on purchase/sales of investments - - - - - - Previous Year - - - - - -
Clearing Charges - - - - - - Previous Year - - - - - -
Fixed Deposits Placed - - - - - - Previous Year - - - - - -
Reimbursement of Expenses - - - - - - Previous Year - - - - - -
Fixed Deposits Matured - - - - - - Previous Year - - - - - -
Interest Rate Swaps placed - - - - - - Previous Year - - - - - -
Interest Rate Swaps Matured - - - - - - Previous Year - - - - - -
Reverse Repos Placed - - - - - - Previous Year - - - - - -
Reverse Repos Matured - - - - - - Previous Year - - - - - -
Charges for Services Provided by Bank - - - - - - Previous Year - - - - - -
(ii) Outstanding As At Year End
Nature of Transaction Sponsor Investment Manager
Associate of Investment Manager
Schemes under Common Control of
Sponsor
Key Management Personnel & their
Relatives Total
Investment Management and Advisory Fees Payable - - - - - - Previous Year - 5,064 - - - 5,064
Trusteeship Fees Payable - - - - - - Previous Year - - - - - -
Brokerage/ Commission Payable on Distribution of Units - - 2,426 - - 2,426 Previous Year - - 1,643 - - 1,643
Brokerage on Purchase/Sale of Investments Payable - - - - - - Previous Year - - - - - -
Units Outstanding As At Year End - - - - - - Previous Year - - - - - -
Charges for Services Provided by Bank Payable - - - - - - Previous Year - - - - - -
Dividend Payable - - - - - - Previous Year - - - - - -
Other Payables - - - - - - Previous Year - - - - - -
Other Receivables - - - - - - Previous Year - 2,202 - - - 2,202
HSBC GILT FUND
Schedules forming part of the Balance Sheet as at March 31, 2013and the Revenue Account for the year ended March 31, 2013

(iii) Details of material transactions with respect to parties referred to in Note 10 (I)(iii) & (iv) for Associate of Investment Manager
April 01, 2012 to April 01, 2011 toMarch 31, 2013 March 31, 2012
Subscription of Units (including switch in and dividend reinvestment)HSBC InvestDirect Securities (India) Limited - Investsmart Financial Services Limited - -
Redemption of Units (including switch out)HSBC InvestDirect Securities (India) Limited - - Investsmart Financial Services Limited - -
Dividend Paid/Payable( Including dividend reinvested)HSBC Asset Management India Private Limited - - HSBC Asset Management Pms Ac Signature Portfolio - -
Brokerage/ Commission on Distribution of UnitsThe Hongkong and Shanghai Banking Corporation Limited - - HSBC InvestDirect Securities (India) Limited - -
Brokerage/ Commission Payable for Distribution of UnitsThe Hongkong and Shanghai Banking Corporation Limited - -
Charges for Services Provided by BankThe Hongkong and Shanghai Banking Corporation Limited - -
Units Outstanding As At Year EndHSBC InvestDirect Securities (India) Limited - - HSBC Asset Management India Private Limited - - HSBC Asset Management PMS AC LCOP - - HSBC Asset Management PMS AC Signature Portfolio - -
(iv) Details of material transactions with respect to parties referred to in Note 10 (I)(v) for Schemes under common control of the Sponsor
April 01, 2012 to April 01, 2011 toMarch 31, 2013 March 31, 2012
Purchase of InvestmentsHSBC Ultra Short Term Bond Fund - - HSBC Floating Rate Fund Short Term Plan - -
Sale of InvestmentsHSBC Ultra Short Term Bond Fund - -
Subscription of Units (including switch in and dividend reinvestment)HSBC India Opportunities Fund - - HSBC Advantage India Fund - - HSBC Unique Opportunities Fund - -
Redemption of Units (including switch out)HSBC India Opportunities Fund - - HSBC Advantage India Fund - - HSBC Ultra Short Term Bond Fund (Formerly, HSBC Liquid Plus Fund) - -
Dividend Paid/Payable( Including dividend reinvested)
Clearing ChargesHSBC---- Fund - -
- - Units Outstanding As At Year EndHSBC Equity Fund - - HSBC India Opportunities Fund - - HSBC Advantage India Fund - - HSBC Unique Opportunities Fund - -
Other PayablesHSBC Equity Fund - - HSBC Floating Rate Fund - Long Term Plan - - HSBC MIP - Saving Plan - -
Other ReceivablesHSBC Progressive Themes Fund (Formerly, HSBC Advantage India Fund) - -
(iv) Disclosures in respect of material transactions with persons referred to in Note 10 (I)(vi) for key management personnel and their relatives
April 01, 2012 to April 01, 2011 toMarch 31, 2013 March 31, 2012
Subscription of Units (including switch in and dividend reinvestment)Kemaya Lal Kidwai - - Naina Lal Kidwai - - Nelum P Gidwani - - Rashid K Kidwai(Relative) - -
Redemption of Units (including switch out)Kemaya Lal Kidwai - - Naina Lal Kidwai - - Rashid K Kidwai(Relative) - -
Dividend Distribution (Including dividend reinvested)Naina Lal Kidwai - - Kemaya Lal Kidwai - - Naina Lal Kidwai - - Rashid K Kidwai(Relative) - -
Units Outstanding As At Year EndKemaya Lal Kidwai - - Rashid K Kidwai(Relative) - - Naina Lal Kidwai - - Rumaan Nazir Kidwai - -

Company Name Schemes invested in by the Company
Investment made by schemes of HSBC Mutual Fund in the
company/subsidiary
Aggregate cost of acquisition during
the year ended March 31, 2013
Outstanding as at March 31, 2013(At Market / Fair
Value)
(Rupees in Lakhs) (Rupees in Lakhs)
Hindalco Industries Limited HFTS81 HDF 309.76 219.84
HIOF 514.67 366.40
HTSF 409.96 -
HUOF 93.18 64.76
Larsen & Toubro Limited HCF HDF 794.22 683.10
HFRF HEF - 1,912.68
HIOF 338.53 618.21
HMIP 365.99 -
HPTF 556.00 -
HTSF 137.77 -
HUOF 149.90 133.20
L&T Finance Limited HCF 9,110.12 -
(Subsidiary of Larsen & Toubro Limited) HFRF 4,231.84 -
HUSBF 9.87 -
Mahindra & Mahindra Limited HCF HTSF 956.77 -
Mahindra & Mahindra Financial Services Limited HCF 7,207.55 2,473.50
(Subsidiary of Mahindra & Mahindra Limited) HFRF 10,164.61 -
HIF 1,973.43 -
HMIP 2,498.35 -
HUSBF 345.73 -
Reliance Industries Limited HIF HDF 483.06 656.97
HFTS90 HEF - 2,705.15
HIOF - 699.47
HUOF - 120.57
Shriram Transport Finance Company Limited HCF HCF 1,483.40 -
HFDF 2,993.62 3,307.96
HIF 3,498.62 7,914.07
HMIP 280.88 3,080.23
Shriram Equipment Finance Company Ltd HCF 988.86 -
(Subsidiary of Shriram Transport Finance Company Limited) HFRF 1,486.31 -
United Bank of India HCF HCF 3,239.95 2,376.57
HFRF 97.33 -
HFTS80 2,498.34 -
HFTS83 1,775.75 -
HIF 3,061.35 2,578.75
HPTF 240.51 189.34
HUSBF 486.66 -
Scheme Name Scheme CodeHSBC Cash Fund HCF
HSBC Dynamic Fund HDF
HSBC Equity Fund HEF
HSBC Flexi Debt Fund HFDF
HSBC Floating Rate Fund - Long Term Plan HFRF
HSBC Fixed Term Series 79 HFTS79
HSBC Fixed Term Series 81 HFTS81
HSBC Fixed Term Series 80 HFTS80
HSBC Fixed Term Series 83 HFTS83
HSBC Income Fund HIF
HSBC India Opportunities Fund HIOF
HSBC Progressive Themes Fund HPTF
HSBC Small Cap Fund HSCF
HSBC Tax Saver Equity Fund HTSF
HSBC Ultra Short Term Bond Fund HUSBF
HSBC Fixed Term Series 90 HFTS90
HSBC MIP Fund HMIP
HSBC Unique Opportunities Fund HUOF
Annexure II
Disclosure under Regulation 25(11) of the Securities and Exchange Board of India (Mutual Funds) Regulations, 1996 as amended Investments made by the schemes of HSBC Mutual Fund in Companies or their subsidiaries that have invested more than 5%
of the net assets of any scheme
The above investments comprise equity shares, debentures / bonds, commercial papers, certificate of deposits, fixed deposits and other debt instruments. These investments have been made on account of their high credit quality and competitive yield for the investment in fixed income/ money market instruments and in case of equity shares because of
attractive valuations of these companies.

HPU Final HFDF
April 01, 2012to March 31, 2013
April 01, 2011to March 31, 2012
April 01, 2010to March 31, 2011
Rupees Rupees Rupees
(a) Net asset value per unit at the end of the period (Note 2.5)Regular Option - Growth Sub-option 15.9387 14.3775 13.1704 Regular Option - Monthly Dividend Sub-option 10.3235 10.3039 10.3414 Regular Option - Fortnightly Dividend Plan Sub-option 10.7422 10.7344 10.7327 Regular Option - Quarterly Dividend Sub-option 11.8526 11.4909 11.1421 Regular Option - Half Yearly Dividend Sub-option 11.2716 10.9104 10.6003 Growth Option 16.2393 14.6048 13.3320 Monthly Dividend Option 10.5732 10.5337 10.5730 Fortnightly Dividend Option 10.0451 10.0045 10.0579 Quarterly Dividend Option 11.7590 11.3730 10.9965 Half Yearly Dividend Option 10.5850 - 10.2816 Direct Plan - Growth Option 10.6297 N.A N.A Direct Plan - Monthly Dividend Option 16.2765 N.A N.A Direct Plan - Fortnightly Dividend Option 10.1531 N.A N.A Direct Plan - Half Yearly Dividend Option 10.6143 N.A N.A Direct Plan - Quarterly Dividend Option 11.7912 N.A N.A
(b) Gross Income
(i) income other than profit on sale of investment 0.6939 0.5682 1.2643
(ii) income from profit on inter scheme sales/transfer of investment - - -
(iii)income (net) from profit on sale of investments to third party 0.2562 0.0647 0.0660
(iv) transfer to revenue account from past year’s reserve - - 0.3689
Gross income and gains 0.9502 0.6329 1.6992
(c) Aggregate of expenses, writeoff, amortisation and charges 0.1408 0.1005 0.2843
(d) Net income 0.8094 0.5324 1.4150
(e) Net change in unrealised appreciation / (depreciation) in valueof investments (0.0119) (0.0124) (0.0002)
(f) Redemption price
-HighestRegular Option - Growth Sub-option 15.9306 14.3656 13.1489 Regular Option - Monthly Dividend Sub-option 10.5988 10.4783 10.3577 Regular Option - Fortnightly Dividend Plan Sub-option 10.9839 10.8011 10.7562 Regular Option - Quarterly Dividend Sub-option 12.0604 11.6610 11.2877 Regular Option - Half Yearly Dividend Sub-option 11.4903 - 10.5858 Growth Option 16.2307 14.5805 13.0456 Monthly Dividend Option 10.8407 10.5946 10.5941 Fortnightly Dividend Option 10.2178 10.0843 10.0902 Quarterly Dividend Option 11.9737 11.1612 10.9336 Half Yearly Dividend Option 10.8805 10.3141 10.2862 Direct Plan - Growth Option 16.1229 N.A N.A Direct Plan - Monthly Dividend Option - N.A N.A Direct Plan - Fortnightly Dividend Option - N.A N.A Direct Plan - Half Yearly Dividend Option - N.A N.A Direct Plan - Quarterly Dividend Option - N.A N.A
-LowestRegular Option - Growth Sub-option 14.3848 13.1836 12.4693 Regular Option - Monthly Dividend Sub-option 10.3090 10.3060 10.2910 Regular Option - Fortnightly Dividend Plan Sub-option 10.7430 10.7357 10.7105 Regular Option - Quarterly Dividend Sub-option 11.5033 11.1661 11.0611 Regular Option - Half Yearly Dividend Sub-option 11.1454 - 10.4074 Growth Option 14.6126 13.3924 12.7801 Monthly Dividend Option 10.5688 10.5386 10.5382 Fortnightly Dividend Option 10.0436 10.0716 10.0396 Quarterly Dividend Option 11.5686 11.1612 10.9336 Half Yearly Dividend Option 10.8805 10.3141 10.0000 Direct Plan - Growth Option 16.1229 N.A N.A Direct Plan - Monthly Dividend Option - N.A N.A Direct Plan - Fortnightly Dividend Option - N.A N.A Direct Plan - Half Yearly Dividend Option - N.A N.A Direct Plan - Quarterly Dividend Option - N.A N.A
(g) Purchase price
-HighestRegular Option - Growth Sub-option 15.9122 14.3747 13.1201 Regular Option - Monthly Dividend Sub-option 10.5622 10.4783 10.3245 Regular Option - Fortnightly Dividend Plan Sub-option 10.8407 10.8320 10.7734 Regular Option - Quarterly Dividend Sub-option 12.0345 11.6610 11.1454 Regular Option - Half Yearly Dividend Sub-option 11.4134 11.2756 10.6654 Growth Option 16.2307 14.6018 13.1362 Monthly Dividend Option 10.8407 10.6048 10.5475 Fortnightly Dividend Option 10.1566 10.0579 10.0592 Quarterly Dividend Option 11.9737 11.5279 10.9511 Half Yearly Dividend Option 10.9525 - 10.2262 Direct Plan - Growth Option 16.2664 N.A N.A Direct Plan - Monthly Dividend Option 10.6681 N.A N.A Direct Plan - Fortnightly Dividend Option 10.1675 N.A N.A Direct Plan - Half Yearly Dividend Option 10.7272 N.A N.A Direct Plan - Quarterly Dividend Option 11.7026 N.A N.A
-LowestRegular Option - Growth Sub-option 14.3848 13.1836 12.4693 Regular Option - Monthly Dividend Sub-option 10.3018 10.3018 10.3019 Regular Option - Fortnightly Dividend Plan Sub-option 10.7322 10.7292 10.7327 Regular Option - Quarterly Dividend Sub-option 11.4967 11.1735 11.0575 Regular Option - Half Yearly Dividend Sub-option 10.9370 10.8072 10.2683 Growth Option 14.6556 13.3742 12.7659 Monthly Dividend Option 10.5315 10.5315 10.5321 Fortnightly Dividend Option 10.0001 10.0000 10.0579 Quarterly Dividend Option 11.4331 11.3264 10.9511 Half Yearly Dividend Option 10.0000 - 10.0000 Direct Plan - Growth Option 16.0200 N.A N.A Direct Plan - Monthly Dividend Option 10.5984 N.A N.A Direct Plan - Fortnightly Dividend Option 10.1318 N.A N.A Direct Plan - Half Yearly Dividend Option 10.5904 N.A N.A Direct Plan - Quarterly Dividend Option 11.7026 N.A N.A
(h) Price earnings ratio NA NA NA
(i) Ratio of expenses to average daily net assets by percentageRegular 1.90% 1.85% 1.85%Institutional 1.62% 1.51% 1.50%Direct 0.50% NA NA
(j) Ratio of gross income (including net loss on sale of 11.76% 9.91% 7.22%investments and net change in unrealised depreciation in valueof investments) to average daily net assets by percentage
* The above per unit calculations are based on the number of units in issue at the end of the financial year.
HSBC MUTUAL FUND - HSBC FLEXI DEBT FUND
HISTORICAL PER UNIT STATISTICS*

HPU Final HGF
Rupees Rupees Rupees(a) Net asset value per unit at the end of the year (Note 2.5)
Growth Sub-Option 15.1621 13.5187 12.4926Dividend Sub-Option 13.3705 11.9213 11.0165Weekly Dividend 9.9928 9.9259 10.0429Direct Plan - Growth Option 15.1841 N.A N.A
(b) Gross Income(i) income other than profit on sale of investment 0.9430 0.8065 0.8830
(ii) income from profit on inter scheme sales/transfer of investment - - -
(iii) income (net) from profit on sale of investments to third party 0.4786 0.1058 0.2542
(iv) transfer to revenue account from past year’s reserve - - 0.0346
Gross income and gains 1.4216 0.9123 1.1718 (c) Aggregate of expenses, writeoff, amortisation and charges 0.1056 0.0756 0.1041
(d) Net income 1.3160 0.8367 1.0677
(e) Net unrealised appreciation / (depreciation) in value of investments (0.0235) (0.0315) -
(f) Redemption price
- Growth Option 15.1731 13.6172 12.4932 - Dividend Option - 11.9030 10.8536 - Weekly Dividend Option 10.0259 10.0112 9.8522 - Direct Plan - Growth Option - N.A N.A
Lowest- Growth Option 13.6211 12.4893 11.5936 - Dividend Option - 11.0169 10.2236 - Weekly Dividend Option 10.0259 9.9606 9.8522 - Direct Plan - Growth Option - N.A N.A
(g) Purchase price
Highest- Growth Option 15.1675 13.6285 12.4932 - Dividend Option - 12.0179 10.8422 - Weekly Dividend Option 10.0280 10.0429 10.0429 - Direct Plan - Growth Option 15.0327 N.A N.A
Lowest- Growth Option 13.6219 12.4893 11.6058 - Dividend Option - 11.0304 10.2820 - Weekly Dividend Option 9.9470 9.9960 9.6583 - Direct Plan-Growth Option 14.8061 N.A N.A
(h) Price earnings ratio NA NA NA
(i) Ratio of expenses to average daily net assets by percentageRegular 0.92% 0.75% 0.75%Direct 0.45%
(j) Ratio of gross income (including net profit / loss on sale of investments and net change in unrealised depreciation in value of investments) to average daily net assets by percentage 12.07% 8.73% 8.19%
* The above per unit calculations are based on the number of units in issue at the end of the financial year
Highest
HSBC MUTUAL FUND - HSBC GILT FUND
HISTORICAL PER UNIT STATISTICS*
April 01, 2012 April 01, 2011to March 31, 2013 to March 31, 2012
April 01, 2010to March 31, 2011
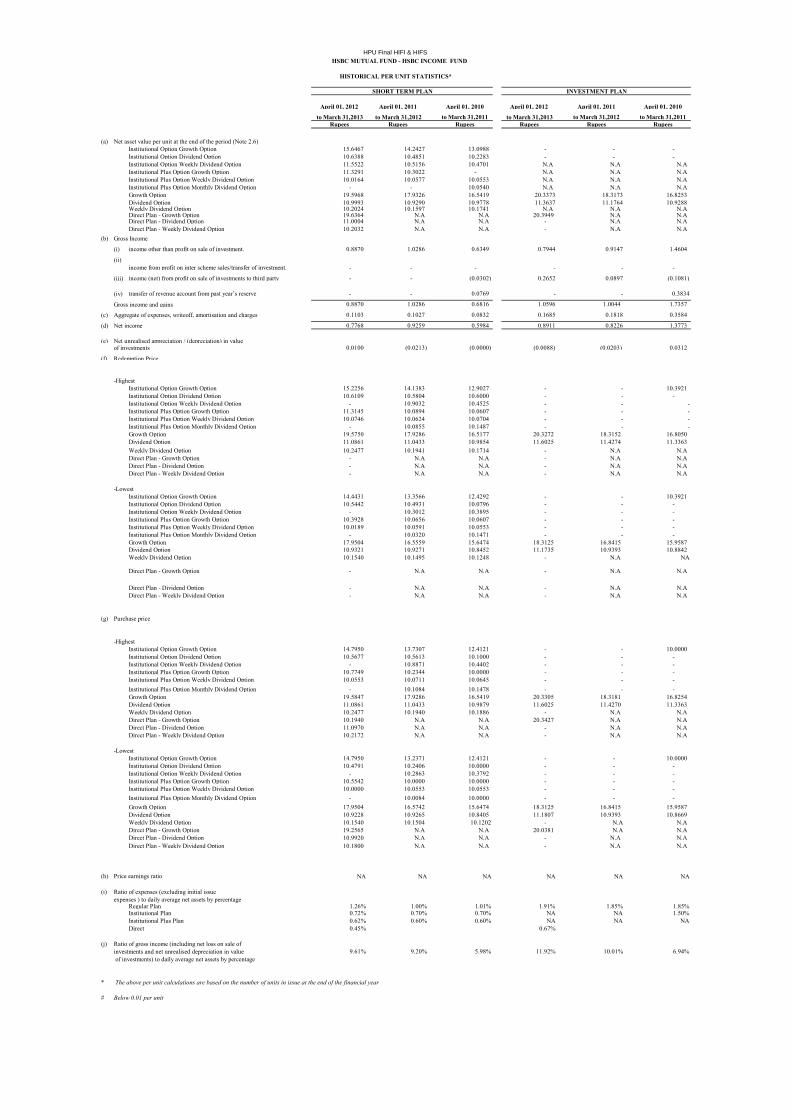
HPU Final HIFI & HIFS
April 01, 2012 April 01, 2011 April 01, 2010 April 01, 2012 April 01, 2011 April 01, 2010
to March 31,2013 to March 31,2012 to March 31,2011 to March 31,2013 to March 31,2012 to March 31,2011Rupees Rupees Rupees Rupees Rupees Rupees
(a) Net asset value per unit at the end of the period (Note 2.6)Institutional Option Growth Option 15.6467 14.2427 13.0988 - - - Institutional Option Dividend Option 10.6388 10.4851 10.2283 - - - Institutional Option Weekly Dividend Option 11.5522 10.5156 10.4701 N.A N.A N.AInstitutional Plus Option Growth Option 11.3291 10.3022 - N.A N.A N.AInstitutional Plus Option Weekly Dividend Option 10.0164 10.0577 10.0553 N.A N.A N.AInstitutional Plus Option Monthly Dividend Option - - 10.0540 N.A N.A N.AGrowth Option 19.5968 17.9326 16.5419 20.3373 18.3173 16.8253 Dividend Option 10.9993 10.9290 10.9778 11.3637 11.1764 10.9288 Weekly Dividend Option 10.2024 10.1597 10.1741 N.A N.A N.ADirect Plan - Growth Option 19.6364 N.A N.A 20.3949 N.A N.ADirect Plan - Dividend Option 11.0004 N.A N.A - N.A N.ADirect Plan - Weekly Dividend Option 10.2032 N.A N.A - N.A N.AN.A N.A
(b) Gross Income
(i) income other than profit on sale of investment. 0.8870 1.0286 0.6349 0.7944 0.9147 1.4604
(ii)income from profit on inter scheme sales/transfer of investment. - - - - - -
(iii) income (net) from profit on sale of investments to third party - - (0.0302) 0.2652 0.0897 (0.1081)
(iv) transfer of revenue account from past year’s reserve - - 0.0769 - - 0.3834
Gross income and gains 0.8870 1.0286 0.6816 1.0596 1.0044 1.7357
(c) Aggregate of expenses, writeoff, amortisation and charges 0.1103 0.1027 0.0832 0.1685 0.1818 0.3584
(d) Net income 0.7768 0.9259 0.5984 0.8911 0.8226 1.3773
(e) Net unrealised appreciation / (depreciation) in valueof investments 0.0100 (0.0213) (0.0000) (0.0088) (0.0203) 0.0312
(f) Redemption Price
-HighestInstitutional Option Growth Option 15.2256 14.1383 12.9027 - - 10.3921 Institutional Option Dividend Option 10.6109 10.5804 10.6000 - - - Institutional Option Weekly Dividend Option - 10.9032 10.4525 - - - Institutional Plus Option Growth Option 11.3145 10.0894 10.0607 - - - Institutional Plus Option Weekly Dividend Option 10.0746 10.0624 10.0704 - - - Institutional Plus Option Monthly Dividend Option - 10.0855 10.1487 - - - Growth Option 19.5750 17.9286 16.5177 20.3272 18.3152 16.8050 Dividend Option 11.0861 11.0433 10.9854 11.6025 11.4274 11.3363 Weekly Dividend Option 10.2477 10.1941 10.1714 - N.A N.ADirect Plan - Growth Option - N.A N.A - N.A N.ADirect Plan - Dividend Option - N.A N.A - N.A N.ADirect Plan - Weekly Dividend Option - N.A N.A - N.A N.A
-LowestInstitutional Option Growth Option 14.4431 13.3566 12.4292 - - 10.3921 Institutional Option Dividend Option 10.5442 10.4931 10.0796 - - - Institutional Option Weekly Dividend Option - 10.3012 10.3895 - - - Institutional Plus Option Growth Option 10.3928 10.0656 10.0607 - - - Institutional Plus Option Weekly Dividend Option 10.0189 10.0591 10.0553 - - - Institutional Plus Option Monthly Dividend Option - 10.0320 10.1471 - - - Growth Option 17.9504 16.5559 15.6474 18.3125 16.8415 15.9587 Dividend Option 10.9321 10.9271 10.8452 11.1735 10.9393 10.8842 Weekly Dividend Option 10.1540 10.1495 10.1248 - N.A NA
Direct Plan - Growth Option - N.A N.A - N.A N.A
Direct Plan - Dividend Option - N.A N.A - N.A N.ADirect Plan - Weekly Dividend Option - N.A N.A - N.A N.A
(g) Purchase price
-HighestInstitutional Option Growth Option 14.7950 13.7307 12.4121 - - 10.0000 Institutional Option Dividend Option 10.5677 10.5613 10.1000 - - - Institutional Option Weekly Dividend Option - 10.8871 10.4402 - - - Institutional Plus Option Growth Option 10.7749 10.2344 10.0000 - - - Institutional Plus Option Weekly Dividend Option 10.0553 10.0711 10.0645 - - - Institutional Plus Option Monthly Dividend Option - 10.1084 10.1478 - - - Growth Option 19.5847 17.9286 16.5419 20.3305 18.3181 16.8254 Dividend Option 11.0861 11.0433 10.9879 11.6025 11.4270 11.3363 Weekly Dividend Option 10.2477 10.1940 10.1886 - N.A N.ADirect Plan - Growth Option 10.1940 N.A N.A 20.3427 N.A N.ADirect Plan - Dividend Option 11.0970 N.A N.A - N.A N.ADirect Plan - Weekly Dividend Option 10.2172 N.A N.A - N.A N.A
-LowestInstitutional Option Growth Option 14.7950 13.2371 12.4121 - - 10.0000 Institutional Option Dividend Option 10.4791 10.2406 10.0000 - - - Institutional Option Weekly Dividend Option - 10.2863 10.3792 - - - Institutional Plus Option Growth Option 10.5542 10.0000 10.0000 - - - Institutional Plus Option Weekly Dividend Option 10.0000 10.0553 10.0553 - - - Institutional Plus Option Monthly Dividend Option - 10.0084 10.0000 - - - Growth Option 17.9504 16.5742 15.6474 18.3125 16.8415 15.9587 Dividend Option 10.9228 10.9265 10.8405 11.1807 10.9393 10.8669 Weekly Dividend Option 10.1540 10.1504 10.1202 - N.A N.ADirect Plan - Growth Option 19.2565 N.A N.A 20.0381 N.A N.ADirect Plan - Dividend Option 10.9920 N.A N.A - N.A N.ADirect Plan - Weekly Dividend Option 10.1800 N.A N.A - N.A N.A
(h) Price earnings ratio NA NA NA NA NA NA
(i) Ratio of expenses (excluding initial issue expenses ) to daily average net assets by percentage
Regular Plan 1.26% 1.00% 1.01% 1.91% 1.85% 1.85%Institutional Plan 0.72% 0.70% 0.70% NA NA 1.50%Institutional Plus Plan 0.62% 0.60% 0.60% NA NA NADirect 0.45% 0.67%
(j) Ratio of gross income (including net loss on sale of investments and net unrealised depreciation in value 9.61% 9.20% 5.98% 11.92% 10.01% 6.94% of investments) to daily average net assets by percentage
* The above per unit calculations are based on the number of units in issue at the end of the financial year
# Below 0.01 per unit
HSBC MUTUAL FUND - HSBC INCOME FUND
HISTORICAL PER UNIT STATISTICS*
SHORT TERM PLAN INVESTMENT PLAN

► INDEX HSBC MIP

4
HSBC MIP
Trustees’ ReportFor the year ended March 31, 2013
The Trustees present the eleventh report and the audited abridged fi nancial statements of the Schemes of HSBC Mutual Fund (the “Fund”), for the year ended March 31, 2013.
1. SCHEME PERFORMANCE, FUTURE OUTLOOK AND OPERATIONS OF THE SCHEMES
a) Operations and Performance of the Schemes
HSBC MIP (HMIP) - an open-ended Fund
(Monthly income is not assured and is subject to availability of distributable surplus.)
HMIP is an open-ended fund which seeks to generate reasonable returns through investments in Debt and Money Market Instruments. The secondary objective of the scheme is to invest in equity and equity related instruments to seek capital appreciation.
The Scheme offers two Plans: Regular Plan and Savings Plan. The Regular Plan can have up to 15% of the corpus invested in equities while the Savings Plan can have up to 25 % invested in equities. The net assets of HMIP - Re ular Plan (HMIP - R) amounted to Rs. 190.42 crores as at March 31, 2013 as compared to Rs. 128.06 crores as at March 31, 2012. Around 81.68% of the net assets were invested in debt and money market instruments & 14.27% of the net assets were invested in equities as at March 31, 2013. The net assets of HMIP - Savings Plan (HMIP - S) amounted to Rs. 317.36 crores as at March 31, 2013 as compared to Rs. 245.05 crores as at March 31, 2012. Around 74.41% of the net assets were invested in debt and money market instruments & 21.84% % of the net assets were invested in equities as at March 31, 2013.
HMIP performance is broadly in line with the benchmark as it shifted allocation to large cap stocks and through active duration management.
HMIP - Regular Plan
Date of Inception : 24 February, 2004 Simple Annualized (%) Compounded Annualized (%)
Scheme Name & Benchmarks April ‘12 - March ‘13
April ‘11 - March ‘12
April ‘10 - March ‘11
Since Inception
HSBC MIP - Regular Plan - Growth 10.07 5.20 3.45 7.74
CRISIL 1 Year T-Bill Index (Standard Benchmark) 8.37 6.59 3.86 5.41
CRISIL 10 Year Gilt Index (Standard Benchmark) 11.31 2.41 4.61 4.79
CRISIL MIP Blended Index (Scheme Benchmark) 9.09 5.26 6.04 7.20
Rs. 10,000, if invested in HMIP - Regular Plan - Growth, would have become
11,007 10,520 10,345 19,728
Rs. 10,000, if invested in CRISIL 1 Year T-Bill Index, would have become
10,837 10659 10,386 16,166
Rs. 10,000, if invested in CRISIL 10 Year Gilt Index, would have become
11,131 10241 10,461 15,322
Rs. 10,000, if invested in CRISIL MIP Blended Index, would have become
10,909 10526 10,604 18,842
Returns data as on March 31, 2013. Past performance may or may not be sustained in future. ‘Since inception’ returns are calculated on Rs. 10 invested at inception. Calculations are based on Growth NAVs.

5
HSBC MIP
Trustees’ ReportFor the year ended March 31, 2013 (Contd...)
HMIP - Savings Plan
Date of Inception : 24 February, 2004 Simple Annualized (%) Compounded Annualized (%)
Scheme Name & Benchmarks April ‘12 - March ‘13
April ‘11 - March ‘12
April ‘10 - March ‘11
Since Inception
HSBC MIP - Savings Plan - Growth 10.74 4.94 3.53 9.25
CRISIL 1 Year T-Bill Index (Standard Benchmark) 8.37 6.59 3.86 5.41
CRISIL 10 Year Gilt Index (Standard Benchmark) 11.31 2.41 4.61 4.79
CRISIL MIP Blended Index (Scheme Benchmark) 9.09 5.26 6.04 7.20
Rs. 10,000, if invested in HMIP - Savings Plan - Growth, would have become
11,074 10,494 10,353 22,401
Rs. 10,000, if invested in CRISIL 1 Year T-Bill Index, would have become
10,837 10659 10,386 16,166
Rs. 10,000, if invested in CRISIL 10 Year Gilt Index, would have become
11,131 10241 10,461 15,322
Rs. 10,000, if invested in CRISIL MIP Blended Index, would have become
10,909 10526 10,604 18,842
Returns data as on March 31, 2013. Past performance may or may not be sustained in future. ‘Since Inception’ returns are calculated on Rs. 10 invested at inception. Calculations are based on Growth NAVs.
b) Market Overview & Outlook
EQUITY OUTLOOK
The Sensex returned 8.23% for the FY ended March 2013. While this looks to be a tepid return, the market rallied smoothly for a low of 15965 in June to end at 18835 at the FY end, a return of 17.98%. This was largely due to a series of announcements on reforms by the government and falling crude oil prices, signaling hopes of an economic recovery.
Returns (April 1, 2012 - March 31, 2013) 1 Year (%)
NIFTY 7.31
Sensex 8.23
S&P BSE 100 6.84
S&P BSE 200 6.03
S&P BSE 500 4.81
CNX Midcap -4.02
Source: Bloomberg
Our view in respect of key issues facing equity market currently is highlighted as under, based on which we do expect a likely reversal of the prevailing negative sentiment going forward -
� Macro challenge - expect some relief in current account defi cit given likely lower gold imports and crude oil correction. Solution to fi scal defi cit may however need policy decision to reduce subsidy burden on diesel, kerosene, LPG.
� Commodities infl ation expected to decline on account of China slowdown and lower growth in western world. This may have positive impact margin expansion for corporate sector and on currency (INR) and will give room for reducing interest rates over time. Lower cost of capital should hopefully revive capex spending, though gradually (recovery from 2H12).

6
HSBC MIP
Trustees’ ReportFor the year ended March 31, 2013 (Contd...)
� Lower interest rates directionally would be the single most important variable for equity markets to rally. This will be driven by lower commodity infl ation and focus back on reviving growth through monetary policy (recent disappointing GDP/IIP numbers support this view).
� Valuations (for large Sensex companies) are attractive at close to 13x forward earnings and in the lower range of historic multiples. A large number of mid-caps available at a signifi cant discount to large cap peer.
� Structural model for India equity investment remains intact for long term returns. These include favourable demography, high savings rate, rising incomes, growing consumption demand growth, existing low penetration, etc.
DEBT OUTLOOK
Fixed Income market in FY 2013 moved towards lower yields on back of 100 bps rate cut and CRR cuts. RBI front loaded the rate cut in April and then followed it up in January 2013 and March 2013. Towards the second half rates stabilized largely as the core infl ation remained within comfort zone.
In the second half of the year expectation of rate cut and series of open market operations led to rally in rates. Government borrowing was lower than budgeted and the spending was also controlled in second half of the year. Towards the end of the year short end rates tightened substantially due to low deposit growth in banking system.
Corporate yield curve remained inverted with short end rates higher than long end rates for the large part of the year due to liquidity tightness.
Expectation is to see continuation of some easing of the rates stance from RBI in FY 14. However, there is a need to focus on key variables in the economy to judge future directions. These are:
� Liquidity: Liquidity will drive short end rates and eventually drive decisions on open market operations as well as CRR cuts.
� Infl ation: Infl ation numbers will determine future course of action for RBI and remains a critical variable for policy. We expect infl ation to ease in fi rst half of FY 14.
� Growth: GDP growth numbers as well as industrial activity will also determine the decision on policy. Weak GDP numbers may continue for couple of quarters.
� Fiscal defi cit: Fiscal defi cit and government spending will determine the government borrowing and crowding out in interest rate curve.
� Current account defi cit / BoP situation: CAD determines how the pressure on currency works and effective management of forex reserves
� Currency levels: Level of INR will determine how the central banker reacts to the situation on the global crisis etc.
2. BRIEF BACKGROUND OF SPONSORS, BOARD OF TRUSTEES AND ASSET MANAGEMENT COMPANY
a) Sponsor HSBC Mutual Fund is sponsored by HSBC Securities and Capital Markets (India) Private Limited (HSCI).
The Sponsor is the Settler of the Mutual Fund Trust. The Sponsor has entrusted a sum of Rs.1,00,000 (Rupees One Lakh only) to the Trustee as the initial contribution towards the corpus of the Mutual Fund.
HSCI offers integrated investment banking services, securities and corporate fi nance & advisory. HSCI is a member of The Bombay Stock Exchange Limited and National Stock Exchange (capital and derivative market segments). HSCI holds 100% of the paid up equity share capital of HSBC Asset Management (India) Private Limited.

7
HSBC MIP
Trustees’ ReportFor the year ended March 31, 2013 (Contd...)
b) HSBC Mutual Fund HSBC Mutual Fund (“the Mutual Fund” or “the Fund”) has been constituted as a Trust in accordance with
the provisions of the Indian Trusts Act, 1882 (2 of 1882) vide a Trust Deed dated February 7, 2002 with HSBC Securities and Capital Markets (India) Private Limited, as the Sponsor and the Board of Individual Trustees. The Trustee has entered into an Investment Management Agreement dated February 7, 2002 with HSBC Asset Management (India) Private Limited (AMC) to function as the Investment Manager for all the Schemes of the Fund. The Fund was registered with SEBI vide registration number MF/046/02/5 dated May 27, 2002.
The Trust has been formed for the purpose of pooling of capital from the public for collective investment in securities/any other property for the purpose of providing facilities for participation by persons as benefi ciaries in such properties/investments and in the profi ts/income arising therefrom.
c) Board of Trustees (the Trustees) The Board of Trustees is the exclusive owner of the Trust Fund and holds the same in trust for the benefi t
of the unit holders. The Trustees have been discharging their duties and carrying out the responsibilities as provided in the SEBI (Mutual Funds) Regulations, 1996 and the Trust Deed. The Trustees seek to ensure that the Fund and the Schemes fl oated there under are managed by the AMC in accordance with the Trust Deed, the said Regulations, directions and guidelines issued by the SEBI, the Stock Exchanges, the Association of Mutual Funds in India and other regulatory agencies.
d) Asset Management Company (the AMC) HSBC Asset Management (India) Private Limited (the Investment Manager or the AMC) is a private limited
company incorporated under the Companies Act, 1956 on December 12, 2001 having its Registered Offi ce at 16, V. N. Road, Fort, Mumbai 400 001. HSBC Asset Management (India) Private Limited has been appointed as the Asset Management Company of the HSBC Mutual Fund by the Trustee vide Investment Management Agreement (IMA) dated February 7, 2002 and executed between the Trustees and the AMC. SEBI approved the AMC to act as the Investment Manager of the Fund vide its letter No. MFD/BC/163/2002 dated May 27, 2002. The paid-up equity share capital of the AMC is Rs. 54.2 crores. HSBC Securities and Capital Markets (India) Private Limited holds 100% of the paid up equity share capital of the AMC.
3. INVESTMENT OBJECTIVE OF THE SCHEMESThe investment objective of the respective Schemes has been provided above under the heading “Scheme Performance, Future Outlook and Operation of the Scheme” (Refer Section 1).
4. SIGNIFICANT ACCOUNTING POLICIESThe accounting policies are in accordance with Securities Exchange Board of India (Mutual Funds) Regulations 1996.
5. UNCLAIMED DIVIDENDS & REDEMPTIONSSummary of number of Investors & corresponding amount Scheme-wise as on March 31, 2013
Scheme
Unclaimed Dividends Unclaimed Redemptions
Amount (Rs.)
No. of Investors
Amount (Rs.)
No. of Investors
HSBC MIP - Regular Plan 433,063.63 474 1,052,750.95 13
HSBC MIP - Savings Plan 591,339.94 628 114,778.41 15
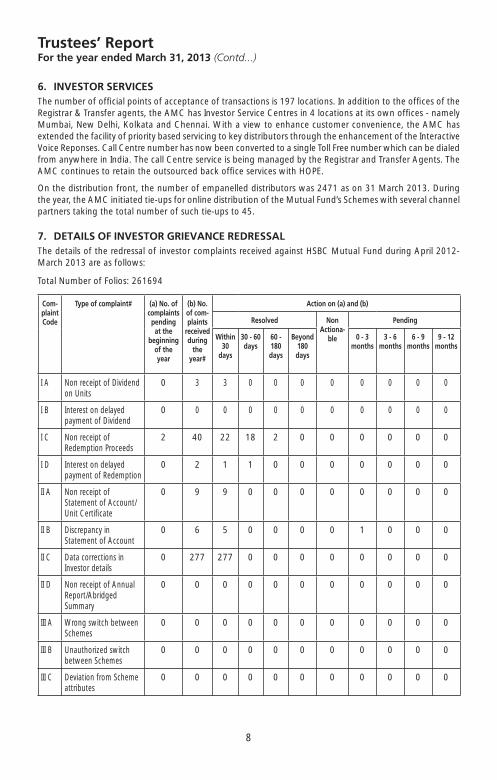
8
HSBC MIP
Trustees’ ReportFor the year ended March 31, 2013 (Contd...)
6. INVESTOR SERVICESThe number of offi cial points of acceptance of transactions is 197 locations. In addition to the offi ces of the Registrar & Transfer agents, the AMC has Investor Service Centres in 4 locations at its own offi ces - namely Mumbai, New Delhi, Kolkata and Chennai. With a view to enhance customer convenience, the AMC has extended the facility of priority based servicing to key distributors through the enhancement of the Interactive Voice Reponses. Call Centre number has now been converted to a single Toll Free number which can be dialed from anywhere in India. The call Centre service is being managed by the Registrar and Transfer Agents. The AMC continues to retain the outsourced back offi ce services with HOPE.
On the distribution front, the number of empanelled distributors was 2471 as on 31 March 2013. During the year, the AMC initiated tie-ups for online distribution of the Mutual Fund’s Schemes with several channel partners taking the total number of such tie-ups to 45.
7. DETAILS OF INVESTOR GRIEVANCE REDRESSALThe details of the redressal of investor complaints received against HSBC Mutual Fund during April 2012- March 2013 are as follows:
Total Number of Folios: 261694
Com-plaintCode
Type of complaint#
(a) No. ofcomplaintspendingat the
beginningof theyear
(b) No. of com-plaints
receivedduring
theyear#
Action on (a) and (b)
Resolved Non Actiona-
ble
Pending
Within 30
days
30 - 60 days
60 - 180 days
Beyond 180 days
0 - 3 months
3 - 6 months
6 - 9 months
9 - 12 months
I A Non receipt of Dividend on Units
0 3 3 0 0 0 0 0 0 0 0
I B Interest on delayed payment of Dividend
0 0 0 0 0 0 0 0 0 0 0
I C Non receipt of Redemption Proceeds
2 40 22 18 2 0 0 0 0 0 0
I D Interest on delayed payment of Redemption
0 2 1 1 0 0 0 0 0 0 0
II A Non receipt of Statement of Account/Unit Certifi cate
0 9 9 0 0 0 0 0 0 0 0
II B Discrepancy in Statement of Account
0 6 5 0 0 0 0 1 0 0 0
II C Data corrections in Investor details
0 277 277 0 0 0 0 0 0 0 0
II D Non receipt of Annual Report/Abridged Summary
0 0 0 0 0 0 0 0 0 0 0
III A Wrong switch between Schemes
0 0 0 0 0 0 0 0 0 0 0
III B Unauthorized switch between Schemes
0 0 0 0 0 0 0 0 0 0 0
III C Deviation from Scheme attributes
0 0 0 0 0 0 0 0 0 0 0
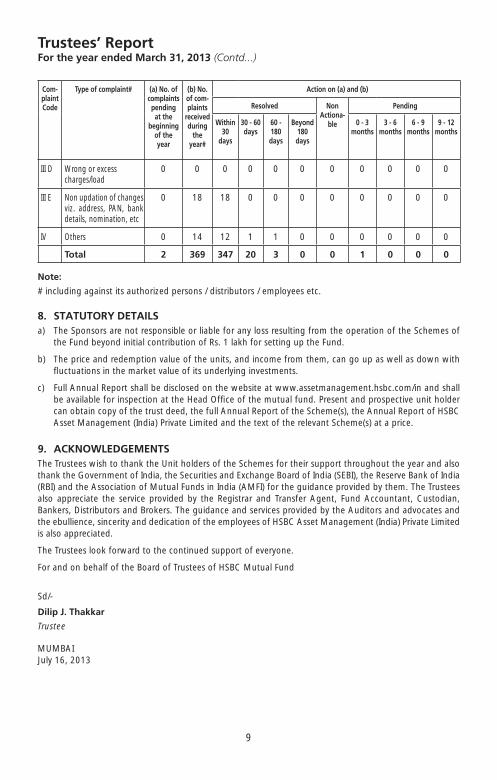
9
HSBC MIP
Com-plaintCode
Type of complaint#
(a) No. ofcomplaintspendingat the
beginningof theyear
(b) No. of com-plaints
receivedduring
theyear#
Action on (a) and (b)
Resolved Non Actiona-
ble
Pending
Within 30
days
30 - 60 days
60 - 180 days
Beyond 180 days
0 - 3 months
3 - 6 months
6 - 9 months
9 - 12 months
III D Wrong or excess charges/load
0 0 0 0 0 0 0 0 0 0 0
III E Non updation of changes viz. address, PAN, bank details, nomination, etc
0 18 18 0 0 0 0 0 0 0 0
IV Others 0 14 12 1 1 0 0 0 0 0 0
Total 2 369 347 20 3 0 0 1 0 0 0
Note:
# including against its authorized persons / distributors / employees etc.
8. STATUTORY DETAILSa) The Sponsors are not responsible or liable for any loss resulting from the operation of the Schemes of
the Fund beyond initial contribution of Rs. 1 lakh for setting up the Fund.
b) The price and redemption value of the units, and income from them, can go up as well as down with fl uctuations in the market value of its underlying investments.
c) Full Annual Report shall be disclosed on the website at www.assetmanagement.hsbc.com/in and shall be available for inspection at the Head Offi ce of the mutual fund. Present and prospective unit holder can obtain copy of the trust deed, the full Annual Report of the Scheme(s), the Annual Report of HSBC Asset Management (India) Private Limited and the text of the relevant Scheme(s) at a price.
9. ACKNOWLEDGEMENTSThe Trustees wish to thank the Unit holders of the Schemes for their support throughout the year and also thank the Government of India, the Securities and Exchange Board of India (SEBI), the Reserve Bank of India (RBI) and the Association of Mutual Funds in India (AMFI) for the guidance provided by them. The Trustees also appreciate the service provided by the Registrar and Transfer Agent, Fund Accountant, Custodian, Bankers, Distributors and Brokers. The guidance and services provided by the Auditors and advocates and the ebullience, sincerity and dedication of the employees of HSBC Asset Management (India) Private Limited is also appreciated.
The Trustees look forward to the continued support of everyone.
For and on behalf of the Board of Trustees of HSBC Mutual Fund
Sd/-
Dilip J. Thakkar
Trustee
MUMBAIJuly 16, 2013
Trustees’ ReportFor the year ended March 31, 2013 (Contd...)

10
HSBC MIP
Independent Auditors’ Report
To the Board of Trustees of
HSBC Mutual Fund
Report on the Financial Statements1. We have audited the accompanying fi nancial statements of HSBC Mutual Fund - HSBC MIP (the “Scheme”),
which comprise the Balance Sheet as at March 31, 2013, and the related Revenue Account for the year then ended, and a summary of signifi cant accounting policies and other explanatory information, which we have signed under reference to this report.
Trustee’s and Management’s Responsibility for the Financial Statements2. The Board of Trustees of HSBC Mutual Fund (the “Trustee”) and the Management of HSBC Asset
Management (India) Private Limited (the “Management”) are responsible for the preparation of these fi nancial statements that give a true and fair view of the fi nancial position and fi nancial performance of the Scheme in accordance with the accounting policies and standards specifi ed in the Ninth Schedule of the Securities and Exchange Board of India (Mutual Funds) Regulations, 1996 and amendments thereto (the “Regulations”). This responsibility includes the design, implementation and maintenance of internal control relevant to the preparation and presentation of the fi nancial statements that give a true and fair view and are free from material misstatement, whether due to fraud or error.
Auditors’ Responsibility3. Our responsibility is to express an opinion on these fi nancial statements based on our audit. We conducted
our audit in accordance with the Standards on Auditing issued by the Institute of Chartered Accountants of India. Those Standards require that we comply with ethical requirements and plan and perform the audit to obtain reasonable assurance about whether the fi nancial statements are free from material misstatement.
4. An audit involves performing procedures to obtain audit evidence, about the amounts and disclosures in the fi nancial statements. The procedures selected depend on the auditors’ judgment, including the assessment of the risks of material misstatement of the fi nancial statements, whether due to fraud or error. In making those risk assessments, the auditors consider internal control relevant to the preparation and fair presentation of the fi nancial statements in order to design audit procedures that are appropriate in the circumstances. Our procedures included confi rmation of securities owned and unit capital balances as at March 31, 2013 by correspondence with the custodian/others and registrar and transfer agent, respectively. An audit also includes evaluating the appropriateness of accounting policies used and the reasonableness of the accounting estimates made by the Trustee and the Management, as well as evaluating the overall presentation of the fi nancial statements.
5. We believe that the audit evidence we have obtained is suffi cient and appropriate to provide a basis for our audit opinion.
Opinion6. In our opinion, and to the best of our information and according to the explanations given to us, the
accompanying fi nancial statements give the information required by the Regulations in the manner so required and give a true and fair view in conformity with the accounting principles generally accepted in India:
(a) in the case of the Balance Sheet, of the state of affairs of the scheme as at March 31, 2013; and
(b) in the case of the Revenue Account, of the net surplus for the year ended on that date.
Report on Other Legal and Regulatory Requirement7. As required by section 55(4) of the Regulations, we report that:
(a) We have obtained all the information and explanations which, to the best of our knowledge and belief, were necessary for the purposes of our audit; and

11
HSBC MIP
Independent Auditors’ Report (Contd...)
(b) In our opinion, the Balance Sheet and Revenue Account dealt with by this report have been prepared in accordance with the accounting policies and standards specifi ed in the Ninth Schedule of the Regulations.
8. As required by clause 5 (ii)(2) of the Eleventh Schedule to the Regulations, we report that the Balance Sheet and Revenue Account dealt with by this Report are in agreement with the books of account of the scheme.
9. In our opinion, the methods used to value non-traded securities as at March 31, 2013, as determined by HSBC Asset Management (India) Private Limited under procedures approved by the Board of Trustees of HSBC Mutual Fund in accordance with the guidelines for valuation of securities for mutual funds as mentioned in the Eighth Schedule of the Regulations issued by the Securities and Exchange Board of India, are fair and reasonable.
For PRICE WATERHOUSEFirm Registration Number: 301112EChartered Accountants
Sd/-
Vivek PrasadPartnerMembership Number: 104941
Place : MumbaiDate : July 16, 2013

March 31, 2013 March 31, 2012 March 31, 2013 March 31, 2012Schedule Rupees Rupees Rupees Rupees
ASSETS
Investments 1 1,827,073,798 1,148,073,273 3,054,338,764 2,303,994,184 Deposits 2 5,819,450 37,338,847 6,731,742 28,599,386 Other Current Assets 3 103,694,954 115,828,427 155,491,894 149,147,829
TOTAL 1,936,588,202 1,301,240,547 3,216,562,400 2,481,741,399
LIABILITIES
Unit Capital 4 1,458,936,023 1,007,187,396 2,128,472,010 1,752,343,701 Reserves and Surplus 5 445,265,633 273,441,315 1,045,140,207 698,143,691 Current Liabilities and Provisions 6 32,386,546 20,611,836 42,950,183 31,254,007
TOTAL 1,936,588,202 1,301,240,547 3,216,562,400 2,481,741,399
(0) (0) 0 0
Notes to the Financial Statements. 8
The Schedules referred to herein form an integral part of the Financial Statements.
This is the Balance Sheet referred to in our report of even date.
For PRICE WATERHOUSE For Board of Trustees of For HSBC Asset Management (India)Firm Registration Number: 301112E HSBC Mutual Fund Private LimitedChartered Accountants
sd/- sd/- sd/-VIVEK PRASAD N. P. Gidwani Puneet ChaddhaPartner Trustee Director and Chief Executive OfficerMembership No.104941
sd/- sd/-Dilip J. Thakkar Kishori J. UdeshiTrustee Director
sd/-Sanjay ShahFund Manager
sd/- sd/-Ruchir Parekh Aditya KhemaniFund Manager Fund Manager
Place: MumbaiDate: July 16, 2013
HSBC MUTUAL FUND - HSBC MIP FUND
Balance Sheet as at March 31, 2013
REGULAR PLAN SAVINGS PLAN

H32872 H32873
April 01, 2012 to April 01, 2011 to April 01, 2012 to April 01, 2011 toMarch 31, 2013 March 31, 2012 March 31, 2013 March 31, 2012
Schedule Rupees Rupees Rupees Rupees
INCOME AND GAINS
Dividends (Note 2.4) 3,372,493 3,660,756 9,633,824 18,075,672 Interest and Discount 7 133,699,232 122,777,918 181,057,112 314,288,600 Net Profit on Sale of Investments and Derivatives (Note 2.3, 2.5 and 14) 39,860,952 - 88,309,469 - Miscellaneous Income (Note 19) 2,055,098 1,593 2,344,638 3,223
TOTAL 178,987,775 126,440,267 281,345,043 332,367,495
EXPENSES AND LOSSES
Net Loss on Sale of Investments and Derivatives (Note 2.3, 2.5 and 14) - 18,862,041 - 100,331,741 Investment Management and Advisory Fees (Note 3) 18,403,770 18,276,514 27,644,105 47,634,943 Transfer Agent Fees and Expenses 1,833,547 2,203,364 2,845,420 6,223,407 Trusteeship Fees and Expenses (Note 4) 15,579 37,228 24,113 102,369 Custodian Fees and Expenses (Note 5) 296,972 327,426 540,049 1,079,711 Audit Fees 269,606 136,378 449,230 262,854 Investor Education Fees 193,615 - 285,772 - Selling and Distribution Expenses 21,632,529 10,184,758 26,624,707 27,902,928 Other Operating Expenses 3,416,620 2,899,465 5,138,311 7,532,352
TOTAL 46,062,238 52,927,174 63,551,707 191,070,305
Less: Expenses to be Reimbursed by the Investment Manager (Note 7) 5,601,494 - 2,945,419 -
TOTAL 40,460,744 52,927,174 60,606,288 191,070,305
Net Realised Gains for the Year 138,527,031 73,513,093 220,738,755 141,297,190
Net Change in Unrealised Depreciation in Value of Investments and Derivatives (Note 2.2, 2.5 and 8) 4,696,195 2,452,804 5,490,383 29,176,898
Net Gains for the Year 143,223,226 75,965,897 226,229,138 170,474,088
Net Change in Unrealised Appreciation in Value of Investments and Derivatives (Note 2.2, 2.5 and 8) 27,815,951 809,016 47,274,252 (1,977,974)
Net Surplus including Net Change in Unrealised Appreciation in Value of Investments and Derivatives 171,039,177 76,774,913 273,503,390 168,496,114
Net Change in Unrealised Appreciation in Value of Investments and Derivatives transferred to Unrealised Appreciation Reserve (27,815,951) (809,016) (47,274,252) 1,977,974
Net Surplus for the Year 143,223,226 75,965,897 226,229,138 170,474,088
April 01, 2012 to April 01, 2011 to April 01, 2012 to April 01, 2011 toMarch 31, 2013 March 31, 2012 March 31, 2013 March 31, 2012
Rupees Rupees Rupees Rupees
Net Surplus for the Year 143,223,226 75,965,897 226,229,138 170,474,088 Transfer (to) / from Income Equalisation Reserve (Note 2.8) 61,846,027 (107,817,510) 132,061,779 (698,895,590) Transfer from Reserve Fund 228,207,238 313,438,864 516,765,811 1,159,748,300 Dividend / Distribution (72,873,617) (46,608,409) (89,906,678) (99,596,882) Dividend / Distribution Tax thereon (10,400,486) (6,771,604) (12,797,138) (14,964,105)
Balance Transferred to Reserve Fund 350,002,388 228,207,238 772,352,913 516,765,811
Notes to the Financial Statements. 8
The schedules referred to herein form an integral part of the Financial Statements.
This is the Revenue Account referred to in our report of even date.
For PRICE WATERHOUSE For Board of Trustees of For HSBC Asset Management (India)Firm Registration Number: 301112E HSBC Mutual Fund Private LimitedChartered Accountants
sd/- sd/- sd/-VIVEK PRASAD N. P. Gidwani Puneet ChaddhaPartner Trustee Director and Chief Executive OfficerMembership No.104941
sd/- sd/-Dilip J. Thakkar Kishori J. UdeshiTrustee Director
sd/-Sanjay ShahFund Manager
sd/- sd/-Ruchir Parekh Aditya KhemaniFund Manager Fund Manager
Place: MumbaiDate: July 16, 2013
HSBC MUTUAL FUND - HSBC MIP FUND
Revenue Account for the year ended March 31, 2013
REGULAR PLAN SAVINGS PLAN
REGULAR PLAN SAVINGS PLAN
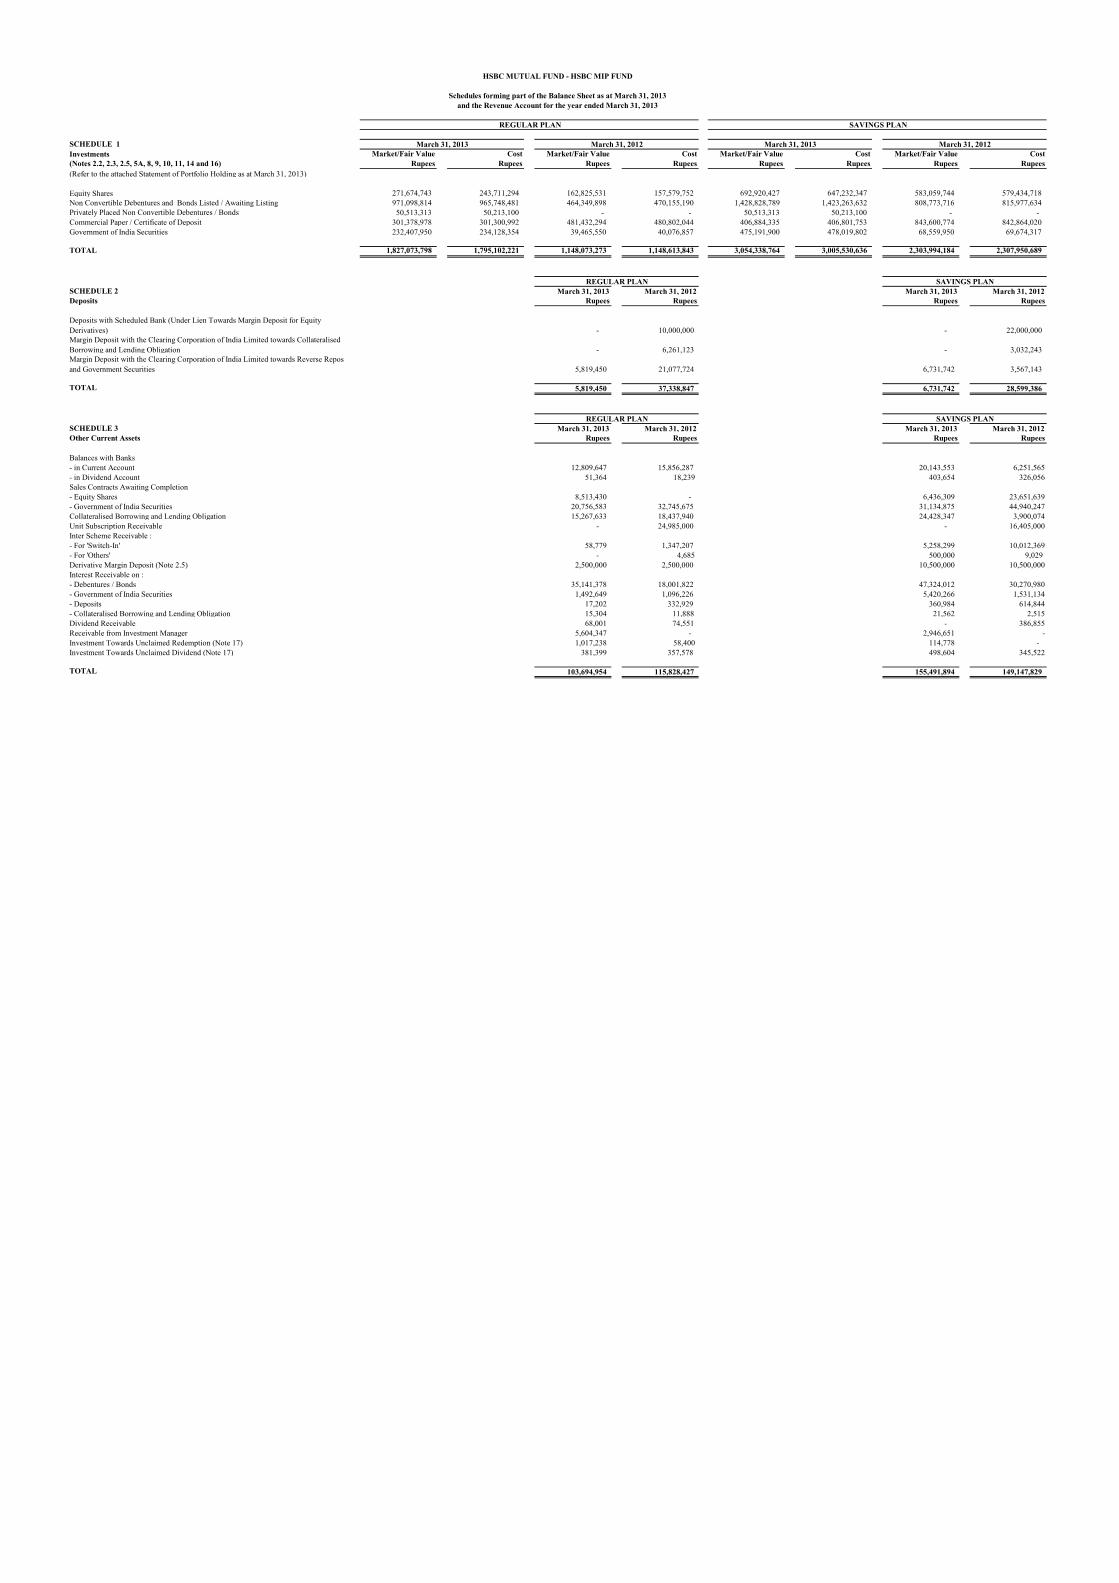
SCHEDULE 1Investments Market/Fair Value Cost Market/Fair Value Cost Market/Fair Value Cost Market/Fair Value Cost (Notes 2.2, 2.3, 2.5, 5A, 8, 9, 10, 11, 14 and 16) Rupees Rupees Rupees Rupees Rupees Rupees Rupees Rupees (Refer to the attached Statement of Portfolio Holding as at March 31, 2013)
Equity Shares 271,674,743 243,711,294 162,825,531 157,579,752 692,920,427 647,232,347 583,059,744 579,434,718 Non Convertible Debentures and Bonds Listed / Awaiting Listing 971,098,814 965,748,481 464,349,898 470,155,190 1,428,828,789 1,423,263,632 808,773,716 815,977,634 Privately Placed Non Convertible Debentures / Bonds 50,513,313 50,213,100 - - 50,513,313 50,213,100 - - Commercial Paper / Certificate of Deposit 301,378,978 301,300,992 481,432,294 480,802,044 406,884,335 406,801,753 843,600,774 842,864,020 Government of India Securities 232,407,950 234,128,354 39,465,550 40,076,857 475,191,900 478,019,802 68,559,950 69,674,317
TOTAL 1,827,073,798 1,795,102,221 1,148,073,273 1,148,613,843 3,054,338,764 3,005,530,636 2,303,994,184 2,307,950,689
SCHEDULE 2 March 31, 2013 March 31, 2012 March 31, 2013 March 31, 2012Deposits Rupees Rupees Rupees Rupees
Deposits with Scheduled Bank (Under Lien Towards Margin Deposit for Equity Derivatives) - 10,000,000 - 22,000,000 Margin Deposit with the Clearing Corporation of India Limited towards Collateralised Borrowing and Lending Obligation - 6,261,123 - 3,032,243 Margin Deposit with the Clearing Corporation of India Limited towards Reverse Repos and Government Securities 5,819,450 21,077,724 6,731,742 3,567,143
TOTAL 5,819,450 37,338,847 6,731,742 28,599,386
SCHEDULE 3 March 31, 2013 March 31, 2012 March 31, 2013 March 31, 2012Other Current Assets Rupees Rupees Rupees Rupees
Balances with Banks - in Current Account 12,809,647 15,856,287 20,143,553 6,251,565 - in Dividend Account 51,364 18,239 403,654 326,056 Sales Contracts Awaiting Completion- Equity Shares 8,513,430 - 6,436,309 23,651,639 - Government of India Securities 20,756,583 32,745,675 31,134,875 44,940,247 Collateralised Borrowing and Lending Obligation 15,267,633 18,437,940 24,428,347 3,900,074 Unit Subscription Receivable - 24,985,000 - 16,405,000 Inter Scheme Receivable :- For 'Switch-In' 58,779 1,347,207 5,258,299 10,012,369 - For 'Others' - 4,685 500,000 9,029 Derivative Margin Deposit (Note 2.5) 2,500,000 2,500,000 10,500,000 10,500,000 Interest Receivable on :- Debentures / Bonds 35,141,378 18,001,822 47,324,012 30,270,980 - Government of India Securities 1,492,649 1,096,226 5,420,266 1,531,134 - Deposits 17,202 332,929 360,984 614,844 - Collateralised Borrowing and Lending Obligation 15,304 11,888 21,562 2,515 Dividend Receivable 68,001 74,551 - 386,855 Receivable from Investment Manager 5,604,347 - 2,946,651 - Investment Towards Unclaimed Redemption (Note 17) 1,017,238 58,400 114,778 - Investment Towards Unclaimed Dividend (Note 17) 381,399 357,578 498,604 345,522
TOTAL 103,694,954 115,828,427 155,491,894 149,147,829
REGULAR PLAN SAVINGS PLAN
REGULAR PLAN SAVINGS PLAN
March 31, 2013 March 31, 2012 March 31, 2013 March 31, 2012
HSBC MUTUAL FUND - HSBC MIP FUND
Schedules forming part of the Balance Sheet as at March 31, 2013and the Revenue Account for the year ended March 31, 2013
REGULAR PLAN SAVINGS PLAN
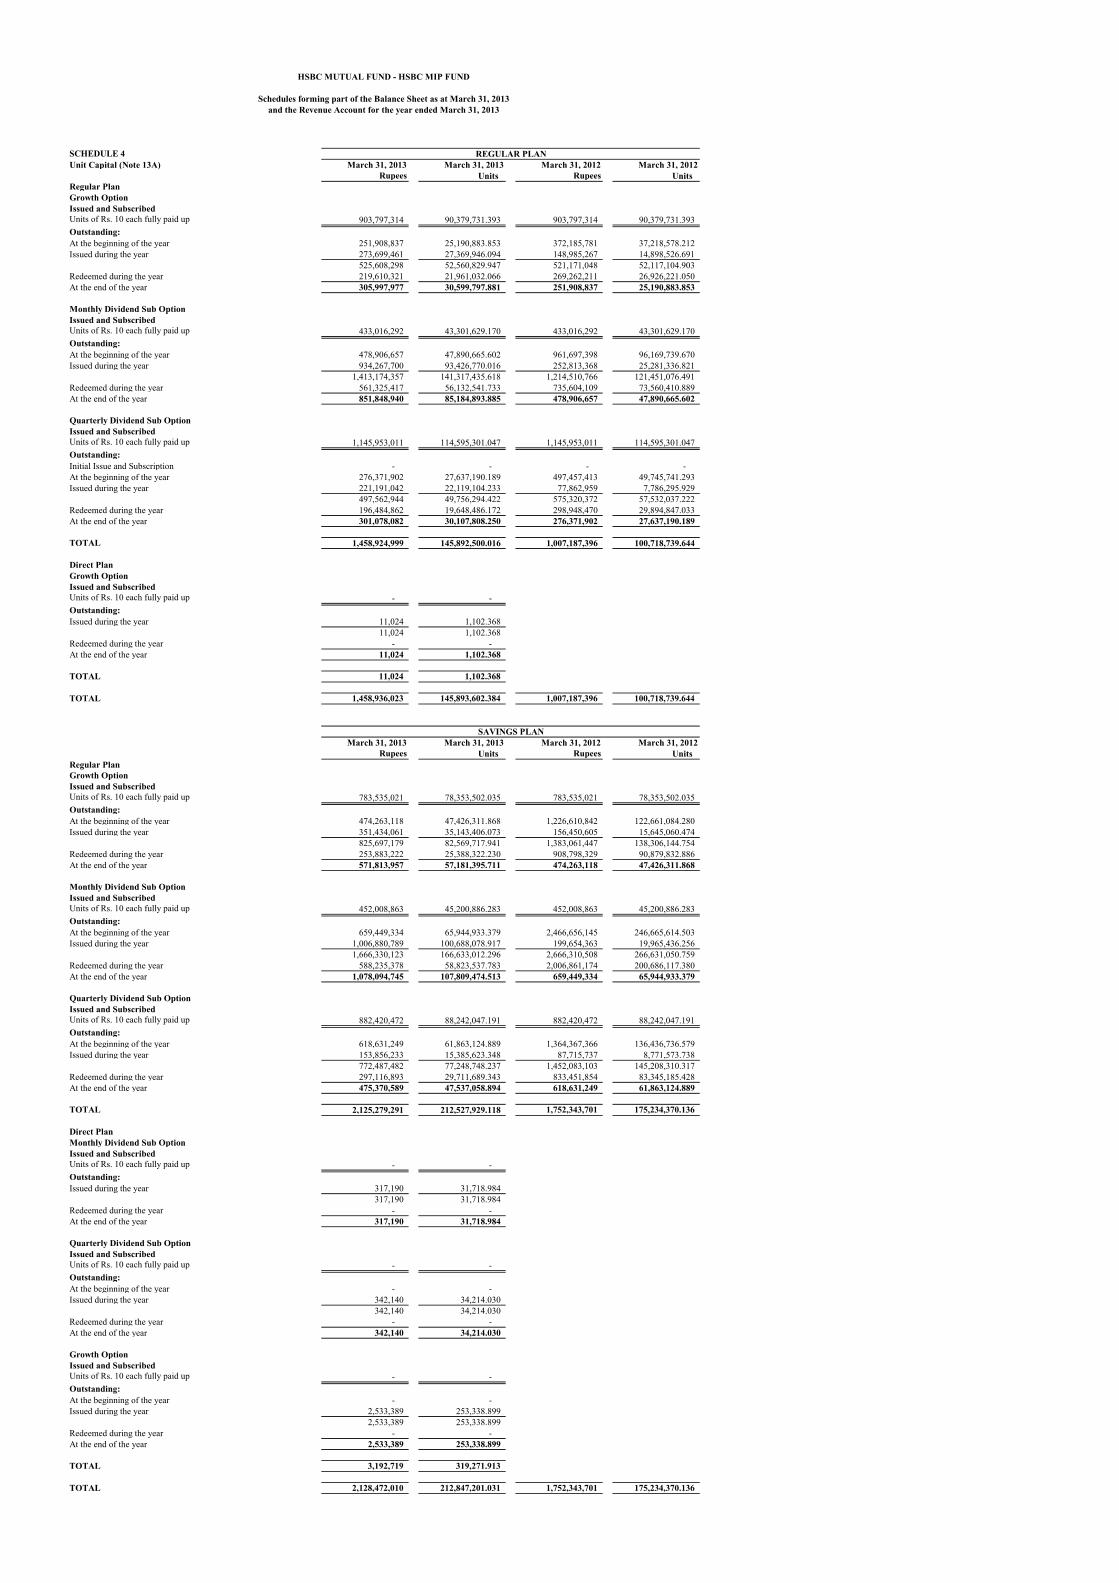
SCHEDULE 4Unit Capital (Note 13A) March 31, 2013 March 31, 2013 March 31, 2012 March 31, 2012
Rupees Units Rupees Units Regular PlanGrowth OptionIssued and SubscribedUnits of Rs. 10 each fully paid up 903,797,314 90,379,731.393 903,797,314 90,379,731.393 Outstanding:At the beginning of the year 251,908,837 25,190,883.853 372,185,781 37,218,578.212 Issued during the year 273,699,461 27,369,946.094 148,985,267 14,898,526.691
525,608,298 52,560,829.947 521,171,048 52,117,104.903 Redeemed during the year 219,610,321 21,961,032.066 269,262,211 26,926,221.050 At the end of the year 305,997,977 30,599,797.881 251,908,837 25,190,883.853
Monthly Dividend Sub Option Issued and SubscribedUnits of Rs. 10 each fully paid up 433,016,292 43,301,629.170 433,016,292 43,301,629.170 Outstanding:At the beginning of the year 478,906,657 47,890,665.602 961,697,398 96,169,739.670 Issued during the year 934,267,700 93,426,770.016 252,813,368 25,281,336.821
1,413,174,357 141,317,435.618 1,214,510,766 121,451,076.491 Redeemed during the year 561,325,417 56,132,541.733 735,604,109 73,560,410.889 At the end of the year 851,848,940 85,184,893.885 478,906,657 47,890,665.602
Quarterly Dividend Sub Option Issued and SubscribedUnits of Rs. 10 each fully paid up 1,145,953,011 114,595,301.047 1,145,953,011 114,595,301.047 Outstanding:Initial Issue and Subscription - - - - At the beginning of the year 276,371,902 27,637,190.189 497,457,413 49,745,741.293 Issued during the year 221,191,042 22,119,104.233 77,862,959 7,786,295.929
497,562,944 49,756,294.422 575,320,372 57,532,037.222 Redeemed during the year 196,484,862 19,648,486.172 298,948,470 29,894,847.033 At the end of the year 301,078,082 30,107,808.250 276,371,902 27,637,190.189
TOTAL 1,458,924,999 145,892,500.016 1,007,187,396 100,718,739.644
Direct PlanGrowth Option Issued and SubscribedUnits of Rs. 10 each fully paid up - - Outstanding:Issued during the year 11,024 1,102.368
11,024 1,102.368 Redeemed during the year - - At the end of the year 11,024 1,102.368
TOTAL 11,024 1,102.368
TOTAL 1,458,936,023 145,893,602.384 1,007,187,396 100,718,739.644
March 31, 2013 March 31, 2013 March 31, 2012 March 31, 2012 Rupees Units Rupees Units
Growth OptionIssued and SubscribedUnits of Rs. 10 each fully paid up 783,535,021 78,353,502.035 783,535,021 78,353,502.035 Outstanding:At the beginning of the year 474,263,118 47,426,311.868 1,226,610,842 122,661,084.280 Issued during the year 351,434,061 35,143,406.073 156,450,605 15,645,060.474
825,697,179 82,569,717.941 1,383,061,447 138,306,144.754 Redeemed during the year 253,883,222 25,388,322.230 908,798,329 90,879,832.886 At the end of the year 571,813,957 57,181,395.711 474,263,118 47,426,311.868
Monthly Dividend Sub Option Issued and SubscribedUnits of Rs. 10 each fully paid up 452,008,863 45,200,886.283 452,008,863 45,200,886.283 Outstanding:At the beginning of the year 659,449,334 65,944,933.379 2,466,656,145 246,665,614.503 Issued during the year 1,006,880,789 100,688,078.917 199,654,363 19,965,436.256
1,666,330,123 166,633,012.296 2,666,310,508 266,631,050.759 Redeemed during the year 588,235,378 58,823,537.783 2,006,861,174 200,686,117.380 At the end of the year 1,078,094,745 107,809,474.513 659,449,334 65,944,933.379
Quarterly Dividend Sub Option Issued and SubscribedUnits of Rs. 10 each fully paid up 882,420,472 88,242,047.191 882,420,472 88,242,047.191 Outstanding:At the beginning of the year 618,631,249 61,863,124.889 1,364,367,366 136,436,736.579 Issued during the year 153,856,233 15,385,623.348 87,715,737 8,771,573.738
772,487,482 77,248,748.237 1,452,083,103 145,208,310.317 Redeemed during the year 297,116,893 29,711,689.343 833,451,854 83,345,185.428 At the end of the year 475,370,589 47,537,058.894 618,631,249 61,863,124.889
TOTAL 2,125,279,291 212,527,929.118 1,752,343,701 175,234,370.136
Direct PlanMonthly Dividend Sub OptionIssued and SubscribedUnits of Rs. 10 each fully paid up - - Outstanding:Issued during the year 317,190 31,718.984
317,190 31,718.984 Redeemed during the year - - At the end of the year 317,190 31,718.984
Quarterly Dividend Sub Option Issued and SubscribedUnits of Rs. 10 each fully paid up - - Outstanding:At the beginning of the year - - Issued during the year 342,140 34,214.030
342,140 34,214.030 Redeemed during the year - - At the end of the year 342,140 34,214.030
Growth Option Issued and SubscribedUnits of Rs. 10 each fully paid up - - Outstanding:At the beginning of the year - - Issued during the year 2,533,389 253,338.899
2,533,389 253,338.899 Redeemed during the year - - At the end of the year 2,533,389 253,338.899
TOTAL 3,192,719 319,271.913
TOTAL 2,128,472,010 212,847,201.031 1,752,343,701 175,234,370.136
SAVINGS PLAN
Regular Plan
HSBC MUTUAL FUND - HSBC MIP FUND
Schedules forming part of the Balance Sheet as at March 31, 2013and the Revenue Account for the year ended March 31, 2013
REGULAR PLAN
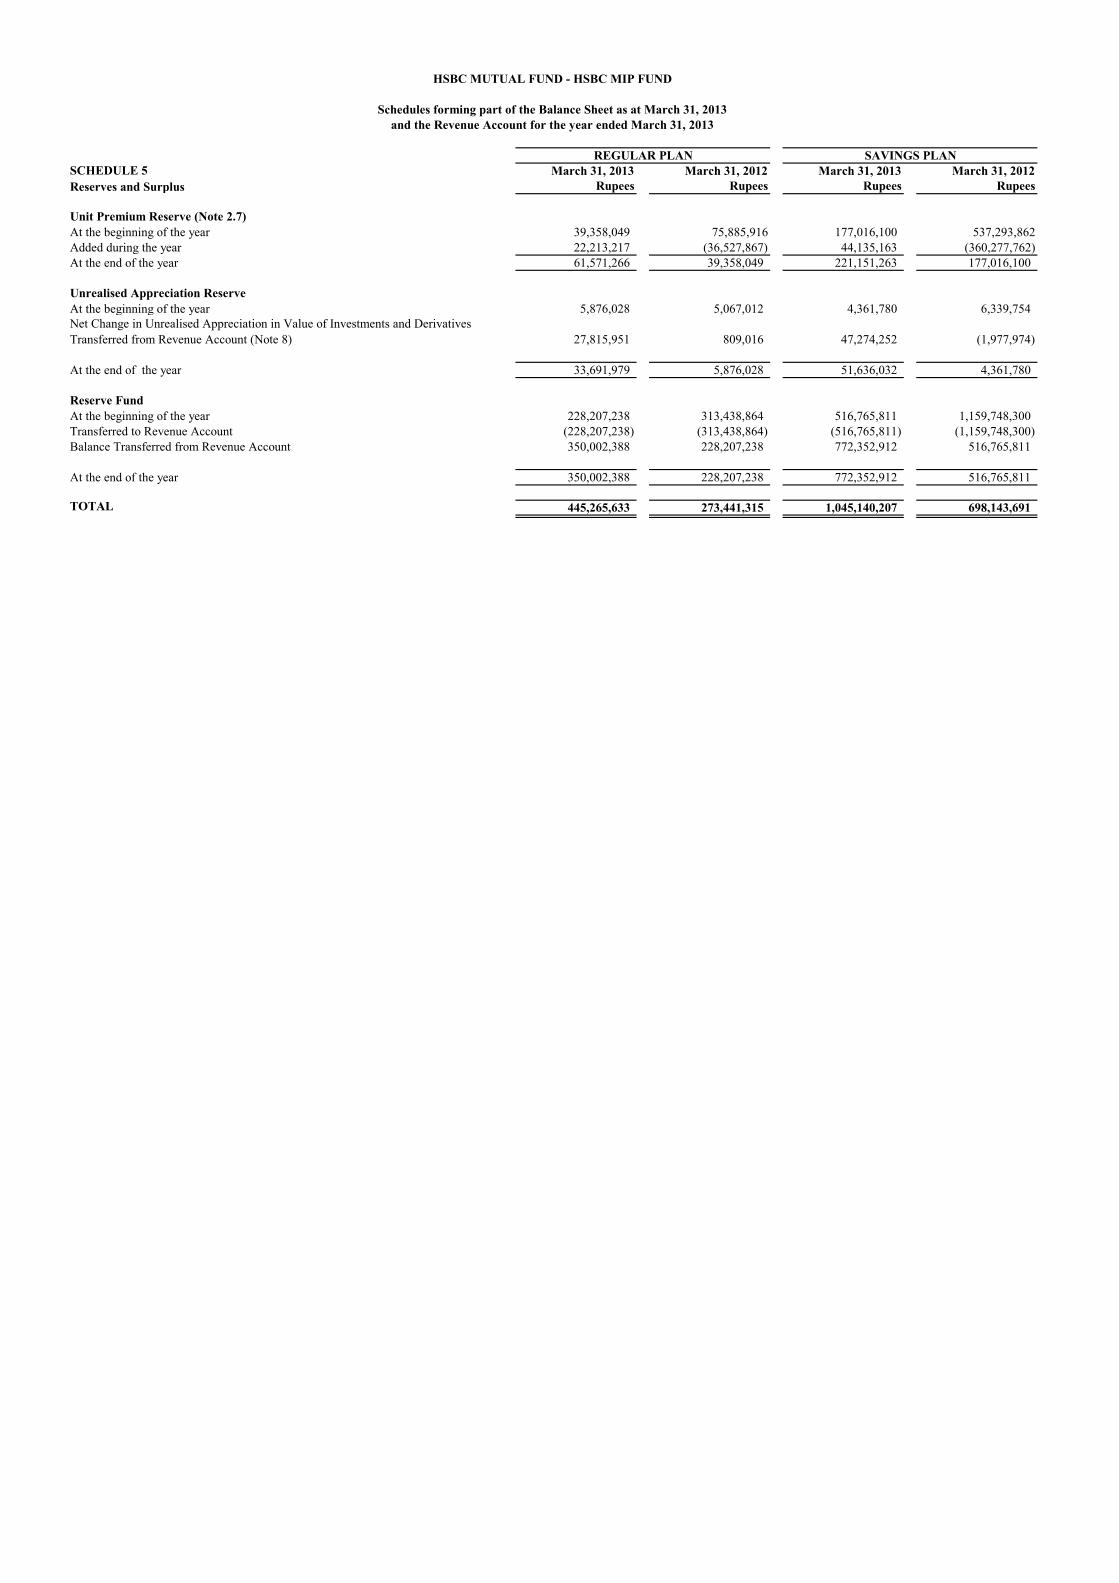
SCHEDULE 5 March 31, 2013 March 31, 2012 March 31, 2013 March 31, 2012Reserves and Surplus Rupees Rupees Rupees Rupees
Unit Premium Reserve (Note 2.7)At the beginning of the year 39,358,049 75,885,916 177,016,100 537,293,862 Added during the year 22,213,217 (36,527,867) 44,135,163 (360,277,762)At the end of the year 61,571,266 39,358,049 221,151,263 177,016,100
Unrealised Appreciation ReserveAt the beginning of the year 5,876,028 5,067,012 4,361,780 6,339,754 Net Change in Unrealised Appreciation in Value of Investments and Derivatives Transferred from Revenue Account (Note 8) 27,815,951 809,016 47,274,252 (1,977,974)
At the end of the year 33,691,979 5,876,028 51,636,032 4,361,780
Reserve FundAt the beginning of the year 228,207,238 313,438,864 516,765,811 1,159,748,300 Transferred to Revenue Account (228,207,238) (313,438,864) (516,765,811) (1,159,748,300) Balance Transferred from Revenue Account 350,002,388 228,207,238 772,352,912 516,765,811
At the end of the year 350,002,388 228,207,238 772,352,912 516,765,811
TOTAL 445,265,633 * 273,441,315 * 1,045,140,207 * 698,143,691 *
HSBC MUTUAL FUND - HSBC MIP FUND
Schedules forming part of the Balance Sheet as at March 31, 2013and the Revenue Account for the year ended March 31, 2013
REGULAR PLAN SAVINGS PLAN
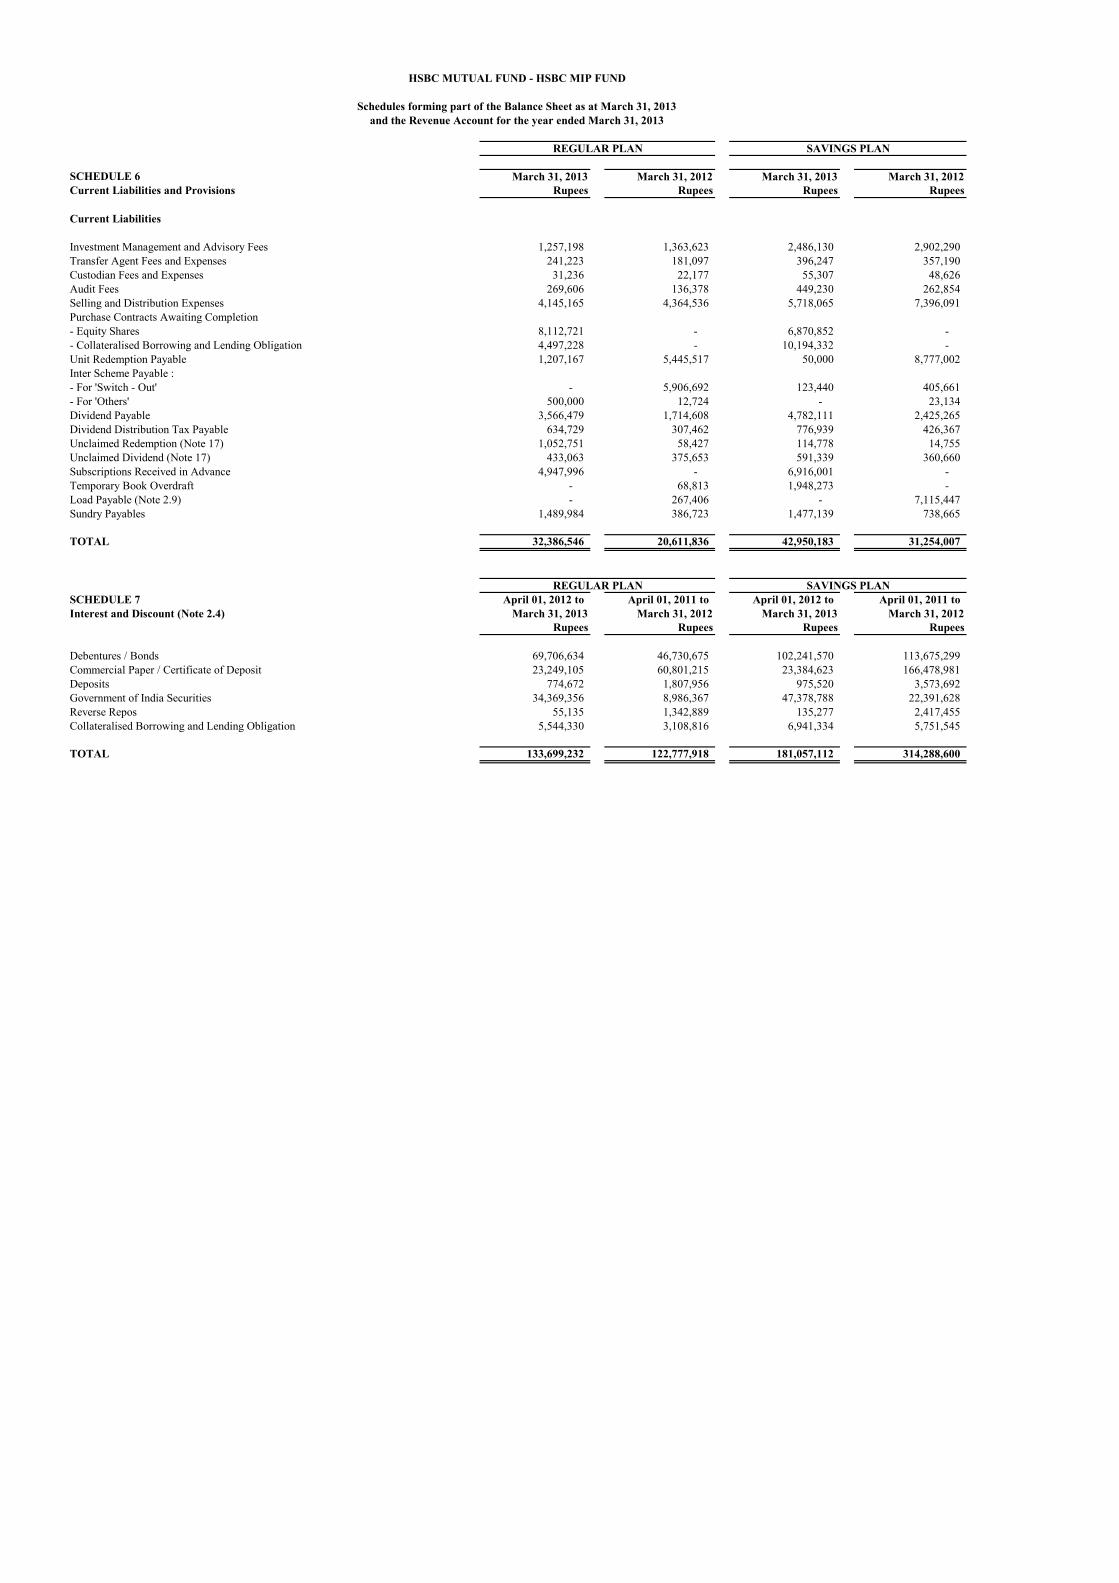
SCHEDULE 6 March 31, 2013 March 31, 2012 March 31, 2013 March 31, 2012Current Liabilities and Provisions Rupees Rupees Rupees Rupees
Current Liabilities
Investment Management and Advisory Fees 1,257,198 1,363,623 2,486,130 2,902,290 Transfer Agent Fees and Expenses 241,223 181,097 396,247 357,190 Custodian Fees and Expenses 31,236 22,177 55,307 48,626 Audit Fees 269,606 136,378 449,230 262,854 Selling and Distribution Expenses 4,145,165 4,364,536 5,718,065 7,396,091 Purchase Contracts Awaiting Completion - Equity Shares 8,112,721 - 6,870,852 - - Collateralised Borrowing and Lending Obligation 4,497,228 - 10,194,332 - Unit Redemption Payable 1,207,167 5,445,517 50,000 8,777,002 Inter Scheme Payable :- For 'Switch - Out' - 5,906,692 123,440 405,661 - For 'Others' 500,000 12,724 - 23,134 Dividend Payable 3,566,479 1,714,608 4,782,111 2,425,265 Dividend Distribution Tax Payable 634,729 307,462 776,939 426,367 Unclaimed Redemption (Note 17) 1,052,751 58,427 114,778 14,755 Unclaimed Dividend (Note 17) 433,063 375,653 591,339 360,660 Subscriptions Received in Advance 4,947,996 - 6,916,001 - Temporary Book Overdraft - 68,813 1,948,273 - Load Payable (Note 2.9) - 267,406 - 7,115,447 Sundry Payables 1,489,984 386,723 1,477,139 738,665
TOTAL 32,386,546 20,611,836 42,950,183 31,254,007
SCHEDULE 7 April 01, 2012 to April 01, 2011 to April 01, 2012 to April 01, 2011 toInterest and Discount (Note 2.4) March 31, 2013 March 31, 2012 March 31, 2013 March 31, 2012
Rupees Rupees Rupees Rupees
Debentures / Bonds 69,706,634 46,730,675 102,241,570 113,675,299 Commercial Paper / Certificate of Deposit 23,249,105 60,801,215 23,384,623 166,478,981 Deposits 774,672 1,807,956 975,520 3,573,692 Government of India Securities 34,369,356 8,986,367 47,378,788 22,391,628 Reverse Repos 55,135 1,342,889 135,277 2,417,455 Collateralised Borrowing and Lending Obligation 5,544,330 3,108,816 6,941,334 5,751,545
TOTAL 133,699,232 122,777,918 181,057,112 314,288,600
REGULAR PLAN SAVINGS PLAN
HSBC MUTUAL FUND - HSBC MIP FUND
Schedules forming part of the Balance Sheet as at March 31, 2013and the Revenue Account for the year ended March 31, 2013
REGULAR PLAN SAVINGS PLAN
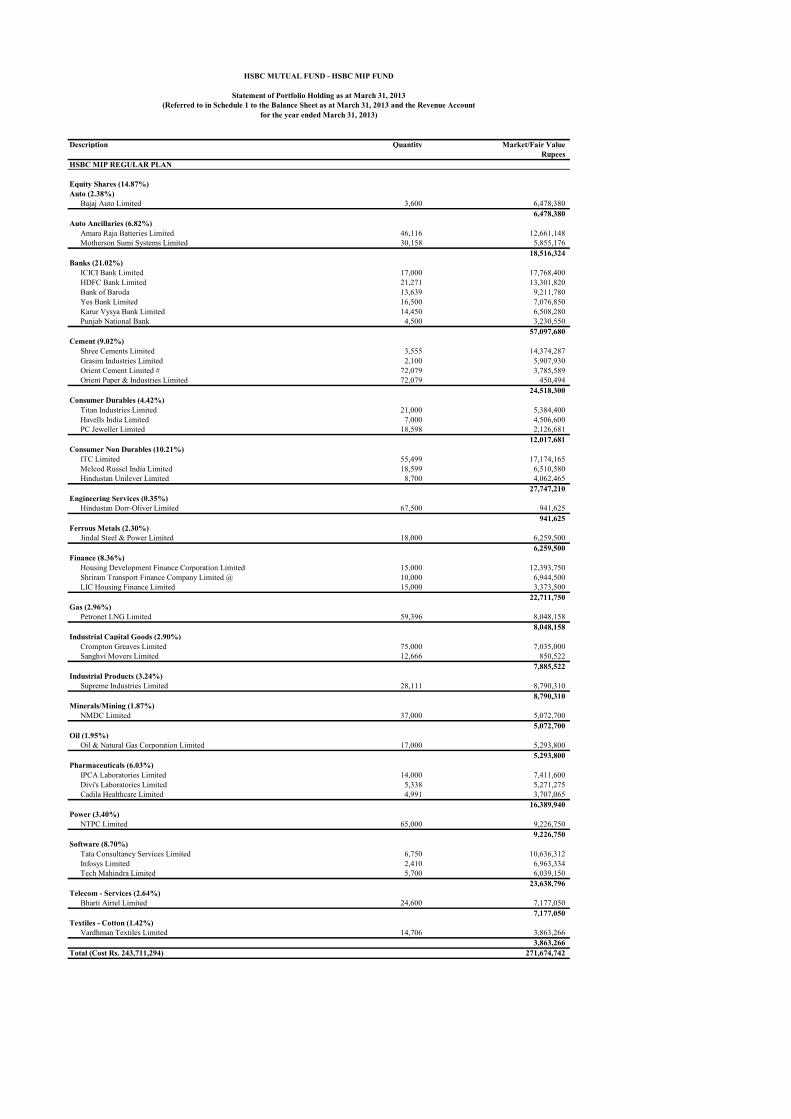
Description Quantity Market/Fair ValueRupees
HSBC MIP REGULAR PLAN
Equity Shares (14.87%)Auto (2.38%)
Bajaj Auto Limited 3,600 6,478,380 6,478,380
Auto Ancillaries (6.82%)Amara Raja Batteries Limited 46,116 12,661,148 Motherson Sumi Systems Limited 30,158 5,855,176
18,516,324 Banks (21.02%)
ICICI Bank Limited 17,000 17,768,400 HDFC Bank Limited 21,271 13,301,820 Bank of Baroda 13,639 9,211,780 Yes Bank Limited 16,500 7,076,850 Karur Vysya Bank Limited 14,450 6,508,280 Punjab National Bank 4,500 3,230,550
57,097,680 Cement (9.02%)
Shree Cements Limited 3,555 14,374,287 Grasim Industries Limited 2,100 5,907,930 Orient Cement Limited # 72,079 3,785,589 Orient Paper & Industries Limited 72,079 450,494
24,518,300 Consumer Durables (4.42%)
Titan Industries Limited 21,000 5,384,400 Havells India Limited 7,000 4,506,600 PC Jeweller Limited 18,598 2,126,681
12,017,681 Consumer Non Durables (10.21%)
ITC Limited 55,499 17,174,165 Mcleod Russel India Limited 18,599 6,510,580 Hindustan Unilever Limited 8,700 4,062,465
27,747,210 Engineering Services (0.35%)
Hindustan Dorr-Oliver Limited 67,500 941,625 941,625
Ferrous Metals (2.30%)Jindal Steel & Power Limited 18,000 6,259,500
6,259,500 Finance (8.36%)
Housing Development Finance Corporation Limited 15,000 12,393,750 Shriram Transport Finance Company Limited @ 10,000 6,944,500 LIC Housing Finance Limited 15,000 3,373,500
22,711,750 Gas (2.96%)
Petronet LNG Limited 59,396 8,048,158 8,048,158
Industrial Capital Goods (2.90%)Crompton Greaves Limited 75,000 7,035,000 Sanghvi Movers Limited 12,666 850,522
7,885,522 Industrial Products (3.24%)
Supreme Industries Limited 28,111 8,790,310 8,790,310
Minerals/Mining (1.87%)NMDC Limited 37,000 5,072,700
5,072,700 Oil (1.95%)
Oil & Natural Gas Corporation Limited 17,000 5,293,800 5,293,800
Pharmaceuticals (6.03%)IPCA Laboratories Limited 14,000 7,411,600 Divi's Laboratories Limited 5,338 5,271,275 Cadila Healthcare Limited 4,991 3,707,065
16,389,940 Power (3.40%)
NTPC Limited 65,000 9,226,750 9,226,750
Software (8.70%)Tata Consultancy Services Limited 6,750 10,636,312 Infosys Limited 2,410 6,963,334 Tech Mahindra Limited 5,700 6,039,150
23,638,796 Telecom - Services (2.64%)
Bharti Airtel Limited 24,600 7,177,050 7,177,050
Textiles - Cotton (1.42%)Vardhman Textiles Limited 14,706 3,863,266
3,863,266 Total (Cost Rs. 243,711,294) 271,674,742
HSBC MUTUAL FUND - HSBC MIP FUND
Statement of Portfolio Holding as at March 31, 2013(Referred to in Schedule 1 to the Balance Sheet as at March 31, 2013 and the Revenue Account
for the year ended March 31, 2013)

Description Quantity Market/Fair ValueRupees
Non-Convertible Debentures / Bonds Listed / Awaiting listing (53.15%)Banks (6.75%)
9.32% Export Import Bank of India 2015 $ 50 50,475,029 8.95% Bank of Baroda 2016 $ 15 15,062,797
65,537,826 Finance (70.90%)
9.90% Bajaj Finance Limited 2014 $ 10 100,552,093 9.20% Housing Development Finance Corporation Limited 2018 $ 100 100,101,842 9.64% LIC Housing Finance Limited 2014 $ 80 80,343,589 8.70% Rural Electrification Corporation Limited 2018 $ 80 79,640,787 8.95% Power Finance Corporation Limited 2018 $ 70 70,256,584 10.20% Shriram Transport Finance Company Limited 2013 $ 70 70,062,620 0.00% Housing Development Finance Corporation Limited 2017 $ 50 56,791,492 9.27% Power Finance Corporation Limited 2017 $ 50 50,601,780 8.90% Power Finance Corporation Limited 2018 $ 30 30,054,090 8.90% Power Finance Corporation Limited 2023 $ 30 30,053,819 9.62% National Housing Bank 2014 $ 20 20,049,670
688,508,366 Finance & Term Lending (13.59%)
9.33% National Bank for Agriculture and Rural Development 2017 $ 80 81,317,491 9.50% National Bank for Agriculture and Rural Development 2015 $ 30 30,382,476 9.40% National Bank for Agriculture and Rural Development 2016 $ 20 20,313,132
132,013,099 Power (8.76%)
8.80% Power Grid Corporation of India Limited 2023 $ 85 85,039,523 85,039,523
Total (Cost Rs. 965,748,481) 971,098,814
Privately Placed / Unlisted Non-Convertible Debentures / Bonds (2.76%)Finance (100.00%)9.78% Tata Sons Limited 2015 $ 50 50,513,313
50,513,313 Total (Cost Rs. 50,213,100) 50,513,313
Commercial Papers/Certificate of Deposits (16.50%)Certificate of Deposits (84.14%)
ING Vysya Bank Limited 2013 $ 1,000 98,997,444 ICICI Bank Limited 2013 $ 700 69,047,274 Syndicate Bank 2013 $ 700 65,855,047 Allahabad Bank 2013 $ 200 19,684,509
253,584,274 Commercial Papers (15.86%)
Kotak Mahindra Prime Limited 2013 $ 100 47,794,704 47,794,704
Total (Cost Rs. 301,300,992) 301,378,978
Government of India Securities (12.72%)8.20% Government Stock-M- 24-Sep-2025 1,815,000 183,296,850 8.15% Government Stock-M- 11-Jun-2022 485,000 49,111,100
Total (Cost Rs. 234,128,354) 232,407,950 TOTAL INVESTMENTS (Cost Rs. 1,795,102,221) 1,827,073,797
Deposits (0.78%) ^ Tenure9.80% The Hongkong and Shanghai Banking Corporation Limited 91 10,000,000
Total Deposits 10,000,000
# Fair value of equity shares awaiting listing as determined in good faith by HSBC Asset Management (India) Private Limited under procedures approved by the Board of Trustees.
^ Denotes Percentage to Net Assets.
Confirmation has been received from J P Morgan Chase Bank, Mumbai Branch at the end of the financial year for the investments held by them.@ Investments in companies which have invested more than five percent of the net asset value of any scheme of HSBC Mutual Fund.
There were no derivative transactions during the year.
Statement of Portfolio Holding as at March 31, 2013(Referred to in Schedule 1 to the Balance Sheet as at March 31, 2013 and the Revenue Account
for the year ended March 31, 2013)
$ Fair value of non traded debt securities as determined by HSBC Asset Management (India) Private Limited under procedures approved by the Board of Trusteesin accordance with the guidelines for valuation of securities for Mutual funds as applicable issued by the Securities and Exchange Board of India.
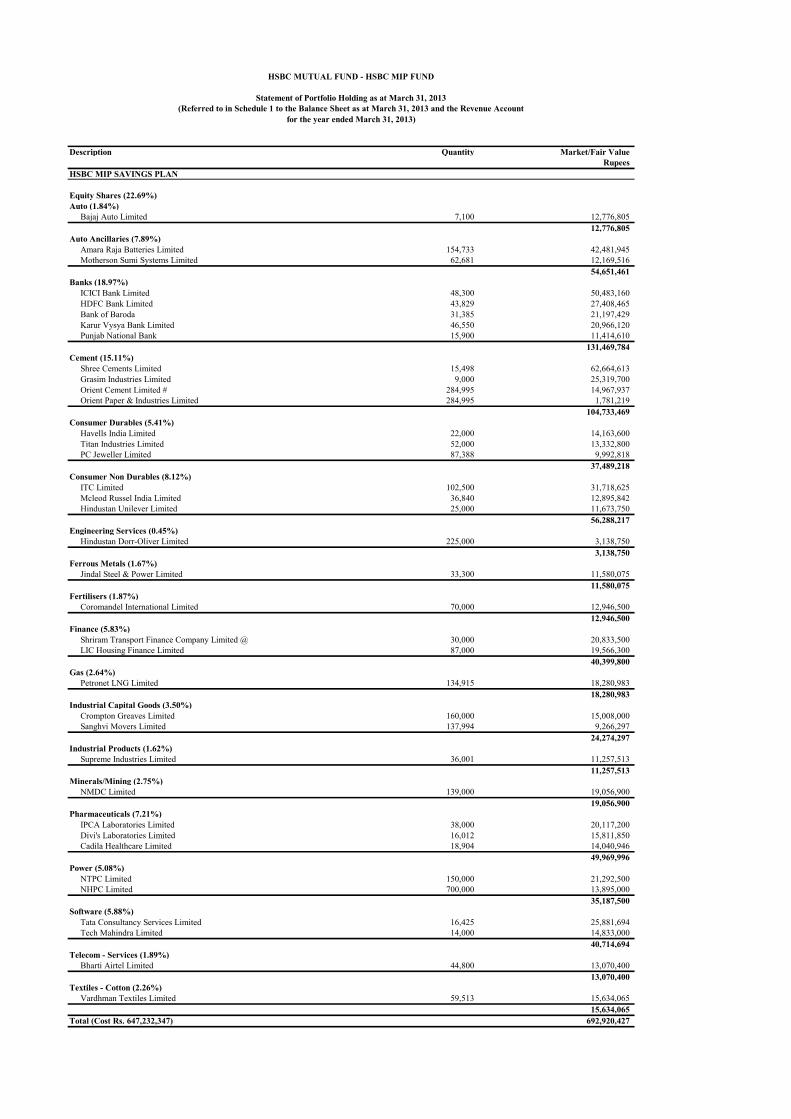
Description Quantity Market/Fair ValueRupees
HSBC MIP SAVINGS PLAN
Equity Shares (22.69%)Auto (1.84%)
Bajaj Auto Limited 7,100 12,776,805 12,776,805
Auto Ancillaries (7.89%)Amara Raja Batteries Limited 154,733 42,481,945 Motherson Sumi Systems Limited 62,681 12,169,516
54,651,461 Banks (18.97%)
ICICI Bank Limited 48,300 50,483,160 HDFC Bank Limited 43,829 27,408,465 Bank of Baroda 31,385 21,197,429 Karur Vysya Bank Limited 46,550 20,966,120 Punjab National Bank 15,900 11,414,610
131,469,784 Cement (15.11%)
Shree Cements Limited 15,498 62,664,613 Grasim Industries Limited 9,000 25,319,700 Orient Cement Limited # 284,995 14,967,937 Orient Paper & Industries Limited 284,995 1,781,219
104,733,469 Consumer Durables (5.41%)
Havells India Limited 22,000 14,163,600 Titan Industries Limited 52,000 13,332,800 PC Jeweller Limited 87,388 9,992,818
37,489,218 Consumer Non Durables (8.12%)
ITC Limited 102,500 31,718,625 Mcleod Russel India Limited 36,840 12,895,842 Hindustan Unilever Limited 25,000 11,673,750
56,288,217 Engineering Services (0.45%)
Hindustan Dorr-Oliver Limited 225,000 3,138,750 3,138,750
Ferrous Metals (1.67%)Jindal Steel & Power Limited 33,300 11,580,075
11,580,075 Fertilisers (1.87%)
Coromandel International Limited 70,000 12,946,500 12,946,500
Finance (5.83%)Shriram Transport Finance Company Limited @ 30,000 20,833,500 LIC Housing Finance Limited 87,000 19,566,300
40,399,800 Gas (2.64%)
Petronet LNG Limited 134,915 18,280,983 18,280,983
Industrial Capital Goods (3.50%)Crompton Greaves Limited 160,000 15,008,000 Sanghvi Movers Limited 137,994 9,266,297
24,274,297 Industrial Products (1.62%)
Supreme Industries Limited 36,001 11,257,513 11,257,513
Minerals/Mining (2.75%)NMDC Limited 139,000 19,056,900
19,056,900 Pharmaceuticals (7.21%)
IPCA Laboratories Limited 38,000 20,117,200 Divi's Laboratories Limited 16,012 15,811,850 Cadila Healthcare Limited 18,904 14,040,946
49,969,996 Power (5.08%)
NTPC Limited 150,000 21,292,500 NHPC Limited 700,000 13,895,000
35,187,500 Software (5.88%)
Tata Consultancy Services Limited 16,425 25,881,694 Tech Mahindra Limited 14,000 14,833,000
40,714,694 Telecom - Services (1.89%)
Bharti Airtel Limited 44,800 13,070,400 13,070,400
Textiles - Cotton (2.26%)Vardhman Textiles Limited 59,513 15,634,065
15,634,065 Total (Cost Rs. 647,232,347) 692,920,427
HSBC MUTUAL FUND - HSBC MIP FUND
Statement of Portfolio Holding as at March 31, 2013(Referred to in Schedule 1 to the Balance Sheet as at March 31, 2013 and the Revenue Account
for the year ended March 31, 2013)

Description Quantity Market ValueRupees
Non-Convertible Debentures / Bonds Listed / Awaiting listing (46.78%)Banks (1.41%)
8.95% Bank of Baroda 2016 $ 20 20,083,730 20,083,730
Finance (74.27%)10.20% Shriram Transport Finance Company Limited 2013 $ 180 180,161,022 9.90% Bajaj Finance Limited 2014 $ 15 150,828,139 9.20% Housing Development Finance Corporation Limited 2018 $ 150 150,152,764 8.70% Rural Electrification Corporation Limited 2018 $ 120 119,461,181 9.64% LIC Housing Finance Limited 2014 $ 100 100,429,487 8.95% Power Finance Corporation Limited 2018 $ 100 100,366,548 9.27% Power Finance Corporation Limited 2017 $ 50 50,601,780 9.85% Housing Development Finance Corporation Limited 2015 $ 50 50,584,214 8.90% Power Finance Corporation Limited 2018 $ 45 45,081,135 8.90% Power Finance Corporation Limited 2023 $ 45 45,080,729 10.05% Shriram Transport Finance Company Limited 2013 $ 30 30,021,764 0.00% Housing Development Finance Corporation Limited 2017 $ 25 28,395,746 9.62% National Housing Bank 2014 $ 10 10,024,835
1,061,189,344 Finance & Term Lending (12.07%)
9.40% National Bank for Agriculture and Rural Development 2016 $ 80 81,252,530 9.50% National Bank for Agriculture and Rural Development 2015 $ 70 70,892,444 9.33% National Bank for Agriculture and Rural Development 2017 $ 20 20,329,373
172,474,346 Power (12.25%)
8.80% Power Grid Corporation of India Limited 2023 $ 175 175,081,370 175,081,370
Total (Cost Rs. 1,423,263,632) 1,428,828,789
Privately Placed / Unlisted Non-Convertible Debentures / Bonds (1.65%)Finance (100.00%)9.78% Tata Sons Limited 2015 $ 50 50,513,313
50,513,313 Total (Cost Rs. 50,213,100) 50,513,313 Certificate of Deposits (13.32%)Certificate of Deposits (100.00%)
ING Vysya Bank Limited 2013 $ 2,000 197,994,887 ICICI Bank Limited 2013 $ 750 73,979,222 Allahabad Bank 2013 $ 700 68,895,780 Oriental Bank of Commerce 2013 $ 700 66,014,446
406,884,335 Total (Cost Rs. 406,801,753) 406,884,335
Government of India Securities (15.56%)8.20% Government Stock-M- 24-Sep-2025 2,700,000 272,673,000 8.15% Government Stock-M- 11-Jun-2022 1,025,000 103,791,500 8.12% Government Stock-M- 10-Dec-2020 930,000 94,460,100 8.97% Government Stock-M- 05-Dec-2030 40,000 4,267,300
Total (Cost Rs. 478,019,802) 475,191,900 TOTAL INVESTMENTS (Cost Rs. 3,005,530,635) 3,054,338,764
Deposits (0.90%) ^ Tenure9.60% The Hongkong and Shanghai Banking Corporation Limited 91 12,000,000 9.80% The Hongkong and Shanghai Banking Corporation Limited 91 10,000,000
Total Deposits 22,000,000
# Fair value of equity shares awaiting listing as determined in good faith by HSBC Asset Management (India) Private Limited under procedures approved by the Board of Trustees.
There were no derivative transactions during the year.^ Denotes Percentage to Net Assets.
Statement of Portfolio Holding as at March 31, 2013(Referred to in Schedule 1 to the Balance Sheet as at March 31, 2013 and the Revenue Account
for the year ended March 31, 2013)
Confirmation has been received from J P Morgan Chase Bank, Mumbai Branch at the end of the financial year for the investments held by them.@ Investments in companies which have invested more than five percent of the net asset value of any scheme of HSBC Mutual Fund.
$ Fair value of non traded debt securities as determined by HSBC Asset Management (India) Private Limited under procedures approved by the Board of Trusteesin accordance with the guidelines for valuation of securities for Mutual funds as applicable issued by the Securities and Exchange Board of India.
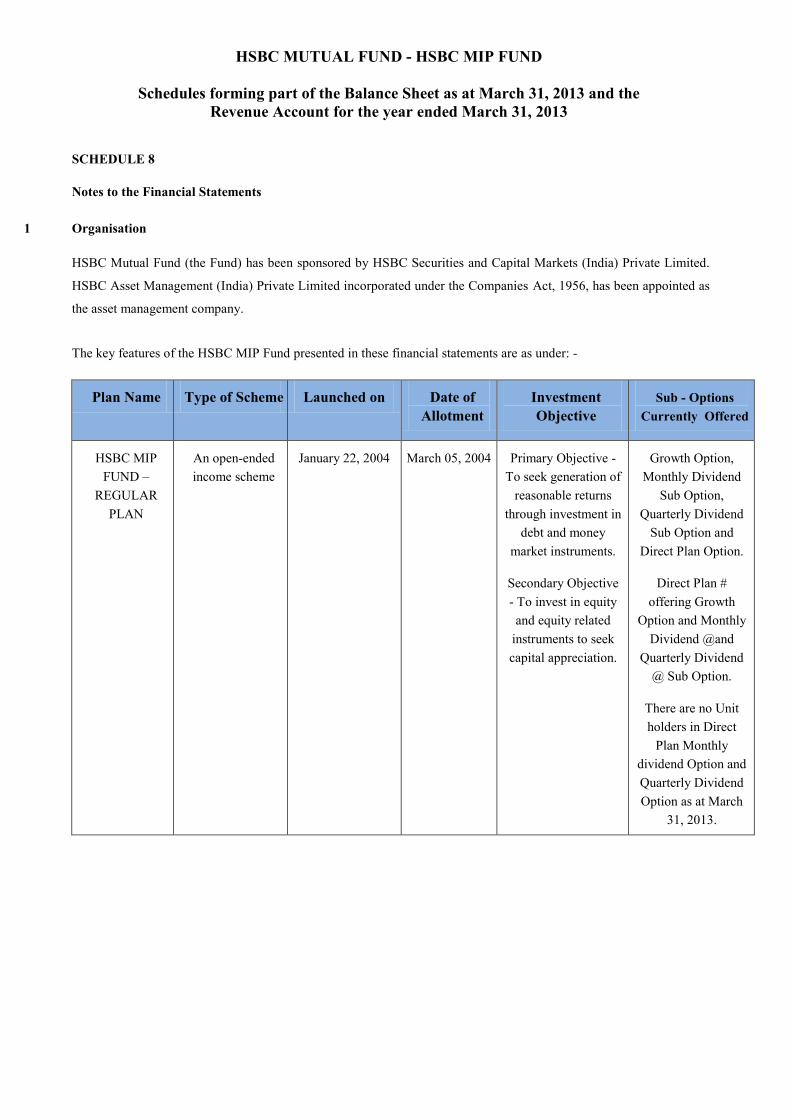
HSBC MUTUAL FUND - HSBC MIP FUND
Schedules forming part of the Balance Sheet as at March 31, 2013 and the Revenue Account for the year ended March 31, 2013
SCHEDULE 8
Notes to the Financial Statements
1 Organisation
HSBC Mutual Fund (the Fund) has been sponsored by HSBC Securities and Capital Markets (India) Private Limited.
HSBC Asset Management (India) Private Limited incorporated under the Companies Act, 1956, has been appointed as
the asset management company.
The key features of the HSBC MIP Fund presented in these financial statements are as under: -
Plan Name Type of Scheme Launched on Date of Allotment
Investment Objective
Sub - Options Currently Offered
HSBC MIP FUND –
REGULAR PLAN
An open-ended income scheme
January 22, 2004 March 05, 2004 Primary Objective - To seek generation of
reasonable returns through investment in
debt and money market instruments.
Secondary Objective - To invest in equity and equity related
instruments to seek capital appreciation.
Growth Option, Monthly Dividend
Sub Option, Quarterly Dividend
Sub Option and Direct Plan Option.
Direct Plan # offering Growth
Option and Monthly Dividend @and
Quarterly Dividend @ Sub Option.
There are no Unit holders in Direct
Plan Monthly dividend Option and Quarterly Dividend Option as at March
31, 2013.
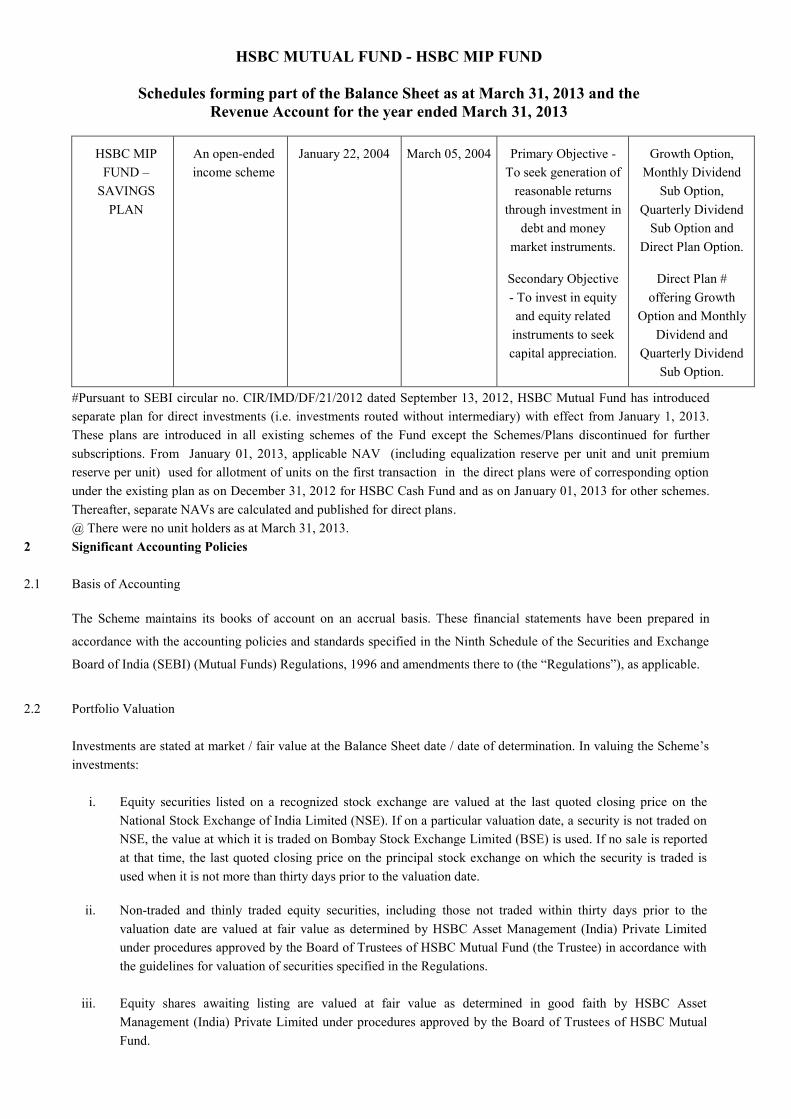
HSBC MUTUAL FUND - HSBC MIP FUND
Schedules forming part of the Balance Sheet as at March 31, 2013 and the Revenue Account for the year ended March 31, 2013
HSBC MIP FUND –
SAVINGS PLAN
An open-ended income scheme
January 22, 2004 March 05, 2004 Primary Objective - To seek generation of
reasonable returns through investment in
debt and money market instruments.
Secondary Objective - To invest in equity and equity related
instruments to seek capital appreciation.
Growth Option, Monthly Dividend
Sub Option, Quarterly Dividend
Sub Option and Direct Plan Option.
Direct Plan # offering Growth
Option and Monthly Dividend and
Quarterly Dividend Sub Option.
#Pursuant to SEBI circular no. CIR/IMD/DF/21/2012 dated September 13, 2012, HSBC Mutual Fund has introduced separate plan for direct investments (i.e. investments routed without intermediary) with effect from January 1, 2013. These plans are introduced in all existing schemes of the Fund except the Schemes/Plans discontinued for further subscriptions. From January 01, 2013, applicable NAV (including equalization reserve per unit and unit premium reserve per unit) used for allotment of units on the first transaction in the direct plans were of corresponding option under the existing plan as on December 31, 2012 for HSBC Cash Fund and as on January 01, 2013 for other schemes. Thereafter, separate NAVs are calculated and published for direct plans.
@ There were no unit holders as at March 31, 2013. 2 Significant Accounting Policies
2.1 Basis of Accounting
The Scheme maintains its books of account on an accrual basis. These financial statements have been prepared in
accordance with the accounting policies and standards specified in the Ninth Schedule of the Securities and Exchange
Board of India (SEBI) (Mutual Funds) Regulations, 1996 and amendments there to (the “Regulations”), as applicable.
2.2 Portfolio Valuation
Investments are stated at market / fair value at the Balance Sheet date / date of determination. In valuing the Scheme’s investments:
i. Equity securities listed on a recognized stock exchange are valued at the last quoted closing price on the National Stock Exchange of India Limited (NSE). If on a particular valuation date, a security is not traded on NSE, the value at which it is traded on Bombay Stock Exchange Limited (BSE) is used. If no sale is reported at that time, the last quoted closing price on the principal stock exchange on which the security is traded is used when it is not more than thirty days prior to the valuation date.
ii. Non-traded and thinly traded equity securities, including those not traded within thirty days prior to the
valuation date are valued at fair value as determined by HSBC Asset Management (India) Private Limited under procedures approved by the Board of Trustees of HSBC Mutual Fund (the Trustee) in accordance with the guidelines for valuation of securities specified in the Regulations.
iii. Equity shares awaiting listing are valued at fair value as determined in good faith by HSBC Asset
Management (India) Private Limited under procedures approved by the Board of Trustees of HSBC Mutual Fund.
HSBC MUTUAL FUND - HSBC MIP FUND
Schedules forming part of the Balance Sheet as at March 31, 2013 and the Revenue Account for the year ended March 31, 2013
iv. For money market securities, debt securities and floating rate securities : a) All traded money market securities, debt securities and floating rate securities listed on the recognized stock exchange are valued at the weighted average price at which they are traded on the particular valuation day. b) Non-traded /thinly traded money market securities, debt securities and floating rate securities with residual maturity of upto 91 days are valued on amortization basis. Floating rate securities with floor and caps on coupon rate and residual maturity of upto 91 days are valued on amortization basis taking the coupon rate as floor. c) Non-traded /thinly traded money market securities, debt securities and floating rate securities with residual maturity of over 91 days are valued at fair value as per procedures determined by HSBC Asset Management (India) Private Limited and approved by the Trustee in accordance with the guidelines for valuation of securities for mutual funds, issued by SEBI from time to time. For money market securities, debt securities and floating rate securities (with effect from July 06, 2012) a) All traded money market securities and debt securities and floating rate securities are valued at the weighted average traded YTM or weighted average price at which they are traded / reported on public platform on the particular valuation day as per procedures determined by HSBC Asset Management (India) Private Limited and approved by the Trustee in accordance with the guidelines for valuation of securities for mutual funds, issued by SEBI from time to time. b) Non-traded /thinly traded money market and debt securities and floating rate securities, with residual maturity of up to 91* days are valued on amortization basis. Floating rate securities with floor and caps on coupon rate and residual maturity of up to 91* days are valued on amortization basis taking the coupon rate as floor. Amortized price as per Crisil Bond Valuer (CBV) will be compared with the reference price (as per CBV) to ascertain if the difference is within the band of +/- 10 basis points of the reference price. In case of amortised price falling outside the band, the YTM of the amortised price will be adjusted in order to bring the price within the band. c) Non-traded /thinly traded money market securities, debt securities and floating rate securities with residual maturity of over 91* days are valued at fair value as per procedures determined by HSBC Asset Management (India) Private Limited and approved by the Trustee in accordance with the guidelines for valuation of securities for mutual funds, issued by SEBI from time to time. Thus they are valued at benchmark yield/matrix of spread over risk free benchmark yield obtained from agencies entrusted for the said purpose by AMFI. This may be further adjusted for the illiquidity mark-up / mark-down as permitted under the regulations. *Pursuant to SEBI circular CIR/IMD/DF/6/2012 dated February 28, 2012, with effect from October 01, 2012, reference to 91 days above was changed to 60 days.
v. Instruments bought on ‘repo’ basis are valued at the resale price after deduction of applicable interest up to
the date of resale. Instruments sold on repo basis are adjusted for the difference between the repurchase price (after deduction of applicable interest upto the date of repurchase) and the value of instrument.
HSBC MUTUAL FUND - HSBC MIP FUND
Schedules forming part of the Balance Sheet as at March 31, 2013 and the Revenue Account for the year ended March 31, 2013
vi. Collateralised Borrowing and Lending Obligations (CBLO) are valued at cost plus accrued interest. The net unrealised appreciation / depreciation in the value of investments and derivatives is determined separately
for each category of investments and derivatives. In respect of each category of investments and derivatives, the
net change in the unrealised appreciation if any, between two balance sheet dates / valuation dates is accounted
through the Revenue Account and thereafter the net change in unrealised appreciation is transferred from the
Revenue Account to the Unrealised Appreciation Reserve. The net change in unrealised depreciation in the value
of investments and derivatives between the two balance sheet dates/ valuation dates if any, is accounted through
the Revenue Account.
Net unrealised appreciation is reduced from the distributable income at the time of income distribution.
2.3 Securities Transaction
(i) Investment securities transactions are accounted for on a trade date basis. The Scheme uses the average cost method
for determining the realized gain or loss on sale of investments. The cost of investments includes brokerage stamp
charges and any other charges customarily included in the contract note but excludes custodian safekeeping fees. Pursuant to SEBI circular no. CIR/IMD/DF/21/2012 dated September 13, 2012, with effect from October 01, 2012,
Brokerage and Transaction Costs which are incurred for the purpose of execution of trade, is included in the cost of
investment, not exceeding 0.12 per cent in case of cash market transactions and 0.05 per cent in case of derivatives
transactions. Remaining portion is charged to expenses, within total expense ratio in line with Regulations.
(ii) Rights entitlements are recognized as investments on the ex-rights date or during the rights offer period depending
upon the date of intention to subscribe to the rights issue.
(iii) Bonus entitlements are recognized as investments on the ex-bonus date.
2.4 Investment Income
Interest income is recorded on an accrual basis. Dividend income is recognised on ex dividend date.
2.5 Derivatives
The Scheme enters into derivative transactions in stock / index futures and options for the purpose of hedging and
portfolio balancing.
“Derivative margin deposits” representing the margin towards stock / index derivative contracts entered into by the
Scheme is disclosed under “Other Current Assets”.
Futures

HSBC MUTUAL FUND - HSBC MIP FUND
Schedules forming part of the Balance Sheet as at March 31, 2013 and the Revenue Account for the year ended March 31, 2013
• Futures contracts are marked to market daily at the futures settlement price as determined by the exchange. The
variation margin calculated as the difference between the trade price or the previous day’s settlement price, as the case
may be, and the current day’s settlement price is recorded as a receivable or payable.
• When a contract is closed (squared off)/ settled (on expiry), the difference between the final settlement / square-off
price and the contract price is recognised in the Revenue Account. If more than one futures contracts in respect of the
same stock / index and expiry date, to which the squared off / settled contract pertains, is outstanding at the time of
square off / settlement of the contract, the weighted average method is followed for determining the gain or loss.
• As at the Balance Sheet date / date of determination, all open futures positions are valued at the futures settlement
price as determined by the exchange where it is traded. The unrealised appreciation / depreciation on all open positions
is considered for determining the net asset value.
Options
(i) Premium paid/received on bought/written option contracts is debited / credited to “equity option premium account”
and recorded as an Asset/Liability.
(ii) When the option contracts are squared off before expiry, the difference between the premium paid and received on
the squared off transactions is recognized in the revenue account. When the option contracts are exercised on or before
expiry, the difference between the option settlement price as determined by the exchange and the premium is recognized
in the revenue account. If more than one option contracts in respect of the same stock/index with the same strike price
and expiry date to which the squared off /exercised contract pertains is outstanding at the time of square off /exercise of
the contract, the weighted average method is followed for determining the gain or loss.
(iii) Premium asset/liability in respect of options not exercised / squared off as on expiry date is transferred to revenue
account.
As at the Balance Sheet date/date of determination, all open option positions are valued at the settlement price as
determined by the exchange where it is traded. Non traded option contracts are valued at fair value as determined by
HSBC Asset Management (India) Private Limited and approved by the Trustee. The unrealized appreciation/depreciation
on all open positions is considered for determining the net asset value.
2.6 Net Asset Value
The net asset value of the units of the Scheme is determined separately for the units issued under various Plans/
Options. For reporting the net asset value of the Plans/ Options, daily income earned, including realised and unrealised
gain or loss in the value of investments and expenses incurred by the Scheme are allocated to the Plans/ Options in
proportion to the value of the net assets.
2.7 Unit Premium Reserve
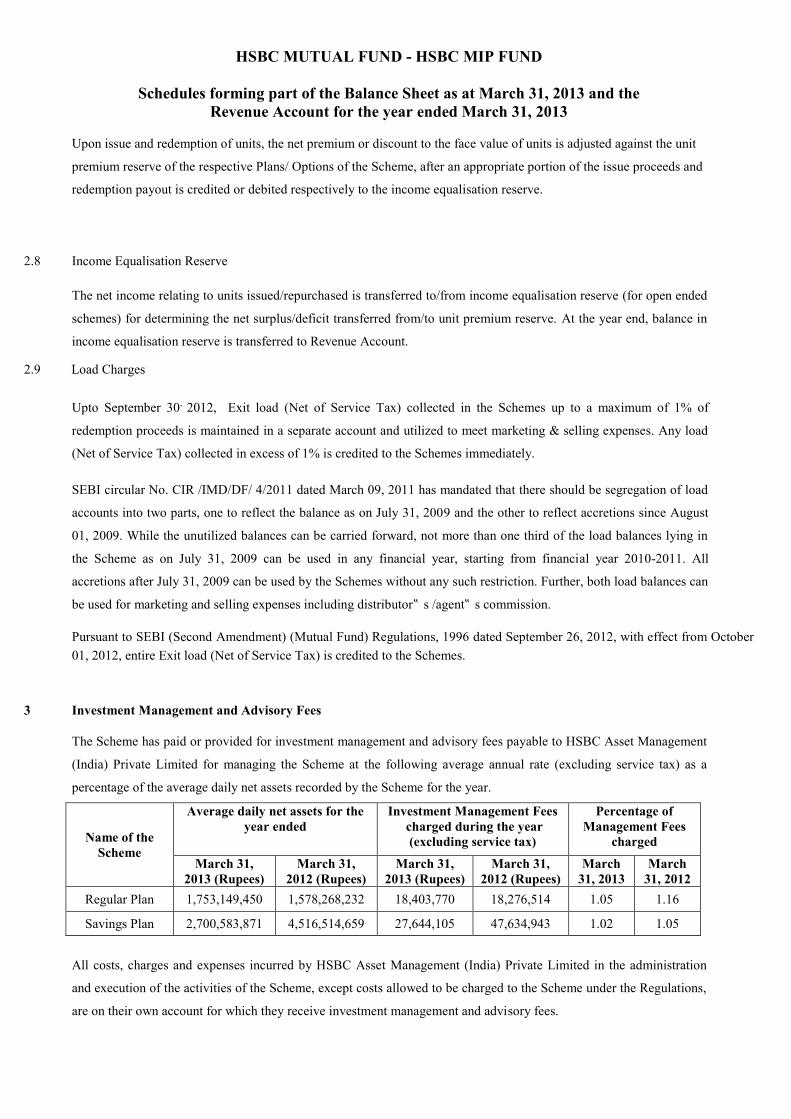
HSBC MUTUAL FUND - HSBC MIP FUND
Schedules forming part of the Balance Sheet as at March 31, 2013 and the Revenue Account for the year ended March 31, 2013
Upon issue and redemption of units, the net premium or discount to the face value of units is adjusted against the unit
premium reserve of the respective Plans/ Options of the Scheme, after an appropriate portion of the issue proceeds and
redemption payout is credited or debited respectively to the income equalisation reserve.
2.8 Income Equalisation Reserve
The net income relating to units issued/repurchased is transferred to/from income equalisation reserve (for open ended
schemes) for determining the net surplus/deficit transferred from/to unit premium reserve. At the year end, balance in
income equalisation reserve is transferred to Revenue Account.
2.9 Load Charges
Upto September 30, 2012, Exit load (Net of Service Tax) collected in the Schemes up to a maximum of 1% of
redemption proceeds is maintained in a separate account and utilized to meet marketing & selling expenses. Any load
(Net of Service Tax) collected in excess of 1% is credited to the Schemes immediately.
SEBI circular No. CIR /IMD/DF/ 4/2011 dated March 09, 2011 has mandated that there should be segregation of load
accounts into two parts, one to reflect the balance as on July 31, 2009 and the other to reflect accretions since August
01, 2009. While the unutilized balances can be carried forward, not more than one third of the load balances lying in
the Scheme as on July 31, 2009 can be used in any financial year, starting from financial year 2010-2011. All
accretions after July 31, 2009 can be used by the Schemes without any such restriction. Further, both load balances can
be used for marketing and selling expenses including distributor‟ s /agent‟ s commission.
Pursuant to SEBI (Second Amendment) (Mutual Fund) Regulations, 1996 dated September 26, 2012, with effect from October 01, 2012, entire Exit load (Net of Service Tax) is credited to the Schemes.
3 Investment Management and Advisory Fees
The Scheme has paid or provided for investment management and advisory fees payable to HSBC Asset Management
(India) Private Limited for managing the Scheme at the following average annual rate (excluding service tax) as a
percentage of the average daily net assets recorded by the Scheme for the year.
Name of the Scheme
Average daily net assets for the year ended
Investment Management Fees charged during the year
(excluding service tax)
Percentage of Management Fees
charged
March 31, 2013 (Rupees)
March 31, 2012 (Rupees)
March 31, 2013 (Rupees)
March 31, 2012 (Rupees)
March 31, 2013
March 31, 2012
Regular Plan 1,753,149,450 1,578,268,232 18,403,770 18,276,514 1.05 1.16
Savings Plan 2,700,583,871 4,516,514,659 27,644,105 47,634,943 1.02 1.05
All costs, charges and expenses incurred by HSBC Asset Management (India) Private Limited in the administration
and execution of the activities of the Scheme, except costs allowed to be charged to the Scheme under the Regulations,
are on their own account for which they receive investment management and advisory fees.
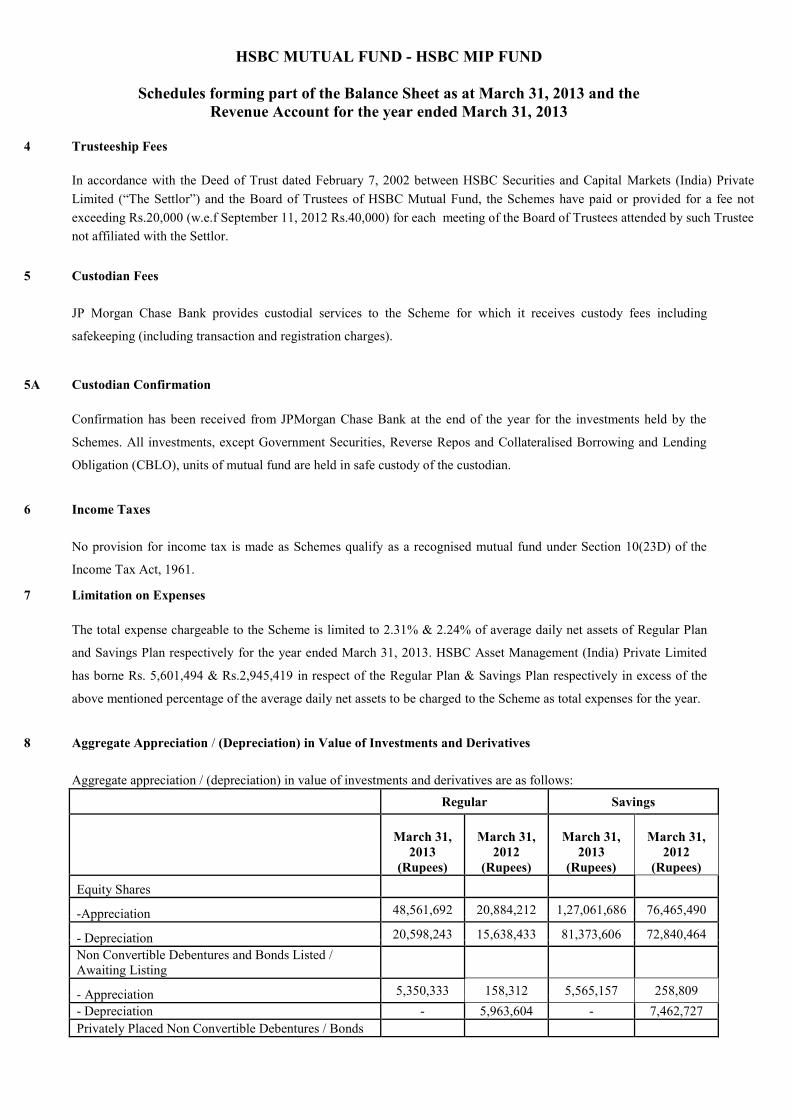
HSBC MUTUAL FUND - HSBC MIP FUND
Schedules forming part of the Balance Sheet as at March 31, 2013 and the Revenue Account for the year ended March 31, 2013
4 Trusteeship Fees
In accordance with the Deed of Trust dated February 7, 2002 between HSBC Securities and Capital Markets (India) Private Limited (“The Settlor”) and the Board of Trustees of HSBC Mutual Fund, the Schemes have paid or provided for a fee not exceeding Rs.20,000 (w.e.f September 11, 2012 Rs.40,000) for each meeting of the Board of Trustees attended by such Trustee not affiliated with the Settlor.
5 Custodian Fees
JP Morgan Chase Bank provides custodial services to the Scheme for which it receives custody fees including
safekeeping (including transaction and registration charges).
5A Custodian Confirmation Confirmation has been received from JPMorgan Chase Bank at the end of the year for the investments held by the
Schemes. All investments, except Government Securities, Reverse Repos and Collateralised Borrowing and Lending
Obligation (CBLO), units of mutual fund are held in safe custody of the custodian.
6 Income Taxes
No provision for income tax is made as Schemes qualify as a recognised mutual fund under Section 10(23D) of the
Income Tax Act, 1961.
7 Limitation on Expenses The total expense chargeable to the Scheme is limited to 2.31% & 2.24% of average daily net assets of Regular Plan
and Savings Plan respectively for the year ended March 31, 2013. HSBC Asset Management (India) Private Limited
has borne Rs. 5,601,494 & Rs.2,945,419 in respect of the Regular Plan & Savings Plan respectively in excess of the
above mentioned percentage of the average daily net assets to be charged to the Scheme as total expenses for the year.
8 Aggregate Appreciation / (Depreciation) in Value of Investments and Derivatives
Aggregate appreciation / (depreciation) in value of investments and derivatives are as follows:
Regular Savings
March 31, 2013
(Rupees)
March 31, 2012
(Rupees)
March 31, 2013
(Rupees)
March 31, 2012
(Rupees)
Equity Shares
-Appreciation 48,561,692 20,884,212 1,27,061,686 76,465,490
- Depreciation 20,598,243 15,638,433 81,373,606 72,840,464 Non Convertible Debentures and Bonds Listed / Awaiting Listing
- Appreciation 5,350,333 158,312 5,565,157 258,809 - Depreciation - 5,963,604 - 7,462,727 Privately Placed Non Convertible Debentures / Bonds

HSBC MUTUAL FUND - HSBC MIP FUND
Schedules forming part of the Balance Sheet as at March 31, 2013 and the Revenue Account for the year ended March 31, 2013
Regular Savings
March 31, 2013
(Rupees)
March 31, 2012
(Rupees)
March 31, 2013
(Rupees)
March 31, 2012
(Rupees) - Appreciation 300,212 - 300,212 - - Depreciation - - - - Commercial Paper / Certificate of Deposit - Appreciation 81,420 1,098,410 88,308 1,647,298 - Depreciation 3,434 468,160 5,726 910,544 Government of India Securities - Appreciation - - 1,89,898 - - Depreciation 1,720,404 611,307 3,017,800 1,114,367
9 Registered Securities
In accordance with Regulation 44(1) of the Securities and Exchange Board of India (Mutual Funds) Regulations, 1996,
securities purchased should be held in the name of the Scheme. As at March 31, 2013, Government securities
aggregating to Rs. 232,407,950 and Rs. 475,191,900 (market value) and as at March 31, 2012, Government Securities
aggregating to Rs. 39,465,550 and Rs. 68,559,950 (market value) of the Regular Plan and Savings Plan respectively
are held in the name of HSBC Mutual Fund.
10 (a) Aggregate Fair Value of Non-Traded/ Privately Placed Investments
Aggregate fair value of non-traded (including private placement) investments as determined by HSBC Asset
Management (India) Private Limited under the procedures approved by the Board of Trustees are as follows:
Plan Fair Value (Rupees) March 31, 2013 March 31, 2012
Regular 1,326,776,693 945,903,621 Savings 1,901,194,375 1,653,345,968
(b) Illiquid Securities The Scheme held the following illiquid Securities as at March 31, 2013 and March 31, 2012:
March 31, 2013 Plan Company Name Fair
Value (Rupee)
Percentage of Fair Value to
Net Assets Regular Orient Cement Limited 3,785,589 0.20 Savings Orient Cement Limited 14,967,937 0.47
March 31, 2012 Plan Company Name Fair
Value (Rupee)
Percentage of Fair Value to
Net Assets Regular Vardhman Special Steels Limited 121,429 0.01

HSBC MUTUAL FUND - HSBC MIP FUND
Schedules forming part of the Balance Sheet as at March 31, 2013 and the Revenue Account for the year ended March 31, 2013
Savings Vardhman Special Steels Limited 971,477 0.04 11 Aggregate Value of Purchase and Sale of Investments
The aggregate value of investment securities (excluding CBLO and Reverse Repos) purchased and sold (including
matured) during the year (excluding accretion of discount) and their percentage of the respective average daily net
assets is as follows:
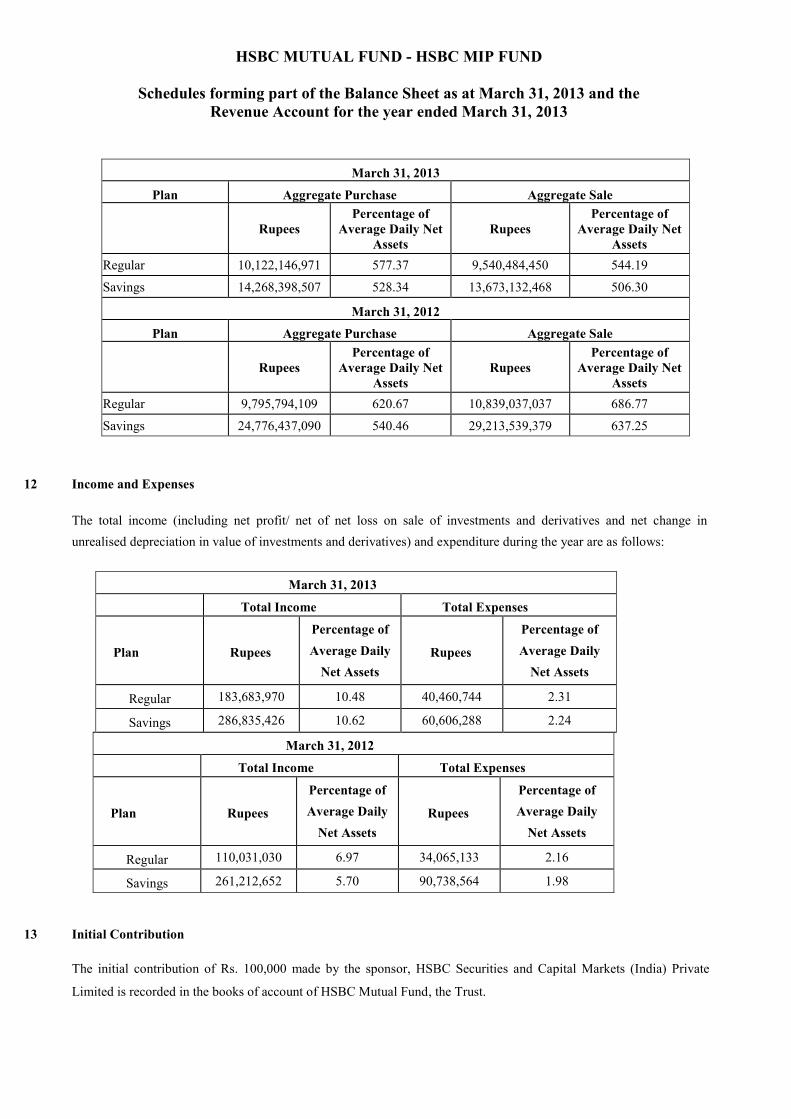
HSBC MUTUAL FUND - HSBC MIP FUND
Schedules forming part of the Balance Sheet as at March 31, 2013 and the Revenue Account for the year ended March 31, 2013
March 31, 2013
Plan Aggregate Purchase Aggregate Sale
Rupees
Percentage of Average Daily Net
Assets Rupees
Percentage of Average Daily Net
Assets Regular 10,122,146,971 577.37 9,540,484,450 544.19
Savings 14,268,398,507 528.34 13,673,132,468 506.30
March 31, 2012 Plan Aggregate Purchase Aggregate Sale
Rupees
Percentage of Average Daily Net
Assets Rupees
Percentage of Average Daily Net
Assets Regular 9,795,794,109 620.67 10,839,037,037 686.77
Savings 24,776,437,090 540.46 29,213,539,379 637.25 12 Income and Expenses
The total income (including net profit/ net of net loss on sale of investments and derivatives and net change in unrealised depreciation in value of investments and derivatives) and expenditure during the year are as follows:
March 31, 2013
Total Income Total Expenses
Plan Rupees
Percentage of Average Daily
Net Assets
Rupees
Percentage of Average Daily
Net Assets Regular 183,683,970 10.48 40,460,744 2.31
Savings 286,835,426 10.62 60,606,288 2.24
March 31, 2012
Total Income Total Expenses
Plan Rupees
Percentage of Average Daily
Net Assets
Rupees
Percentage of Average Daily
Net Assets Regular 110,031,030 6.97 34,065,133 2.16
Savings 261,212,652 5.70 90,738,564 1.98 13 Initial Contribution
The initial contribution of Rs. 100,000 made by the sponsor, HSBC Securities and Capital Markets (India) Private
Limited is recorded in the books of account of HSBC Mutual Fund, the Trust.

HSBC MUTUAL FUND - HSBC MIP FUND
Schedules forming part of the Balance Sheet as at March 31, 2013 and the Revenue Account for the year ended March 31, 2013
13A Movement in Unit Capital The movement in Unit Capital during the year is detailed in Schedule 4.
14 Equity Derivatives Disclosures:
(a) Options (i) There are no outstanding option contracts as at March 31, 2013. (ii) The net profit / (loss) on options transactions recognized in the revenue account is Nil. (b) Futures (i) Details of open interest on outstanding future contracts as at March 31, 2013: Nil (ii) The net profit / (loss) on futures transactions recognized in the revenue account aggregates as detailed below:
Scheme For the year ended
March 31, 2013 (Rupees)
For the year ended March 31, 2012
(Rupees) HMIPR - 1,895,647 HMIPS - 9,692,438
(iii) The notional value of futures contracts bought and sold are detailed below:
Scheme
For the year ended March 31, 2013 (Rupees)
For the year ended March 31, 2012 (Rupees)
Gross Notional Value of contracts
where futures were bought
Gross Notional Value of
contracts where futures were sold
Gross Notional Value of contracts where futures were
bought
Gross Notional Value of contracts
where futures were sold
HMIPR - - 114,423,954 116,319,601 HMIPS - - 590,714,501 600,406,939
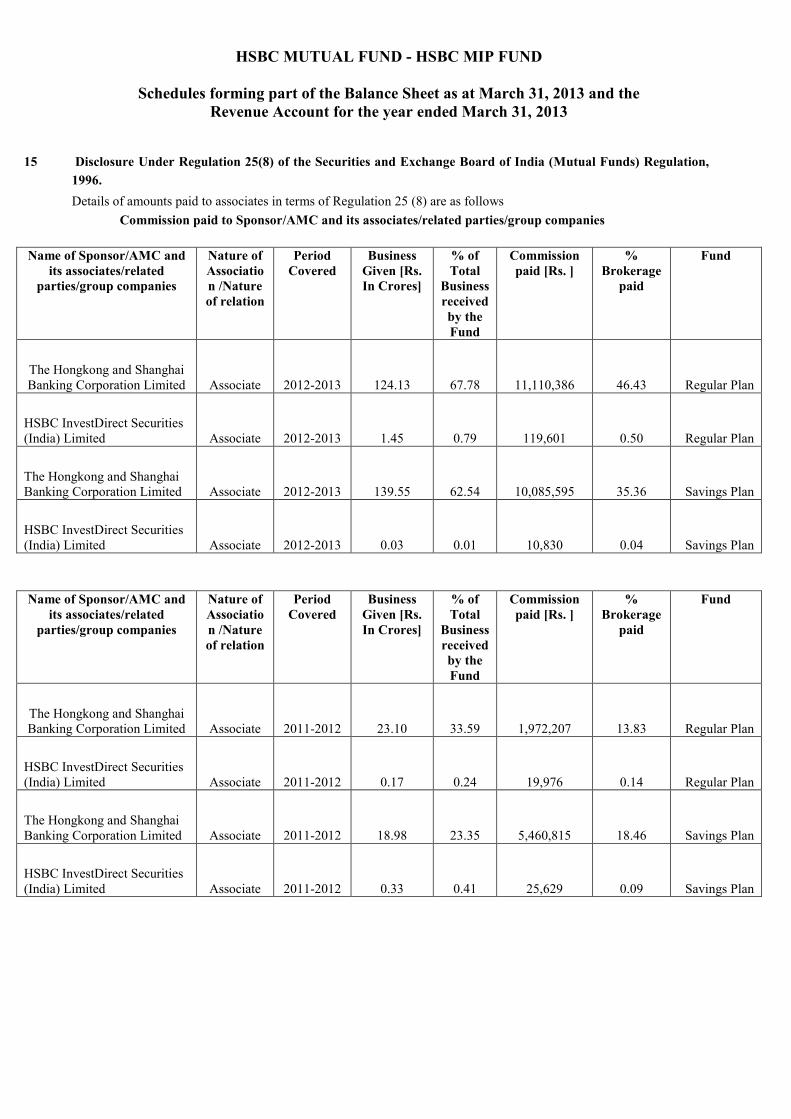
HSBC MUTUAL FUND - HSBC MIP FUND
Schedules forming part of the Balance Sheet as at March 31, 2013 and the Revenue Account for the year ended March 31, 2013
15 Disclosure Under Regulation 25(8) of the Securities and Exchange Board of India (Mutual Funds) Regulation,
1996. Details of amounts paid to associates in terms of Regulation 25 (8) are as follows
Commission paid to Sponsor/AMC and its associates/related parties/group companies
Name of Sponsor/AMC and its associates/related
parties/group companies
Nature of Association /Nature of relation
Period Covered
Business Given [Rs. In Crores]
% of Total
Business received by the Fund
Commission paid [Rs. ]
% Brokerage
paid
Fund
The Hongkong and Shanghai Banking Corporation Limited Associate 2012-2013 124.13 67.78 11,110,386 46.43 Regular Plan
HSBC InvestDirect Securities (India) Limited Associate 2012-2013 1.45 0.79 119,601 0.50 Regular Plan
The Hongkong and Shanghai Banking Corporation Limited Associate 2012-2013 139.55 62.54 10,085,595 35.36 Savings Plan
HSBC InvestDirect Securities (India) Limited Associate 2012-2013 0.03 0.01 10,830 0.04 Savings Plan Name of Sponsor/AMC and
its associates/related parties/group companies
Nature of Association /Nature of relation
Period Covered
Business Given [Rs. In Crores]
% of Total
Business received by the Fund
Commission paid [Rs. ]
% Brokerage
paid
Fund
The Hongkong and Shanghai Banking Corporation Limited Associate 2011-2012 23.10 33.59 1,972,207 13.83 Regular Plan
HSBC InvestDirect Securities (India) Limited Associate 2011-2012 0.17 0.24 19,976 0.14 Regular Plan
The Hongkong and Shanghai Banking Corporation Limited Associate 2011-2012 18.98 23.35 5,460,815 18.46 Savings Plan
HSBC InvestDirect Securities (India) Limited Associate 2011-2012 0.33 0.41 25,629 0.09 Savings Plan
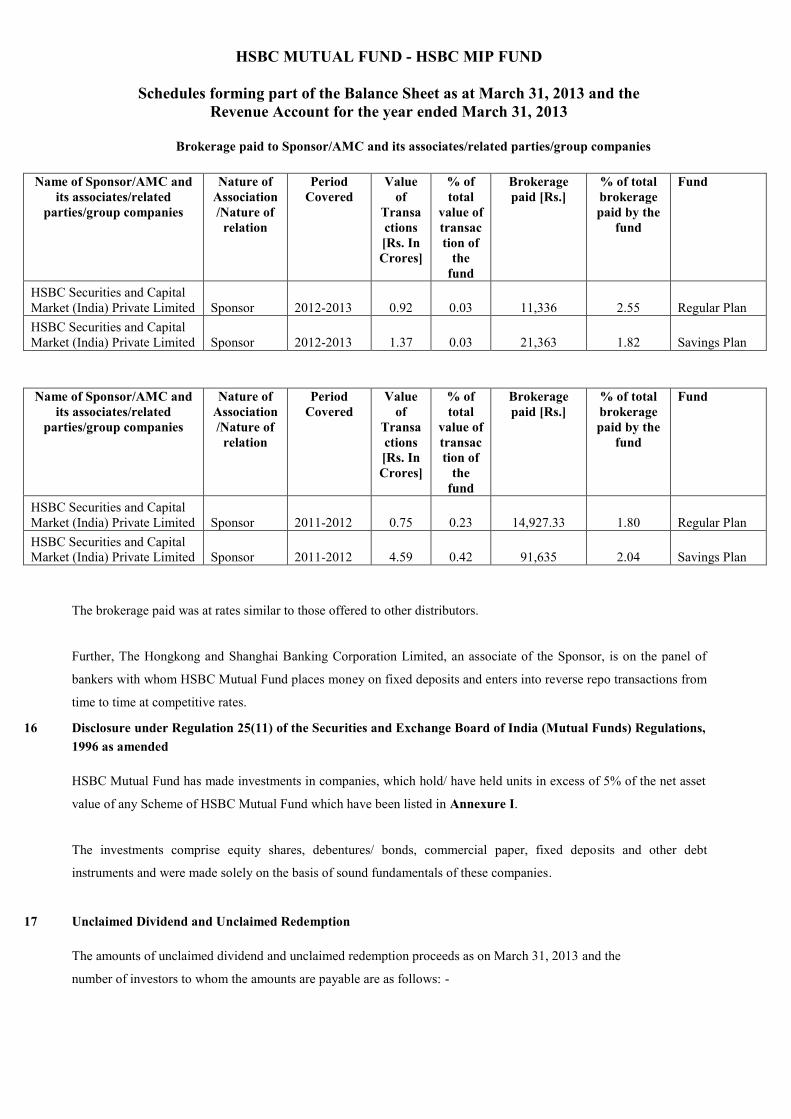
HSBC MUTUAL FUND - HSBC MIP FUND
Schedules forming part of the Balance Sheet as at March 31, 2013 and the Revenue Account for the year ended March 31, 2013
Brokerage paid to Sponsor/AMC and its associates/related parties/group companies
Name of Sponsor/AMC and its associates/related
parties/group companies
Nature of Association /Nature of
relation
Period Covered
Value of
Transactions [Rs. In Crores]
% of total
value of transaction of
the fund
Brokerage paid [Rs.]
% of total brokerage paid by the
fund
Fund
HSBC Securities and Capital Market (India) Private Limited Sponsor 2012-2013 0.92 0.03 11,336 2.55 Regular Plan HSBC Securities and Capital Market (India) Private Limited Sponsor 2012-2013 1.37 0.03 21,363 1.82 Savings Plan
Name of Sponsor/AMC and its associates/related
parties/group companies
Nature of Association /Nature of
relation
Period Covered
Value of
Transactions [Rs. In Crores]
% of total
value of transaction of
the fund
Brokerage paid [Rs.]
% of total brokerage paid by the
fund
Fund
HSBC Securities and Capital Market (India) Private Limited Sponsor 2011-2012 0.75 0.23 14,927.33 1.80 Regular Plan HSBC Securities and Capital Market (India) Private Limited Sponsor 2011-2012 4.59 0.42 91,635 2.04 Savings Plan
The brokerage paid was at rates similar to those offered to other distributors.
Further, The Hongkong and Shanghai Banking Corporation Limited, an associate of the Sponsor, is on the panel of
bankers with whom HSBC Mutual Fund places money on fixed deposits and enters into reverse repo transactions from
time to time at competitive rates.
16 Disclosure under Regulation 25(11) of the Securities and Exchange Board of India (Mutual Funds) Regulations, 1996 as amended
HSBC Mutual Fund has made investments in companies, which hold/ have held units in excess of 5% of the net asset
value of any Scheme of HSBC Mutual Fund which have been listed in Annexure I.
The investments comprise equity shares, debentures/ bonds, commercial paper, fixed deposits and other debt
instruments and were made solely on the basis of sound fundamentals of these companies.
17 Unclaimed Dividend and Unclaimed Redemption
The amounts of unclaimed dividend and unclaimed redemption proceeds as on March 31, 2013 and the
number of investors to whom the amounts are payable are as follows: -

HSBC MUTUAL FUND - HSBC MIP FUND
Schedules forming part of the Balance Sheet as at March 31, 2013 and the Revenue Account for the year ended March 31, 2013
March 31, 2013 Plan Unclaimed Dividend Unclaimed Redemption No. of
investors Amount (Rupees)
Units Market Value (Rupees) *
No. of investors
Amount (Rupees)
Units Market Value (Rupees) *
Regular 474 433,063 425.011 496,760 13 1,052,751 970.567 1,134,416
Savings 628 591,339 558.537 652,828 15 114,778 99.824 116,676
March 31, 2012
Plan Unclaimed Dividend Unclaimed Redemption No. of
investors Amount (Rupees)
Units Market Value (Rupees) *
No. of investors
Amount (Rupees)
Units Market Value (Rupees) *
Regular 354 375,653 20,758.156 351,932 4 58,427 4,489.591 76,116
Savings 484 360,660 22,358.558 379,065 6 14,755 - -
* Invested in HSBC Cash Fund – Growth Option and HSBC Cash Fund – Direct Growth Option 18 Margin Deposit with Clearing Corporation of India Limited
The Scheme has placed margin deposit with Clearing Corporation of India Limited, of which the following amounts are
towards 'Securities Segment' transactions and 'Collateralised Borrowing and Lending Obligation' transactions. These deposits
are held in the name of HSBC Mutual Fund.
March 31, 2013 Plan Total
amount of Margin
deposit with Clearing
Corporation of India Limited
Deposit made
towards Security Segment
transactions
Deposit made towards
Collateralised Borrowing
and Lending Obligation
transactions
Regular 5,819,450 5,819,450 -
Savings 6,731,742 6,731,742 -
March 31, 2012 Plan Total
amount of Margin
deposit with Clearing
Corporation of India Limited
Deposit made
towards Security Segment
transactions
Deposit made towards
Collateralised Borrowing
and Lending Obligation
transactions
Regular 27,338,847 21,077,724 6,261,123
Savings 6,599,386 3,567,143 3,032,243
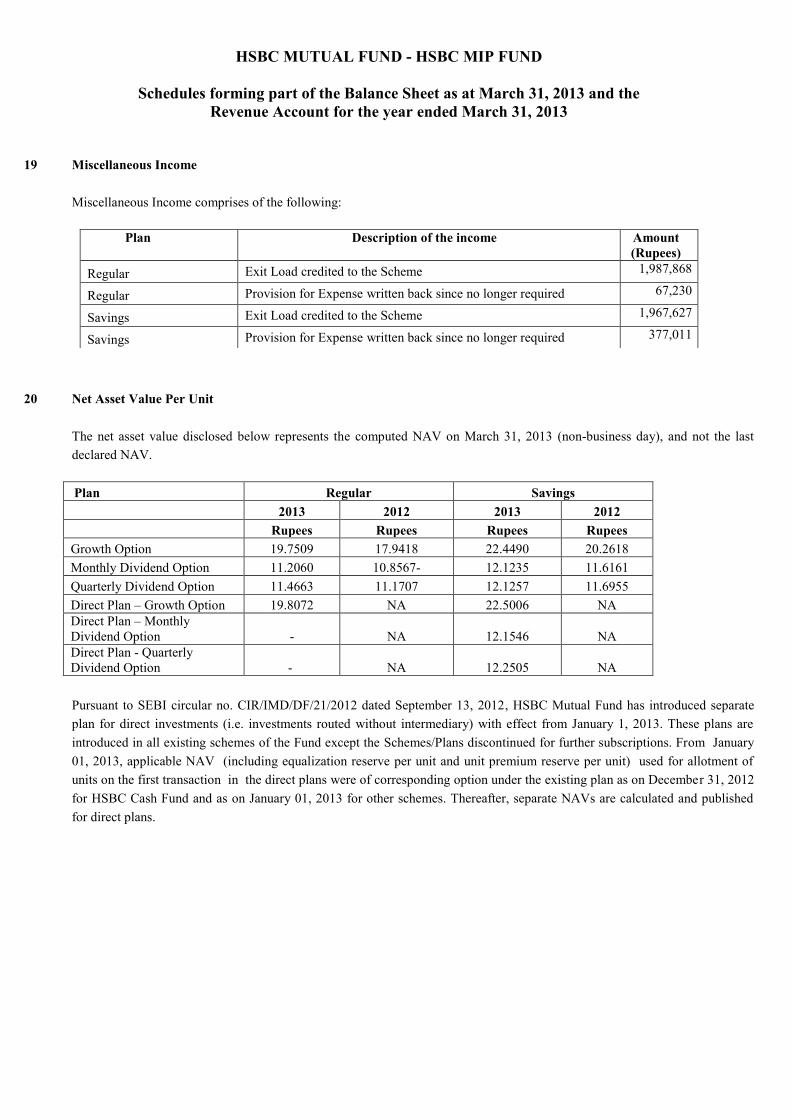
HSBC MUTUAL FUND - HSBC MIP FUND
Schedules forming part of the Balance Sheet as at March 31, 2013 and the Revenue Account for the year ended March 31, 2013
19 Miscellaneous Income
Miscellaneous Income comprises of the following:
20 Net Asset Value Per Unit
The net asset value disclosed below represents the computed NAV on March 31, 2013 (non-business day), and not the last declared NAV.
Plan Regular Savings
2013 2012 2013 2012
Rupees Rupees Rupees Rupees
Growth Option 19.7509 17.9418 22.4490 20.2618 Monthly Dividend Option 11.2060 10.8567- 12.1235 11.6161 Quarterly Dividend Option 11.4663 11.1707 12.1257 11.6955 Direct Plan – Growth Option 19.8072 NA 22.5006 NA Direct Plan – Monthly Dividend Option - NA 12.1546 NA Direct Plan - Quarterly Dividend Option - NA 12.2505 NA
Pursuant to SEBI circular no. CIR/IMD/DF/21/2012 dated September 13, 2012, HSBC Mutual Fund has introduced separate
plan for direct investments (i.e. investments routed without intermediary) with effect from January 1, 2013. These plans are introduced in all existing schemes of the Fund except the Schemes/Plans discontinued for further subscriptions. From January 01, 2013, applicable NAV (including equalization reserve per unit and unit premium reserve per unit) used for allotment of units on the first transaction in the direct plans were of corresponding option under the existing plan as on December 31, 2012 for HSBC Cash Fund and as on January 01, 2013 for other schemes. Thereafter, separate NAVs are calculated and published for direct plans.
Plan Description of the income Amount (Rupees)
Regular Exit Load credited to the Scheme 1,987,868
Regular Provision for Expense written back since no longer required 67,230
Savings Exit Load credited to the Scheme 1,967,627
Savings Provision for Expense written back since no longer required 377,011

HSBC MUTUAL FUND - HSBC MIP FUND
Schedules forming part of the Balance Sheet as at March 31, 2013 and the Revenue Account for the year ended March 31, 2013
21 Garnishee Notice from Income Tax Authorities
An Income tax demand of Rs. 32.58 crores was purported to be recovered under garnishee proceedings, by Income Tax
Authorities in respect of investments made in Pass through Certifi cates (PTC) by some of the debt schemes (including
matured schemes) of HSBC Mutual Fund (HSBC MF), for A.Y. 2009-2010. The said demand, impacting various
players in the industry, raised originally on the trusts sponsored by IL&FS Trust Company Ltd., (Appellants) was
sought to be also recovered u/s 177(3) of the Income Tax Act, from HSBC MF. HSBC MF, through its trustees fi led
Writ petitions before the Bombay High Court and obtained necessary reliefs for stay of the impugned demand till the
adjudication of the appeal by the fi rst Appellate Authority and six weeks thereafter. During last week of April 2013,
the fi rst Appellate Authority passed its order giving part relief to Appellant. Against the order granting part relief, the
Appellant has fi led an appeal before Income-tax Appellate Tribunal. The appeal is now expected to be heard on 14th
August, 2013.
Similar to AY 2009-2010, HSBC MF has received a demand notice from the Income Tax Authorities for the A.Y.
2010-2011 for Rs. 6.95 crores. HSBC MF, through its trustees, fi led a writ petition before the Bombay High Court and
obtained necessary reliefs for stay of the impugned demand till the adjudication of the appeal by the fi rst Appellate
Authority and six weeks thereafter. The appeal has been preferred by the appellant to the fi rst Appellate Authority
which is pending to be heard.
Similar to the above, the assessment for the A.Y. 2007-2008 has also been revised by the Income Tax Authorities and
demand has been made of Rs. 2.04 Crores on the trust sponsored by IL&FS Trust Company Ltd. The trust has fi led an
appeal before fi rst Appellate Authority. The HSBC MF has not received any demand notice from the Income Tax
authorities for this assessment year.

HSBC MUTUAL FUND - HSBC MIP FUND
Schedules forming part of the Balance Sheet as at March 31, 2013 and the Revenue Account for the year ended March 31, 2013
22 Prior Year’s Figures
Previous year’s figures have been regrouped/re-arranged where appropriate.
Signatures to the Schedules 1 to 8 forming part of the Balance Sheet and the Revenue Account
For PRICE WATERHOUSE Firm Registration Number: 301112E
Chartered Accountants
For Board of Trustees of HSBC Mutual Fund
For HSBC Asset Management (India) Private Limited
d/- VIVEK PRASAD Partner Membership No.104941
sd/- N. P. Gidwani Trustee
sd/- Puneet Chaddha Director and Chief Executive Officer
sd/- Dilip J. Thakkar Trustee
sd/- Kishori J. Udeshi Director
Place: Mumbai Date : July 16, 2013
sd/- Sanjay Shah Fund Manager sd/- Ruchir Parekh Fund Manager sd/- Aditya Khemani Fund Manager
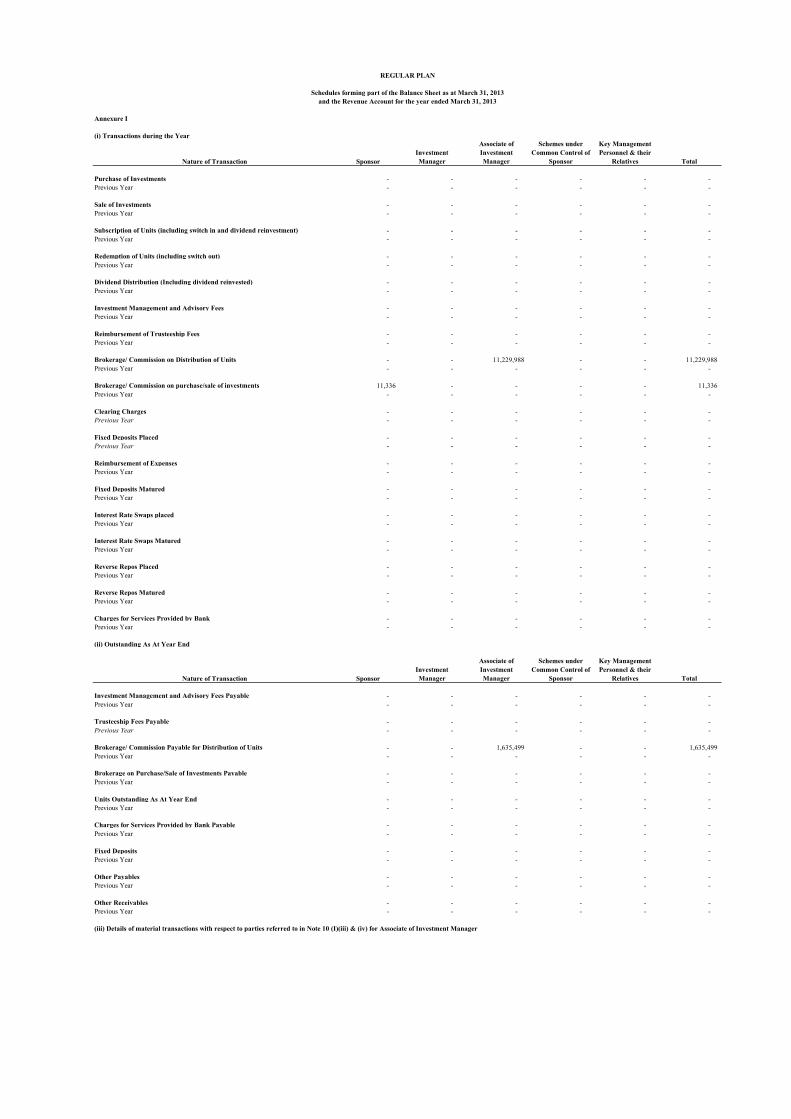
Annexure I
(i) Transactions during the Year
Nature of Transaction SponsorInvestment Manager
Associate of Investment Manager
Schemes under Common Control of
Sponsor
Key Management Personnel & their
Relatives Total
Purchase of Investments - - - - - - Previous Year - - - - - -
Sale of Investments - - - - - - Previous Year - - - - - -
Subscription of Units (including switch in and dividend reinvestment) - - - - - - Previous Year - - - - - -
Redemption of Units (including switch out) - - - - - - Previous Year - - - - - -
Dividend Distribution (Including dividend reinvested) - - - - - - Previous Year - - - - - -
Investment Management and Advisory Fees - - - - - - Previous Year - - - - - -
Reimbursement of Trusteeship Fees - - - - - - Previous Year - - - - - -
Brokerage/ Commission on Distribution of Units - - 11,229,988 - - 11,229,988 Previous Year - - - - - -
Brokerage/ Commission on purchase/sale of investments 11,336 - - - - 11,336 Previous Year - - - - - -
Clearing Charges - - - - - - Previous Year - - - - - -
Fixed Deposits Placed - - - - - - Previous Year - - - - - -
Reimbursement of Expenses - - - - - - Previous Year - - - - - -
Fixed Deposits Matured - - - - - - Previous Year - - - - - -
Interest Rate Swaps placed - - - - - - Previous Year - - - - - -
Interest Rate Swaps Matured - - - - - - Previous Year - - - - - -
Reverse Repos Placed - - - - - - Previous Year - - - - - -
Reverse Repos Matured - - - - - - Previous Year - - - - - -
Charges for Services Provided by Bank - - - - - - Previous Year - - - - - -
(ii) Outstanding As At Year End
Nature of Transaction SponsorInvestment Manager
Associate of Investment Manager
Schemes under Common Control of
Sponsor
Key Management Personnel & their
Relatives Total
Investment Management and Advisory Fees Payable - - - - - - Previous Year - - - - - -
Trusteeship Fees Payable - - - - - - Previous Year - - - - - -
Brokerage/ Commission Payable for Distribution of Units - - 1,635,499 - - 1,635,499 Previous Year - - - - - -
Brokerage on Purchase/Sale of Investments Payable - - - - - - Previous Year - - - - - -
Units Outstanding As At Year End - - - - - - Previous Year - - - - - -
Charges for Services Provided by Bank Payable - - - - - - Previous Year - - - - - -
Fixed Deposits - - - - - - Previous Year - - - - - -
Other Payables - - - - - - Previous Year - - - - - -
Other Receivables - - - - - - Previous Year - - - - - -
(iii) Details of material transactions with respect to parties referred to in Note 10 (I)(iii) & (iv) for Associate of Investment Manager
REGULAR PLAN
Schedules forming part of the Balance Sheet as at March 31, 2013and the Revenue Account for the year ended March 31, 2013
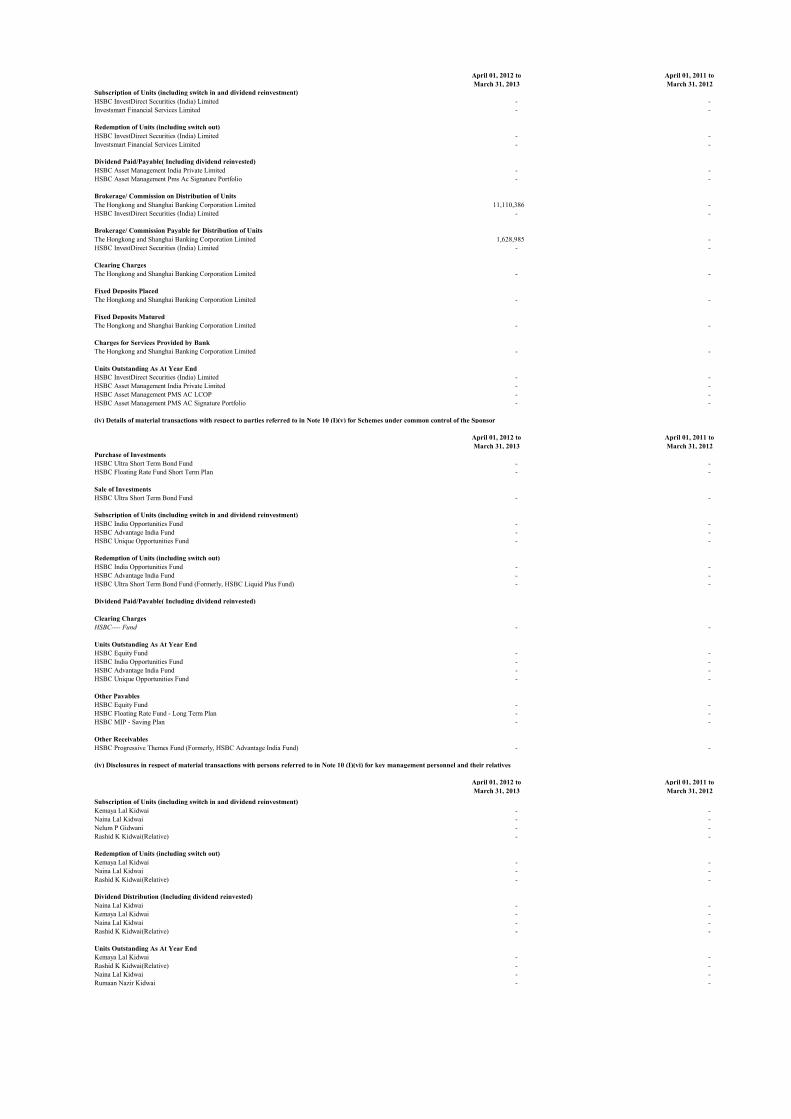
April 01, 2012 to April 01, 2011 toMarch 31, 2013 March 31, 2012
Subscription of Units (including switch in and dividend reinvestment)HSBC InvestDirect Securities (India) Limited - - Investsmart Financial Services Limited - -
Redemption of Units (including switch out)HSBC InvestDirect Securities (India) Limited - - Investsmart Financial Services Limited - -
Dividend Paid/Payable( Including dividend reinvested)HSBC Asset Management India Private Limited - - HSBC Asset Management Pms Ac Signature Portfolio - -
Brokerage/ Commission on Distribution of UnitsThe Hongkong and Shanghai Banking Corporation Limited 11,110,386 - HSBC InvestDirect Securities (India) Limited - -
Brokerage/ Commission Payable for Distribution of UnitsThe Hongkong and Shanghai Banking Corporation Limited 1,628,985 - HSBC InvestDirect Securities (India) Limited - -
Clearing ChargesThe Hongkong and Shanghai Banking Corporation Limited - -
Fixed Deposits PlacedThe Hongkong and Shanghai Banking Corporation Limited - -
Fixed Deposits MaturedThe Hongkong and Shanghai Banking Corporation Limited - -
Charges for Services Provided by BankThe Hongkong and Shanghai Banking Corporation Limited - -
Units Outstanding As At Year EndHSBC InvestDirect Securities (India) Limited - - HSBC Asset Management India Private Limited - - HSBC Asset Management PMS AC LCOP - - HSBC Asset Management PMS AC Signature Portfolio - -
(iv) Details of material transactions with respect to parties referred to in Note 10 (I)(v) for Schemes under common control of the Sponsor
April 01, 2012 to April 01, 2011 toMarch 31, 2013 March 31, 2012
Purchase of InvestmentsHSBC Ultra Short Term Bond Fund - - HSBC Floating Rate Fund Short Term Plan - -
Sale of InvestmentsHSBC Ultra Short Term Bond Fund - -
Subscription of Units (including switch in and dividend reinvestment)HSBC India Opportunities Fund - - HSBC Advantage India Fund - - HSBC Unique Opportunities Fund - -
Redemption of Units (including switch out)HSBC India Opportunities Fund - - HSBC Advantage India Fund - - HSBC Ultra Short Term Bond Fund (Formerly, HSBC Liquid Plus Fund) - -
Dividend Paid/Payable( Including dividend reinvested)
Clearing ChargesHSBC---- Fund - -
Units Outstanding As At Year EndHSBC Equity Fund - - HSBC India Opportunities Fund - - HSBC Advantage India Fund - - HSBC Unique Opportunities Fund - -
Other PayablesHSBC Equity Fund - - HSBC Floating Rate Fund - Long Term Plan - - HSBC MIP - Saving Plan - -
Other ReceivablesHSBC Progressive Themes Fund (Formerly, HSBC Advantage India Fund) - -
(iv) Disclosures in respect of material transactions with persons referred to in Note 10 (I)(vi) for key management personnel and their relatives
April 01, 2012 to April 01, 2011 toMarch 31, 2013 March 31, 2012
Subscription of Units (including switch in and dividend reinvestment)Kemaya Lal Kidwai - - Naina Lal Kidwai - - Nelum P Gidwani - - Rashid K Kidwai(Relative) - -
Redemption of Units (including switch out)Kemaya Lal Kidwai - - Naina Lal Kidwai - - Rashid K Kidwai(Relative) - -
Dividend Distribution (Including dividend reinvested)Naina Lal Kidwai - - Kemaya Lal Kidwai - - Naina Lal Kidwai - - Rashid K Kidwai(Relative) - -
Units Outstanding As At Year EndKemaya Lal Kidwai - - Rashid K Kidwai(Relative) - - Naina Lal Kidwai - - Rumaan Nazir Kidwai - -

Annexure I
(i) Transactions during the Year
Nature of Transaction SponsorInvestment Manager
Associate of Investment Manager
Schemes under Common Control of
Sponsor
Key Management Personnel & their
Relatives Total
Purchase of Investments - - - - - - Previous Year - - - - - -
Sale of Investments - - - - - - Previous Year - - - - - -
Subscription of Units (including switch in and dividend reinvestment) - - - - - - Previous Year - - - - - -
Redemption of Units (including switch out) - - - - - - Previous Year - - - - - -
Dividend Distribution (Including dividend reinvested) - - - - - - Previous Year - - - - - -
Investment Management and Advisory Fees - - - - - - Previous Year - - - - - -
Reimbursement of Trusteeship Fees - - - - - - Previous Year - - - - - -
Brokerage/ Commission on Distribution of Units - - 10,096,424 - - 10,096,424 Previous Year - - - - - -
Brokerage/ Commission on purchase/sale of investments 21,363 - - - - 21,363 Previous Year - - - - - -
Clearing Charges - - - - - - Previous Year - - - - - -
Fixed Deposits Placed - - - - - - Previous Year - - - - - -
Reimbursement of Expenses - - - - - - Previous Year - - - - - -
Fixed Deposits Matured - - - - - - Previous Year - - - - - -
Interest Rate Swaps placed - - - - - - Previous Year - - - - - -
Interest Rate Swaps Matured - - - - - - Previous Year - - - - - -
Reverse Repos Placed - - - - - - Previous Year - - - - - -
Reverse Repos Matured - - - - - - Previous Year - - - - - -
Charges for Services Provided by Bank - - - - - - Previous Year - - - - - -
(ii) Outstanding As At Year End
Nature of Transaction Sponsor Investment Manager
Associate of Investment Manager
Schemes under Common Control of
Sponsor
Key Management Personnel & their
Relatives Total
Investment Management and Advisory Fees Payable - - - - - - Previous Year - - - - - -
Trusteeship Fees Payable - - - - - - Previous Year - - - - - -
Brokerage/ Commission Payable for Distribution of Units - - 2,081,811 - - 2,081,811 Previous Year - - - - - -
Brokerage on Purchase/Sale of Investments Payable - - - - - - Previous Year - - - - - -
Units Outstanding As At Year End - - - - 4,093,394 4,093,394 Previous Year - - - - 4,093,394 4,093,394
Charges for Services Provided by Bank Payable - - - - - - Previous Year - - - - - -
Fixed Deposits - - - - - - Previous Year - - - - - -
Other Payables - - - - - - Previous Year - - - 1,500 - 1,500
Other Receivables - - - - - - Previous Year - 2,494,936 - - - 2,494,936
(iii) Details of material transactions with respect to parties referred to in Note 10 (I)(iii) & (iv) for Associate of Investment Manager
SAVINGS PLAN
Schedules forming part of the Balance Sheet as at March 31, 2013and the Revenue Account for the year ended March 31, 2013
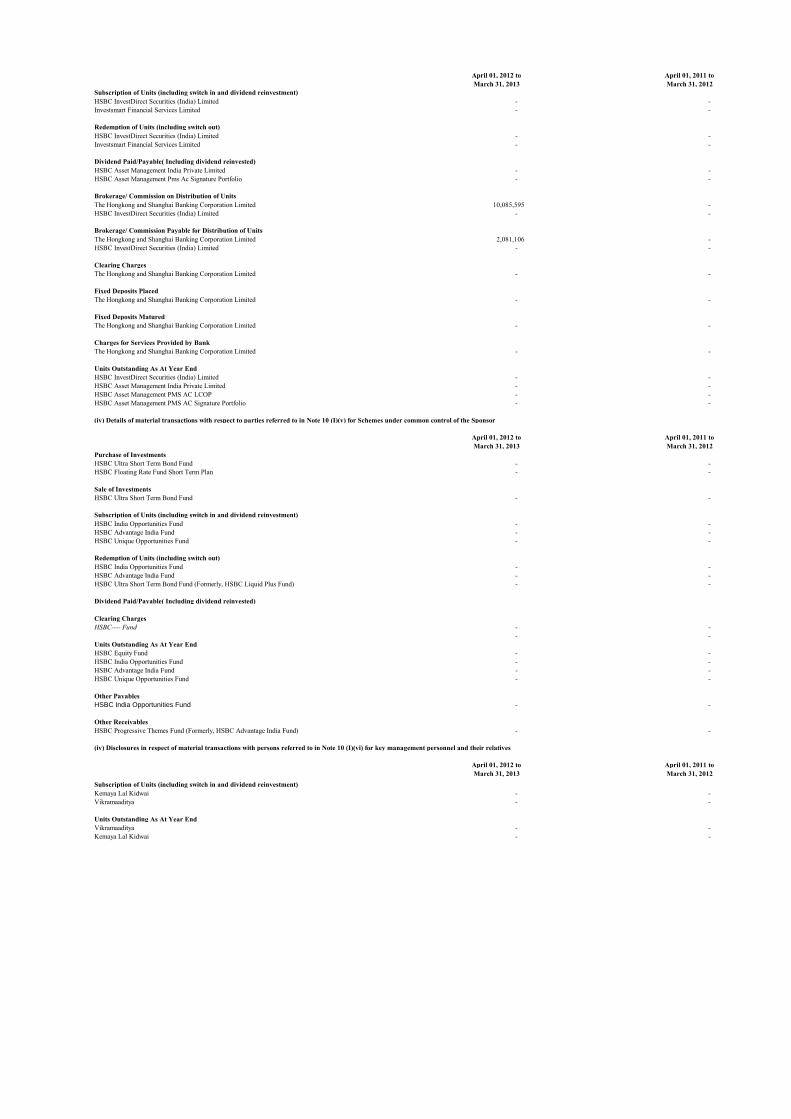
April 01, 2012 to April 01, 2011 toMarch 31, 2013 March 31, 2012
Subscription of Units (including switch in and dividend reinvestment)HSBC InvestDirect Securities (India) Limited - - Investsmart Financial Services Limited - -
Redemption of Units (including switch out)HSBC InvestDirect Securities (India) Limited - - Investsmart Financial Services Limited - -
Dividend Paid/Payable( Including dividend reinvested)HSBC Asset Management India Private Limited - - HSBC Asset Management Pms Ac Signature Portfolio - -
Brokerage/ Commission on Distribution of UnitsThe Hongkong and Shanghai Banking Corporation Limited 10,085,595 - HSBC InvestDirect Securities (India) Limited - -
Brokerage/ Commission Payable for Distribution of UnitsThe Hongkong and Shanghai Banking Corporation Limited 2,081,106 - HSBC InvestDirect Securities (India) Limited - -
Clearing ChargesThe Hongkong and Shanghai Banking Corporation Limited - -
Fixed Deposits PlacedThe Hongkong and Shanghai Banking Corporation Limited - -
Fixed Deposits MaturedThe Hongkong and Shanghai Banking Corporation Limited - -
Charges for Services Provided by BankThe Hongkong and Shanghai Banking Corporation Limited - -
Units Outstanding As At Year EndHSBC InvestDirect Securities (India) Limited - - HSBC Asset Management India Private Limited - - HSBC Asset Management PMS AC LCOP - - HSBC Asset Management PMS AC Signature Portfolio - -
(iv) Details of material transactions with respect to parties referred to in Note 10 (I)(v) for Schemes under common control of the Sponsor
April 01, 2012 to April 01, 2011 toMarch 31, 2013 March 31, 2012
Purchase of InvestmentsHSBC Ultra Short Term Bond Fund - - HSBC Floating Rate Fund Short Term Plan - -
Sale of InvestmentsHSBC Ultra Short Term Bond Fund - -
Subscription of Units (including switch in and dividend reinvestment)HSBC India Opportunities Fund - - HSBC Advantage India Fund - - HSBC Unique Opportunities Fund - -
Redemption of Units (including switch out)HSBC India Opportunities Fund - - HSBC Advantage India Fund - - HSBC Ultra Short Term Bond Fund (Formerly, HSBC Liquid Plus Fund) - -
Dividend Paid/Payable( Including dividend reinvested)
Clearing ChargesHSBC---- Fund - -
- - Units Outstanding As At Year EndHSBC Equity Fund - - HSBC India Opportunities Fund - - HSBC Advantage India Fund - - HSBC Unique Opportunities Fund - -
Other PayablesHSBC India Opportunities Fund - -
Other ReceivablesHSBC Progressive Themes Fund (Formerly, HSBC Advantage India Fund) - -
(iv) Disclosures in respect of material transactions with persons referred to in Note 10 (I)(vi) for key management personnel and their relatives
April 01, 2012 to April 01, 2011 toMarch 31, 2013 March 31, 2012
Subscription of Units (including switch in and dividend reinvestment)Kemaya Lal Kidwai - - Vikramaaditya - -
Units Outstanding As At Year EndVikramaaditya - - Kemaya Lal Kidwai - -
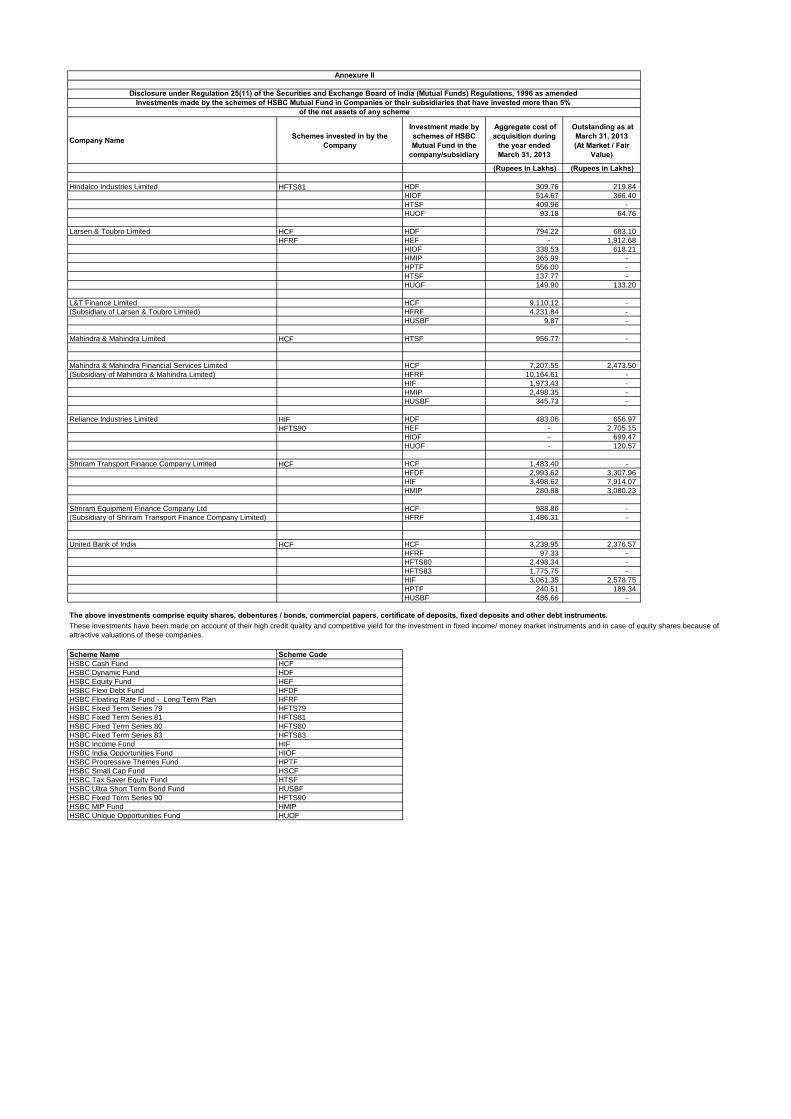
Company Name Schemes invested in by the Company
Investment made by schemes of HSBC Mutual Fund in the
company/subsidiary
Aggregate cost of acquisition during
the year ended March 31, 2013
Outstanding as at March 31, 2013(At Market / Fair
Value)
(Rupees in Lakhs) (Rupees in Lakhs)
Hindalco Industries Limited HFTS81 HDF 309.76 219.84
HIOF 514.67 366.40
HTSF 409.96 -
HUOF 93.18 64.76
Larsen & Toubro Limited HCF HDF 794.22 683.10
HFRF HEF - 1,912.68
HIOF 338.53 618.21
HMIP 365.99 -
HPTF 556.00 -
HTSF 137.77 -
HUOF 149.90 133.20
L&T Finance Limited HCF 9,110.12 -
(Subsidiary of Larsen & Toubro Limited) HFRF 4,231.84 -
HUSBF 9.87 -
Mahindra & Mahindra Limited HCF HTSF 956.77 -
Mahindra & Mahindra Financial Services Limited HCF 7,207.55 2,473.50
(Subsidiary of Mahindra & Mahindra Limited) HFRF 10,164.61 -
HIF 1,973.43 -
HMIP 2,498.35 -
HUSBF 345.73 -
Reliance Industries Limited HIF HDF 483.06 656.97
HFTS90 HEF - 2,705.15
HIOF - 699.47
HUOF - 120.57
Shriram Transport Finance Company Limited HCF HCF 1,483.40 -
HFDF 2,993.62 3,307.96
HIF 3,498.62 7,914.07
HMIP 280.88 3,080.23
Shriram Equipment Finance Company Ltd HCF 988.86 -
(Subsidiary of Shriram Transport Finance Company Limited) HFRF 1,486.31 -
United Bank of India HCF HCF 3,239.95 2,376.57
HFRF 97.33 -
HFTS80 2,498.34 -
HFTS83 1,775.75 -
HIF 3,061.35 2,578.75
HPTF 240.51 189.34
HUSBF 486.66 -
Scheme Name Scheme CodeHSBC Cash Fund HCF
HSBC Dynamic Fund HDF
HSBC Equity Fund HEF
HSBC Flexi Debt Fund HFDF
HSBC Floating Rate Fund - Long Term Plan HFRF
HSBC Fixed Term Series 79 HFTS79
HSBC Fixed Term Series 81 HFTS81
HSBC Fixed Term Series 80 HFTS80
HSBC Fixed Term Series 83 HFTS83
HSBC Income Fund HIF
HSBC India Opportunities Fund HIOF
HSBC Progressive Themes Fund HPTF
HSBC Small Cap Fund HSCF
HSBC Tax Saver Equity Fund HTSF
HSBC Ultra Short Term Bond Fund HUSBF
HSBC Fixed Term Series 90 HFTS90
HSBC MIP Fund HMIP
HSBC Unique Opportunities Fund HUOF
Annexure II
Disclosure under Regulation 25(11) of the Securities and Exchange Board of India (Mutual Funds) Regulations, 1996 as amended Investments made by the schemes of HSBC Mutual Fund in Companies or their subsidiaries that have invested more than 5%
of the net assets of any scheme
The above investments comprise equity shares, debentures / bonds, commercial papers, certificate of deposits, fixed deposits and other debt instruments. These investments have been made on account of their high credit quality and competitive yield for the investment in fixed income/ money market instruments and in case of equity shares because of
attractive valuations of these companies.

H32872 H32873
April 1, 2012 April 1, 2011 April 1, 2010 April 1, 2012 April 1, 2011 April 1, 2010to March 31, 2013 to March 31, 2012 to March 31, 2011 to March 31, 2013 to March 31, 2012 to March 31, 2011
Rupees Rupees Rupees Rupees Rupees Rupees
(a) Net asset value per unit at the end of the year (Note 2.5)Growth 19.7509 17.9418 16.9989 22.4490 20.2618 19.2049 Monthly Dividend 11.2060 10.8567 10.7617 12.1235 11.6161 11.3836 Quarterly Dividend 11.4663 11.1707 11.2192 12.1257 11.6955 11.7079 Direct Plan - Growth Option 19.8072 NA NA 22.5006 NA NADirect Plan - Monthly Dividend Option - NA NA 12.1546 NA NADirect Plan - Quarterly Dividend Option - NA NA 12.2505 NA NA
(b) Gross Income
(i) income other than profit on sale of investment. 0.9536 1.2554 0.8146 1.1016 0.6572 0.6556
(ii) income from profit on inter scheme sales/transfer of investment. - - - - - -
(iii) income (net) from profit on sale of investments to third party 0.1873 - 0.1686 0.5040 - 0.1026
(iv) transfer to revenue account from past year’s reserve 1.5642 3.1120 0.4180 2.4279 6.6183 -
Gross income and gains 2.7051 4.3674 1.4012 4.0335 7.2755 0.7582
(c) Aggregate of expenses, writeoff, amortisation and charges 0.2773 0.5255 0.2781 0.3459 0.3778 0.2214
(d) Net income 2.4278 3.8419 1.1231 3.6876 6.8977 0.5368
(e) Net unrealised appreciation / (depreciation) in value 0.0322 0.0244 (0.0484) 0.0313 0.0577 (0.0741)of investments
(f) Redemption price
-HighestGrowth Option 19.8575 17.9638 17.1649 22.8713 20.3203 19.7189 Monthly Dividend Option 11.4263 10.9652 11.6488 12.5338 11.7451 12.3278 Quarterly Dividend Option 11.7174 11.3856 11.8078 12.5566 11.9109 12.4651 Direct Plan - Growth Option - NA NA - NA NADirect Plan - Monthly Dividend Option - NA NA - NA NADirect Plan - Quarterly Dividend Option - NA NA - NA NA
-LowestGrowth Option 17.9188 16.9608 16.3363 19.9892 18.9851 18.2706 Monthly Dividend Option 10.7613 10.5392 10.5779 11.3915 11.0136 11.0752 Quarterly Dividend Option 11.0965 10.9202 11.0584 11.5232 11.1299 11.4551 Direct Plan - Growth Option - NA NA - NA NADirect Plan - Monthly Dividend Option - NA NA - NA NADirect Plan - Quarterly Dividend Option - NA NA - NA NA
(g) Purchase price
-HighestGrowth Option 19.8332 17.9398 17.1649 22.8713 20.3203 19.7189 Monthly Dividend Option 11.4279 10.9652 11.6488 12.5338 11.7236 12.3278 Quarterly Dividend Option 11.7146 11.3704 11.8078 12.5370 11.9109 12.4651 Direct Plan - Growth Option 19.6523 NA NA 22.8388 NA NADirect Plan - Monthly Dividend Option - NA NA 12.5391 NA NADirect Plan - Quarterly Dividend Option - NA NA 12.5148 NA NA
-LowestGrowth Option 17.9188 16.9627 16.3363 20.0202 18.9851 18.2706 Monthly Dividend Option 10.7503 10.5392 10.5908 11.3947 11.0136 11.0752 Quarterly Dividend Option 11.0965 10.9385 11.0713 11.5232 11.1299 11.4551 Direct Plan - Growth Option 19.6216 NA NA 22.4268 NA NADirect Plan - Monthly Dividend Option - NA NA 12.1502 NA NADirect Plan - Quarterly Dividend Option - NA NA 12.2914 NA NA
(h) Price earnings ratio NA NA NA NA NA NA
(i) Ratio of expenses to average daily net
Regular 2.31% 2.16% 2.10% 2.24% 2.01% 1.96%Direct 1.31% NA NA 1.35% NA NA
(j) Ratio of gross income (including net loss on sale of 6.80% 2.44% 7.07% 10.62% 5.78% 6.06%investments and net unrealised depreciation in value of investments) to average daily net assets by percentage @
* The above per unit calculations are based on the number of units in issue at the end of the financial year.
@ The ratio of expenses and gross income to average daily net assets by percentage has been annualised for the period December 10, 2003 to March 31, 2003. 170,729,327.29 261,340,469.4100
667,125,754.69 1,315,680,492.63
HSBC MUTUAL FUND - HSBC MIP FUND
HISTORICAL PER UNIT STATISTICS*
Regular Plan Savings Plan
assets by percentage @

► INDEX HSBC Fixed Term Series 86 HSBC Fixed Term Series 89 HSBC Fixed Term Series 90
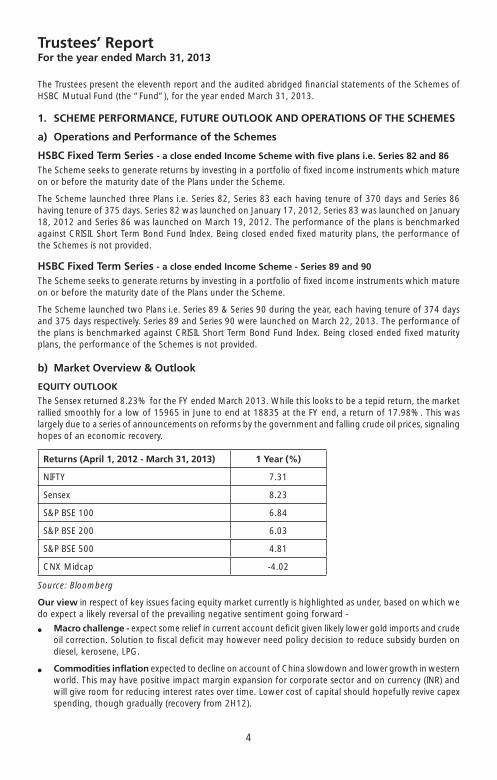
4
HSBC FTP Series
Trustees’ ReportFor the year ended March 31, 2013
The Trustees present the eleventh report and the audited abridged fi nancial statements of the Schemes of HSBC Mutual Fund (the “Fund”), for the year ended March 31, 2013.
1. SCHEME PERFORMANCE, FUTURE OUTLOOK AND OPERATIONS OF THE SCHEMES
a) Operations and Performance of the Schemes
HSBC Fixed Term Series - a close ended Income Scheme with fi ve plans i.e. Series 82 and 86
The Scheme seeks to generate returns by investing in a portfolio of fi xed income instruments which mature on or before the maturity date of the Plans under the Scheme.
The Scheme launched three Plans i.e. Series 82, Series 83 each having tenure of 370 days and Series 86 having tenure of 375 days. Series 82 was launched on January 17, 2012, Series 83 was launched on January 18, 2012 and Series 86 was launched on March 19, 2012. The performance of the plans is benchmarked against CRISIL Short Term Bond Fund Index. Being closed ended fi xed maturity plans, the performance of the Schemes is not provided.
HSBC Fixed Term Series - a close ended Income Scheme - Series 89 and 90
The Scheme seeks to generate returns by investing in a portfolio of fi xed income instruments which mature on or before the maturity date of the Plans under the Scheme.
The Scheme launched two Plans i.e. Series 89 & Series 90 during the year, each having tenure of 374 days and 375 days respectively. Series 89 and Series 90 were launched on March 22, 2013. The performance of the plans is benchmarked against CRISIL Short Term Bond Fund Index. Being closed ended fi xed maturity plans, the performance of the Schemes is not provided.
b) Market Overview & Outlook
EQUITY OUTLOOK
The Sensex returned 8.23% for the FY ended March 2013. While this looks to be a tepid return, the market rallied smoothly for a low of 15965 in June to end at 18835 at the FY end, a return of 17.98%. This was largely due to a series of announcements on reforms by the government and falling crude oil prices, signaling hopes of an economic recovery.
Returns (April 1, 2012 - March 31, 2013) 1 Year (%)
NIFTY 7.31
Sensex 8.23
S&P BSE 100 6.84
S&P BSE 200 6.03
S&P BSE 500 4.81
CNX Midcap -4.02
Source: Bloomberg
Our view in respect of key issues facing equity market currently is highlighted as under, based on which we do expect a likely reversal of the prevailing negative sentiment going forward -
� Macro challenge - expect some relief in current account defi cit given likely lower gold imports and crude oil correction. Solution to fi scal defi cit may however need policy decision to reduce subsidy burden on diesel, kerosene, LPG.
� Commodities infl ation expected to decline on account of China slowdown and lower growth in western world. This may have positive impact margin expansion for corporate sector and on currency (INR) and will give room for reducing interest rates over time. Lower cost of capital should hopefully revive capex spending, though gradually (recovery from 2H12).

5
HSBC FTP Series
Trustees’ ReportFor the year ended March 31, 2013 (Contd...)
� Lower interest rates directionally would be the single most important variable for equity markets to rally. This will be driven by lower commodity infl ation and focus back on reviving growth through monetary policy (recent disappointing GDP/IIP numbers support this view).
� Valuations (for large Sensex companies) are attractive at close to 13x forward earnings and in the lower range of historic multiples. A large number of mid-caps available at a signifi cant discount to large cap peer.
� Structural model for India equity investment remains intact for long term returns. These include favourable demography, high savings rate, rising incomes, growing consumption demand growth, existing low penetration, etc.
DEBT OUTLOOK
Fixed Income market in FY 2013 moved towards lower yields on back of 100 bps rate cut and CRR cuts. RBI front loaded the rate cut in April and then followed it up in January 2013 and March 2013. Towards the second half rates stabilized largely as the core infl ation remained within comfort zone.
In the second half of the year expectation of rate cut and series of open market operations led to rally in rates. Government borrowing was lower than budgeted and the spending was also controlled in second half of the year. Towards the end of the year short end rates tightened substantially due to low deposit growth in banking system.
Corporate yield curve remained inverted with short end rates higher than long end rates for the large part of the year due to liquidity tightness.
Expectation is to see continuation of some easing of the rates stance from RBI in FY 14. However, there is a need to focus on key variables in the economy to judge future directions. These are:
� Liquidity: Liquidity will drive short end rates and eventually drive decisions on open market operations as well as CRR cuts.
� Infl ation: Infl ation numbers will determine future course of action for RBI and remains a critical variable for policy. We expect infl ation to ease in fi rst half of FY 14.
� Growth: GDP growth numbers as well as industrial activity will also determine the decision on policy. Weak GDP numbers may continue for couple of quarters.
� Fiscal defi cit: Fiscal defi cit and government spending will determine the government borrowing and crowding out in interest rate curve.
� Current account defi cit / BoP situation: CAD determines how the pressure on currency works and effective management of forex reserves
� Currency levels: Level of INR will determine how the central banker reacts to the situation on the global crisis etc.
2. BRIEF BACKGROUND OF SPONSORS, BOARD OF TRUSTEES AND ASSET MANAGEMENT COMPANY
a) Sponsor HSBC Mutual Fund is sponsored by HSBC Securities and Capital Markets (India) Private Limited (HSCI).
The Sponsor is the Settler of the Mutual Fund Trust. The Sponsor has entrusted a sum of Rs.1,00,000 (Rupees One Lakh only) to the Trustee as the initial contribution towards the corpus of the Mutual Fund.
HSCI offers integrated investment banking services, securities and corporate fi nance & advisory. HSCI is a member of The Bombay Stock Exchange Limited and National Stock Exchange (capital and derivative market segments). HSCI holds 100% of the paid up equity share capital of HSBC Asset Management (India) Private Limited.

6
HSBC FTP Series
Trustees’ ReportFor the year ended March 31, 2013 (Contd...)
b) HSBC Mutual Fund HSBC Mutual Fund (“the Mutual Fund” or “the Fund”) has been constituted as a Trust in accordance with
the provisions of the Indian Trusts Act, 1882 (2 of 1882) vide a Trust Deed dated February 7, 2002 with HSBC Securities and Capital Markets (India) Private Limited, as the Sponsor and the Board of Individual Trustees. The Trustee has entered into an Investment Management Agreement dated February 7, 2002 with HSBC Asset Management (India) Private Limited (AMC) to function as the Investment Manager for all the Schemes of the Fund. The Fund was registered with SEBI vide registration number MF/046/02/5 dated May 27, 2002.
The Trust has been formed for the purpose of pooling of capital from the public for collective investment in securities/any other property for the purpose of providing facilities for participation by persons as benefi ciaries in such properties / investments and in the profi ts / income arising therefrom.
c) Board of Trustees (the Trustees) The Board of Trustees is the exclusive owner of the Trust Fund and holds the same in trust for the benefi t
of the unit holders. The Trustees have been discharging their duties and carrying out the responsibilities as provided in the SEBI (Mutual Funds) Regulations, 1996 and the Trust Deed. The Trustees seek to ensure that the Fund and the Schemes fl oated there under are managed by the AMC in accordance with the Trust Deed, the said Regulations, directions and guidelines issued by the SEBI, the Stock Exchanges, the Association of Mutual Funds in India and other regulatory agencies.
d) Asset Management Company (the AMC) HSBC Asset Management (India) Private Limited (the Investment Manager or the AMC) is a private limited
company incorporated under the Companies Act, 1956 on December 12, 2001 having its Registered Offi ce at 16, V. N. Road, Fort, Mumbai 400 001. HSBC Asset Management (India) Private Limited has been appointed as the Asset Management Company of the HSBC Mutual Fund by the Trustee vide Investment Management Agreement (IMA) dated February 7, 2002 and executed between the Trustees and the AMC. SEBI approved the AMC to act as the Investment Manager of the Fund vide its letter No. MFD/BC/163/2002 dated May 27, 2002. The paid-up equity share capital of the AMC is Rs. 54.2 crores. HSBC Securities and Capital Markets (India) Private Limited holds 100% of the paid up equity share capital of the AMC.
3. INVESTMENT OBJECTIVE OF THE SCHEMESThe investment objective of the respective Schemes has been provided above under the heading “Scheme Performance, Future Outlook and Operation of the Scheme” (Refer Section 1).
4. SIGNIFICANT ACCOUNTING POLICIESThe accounting policies are in accordance with Securities Exchange Board of India (Mutual Funds) Regulations 1996.
5. UNCLAIMED DIVIDENDS & REDEMPTIONSNil.
6. INVESTOR SERVICESThe number of offi cial points of acceptance of transactions is 197 locations. In addition to the offi ces of the Registrar & Transfer agents, the AMC has Investor Service Centres in 4 locations at its own offi ces - namely Mumbai, New Delhi, Kolkata and Chennai. With a view to enhance customer convenience, the AMC has extended the facility of priority based servicing to key distributors through the enhancement of the Interactive Voice Reponses. Call Centre number has now been converted to a single Toll Free number which can be dialed from anywhere in India. The call Centre service is being managed by the Registrar and Transfer Agents. The AMC continues to retain the outsourced back offi ce services with HOPE.
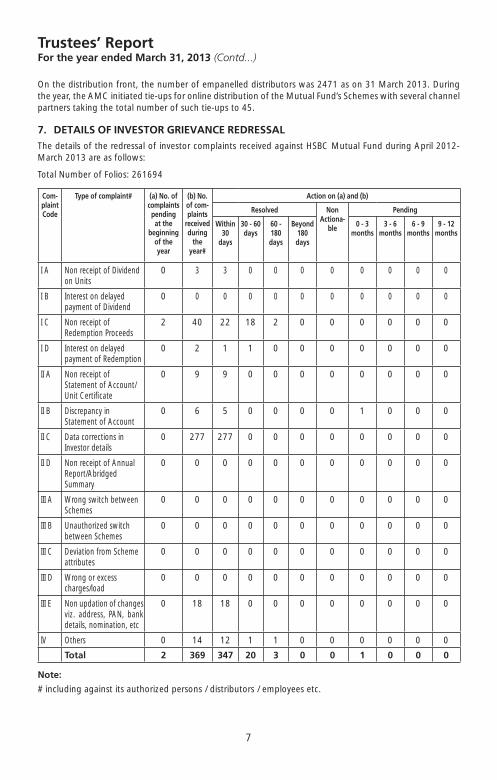
7
HSBC FTP Series
Trustees’ ReportFor the year ended March 31, 2013 (Contd...)
On the distribution front, the number of empanelled distributors was 2471 as on 31 March 2013. During the year, the AMC initiated tie-ups for online distribution of the Mutual Fund’s Schemes with several channel partners taking the total number of such tie-ups to 45.
7. DETAILS OF INVESTOR GRIEVANCE REDRESSALThe details of the redressal of investor complaints received against HSBC Mutual Fund during April 2012- March 2013 are as follows:
Total Number of Folios: 261694
Com-plaintCode
Type of complaint#
(a) No. ofcomplaintspendingat the
beginningof theyear
(b) No. of com-plaints
receivedduring
theyear#
Action on (a) and (b)
Resolved Non Actiona-
ble
Pending
Within 30
days
30 - 60 days
60 - 180 days
Beyond 180 days
0 - 3 months
3 - 6 months
6 - 9 months
9 - 12 months
I A Non receipt of Dividend on Units
0 3 3 0 0 0 0 0 0 0 0
I B Interest on delayed payment of Dividend
0 0 0 0 0 0 0 0 0 0 0
I C Non receipt of Redemption Proceeds
2 40 22 18 2 0 0 0 0 0 0
I D Interest on delayed payment of Redemption
0 2 1 1 0 0 0 0 0 0 0
II A Non receipt of Statement of Account/Unit Certifi cate
0 9 9 0 0 0 0 0 0 0 0
II B Discrepancy in Statement of Account
0 6 5 0 0 0 0 1 0 0 0
II C Data corrections in Investor details
0 277 277 0 0 0 0 0 0 0 0
II D Non receipt of Annual Report/Abridged Summary
0 0 0 0 0 0 0 0 0 0 0
III A Wrong switch between Schemes
0 0 0 0 0 0 0 0 0 0 0
III B Unauthorized switch between Schemes
0 0 0 0 0 0 0 0 0 0 0
III C Deviation from Scheme attributes
0 0 0 0 0 0 0 0 0 0 0
III D Wrong or excess charges/load
0 0 0 0 0 0 0 0 0 0 0
III E Non updation of changes viz. address, PAN, bank details, nomination, etc
0 18 18 0 0 0 0 0 0 0 0
IV Others 0 14 12 1 1 0 0 0 0 0 0
Total 2 369 347 20 3 0 0 1 0 0 0
Note:
# including against its authorized persons / distributors / employees etc.

8
HSBC FTP Series
Trustees’ ReportFor the year ended March 31, 2013 (Contd...)
8. STATUTORY DETAILSa) The Sponsors are not responsible or liable for any loss resulting from the operation of the Schemes of
the Fund beyond initial contribution of Rs. 1 lakh for setting up the Fund.
b) The price and redemption value of the units, and income from them, can go up as well as down with fl uctuations in the market value of its underlying investments.
c) Full Annual Report shall be disclosed on the website at www.assetmanagement.hsbc.com/in and shall be available for inspection at the Head Offi ce of the mutual fund. Present and prospective unit holder can obtain copy of the trust deed, the full Annual Report of the Scheme(s), the Annual Report of HSBC Asset Management (India) Private Limited and the text of the relevant Scheme(s) at a price.
9. ACKNOWLEDGEMENTSThe Trustees wish to thank the Unit holders of the Schemes for their support throughout the year and also thank the Government of India, the Securities and Exchange Board of India (SEBI), the Reserve Bank of India (RBI) and the Association of Mutual Funds in India (AMFI) for the guidance provided by them. The Trustees also appreciate the service provided by the Registrar and Transfer Agent, Fund Accountant, Custodian, Bankers, Distributors and Brokers. The guidance and services provided by the Auditors and advocates and the ebullience, sincerity and dedication of the employees of HSBC Asset Management (India) Private Limited is also appreciated.
The Trustees look forward to the continued support of everyone.
For and on behalf of the Board of Trustees of HSBC Mutual Fund
Sd/-
Dilip J. Thakkar
Trustee
MUMBAIJuly 16, 2013.
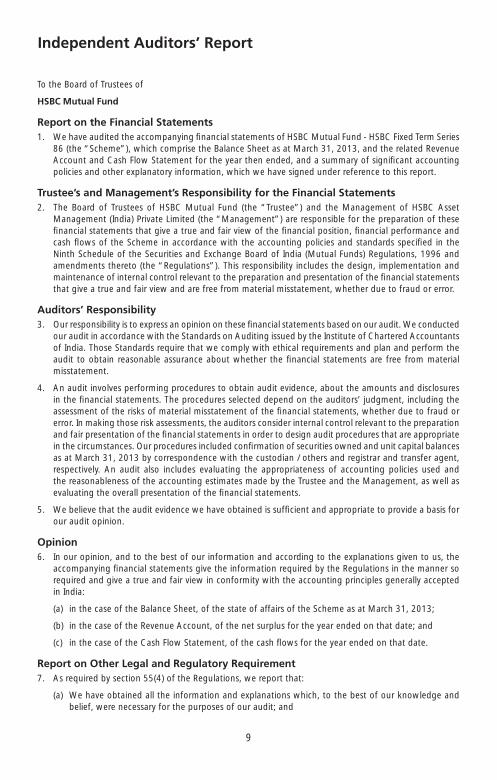
9
HSBC FTP Series
Independent Auditors’ Report
To the Board of Trustees of
HSBC Mutual Fund
Report on the Financial Statements1. We have audited the accompanying fi nancial statements of HSBC Mutual Fund - HSBC Fixed Term Series
86 (the “Scheme”), which comprise the Balance Sheet as at March 31, 2013, and the related Revenue Account and Cash Flow Statement for the year then ended, and a summary of signifi cant accounting policies and other explanatory information, which we have signed under reference to this report.
Trustee’s and Management’s Responsibility for the Financial Statements2. The Board of Trustees of HSBC Mutual Fund (the “Trustee”) and the Management of HSBC Asset
Management (India) Private Limited (the “Management”) are responsible for the preparation of these fi nancial statements that give a true and fair view of the fi nancial position, fi nancial performance and cash fl ows of the Scheme in accordance with the accounting policies and standards specifi ed in the Ninth Schedule of the Securities and Exchange Board of India (Mutual Funds) Regulations, 1996 and amendments thereto (the “Regulations”). This responsibility includes the design, implementation and maintenance of internal control relevant to the preparation and presentation of the fi nancial statements that give a true and fair view and are free from material misstatement, whether due to fraud or error.
Auditors’ Responsibility3. Our responsibility is to express an opinion on these fi nancial statements based on our audit. We conducted
our audit in accordance with the Standards on Auditing issued by the Institute of Chartered Accountants of India. Those Standards require that we comply with ethical requirements and plan and perform the audit to obtain reasonable assurance about whether the fi nancial statements are free from material misstatement.
4. An audit involves performing procedures to obtain audit evidence, about the amounts and disclosures in the fi nancial statements. The procedures selected depend on the auditors’ judgment, including the assessment of the risks of material misstatement of the fi nancial statements, whether due to fraud or error. In making those risk assessments, the auditors consider internal control relevant to the preparation and fair presentation of the fi nancial statements in order to design audit procedures that are appropriate in the circumstances. Our procedures included confi rmation of securities owned and unit capital balances as at March 31, 2013 by correspondence with the custodian / others and registrar and transfer agent, respectively. An audit also includes evaluating the appropriateness of accounting policies used and the reasonableness of the accounting estimates made by the Trustee and the Management, as well as evaluating the overall presentation of the fi nancial statements.
5. We believe that the audit evidence we have obtained is suffi cient and appropriate to provide a basis for our audit opinion.
Opinion6. In our opinion, and to the best of our information and according to the explanations given to us, the
accompanying fi nancial statements give the information required by the Regulations in the manner so required and give a true and fair view in conformity with the accounting principles generally accepted in India:
(a) in the case of the Balance Sheet, of the state of affairs of the Scheme as at March 31, 2013;
(b) in the case of the Revenue Account, of the net surplus for the year ended on that date; and
(c) in the case of the Cash Flow Statement, of the cash fl ows for the year ended on that date.
Report on Other Legal and Regulatory Requirement7. As required by section 55(4) of the Regulations, we report that:
(a) We have obtained all the information and explanations which, to the best of our knowledge and belief, were necessary for the purposes of our audit; and

10
HSBC FTP Series
Independent Auditors’ Report (Contd...)
(b) In our opinion, the Balance Sheet, Revenue Account and Cash Flow Statement dealt with by this report have been prepared in accordance with the accounting policies and standards specifi ed in the Ninth Schedule of the Regulations.
8. As required by clause 5 (ii)(2) of the Eleventh Schedule to the Regulations, we report that the Balance Sheet, Revenue Account, and Cash Flow Statement dealt with by this Report are in agreement with the books of account of the Scheme.
9. In our opinion, the methods used to value non-traded securities where applicable as at March 31, 2013, as determined by HSBC Asset Management (India) Private Limited under procedures approved by the Board of Trustees of HSBC Mutual Fund in accordance with the guidelines for valuation of securities for mutual funds as mentioned in the Eighth Schedule of the Regulations issued by the Securities and Exchange Board of India, are fair and reasonable.
For PRICE WATERHOUSEFirm Registration Number: 301112EChartered Accountants
Sd/-
Vivek PrasadPartnerMembership Number: 104941
Place : MumbaiDate : July 16, 2013.

11
HSBC FTP Series
Independent Auditors’ Report
To the Board of Trustees of
HSBC Mutual Fund
Report on the Financial Statements1. We have audited the accompanying fi nancial statements of HSBC Mutual Fund - HSBC Fixed Term Series
89 (the “Scheme”), which comprise the Balance Sheet as at March 31, 2013, and the related Revenue Account and Cash Flow Statement for the period from March 22, 2013 to March 31, 2013, and a summary of signifi cant accounting policies and other explanatory information, which we have signed under reference to this report.
Trustee’s and Management’s Responsibility for the Financial Statements2. The Board of Trustees of HSBC Mutual Fund (the “Trustee”) and the Management of HSBC Asset
Management (India) Private Limited (the “Management”) are responsible for the preparation of these fi nancial statements that give a true and fair view of the fi nancial position, fi nancial performance and cash fl ows of the Scheme in accordance with the accounting policies and standards specifi ed in the Ninth Schedule of the Securities and Exchange Board of India (Mutual Funds) Regulations, 1996 and amendments thereto (the “Regulations”). This responsibility includes the design, implementation and maintenance of internal control relevant to the preparation and presentation of the fi nancial statements that give a true and fair view and are free from material misstatement, whether due to fraud or error.
Auditors’ Responsibility3. Our responsibility is to express an opinion on these fi nancial statements based on our audit. We conducted
our audit in accordance with the Standards on Auditing issued by the Institute of Chartered Accountants of India. Those Standards require that we comply with ethical requirements and plan and perform the audit to obtain reasonable assurance about whether the fi nancial statements are free from material misstatement.
4. An audit involves performing procedures to obtain audit evidence, about the amounts and disclosures in the fi nancial statements. The procedures selected depend on the auditors’ judgment, including the assessment of the risks of material misstatement of the fi nancial statements, whether due to fraud or error. In making those risk assessments, the auditors consider internal control relevant to the preparation and fair presentation of the fi nancial statements in order to design audit procedures that are appropriate in the circumstances. Our procedures included confi rmation of securities owned and unit capital balances as at March 31, 2013 by correspondence with the custodian/others and registrar and transfer agent, respectively. An audit also includes evaluating the appropriateness of accounting policies used and the reasonableness of the accounting estimates made by the Trustee and the Management, as well as evaluating the overall presentation of the fi nancial statements.
5. We believe that the audit evidence we have obtained is suffi cient and appropriate to provide a basis for our audit opinion.
Opinion6. In our opinion, and to the best of our information and according to the explanations given to us, the
accompanying fi nancial statements give the information required by the Regulations in the manner so required and give a true and fair view in conformity with the accounting principles generally accepted in India:
(a) in the case of the Balance Sheet, of the state of affairs of the Scheme as at March 31, 2013;
(b) in the case of the Revenue Account, of the net surplus for the period from March 22, 2013 to March 31, 2013; and
(c) in the case of the Cash Flow Statement, of the cash fl ows for the period from March 22, 2013 to March 31, 2013.

12
HSBC FTP Series
Independent Auditors’ Report (Contd...)
Report on Other Legal and Regulatory Requirement7. As required by section 55(4) of the Regulations, we report that:
(a) We have obtained all the information and explanations which, to the best of our knowledge and belief, were necessary for the purposes of our audit; and
(b) In our opinion, the Balance Sheet, Revenue Account and Cash Flow Statement dealt with by this report have been prepared in accordance with the accounting policies and standards specifi ed in the Ninth Schedule of the Regulations.
8. As required by clause 5 (ii)(2) of the Eleventh Schedule to the Regulations, we report that the Balance Sheet, Revenue Account, and Cash Flow Statement dealt with by this Report are in agreement with the books of account of the Scheme.
9. In our opinion, the methods used to value non-traded securities as at March 31, 2013, as determined by HSBC Asset Management (India) Private Limited under procedures approved by the Board of Trustees of HSBC Mutual Fund in accordance with the guidelines for valuation of securities for mutual funds as mentioned in the Eighth Schedule of the Regulations issued by the Securities and Exchange Board of India, are fair and reasonable.
For PRICE WATERHOUSEFirm Registration Number: 301112EChartered Accountants
Sd/-
Vivek PrasadPartnerMembership Number: 104941
Place : MumbaiDate : July 16, 2013.
13
HSBC FTP Series
Independent Auditors’ Report
To the Board of Trustees of
HSBC Mutual Fund
Report on the Financial Statements1. We have audited the accompanying fi nancial statements of HSBC Mutual Fund - HSBC Fixed Term Series
90 (the “Scheme”), which comprise the Balance Sheet as at March 31, 2013, and the related Revenue Account and Cash Flow Statement for the period from March 22, 2013 to March 31, 2013, and a summary of signifi cant accounting policies and other explanatory information, which we have signed under reference to this report.
Trustee’s and Management’s Responsibility for the Financial Statements2. The Board of Trustees of HSBC Mutual Fund (the “Trustee”) and the Management of HSBC Asset
Management (India) Private Limited (the “Management”) are responsible for the preparation of these fi nancial statements that give a true and fair view of the fi nancial position, fi nancial performance and cash fl ows of the Scheme in accordance with the accounting policies and standards specifi ed in the Ninth Schedule of the Securities and Exchange Board of India (Mutual Funds) Regulations, 1996 and amendments thereto (the “Regulations”). This responsibility includes the design, implementation and maintenance of internal control relevant to the preparation and presentation of the fi nancial statements that give a true and fair view and are free from material misstatement, whether due to fraud or error.
Auditors’ Responsibility3. Our responsibility is to express an opinion on these fi nancial statements based on our audit. We conducted
our audit in accordance with the Standards on Auditing issued by the Institute of Chartered Accountants of India. Those Standards require that we comply with ethical requirements and plan and perform the audit to obtain reasonable assurance about whether the fi nancial statements are free from material misstatement.
4. An audit involves performing procedures to obtain audit evidence, about the amounts and disclosures in the fi nancial statements. The procedures selected depend on the auditors’ judgment, including the assessment of the risks of material misstatement of the fi nancial statements, whether due to fraud or error. In making those risk assessments, the auditors consider internal control relevant to the preparation and fair presentation of the fi nancial statements in order to design audit procedures that are appropriate in the circumstances. Our procedures included confi rmation of securities owned and unit capital balances as at March 31, 2013 by correspondence with the custodian / others and registrar and transfer agent, respectively. An audit also includes evaluating the appropriateness of accounting policies used and the reasonableness of the accounting estimates made by the Trustee and the Management, as well as evaluating the overall presentation of the fi nancial statements.
5. We believe that the audit evidence we have obtained is suffi cient and appropriate to provide a basis for our audit opinion.
Opinion6. In our opinion, and to the best of our information and according to the explanations given to us, the
accompanying fi nancial statements give the information required by the Regulations in the manner so required and give a true and fair view in conformity with the accounting principles generally accepted in India:
(a) in the case of the Balance Sheet, of the state of affairs of the Scheme as at March 31, 2013;
(b) in the case of the Revenue Account, of the net surplus for the period from March 22, 2013 to March 31, 2013; and
(c) in the case of the Cash Flow Statement, of the cash fl ows for the period from March 22, 2013 to March 31, 2013.
14
HSBC FTP Series
Report on Other Legal and Regulatory Requirement7. As required by section 55(4) of the Regulations, we report that:
(a) We have obtained all the information and explanations which, to the best of our knowledge and belief, were necessary for the purposes of our audit; and
(b) In our opinion, the Balance Sheet, Revenue Account and Cash Flow Statement dealt with by this report have been prepared in accordance with the accounting policies and standards specifi ed in the Ninth Schedule of the Regulations.
8. As required by clause 5 (ii)(2) of the Eleventh Schedule to the Regulations, we report that the Balance Sheet, Revenue Account, and Cash Flow Statement dealt with by this Report are in agreement with the books of account of the Scheme.
9. In our opinion, the methods used to value non-traded securities as at March 31, 2013, as determined by HSBC Asset Management (India) Private Limited under procedures approved by the Board of Trustees of HSBC Mutual Fund in accordance with the guidelines for valuation of securities for mutual funds as mentioned in the Eighth Schedule of the Regulations issued by the Securities and Exchange Board of India, are fair and reasonable.
For PRICE WATERHOUSEFirm Registration Number: 301112EChartered Accountants
Sd/-
Vivek PrasadPartnerMembership Number: 104941
Place : MumbaiDate : July 16, 2013.
Independent Auditors’ Report (Contd...)

HSBC FIXED TERM SERIES 90 March 31, 2013 March 31, 2012 March 31, 2013 March 31, 2013
Schedule Rupees Rupees Rupees Rupees ASSETS
Investments 1 1,961,377,558 2,166,908,798 847,777,955 642,484,771 Other Current Assets 2 427,608,265 3,043,644 101,319,543 1,312,334
TOTAL 2,388,985,823 2,169,952,442 949,097,498 643,797,105
LIABILITIES
Unit Capital 3 2,156,760,247 2,156,760,247 847,247,237 642,957,548 Reserves and Surplus 4 231,795,470 13,070,395 919,283 796,346 Current Liabilities and Provisions 5 430,106 121,800 100,930,978 43,211
TOTAL 2,388,985,823 2,169,952,442 949,097,498 643,797,105
Notes to the Financial Statements. 7
The schedules referred to herein form an integral part of the Financial Statements.
This is the Balance Sheet referred to in our report of even date.
For PRICE WATERHOUSE For Board of Trustees of HSBC Mutual Fund For HSBC Asset Management (India) Private LimitedFirm Registration Number: 301112EChartered Accountants
sd/- sd/- sd/-VIVEK PRASAD N. P. Gidwani Puneet ChaddhaPartner Trustee Director and Chief Executive OfficerMembership No.104941
sd/- sd/-Dilip J. Thakkar Kishori J. UdeshiTrustee Director
sd/- sd/-Sanjay Shah Ruchir ParekhFund Manager Fund Manager
Place: MumbaiDate: July 16 ,2013 \
HSBC MUTUAL FUND - HSBC FIXED TERM SERIES 86, HSBC FIXED TERM SERIES 89, HSBC FIXED TERM SERIES 90
Balance Sheet as at March 31, 2013
HSBC FIXED TERM SERIES 86 HSBC FIXED TERM
SERIES 89

H00175 H85963 H85967 HSBC FIXED TERM SERIES 89
HSBC FIXED TERM SERIES 90
April 01, 2012 to March 19, 2012 to March 22, 2013 to March 22, 2013 toMarch 31, 2013 March 31, 2012 March 31, 2013 March 31, 2013
Schedule Rupees Rupees Rupees Rupees
INCOME AND GAINS
Interest and Discount 6 227,966,510 5,341,039 1,305,939 1,018,024 Net Profit on Sale of Investments and Derivatives (Note 2.3) 889,269 - - -
TOTAL 228,855,779 5,341,039 1,305,939 1,018,024
EXPENSES AND LOSSES
Investment Management and Advisory Fees (Note 3) 1,358,906 32,130 8,360 4,937 Transfer Agent Fees and Expenses 339,535 40,479 7,935 6,024 Trusteeship Fees and Expenses (Note 4) - - - - Custodian Fees and Expenses (Note 5) 317,858 3,926 1,145 1,164 Audit Fees 20,000 20,000 20,000 20,000 Investor Education Expenses 233,271 - 2,787 2,468 Other Operating Expenses 193,969 23,965 18,740 8,515
TOTAL 2,463,539 120,500 58,967 43,108
Less: Expenses to be Reimbursed by the Investment Manager (Note 7) 178,766 52,831 726 18,816
TOTAL 2,284,773 67,669 58,241 24,292
Net Realised Gains for the Year/ Period 226,571,006 5,273,370 1,247,698 993,732
Net change in Unrealised Depreciation in Value of Investments (Note 2.2 and 8) (48,906) - (328,415) (197,386)
Net Gains for the Year/ Period 226,522,100 5,273,370 919,283 796,346
Net change in Unrealised Appreciation in Value of Investments (Note 2.2 and 8) (7,797,025) 7,797,025 - -
Net Surplus including Net change in Unrealised Appreciation / Depreciation in Value of Investments 218,725,076 13,070,395 919,283 796,346
Net change in Unrealised Appreciation in Value of Investments transferred to Unrealised Appreciation Reserve 7,797,025 (7,797,025) - -
Net Surplus for the Year/ Period 226,522,100 5,273,370 919,283 796,346
April 01, 2012 to March 19, 2012 to March 22, 2013 to March 22, 2013 toMarch 31, 2013 March 31, 2012 March 31, 2013 March 31, 2013
Rupees Rupees Rupees Rupees
Net Surplus for the Year/ Period 226,522,100 5,273,370 919,283 796,346 Transfer from Reserve Fund 5,273,370 - - -
Balance Transferred to Reserve Fund 231,795,470 5,273,370 919,283 796,346
Notes to the Financial Statements. 7The schedules referred to herein form an integral part of the Financial Statements.This is the Revenue Account referred to in our report of even date.
For PRICE WATERHOUSE For Board of Trustees of HSBC Mutual Fund For HSBC Asset Management (India) Private LimitedFirm Registration Number: 301112EChartered Accountants
sd/- sd/- sd/-VIVEK PRASAD N. P. Gidwani Puneet ChaddhaPartner Trustee Director and Chief Executive OfficerMembership No.104941
sd/- sd/-Dilip J. Thakkar Kishori J. UdeshiTrustee Director
sd/- sd/-Sanjay Shah Ruchir ParekhFund Manager Fund Manager
Place: MumbaiDate: July 16 ,2013
HSBC MUTUAL FUND - HSBC FIXED TERM SERIES 86, HSBC FIXED TERM SERIES 89, HSBC FIXED TERM SERIES 90
Revenue Account for the year/period ended March 31, 2013
HSBC FIXED TERM SERIES 86
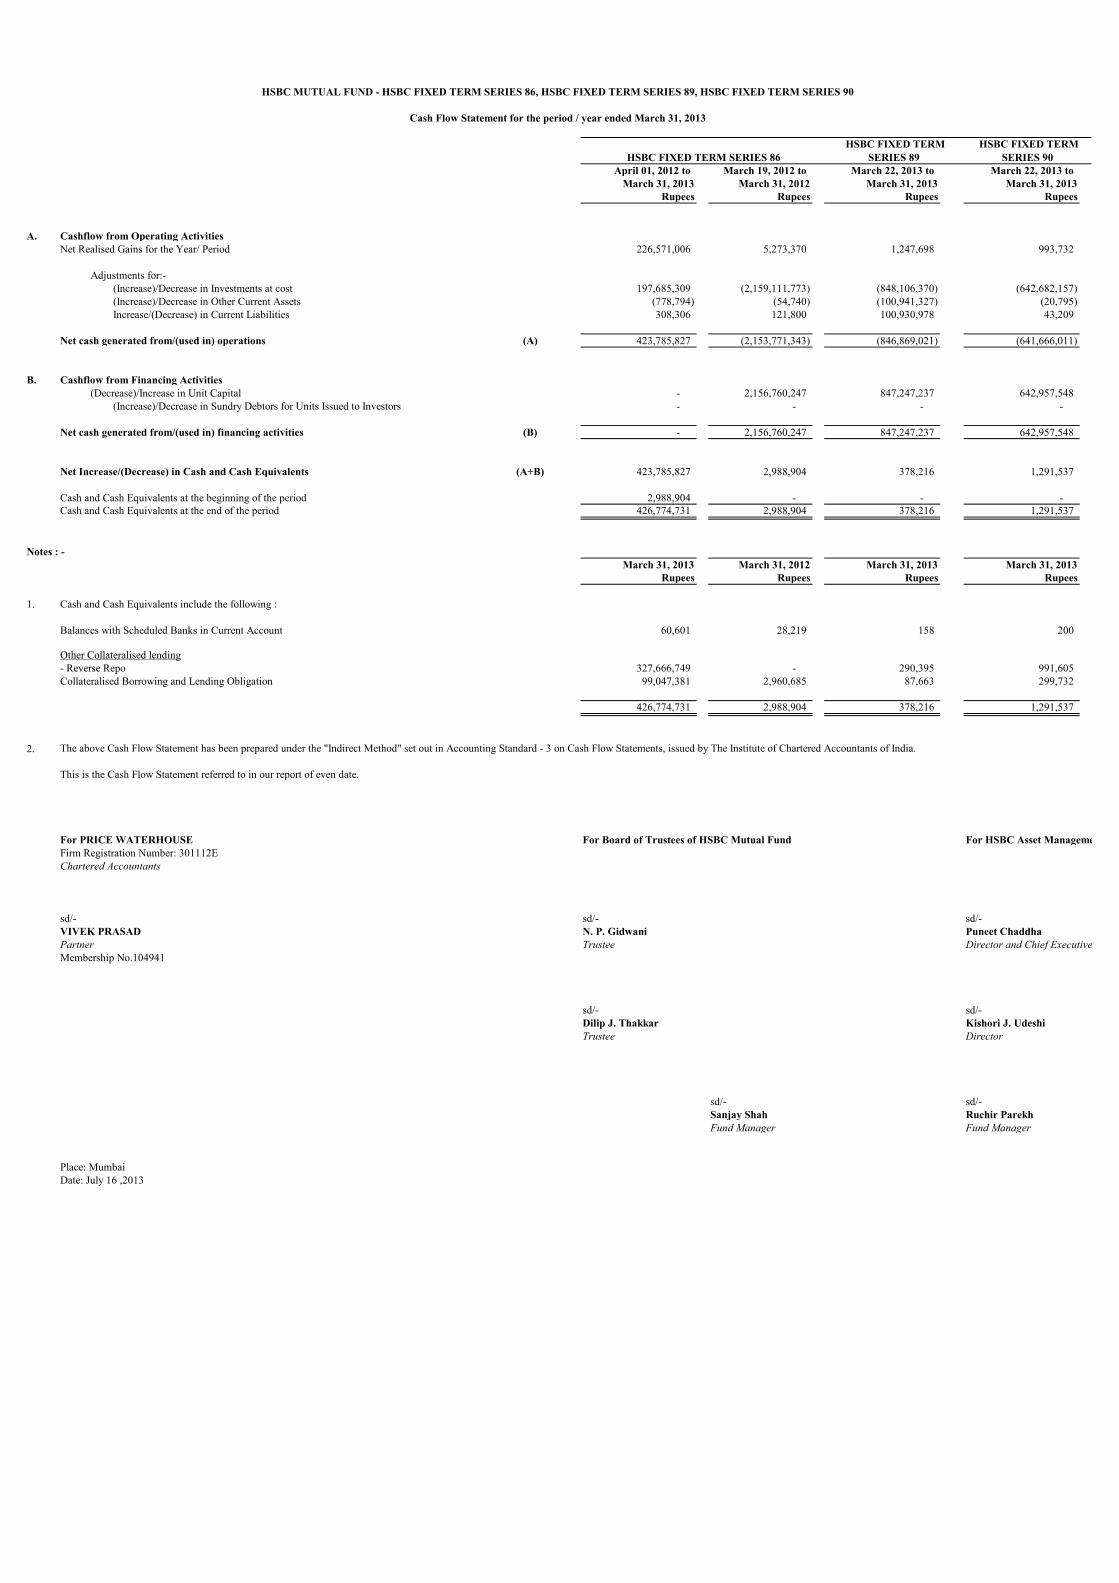
April 01, 2012 to March 19, 2012 to March 22, 2013 to March 22, 2013 toMarch 31, 2013 March 31, 2012 March 31, 2013 March 31, 2013
Rupees Rupees Rupees Rupees
A. Cashflow from Operating ActivitiesNet Realised Gains for the Year/ Period 226,571,006 5,273,370 1,247,698 993,732
Adjustments for:-(Increase)/Decrease in Investments at cost 197,685,309 (2,159,111,773) (848,106,370) (642,682,157) (Increase)/Decrease in Other Current Assets (778,794) (54,740) (100,941,327) (20,795) Increase/(Decrease) in Current Liabilities 308,306 121,800 100,930,978 43,209
Net cash generated from/(used in) operations (A) 423,785,827 (2,153,771,343) (846,869,021) (641,666,011)
B. Cashflow from Financing Activities(Decrease)/Increase in Unit Capital - 2,156,760,247 847,247,237 642,957,548
(Increase)/Decrease in Sundry Debtors for Units Issued to Investors - - - -
Net cash generated from/(used in) financing activities (B) - 2,156,760,247 847,247,237 642,957,548
Net Increase/(Decrease) in Cash and Cash Equivalents (A+B) 423,785,827 2,988,904 378,216 1,291,537
Cash and Cash Equivalents at the beginning of the period 2,988,904 - - - Cash and Cash Equivalents at the end of the period 426,774,731 2,988,904 378,216 1,291,537
0 (0) (0) 0 Notes : -
March 31, 2013 March 31, 2012 March 31, 2013 March 31, 2013 Rupees Rupees Rupees Rupees
1. Cash and Cash Equivalents include the following :
Balances with Scheduled Banks in Current Account 60,601 28,219 158 200
Other Collateralised lending- Reverse Repo 327,666,749 - 290,395 991,605 Collateralised Borrowing and Lending Obligation 99,047,381 2,960,685 87,663 299,732
426,774,731 2,988,904 378,216 1,291,537
2. The above Cash Flow Statement has been prepared under the "Indirect Method" set out in Accounting Standard - 3 on Cash Flow Statements, issued by The Institute of Chartered Accountants of India.
This is the Cash Flow Statement referred to in our report of even date.
For PRICE WATERHOUSE For Board of Trustees of HSBC Mutual Fund For HSBC Asset Management (India) Private LimitedFirm Registration Number: 301112EChartered Accountants
sd/- sd/- sd/-VIVEK PRASAD N. P. Gidwani Puneet ChaddhaPartner Trustee Director and Chief Executive OfficerMembership No.104941
sd/- sd/-Dilip J. Thakkar Kishori J. UdeshiTrustee Director
sd/- sd/-Sanjay Shah Ruchir ParekhFund Manager Fund Manager
Place: MumbaiDate: July 16 ,2013
HSBC MUTUAL FUND - HSBC FIXED TERM SERIES 86, HSBC FIXED TERM SERIES 89, HSBC FIXED TERM SERIES 90
Cash Flow Statement for the period / year ended March 31, 2013
HSBC FIXED TERM SERIES 86 HSBC FIXED TERM
SERIES 89 HSBC FIXED TERM
SERIES 90

SCHEDULE 1 Investments Market/Fair Value Cost Market/Fair Value Cost Market/Fair Value Cost Market/Fair Value Cost
(Notes 2.2, 2.3, 5A, 8, 9, 10 and 14) Rupees Rupees Rupees Rupees Rupees Rupees Rupees Rupees '(Refer to the attached Statement of Portfolio Holding as at March 31, 2013)
Privately Placed Non Convertible Debentures / Bonds - - - - 68,843,609 69,000,000 - - Certificate of Deposit 1,961,377,558 1,961,426,464 2,166,908,798 2,159,111,773 778,934,346 779,106,370 642,484,771 642,682,157
TOTAL 1,961,377,558 1,961,426,464 2,166,908,798 2,159,111,773 847,777,955 848,106,370 642,484,771 642,682,157 (197,685,310)
SCHEDULE 2 March 31, 2013 March 31, 2012 March 31, 2013 March 31, 2013 Other Current Assets Rupees Rupees Rupees Rupees
Balances with Banks in Current Account 60,601 28,219 158 200 Securities Awaiting Settlement - Certificate of Deposit - - 100,871,210 -
Reverse Repos 327,666,749 - 290,395 991,605 Collateralised Borrowing and Lending Obligation 99,047,381 2,960,685 87,663 299,732 Interest Receivable on : - Debentures / Bonds - - 68,811 - - Reverse Repos 531,020 - 470 1,607 - Collateralised Borrowing and Lending Obligation 123,748 1,909 110 374 Receivable from Investment Manager 178,766 52,831 726 18,816
TOTAL 427,608,265 3,043,644 101,319,543 1,312,334
HSBC MUTUAL FUND - HSBC FIXED TERM SERIES 86, HSBC FIXED TERM SERIES 89, HSBC FIXED TERM SERIES 90
Schedules forming part of the Balance Sheet as at March 31, 2013
March 31, 2013
and the Revenue Account for the year/period ended March 31, 2013
HSBC FIXED TERM SERIES 86 HSBC FIXED TERM SERIES 89 March 31, 2013 March 31, 2013March 31, 2012
HSBC FIXED TERM SERIES 90
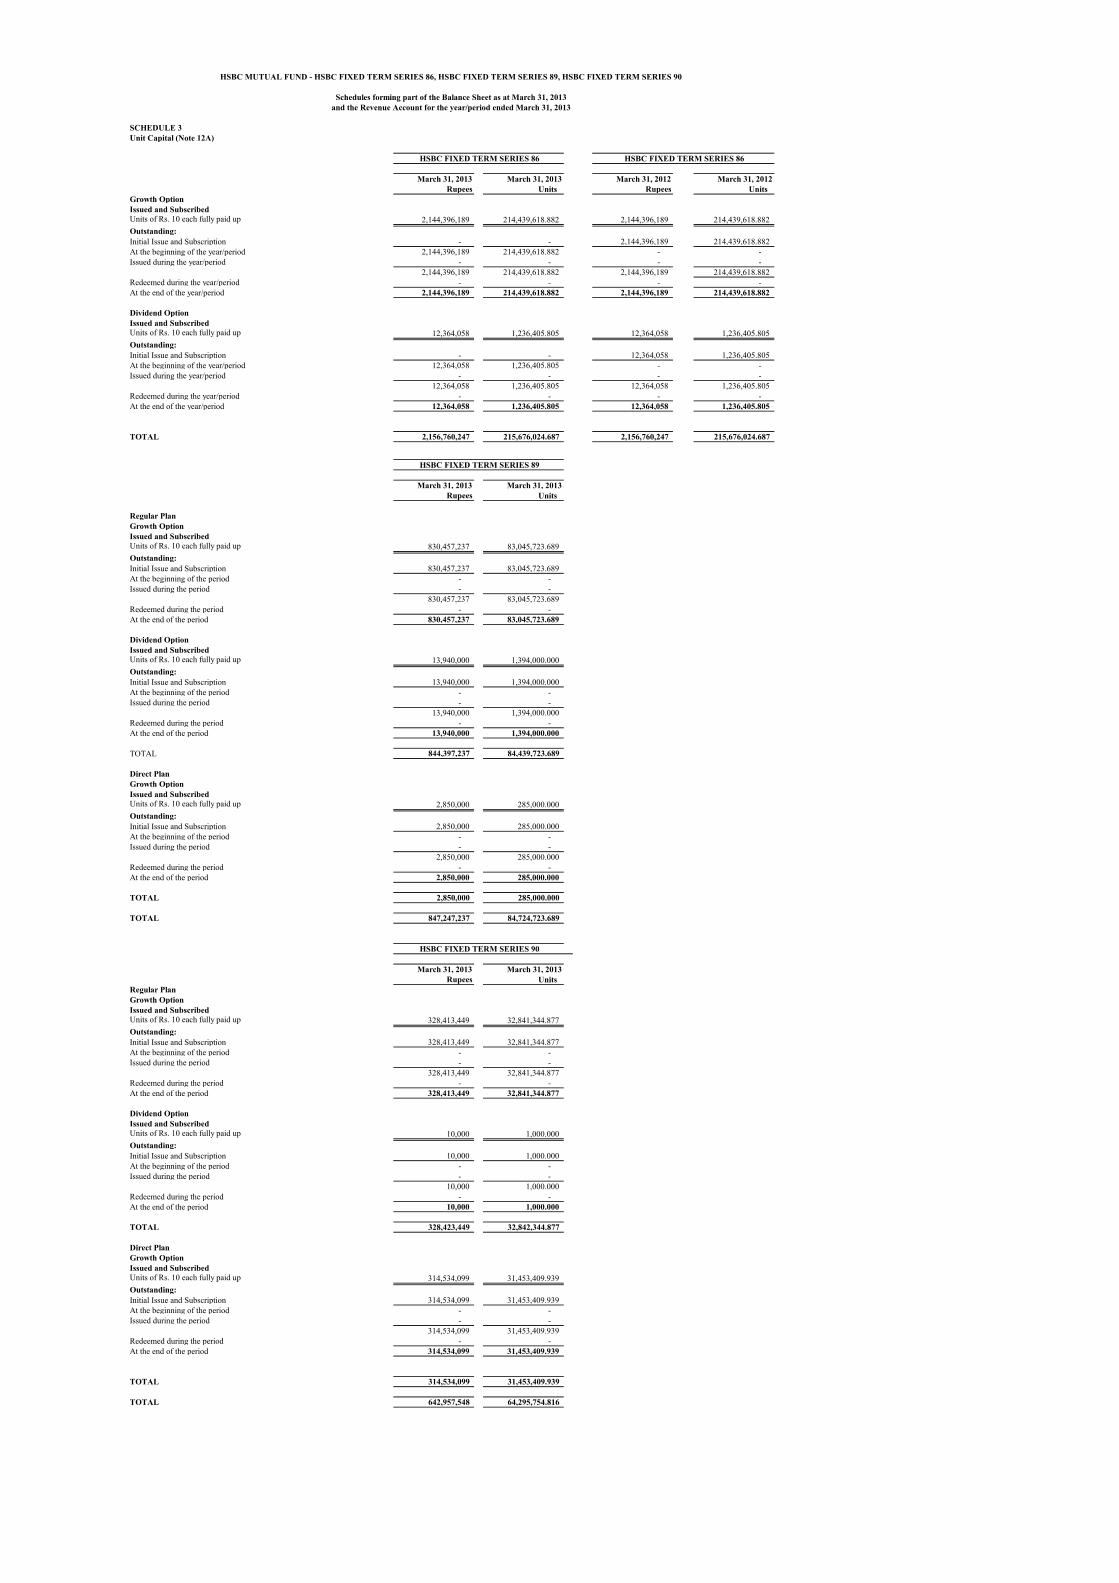
SCHEDULE 3Unit Capital (Note 12A)
March 31, 2013 March 31, 2013 March 31, 2012 March 31, 2012 Rupees Units Rupees Units
Growth OptionIssued and SubscribedUnits of Rs. 10 each fully paid up 2,144,396,189 214,439,618.882 2,144,396,189 214,439,618.882 Outstanding:Initial Issue and Subscription - - 2,144,396,189 214,439,618.882 At the beginning of the year/period 2,144,396,189 214,439,618.882 - - Issued during the year/period - - - -
2,144,396,189 214,439,618.882 2,144,396,189 214,439,618.882 Redeemed during the year/period - - - - At the end of the year/period 2,144,396,189 214,439,618.882 2,144,396,189 214,439,618.882
Dividend OptionIssued and SubscribedUnits of Rs. 10 each fully paid up 12,364,058 1,236,405.805 12,364,058 1,236,405.805 Outstanding:Initial Issue and Subscription - - 12,364,058 1,236,405.805 At the beginning of the year/period 12,364,058 1,236,405.805 - - Issued during the year/period - - - -
12,364,058 1,236,405.805 12,364,058 1,236,405.805 Redeemed during the year/period - - - - At the end of the year/period 12,364,058 1,236,405.805 12,364,058 1,236,405.805
TOTAL 2,156,760,247 215,676,024.687 2,156,760,247 215,676,024.687
March 31, 2013 March 31, 2013 Rupees Units
Regular PlanGrowth OptionIssued and SubscribedUnits of Rs. 10 each fully paid up 830,457,237 83,045,723.689 Outstanding:Initial Issue and Subscription 830,457,237 83,045,723.689 At the beginning of the period - - Issued during the period - -
830,457,237 83,045,723.689 Redeemed during the period - - At the end of the period 830,457,237 83,045,723.689
Dividend OptionIssued and SubscribedUnits of Rs. 10 each fully paid up 13,940,000 1,394,000.000 Outstanding:Initial Issue and Subscription 13,940,000 1,394,000.000 At the beginning of the period - - Issued during the period - -
13,940,000 1,394,000.000 Redeemed during the period - - At the end of the period 13,940,000 1,394,000.000
TOTAL 844,397,237 84,439,723.689
Direct PlanGrowth OptionIssued and SubscribedUnits of Rs. 10 each fully paid up 2,850,000 285,000.000 Outstanding:Initial Issue and Subscription 2,850,000 285,000.000 At the beginning of the period - - Issued during the period - -
2,850,000 285,000.000 Redeemed during the period - - At the end of the period 2,850,000 285,000.000
TOTAL 2,850,000 285,000.000
TOTAL 847,247,237 84,724,723.689
March 31, 2013 March 31, 2013 Rupees Units
Regular PlanGrowth OptionIssued and SubscribedUnits of Rs. 10 each fully paid up 328,413,449 32,841,344.877 Outstanding:Initial Issue and Subscription 328,413,449 32,841,344.877 At the beginning of the period - - Issued during the period - -
328,413,449 32,841,344.877 Redeemed during the period - - At the end of the period 328,413,449 32,841,344.877
Dividend OptionIssued and SubscribedUnits of Rs. 10 each fully paid up 10,000 1,000.000 Outstanding:Initial Issue and Subscription 10,000 1,000.000 At the beginning of the period - - Issued during the period - -
10,000 1,000.000 Redeemed during the period - - At the end of the period 10,000 1,000.000
TOTAL 328,423,449 32,842,344.877
Direct Plan Growth OptionIssued and SubscribedUnits of Rs. 10 each fully paid up 314,534,099 31,453,409.939 Outstanding:Initial Issue and Subscription 314,534,099 31,453,409.939 At the beginning of the period - - Issued during the period - -
314,534,099 31,453,409.939 Redeemed during the period - - At the end of the period 314,534,099 31,453,409.939
TOTAL 314,534,099 31,453,409.939
TOTAL 642,957,548 64,295,754.816
HSBC MUTUAL FUND - HSBC FIXED TERM SERIES 86, HSBC FIXED TERM SERIES 89, HSBC FIXED TERM SERIES 90
Schedules forming part of the Balance Sheet as at March 31, 2013and the Revenue Account for the year/period ended March 31, 2013
HSBC FIXED TERM SERIES 86 HSBC FIXED TERM SERIES 86
HSBC FIXED TERM SERIES 89
HSBC FIXED TERM SERIES 90
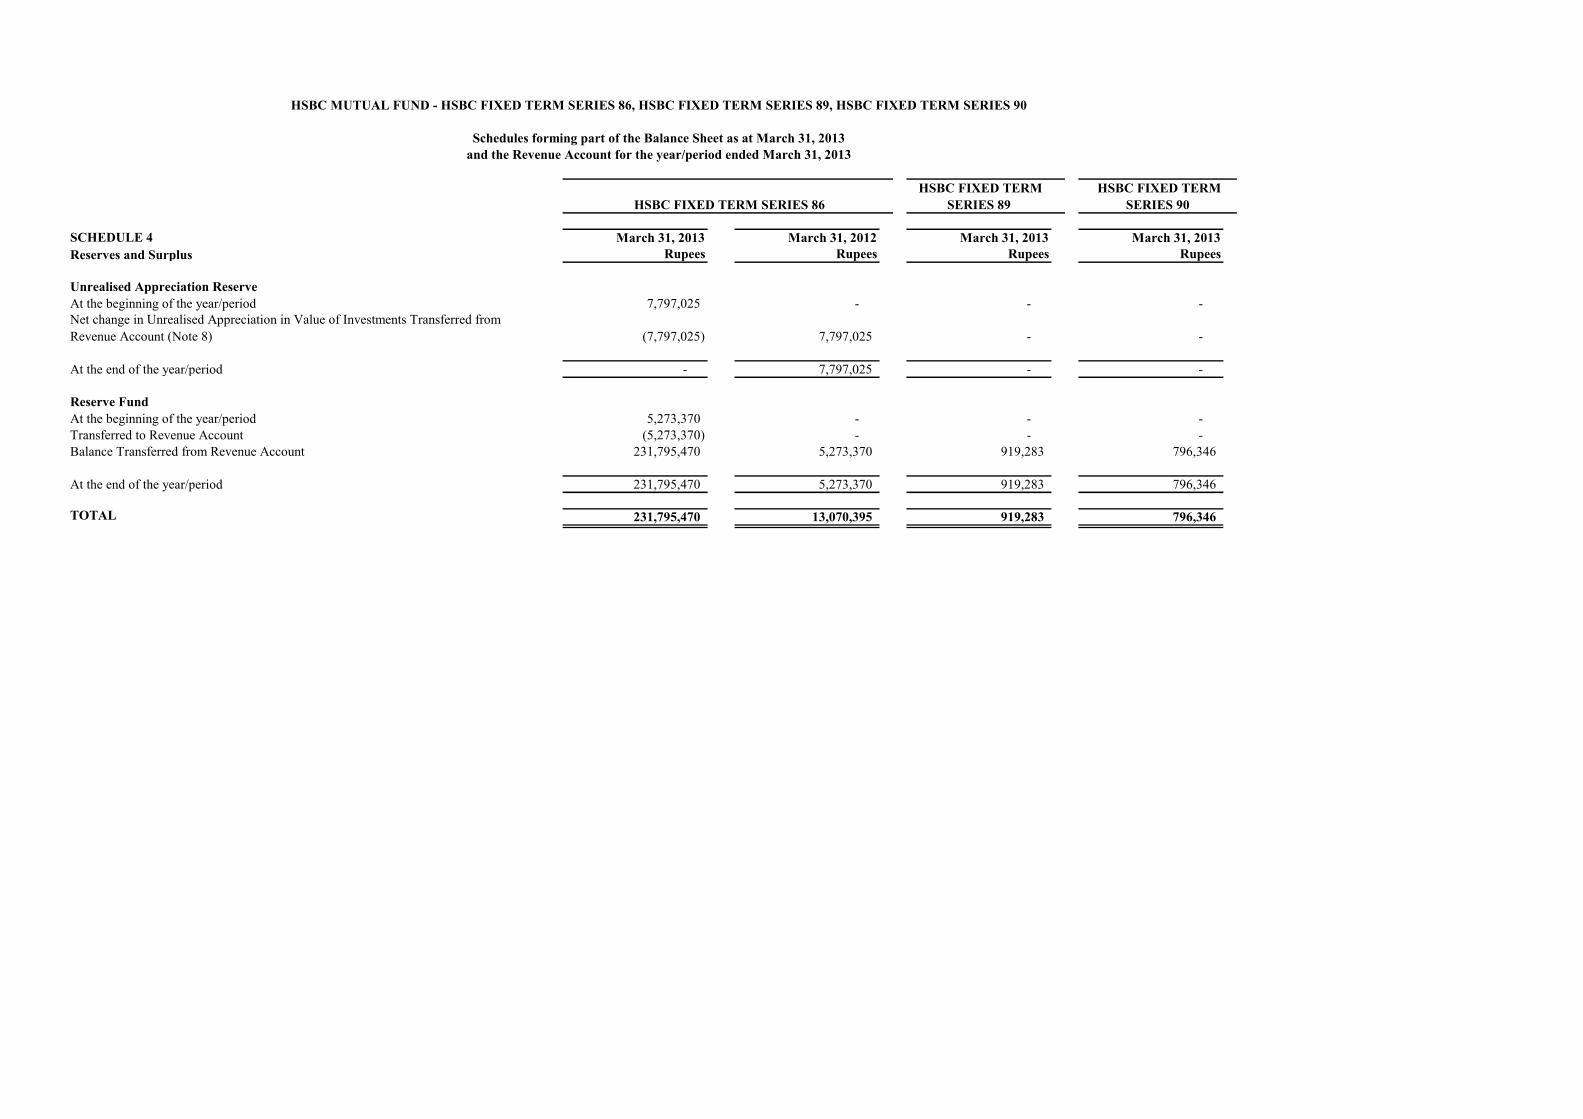
SCHEDULE 4 March 31, 2013 March 31, 2012 March 31, 2013 March 31, 2013Reserves and Surplus Rupees Rupees Rupees Rupees
Unrealised Appreciation ReserveAt the beginning of the year/period 7,797,025 - - - Net change in Unrealised Appreciation in Value of Investments Transferred from Revenue Account (Note 8) (7,797,025) 7,797,025 - -
At the end of the year/period - 7,797,025 - -
Reserve FundAt the beginning of the year/period 5,273,370 - - - Transferred to Revenue Account (5,273,370) - - - Balance Transferred from Revenue Account 231,795,470 5,273,370 919,283 796,346
At the end of the year/period 231,795,470 5,273,370 919,283 796,346
TOTAL 231,795,470 * 13,070,395 * 919,283 * 796,346 *
HSBC MUTUAL FUND - HSBC FIXED TERM SERIES 86, HSBC FIXED TERM SERIES 89, HSBC FIXED TERM SERIES 90
Schedules forming part of the Balance Sheet as at March 31, 2013and the Revenue Account for the year/period ended March 31, 2013
HSBC FIXED TERM SERIES 86 HSBC FIXED TERM
SERIES 89 HSBC FIXED TERM
SERIES 90
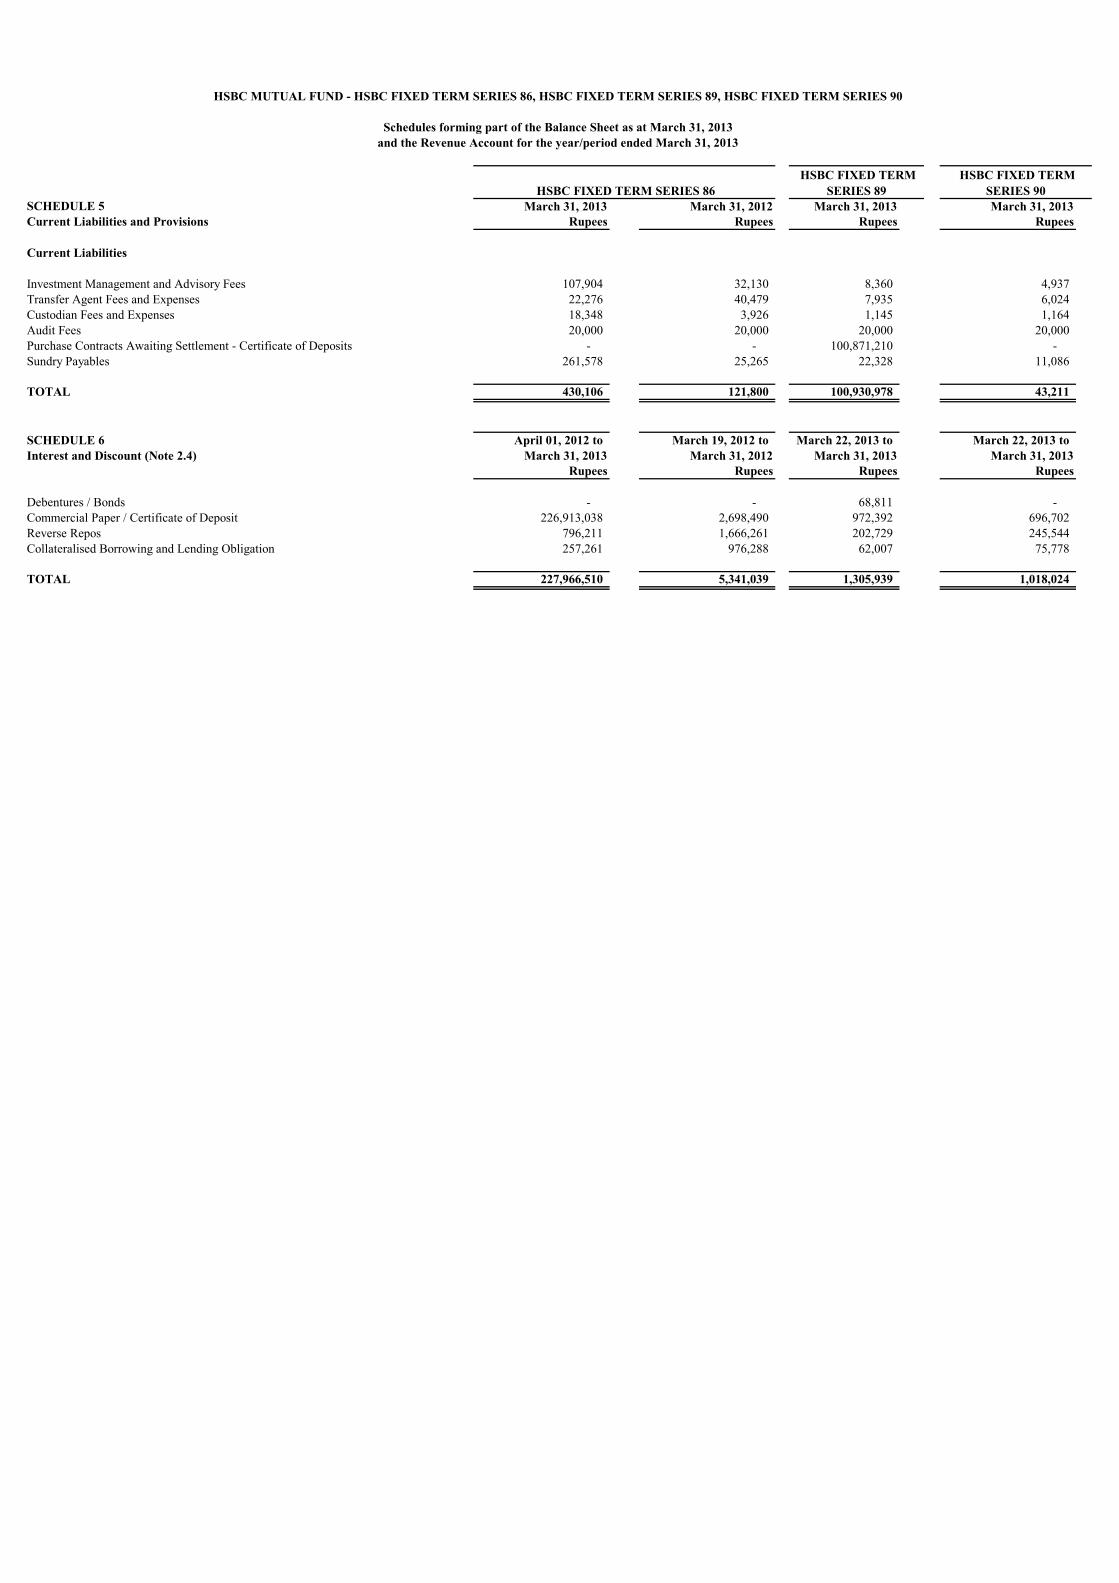
SCHEDULE 5 March 31, 2013 March 31, 2012 March 31, 2013 March 31, 2013Current Liabilities and Provisions Rupees Rupees Rupees Rupees
Current Liabilities
Investment Management and Advisory Fees 107,904 32,130 8,360 4,937 Transfer Agent Fees and Expenses 22,276 40,479 7,935 6,024 Custodian Fees and Expenses 18,348 3,926 1,145 1,164 Audit Fees 20,000 20,000 20,000 20,000 Purchase Contracts Awaiting Settlement - Certificate of Deposits - - 100,871,210 - Sundry Payables 261,578 25,265 22,328 11,086
TOTAL 430,106 121,800 100,930,978 43,211
SCHEDULE 6 April 01, 2012 to March 19, 2012 to March 22, 2013 to March 22, 2013 toInterest and Discount (Note 2.4) March 31, 2013 March 31, 2012 March 31, 2013 March 31, 2013
Rupees Rupees Rupees Rupees
Debentures / Bonds - - 68,811 - Commercial Paper / Certificate of Deposit 226,913,038 2,698,490 972,392 696,702 Reverse Repos 796,211 1,666,261 202,729 245,544 Collateralised Borrowing and Lending Obligation 257,261 976,288 62,007 75,778
TOTAL 227,966,510 5,341,039 1,305,939 1,018,024
HSBC MUTUAL FUND - HSBC FIXED TERM SERIES 86, HSBC FIXED TERM SERIES 89, HSBC FIXED TERM SERIES 90
Schedules forming part of the Balance Sheet as at March 31, 2013and the Revenue Account for the year/period ended March 31, 2013
HSBC FIXED TERM SERIES 86 HSBC FIXED TERM
SERIES 89 HSBC FIXED TERM
SERIES 90

Description Quantity Market / Fair ValueRupees
Commercial Papers/Certificate of Deposits (100.00%)Certificate of Deposits (100.00%)
Bank of Maharashtra 2013 $ 4,720 471,793,457
IDBI Bank Limited 2013 $ 4,500 449,867,717
Syndicate Bank 2013 $ 4,300 429,888,712
Canara Bank 2013 $ 3,600 359,891,711
Dena Bank 2013 $ 2,500 249,935,961
1,961,377,558Total (Cost Rs. 1,961,426,464) 1,961,377,558TOTAL INVESTMENTS (Cost Rs. 1,961,426,464) 1,961,377,558
There were no derivative transactions during the year.
(Referred to in Schedule 1 to the Balance Sheet as at March 31, 2013 and the Revenue Accountfor the year ended March 31, 2013)
Confirmation has been received from J P Morgan Chase Bank, Mumbai Branch at the end of the financial year for the investments held by them.
HSBC FIXED TERM SERIES 86
Statement of Portfolio Holding as at March 31, 2013
$ Fair value of non traded debt securities as determined by HSBC Asset Management (India) Private Limited under procedures approved by the Board of Trustees in accordance with the guidelines for valuation of securities for Mutual funds as applicable issued by SEBI.
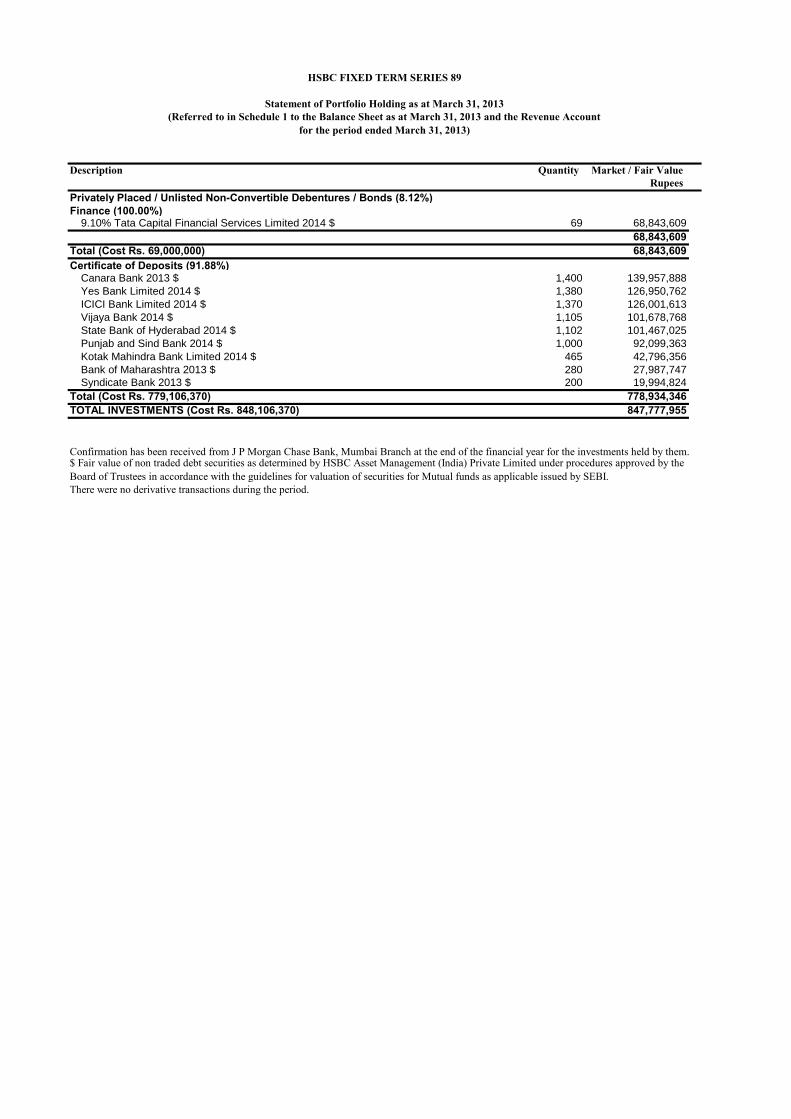
Description Quantity Market / Fair ValueRupees
Privately Placed / Unlisted Non-Convertible Debentures / Bonds (8.12%)Finance (100.00%)
9.10% Tata Capital Financial Services Limited 2014 $ 69 68,843,609
68,843,609Total (Cost Rs. 69,000,000) 68,843,609Certificate of Deposits (91.88%)
Canara Bank 2013 $ 1,400 139,957,888
Yes Bank Limited 2014 $ 1,380 126,950,762
ICICI Bank Limited 2014 $ 1,370 126,001,613
Vijaya Bank 2014 $ 1,105 101,678,768
State Bank of Hyderabad 2014 $ 1,102 101,467,025
Punjab and Sind Bank 2014 $ 1,000 92,099,363
Kotak Mahindra Bank Limited 2014 $ 465 42,796,356
Bank of Maharashtra 2013 $ 280 27,987,747
Syndicate Bank 2013 $ 200 19,994,824
Total (Cost Rs. 779,106,370) 778,934,346TOTAL INVESTMENTS (Cost Rs. 848,106,370) 847,777,955
(Referred to in Schedule 1 to the Balance Sheet as at March 31, 2013 and the Revenue Accountfor the period ended March 31, 2013)
Confirmation has been received from J P Morgan Chase Bank, Mumbai Branch at the end of the financial year for the investments held by them.
There were no derivative transactions during the period.
HSBC FIXED TERM SERIES 89
Statement of Portfolio Holding as at March 31, 2013
$ Fair value of non traded debt securities as determined by HSBC Asset Management (India) Private Limited under procedures approved by the Board of Trustees in accordance with the guidelines for valuation of securities for Mutual funds as applicable issued by SEBI.

Description Quantity Market / Fair ValueRupees
Commercial Papers/Certificate of Deposits (100.00%)Certificate of Deposits (100.00%)
State Bank of Hyderabad 2014 $ 1,398 128,721,326
Vijaya Bank 2014 $ 1,395 128,363,694
Yes Bank Limited 2014 $ 1,050 96,592,971
ICICI Bank Limited 2014 $ 1,050 96,570,579
Kotak Mahindra Bank Limited 2014 $ 1,048 96,452,863
Punjab and Sind Bank 2014 $ 1,040 95,783,338
642,484,771Total (Cost Rs. 642,682,157) 642,484,771TOTAL INVESTMENTS (Cost Rs. 642,682,157) 642,484,771
HSBC FIXED TERM SERIES 90
$ Fair value of non traded debt securities as determined by HSBC Asset Management (India) Private Limited under procedures approved by the Board of Trustees in accordance with the guidelines for valuation of securities for Mutual funds as applicable issued by SEBI.
(Referred to in Schedule 1 to the Balance Sheet as at March 31, 2013 and the Revenue Accountfor the period ended March 31, 2013)
Confirmation has been received from J P Morgan Chase Bank, Mumbai Branch at the end of the financial year for the investments held by them.
There were no derivative transactions during the period.
Statement of Portfolio Holding as at March 31, 2013
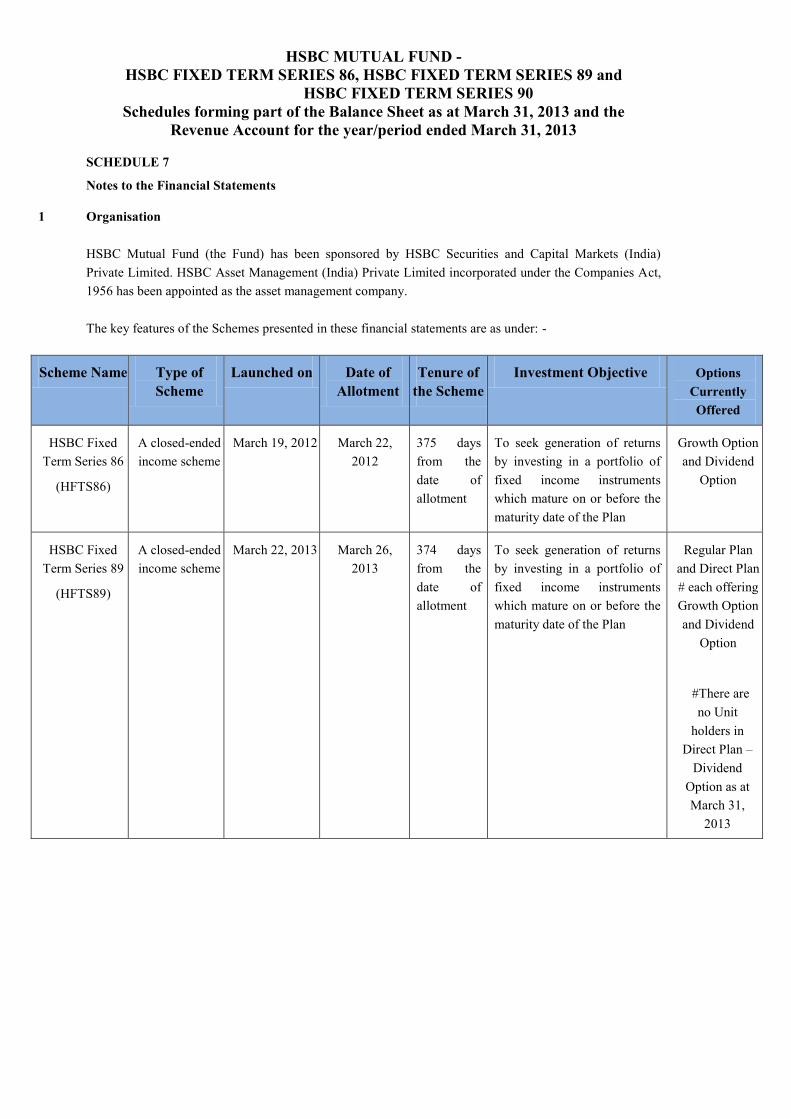
HSBC MUTUAL FUND - HSBC FIXED TERM SERIES 86, HSBC FIXED TERM SERIES 89 and
HSBC FIXED TERM SERIES 90 Schedules forming part of the Balance Sheet as at March 31, 2013 and the
Revenue Account for the year/period ended March 31, 2013
SCHEDULE 7
Notes to the Financial Statements 1 Organisation
HSBC Mutual Fund (the Fund) has been sponsored by HSBC Securities and Capital Markets (India) Private Limited. HSBC Asset Management (India) Private Limited incorporated under the Companies Act, 1956 has been appointed as the asset management company. The key features of the Schemes presented in these financial statements are as under: -
Scheme Name Type of Scheme
Launched on Date of Allotment
Tenure of the Scheme
Investment Objective Options Currently Offered
HSBC Fixed Term Series 86
(HFTS86)
A closed-ended income scheme
March 19, 2012 March 22, 2012
375 days from the date of allotment
To seek generation of returns by investing in a portfolio of fixed income instruments which mature on or before the maturity date of the Plan
Growth Option and Dividend
Option
HSBC Fixed Term Series 89
(HFTS89)
A closed-ended income scheme
March 22, 2013 March 26, 2013
374 days from the date of allotment
To seek generation of returns by investing in a portfolio of fixed income instruments which mature on or before the maturity date of the Plan
Regular Plan and Direct Plan # each offering Growth Option and Dividend
Option
#There are no Unit
holders in Direct Plan –
Dividend Option as at March 31,
2013
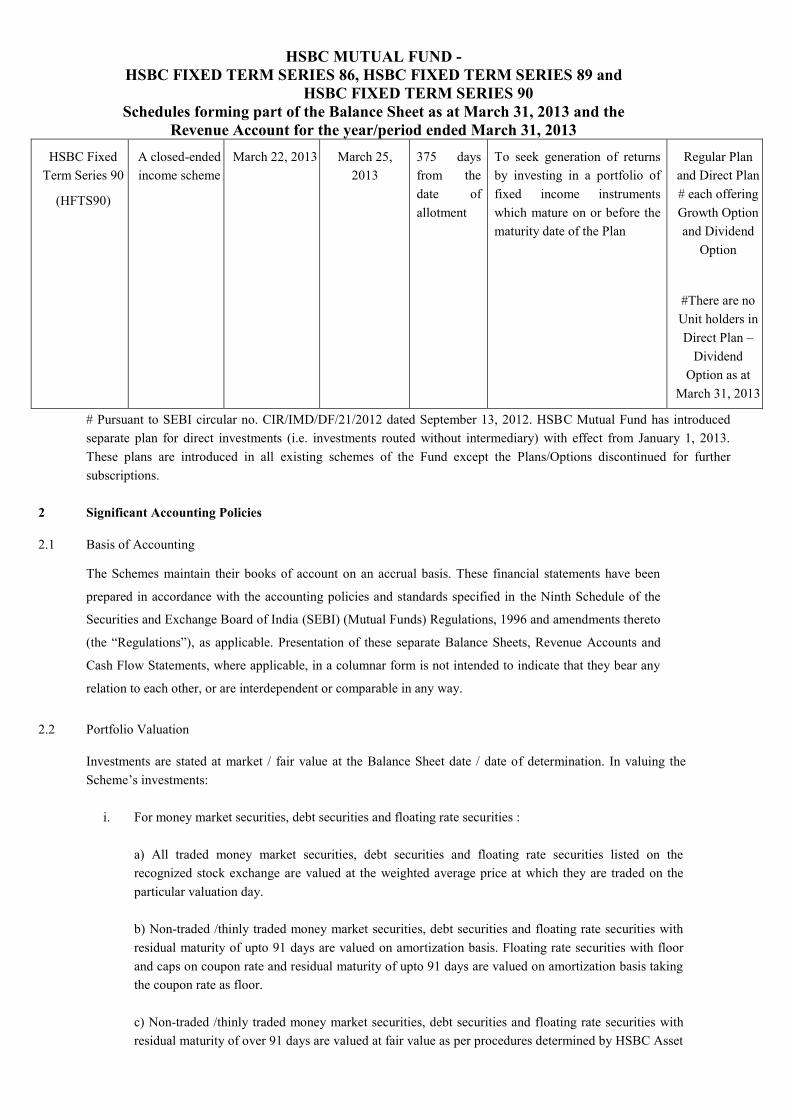
HSBC MUTUAL FUND - HSBC FIXED TERM SERIES 86, HSBC FIXED TERM SERIES 89 and
HSBC FIXED TERM SERIES 90 Schedules forming part of the Balance Sheet as at March 31, 2013 and the
Revenue Account for the year/period ended March 31, 2013
HSBC Fixed Term Series 90
(HFTS90)
A closed-ended income scheme
March 22, 2013 March 25, 2013
375 days from the date of allotment
To seek generation of returns by investing in a portfolio of fixed income instruments which mature on or before the maturity date of the Plan
Regular Plan and Direct Plan # each offering Growth Option and Dividend
Option
#There are no Unit holders in Direct Plan –
Dividend Option as at
March 31, 2013
# Pursuant to SEBI circular no. CIR/IMD/DF/21/2012 dated September 13, 2012. HSBC Mutual Fund has introduced separate plan for direct investments (i.e. investments routed without intermediary) with effect from January 1, 2013. These plans are introduced in all existing schemes of the Fund except the Plans/Options discontinued for further subscriptions.
2 Significant Accounting Policies 2.1 Basis of Accounting
The Schemes maintain their books of account on an accrual basis. These financial statements have been
prepared in accordance with the accounting policies and standards specified in the Ninth Schedule of the
Securities and Exchange Board of India (SEBI) (Mutual Funds) Regulations, 1996 and amendments thereto
(the “Regulations”), as applicable. Presentation of these separate Balance Sheets, Revenue Accounts and
Cash Flow Statements, where applicable, in a columnar form is not intended to indicate that they bear any
relation to each other, or are interdependent or comparable in any way.
2.2 Portfolio Valuation
Investments are stated at market / fair value at the Balance Sheet date / date of determination. In valuing the Scheme’s investments:
i. For money market securities, debt securities and floating rate securities : a) All traded money market securities, debt securities and floating rate securities listed on the recognized stock exchange are valued at the weighted average price at which they are traded on the particular valuation day. b) Non-traded /thinly traded money market securities, debt securities and floating rate securities with residual maturity of upto 91 days are valued on amortization basis. Floating rate securities with floor and caps on coupon rate and residual maturity of upto 91 days are valued on amortization basis taking the coupon rate as floor. c) Non-traded /thinly traded money market securities, debt securities and floating rate securities with residual maturity of over 91 days are valued at fair value as per procedures determined by HSBC Asset
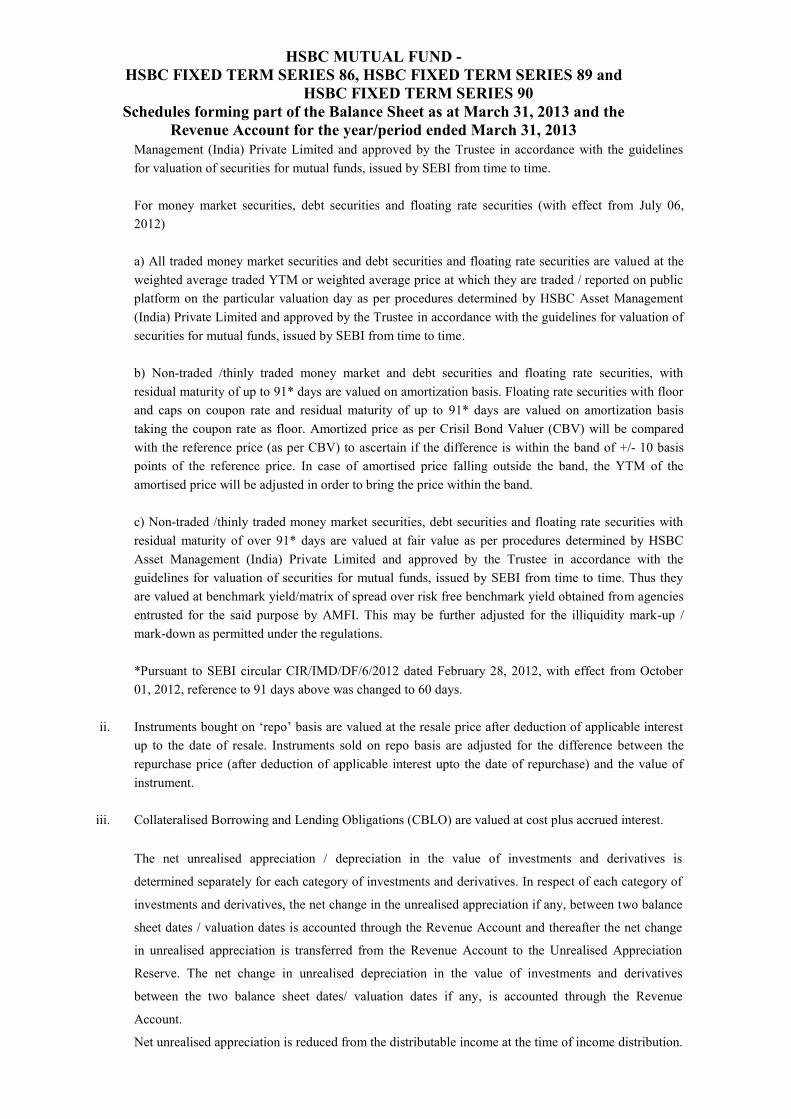
HSBC MUTUAL FUND - HSBC FIXED TERM SERIES 86, HSBC FIXED TERM SERIES 89 and
HSBC FIXED TERM SERIES 90 Schedules forming part of the Balance Sheet as at March 31, 2013 and the
Revenue Account for the year/period ended March 31, 2013
Management (India) Private Limited and approved by the Trustee in accordance with the guidelines for valuation of securities for mutual funds, issued by SEBI from time to time. For money market securities, debt securities and floating rate securities (with effect from July 06, 2012) a) All traded money market securities and debt securities and floating rate securities are valued at the weighted average traded YTM or weighted average price at which they are traded / reported on public platform on the particular valuation day as per procedures determined by HSBC Asset Management (India) Private Limited and approved by the Trustee in accordance with the guidelines for valuation of securities for mutual funds, issued by SEBI from time to time. b) Non-traded /thinly traded money market and debt securities and floating rate securities, with residual maturity of up to 91* days are valued on amortization basis. Floating rate securities with floor and caps on coupon rate and residual maturity of up to 91* days are valued on amortization basis taking the coupon rate as floor. Amortized price as per Crisil Bond Valuer (CBV) will be compared with the reference price (as per CBV) to ascertain if the difference is within the band of +/- 10 basis points of the reference price. In case of amortised price falling outside the band, the YTM of the amortised price will be adjusted in order to bring the price within the band. c) Non-traded /thinly traded money market securities, debt securities and floating rate securities with residual maturity of over 91* days are valued at fair value as per procedures determined by HSBC Asset Management (India) Private Limited and approved by the Trustee in accordance with the guidelines for valuation of securities for mutual funds, issued by SEBI from time to time. Thus they are valued at benchmark yield/matrix of spread over risk free benchmark yield obtained from agencies entrusted for the said purpose by AMFI. This may be further adjusted for the illiquidity mark-up / mark-down as permitted under the regulations. *Pursuant to SEBI circular CIR/IMD/DF/6/2012 dated February 28, 2012, with effect from October 01, 2012, reference to 91 days above was changed to 60 days.
ii. Instruments bought on ‘repo’ basis are valued at the resale price after deduction of applicable interest up to the date of resale. Instruments sold on repo basis are adjusted for the difference between the repurchase price (after deduction of applicable interest upto the date of repurchase) and the value of instrument.
iii. Collateralised Borrowing and Lending Obligations (CBLO) are valued at cost plus accrued interest.
The net unrealised appreciation / depreciation in the value of investments and derivatives is
determined separately for each category of investments and derivatives. In respect of each category of
investments and derivatives, the net change in the unrealised appreciation if any, between two balance
sheet dates / valuation dates is accounted through the Revenue Account and thereafter the net change
in unrealised appreciation is transferred from the Revenue Account to the Unrealised Appreciation
Reserve. The net change in unrealised depreciation in the value of investments and derivatives
between the two balance sheet dates/ valuation dates if any, is accounted through the Revenue
Account.
Net unrealised appreciation is reduced from the distributable income at the time of income distribution.
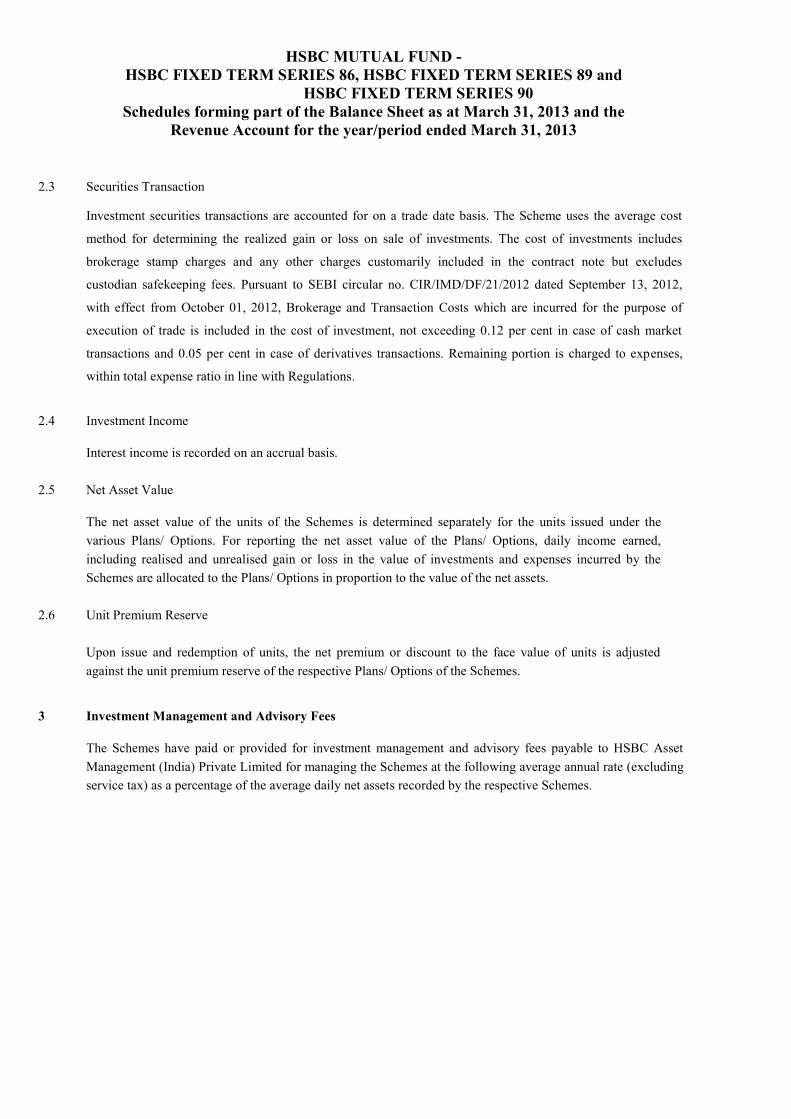
HSBC MUTUAL FUND - HSBC FIXED TERM SERIES 86, HSBC FIXED TERM SERIES 89 and
HSBC FIXED TERM SERIES 90 Schedules forming part of the Balance Sheet as at March 31, 2013 and the
Revenue Account for the year/period ended March 31, 2013
2.3 Securities Transaction
Investment securities transactions are accounted for on a trade date basis. The Scheme uses the average cost
method for determining the realized gain or loss on sale of investments. The cost of investments includes
brokerage stamp charges and any other charges customarily included in the contract note but excludes
custodian safekeeping fees. Pursuant to SEBI circular no. CIR/IMD/DF/21/2012 dated September 13, 2012,
with effect from October 01, 2012, Brokerage and Transaction Costs which are incurred for the purpose of
execution of trade is included in the cost of investment, not exceeding 0.12 per cent in case of cash market
transactions and 0.05 per cent in case of derivatives transactions. Remaining portion is charged to expenses,
within total expense ratio in line with Regulations.
2.4 Investment Income
Interest income is recorded on an accrual basis.
2.5 Net Asset Value
The net asset value of the units of the Schemes is determined separately for the units issued under the various Plans/ Options. For reporting the net asset value of the Plans/ Options, daily income earned, including realised and unrealised gain or loss in the value of investments and expenses incurred by the Schemes are allocated to the Plans/ Options in proportion to the value of the net assets.
2.6 Unit Premium Reserve Upon issue and redemption of units, the net premium or discount to the face value of units is adjusted
against the unit premium reserve of the respective Plans/ Options of the Schemes. 3 Investment Management and Advisory Fees
The Schemes have paid or provided for investment management and advisory fees payable to HSBC Asset Management (India) Private Limited for managing the Schemes at the following average annual rate (excluding service tax) as a percentage of the average daily net assets recorded by the respective Schemes.

HSBC MUTUAL FUND - HSBC FIXED TERM SERIES 86, HSBC FIXED TERM SERIES 89 and
HSBC FIXED TERM SERIES 90 Schedules forming part of the Balance Sheet as at March 31, 2013 and the
Revenue Account for the year/period ended March 31, 2013
* Annualised All costs, charges and expenses incurred by HSBC Asset Management (India) Private Limited in the administration and execution of the activities of the Schemes, except costs allowed to be charged to the Scheme under the Regulations, are on their own account for which they receive investment management and advisory fees.
4 Trusteeship Fees
In accordance with the Deed of Trust dated February 7, 2002 between HSBC Securities and Capital Markets
(India) Private Limited (“The Settlor”) and the Board of Trustees of HSBC Mutual Fund, the Schemes have paid
or provided for a fee not exceeding Rs.40,000 (March 31, 2012 Rs .20,000) for each meeting of the Board of
Trustees attended by such Trustee not affiliated with the Settlor.
5 Custodian Fees
JP Morgan Chase Bank provides custodial services to the Schemes for which it receives custody fees
including safekeeping (including transaction and registration charges).
5A Custodian Confirmation
Confirmation has been received from JPMorgan Chase Bank at the end of the year/period for the
investments held by the Schemes. All investments, except Government Securities, Reverse Repos and
Collateralised Borrowing and Lending Obligation (CBLO), units of mutual fund are held in safe custody of
the custodian. 6 Income Taxes
No provision for income tax is made as the Schemes qualify as a recognized mutual fund under Section 10(23D) of the Income Tax Act, 1961.
7 Limitation on Expenses
The total expenses chargeable to Schemes are limited to percentage of average daily net assets of Schemes. HSBC Asset Management (India) Private Limited has borne following amounts of expenses in excess of the
Name of the Scheme
Average daily net assets for the year/period ended
Investment Management Fees charged during the year/
period (excluding service tax)
Percentage of Management Fees
charged
March 31, 2013 (Rupees)
March 31, 2012 (Rupees)
March 31, 2013 (Rupees)
March 31, 2012 (Rupees)
March 31, 2013
March 31, 2012
HFTS86 2,284,797,091 2,161,784,007 1,358,906 32,130 0.06 0.05* HFTS89 847,642,317 NA 8,360 NA 0.04* NA HFTS90 643,539,368 NA 4,937 NA 0.03* NA
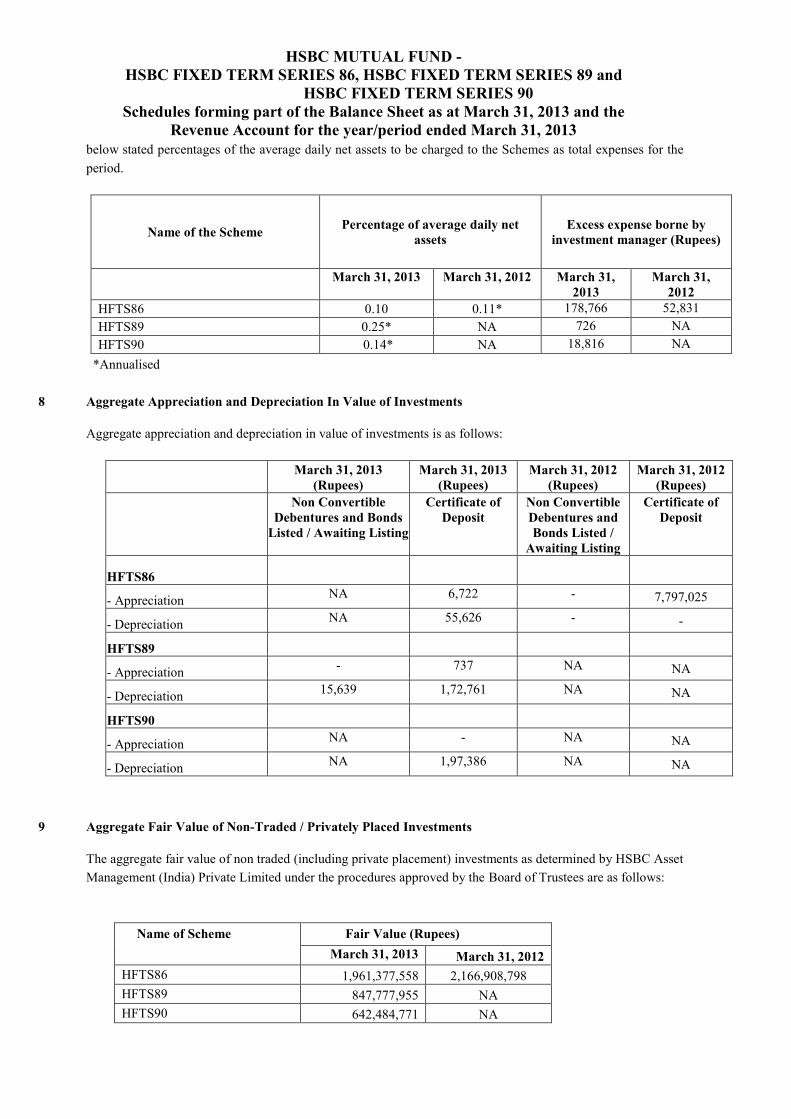
HSBC MUTUAL FUND - HSBC FIXED TERM SERIES 86, HSBC FIXED TERM SERIES 89 and
HSBC FIXED TERM SERIES 90 Schedules forming part of the Balance Sheet as at March 31, 2013 and the
Revenue Account for the year/period ended March 31, 2013
below stated percentages of the average daily net assets to be charged to the Schemes as total expenses for the period.
Name of the Scheme Percentage of average daily net assets
Excess expense borne by investment manager (Rupees)
March 31, 2013 March 31, 2012 March 31, 2013
March 31, 2012
HFTS86 0.10 0.11* 178,766 52,831 HFTS89 0.25* NA 726 NA HFTS90 0.14* NA 18,816 NA
*Annualised 8 Aggregate Appreciation and Depreciation In Value of Investments Aggregate appreciation and depreciation in value of investments is as follows:
March 31, 2013
(Rupees) March 31, 2013
(Rupees) March 31, 2012
(Rupees) March 31, 2012
(Rupees) Non Convertible
Debentures and Bonds Listed / Awaiting Listing
Certificate of Deposit
Non Convertible Debentures and Bonds Listed /
Awaiting Listing
Certificate of Deposit
HFTS86
- Appreciation NA 6,722 - 7,797,025
- Depreciation NA 55,626 - -
HFTS89
- Appreciation - 737 NA NA
- Depreciation 15,639 1,72,761 NA NA
HFTS90
- Appreciation NA - NA NA
- Depreciation NA 1,97,386 NA NA 9 Aggregate Fair Value of Non-Traded / Privately Placed Investments
The aggregate fair value of non traded (including private placement) investments as determined by HSBC Asset Management (India) Private Limited under the procedures approved by the Board of Trustees are as follows:
Name of Scheme Fair Value (Rupees) March 31, 2013 March 31, 2012
HFTS86 1,961,377,558 2,166,908,798 HFTS89 847,777,955 NA HFTS90 642,484,771 NA
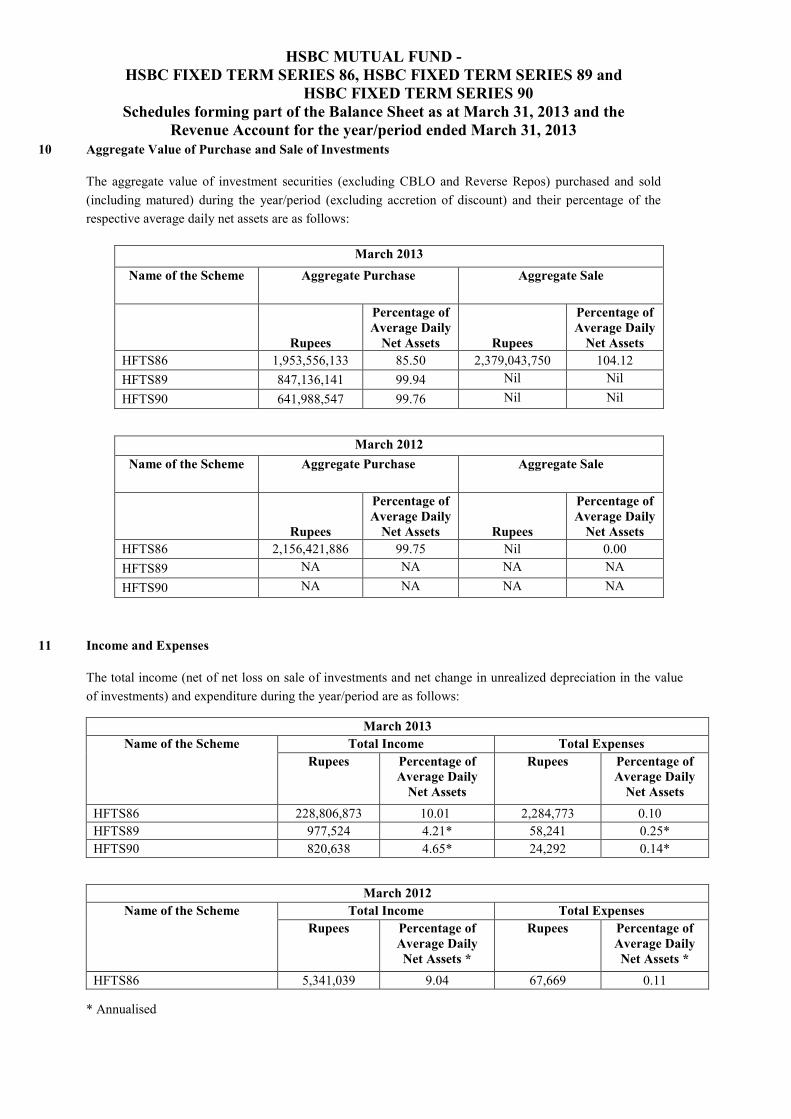
HSBC MUTUAL FUND - HSBC FIXED TERM SERIES 86, HSBC FIXED TERM SERIES 89 and
HSBC FIXED TERM SERIES 90 Schedules forming part of the Balance Sheet as at March 31, 2013 and the
Revenue Account for the year/period ended March 31, 2013
10 Aggregate Value of Purchase and Sale of Investments
The aggregate value of investment securities (excluding CBLO and Reverse Repos) purchased and sold (including matured) during the year/period (excluding accretion of discount) and their percentage of the respective average daily net assets are as follows:
March 2013 Name of the Scheme Aggregate Purchase Aggregate Sale
Rupees
Percentage of Average Daily
Net Assets Rupees
Percentage of Average Daily
Net Assets HFTS86 1,953,556,133 85.50 2,379,043,750 104.12 HFTS89 847,136,141 99.94 Nil Nil HFTS90 641,988,547 99.76 Nil Nil
March 2012 Name of the Scheme Aggregate Purchase Aggregate Sale
Rupees
Percentage of Average Daily
Net Assets Rupees
Percentage of Average Daily
Net Assets HFTS86 2,156,421,886 99.75 Nil 0.00 HFTS89 NA NA NA NA HFTS90 NA NA NA NA
11 Income and Expenses
The total income (net of net loss on sale of investments and net change in unrealized depreciation in the value of investments) and expenditure during the year/period are as follows:
March 2013
Name of the Scheme Total Income Total Expenses Rupees Percentage of
Average Daily Net Assets
Rupees Percentage of Average Daily
Net Assets HFTS86 228,806,873 10.01 2,284,773 0.10 HFTS89 977,524 4.21* 58,241 0.25* HFTS90 820,638 4.65* 24,292 0.14*
March 2012 Name of the Scheme Total Income Total Expenses
Rupees Percentage of Average Daily Net Assets *
Rupees Percentage of Average Daily Net Assets *
HFTS86 5,341,039 9.04 67,669 0.11 * Annualised

HSBC MUTUAL FUND - HSBC FIXED TERM SERIES 86, HSBC FIXED TERM SERIES 89 and
HSBC FIXED TERM SERIES 90 Schedules forming part of the Balance Sheet as at March 31, 2013 and the
Revenue Account for the year/period ended March 31, 2013
12 Initial Contribution
The initial contribution of Rs. 100,000 made by the sponsor, HSBC Securities and Capital Markets (India) Private Limited is recorded in the books of account of HSBC Mutual Fund, the Trust.
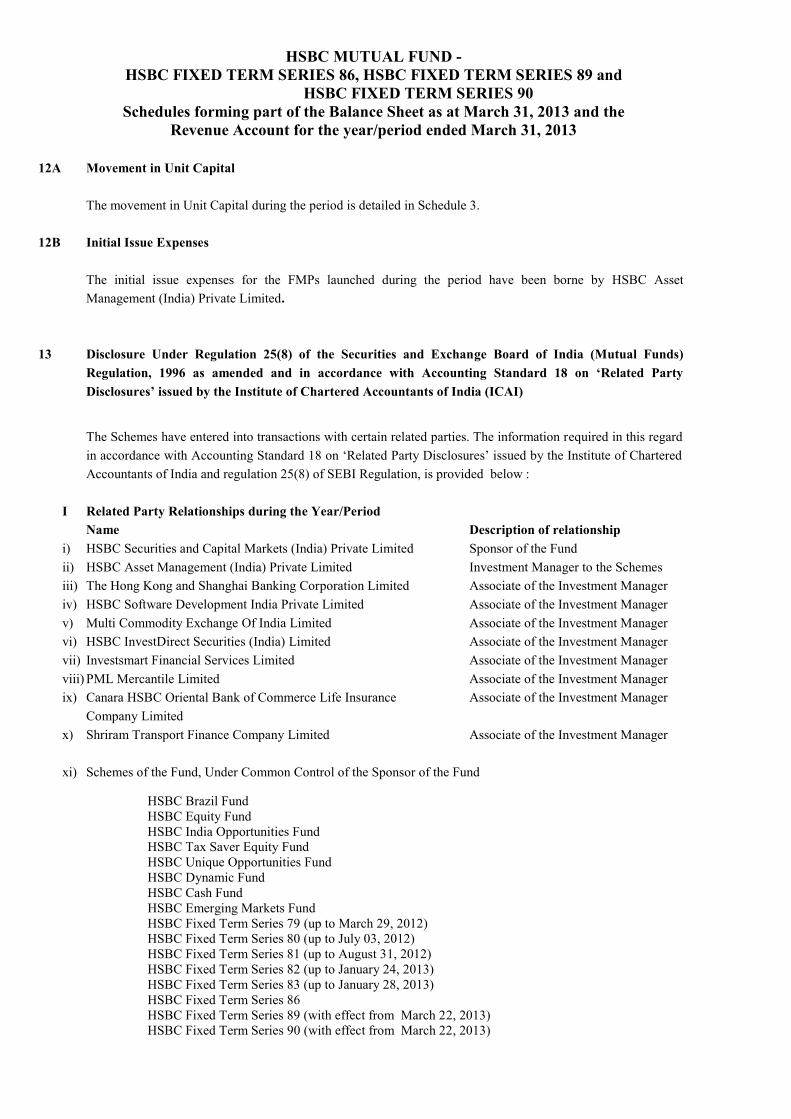
HSBC MUTUAL FUND - HSBC FIXED TERM SERIES 86, HSBC FIXED TERM SERIES 89 and
HSBC FIXED TERM SERIES 90 Schedules forming part of the Balance Sheet as at March 31, 2013 and the
Revenue Account for the year/period ended March 31, 2013
12A Movement in Unit Capital The movement in Unit Capital during the period is detailed in Schedule 3.
12B Initial Issue Expenses The initial issue expenses for the FMPs launched during the period have been borne by HSBC Asset
Management (India) Private Limited. 13 Disclosure Under Regulation 25(8) of the Securities and Exchange Board of India (Mutual Funds)
Regulation, 1996 as amended and in accordance with Accounting Standard 18 on ‘Related Party Disclosures’ issued by the Institute of Chartered Accountants of India (ICAI)
The Schemes have entered into transactions with certain related parties. The information required in this regard in accordance with Accounting Standard 18 on ‘Related Party Disclosures’ issued by the Institute of Chartered Accountants of India and regulation 25(8) of SEBI Regulation, is provided below :
I Related Party Relationships during the Year/Period Name Description of relationship i) HSBC Securities and Capital Markets (India) Private Limited Sponsor of the Fund ii) HSBC Asset Management (India) Private Limited Investment Manager to the Schemes iii) The Hong Kong and Shanghai Banking Corporation Limited Associate of the Investment Manager iv) HSBC Software Development India Private Limited Associate of the Investment Manager v) Multi Commodity Exchange Of India Limited Associate of the Investment Manager vi) HSBC InvestDirect Securities (India) Limited Associate of the Investment Manager vii) Investsmart Financial Services Limited Associate of the Investment Manager viii) PML Mercantile Limited Associate of the Investment Manager ix) Canara HSBC Oriental Bank of Commerce Life Insurance Associate of the Investment Manager Company Limited x) Shriram Transport Finance Company Limited Associate of the Investment Manager xi) Schemes of the Fund, Under Common Control of the Sponsor of the Fund
HSBC Brazil Fund HSBC Equity Fund HSBC India Opportunities Fund HSBC Tax Saver Equity Fund HSBC Unique Opportunities Fund HSBC Dynamic Fund HSBC Cash Fund HSBC Emerging Markets Fund HSBC Fixed Term Series 79 (up to March 29, 2012) HSBC Fixed Term Series 80 (up to July 03, 2012) HSBC Fixed Term Series 81 (up to August 31, 2012) HSBC Fixed Term Series 82 (up to January 24, 2013) HSBC Fixed Term Series 83 (up to January 28, 2013) HSBC Fixed Term Series 86 HSBC Fixed Term Series 89 (with effect from March 22, 2013) HSBC Fixed Term Series 90 (with effect from March 22, 2013)
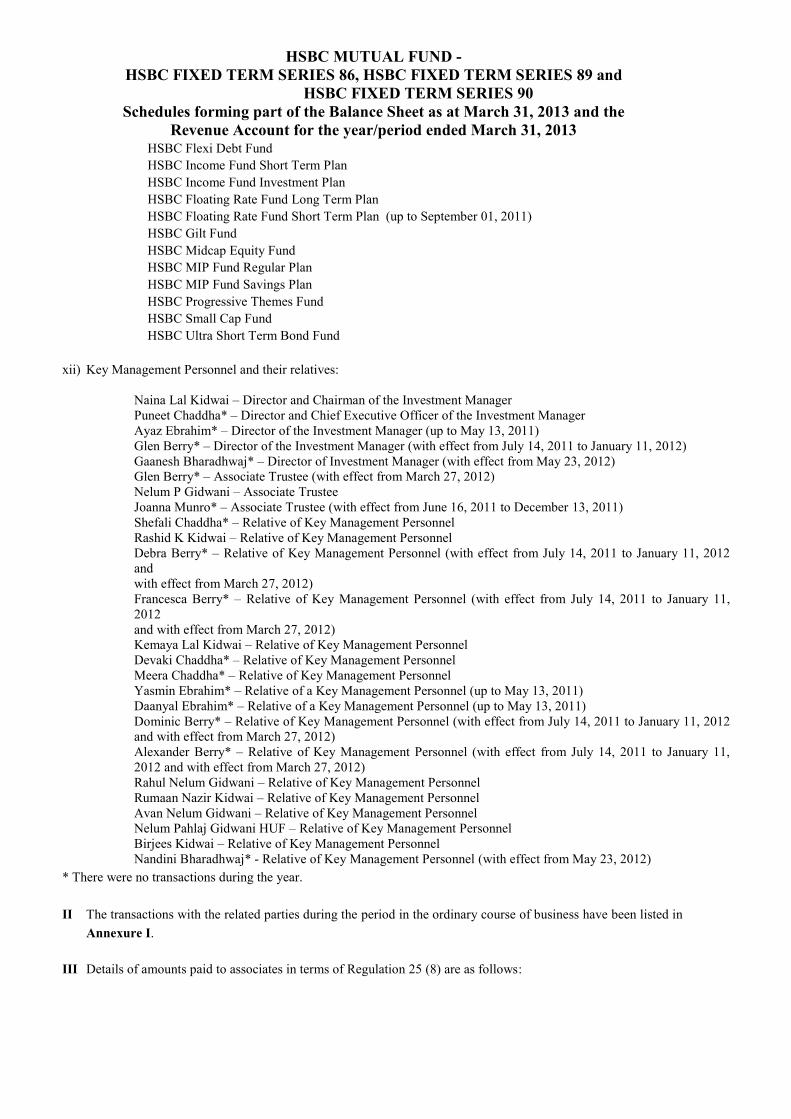
HSBC MUTUAL FUND - HSBC FIXED TERM SERIES 86, HSBC FIXED TERM SERIES 89 and
HSBC FIXED TERM SERIES 90 Schedules forming part of the Balance Sheet as at March 31, 2013 and the
Revenue Account for the year/period ended March 31, 2013
HSBC Flexi Debt Fund HSBC Income Fund Short Term Plan HSBC Income Fund Investment Plan HSBC Floating Rate Fund Long Term Plan HSBC Floating Rate Fund Short Term Plan (up to September 01, 2011) HSBC Gilt Fund HSBC Midcap Equity Fund HSBC MIP Fund Regular Plan HSBC MIP Fund Savings Plan HSBC Progressive Themes Fund HSBC Small Cap Fund HSBC Ultra Short Term Bond Fund
xii) Key Management Personnel and their relatives:
Naina Lal Kidwai – Director and Chairman of the Investment Manager Puneet Chaddha* – Director and Chief Executive Officer of the Investment Manager Ayaz Ebrahim* – Director of the Investment Manager (up to May 13, 2011) Glen Berry* – Director of the Investment Manager (with effect from July 14, 2011 to January 11, 2012) Gaanesh Bharadhwaj* – Director of Investment Manager (with effect from May 23, 2012) Glen Berry* – Associate Trustee (with effect from March 27, 2012) Nelum P Gidwani – Associate Trustee Joanna Munro* – Associate Trustee (with effect from June 16, 2011 to December 13, 2011) Shefali Chaddha* – Relative of Key Management Personnel Rashid K Kidwai – Relative of Key Management Personnel Debra Berry* – Relative of Key Management Personnel (with effect from July 14, 2011 to January 11, 2012 and with effect from March 27, 2012) Francesca Berry* – Relative of Key Management Personnel (with effect from July 14, 2011 to January 11, 2012 and with effect from March 27, 2012) Kemaya Lal Kidwai – Relative of Key Management Personnel Devaki Chaddha* – Relative of Key Management Personnel Meera Chaddha* – Relative of Key Management Personnel Yasmin Ebrahim* – Relative of a Key Management Personnel (up to May 13, 2011) Daanyal Ebrahim* – Relative of a Key Management Personnel (up to May 13, 2011) Dominic Berry* – Relative of Key Management Personnel (with effect from July 14, 2011 to January 11, 2012 and with effect from March 27, 2012) Alexander Berry* – Relative of Key Management Personnel (with effect from July 14, 2011 to January 11, 2012 and with effect from March 27, 2012) Rahul Nelum Gidwani – Relative of Key Management Personnel Rumaan Nazir Kidwai – Relative of Key Management Personnel Avan Nelum Gidwani – Relative of Key Management Personnel Nelum Pahlaj Gidwani HUF – Relative of Key Management Personnel Birjees Kidwai – Relative of Key Management Personnel Nandini Bharadhwaj* - Relative of Key Management Personnel (with effect from May 23, 2012)
* There were no transactions during the year. II The transactions with the related parties during the period in the ordinary course of business have been listed in
Annexure I.
III Details of amounts paid to associates in terms of Regulation 25 (8) are as follows:
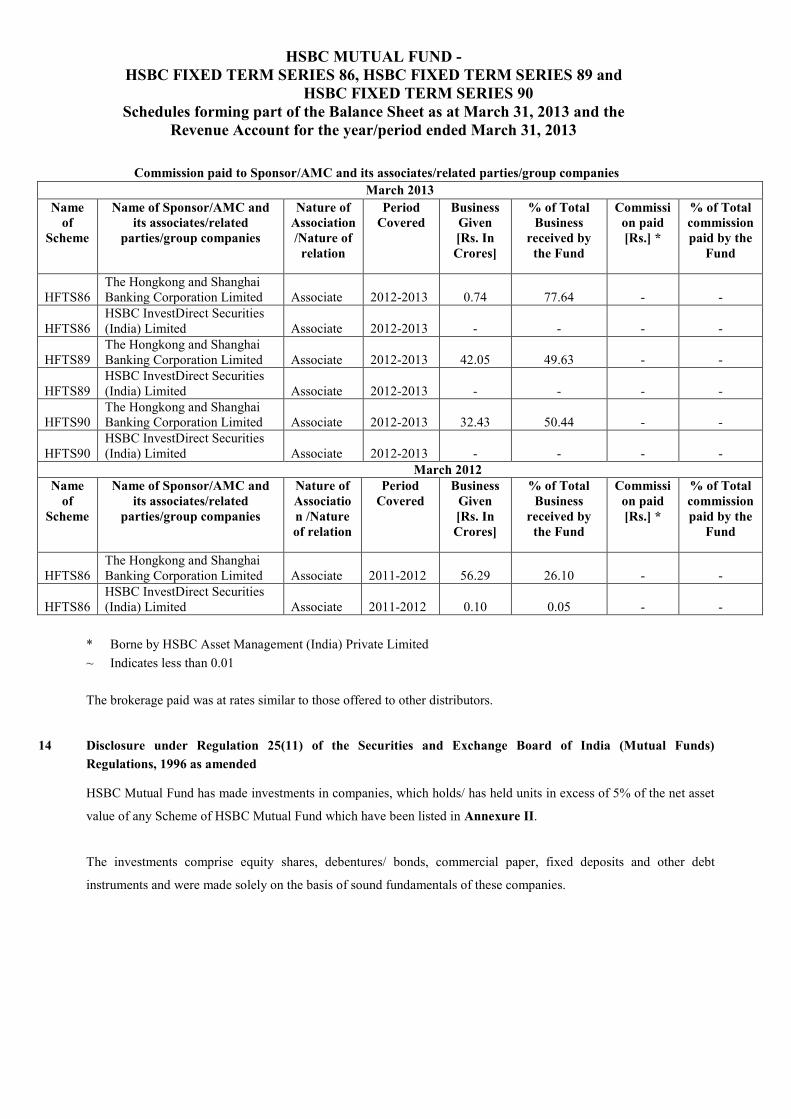
HSBC MUTUAL FUND - HSBC FIXED TERM SERIES 86, HSBC FIXED TERM SERIES 89 and
HSBC FIXED TERM SERIES 90 Schedules forming part of the Balance Sheet as at March 31, 2013 and the
Revenue Account for the year/period ended March 31, 2013
Commission paid to Sponsor/AMC and its associates/related parties/group companies
March 2013 Name
of Scheme
Name of Sponsor/AMC and its associates/related
parties/group companies
Nature of Association /Nature of
relation
Period Covered
Business Given [Rs. In Crores]
% of Total Business
received by the Fund
Commission paid [Rs.] *
% of Total commission paid by the
Fund
HFTS86 The Hongkong and Shanghai Banking Corporation Limited Associate 2012-2013 0.74 77.64 - -
HFTS86 HSBC InvestDirect Securities (India) Limited Associate 2012-2013 - - - -
HFTS89 The Hongkong and Shanghai Banking Corporation Limited Associate 2012-2013 42.05 49.63 - -
HFTS89 HSBC InvestDirect Securities (India) Limited Associate 2012-2013 - - - -
HFTS90 The Hongkong and Shanghai Banking Corporation Limited Associate 2012-2013 32.43 50.44 - -
HFTS90 HSBC InvestDirect Securities (India) Limited Associate 2012-2013 - - - -
March 2012 Name
of Scheme
Name of Sponsor/AMC and its associates/related
parties/group companies
Nature of Association /Nature of relation
Period Covered
Business Given [Rs. In Crores]
% of Total Business
received by the Fund
Commission paid [Rs.] *
% of Total commission paid by the
Fund
HFTS86 The Hongkong and Shanghai Banking Corporation Limited Associate 2011-2012 56.29 26.10 - -
HFTS86 HSBC InvestDirect Securities (India) Limited Associate 2011-2012 0.10 0.05 - -
* Borne by HSBC Asset Management (India) Private Limited ~ Indicates less than 0.01 The brokerage paid was at rates similar to those offered to other distributors.
14 Disclosure under Regulation 25(11) of the Securities and Exchange Board of India (Mutual Funds)
Regulations, 1996 as amended
HSBC Mutual Fund has made investments in companies, which holds/ has held units in excess of 5% of the net asset
value of any Scheme of HSBC Mutual Fund which have been listed in Annexure II.
The investments comprise equity shares, debentures/ bonds, commercial paper, fixed deposits and other debt
instruments and were made solely on the basis of sound fundamentals of these companies.

HSBC MUTUAL FUND - HSBC FIXED TERM SERIES 86, HSBC FIXED TERM SERIES 89 and
HSBC FIXED TERM SERIES 90 Schedules forming part of the Balance Sheet as at March 31, 2013 and the
Revenue Account for the year/period ended March 31, 2013
15 Segment Reporting The Schemes are primarily engaged in the business of investing, amounts received from investors as unit
capital, in accordance with their investment objectives to generate returns. Since there is only one business
segment and no geographical segments, the segmental reporting disclosures as required by Accounting Standard
(AS)-17, issued by the Institute of Chartered Accountants of India have not been made.
16 Net Asset Value Per Unit
The net asset value disclosed below represents the computed NAV on March 31, 2013 (non-business day), and not the last declared NAV. HFTS86 HFTS89 HFTS90 Plan 2013 2012 2013 2012 2013 2012
Rupees Rupees Rupees Rupees Rupees Rupees
Growth Option 11.0747 10.0606 NA NA NA NA Dividend Option 11.0747 10.0606 NA NA NA NA Regular Plan - Growth Option NA NA 10.0108 NA 10.0122 NA Regular Plan - Dividend Option NA NA 10.0022 NA 10.0122 NA Direct Plan - Growth Option NA NA 10.0554 NA 10.0216 NA Direct Plan - Dividend Option NA NA - NA - NA
Pursuant to SEBI circular no. CIR/IMD/DF/21/2012 dated September 13, 2012. HSBC Mutual Fund has
introduced separate plan for direct investments (i.e. investments routed without intermediary) with effect from January 1, 2013. These plans are introduced in all existing schemes of the Fund except the Plans/Options discontinued for further subscriptions.

HSBC MUTUAL FUND - HSBC FIXED TERM SERIES 86, HSBC FIXED TERM SERIES 89 and
HSBC FIXED TERM SERIES 90 Schedules forming part of the Balance Sheet as at March 31, 2013 and the
Revenue Account for the year/period ended March 31, 2013
17 Prior Year’s Figures
Previous year’s figures of FTS 86 have been re-grouped/re-arranged where appropriate. As these are the first financial statements of FTS 89 and FTS 90 since the date of their commencement, there are no comparative figures. Signatures to the Schedules 1 to 7 forming part of the Balance Sheet and the Revenue Account
For PRICE WATERHOUSE Firm Registration Number: 301112E
Chartered Accountants
For Board of Trustees of HSBC Mutual Fund
For HSBC Asset Management (India) Private Limited
sd/- VIVEK PRASAD Partner Membership No. 104941
sd/- N. P. Gidwani Trustee
sd/- Puneet Chaddha
Director and Chief Executive Officer
sd/- Dilip J. Thakkar Trustee
sd/- Kishori J. Udeshi Director
Place: Mumbai Date : July 16, 2013
sd/- Ruchir Parekh Fund Manager
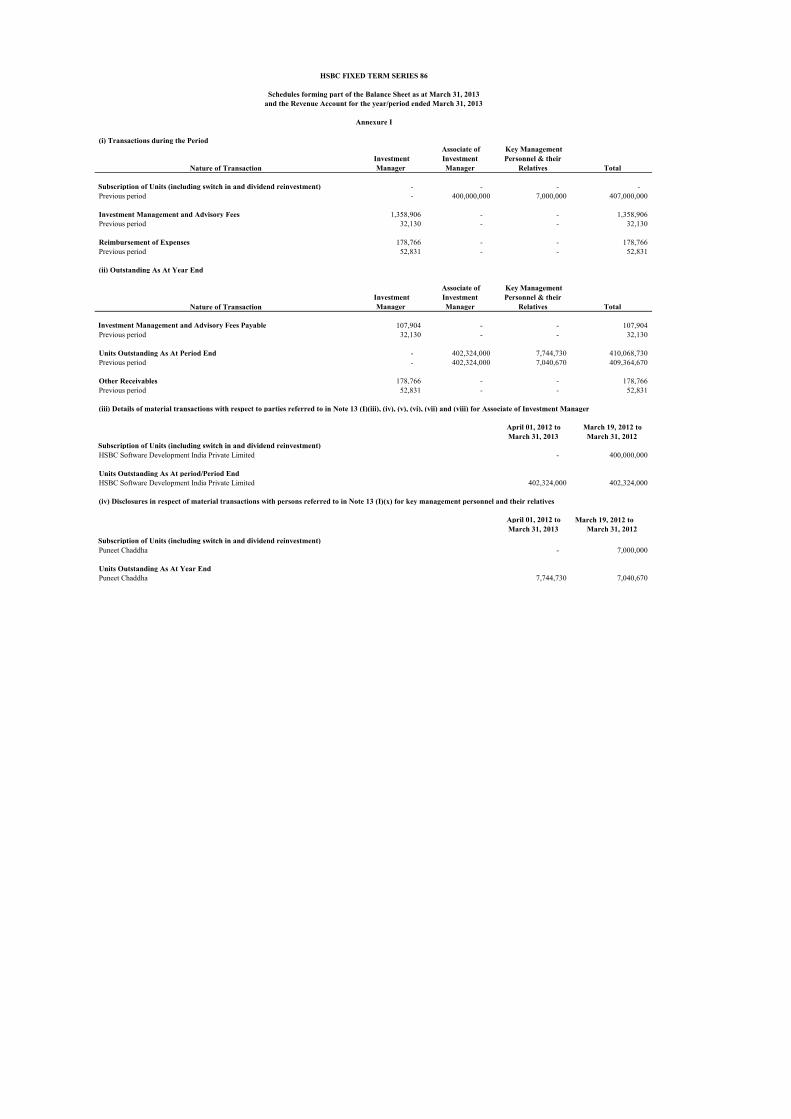
(i) Transactions during the Period
Nature of Transaction Investment
Manager
Associate of Investment Manager
Key Management Personnel & their
Relatives Total
Subscription of Units (including switch in and dividend reinvestment) - - - - Previous period - 400,000,000 7,000,000 407,000,000
Investment Management and Advisory Fees 1,358,906 - - 1,358,906 Previous period 32,130 - - 32,130
Reimbursement of Expenses 178,766 - - 178,766 Previous period 52,831 - - 52,831
(ii) Outstanding As At Year End
Nature of Transaction Investment
Manager
Associate of Investment Manager
Key Management Personnel & their
Relatives Total
Investment Management and Advisory Fees Payable 107,904 - - 107,904 Previous period 32,130 - - 32,130
Units Outstanding As At Period End - 402,324,000 7,744,730 410,068,730 Previous period - 402,324,000 7,040,670 409,364,670
Other Receivables 178,766 - - 178,766 Previous period 52,831 - - 52,831
(iii) Details of material transactions with respect to parties referred to in Note 13 (I)(iii), (iv), (v), (vi), (vii) and (viii) for Associate of Investment Manager
April 01, 2012 to March 19, 2012 to March 31, 2013 March 31, 2012
Subscription of Units (including switch in and dividend reinvestment) HSBC Software Development India Private Limited - 400,000,000
Units Outstanding As At period/Period EndHSBC Software Development India Private Limited 402,324,000 402,324,000
(iv) Disclosures in respect of material transactions with persons referred to in Note 13 (I)(x) for key management personnel and their relatives
April 01, 2012 to March 19, 2012 toMarch 31, 2013 March 31, 2012
Subscription of Units (including switch in and dividend reinvestment) Puneet Chaddha - 7,000,000
Units Outstanding As At Year EndPuneet Chaddha 7,744,730 7,040,670
HSBC FIXED TERM SERIES 86
Schedules forming part of the Balance Sheet as at March 31, 2013and the Revenue Account for the year/period ended March 31, 2013
Annexure I
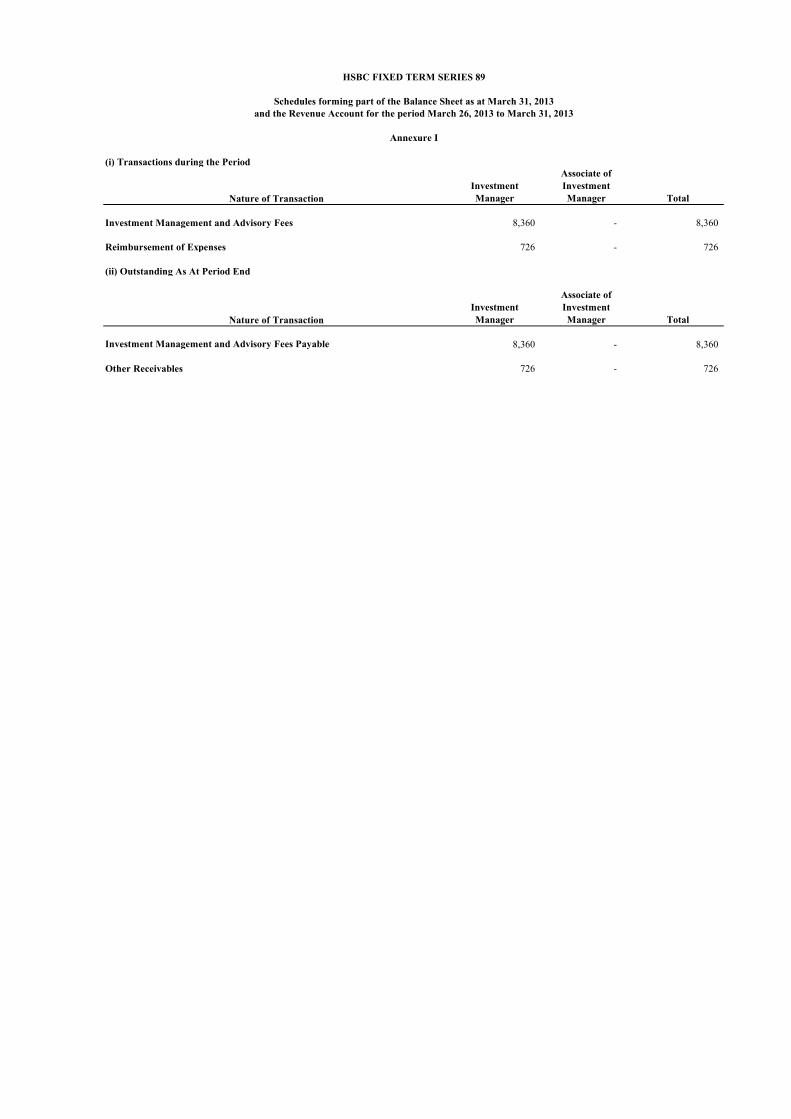
(i) Transactions during the Period
Nature of TransactionInvestment Manager
Associate of Investment Manager Total
Investment Management and Advisory Fees 8,360 - 8,360
Reimbursement of Expenses 726 - 726
(ii) Outstanding As At Period End
Nature of TransactionInvestment Manager
Associate of Investment Manager Total
Investment Management and Advisory Fees Payable 8,360 - 8,360
Other Receivables 726 - 726
HSBC FIXED TERM SERIES 89
Schedules forming part of the Balance Sheet as at March 31, 2013and the Revenue Account for the period March 26, 2013 to March 31, 2013
Annexure I

(i) Transactions during the Period
Nature of TransactionInvestment Manager Total
Investment Management and Advisory Fees 4,937 4,937
Reimbursement of Expenses 18,816 18,816
(ii) Outstanding As At Period End
Nature of TransactionInvestment Manager Total
Investment Management and Advisory Fees Payable 4,937 4,937
Other Receivables 18,816 18,816
HSBC FIXED TERM SERIES 90
Schedules forming part of the Balance Sheet as at March 31, 2013and the Revenue Account for the period March 25, 2013 to March 31, 2013
Annexure I

Company Name Schemes invested in by the Company
Investment made by schemes of HSBC Mutual Fund in the
company/subsidiary
Aggregate cost of acquisition during
the year ended March 31, 2013
Outstanding as at March 31, 2013(At Market / Fair
Value)
(Rupees in Lakhs) (Rupees in Lakhs)
Hindalco Industries Limited HFTS81 HDF 309.76 219.84
HIOF 514.67 366.40
HTSF 409.96 -
HUOF 93.18 64.76
Larsen & Toubro Limited HCF HDF 794.22 683.10
HFRF HEF - 1,912.68
HIOF 338.53 618.21
HMIP 365.99 -
HPTF 556.00 -
HTSF 137.77 -
HUOF 149.90 133.20
L&T Finance Limited HCF 9,110.12 -
(Subsidiary of Larsen & Toubro Limited) HFRF 4,231.84 -
HUSBF 9.87 -
Mahindra & Mahindra Limited HCF HTSF 956.77 -
Mahindra & Mahindra Financial Services Limited HCF 7,207.55 2,473.50
(Subsidiary of Mahindra & Mahindra Limited) HFRF 10,164.61 -
HIF 1,973.43 -
HMIP 2,498.35 -
HUSBF 345.73 -
Reliance Industries Limited HIF HDF 483.06 656.97
HFTS90 HEF - 2,705.15
HIOF - 699.47
HUOF - 120.57
Shriram Transport Finance Company Limited HCF HCF 1,483.40 -
HFDF 2,993.62 3,307.96
HIF 3,498.62 7,914.07
HMIP 280.88 3,080.23
Shriram Equipment Finance Company Ltd HCF 988.86 -
(Subsidiary of Shriram Transport Finance Company Limited) HFRF 1,486.31 -
United Bank of India HCF HCF 3,239.95 2,376.57
HFRF 97.33 -
HFTS80 2,498.34 -
HFTS83 1,775.75 -
HIF 3,061.35 2,578.75
HPTF 240.51 189.34
HUSBF 486.66 -
Scheme Name Scheme CodeHSBC Cash Fund HCF
HSBC Dynamic Fund HDF
HSBC Equity Fund HEF
HSBC Flexi Debt Fund HFDF
HSBC Floating Rate Fund - Long Term Plan HFRF
HSBC Fixed Term Series 79 HFTS79
HSBC Fixed Term Series 81 HFTS81
HSBC Fixed Term Series 80 HFTS80
HSBC Fixed Term Series 83 HFTS83
HSBC Income Fund HIF
HSBC India Opportunities Fund HIOF
HSBC Progressive Themes Fund HPTF
HSBC Small Cap Fund HSCF
HSBC Tax Saver Equity Fund HTSF
HSBC Ultra Short Term Bond Fund HUSBF
HSBC Fixed Term Series 90 HFTS90
HSBC MIP Fund HMIP
HSBC Unique Opportunities Fund HUOF
Annexure II
Disclosure under Regulation 25(11) of the Securities and Exchange Board of India (Mutual Funds) Regulations, 1996 as amended Investments made by the schemes of HSBC Mutual Fund in Companies or their subsidiaries that have invested more than 5%
of the net assets of any scheme
The above investments comprise equity shares, debentures / bonds, commercial papers, certificate of deposits, fixed deposits and other debt instruments. These investments have been made on account of their high credit quality and competitive yield for the investment in fixed income/ money market instruments and in case of equity shares because of
attractive valuations of these companies.
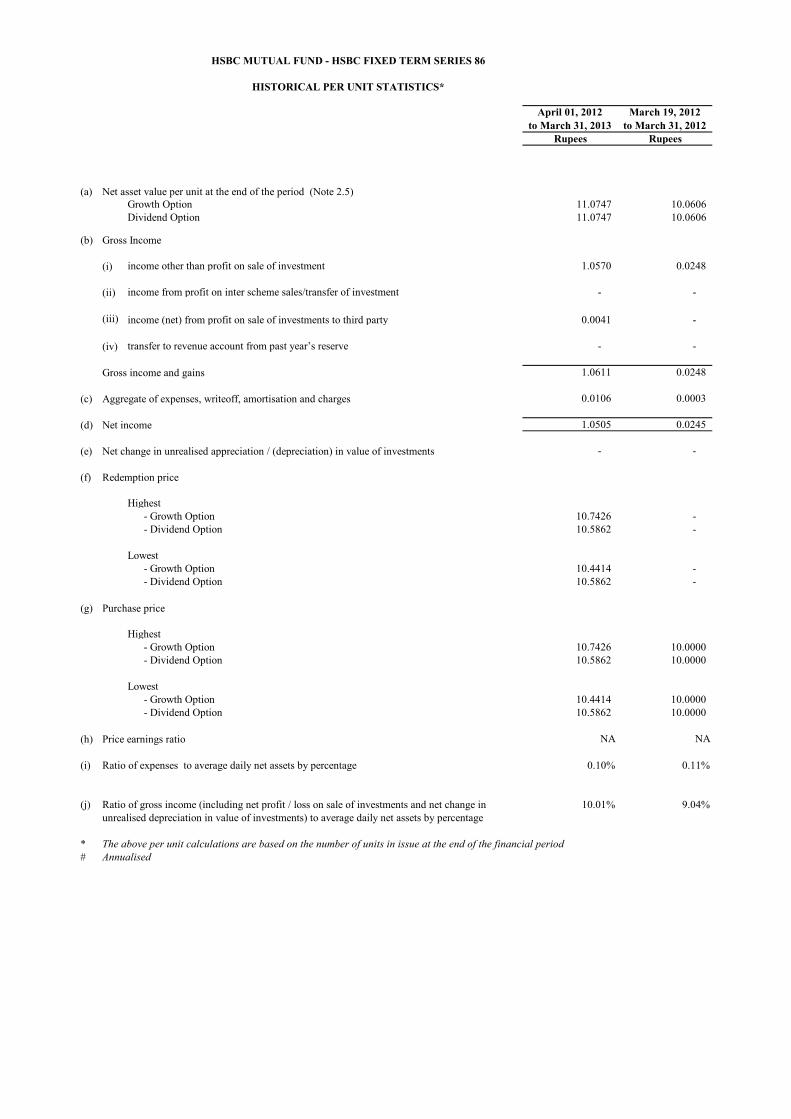
April 01, 2012to March 31, 2013
March 19, 2012to March 31, 2012
Rupees Rupees
(a) Net asset value per unit at the end of the period (Note 2.5)Growth Option 11.0747 10.0606 Dividend Option 11.0747 10.0606
(b) Gross Income
(i) income other than profit on sale of investment 1.0570 0.0248
(ii) income from profit on inter scheme sales/transfer of investment - -
(iii) income (net) from profit on sale of investments to third party 0.0041 -
(iv) transfer to revenue account from past year’s reserve - -
Gross income and gains 1.0611 0.0248
(c) Aggregate of expenses, writeoff, amortisation and charges 0.0106 0.0003
(d) Net income 1.0505 0.0245
(e) Net change in unrealised appreciation / (depreciation) in value of investments - -
(f) Redemption price
Highest - Growth Option 10.7426 - - Dividend Option 10.5862 -
Lowest - Growth Option 10.4414 - - Dividend Option 10.5862 -
(g) Purchase price
Highest - Growth Option 10.7426 10.0000 - Dividend Option 10.5862 10.0000
Lowest - Growth Option 10.4414 10.0000 - Dividend Option 10.5862 10.0000
(h) Price earnings ratio NA NA
(i) Ratio of expenses to average daily net assets by percentage 0.10% 0.11%
(j) Ratio of gross income (including net profit / loss on sale of investments and net change in 10.01% 9.04%unrealised depreciation in value of investments) to average daily net assets by percentage
* The above per unit calculations are based on the number of units in issue at the end of the financial period# Annualised
HSBC MUTUAL FUND - HSBC FIXED TERM SERIES 86
HISTORICAL PER UNIT STATISTICS*

March 26, 2012to March 31, 2013
Rupees
(a) Net asset value per unit at the end of the period (Note 2.5)Growth Option 10.0108 Dividend Option 10.0022 Direct Plan - Growth Option 10.0554 Direct Plan - Dividend Option -
(b) Gross Income
(i) income other than profit on sale of investment 4.5822
(ii) income from profit on inter scheme sales/transfer of investment -
(iii) income (net) from profit on sale of investments to third party -
(iv) transfer to revenue account from past year’s reserve -
Gross income and gains 4.5822
(c) Aggregate of expenses, writeoff, amortisation and charges 0.2044
(d) Net income 4.3779
(e) Net change in unrealised appreciation / (depreciation) in value of investments (1.1523)
(f) Redemption price
Highest - Growth Option - - Dividend Option - - Direct Plan - Growth Option - - Direct Plan - Dividend Option -
Lowest - Growth Option - - Dividend Option - - Direct Plan - Growth Option - - Direct Plan - Dividend Option -
(g) Purchase price
Highest - Growth Option 10.0000 - Dividend Option 10.0000 - Direct Plan - Growth Option 10.0000 - Direct Plan - Dividend Option -
Lowest - Growth Option 10.0000 - Dividend Option 10.0000 - Direct Plan - Growth Option 10.0000 - Direct Plan - Dividend Option -
(h) Price earnings ratio NA
(i) Ratio of expenses to average daily net assets by percentageRegular 0.41%Direct 0.11%
(j) Ratio of gross income (including net profit / loss on sale of investments and net change in 4.21%unrealised depreciation in value of investments) to average daily net assets by percentageRegular #REF!Institutional #REF!
* The above per unit calculations are based on the number of units in issue at the end of the financial period** The ratio of expenses and gross income to average daily net assets by percentage have been annualised for
the period November 21, 2005 to March 31, 2006.@ The ratio of expenses and gross income to average daily net assets by percentage has been annualised for
the period November 09, 2004 to March 31, 2005.# Less than 0.0001 per unit$ Long Term Plan – Monthly Dividend Sub-Option
Short Term Plan – Daily Dividend Sub-Option£
# Annualised
HSBC MUTUAL FUND - HSBC FIXED TERM SERIES 89
HISTORICAL PER UNIT STATISTICS*
The redemption and purchase price does not take into consideration prices on account of inter-scheme switches and dividend reinvestments.
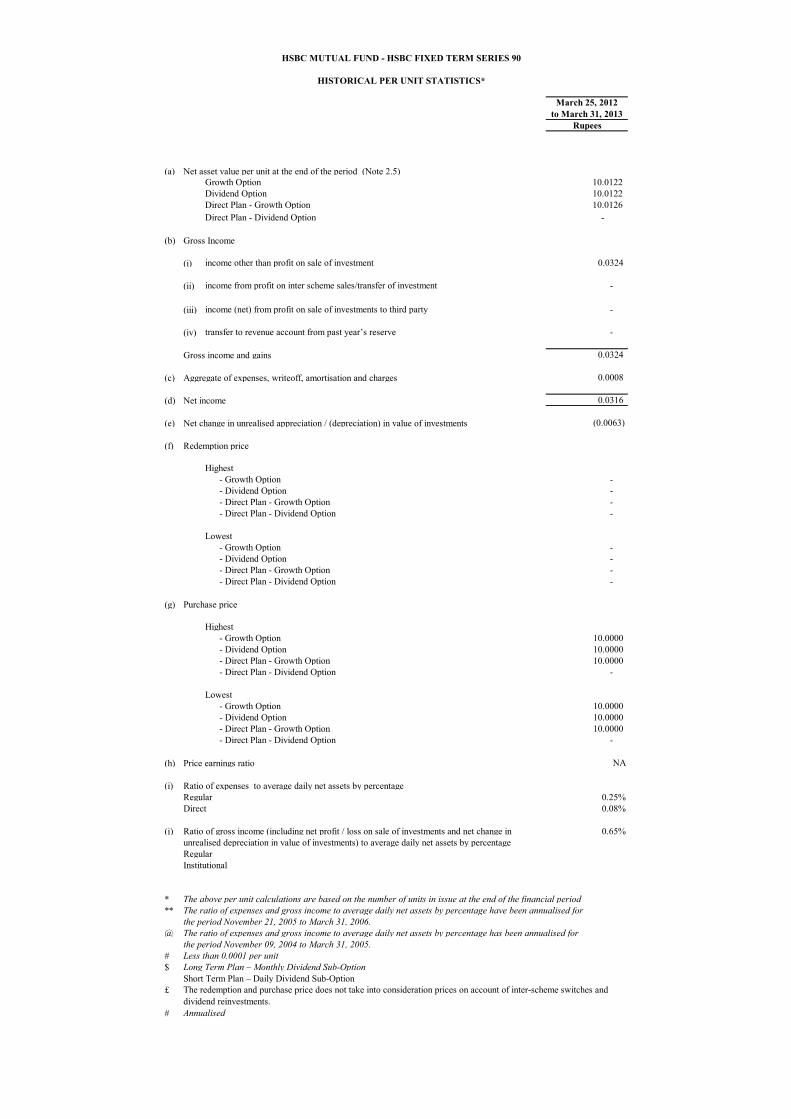
March 25, 2012to March 31, 2013
Rupees
(a) Net asset value per unit at the end of the period (Note 2.5)Growth Option 10.0122 Dividend Option 10.0122 Direct Plan - Growth Option 10.0126 Direct Plan - Dividend Option -
(b) Gross Income
(i) income other than profit on sale of investment 0.0324
(ii) income from profit on inter scheme sales/transfer of investment -
(iii) income (net) from profit on sale of investments to third party -
(iv) transfer to revenue account from past year’s reserve -
Gross income and gains 0.0324
(c) Aggregate of expenses, writeoff, amortisation and charges 0.0008
(d) Net income 0.0316
(e) Net change in unrealised appreciation / (depreciation) in value of investments (0.0063)
(f) Redemption price
Highest - Growth Option - - Dividend Option - - Direct Plan - Growth Option - - Direct Plan - Dividend Option -
Lowest - Growth Option - - Dividend Option - - Direct Plan - Growth Option - - Direct Plan - Dividend Option -
(g) Purchase price
Highest - Growth Option 10.0000 - Dividend Option 10.0000 - Direct Plan - Growth Option 10.0000 - Direct Plan - Dividend Option -
Lowest - Growth Option 10.0000 - Dividend Option 10.0000 - Direct Plan - Growth Option 10.0000 - Direct Plan - Dividend Option -
(h) Price earnings ratio NA
(i) Ratio of expenses to average daily net assets by percentageRegular 0.25%Direct 0.08%
(j) Ratio of gross income (including net profit / loss on sale of investments and net change in 0.65%unrealised depreciation in value of investments) to average daily net assets by percentageRegular #REF!Institutional #REF!
* The above per unit calculations are based on the number of units in issue at the end of the financial period** The ratio of expenses and gross income to average daily net assets by percentage have been annualised for
the period November 21, 2005 to March 31, 2006.@ The ratio of expenses and gross income to average daily net assets by percentage has been annualised for
the period November 09, 2004 to March 31, 2005.# Less than 0.0001 per unit$ Long Term Plan – Monthly Dividend Sub-Option
Short Term Plan – Daily Dividend Sub-Option£
# Annualised
HSBC MUTUAL FUND - HSBC FIXED TERM SERIES 90
HISTORICAL PER UNIT STATISTICS*
The redemption and purchase price does not take into consideration prices on account of inter-scheme switches and dividend reinvestments.