
Schedule and Cost Estimation III Dr. Phil Laplante, CSDP, PE Lecture 5.
38
Schedule and Cost Estimation III Dr. Phil Laplante, CSDP, PE Lecture 5
-
Upload
meredith-hardesty -
Category
Documents
-
view
214 -
download
0
Transcript of Schedule and Cost Estimation III Dr. Phil Laplante, CSDP, PE Lecture 5.

Schedule and Cost Estimation III
Dr. Phil Laplante, CSDP, PELecture 5

2
Topics
Other accounting measures Earned Value Analysis Balanced Scorecard

3
Internal rate of return (IRR)
NPV is an indirect measure: you are required to specify the market opportunity cost (discount rate) of the capital involved.
IRR is defined as the discount rate in the NPV equation that causes the calculated NPV to be zero.
It is not the return on investment (ROI). IRR is popular because it does not require
knowledge of the cost of capital.
4
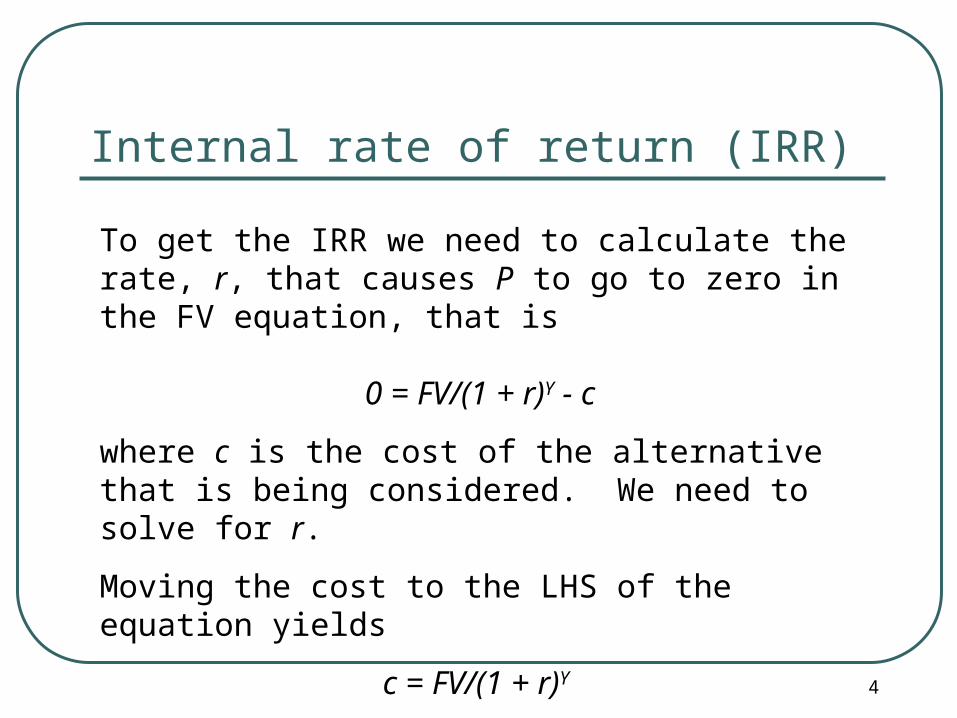
Internal rate of return (IRR)
To get the IRR we need to calculate the rate, r, that causes P to go to zero in the FV equation, that is
0 = FV/(1 + r)Y - c
where c is the cost of the alternative that is being considered. We need to solve for r.
Moving the cost to the LHS of the equation yields
c = FV/(1 + r)Y
5
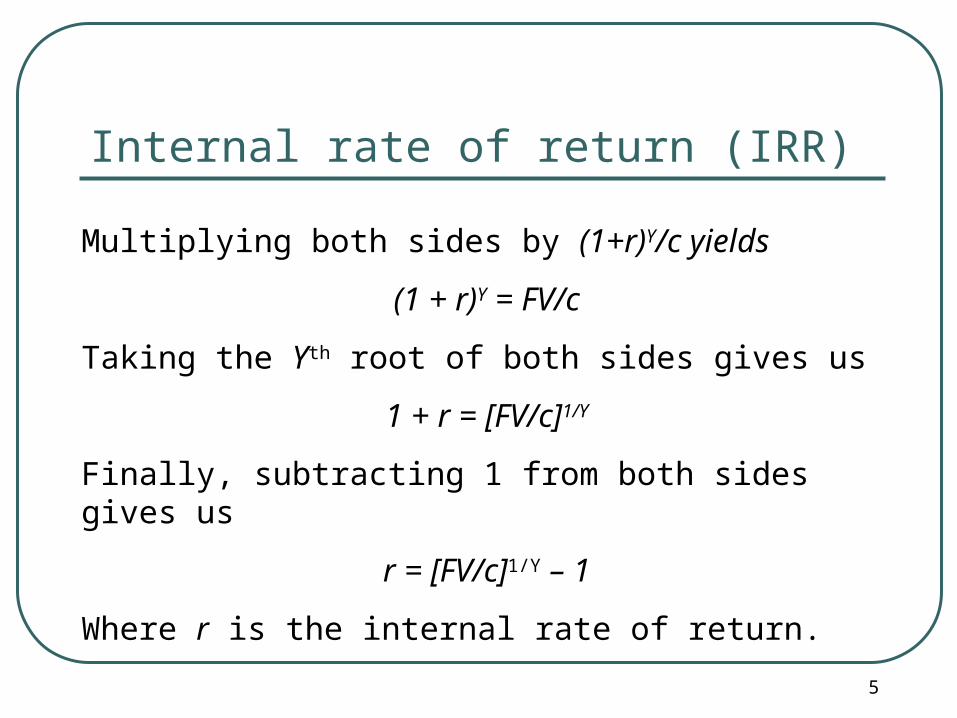
Internal rate of return (IRR)
Multiplying both sides by (1+r)Y/c yields
(1 + r)Y = FV/c
Taking the Yth root of both sides gives us
1 + r = [FV/c]1/Y
Finally, subtracting 1 from both sides gives us
r = [FV/c]1/Y – 1
Where r is the internal rate of return.

6
Internal rate of return (IRR) : example
The code reading initiative just discussed is expected to cost $50,000. The returns of this improvement are expected to be $100,000 of reduced rework two years in the future.
What is the internal rate of return on this activity?

7
Internal rate of return (IRR) : example
Here, NPV = 100,000 / (1+r) 2 – 50,000
We wish to find the r that makes the NPV =0, that is the “break even” value. Using our IRR equation
r = [100,000/50,000)]1/2– 1
Plugging this into a calculator gives r =0.414 =41.4%
8
Internal rate of return (IRR) : example
• To decide if we should make this decision, we compare the IRR to the return of another investment alternative.
• For example, if the IRR was very low, then we might simply want to take this money and find an equivalent investment with lower risk (e.g. buy bonds with it).
• But if the IRR is very high, then the decision might be worth whatever risk is involved.
9
Profitability index (PI)
PI is defined as PV/I. That is, we take the present value of an
investment and divide it by the initial outlay, I.
This yields a kind of “bang-for-the-buck” measure.

10
Profitability index (PI): example
The code reading initiative previously discussed is expected to cost the company $50,000.
The returns of this improvement are expected to be $100,000 of reduced rework two years in the future.

11
Profitability index (PI): example
The Net Present Value for this initiative at a discount rate of 10% is:
PV = 100,000 / 1.102
= 82,645
for a Profitability Index of 82,645/50,000 or 1.65
12
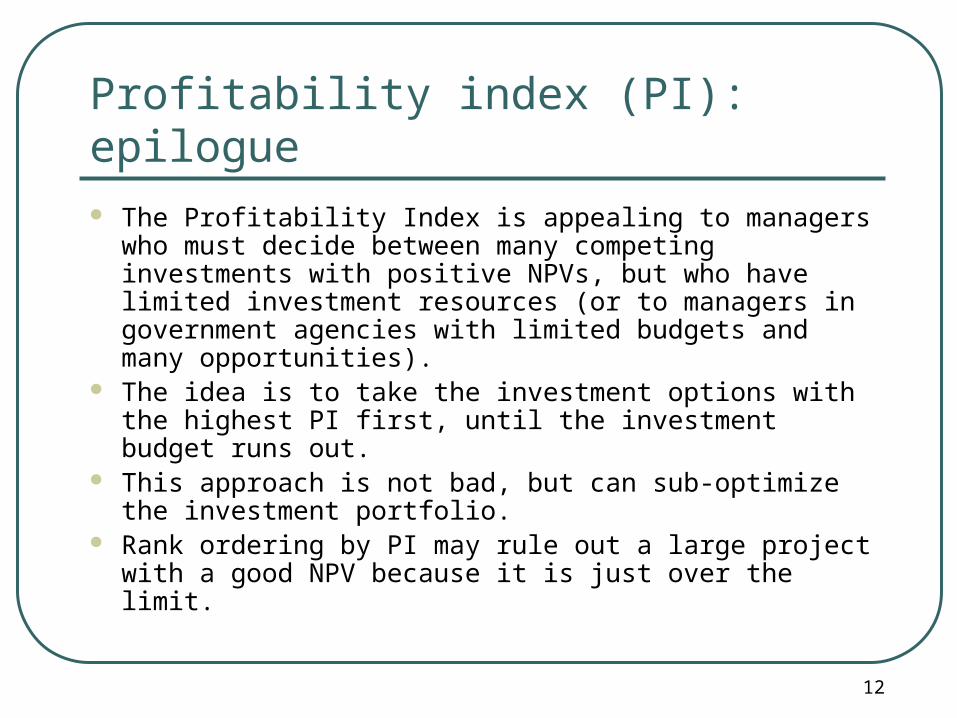
Profitability index (PI): epilogue The Profitability Index is appealing to managers who must
decide between many competing investments with positive NPVs, but who have limited investment resources (or to managers in government agencies with limited budgets and many opportunities).
The idea is to take the investment options with the highest PI first, until the investment budget runs out.
This approach is not bad, but can sub-optimize the investment portfolio.
Rank ordering by PI may rule out a large project with a good NPV because it is just over the limit.
13
Profitability index (PI): epilogue
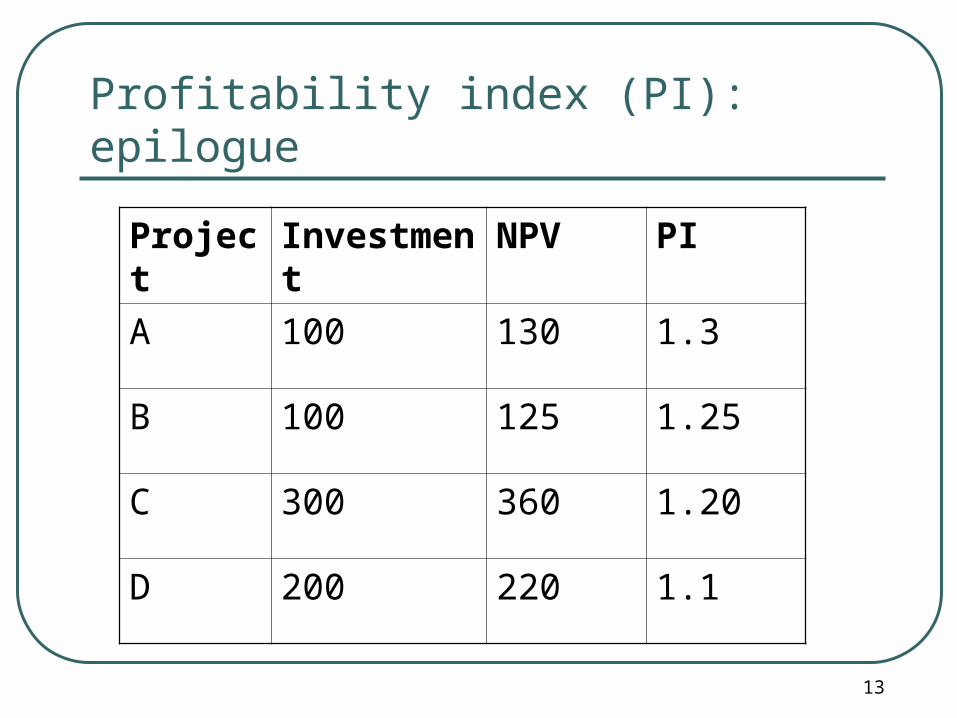
Project Investment NPV PI
A 100 130 1.3
B 100 125 1.25
C 300 360 1.20
D 200 220 1.1
14
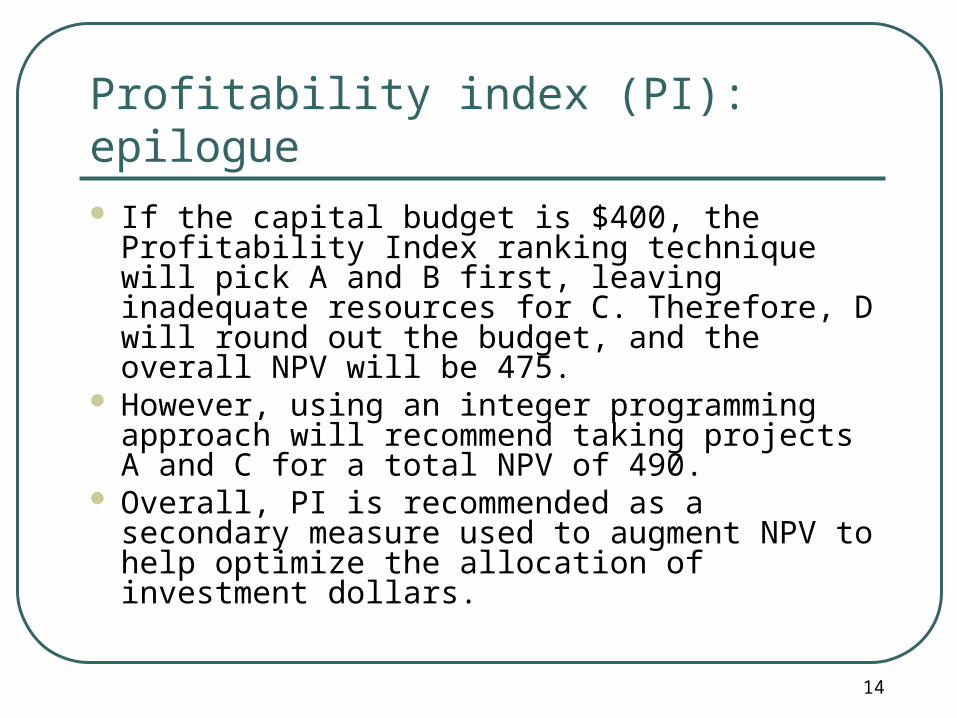
Profitability index (PI): epilogue If the capital budget is $400, the Profitability
Index ranking technique will pick A and B first, leaving inadequate resources for C. Therefore, D will round out the budget, and the overall NPV will be 475.
However, using an integer programming approach will recommend taking projects A and C for a total NPV of 490.
Overall, PI is recommended as a secondary measure used to augment NPV to help optimize the allocation of investment dollars.

15
Payback
Payback is the time it takes to get the initial investment back out of the project.
Projects with short paybacks are preferred, although the term “short” is completely arbitrary.
The intuitive appeal is reasonably clear: it is easy to calculate, communicate, and understand.
Because of this, it is the least likely to confuse managers.
16
Payback However, if payback period is the only criterion
used, then there is no recognition of any cash flows, small or large, to arrive after the cutoff period.
Furthermore, there is no recognition of the opportunity cost of tying up funds.
Inasmuch as discussions of payback tend to coincide with discussions of risk, it is probable that a short payback period is viewed as a way to respond to higher risks. However all criteria are arbitrary.
17
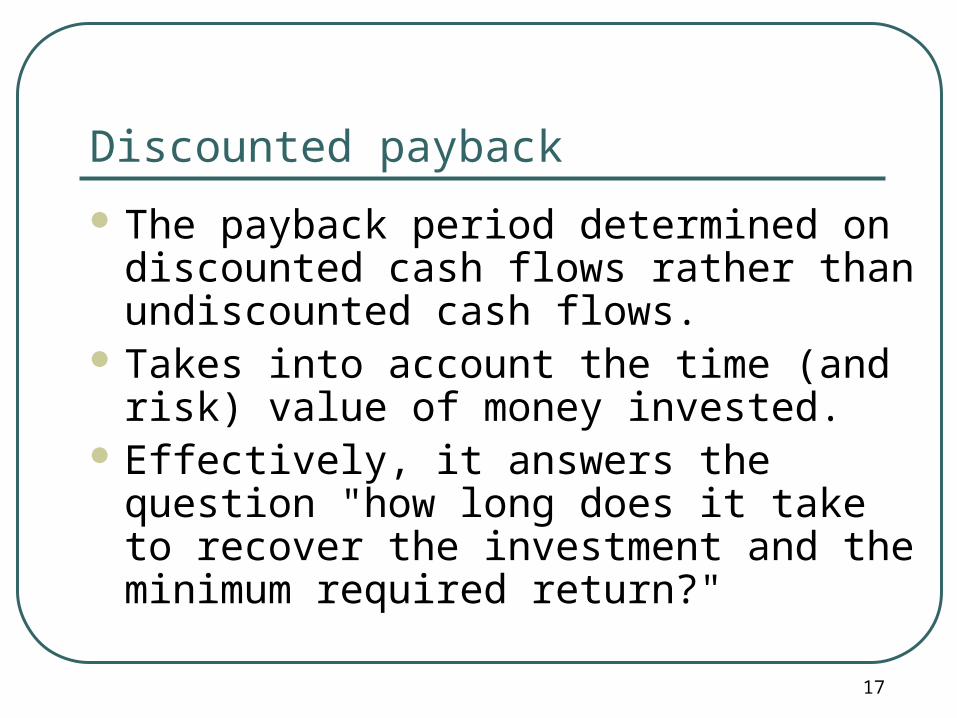
Discounted payback
The payback period determined on discounted cash flows rather than undiscounted cash flows.
Takes into account the time (and risk) value of money invested.
Effectively, it answers the question "how long does it take to recover the investment and the minimum required return?"

18
Discounted payback
If the discounted payback period is finite in length, it means that the investment plus its capital costs are indeed recovered eventually, which means that the NPV is at least as great as zero.
Consequently, a criterion that says, go ahead with the project if it has any finite discounted payback period is consistent with the NPV rule.
Beyond that, however, discounted payback has the same shortcomings as payback.

19
Average rate of return (ARR)
Can stand for “Average Rate of Return” or "Accounting Rate of Return“.
Traditionally, it considers accounting net income rather than cash flows.
It does this by including depreciation/ amortization in the computation of the cash flow (meaning it treats depreciation as an out-of-pocket expense, reducing the cash flow).

20
Average rate of return (ARR)
Its proponents argue that ultimately publicly traded organizations are evaluated on accounting measures of net income .
So capital budgeting techniques should be based on this approach to determining cash flow.
There are a variety of different ARR measures based on some notion of benefits divided by some notion of investment.

21
Average rate of return (ARR) Here are some example definitions, the first
one being the one normally mentioned in textbooks.• Average projected after-tax profit / Average
investment• Average projected after-tax profit / Initial investment• Average projected after-tax cash flow / Average
investment• Average projected after-cash flow / Initial investment
Profit and investment can have varying definitions, so various accounting adjustments may or may not be made.
22
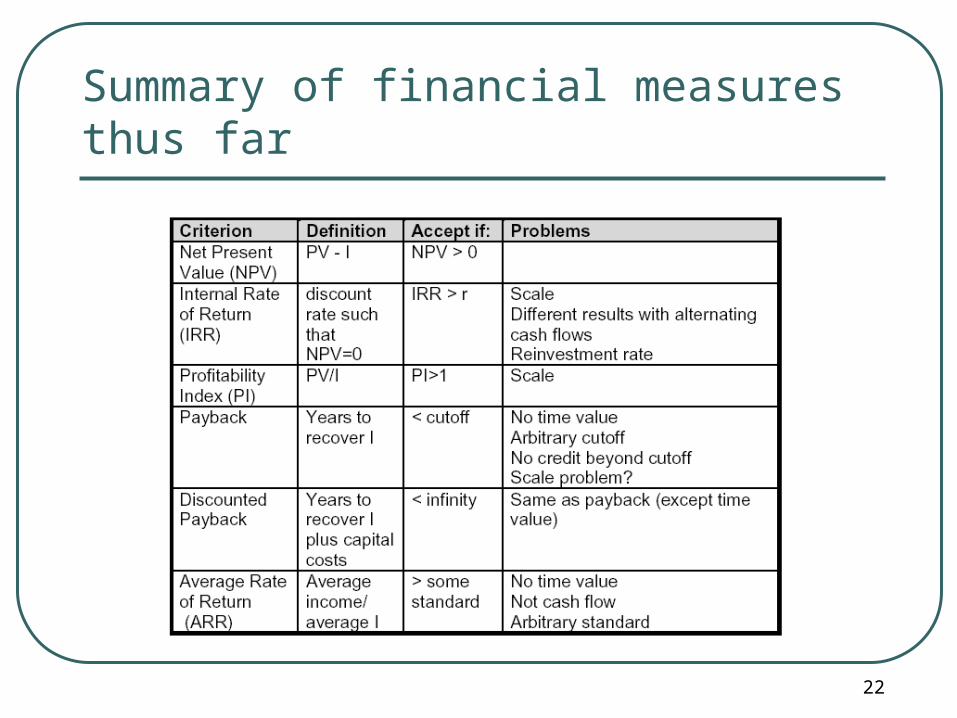
Summary of financial measures thus far

Activity-Based Costing (ABC) An accounting strategy that considers the costs of people,
facilities, computers, supplies, and other resources consumed. The goal is to show the rationale for investment in IT
infrastructure by incorporating the costs of contribution from all parts of the organization that touch the IT function.
Tools are available to perform forecasting simulations. Ex: installation of a software package on a single desktop is
one step in upgrading the operating system in preparation for the installation of a new ERP system.
23

ABC drawbacks Specially trained estimators are needed. Activity costs are often difficult to quantify and capture. Reliable information needed based on honest reporting. There can be tremendous variation in factors affecting the
estimation, such as compensation levels, personnel overhead structure, and individual performance levels.
These variations collectively contribute to a great deal of uncertainty in the cost estimation equations (Jones 1996).
24

Earned Value Analysis (EVA) Presumes that a project adds value and that this value is going
to be measured through the life of the project. Permits forecasted and actual costs to be tracked to allow for
mid-project adjustments or termination. Simple EVA metrics can be used to monitor and control a
project. Some customers pay as they go based on EVA (or can be
used for partial payment of an aborted project) A somewhat atypical approach to EVA involves the following
calculations (Morgan 2005) [next slide].
25

EVA At key points in the project the schedule variance, SV, is
computed as
SV = BCWP – BCWSBCWS: budgeted cost of work scheduled
BCWP: budgeted cost of work performed.
The cost variance, CV, can then be computed.
CV = BCWP – ACWPACWP: actual cost of work performed
The cost performance index, CPI, is based on the relationship between the cost variance and the schedule variance.
CPI=BCWP/ACWP
26

EVA
The CPI can then be used to forecast the cost to complete the project :
FCTC = original budget for work remaining/CPI The forecast cost at completion (FCAC) is just the
actual cost of work already performed plus the forecast cost to complete the work:
FCAC = ACWP + FCTC
27

Balanced scorecard
A control mechanism (strategic) that links performance evaluation to strategic objectives.
Considers what drives four performance perspectives: financial, customer, internal process, learning and growth.
Links short-term drivers to long-term performance using cause-and-effect relationships.
Used for controlling, coordinating, and resource allocating across multiple projects.
Consists of 9 steps (phases).
28

The “balanced scorecard”
29Source: BSC Institute

BSC Steps 1-4 Step One: Assessment
- BSC Development Plan- Strategic Elements- Change Management
Step Two: Strategy- Customer Value - Strategic Themes - Strategic Results
Step Three: Objectives- Strategy Action Components
Step Four: Strategy Map- Cause-and-Effect Links
30

BSC Steps 5-7
Step Five: Performance Measures- Performance Measures - Targets - Baselines
Step Six: Initiatives- Strategic Projects
Step Seven: Automation- Software - Performance Reporting - Knowledge Sharing
31

BSC Steps 8,9
Step Eight: Cascade- Alignment - Unit & Individual Scorecards
Step Nine: Evaluation- Strategy Results - Revised Strategies
32

Four performance perspectives for an ERP system
33
Source: Hwang

BSC Strategy map
Highlights key causal relationships among the four performance perspectives
Companies can use these relationships to drive and monitor implementation during project implementation.
In all cases, the organization must control socio-technical requirements.
34

Sample strategy map within BCS-IS Framework
35
Source: Hwang
BSC epilogue
Typically, not a project management tool per se.
Is a portfolio management tool used at the CIO, COO, CEO, and Board level.
But… knowledge of the linkages from project to scorecard are essential for the project manager.
36

Death and taxes….
Must be considered in all “real” project costing endeavors. E.g
• Is software a capital budget item or expense?
• Staff as permanent employees or contract employees?
• Tax treatment of investment in new development and profits made on that development?
Many more, very complicated questions that only armies of lawyers, accountants, and prognosticators can attempt to guess at.
37

38
References Hwang, Yujong, and R. Leitch, “Balanced Scorecard: Evening
the Odds of Successful BPR,” IT Professional, Nov. 2005, pp. 24-30.
Jones, C., 1996. “Activity-Based Software Costing,” IEEE Computer, May, pp. 103–104.
Morgan, J. N., 2005. “A Roadmap of Financial Measures for IT Project ROI,” IT Professional, Jan./Feb., pp. 52–57.
Moskowitz, K., and H. Kern, 2003, Managing IT as an Investment, Prentice Hall PTR.
Raffo, D., J. Settle, and W. Harrison, 1999, Investigating Financial Measures for Planning of Software IV&V, Portland State University Research Report #TR-99-05.


![[Clubs & Societies Development Plan (CSDP)] Executive Summary](https://static.fdocuments.net/doc/165x107/58ad25391a28ab50728b6581/clubs-societies-development-plan-csdp-executive-summary.jpg)
