
SB 743 Implementation – Review of Existing Policies, VMT ...
50
SB 743 Implementation – Review of Existing Policies, VMT Tools, and Case Studies | Final City of Morgan Hill SB 743 Implementation – Review of Existing Policies, VMT Tools, and Case Studies Final April 2020
Transcript of SB 743 Implementation – Review of Existing Policies, VMT ...

SB 743 Implementation – Review of Existing Policies, VMT Tools, and Case Studies | Final City of Morgan Hill
Nelson\Nygaard Consulting Associates Inc. | i
SB 743 Implementation – Review of Existing Policies, VMT Tools, and Case Studies Final
April 2020

SB 743 Implementation – Review of Existing Policies, VMT Tools, and Case Studies | Final City of Morgan Hill
Nelson\Nygaard Consulting Associates Inc. | i
Table of Contents Page
Introduction ................................................................................................................................ 1 1 Legal Framework ................................................................................................................ 1 2 Stakeholder Interview Summary ......................................................................................... 9 3 VMT Analysis Tools .......................................................................................................... 11
Office of Planning and Research Technical Advisory Considerations ........................................... 12 Vehicle Miles Traveled Metrics ............................................................................................................. 13 Existing VMT Models ............................................................................................................................... 15 MTC’s Regional Travel Demand Model ............................................................................................... 15 VTA Regional Transportation Model ................................................................................................... 21 Regional Model Differences .................................................................................................................. 26 Countywide VMT Evaluation Tool ......................................................................................................... 27
4 State Guidance and Case Studies...................................................................................... 28 Case Study Cities ..................................................................................................................................... 29 Thresholds of Significance for Land Use Projects .............................................................................. 30 Screening Thresholds for Land Use Projects ....................................................................................... 33 VMT Mitigation ......................................................................................................................................... 39 Continued Use of Level of Service ....................................................................................................... 41 Thresholds of Significance for Transportation Projects .................................................................... 42 Screening Thresholds for Transportation Projects .............................................................................. 43
5 Review of Transportation Impact Analysis ....................................................................... 44 6 Recommendations and Next Steps ................................................................................... 47
Table of Figures Page
Figure 1 Traffic Impact Fees ................................................................................................................... 7 Figure 2 Vehicle Miles Traveled Metrics ............................................................................................ 14 Figure 3 Comparison of Trip-Based and Tour-Based Models ....................................................... 15 Figure 4 MTC Daily VMT per Capita ................................................................................................. 17 Figure 5 VMT per capita (MTC) Variation from Local Mean ......................................................... 18 Figure 6 MTC Daily VMT per Employee ............................................................................................ 18 Figure 7 VMT per employee map (MTC) Variation from Regional Mean .................................. 20 Figure 8 VTA Daily VMT per Capita .................................................................................................. 22 Figure 9 VTA Model, Variation from Morgan Hill Citywide Average VMT per Capita .......... 23 Figure 10 VTA Daily VMT per Employee ............................................................................................. 24 Figure 11 VTA Model, Variation from 9-County Bay Area Region Average VMT per
Employee .................................................................................................................................. 25 Figure 12 VTA Model, Variation from County Average VMT per Employee ............................... 26 Figure 13 Summary of OPR and Example City Transportation Analysis Process ......................... 30 Figure 14 Thresholds of Significance for Residential and Office Projects ..................................... 31

SB 743 Implementation – Review of Existing Policies, VMT Tools, and Case Studies | Final City of Morgan Hill
Nelson\Nygaard Consulting Associates Inc. | ii
Figure 15 Thresholds of Significance for Retail Land Use ................................................................. 33 Figure 16 Small Project Screening Thresholds ..................................................................................... 34 Figure 17 City of San José - VMT per Capita (2018) ...................................................................... 35 Figure 18 City of San José – Residential Project Screen .................................................................. 36 Figure 19 City of Elk Grove – Land Use Project VMT Screen ......................................................... 37 Figure 20 City of San José – Affordable Housing Project Screen ................................................. 39 Figure 21 Elk Grove VMT Reduction Strategies .................................................................................. 40 Figure 22 City of San José’s Total Allowable VMT Incremental Increase .................................... 43 Figure 23 San José Thresholds of Significance for City Transportation Projects .......................... 43 Figure 24 Project TIAs with Residential Components .......................................................................... 44 Figure 25 Non-Residential Projects TIAs ............................................................................................... 46

Morgan Hill SB 743 LOS-to-VMT Transition | DRAFT TASK 1 & 2 SUMMARY City of Morgan Hill
Nelson\Nygaard Consulting Associates, Inc. | 1
INTRODUCTION This review of existing policies, VMT tools, and case studies establishes preliminary project understanding as a reference for City of Morgan Hill. Implementing changes to transportation impact analysis required under Senate Bill 743 (SB 743) begins with an assessment of the existing Legal Framework. Chapter 1 outlines legal requirements of SB 743, City policies and programs that are already in place to support a new approach to transportation impact analysis (TIA), and the City’s existing development review and environmental review processes. Chapter 2, Stakeholder Interview Summary, reviews TIA policy discussions with City staff and engagement needs of implementing SB 743. Chapter 3, VMT Analysis Tools, provides a review of vehicle miles traveled (VMT) analysis tools, including relevant travel demand models and the associated VMT outputs. Chapter 4, State Guidance and Case Studies provides practical examples from cities that have adopted SB 743 compliant VMT-based analysis. Chapter 5, Review of Transportation Impact Analysis, summarizes several recent transportation impact analysis (TIA) for development projects, and Chapter 6, Recommendations and Next Steps, provides high-level recommendations and next steps.
1 LEGAL FRAMEWORK Senate Bill 743 In September 2013, Governor Brown signed Senate Bill 743 (SB 743) into law, in part mandating the transition from a level of service (LOS) based method of transportation impact analysis to a vehicles miles traveled (VMT) method in compliance with the California Environmental Quality Act (CEQA). Specifically, SB 743 required the Office of Planning and Research (OPR) to amend the CEQA Guidelines to provide alternative criteria for evaluating transportation impacts to promote the reduction of greenhouse gas emissions, the development of multimodal transportation systems, and a diversity of land uses. With the December 2018 Technical Advisory on Evaluating Impacts in CEQA, delay is no longer considered a significant impact under CEQA.
City Goals The City of Morgan Hill has multiple adopted policies that support the shift from measuring transportation impacts based on LOS to using VMT per capita, including policies contained within the Mobility Element of the 2035 General Plan, the Downtown Specific Plan, the criteria

Morgan Hill SB 743 LOS-to-VMT Transition | DRAFT TASK 1 & 2 SUMMARY City of Morgan Hill
Nelson\Nygaard Consulting Associates, Inc. | 2
set in the Residential Development Control System competition manual, and the Bikeways, Trails, Parks, and Recreation Master Plan.
Reducing VMT per capita is supported by the following City goals:
General Plan Transportation Element Policies1
− TR-2.1: A balanced multi-modal system that offers viable choices for residents, employees, customers, visitors, and recreational users.
− TR-2.2: Promote environmental objectives that support smart growth and Sustainable Communities principles, such as safe and uncongested neighborhoods, a pedestrian-friendly vibrant downtown that emphasizes non-auto transportation modes, energy conservation, reduction of air and noise pollution, and the integrity of scenic and/or hillside areas.
− TR-4.B For the Monterey Corridor segments, pursue funding to make streetscape improvements including, not but limited to filling in missing sidewalks and widening the Monterey Road underpass to accommodate four travel lanes along with pedestrian and bicycle facilities.
− TR6.2: Work with VTA to increase commuter bus service to and from Morgan Hill.
− TR-6.6: Support County-wide programs to encourage employers to promote use of mass transportation.
− TR-8.2: Encourage increased use of bicycles for adults commuting to work and for students traveling to school through a safe and efficient bikeways system, enhanced bicycle parking facilities, and bicycle safety and promotion programs.
− TR-9.2: Promote walking as an alternate transportation mode.
− TR-10.1: Provide informational resources to local business subject to BAAQMD transportation demand management program requirements.
General Plan Natural Resources and Environment Element Policies2
− NRE-10.4: Reduce air pollution, the frequency and length of automobile trips, and the amount of traffic congestion by controlling sprawl, promoting infill development, and encouraging mixed uses and higher density development near transit. Support the expansion of alternative modes of transportation.
− NRE-15.2: Encourage land use and transportation patterns that reduce dependence on automobiles.
− NRE-15.10: Continue to work with the Santa Clara Valley Transportation Authority on regional transportation solutions that will reduce vehicle miles traveled and greenhouse gas emissions.
General Plan City and Neighborhood Form Element Policies3
− CNF-10.7: Utilize a full range of parcel sizes and land use categories in the City’s Zoning Ordinance to provide for a variety of residential densities and housing types.
1 City of Morgan Hill 2035 General Plan, Chapter 7, July 2016. 2 City of Morgan Hill 2035 General Plan, Chapter 8, July 2016. 3 City of Morgan Hill 2035 General Plan, Chapter 3, July 2016.

Morgan Hill SB 743 LOS-to-VMT Transition | DRAFT TASK 1 & 2 SUMMARY City of Morgan Hill
Nelson\Nygaard Consulting Associates, Inc. | 3
− CNF-11.8: Require new subdivisions to contain a network of streets, sidewalks, trails, and transit facilities to accommodate all modes of transportation. Methods may include:
o Incorporating complete streets designed for low vehicle speeds.
o Providing safe walking and bicycling routes to schools, parks, and other youth destinations.
− CNF-11.11: Encourage a mix of housing types and lots of sizes within residential projects with five or more lots or units.
− CNF-11.20: Require residential infill development to complement existing development patterns and minimize impacts on neighboring properties.
− CNF-11.28: Require attached residential sites to be designed to accommodate the needs of bicyclists and pedestrians.
− CNF-13.1: Encourage a mix of uses, either vertically or horizontally, to allow residents and employees to meet daily needs without the use of the private automobile.
− CNF-14.1: Encourage a mixture of uses in the Downtown that will promote its density as the cultural and activity center of the City.
− CNF-14.9: Local transit stops convenient to Downtown and housing, focusing on transit- and pedestrian-oriented development.
General Plan Economic Development Element Policies4
− ED-2.1: Maintain sufficient areas of land to promote the development of a balanced community containing adequate jobs, retail services, and commercial activity.
Bikeways, Trails, Parks, and Recreation Master Plan5
− Provide safe, accessible and convenient support services to cyclists.
Downtown Specific Plan6
− Future development should promote pedestrian activity.
− Encourage a diverse mix of land uses.
− Strengthen Downtown through emphasis on infill development of vacant lots along Monterey Road and Third Street.
Residential Development Control System7
− Points are awarded to projects that incorporate bicycle and pedestrian improvements, TDM programming, and connections to adjacent properties.
City of Morgan Hill Municipal Code8
− Employers that adopt and implement a transportation demand management (TDM) plan may reduce the number of required on-site parking spaces for employers.
4 City of Morgan Hill 2035 General Plan, Chapter 5, July 2016. 5 Bikeways, Trails, Parks, and Recreation Master Plan, July 2017. 6 Morgan Hill Downtown Specific Plan, November 2009. 7 City of Morgan Hill, RDCS Competition Manual, September 2018. 8 City of Morgan Hill Municipal Code, Section 18.72.050– On-Site Parking Alternatives. City of Morgan Hill. Accessed March 12, 2020.

Morgan Hill SB 743 LOS-to-VMT Transition | DRAFT TASK 1 & 2 SUMMARY City of Morgan Hill
Nelson\Nygaard Consulting Associates, Inc. | 4
Supporting Policies and Programs In addition to adopted city policies, the City of Morgan Hill also has several programs that support the key tenets of SB 743: greenhouse gas reductions, development of a multimodal network, and land use diversity. The following existing programs support the City’s current and future transportation goals related to VMT reduction:
Morgan Hill Economic Blueprint9
- Update the zoning code and parking requirements to modernize zoning code and allow for new hybrid of developments.
- Allow greater intensification (FAR) and taller buildings to increase value of employment lands.
- Identify parking management strategies in Downtown.
Vision Zero Morgan Hill10
- Include Complete Streets philosophies in street design.
- Seek opportunities to provide more balance in the multimodal network in Downtown.
Station Area Master Plan
- Explore a community shuttle bus program or increased TNC service.
- Explore carsharing if the right factors are there (e.g. proximity to transit, high population/housing density, low auto ownership, difficult parking).
Santa Clara County Guidance The Santa Clara Valley Transportation Authority (VTA) is the Congestion Management Agency (CMA) for Morgan Hill. As the CMA, VTA establishes the TIA Guidelines that local agencies use when analyzing the transportation impacts of land development projects on the region’s transportation system. VTA reviews TIAs for development projects that are projected to generate 100 or more net new weekday (a.m. or p.m.) peak hour trips11 for consistency with Congestion Management Program (CMP) standards. A TIA report must be submitted to VTA at least 20 calendar days before the development decision is scheduled.
VTA’s 2017 CMP sets the methodologies for assessing impacts to all modes and currently uses vehicles LOS to measure vehicle impacts. The CMP Transportation Analysis Standards Elements defines the vehicle LOS threshold for the CMP System as LOS E, except for facilities grandfathered in as LOS F. These guidelines also call for an evaluation of transit, bicycle, and pedestrian conditions. VTA is currently updating its CMP Transportation Analysis Standards Element and Multimodal Performance Measures Element to ensure compatibility with the new CEQA guidelines per SB 743.
9 2017 Morgan Hill Economic Blueprint, City of Morgan Hill, 2017. 10 Vision Zero Morgan Hill: Strategies to Eliminate Traffic Deaths and Serious Injuries. City of Morgan Hill, 2018. 11 Net new peak hour trips are trips not associated with an existing development on the site and not included in an approved project.

Morgan Hill SB 743 LOS-to-VMT Transition | DRAFT TASK 1 & 2 SUMMARY City of Morgan Hill
Nelson\Nygaard Consulting Associates, Inc. | 5
Existing Development Review Process This section documents the review process for development and transportation projects as it exists today based on relevant documents, websites, and discussions with City Staff.
The development review process includes the following steps:
1. Optional Preliminary Plan Review Procedure: Developers can receive input on a project from City departments before submitting a formal application. Preliminary Plan Review is mandatory for Planned Development projects.
2. Development Application: Planning Division receives the Completed Uniform Application, application fees, a planning entitlement project information sheet, and a project narrative that includes a written description of the project and a detailed scope of work. In the case of a housing project processing under SB330, a Preliminary Application is required followed by the Completed Application within a certain time period.
3. Initial Study: City staff determines the environmental review requirements. Projects that are estimated to generate fewer than 100 peak-hour vehicle trips are not typically required to conduct a full traffic study with LOS analysis, though circulation and operational analysis may still be required if deemed necessary by Planning staff. Those projects generating 100 or more motor vehicle trips are required to hire a transportation consultant who works at the City’s direction to prepare a Transportation Impact Analysis (TIA). The City prepares the TIA scope of work for the consultant.
4. Transportation Impact Reviews: TIA requirements are discussed in greater detail in a later section of this memo. TIAs are prepared to comply with CEQA to support a Categorical Exemption, or to support analysis in an Initial Study, which could result in preparation of a Negative Declaration (ND), Mitigated Negative Declaration (MND), or Environmental Impact Report (EIR).
5. CEQA Analysis: Through the CEQA analysis, projects identify potential environmental impacts and associated mitigations, which includes transportation impacts, along with other potential environmental impacts such as air quality, noise, and protected species.
6. Conditions of Approval: The Conditions of Approval describe developer obligations that must be met as a requirement of the permit. Mitigation measures identified in the CEQA document are also included in the adopted Conditions of Approval. Transportation-related Conditions of Approval typically include right-of-way improvements including curb ramps, sidewalks, bike facilities, signalization and other street improvements.
Residential Development Control System (RDCS)
The Residential Development Control System (RDCS) was originally approved by city voters in 1977 in response to concerns over the amount and pace of residential growth, and impacts of growth on City services and infrastructure.12 Under RDCS, developers who wish to build residential units in the City of Morgan Hill must undergo a project competition process. The competition involves a points-based evaluation system that utilizes a series of criteria and standards that are reflective of General Plan objectives. The RDCS competition is held every one to two years at the discretion of the City Council. The most recent iteration of this voter-approved measure, Measure S, was passed in 2016 and established a maximum of 215 residential
12 Ibid 7.

Morgan Hill SB 743 LOS-to-VMT Transition | DRAFT TASK 1 & 2 SUMMARY City of Morgan Hill
Nelson\Nygaard Consulting Associates, Inc. | 6
allotments each year. Award of allotments is not considered approval of a project, but rather authorizes an applicant to apply for entitlements. Subsequent to receiving RDCS building allotments, a project may need to file for land entitlements to complete the project including but not limited to building permits, design review, development agreements, and zoning amendments.
In October 2019, the California State Senate approved the final version of Senate Bill 330 (SB 330), a new law intended to accelerate housing construction across the State of California by allowing unlimited residential permits and expedited permitting processes. The New State Housing Law, which went into effect on January 1, 2020, suspends local practices that involve capping the number of new building permits issued. As a result, the City of Morgan Hill’s RDCS program is temporarily suspended until 2025.
Transportation Impact Analysis
The TIA process provides a mechanism to evaluate whether the transportation system is capable of supporting a proposed development, and to identify proportional mitigation measures. The lead agency conducts an initial study, or preliminary analysis of a project, to determine if a project may have a significant impact on the environment. The initial study also aids in determining what type of environmental document to prepare:
Negative Declaration – A statement that briefly describes the reasons that a proposed project will not have a significant impact on the environment.
Mitigated Negative Declaration – A statement similar to a negative declaration that includes measures to reduce or mitigate potential impacts to a point where no significant impact on the environment will occur.
Environmental Impact Report (EIR) – A detailed report that identifies potentially significant impacts which may include significant and unavoidable impacts from the project.
As defined in the General Plan, the City’s current transportation impact threshold of significance is LOS F in Downtown at Main Street and Monterey Road, along Monterey Road between Main Street and Fifth Street, and along Depot Street between First Street and Fifth Street. For all intersections and segments elsewhere, the impact threshold of significance is LOS D. The City also allows LOS E for identified freeway ramps and zones, road segments, and intersections that:
1. Provide a transition to or are located to the periphery of Downtown.
2. Are freeway zone intersections.
3. Where achieving LOS D could result in interim intersection improvements that may be built over once the City’s network has been completed.
These designated elements of the roadway network are listed within the General Plan.
Traffic Impact Fee
The City of Morgan Hill has several development impact fees. The fees fund improvements to public facilities based on the increased demand associated with new projects. Impact fees for residential projects are assessed by the number of dwellings; while commercial and industrial projects are assessed impact fees based on site acreage, building square footage, and proposed usage. The following fee categories apply to new developments:

Morgan Hill SB 743 LOS-to-VMT Transition | DRAFT TASK 1 & 2 SUMMARY City of Morgan Hill
Nelson\Nygaard Consulting Associates, Inc. | 7
• Traffic
• Park
• Sewer (outside RDA boundary)
• Water
• Storm Drain
• Public Facilities
• Library
• Community/Recreational Centers
• Public Safety Facilities
Traffic impact fees (TIF) provide an opportunity to establish funding that supports capital improvements. Included in the TIF calculations are the Priority Bikeway Projects designated within the Bikeways, Trails, Parks, and Recreation Master Plan.
In October 2019, the City Council approved a resolution to update selected development impact fees, which includes TIFs. As part of the resolution, Council agreed to reduce the funding allocated to total Priority Bikeways projects by one-third or approximately $4 million, which has resulted in a lower than maximum justified traffic impact fee schedule. Figure 1 provides a summary of traffic impact fees based on land use type.
Figure 1 Traffic Impact Fees
Land Use Fee Per
Single Family $3,373 Dwelling Unit
Multi Family (> 1,200 SF) $2,090 Dwelling Unit
Multi Family (<1,200 SF) $1,316 Dwelling Unit
Senior/Downtown (>1,200 SF) $2,090 Dwelling Unit
Senior/Downtown (<1,200 SF) $1,316 Dwelling Unit
Commercial $3,373 Peak Hour Trip
Industrial $3,373 Peak Hour Trip
Office $3,373 Peak Hour Trip
Auto Dealership $3,373 Peak Hour Trip
Hotel $3,373 Peak Hour Trip Source: City of Morgan Hill Public Works Department Fee Schedule effective 01.15.2020


Morgan Hill SB 743 LOS-to-VMT Transition | DRAFT TASK 1 & 2 SUMMARY City of Morgan Hill
Nelson\Nygaard Consulting Associates Inc. | 9
2 STAKEHOLDER INTERVIEW SUMMARY
Nelson\Nygaard conducted an interview with staff members from the Planning Division, Land Development Engineering Division, Engineering & Utilities Department, the Development Services Director and the City Attorney on February 26, 2020. This chapter of the report fulfills the deliverable of Task 2 by providing a summary of staff input and key takeaways to inform the implementation of SB 743 in the City of Morgan Hill.
Overall Themes Morgan Hill has a unique geographic context within Santa Clara County. The
close proximity to job centers in Silicon Valley means many residents commute to the more urban areas to the north, but still live far enough away that the City has a small-town feel. The transportation aspect of this context makes US-101 the main connection to jobs and other destinations outside of Morgan Hill, and congestion on US-101 and highway access points is a common concern among residents. Due to congestions on US-101, Morgan Hill experiences significant cut-through traffic at peak times; as many as 1/3 of travelers take local roads such as Monterey Road or Butterfield Blvd. Monterey Road is the old US-101 route and the primary, continuous parallel regional route while also serving as a main street for Downtown Morgan Hill.
Morgan Hill’s development-review process does not need a major overhaul. Changes to environmental review are in line with the vision of the General Plan, however, public concerns around traffic and parking impacts still need to be addressed. LOS has provided a shared analysis language and implementing SB 743 will require developing a shared language for VMT.
Other state laws need to be factored in. SB 330 went into effect in January 2020. The bill changes residential development in Morgan Hill by suspending the RDCS for five years. An increase in residential development is anticipated in Morgan Hill.
City staff stakeholders prefer to maintain LOS outside of CEQA. LOS is used to analyze project impacts and communicate specific traffic information. For example, elements of LOS analysis inform updates for signal light timing. There are public concerns around traffic related to new development, and the high volume of pass-through commutes using surface streets to avoid highway congestion, which may require analysis of traffic operations.
Traffic congestion and parking are frequently raised as the primary transportation topics of most interest. At public meetings and in public comments, concern is voiced around traffic, especially focused on drivers using city streets to avoid

Morgan Hill SB 743 LOS-to-VMT Transition | DRAFT TASK 1 & 2 SUMMARY City of Morgan Hill
Nelson\Nygaard Consulting Associates Inc. | 10
US-101 congestion, and delays on local streets to access or cross US-101. Project parking requirements, especially downtown, is also a common concern. There was general agreement that this project team will need to thoughtfully communicate why VMT per capita is the required metric for environmental impact review.
Transportation mitigations may need updating. The existing Transportation Demand Management (TDM) ordinance may require an update to support the new transportation review and VMT mitigation process. The TIF was recently updated and provides a functional mechanism to collect revenue in support of transportation investment needs; however, the specific projects called for by the TIF may need to be revisited to ensure they do not induce VMT and trigger an impact under the new CEQA review.
Specific Takeaways
Legal Framework
The following points address the existing legal framework for environmental review, the development process, and anticipated changes by City staff:
RDCS. The RDCS was the first step in the residential development process and included commitments to fund improvements in Morgan Hill, including multimodal transportation improvements such as bicycle lanes and sidewalks. Due to its five-year suspension, that funding will not be available.
Environmental Review. The environmental review process as it stands today works well, however, CEQA review is triggered based on standard trip generation assumptions rather than the VMT generated. Transportation impacts are a key development concern among the public and can become a sticking point in the review process.
Transportation analysis. Staff felt that continuing to measure LOS is an important measure for road operations. A non-CEQA transportation analysis that includes road operations will need to be created, along with a method for incorporating operational improvements into the Conditions of Approval as needed. The measures in the Conditions of Approval that are not in CEQA cannot be called or considered mitigations.
Conditions of Approval. The City’s standard conditions of approval address routine transportation, (i.e. bicycle lanes are built based on the Bikeways, Trails, Parks, and Recreation Master Plan and a project’s proximity). For projects that require CEQA mitigation, the mitigations identified in CEQA are written into the conditions of approval.
Supporting Policies and Programs
The following points relate to land use decision, transportation, funding, and VMT:
Transportation Funding. The long-range transportation planning document is the Transportation Element of the General Plan. Projects included in the TIF are based on the Transportation Element. Many elements of the transportation system are built as funding comes in from individual projects, both via the TIF and specific CEQA mitigations for larger projects. Individual project impact mitigations are also used to build out or increase capacity of some parts of the road network.
Annexation. Morgan Hill is surrounded by Santa Clara County and has expanded the geographic boundary by annexation in the past. Staff felt that geographic area expansion

Morgan Hill SB 743 LOS-to-VMT Transition | DRAFT TASK 1 & 2 SUMMARY City of Morgan Hill
Nelson\Nygaard Consulting Associates Inc. | 11
is not likely in the near future. Instead, growth will be focused in the Urban Service Area where the infrastructure to support development is located.
Parking. Parking, both on-street and off-street, is typically provided for free. The current zoning code defines minimum off-street parking requirements, and the general public perception is that there is not enough parking. A relatively new parking facility downtown supports a “park once” district in downtown. Additionally, the first truly mixed-use projects are under construction, which may reduce parking demand and potentially enable shared parking. Shared parking between different land uses currently requires a conditional use permit.
Transportation Demand Management (TDM). Morgan Hill has a Citywide TDM Ordinance that allows for reduced parking with a TDM program. There is one apartment project in the planning phase that is in the process of including it. TDM is required for the life of the project.
Transit. Transit Service in Morgan Hill is provided by VTA and Caltrain. Caltrain operates three peak-direction trains per day. VTA operates multiple bus routes, however, the frequencies are limited and the perception is that there is a lack of transit service, particularly to reach destinations outside of Morgan Hill. Transit service cuts made during the 2008 recession have not been reinstated.
Engagement Needs
Updating the General Plan to remove LOS as a criterion for significance requires public notice and approval by the Planning Commission and the City Council. The following points were made regarding public engagement:
Required process. Implementing SB 743 in Morgan Hill will require a General Plan amendment, a set process with standard public notice requirements.
Key communication issues. There is a need to effectively communicate how the change from LOS to VMT fits in with the development process and the General Plan, and how this will support continued maintenance of local quality of life in Morgan Hill. Residents are particularly concerned about traffic congestion and capacity constraints along US-101. Parking supply and the pace and scale of development as a whole are also frequently raised issues, and an organized group has expressed opposition to several development plans.
Engagement tools. Engagement for this project will build on City’s efforts to engage the public using social media, the City’s website, and updates to the public, Planning Commission, and City Council.
3 VMT ANALYSIS TOOLS This section provides a review of travel demand models and the associated VMT outputs that are relevant for the City of Morgan Hill, including the following topics:
Morgan Hill SB 743 LOS-to-VMT Transition | DRAFT TASK 1 & 2 SUMMARY City of Morgan Hill
Nelson\Nygaard Consulting Associates Inc. | 12
Overview of state guidance and VMT metrics
Overview of existing VMT models and data outputs from MTC and VTA, including maps of VMT outputs for Morgan Hill
The VMT outputs of both the MTC and VTA models can be used to implement two key aspects of SB 743: 1) creating map-based screens, and 2) establishing the VMT base from which to build additional VMT analysis, including VMT mitigation.
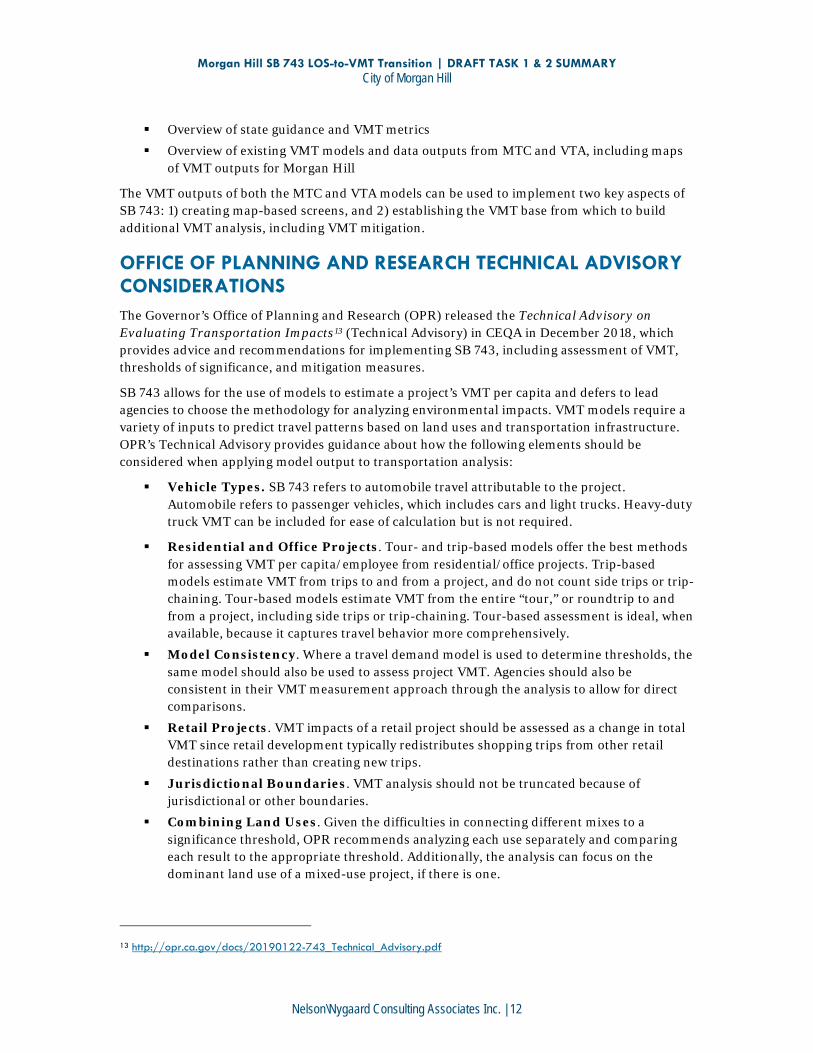
OFFICE OF PLANNING AND RESEARCH TECHNICAL ADVISORY CONSIDERATIONS The Governor’s Office of Planning and Research (OPR) released the Technical Advisory on Evaluating Transportation Impacts13 (Technical Advisory) in CEQA in December 2018, which provides advice and recommendations for implementing SB 743, including assessment of VMT, thresholds of significance, and mitigation measures.
SB 743 allows for the use of models to estimate a project’s VMT per capita and defers to lead agencies to choose the methodology for analyzing environmental impacts. VMT models require a variety of inputs to predict travel patterns based on land uses and transportation infrastructure. OPR’s Technical Advisory provides guidance about how the following elements should be considered when applying model output to transportation analysis:
Vehicle Types. SB 743 refers to automobile travel attributable to the project. Automobile refers to passenger vehicles, which includes cars and light trucks. Heavy-duty truck VMT can be included for ease of calculation but is not required.
Residential and Office Projects. Tour- and trip-based models offer the best methods for assessing VMT per capita/employee from residential/office projects. Trip-based models estimate VMT from trips to and from a project, and do not count side trips or trip-chaining. Tour-based models estimate VMT from the entire “tour,” or roundtrip to and from a project, including side trips or trip-chaining. Tour-based assessment is ideal, when available, because it captures travel behavior more comprehensively.
Model Consistency. Where a travel demand model is used to determine thresholds, the same model should also be used to assess project VMT. Agencies should also be consistent in their VMT measurement approach through the analysis to allow for direct comparisons.
Retail Projects. VMT impacts of a retail project should be assessed as a change in total VMT since retail development typically redistributes shopping trips from other retail destinations rather than creating new trips.
Jurisdictional Boundaries. VMT analysis should not be truncated because of jurisdictional or other boundaries.
Combining Land Uses. Given the difficulties in connecting different mixes to a significance threshold, OPR recommends analyzing each use separately and comparing each result to the appropriate threshold. Additionally, the analysis can focus on the dominant land use of a mixed-use project, if there is one.
13 http://opr.ca.gov/docs/20190122-743_Technical_Advisory.pdf

Morgan Hill SB 743 LOS-to-VMT Transition | DRAFT TASK 1 & 2 SUMMARY City of Morgan Hill
Nelson\Nygaard Consulting Associates Inc. | 13
Cumulative Impacts. Efficiency-based metrics used to analyze residential and office projects (per capita or per employee) do not have a cumulative impact distinct from the project impact as long as they are below the efficiency threshold and aligned with long-term environmental goals and relevant plans. Retail and transportation projects use an absolute VMT metric (total VMT) that does allow for a cumulative impact analysis. For land use projects near planned transportation or other investments that are anticipated to reduce VMT, the significance thresholds will still need to be met or mitigated in the base year. If transit improves and the future VMT per capita in that location is reduced through future investments, it is possible that TDM programs could be reviewed and scaled back at a later date. Area plans allow more flexibility in interpreting cumulative impacts alongside other area plan investments that are schedule to be completed in phases.
VEHICLE MILES TRAVELED METRICS This section defines and describes the calculations for the different VMT metrics recommended by OPR for analysis (Figure 2). Vehicle Miles Traveled measures the amount and distance people drive by personal vehicle to a destination. Typically, development projects that are farther from other complementary land uses, and in areas lacking transit or active transportation infrastructure, generate more VMT per capita than development projects that are near complementary land uses and robust transportation options.
Total VMT
Vehicle Miles Traveled, or VMT, measures the amount and distance people drive by personal vehicle to a destination. Total VMT is calculated by multiplying the total number of vehicles on all roadway segments within a geographical area by the average miles traveled per vehicle. Using an absolute VMT metric like total VMT may be appropriate for assessing a project’s cumulative impacts.
Household VMT per capita
Household VMT per capita is calculated as the total miles of household vehicle travel divided by the total population within a specific geography. OPR recommends using VMT per capita for analyzing transportation impacts for residential projects. Projects that generate VMT per capita that exceeds 15 percent below existing levels, measured regionally or at the city level, may indicate a significant transportation impact.
Employment VMT per employee
Employment VMT per employee is calculated as the total miles of employment vehicle travel divided by the total number of workers within area specific geography. OPR recommends using VMT per employee for analyzing transportation impacts for office projects. Projects that generate VMT per employee that exceeds 15 percent below existing regional VMT per employee may indicate a significant transportation impact. Travel to and from work typically crosses city boundaries, and therefore the threshold is set using a regional average baseline. The region can be defined as the County or regional planning body.

Morgan Hill SB 743 LOS-to-VMT Transition | DRAFT TASK 1 & 2 SUMMARY City of Morgan Hill
Nelson\Nygaard Consulting Associates Inc. | 14
Figure 2 Vehicle Miles Traveled Metrics

Morgan Hill SB 743 LOS-to-VMT Transition | DRAFT TASK 1 & 2 SUMMARY City of Morgan Hill
Nelson\Nygaard Consulting Associates Inc. | 15
EXISTING VMT MODELS Regional travel forecasting models are used to understand the long-range impacts to travel demand of alternative policies and investments in transportation and land use. One of the many outputs produced by such models is VMT. VMT is currently used for planning and greenhouse gas emissions modeling. For CEQA purposes, the VMT estimates illustrate relative travel patterns and do not describe precise, absolute VMT. MTC builds and maintains an activity-based regional travel model for the nine-county San Francisco Bay Area (San Francisco, San Mateo, Santa Clara, Alameda, Contra Costa, Solano, Napa, Sonoma, and Marin Counties) and VTA builds and maintains a regional trip-based model with more granularity in Santa Clara County. This section describes various VMT metrics and each model’s purpose, primary inputs, outputs, and model sophistication.
Figure 3 shows the difference in how the same travel is captured by different models. A trip-based model captures individual trips such as home to work and home to school trips. A tour-based model captures the entire “tour” such as home to work and home to school trips and including the additional VMT for side trips to get lunch or go shopping; one example tour-based trip may include home to school to lunch to visit a friend to grocery store to home.
Figure 3 Comparison of Trip-Based and Tour-Based Models
MTC’S REGIONAL TRAVEL DEMAND MODEL
Background
MTC and the Association of Bay Area Governments (ABAG) lead regional planning for the nine- county Bay Area. MTC built Travel Model 1, a travel demand model for Play Bay Area—the 2040 long range plan adopted in 2013. The model was updated when the final Plan Bay Area 2040 was adopted in 2017.

Morgan Hill SB 743 LOS-to-VMT Transition | DRAFT TASK 1 & 2 SUMMARY City of Morgan Hill
Nelson\Nygaard Consulting Associates Inc. | 16
Transportation Analysis Zones (TAZs) were used to build MTC’s travel and land use model structures. The TAZs are consistent with the 2010 Census Tract boundaries for Morgan Hill and Santa Clara County. The MTC model TAZs are larger than the VTA model TAZs. The MTC model has 8 TAZs in Morgan Hill with a median size of 5,714 acres.
Model Specifics
Travel Model 1 is an activity-based model. The model creates a synthetic population of households and individuals using census data for past year model runs and future land use forecasts for future year model runs. Travel behavior responses are modeled for the synthetic population in response to other inputs such as pricing, land use changes, and transportation system changes. Activity-based models can model realistic constraints of time and space, and the linkages among activities and travel. The MTC model is a partial activity-based model since it aggregates transit and commercial vehicle behavior on roadways and transit facilities rather than modeling them as individual tours. An activity-based model is a tour-based model since it is able to model tours, or trip-chaining (home to work to store to home) rather than separate trips (home to work / work to store / store to home). Modelling at an individual tour-based level allows the model to more realistically represent the effect of travel conditions on activity and travel choices than a trip-based model.
Running the model requires the following steps:
Step 1. MTC’s population synthesizer creates a population of agents that represent the existing population and is calibrated using existing census data and land use forecasts.
Step 2. The travel model simulates a series of travel-related choices for the synthetic population. Travel decisions are constrained by a variety of factors including location, time, automobile access, congestion, transit access, and price.
The following are the primary inputs in addition to the population synthesizer described above:
• Land use. Existing and future land use scenarios can be tested based on how they change the synthetic population and where they live and work.
• Roadway and transit supply. The travel model constrains travel choices based on road capacity, congestion, and transit capacity.
• Prices. Prices are used to model how different travelers respond to time and monetary costs for the following: value of time, bridge tolls, express lane tolls, parking prices, transit fares, and vehicle operating costs.
Model Validation
MTC’s model was validated by modeling a run with the land use and transportation networks of 2010, compared against American Community Survey and Census Data as well as real 2010 counts of traffic volumes and transit ridership. The overall model is refined until it is statistically valid and accepted by the MTC board and other modeling agencies such as the various county models. Corridor-level deviations from observed travel patterns do not invalidate the model for CEQA purposes.

Morgan Hill SB 743 LOS-to-VMT Transition | DRAFT TASK 1 & 2 SUMMARY City of Morgan Hill
Nelson\Nygaard Consulting Associates Inc. | 17
MTC’s Model Outputs
VMT per Capita (MTC)
VMT is one of the outputs of the MTC model. Figure 4 shows the VMT per capita for the nine-county Bay Area region and Morgan Hill, and the 15% reduction from that number. The 15% reduction below average is a recommended threshold from OPR and is provided here to demonstrate the possible VMT per capita threshold for the City of Morgan Hill.
Figure 4 MTC Daily VMT per Capita
Geography VMT per Capita (miles)
Average for 2020 15% below 2020 average
9-County Bay Area Region 14.61 12.42
Morgan Hill 17.75 15.09
Figure 5 shows a map of VMT per capita using the MTC model data in relation to the local (city) average. Given that the regional VMT is lower than Morgan Hill, the map uses Morgan Hill’s average VMT per capita as the baseline.
There are currently no TAZs in the City that are below the proposed threshold of 15% below average VMT per capita, which indicates that proposed projects would require some degree of mitigation. If Morgan Hill were to use the regional average VMT per capita to set thresholds, the existing VMT per capita at any given location would require additional mitigation to meet the lower VMT per capita threshold.
The orange shows areas above average, but where a residential project could potentially still mitigate VMT with TDM. The red shows areas 15% or more above the City’s average VMT per capita. Residential projects in red TAZs that require environmental review would have difficulty mitigating VMT through TDM alone.

Morgan Hill SB 743 LOS-to-VMT Transition | DRAFT TASK 1 & 2 SUMMARY City of Morgan Hill
Nelson\Nygaard Consulting Associates Inc. | 18
Figure 5 VMT per capita (MTC) Variation from Local Mean
VMT per Employee (MTC)
Figure 6 shows the average VMT per employee for the nine-county Bay Area region and the 15% reduction from that number to demonstrate the possible VMT per employee threshold for the City of Morgan Hill.
Figure 6 MTC Daily VMT per Employee
Geography VMT per Employee (miles)
Average for 2020 15% below 2020 average
9-County Bay Area Region 22.35 19.00

Morgan Hill SB 743 LOS-to-VMT Transition | DRAFT TASK 1 & 2 SUMMARY City of Morgan Hill
Nelson\Nygaard Consulting Associates Inc. | 19
Figure 7 shows a map of VMT per employee using the MTC model data. This map includes the areas designated in the General Plan as employment land use (e.g. industrial and industrial/commercial) to indicate the areas of the City where VMT per employee is most relevant. Unlike residential land use, employment land uses typically induce regional travel as people who work in a city do not necessarily live there. OPR’s Technical Advisory recommends using regional averages to define the employment land use threshold. While residential land use around the Morgan Hill Caltrain station is modeled to have VMT per capita that ranges from the City average to 15% above that average, the employment land use in the same TAZ has a relatively low VMT per employee that falls below the regional average per employee.
There are no TAZs in Morgan Hill that are currently less than the proposed threshold of 15% below the regional average VMT per employee. As a result, no office projects in Morgan Hill would be presumed to have a less-than-significant impact using the MTC data. With additional planning and VMT mitigations such as TDM programs, however, transportation impacts of employment land uses can still be mitigated. Yellow and orange TAZs are closer to the threshold of significance and would require less substantial TDM investments than red TAZs, which are 15% or more above the regional average VMT per employee.

Morgan Hill SB 743 LOS-to-VMT Transition | DRAFT TASK 1 & 2 SUMMARY City of Morgan Hill
Nelson\Nygaard Consulting Associates Inc. | 20
Figure 7 VMT per employee map (MTC) Variation from Regional Mean

Morgan Hill SB 743 LOS-to-VMT Transition | DRAFT TASK 1 & 2 SUMMARY City of Morgan Hill
Nelson\Nygaard Consulting Associates Inc. | 21
VTA REGIONAL TRANSPORTATION MODEL
Background
VTA is the Congestion Management Agency (CMA) for Santa Clara County. CMAs are responsible for assessing, monitoring, and improving the regional transportation network of Santa Clara County. Part of that role is maintaining a countywide travel demand model. VTA’s model is a web-based tool that includes a GIS front end. The VTA model uses TAZs and parcels to build the model structure.
The VTA model covers the same geography as the MTC model, however, it includes Monterey, Santa Cruz, San Benito and San Joaquin Counties, totaling 13 counties. The VTA model has a greater level of detail in terms of zone structure (smaller TAZs) for Santa Clara County. The current VMT model for Santa Clara County cities reflects the most current base data: 2017 ABAG land use assumptions and 2015 base data for all other factors.
The model is maintained and updated in compliance with Congestion Management Program (CMP) legislation. CMAs are required to develop a uniform database on traffic impacts for use in a countywide travel demand model and be consistent with the regional travel demand model.
Model Specifics
VTA’s travel demand model is a trip-based model. VTA model outputs present higher VMT estimates compared to the MTC model. The VTA model counts trips to and from one location (e.g. home to work) but does not count any trips taken in between. Since it does not account for trip chaining, where presumably shorter, individual trips are linked together (e.g. home to coffee shop, coffee shop to work, work to home), VTA’s model assumes each individual trip is longer than what is estimated in a tour-based model.
A trip-based model typically involves four steps:
1. Trip Generation: Estimation of the number of trips produced by and attracted to each TAZ – in other words, all trips for which the TAZ is either an origin or destination.
2. Trip Distribution: Connect where trips are produced and where they are attracted to – identifying origin-destination pairs.
3. Mode Choice: Determination of mode choice for each trip – to identify the associated vehicle for each trip.
4. Trip Assignment: Assignment of prediction to specific network facilities or routes used for each trip – based on trip type and distribution assumptions, identify the specific roads used for each trip.
Once the model runs through the four steps, the model runs through these same four steps several times to adjust trip assignment in response to modeled congestion to better reflect that individual trip patterns are informed by existing road operations.
The following are the primary inputs:
Land use data. Consistent with Association of Bay Area Governments 2017 land use assumptions but applied to a more detailed geography given the smaller TAZ size and based on input from jurisdictions.
Transportation networks. Including road, transit, and bicycle facilities.

Morgan Hill SB 743 LOS-to-VMT Transition | DRAFT TASK 1 & 2 SUMMARY City of Morgan Hill
Nelson\Nygaard Consulting Associates Inc. | 22
Pricing information. Vehicle operating costs, parking costs, bridge tolls, express lanes, transit fares.
Trip generators. Other than population and employment (e.g. port, airport).
Model Validation
The VTA model is calibrated and validated by modeling against the most recent travel data on traffic volumes, transit boardings, and bicycle volumes. It is also validated against and required to be consistent with the MTC’s regional model. The overall model is refined until it is statistically valid and accepted by the VTA board and other modeling agencies such as MTC.
VMT Smoothing
VTA incorporated a smoothing algorithm that allows for VMT analysis at the parcel level to ensure that all areas of the City are represented through proper nearest neighbor statistical considerations. The methodology used to calculate VMT values at the parcel level is based on the assumption that VMT per capita or per employee depends on both the VMT value for the TAZ where each parcel is located, and on the VMT value of surrounding TAZs. VMT per capita or VMT per employee for a parcel is defined as the population or employment weighted average of the VMT values for all TAZs that are within a half-mile buffer around the parcel.
VTA’s Model Outputs
VMT per Capita (VTA)
Figure 8 shows the VMT per capita (Based on VTA Travel Demand Model utilizing the 13-County area) for the 9-County Bay Area Region, Santa Clara County, and Morgan Hill and the 15% reduction from those figures. The Bay Area and Santa Clara County have a lower average VMT per capita than Morgan Hill.
Figure 8 VTA Daily VMT per Capita
Geography VMT per Capita (miles)
Average for 2020 15% below 2020 average
9-County Bay Area Region 13.95 11.88
Santa Clara County 13.33 11.33
Morgan Hill 24.64 20.95
Figure 9 shows a map of VMT per capita using the VTA model data at the parcel level. Given that the average 9-County region VMT per capita and Santa Clara County VMT per capita are both lower than Morgan Hill, the map uses Morgan Hill’s citywide average VMT per capita as the baseline to show the maximum area that would have a less-than-significant impact. The 15% reduction from the City’s average is shown in the map in green. Projects in these areas could be presumed to have no significant VMT impact.
The yellow shows parcels that are below the City’s average VMT per capita and are the easiest areas to mitigate VMT. The areas shown in orange are above average, but where residential projects could potentially still mitigate VMT with a substantial investment in TDM.

Morgan Hill SB 743 LOS-to-VMT Transition | DRAFT TASK 1 & 2 SUMMARY City of Morgan Hill
Nelson\Nygaard Consulting Associates Inc. | 23
Areas in red are 15% or more above the City’s average VMT per capita. Residential projects in red areas that require environmental review would not be able to mitigate VMT through TDM alone.
Figure 9 VTA Model, Variation from Morgan Hill Citywide Average VMT per Capita
VMT per Employee (VTA)
Figure 10 shows the average VMT per employee (Based on VTA Travel Demand Model utilizing the 13-County area) for the 9-County Bay Area Region and Santa Clara County and the 15% reduction from those values. The Santa Clara County average skews higher than the 9-County Bay Area Region average as it includes travel from other counties into Santa Clara County. The 9-

Morgan Hill SB 743 LOS-to-VMT Transition | DRAFT TASK 1 & 2 SUMMARY City of Morgan Hill
Nelson\Nygaard Consulting Associates Inc. | 24
County Bay Area Region average skews lower because it includes more travel between main metropolitan areas.
Figure 10 VTA Daily VMT per Employee
Geography VMT per Employee (miles)
Average for 2020 15% below 2020 average
9-County Bay Area Region 15.33 13.03
Santa Clara County 16.64 14.14
Figure 11 shows a map of VMT per employee using the VTA model data. This map includes the areas designated in the General Plan as employment land use (e.g. industrial and industrial/commercial) to indicate the areas of the City where VMT per employee is most relevant. Unlike residential land use, employment land uses induce travel that extends beyond city boundaries as people who work in a city do not necessarily live there, therefore OPR’s Technical Advisory recommends that the threshold of significance for office land uses refers to a regional average. The map uses the 9-County Bay Area Region average VMT per employee as the baseline. While residential land uses near the Morgan Hill Caltrain station is modeled to have a low VMT per capita, these parcels have a relatively high VMT per employee for office land use, at more than 15% above the countywide average VMT per employee.
There are no parcels in Morgan Hill that are currently less than the proposed threshold of 15% below the 9-County Bay Area Region average VMT per employee. As a result, Morgan Hill may not be able to use a map-based screen for employment land uses. With additional planning and VMT mitigations such as TDM programs, however, employment land uses can still receive a negative declaration or mitigated negative declaration.

Morgan Hill SB 743 LOS-to-VMT Transition | DRAFT TASK 1 & 2 SUMMARY City of Morgan Hill
Nelson\Nygaard Consulting Associates Inc. | 25
Figure 11 VTA Model, Variation from 9-County Bay Area Region Average VMT per Employee
Figure 12 shows a map of VMT per employee using the VTA model data. This map includes the areas designated in the General Plan as employment land use (e.g. industrial and industrial/commercial) to indicate the areas of the City where VMT per employee is most relevant. The map uses the Santa Clara County average VMT per employee as the baseline. The areas shown in orange are above average, but where office projects could potentially still mitigate VMT with a substantial investment in TDM.
There are no parcels in Morgan Hill that are currently less than the proposed threshold of 15% below the County average VMT per employee. As a result, Morgan Hill may not be able to use a map-based screen for employment land uses. A negative declaration or mitigated negative

Morgan Hill SB 743 LOS-to-VMT Transition | DRAFT TASK 1 & 2 SUMMARY City of Morgan Hill
Nelson\Nygaard Consulting Associates Inc. | 26
declaration is still attainable with proper planning and TDM for employment land uses in areas that are 15% or more above the County average.
Figure 12 VTA Model, Variation from County Average VMT per Employee
REGIONAL MODEL DIFFERENCES Geographical Granularity
One key difference between the MTC model and VTA model is the size of the transportation analysis zones (TAZ) and the VTA model’s provision of parcel-level analysis. The MTC model has

Morgan Hill SB 743 LOS-to-VMT Transition | DRAFT TASK 1 & 2 SUMMARY City of Morgan Hill
Nelson\Nygaard Consulting Associates Inc. | 27
8 relatively large TAZs that overlap with Morgan Hill jurisdiction boundaries, and a small portion of the TAZs fall within Morgan Hill boundaries. VTA’s model, on the other hand, includes a smoothing algorithm that enables VMT analysis at the parcel level informed by assumption about the travel characteristics of bordering areas.
Relevance for Morgan Hill
Both regional models provide valid data outputs and unique strengths, however, Morgan Hill would benefit more from using VTA’s model. VTA’s model may be better calibrated to Santa Clara County and Morgan Hill. While MTC’s model provides a more accurate representation of the region, due to the larger geography of MTC’s model, it is not focused specifically on Santa Clara County when calibrating the results.
VTA’s model validates travel at screenlines within Santa Clara County. The VTA model’s smoothing algorithm allows for more granular analysis at the parcel level, which may enable this model to capture trips more accurately in these areas than the MTC model. Analysis at the parcel level is also more intuitive from a developmental review standpoint, particularly as CEQA requirements are focused on site-specific development.
Another consideration is how often the model is updated and which agency can best respond to Morgan Hill’s request for updated data. Morgan Hill will need to develop a process for updating local threshold definitions as new VMT data becomes available from either MTC or VTA. Since VTA’s work is primarily focused on supporting cities rather than counties for this effort, VTA may be able to provide more modeling support to cities such as Morgan Hill throughout this process.
COUNTYWIDE VMT EVALUATION TOOL VTA’s VMT Evaluation Tool is an online tool intended for developers to evaluate whether proposed land use projects in Santa Clara County would generate VMT impacts. Using VTA’s travel demand model, the tool estimates the per capita and per employee VMT at the parcel level. Preliminary calculations are compared to distinct impact thresholds that users can select based on the thresholds set by the lead agency where the project is located. The tool uses current Assessor’s Parcel Numbers (APN) as defined by the Santa Clara County Office of the Assessor and does not estimate impacts for retail land uses.
For projects that have a VMT per capita or VMT per employee above the threshold and would trigger a VMT impact, the tool provides an estimate of how much each VMT reducing strategy would mitigate those impacts. The tool allows users to select from four tiers of strategies.
Tier 1: Project Characteristics. Factors land use characteristics, such as density, mix of uses, and housing affordability, that reduce VMT by increasing access to amenities or by attracting residents who generate lower VMT than the average threshold.
Tier 2: Multimodal Infrastructure. Improvements to the transportation network that encourage the use of biking, walking, and public transit. Improvements are funded and/or built by developers.
Tier 3: Parking. Strategies that reduce automobile parking supply and provide high-quality bicycle parking.
Tier 4: Transportation Demand Management (TDM) Programs. Strategies that incentivize programs such as ride sharing, transit subsidies, and shuttle services.
The tool also establishes VMT reduction maximums for each tier and across multiple tiers to ensure that strategies targeting travel behavior in similar ways are not over-counted.
Morgan Hill SB 743 LOS-to-VMT Transition | DRAFT TASK 1 & 2 SUMMARY City of Morgan Hill
Nelson\Nygaard Consulting Associates Inc. | 28
4 STATE GUIDANCE AND CASE STUDIES
Several California state agencies have published guidance materials to support cities and other lead agencies update their transportation impact review policies in compliance with SB 743. This section provides background on the relevant agencies and their guidance. Since SB 743 was signed into law in 2013, multiple cities have adopted VMT-based analysis requirements. Each city provides a case study of practical approaches to implementing VMT-based thresholds for environmental review, screens to streamline review, and the continued use of LOS outside of CEQA. This section provides an overview of the distinct approaches used by the cities of Pasadena, San José, and Elk Grove.
California Air Resources Board
The California Air Resources Board (CARB) is responsible for developing the State of California’s plan to achieve its 2030 and 2050 greenhouse gas (GHG) reduction targets mandated by law. The CARB 2017 Scoping Plan identifies that slower growth in VMT from more efficient land use development patters as consistent with implementing SB 743 would result in an achievement of the State’s climate goals. CARB’s scenario modeling provides the substantial evidence needed to ensure consistency between SB 743 and the State climate goals. The scenario modeling includes improved vehicle technologies, lower carbon fuels, the slower growth in VMT and the interaction of those factors. Thus, even with new technology and widespread electrification of vehicle fleets, reducing VMT growth is essential.14
Office of Planning and Research
In December 2018, the Governor’s Office of Planning and Research (OPR) published their latest Technical Advisory on Evaluating Transportation Impacts in CEQA (Technical Advisory) to assist lead agencies in implementing SB 743. This document includes methods for determining screening thresholds and significance thresholds, which are presented below along with examples from other cities.
Caltrans
The California Department of Transportation (Caltrans) published draft Transportation Impact Study Guide (TISG) in February 2020. Like the OPR Technical Advisory, the TISG is a reference document that provides guidance regarding Caltrans review of land use projects or plans. Caltrans
14 California Air Resources Board 2017 Scoping Plan-Identified VMT Reductions and Relationship to State Climate Goals, January 2019, page 6.

Morgan Hill SB 743 LOS-to-VMT Transition | DRAFT TASK 1 & 2 SUMMARY City of Morgan Hill
Nelson\Nygaard Consulting Associates Inc. | 29
reviews projects and plans as a commenting agency and is an important stakeholder on many types of projects. Caltrans recommends the use of OPR’s Technical Advisory and comments may note methodological deviations from OPR and CARB’s Scoping Plan.15
CASE STUDY CITIES Prior to the release of the final OPR Technical Advisory, multiple cities adopted VMT-based analysis requirements, providing case studies of practical approaches to establishing VMT-based thresholds for environmental review. The following sections present a review of the VMT thresholds of significance and screening thresholds for both land use and transportation projects based on best practices implemented by other cities and OPR’s recommendations. The cities covered in this memorandum are Pasadena, San José, and Elk Grove, and a summary of each cities’ SB 743 compliant policy is provided in Figure 13.
Pasadena
The City of Pasadena was the first to remove LOS from the City’s environmental review, adopted in 2014 before OPR’s Technical Advisory was released. The City implemented the switch from LOS to VMT during a General Plan update and used their own travel demand model to determine thresholds. Since their policy was developed prior to OPR’s Technical Advisory it contains additional metrics such as vehicle trips and VMT per service population (population + jobs in a geographic area). The City also adopted updated Transportation Impact Guidelines and Guidelines for Transportation Review of Projects to provide TIA methodologies and consistent information on the development process.
San José
The City of San José adopted Council Policy 5-1 in February 2018, adopting VMT as the metric used to measure transportation impacts in CEQA analysis. The policy adopts VMT thresholds, screening criteria, and requirements for local transportation analysis, including local operational analysis. A Transportation Analysis Handbook and VMT Evaluation Tool were developed to aid in the implementation of Policy 5-1 and provide consistency to the TIA process. The City used their own travel demand model to develop local VMT thresholds and screening maps.
Elk Grove
Adopted in 2019, Elk Grove used a General Plan Update to remove LOS and adopt VMT-based thresholds of significance. The General Plan Update coincided with an update to City’s Transportation Analysis Guidelines that provides further details on transportation policies, consistent with the General Plan. Although adopted after OPR’s Technical Advisory was issued, the City of Elk Grove deviates from OPR guidance by using measuring VMT per service population that divides total VMT by households and jobs.
15 Caltrans, Transportation Impact Study Guide: Vehicle Miles Traveled-Focused Draft, February 2020.

Morgan Hill SB 743 LOS-to-VMT Transition | DRAFT TASK 1 & 2 SUMMARY City of Morgan Hill
Nelson\Nygaard Consulting Associates Inc. | 30
Figure 13 Summary of OPR and Example City Transportation Analysis Process
Categories OPR San José Pasadena Elk Grove
Thresholds
Residential 15% below city or regional average
15% below city or regional average (whichever is lower)
Net increase in VMT per service population compared to the threshold (22.6 VMT). Has additional non-VMT Thresholds.
Defined for 17 specific land uses as 15% below 2015 city average
Employment 15% below regional average
15% below regional average (office)
Retail No net increase in VMT
No net increase in VMT
Other Industrial: No net increase in VMT
Screens
Small Projects Single family: 12 units Multi-family: 20 units 10,000 SF of office
15 detached units 25 multifamily units 10,000 SF of office 30,000 SF of industrial
10 housing units 10,000 SF of office
10 dwelling units 50,000 SF of commercial or industrial
Low VMT Areas
Areas below the threshold
Areas with low VMT, in Planned Growth Areas, near frequent transit
None Areas below the threshold for service population
Near Transit Half mile of a major transit stop
Half mile of a major transit stop
None Half mile of a major transit stop
Affordable Housing
Screen out affordable housing
Screen out affordable housing in defined areas
None Screen out affordable housing in defined areas
Non-CEQA Analysis
LOS N/A Requires a Local Transportation Analysis (LTA)
Requires a non CEQA analysis that include street segment analysis and LOS
Requires analysis of roadway performance targets (RPT)
THRESHOLDS OF SIGNIFICANCE FOR LAND USE PROJECTS Lead agencies have discretion in setting thresholds of significance for what constitutes a significant impact in CEQA. Per Section 21099 of the Public Resources Code, the criteria for determining the significance of transportation impacts must:
Promote the reduction of greenhouse gas (GHG) emissions;
Develop multimodal transportation networks;
And create a greater diversity of land uses.

Morgan Hill SB 743 LOS-to-VMT Transition | DRAFT TASK 1 & 2 SUMMARY City of Morgan Hill
Nelson\Nygaard Consulting Associates Inc. | 31
Meeting the above criteria requires a reduction in VMT per capita. OPR recommends cities adopt quantified thresholds for residential, office, and retail land use projects since those land uses have the greatest influence on VMT.16 Figure 14 shows the thresholds of significance by land use that have been adopted by San José, Elk Grove, and OPR, and additional context is provided in the following sections.
Figure 14 Thresholds of Significance for Residential and Office Projects
Land Use OPR San José Pasadena Elk Grove
Residential 15% below existing average VMT per capita. Existing VMT per capita may be measured as regional VMT per capita or as city VMT per capita.
Whichever is lower: 15% below
existing citywide average VMT per capita, or
15% below existing regional average VMT per capita
Net increase in existing VMT per service population (population + jobs) Additional non-VMT thresholds.
15% below existing average citywide VMT per service population (employees + dwelling units in the assessed area)
Office 15% below existing regional average VMT per employee.
General employment: 15% below existing regional average VMT per employee
Industrial Employment: below existing regional average VMT per employee
Net increase in existing VMT per service population (population + jobs) Additional non-VMT thresholds.
15% below existing average citywide VMT per service population (employees + dwelling units in the assessed area)
Residential and Office Land Use Projects Meeting State targets for GHG emission reduction goals will require a statewide reduction in VMT, which does not translate directly to VMT thresholds for individual projects. Therefore, OPR recommends that lead agencies use an efficiency metric (reduction per capita or employee) to determine the threshold of significance for residential and office land use projects. OPR suggests that a 15% VMT reduction is achievable at the project level in a variety of place types and also is consistent with achieving State climate goals. This is based on modeling done by CARB to meet the State’s GHG reduction goals.17
San José
San José followed OPR’s recommendations for all uses specified in OPR’s Technical Advisory and defined an additional threshold of significance for industrial land uses. San José created a distinct threshold for industrial land use because most areas zoned for industrial use are disconnected
16 Governor’s Office of Planning and Research, Technical Advisory on Evaluating Transportation Impacts in CEQA, December 2018, p 17. 17 California Air Resources Board 2017 Scoping Plan-Identified VMT Reductions and Relationship to State Climate Goals, January 2019.

Morgan Hill SB 743 LOS-to-VMT Transition | DRAFT TASK 1 & 2 SUMMARY City of Morgan Hill
Nelson\Nygaard Consulting Associates Inc. | 32
from other land uses and tend to have a higher VMT per worker. Vehicle miles traveled, as defined in the Technical Advisory, refers to on-road passenger vehicles, specifically cars and light trucks.18 Heavy-duty truck VMT is not required as part of VMT analysis. Therefore, the threshold for industrial uses was adjusted to acknowledge that industrial projects are a valuable part of the local economy, and because they have different land use needs than office, retail, and other typical employment destinations, they should not relocate to an area with a greater mix of land uses or better transit that would have significantly lower VMT.
Elk Grove
Elk Grove updated their General Plan in 2019 which defines the City’s transportation policies, including VMT Thresholds. Rather than measuring VMT per capita and VMT per employee separately, Elk Grove measures VMT per service population, which is defined as the sum of all employees and dwelling units within the assessed area. VMT per service population creates a single VMT metric for land use projects, however, it deviates from OPR recommendations. The General Plan defines threshold for 17 types of land use designations, set at 15% below the VMT for each land use from 2015 conditions.
Pasadena
Since Pasadena developed their policy before statewide guidance was issued, it is not recommended as a best practice. Their policies, however, are a useful case study. The City adopted five CEQA thresholds of significance, including a general net increase of the VMT per service population that applies to all land uses (as shown in Figure 2 above):
Vehicle trips per capita: 2.9 VT/Capita
Proximity and quality of the bicycle network: any decrease in existing citywide of service population within a quarter mile of levels 1 and 2 bike facilities
Proximity and quality of the transit network: any decrease in existing citywide of service population within a quarter mile of transit facilities
Pedestrian accessibility: any decrease in the Citywide Pedestrian Accessibility Score
Retail Land Use Projects For retail projects, OPR recommends that any net increase in VMT indicates a significant impact since retail trips are typically diverted from another existing retail site. Local serving retail is exempt from further analysis since trips redirected to/from these sites tend to be shorter. Cities can use existing definitions of local serving or regional serving retail, taking into consideration any project specific information, such as market studies or economic impacts analysis that might provide information about customers’ travel behavior. Alternatively, cities can use 50,000 square feet as the size threshold; projects below this threshold would be considered local-serving and projects above this threshold would be considered regional serving.
18 Governor’s Office of Planning and Research, Technical Advisory on Evaluating Transportation Impacts in CEQA, December 2018

Morgan Hill SB 743 LOS-to-VMT Transition | DRAFT TASK 1 & 2 SUMMARY City of Morgan Hill
Nelson\Nygaard Consulting Associates Inc. | 33
Figure 15 Thresholds of Significance for Retail Land Use
OPR San José Elk Grove
Retail Net increase in total VMT Net increase in total VMT 15% below existing average citywide VMT per service population
San José uses the recommended threshold from OPR (Figure 15). However, they define local serving retail as 100,000 square feet based on the finding from a market study they commissioned.
Elk Grove does not use OPR’s assessment that local retail does not create new VMT and instead establishes a threshold per service population (employees + dwelling units) for commercial land uses. The threshold is set at 15% below 2015 VMT per service population.
Additional Land Use Categories Lead agencies can determine thresholds of significance for additional land use categories that are not listed in Figure 13, by creating a significance threshold using more location-specific information. For example, San José created two separate “employment” land use thresholds, one for office (general employment) and one for industrial employment. For other uses, San José’s policy states that the project should use a threshold that is in accordance with the most appropriate type(s) determined by Public Works Director. In practice, the City identifies the most similar land use and works with staff in the transportation and planning departments to agree on the equivalent threshold. For example, a hotel would be analyzed based on the VMT per capita threshold for a residential project. The City can also use a trip cap to condition the development to ensure effective mitigations are implemented to keep VMT low.
Mixed-use Projects Lead agencies can evaluate mixed-use projects based on each separate land use or by considering the dominant use. Since the thresholds are typically efficiency metrics (per capita or per employee), each land use can be analyzed separately. The VMT per capita of a residential mixed-use project is not increased by additional onsite land uses, it is only decreased due to internal trip capture. If a lead agency elects to consider only the dominant use, they can disregard all other uses. For instance, if the mixed-use project contains mostly housing with some local serving retail, the lead agency could only analyze the residential use.
SCREENING THRESHOLDS FOR LAND USE PROJECTS Under SB 743, it is assumed that some types of development can be exempt from a transportation impact analysis (TIA) based on project characteristics that contribute to an inherently less than significant impact on VMT. A less than significant impact on VMT may result from a project’s location, size, or the land use of the development. A project only needs to meet one of four screening criteria to “screen out” of the requirement to complete a transportation impact analysis under CEQA. OPR’s Technical Advisory provides guidance on screening the following four types of projects:
Small projects

Morgan Hill SB 743 LOS-to-VMT Transition | DRAFT TASK 1 & 2 SUMMARY City of Morgan Hill
Nelson\Nygaard Consulting Associates Inc. | 34
Development in low VMT zones
Development near transit stations
Affordable housing
Lead agencies are encouraged to develop screening thresholds to determine when detailed analysis is needed. Screening thresholds allow for streamlining and a greater degree of certainty for both the lead agency and the public. Additional analysis, including a full environmental impact report, can be required for projects that do not meet the screening threshold.
Small Projects
Under CEQA before implementing SB 743, most lead agencies used peak hour trip generation to determine the need for a TIA. Peak hour trip generation is determined based on the project size and land use type. Each city that has adopted VMT-based analysis requirements has reduced the project size threshold for residential and employment land use compared to Morgan Hill’s current one of 100 net new peak-hour trips for projects located outside the Downtown Core.
Absent substantial evidence that a project would generate a significant level of VMT, OPR recommends that projects that generate less than 110 total trips per day may be assumed to cause a less-than significant transportation impact.19 In addition, the project must be consistent with the City’s general plan and regional Sustainable Communities Strategy (Plan Bay Area for Morgan Hill). Figure 16 lists the small project screening thresholds that have been adopted by San José, Pasadena, and Elk Grove, as well as OPR’s recommendation.
Figure 16 Small Project Screening Thresholds
Land Use San José Pasadena Elk Grove OPR
Residential Detached housing: 15 units Attached housing: 25 units
10 dwelling units 10 dwelling units
Single family: 12 units Multi-family: 20 units
Employment Office: 10,000 SF Industrial: 30,000 SF 10,000 SF¹ 50,000 SF Approximately
10,000 SF²
¹ 10,000 SF or 300 daily trips ² 10,000 SF or 110 daily trips
OPR recommends that lead agencies treat retail land use differently than residential and employment uses. As described in the previous section, cities should determine what is considered local-serving retail based on market studies that assess local context, retail need, and travel patterns. Absent such research, the lead agency should adopt OPR recommendations.
Development in Low VMT Areas
OPR guidance recommends streamlining low VMT office and residential development projects as an effective method of reducing VMT and meeting GHG reduction goals. Projects that locate in areas with low VMT and incorporate similar features to the existing development context (i.e.,
19 Governor’s Office of Planning and Research, Technical Advisory on Evaluating Transportation Impacts in CEQA, December 2018, p 12.

Morgan Hill SB 743 LOS-to-VMT Transition | DRAFT TASK 1 & 2 SUMMARY City of Morgan Hill
Nelson\Nygaard Consulting Associates Inc. | 35
density, mix of uses, transit accessibility), will exhibit similarly low VMT. Adopting a map-based screen clearly communicates where projects that meet minimum VMT requirements can be screened out from detailed VMT analysis under CEQA. Low VMT areas can be determined using household travel surveys or a travel demand model.
To develop the map of VMT per Capita shown in Figure 17, San José staff worked with VTA to update the City’s travel model resulting map as shown in Figure 18. This is the same smoothing process VTA has adopted for their VMT estimates recommended for the City of Morgan Hill. Low VMT areas in San José (shown in green) are where residential development would have a have a less-than-significant transportation impact.
Figure 17 City of San José - VMT per Capita (2018)
Source: City of San José, Map downloaded from: http://www.sanjoseca.gov/vmt
While all green areas identified in Figure 5 could be eligible for inclusion in San José’s map-based screen, City staff determined that the low VMT areas in the model output included areas that are not planned for significant growth and lack supportive infrastructure. To address this concern, the City adopted a screen that overlaid high quality transit areas on the low VMT zones, which resulted in a smaller area that is screen out. Figure 18 shows low VMT areas in San José (in green) where residential development is presumed to have a less-than-significant transportation impact.

Morgan Hill SB 743 LOS-to-VMT Transition | DRAFT TASK 1 & 2 SUMMARY City of Morgan Hill
Nelson\Nygaard Consulting Associates Inc. | 36
Figure 18 City of San José – Residential Project Screen
Source: City of San José, Map downloaded from: http://www.sanjoseca.gov/vmt
Figure 19 shows Elk Grove’s screening map which identifies areas that are exempt from VMT analysis, shown in white. The map indicates areas of the City that have been pre-screened through citywide VMT analysis. Screened projects must follow the land use designations of Elk Grove’s Land Use Plan.

Morgan Hill SB 743 LOS-to-VMT Transition | DRAFT TASK 1 & 2 SUMMARY City of Morgan Hill
Nelson\Nygaard Consulting Associates Inc. | 37
Figure 19 City of Elk Grove – Land Use Project VMT Screen
City of Elk Grove, Map downloaded from: http://www.elkgrovecity.org/UserFiles/Servers/Server_109585/File/Departments/Planning/Projects/General%20Plan/GPU/Adopted_2019-02/EG_Traffic_Analysis_Guidelines_CC%20Final_Adopted_2019-02-27.pdf
Development Near Transit Stations OPR’s Technical Advisory recommends that residential, retail, office, and mixed-use projects located within a half-mile of an existing major transit stop should be assumed to have less than significant impact on VMT. A major transit stop is defined as a rail station or the intersection of two or more major bus routes with service every 15 minutes or less during morning and evening commute periods.
A project also should meet additional criteria that support transit-oriented development (TOD), such as:
A Floor Area Ratio (FAR) of at least 0.75.
Does not include more than the minimum number parking spaces required by the jurisdiction (only applicable if the jurisdiction requires the project to supply parking).
Is consistent with the applicable Sustainable Communities Strategy as determined by the lead agency, with input from the Metropolitan Planning Organization (MTC). In Morgan Hill, the Sustainable Communities Strategy is Plan Bay Area. TOD development should align with development density ranges or minimums established by Plan Bay Area, transit agency access and TOD policies, and Morgan Hill specific plans.

Morgan Hill SB 743 LOS-to-VMT Transition | DRAFT TASK 1 & 2 SUMMARY City of Morgan Hill
Nelson\Nygaard Consulting Associates Inc. | 38
Does not replace affordable residential units with a smaller number of moderate- or high-income residential units.
The City of San José incorporated TOD-related criteria into its map-based screen; these are reflected in the map shown in Figure 5. Elk Grove allows projects within a half mile of major transit stops to have a presumed less-than-significant impact. At the time the TA Guidelines were approved, however, there were no major transit stops in Elk Grove.
Affordable Housing Research cited by OPR supports the presumption that affordable housing generates a lower than average VMT.20 Therefore, a project consisting of a high percentage of affordable housing is assumed to have a less than significant impact. Lead agencies have discretion in developing screens for affordable housing.
The City of San José uses a map-based screen, shown in Figure 20. The screen is a combination of Priority Development Areas (PDAs) and high-quality transit, defined as a bus or train at least every 15 minutes during peak. In order to meet the screening criteria, a project must be 100% deed-restricted affordable housing and meet minimum density, parking maximum, and active transportation requirements.
Elk Grove exempts from VMT analysis high density low-income housing on a site designated as such in the Housing element. No other requirements for affordable housing exemptions are defined in their TA Guidelines.
Pasadena does not have screens that exempt affordable housing projects in their TIA guidelines.
20 Governor’s Office of Planning and Research, Technical Advisory on Evaluating Transportation Impacts in CEQA, December 2018, p 15.

Morgan Hill SB 743 LOS-to-VMT Transition | DRAFT TASK 1 & 2 SUMMARY City of Morgan Hill
Nelson\Nygaard Consulting Associates Inc. | 39
Figure 20 City of San José – Affordable Housing Project Screen
City of San José, Map downloaded from: http://www.sanjoseca.gov/DocumentCenter/View/77336
VMT MITIGATION When a lead agency identifies a significant impact attributable to a project or project elements, it must identify feasible mitigation measures to avoid or substantially reduce that impact. Lead agencies have discretion in selecting mitigation measures. Mitigation measures may vary depending on the proposed project and significant impact.
San José
Projects may select a combination of VMT mitigation measures from four strategy types:
Project Characteristics: Factors underlying land use characteristics that reduce VMT by increasing access to amenities or by attracting residents who generate lower VMT (e.g. density, mix of uses, and housing affordability).
Multimodal Infrastructure: Developer-funded or developer-built improvements to the transportation network that encourage biking, walking, and public transit use.
Parking: Measures that reduce automobile parking supply and provide high-quality bicycle parking.

Morgan Hill SB 743 LOS-to-VMT Transition | DRAFT TASK 1 & 2 SUMMARY City of Morgan Hill
Nelson\Nygaard Consulting Associates Inc. | 40
TDM Programs: Programmatic strategies that reduce VMT by providing incentives to avoid driving alone, such as ride sharing programs, transit subsidies, and shuttle services.
VTA’s approach is based on this example. San José uses an excel-based tool rather than an online-based tool, but the calculations and VMT Mitigations are the same.
Project developers may propose mitigation measures that are not included in San José’s list of approved VMT reduction measures; however, they must be reviewed and approved by the Director of Public Works. If mitigations are included during the planning and design stage as part of the project description, the measures are reflected in the assessment of project VMT.
Elk Grove
The City of Elk Grove provides a set of acceptable VMT reduction strategies for projects with an estimated daily VMT exceeding established thresholds. Infill projects may use strategies from any category (Figure 21). Projects within designated growth areas must incorporate the highest reduction strategies within the Land Use and/or Site Enhancement categories (as determined by the city) before using strategies in other categories.
Figure 21 Elk Grove VMT Reduction Strategies
Category Description
Land Use / Location
Land-use characteristics (e.g. density, location, efficiency related to other housing and jobs); diversity of uses within the project; access and proximity to destinations, transit stations, and active transportation infrastructure
Site Enhancement
Establishing or connecting to a pedestrian or bicycle network; traffic calming within the project; car sharing programs; shuttle programs
Transit System Improvement
Improvements to the transit system including route expansion, service frequency, types of transit, access to stations, station safety and quality, parking, and bike access
Commute Trip Reduction
For residential: Transit fare subsidies, education/training of alternatives, rideshare programs, shuttle programs, bike share programs For employer sites: Transit fare subsidies, parking cash-outs, paid parking, alternative work schedules/telecommute, education/training of alternatives, rideshare programs, shuttle programs, and bikeshare programs
In-Lieu Fee Levied fees used to provide non-vehicular transportation services that connect project residents to areas of employment or vice versa
Pasadena
The City of Pasadena does not prescribe a set of acceptable mitigations for project-related impacts exceeding established thresholds. Instead, project applicants are required to develop and implement a targeted Complete Streets Plan that encourages the use of non-vehicular modes by project patrons. Complete Streets measures may include implementing curb extensions, pedestrian and bike traffic signal enhancements, raised medians, and traffic circles. Project-specific measures may include establishing an Average Vehicle Occupancy (AVO) target exceeding the city’s by enhancing the required TDM Plan, project-turn restrictions, and revised project access.

Morgan Hill SB 743 LOS-to-VMT Transition | DRAFT TASK 1 & 2 SUMMARY City of Morgan Hill
Nelson\Nygaard Consulting Associates Inc. | 41
CONTINUED USE OF LEVEL OF SERVICE SB 743 prohibits the use of level of service (LOS) as a metric used to analyze transportation impacts in CEQA. However, cities can still use LOS to inform local analysis, such as traffic operations and traffic signal timing needs. During the development process, LOS analysis can be required outside of CEQA. Project conditions of approval can require changes to the project, transportation demand management (TDM) strategies, or other measures to address LOS analysis outside of CEQA. Project conditions of approval cannot induce vehicle travel or increase VMT, both of which are impacts that conflict with SB 743. San José and Pasadena provide examples of continuing to use LOS outside of CEQA. Elk Grove created a new analysis approach to measure transportation network and traffic signal operations.
San José
San José requires a Local Transportation Analysis (LTA) for all projects other than those that the City defines as Small Infill Projects, the small project screen used in their CEQA streamlining. An LTA is an evaluation of the effects of a development project on transportation outside of CEQA.21 An LTA ensures functional local transportation systems, encourages reduction in vehicle trips, and addresses issues related to operations and safety for all transportation modes based on General Plan street typologies.
The LTA includes an Intersection Operations Analysis (IOA) that measures LOS. A project is required to analyze two scenarios: background conditions and background plus project conditions. A cumulative impact analysis is not required as part of the LTA. Intersections that operate below LOS D with the addition of project vehicle trips to baseline conditions are considered to have an adverse effect. To address the adverse effect, a project can implement measures that reduce projected vehicle trips, construct improvements to the intersections, or implement a trip cap.
Pasadena
Projects of community-wide significance (that do not pass the small project screen) in Pasadena are required to conduct a TIA with a CEQA report and a non-CEQA report. The non-CEQA transportation analysis has the following caps in place of thresholds of significance:
Street Segment Analysis. An increase of 10-15% above existing average daily traffic (ADT) on streets with more than 1,500 ADT would trigger conditions of approval to reduce project vehicular trips.
Auto Level of Service. A decrease beyond LOS D citywide or LOS E within transit-oriented districts would trigger conditions of approval to reduce project vehicular trips.
21 City of San José, Transportation Analysis Handbook, April 2018.

Morgan Hill SB 743 LOS-to-VMT Transition | DRAFT TASK 1 & 2 SUMMARY City of Morgan Hill
Nelson\Nygaard Consulting Associates Inc. | 42
Conditions of approval to reduce project trips must be consistent with the City’s Guiding Principles to encourage multimodal transportation and reduce VMT. Typical measures include contributions to build more complete streets or implementation of TDM strategies.22
Elk Grove
Elk Grove removed LOS from their transportation analysis process as a metric, however, they still measure roadway efficiency defined as Roadway Performance Targets (RPT) and transportation analysis includes the following assessments:
Roadway performance and vehicular capacity
Intersection delay
Pedestrian and bicycle safety and stress levels
Character and context of surrounding environment
THRESHOLDS OF SIGNIFICANCE FOR TRANSPORTATION PROJECTS CARB modeling has determined the limits to VMT growth statewide that are required for California to meet its GHG reduction goals. While the modeling suggests that the State can still meet its GHG targets with a small amount of total VMT growth, the VMT per capita still needs to decrease to accommodate growth projections for jobs and population. The most reliable way to ensure a defensible approach is to set the threshold at no net increase to the total VMT.
An alternative approach is to create a threshold based on the VMT “budget”. This uses the total modeled VMT growth and allocates it by regional planning body or future population to set the threshold. Projects that go over that budget would have a significant impact. A potential budget process, as described by OPR, is as follows:23
1. Estimate the fair share allocation for each jurisdiction using population or another method for proportioning
2. Determine the amount of VMT growth estimated to result from background population growth incorporated into the long-range plan
3. Allocate a jurisdiction’s share between VMT-increasing transportation projects, using whichever criteria the lead agency prefers
Lead agencies can adopt a threshold of significance or evaluate transportation project impacts on a case-by-case basis. Analysis should address the following criteria:
Direct, indirect, and cumulative effects
Near-term and long-term effects
Consistency with state GHG reduction goals
Impact on the development of multimodal transportation networks
22 City of Pasadena, Transportation Impact Analysis Guidelines, 2015. Accessed from: https://ww5.cityofpasadena.net/transportation/wp-content/uploads/sites/6/2015/12/Current-Practice-and-Guidelines.pdf 23 Governor’s Office of Planning and Research, Technical Advisory on Evaluating Transportation Impacts in CEQA, December 2018, p 22.

Morgan Hill SB 743 LOS-to-VMT Transition | DRAFT TASK 1 & 2 SUMMARY City of Morgan Hill
Nelson\Nygaard Consulting Associates Inc. | 43
Impact on the development of a diversity of land uses
San José
San José provides an example of a way to use the VMT “budget” to create a transportation project threshold of significance. San José evaluates transportation projects in relation to the regional transportation plan, Plan Bay Area. The City uses the County-level VMT allocations in Plan Bay Area to estimate its VMT “budget.” Accordingly, the City has determined that the allowable incremental net increase in VMT from 2015 to 2040 for San José is 23%, with a planned increase of roadways miles by 3% over 25 years. The equation used to determine the allowable VMT incremental increase is shown in Figure 22.
Figure 22 City of San José’s Total Allowable VMT Incremental Increase24
The calculation in Figure 9 is used to determine the transportation project thresholds. As shown in Figure 23, a project that results in a greater than 0.3% percent increase in VMT per 1% increase in lane-miles would require mitigation or project alteration.
Figure 23 San José Thresholds of Significance for City Transportation Projects25
Significance Criteria Threshold
Percent increase in total VMT for roadways within Sphere of Influence
0.3% for every percent increase in lane-miles for roadways within Sphere of Influence
Percent increase in total VMT for roadways within Santa Clara County
0.3% for every percent increase in lane-miles for roadways within Santa Clara County
SCREENING THRESHOLDS FOR TRANSPORTATION PROJECTS Since transportation projects are typically public, while land use development projects are typically private, the need to develop screening tools for transportation projects is less critical. Expanding through lane capacity on highways or arterials is the primary type of project that requires an environmental review. Transit and active transportation projects are presumed to cause a less than significant impact and thus do not require an environmental review. Roadway projects that do not increase roadway capacity do not require an induced travel analysis.
Some of the most common projects relevant to the City of Morgan Hill that are considered unlikely to lead to a substantial increase in vehicle travel include:
Maintenance and repair
24 City of San José, Transportation Analysis Handbook, April 2018, p 53. 25 City of San José, Transportation Analysis Handbook, April 2018, p 52.

Morgan Hill SB 743 LOS-to-VMT Transition | DRAFT TASK 1 & 2 SUMMARY City of Morgan Hill
Nelson\Nygaard Consulting Associates Inc. | 44
Addition of local streets
Addition of collector roadways
Intelligent transportation systems (ITS)
Turn pockets
Transit signal upgrades or timing
Removal or relocation of parking (on or off-street)
The complete list of projects that are considered unlikely to lead to a substantial increase in vehicle travel can be found in OPR’s Technical Advisory.26
5 REVIEW OF TRANSPORTATION IMPACT ANALYSIS
To assess how Morgan Hill's existing transportation review process and mitigations function in practice, the project team reviewed several Transportation Impact Analysis (TIA) studies done as part of the development review process. Some of the TIAs were not associated with projects subject to CEQA.
Projects with residential components are listed in Figure 24. Impacts were based on LOS analysis and varied by project based on the existing and cumulative conditions around the project as well as the project’s size and corresponding peak hour trips generated. The mitigations are intended to increase intersection capacity and flow by increasing turn lanes, adding signals, and adding medians/restricting turns. An additional recommendation was made (non-CEQA mitigations) to add a stop sign to create gaps in traffic and required as part of the conditions of approval for the East-Dunne Kyono (Las Colinas) TIA.
Figure 24 Project TIAs with Residential Components
Project Name Year Project Summary Transportation Impact Mitigation/Recommendation
Butterfield-Keenan
2014 Change General Plan designation of 9.5 acres from industrial to Multi-Family Medium (up to 409 dwelling units)
Substantial increase in vehicle delays at intersections and traffic signal warrant met for unsignalized intersections under proposed project conditions.
Significant and unavoidable impact to
Mitigations: Add additional left turn lanes
on Cochrane to mitigate LOS impact at Butterfield/Cochrane and Butterfield/Jarvis intersections.
Signalization of Butterfield/Jarvis intersection.
26 Full list of project types available on p 21. Governor’s Office of Planning and Research, Technical Advisory on Evaluating Transportation Impacts in CEQA, December 2018, p 15.

Morgan Hill SB 743 LOS-to-VMT Transition | DRAFT TASK 1 & 2 SUMMARY City of Morgan Hill
Nelson\Nygaard Consulting Associates Inc. | 45
Project Name Year Project Summary Transportation Impact Mitigation/Recommendation Southbound U.S. 101 from Burnett Avenue to Cochrane Road during PM peak hour.
Condit-Evergreen
2013 18.1 acres of Multi-Family Medium (up to 381 dwelling units)
Change General Plan designation from Commercial (CG) to Multi-Family Medium Residential (R-3)
Projected increase in vehicle delays at Murphy Ave/Main Ave and Murphy Ave/Diana Ave intersections and traffic warrant met for unsignalized intersections under General Plan amendment.
Significant impact at Murphy Ave/Main Ave, Murphy Ave/Diana Ave, and Murphy/Tennant intersections and traffic signal warrant met under cumulative General Plan amendment.
Significant and unavoidable impact to Southbound U.S. 101 from Burnett Ave to Cochrane Rd)
Mitigations: Implementation of a traffic
signal at Murphy Ave/Main Ave would improve delays to LOS C or better during peak hours. Likely completed with planned extension of Murphy Ave from Diana Ave to Half Rd.
Implementation of a traffic signal at Murphy Ave/Diana Ave would improve delays to LOS B or better during peak hours.
Implementation of a traffic signal at Murphy Ave/Tennant Ave would improve delays to LOS C or better during peak hours. Signalization is proposed as part of South East Quadrant/High School GPA project.
Diana-Mana 2018 2.84 acres of 24 single-family residences, public access roads, a private park, and infrastructure improvements
No impact
East-Dunne Kyono (Las Colinas)
2018 5.32 acres of 32-single-family lots ranging from 2,651 to 5,940 square feet
Less than significant transportation impact
Recommendation: Add a stop sign on the
southbound approach of the project driveway to ensure that vehicles exiting the project check for adequate gaps in traffic on East Dunne Ave. Recommendation is required as a condition of approval for the proposed project.
Monterey-City Ventures
2020 5.67 acres subdivided into two parcels to develop 101 multi-family units, a commercial/retail building, and associated improvements
Less than significant transportation impact
N/A

Morgan Hill SB 743 LOS-to-VMT Transition | DRAFT TASK 1 & 2 SUMMARY City of Morgan Hill
Nelson\Nygaard Consulting Associates Inc. | 46
Project Name Year Project Summary Transportation Impact Mitigation/Recommendation
Monterey-Young
2016 Zoning amendment, tentative subdivision map, and development agreement to divide 8.8 acres parcel into 37 lots for residential development
Less than significant transportation impact
N/A
In addition to projects with residential components, school, office, and mixed-use office/commercial projects TIAs were reviewed and listed in Figure 25. Similar to the residential projects, mitigations typically address intersection LOS. School projects had additional pedestrian safety recommendations. TDM programs or alternative commute incentives to reduce vehicle trips were not included in any of the reviewed projects.
Figure 25 Non-Residential Projects TIAs
Project Name Year Project Summary Transportation Impact Mitigation/Recommendation
Monterey Voices Charter School
2019 28,000 SF school 604 students (K to 8th)
and 63 employees
Monterey/San Pedro Intersection is projected to be impacted under existing plus project and 2025 cumulative conditions.
Recommendations: Install protected pedestrian
phasing on all intersections, pedestrian crossing improvements, implement Safe Routes to School Program, prohibit on-street parking along southern project site frontage on Cosmo Avenue.
Mitigations: Install raised median along
Monterey/San Pedro to restrict left turns out of San Pedro to Monterey Road.
Cochrane-Monument Land Co. (Techcon)
2020 55,000 SF mix of office, manufacturing, storage, workshop barn and yard.
Less than significant transportation impact
N/A
Madrone Parkway Carpenters Training Center
2019 55,000 SF training center and yard. Accommodate up to 150 students and 15 employees.
Less than significant transportation impact
N/A
Digital –Venture Professional Center
2004 40,000 SF medical/dental office
21,500 SF office
Butterfield Blvd/Jarvis/ Digital intersection cumulative impacts
Butterfield Blvd/Jarvis (North) intersection cumulative impacts
Cochrane Road /Cochrane Plaza/Madrone Pkwy intersection cumulative impacts
Mitigations: Implementation of a traffic
signal at Butterfield/ Jarvis/Digital intersection or extend Sutter Blvd.
Provide channelization in the Butterfield Blvd median to prohibit left turn movements from Jarvis Drive North.
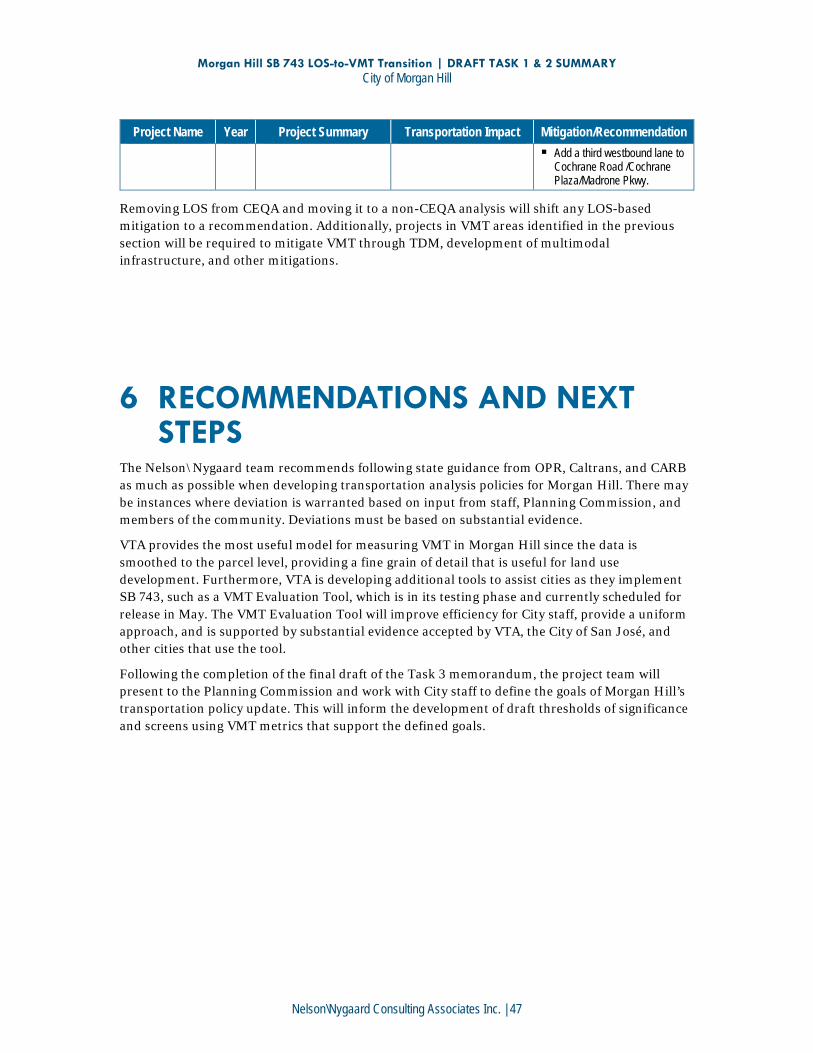
Morgan Hill SB 743 LOS-to-VMT Transition | DRAFT TASK 1 & 2 SUMMARY City of Morgan Hill
Nelson\Nygaard Consulting Associates Inc. | 47
Project Name Year Project Summary Transportation Impact Mitigation/Recommendation Add a third westbound lane to
Cochrane Road /Cochrane Plaza/Madrone Pkwy.
Removing LOS from CEQA and moving it to a non-CEQA analysis will shift any LOS-based mitigation to a recommendation. Additionally, projects in VMT areas identified in the previous section will be required to mitigate VMT through TDM, development of multimodal infrastructure, and other mitigations.
6 RECOMMENDATIONS AND NEXT STEPS
The Nelson\Nygaard team recommends following state guidance from OPR, Caltrans, and CARB as much as possible when developing transportation analysis policies for Morgan Hill. There may be instances where deviation is warranted based on input from staff, Planning Commission, and members of the community. Deviations must be based on substantial evidence.
VTA provides the most useful model for measuring VMT in Morgan Hill since the data is smoothed to the parcel level, providing a fine grain of detail that is useful for land use development. Furthermore, VTA is developing additional tools to assist cities as they implement SB 743, such as a VMT Evaluation Tool, which is in its testing phase and currently scheduled for release in May. The VMT Evaluation Tool will improve efficiency for City staff, provide a uniform approach, and is supported by substantial evidence accepted by VTA, the City of San José, and other cities that use the tool.
Following the completion of the final draft of the Task 3 memorandum, the project team will present to the Planning Commission and work with City staff to define the goals of Morgan Hill’s transportation policy update. This will inform the development of draft thresholds of significance and screens using VMT metrics that support the defined goals.


![Senate Bill 743 Vehicle Miles Traveled Implementation [DRAFT]Sep 13, 2019 · 2020, the Caltrans expectations may accelerate SB 743 implementation for some projects. 2.3 VMT Assessment](https://static.fdocuments.net/doc/165x107/602e16e50344c97bb05568cd/senate-bill-743-vehicle-miles-traveled-implementation-draft-sep-13-2019-2020.jpg)