Savings Rates and Tax Structure Nancy J. Burnett, UW – Oshkosh Lee Van Scyoc, UW – Oshkosh.
32
Savings Rates and Tax Structure Nancy J. Burnett, UW – Oshkosh Lee Van Scyoc, UW – Oshkosh
-
date post
21-Dec-2015 -
Category
Documents
-
view
221 -
download
2
Transcript of Savings Rates and Tax Structure Nancy J. Burnett, UW – Oshkosh Lee Van Scyoc, UW – Oshkosh.
Savings Rates and Tax Structure
Nancy J. Burnett, UW – OshkoshLee Van Scyoc, UW – Oshkosh

US Net National Savings
Savings Rates and Tax Structure
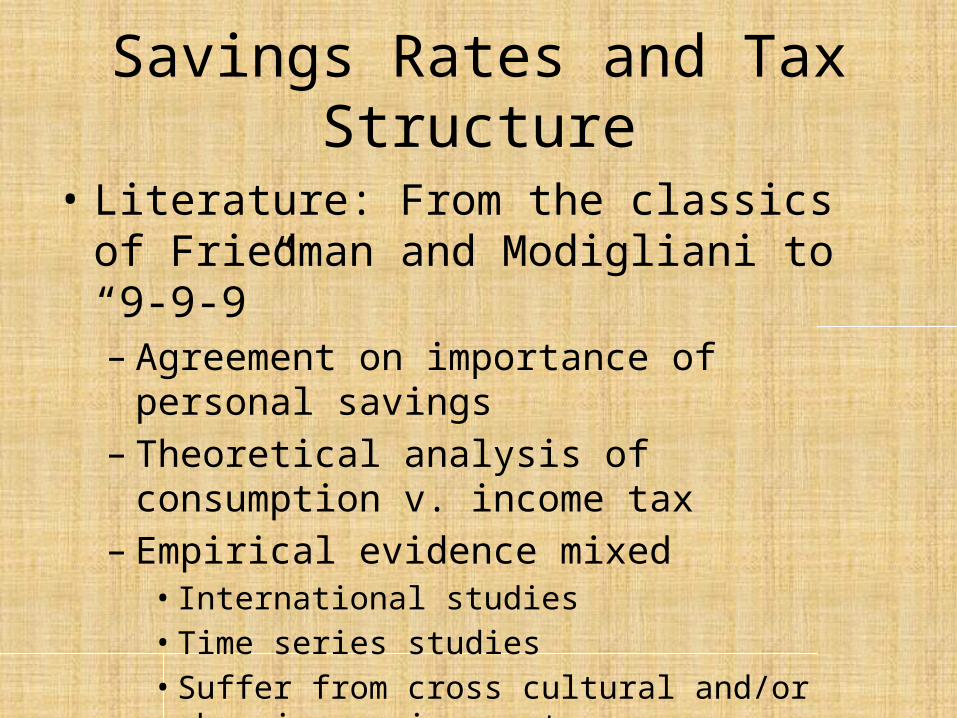
• Literature: From the classics of Friedman and Modigliani to “9-9-9”– Agreement on importance of personal savings– Theoretical analysis of consumption v. income tax– Empirical evidence mixed• International studies• Time series studies• Suffer from cross cultural and/or changing environment
State by State Analysis
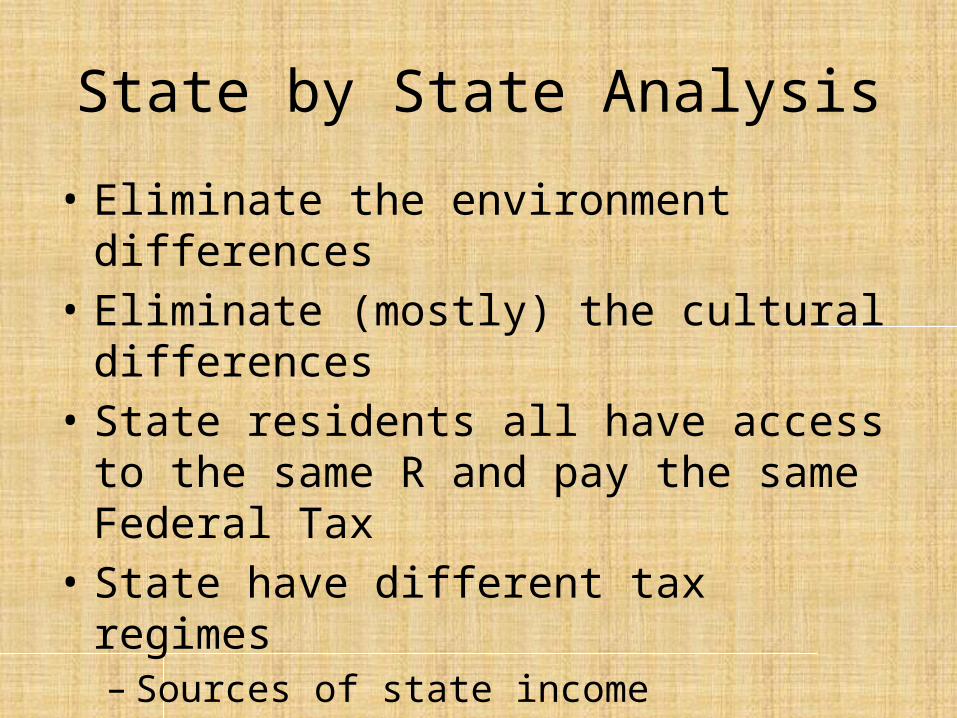
• Eliminate the environment differences• Eliminate (mostly) the cultural differences• State residents all have access to the same R
and pay the same Federal Tax• State have different tax regimes– Sources of state income
State Property General Sales Individual Income
Corporate Income
Other Taxes (a)
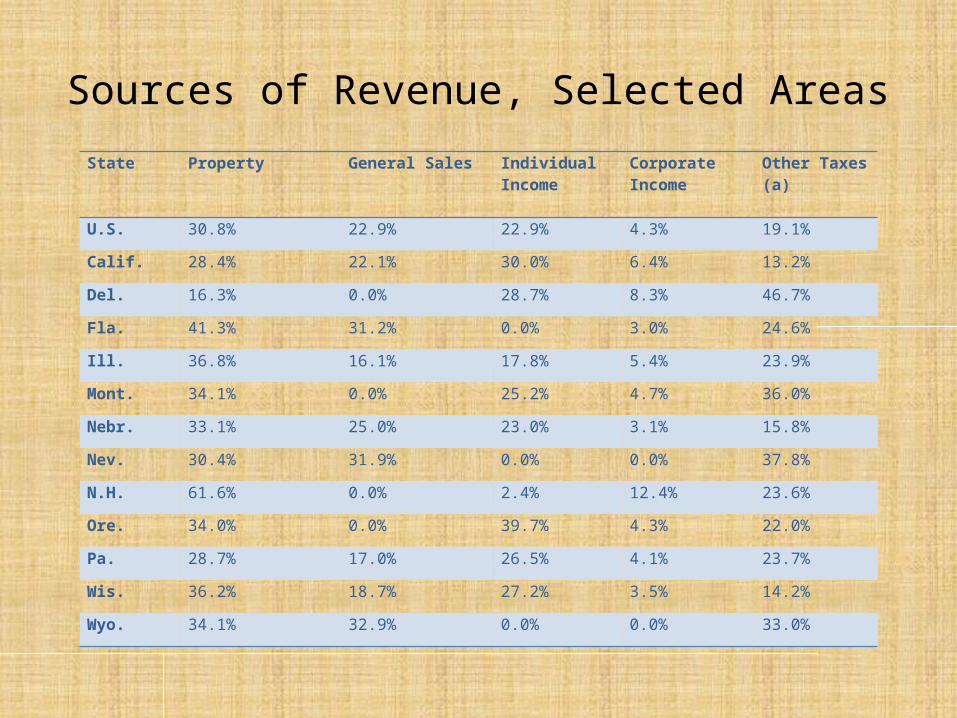
U.S. 30.8% 22.9% 22.9% 4.3% 19.1%
Calif. 28.4% 22.1% 30.0% 6.4% 13.2%
Del. 16.3% 0.0% 28.7% 8.3% 46.7%
Fla. 41.3% 31.2% 0.0% 3.0% 24.6%
Ill. 36.8% 16.1% 17.8% 5.4% 23.9%
Mont. 34.1% 0.0% 25.2% 4.7% 36.0%
Nebr. 33.1% 25.0% 23.0% 3.1% 15.8%
Nev. 30.4% 31.9% 0.0% 0.0% 37.8%
N.H. 61.6% 0.0% 2.4% 12.4% 23.6%
Ore. 34.0% 0.0% 39.7% 4.3% 22.0%
Pa. 28.7% 17.0% 26.5% 4.1% 23.7%
Wis. 36.2% 18.7% 27.2% 3.5% 14.2%
Wyo. 34.1% 32.9% 0.0% 0.0% 33.0%
Sources of Revenue, Selected Areas
9876543210
9
8
7
6
5
4
3
2
1
0
salesT
Avg T
ax
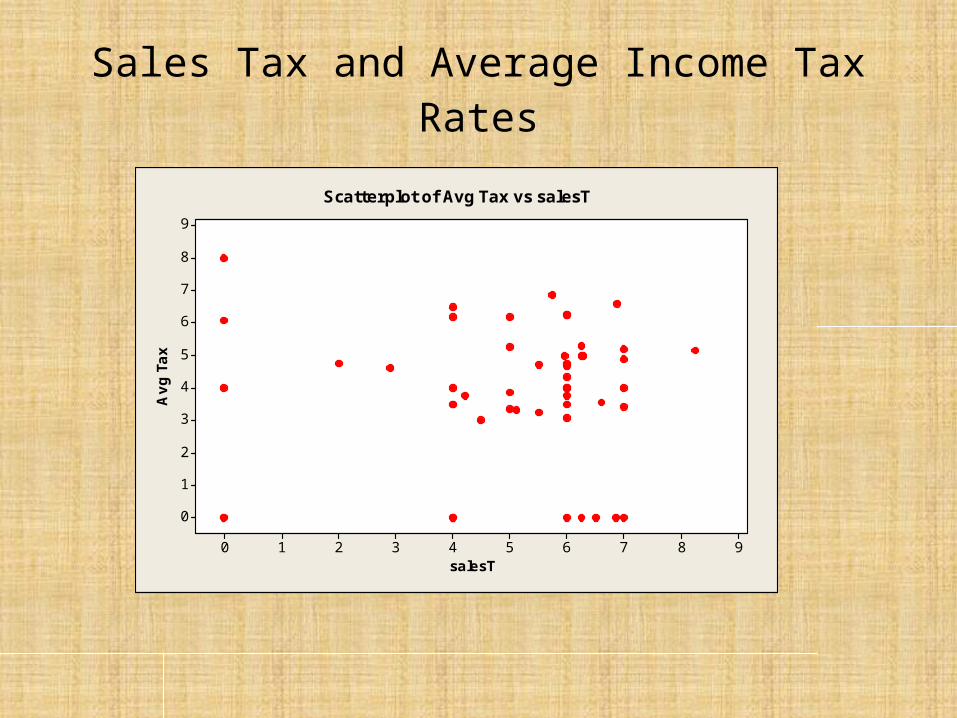
Scatterplot of Avg Tax vs salesT
Sales Tax and Average Income Tax Rates

The Zero States… 0% Sales Tax Rate 0% State Income Tax Rate
AK – Alaska AK - Alaska
DE - Delaware NH* - New Hampshire
MT - Montana SD – South Dakota
NH – New Hampshire WY - Wyoming
OR - Oregon FL - Florida
TX – Texas
WA – Washington
NY – New York
TN - Tennessee

Interesting Period?
• Current political climate (“9-9-9”, etc) makes this topic important now
• Looking at data from period since the ‘credit crunch’ – 2009.
• Will the economic miasma of the period overwhelm results?

Data
• Changes in Personal Income by State– BEA
• Average Income Tax Rate– Federation of Tax Administrators
• State Sales Tax Rate– Federation of Tax Administrators
• Savings Rate?– Interest Income by state: IRS.gov – Adult Population by state: US Stat Abstract
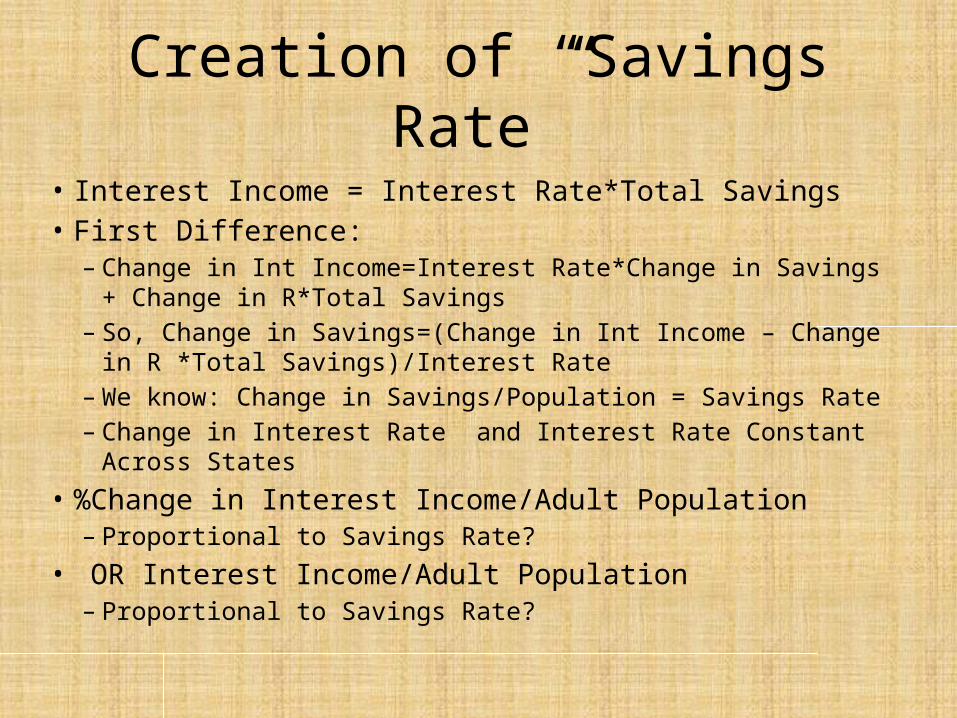
Creation of “Savings Rate”
• Interest Income = Interest Rate*Total Savings• First Difference:
– Change in Int Income=Interest Rate*Change in Savings + Change in R*Total Savings
– So, Change in Savings=(Change in Int Income – Change in R *Total Savings)/Interest Rate
– We know: Change in Savings/Population = Savings Rate– Change in Interest Rate and Interest Rate Constant Across States
• %Change in Interest Income/Adult Population– Proportional to Savings Rate?
• OR Interest Income/Adult Population– Proportional to Savings Rate?

Data Summary, 2009
Variable Mean StDev Minimum Maximum
AvgTax 3.863 2.106 0.000 8.000
SalesTax 5.031 2.044 0.000 8.250
%ChangeSave/Pop -.001682 .003660 -.02391 .006686
IncomeChange -2.124 1.544 -5.900 1.800
InterestIncome/Pop643.7 174.8 384.9 1186.1
Income/Pop32128 5903 23080 49325
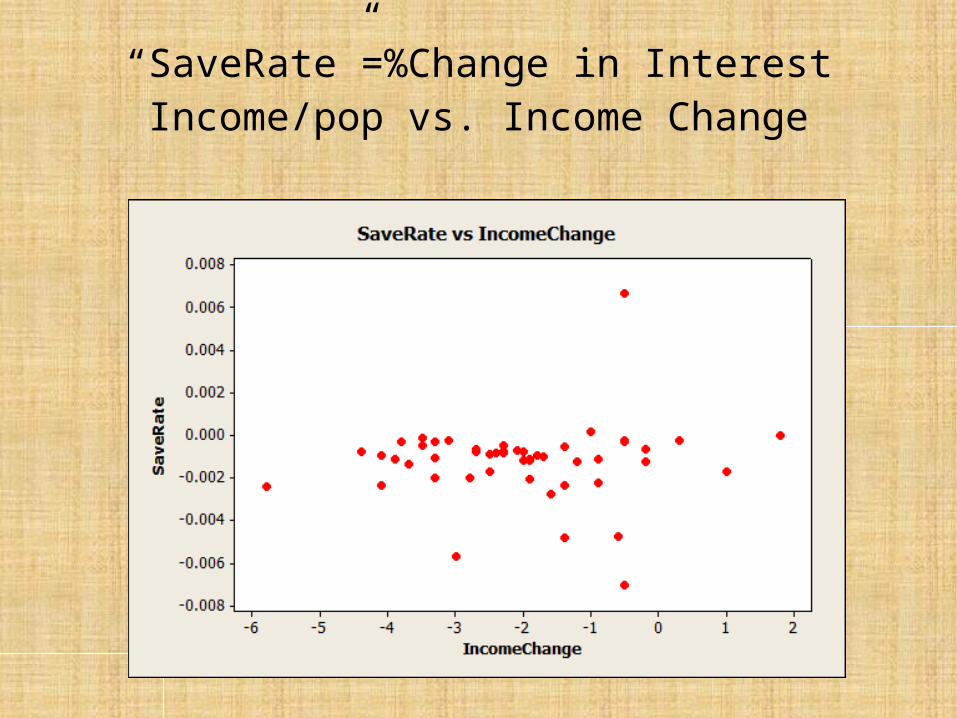
“SaveRate”=%Change in Interest Income/pop vs. Income Change
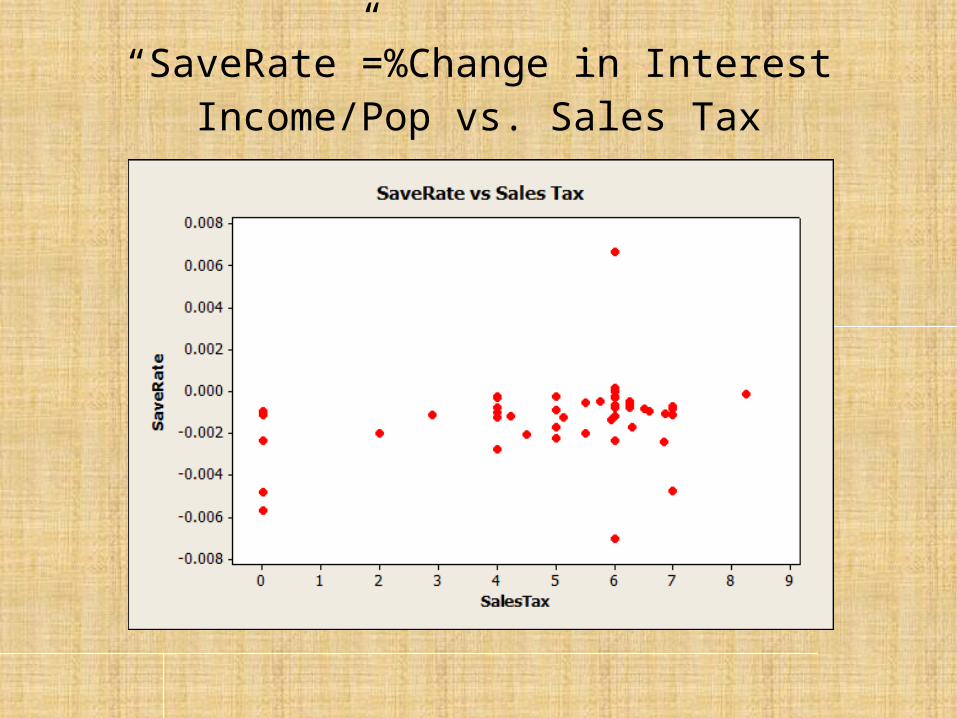
“SaveRate”=%Change in Interest Income/Pop vs. Sales Tax

“SaveRate”=% Change in Interest Income/Pop vs. Income Tax Rate
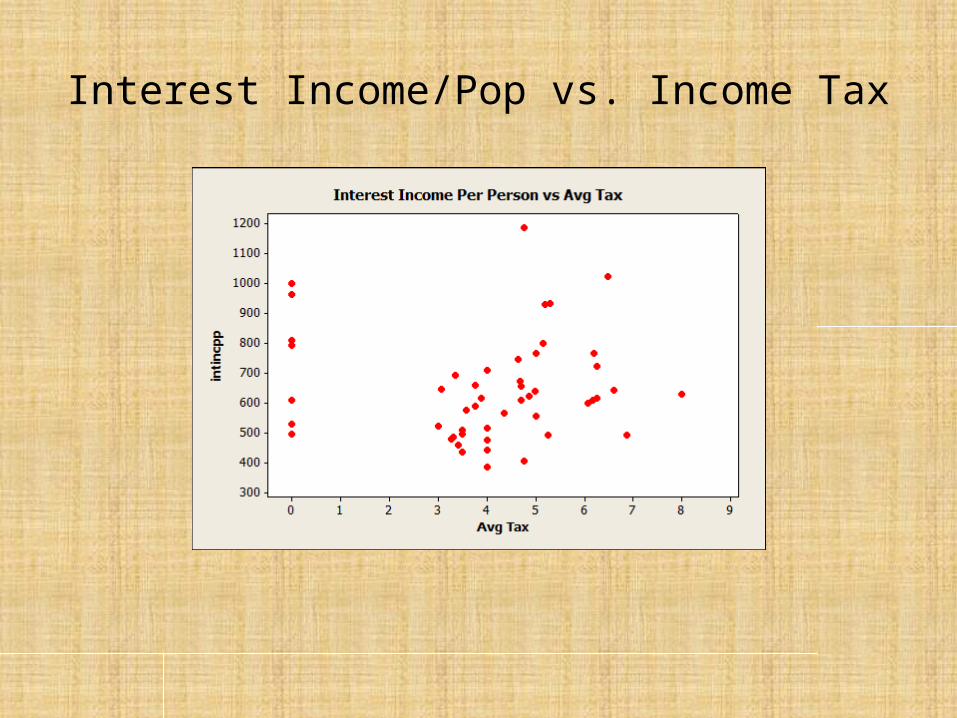
Interest Income/Pop vs. Income Tax
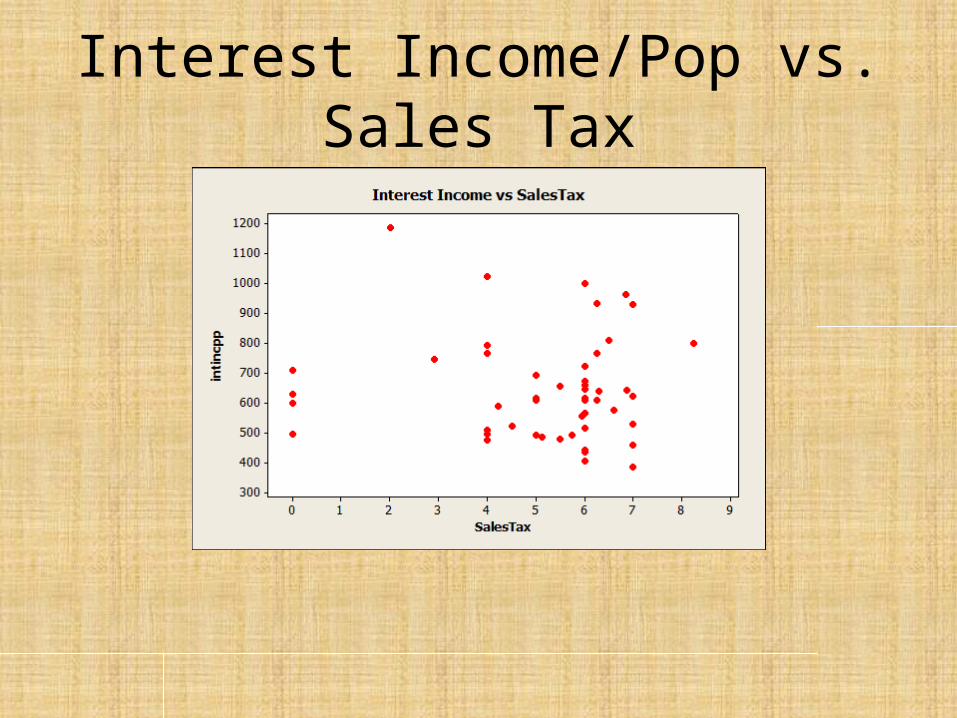
Interest Income/Pop vs. Sales Tax
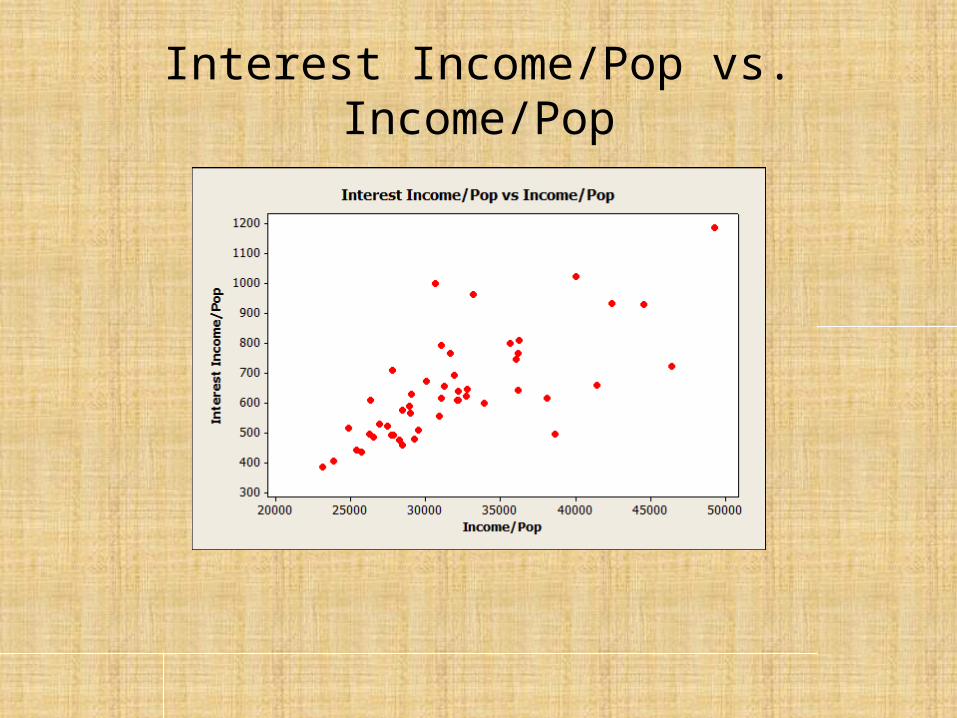
Interest Income/Pop vs. Income/Pop
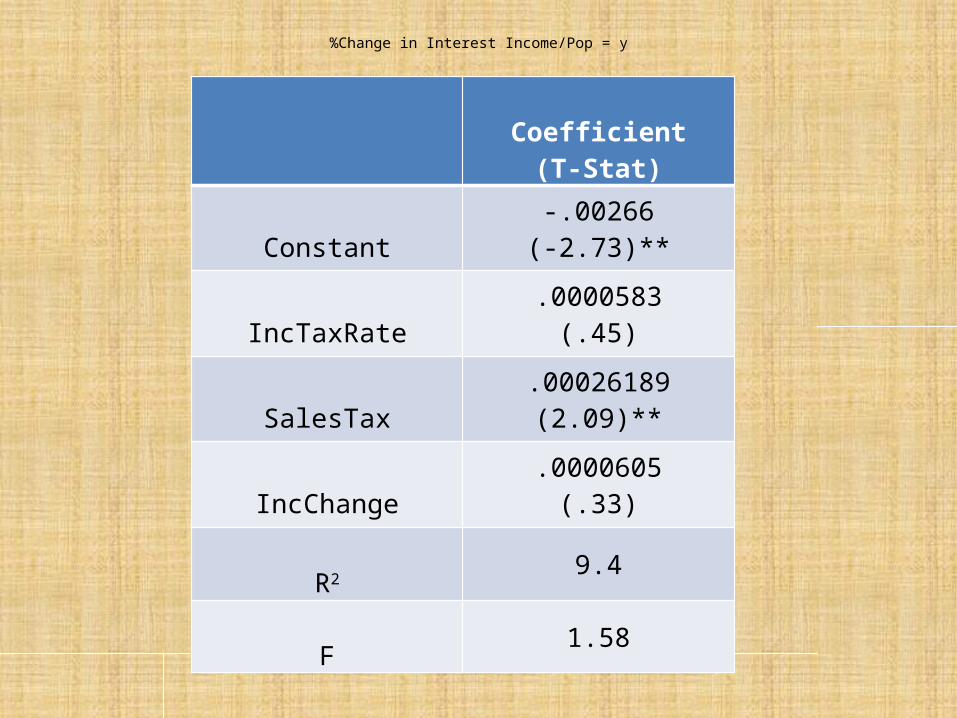
%Change in Interest Income/Pop = y
Coefficient(T-Stat)
Constant-.00266(-2.73)**
IncTaxRate.0000583(.45)
SalesTax.00026189(2.09)**
IncChange.0000605(.33)
R2 9.4
F1.58
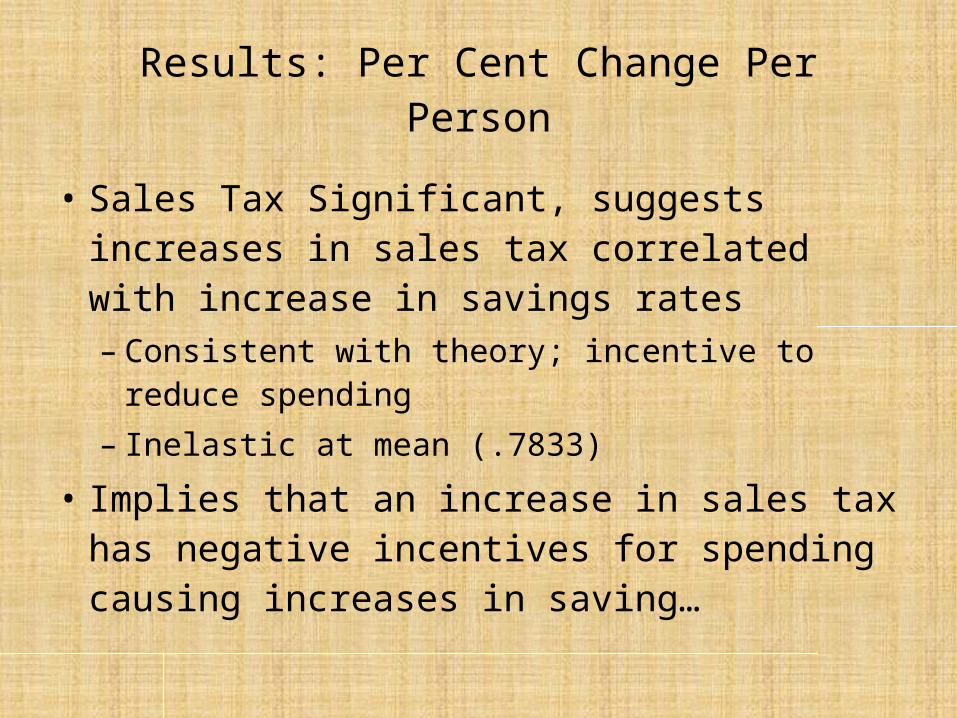
Results: Per Cent Change Per Person
• Sales Tax Significant, suggests increases in sales tax correlated with increase in savings rates– Consistent with theory; incentive to reduce
spending– Inelastic at mean (.7833)
• Implies that an increase in sales tax has negative incentives for spending causing increases in saving…
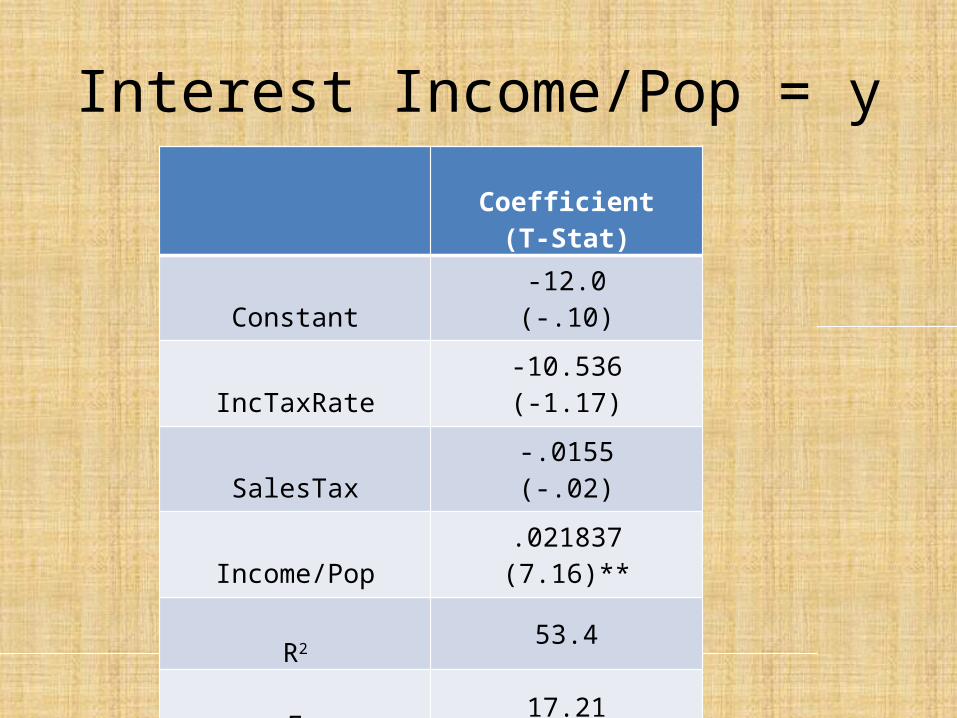
Interest Income/Pop = yCoefficient
(T-Stat)
Constant-12.0(-.10)
IncTaxRate-10.536(-1.17)
SalesTax-.0155(-.02)
Income/Pop.021837(7.16)**
R2 53.4
F17.21
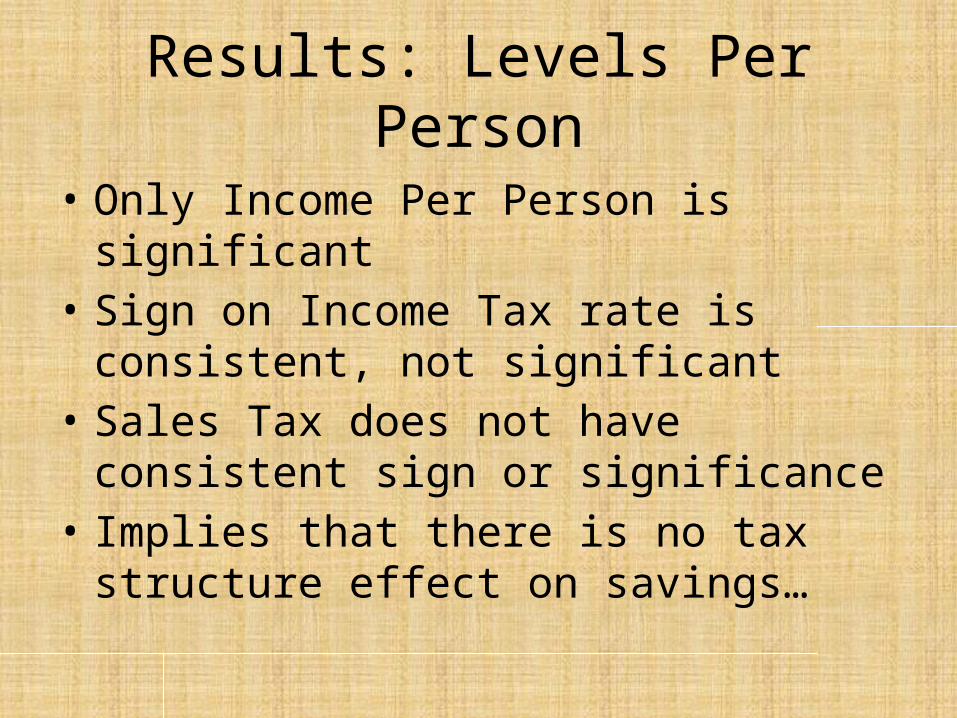
Results: Levels Per Person
• Only Income Per Person is significant• Sign on Income Tax rate is consistent, not
significant• Sales Tax does not have consistent sign or
significance• Implies that there is no tax structure effect on
savings…
Now What?
• 2009 was unusual year – economic miasma• Levels or Percentage Changes?


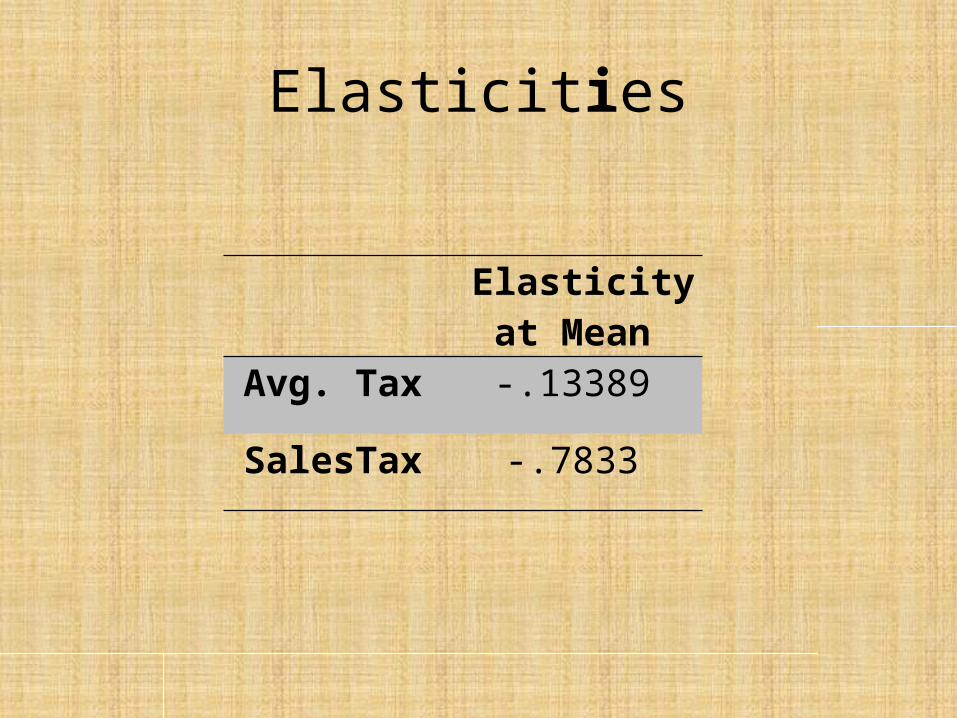
Elasticities
Elasticity at Mean
Avg. Tax -.13389
SalesTax -.7833