Saving Electricity in a Hurry: A Japanese Experience after the Great ...
Energy Efficiency Series
2011
Sara Bryan PaSquier
INFORMATION PAPER
SAVING ELECTRICITY IN A HURRY
Update 2011
June
INTERNATIONAL ENERGY AGENCY
The International Energy Agency (IEA), an autonomous agency, was established in November 1974. Its primary mandate was – and is – two-fold: to promote energy security amongst its member countries through collective response to physical disruptions in oil supply, and provide authoritative
research and analysis on ways to ensure reliable, affordable and clean energy for its 28 member countries and beyond. The IEA carries out a comprehensive programme of energy co-operation among its member countries, each of which is obliged to hold oil stocks equivalent to 90 days of its net imports. The Agency’s aims include the following objectives:
n Secure member countries’ access to reliable and ample supplies of all forms of energy; in particular, through maintaining effective emergency response capabilities in case of oil supply disruptions.
n Promote sustainable energy policies that spur economic growth and environmental protection in a global context – particularly in terms of reducing greenhouse-gas emissions that contribute to climate change.
n Improve transparency of international markets through collection and analysis of energy data.
n Support global collaboration on energy technology to secure future energy supplies and mitigate their environmental impact, including through improved energy
efficiency and development and deployment of low-carbon technologies.
n Find solutions to global energy challenges through engagement and dialogue with non-member countries, industry, international
organisations and other stakeholders. IEA member countries:
Australia Austria
Belgium Canada
Czech RepublicDenmark
Finland France
GermanyGreece
HungaryIreland
ItalyJapan
Korea (Republic of)LuxembourgNetherlandsNew Zealand NorwayPolandPortugalSlovak RepublicSpainSwedenSwitzerland
TurkeyUnited Kingdom
United States
The European Commission also participates in
the work of the IEA.
Please note that this publication is subject to specific restrictions that limit its use and distribution.
The terms and conditions are available online at www.iea.org/about/copyright.asp
© OECD/IEA, 2011International Energy Agency
9 rue de la Fédération 75739 Paris Cedex 15, France
www.iea.org
Sara Bryan PaSquier
INFORMATION PAPER
2011 June
This information paper was prepared for the Energy Efficiency Working Party. It was drafted by the Energy Efficiency and Environment Division. This paper reflects the views of the International Energy Agency
(IEA) Secretariat, but does not necessarily reflect those of individual IEA member countries. For further information, please contact the Energy Efficiency and Environment Division at: [email protected]
SAVING ELECTRICITY IN A HURRY
Update 2011
Saving Electricity in a Hurry: Update 2011 © OECD/IEA 2011
Page | 4
Table of Contents
Foreword ........................................................................................................................................... 6
Acknowledgements .......................................................................................................................... 7
Introduction ...................................................................................................................................... 8
Summary: Recent Electricity Shortfalls .......................................................................................... 10
Japan 2011 ............................................................................................................................... 10
Juneau, Alaska, United States 2008 ......................................................................................... 11
New Zealand 2008 ................................................................................................................... 13
South Africa 2008/09 ............................................................................................................... 13
Chile 2007/08 .......................................................................................................................... 15
Steps for Mitigating Electricity Shortfalls ...................................................................................... 16
Step 1: Analyse the cause and duration of an electricity shortfall .......................................... 16
Cause of electricity shortfall ............................................................................................ 16
Anticipated duration ........................................................................................................ 17
Step 2: Identify opportunities for energy savings ................................................................... 17
Step 3: Implement a package of demand‐side energy‐saving tools ............................................... 18
Price signals ...................................................................................................................... 19
Behaviour changes and information campaigns.............................................................. 21
Technology replacement ................................................................................................. 23
Rationing .......................................................................................................................... 23
Market mechanisms ........................................................................................................ 25
Other Considerations in Electricity Shortfall Emergency Management ....................................... 26
Conclusions and Recommendations .............................................................................................. 30
Annex: Comprehensive Case Studies .............................................................................................. 32
Japan 2011 ............................................................................................................................... 32
Juneau, Alaska, United States 2008 ......................................................................................... 38
New Zealand 2008 ................................................................................................................... 45
South Africa 2008/09 ............................................................................................................... 49
Chile 2007/08 .......................................................................................................................... 52
References ...................................................................................................................................... 56
© OECD/IEA 2011 Saving Electricity in a Hurry: Update 2011
Page | 5
List of figures
Figure 1. Estimated savings achieved through emergency energy‐saving programmes .................. 8
Figure 2. Daily electricity use in Juneau, Alaska before and after the April 2008 avalanche ......... 12
Figure 3. Electricity demand growth in Chile in 2007/08 ................................................................ 15
Figure 4. Areas impacted by the 11 March earthquake and tsunami ............................................ 32
Figure 5. Estimated hourly load curve on summer peak day (all sectors) ...................................... 33
Figure 6. Estimated hourly electricity demand for all households, by appliance ........................... 34
Figure 7. Residential sector energy‐saving recommendations ....................................................... 35
Figure 8. Energy‐saving information kit for office buildings ........................................................... 36
Figure 9. Location of Juneau, Alaska ............................................................................................... 38
Figure 10. Conservation campaign brand, Juneau, Alaska ............................................................. 40
Figure 11. Survey responses: where did you get information on reducing energy use?................ 41
Figure 12. Daily electricity use in Juneau, Alaska before and after the April 2008 avalanche ....... 42
Figure 13. Energy‐saving actions taken by Juneau, Alaska residents ............................................. 43
Figure 14. Hydro storage relative to minzone and emergency zone 2007/08 ............................... 45
Figure 15. Industrial demand response compared to prior year .................................................... 46
Figure 16. Chilean long‐term storage facilities in the Central System ............................................ 52
Figure 17. Electricity demand growth in Chile in 2007/08 .............................................................. 54
List of tables
Table 1. The role of energy‐saving programmes in recent electricity shortfalls ............................ 10
Table 2. Types of electricity shortfalls ............................................................................................ 16
Table 3. Cause and type of select electricity shortfalls 2005‐11 .................................................... 17
Table 4. Demand‐side tools for managing electricity shortfalls ..................................................... 19
Table 5. Energy‐saving measures often promoted in information campaigns ............................... 22
Table 6. Common technology replacements .................................................................................. 23
Table 7. Advantages and disadvantages of various rationing strategies ........................................ 24

Saving Electricity in a Hurry: Update 2011 © OECD/IEA 2011
Page | 6
Foreword Prolonged electricity shortfalls can undermine economic activity by creating uncertainty in electricity supply and increasing electricity costs. In Saving Electricity in a Hurry (2005), the IEA presented case studies of countries that mitigated the negative impacts of electricity shortfalls by implementing emergency energy‐saving programmes. These programmes used a range of tools such as rationing, price signals and information campaigns that stimulated and enabled consumers to curb wasteful energy practices, delay electricity‐consuming activities to non‐peak times and replace old technologies with more energy‐efficient ones. Countries achieved energy savings ranging from 0.5% (France) to 20% (Brazil).
In the years since Saving Electricity in a Hurry was published, electricity shortfalls have continued to occur. At mid‐2011, Japan is in the midst of perhaps one of the most severe electricity shortfalls in history. This IEA information paper updates the earlier literature, highlighting findings from recent electricity shortfalls in Japan, the United States, New Zealand, South Africa and Chile. It draws on these case studies to reinforce three well‐established steps to developing energy‐saving programmes: (i) understanding electricity shortfall cause and duration; (ii) identifying energy‐saving opportunities; and (iii) implementing a package of demand‐side energy‐saving measures. This paper presents insights into best practice for emergency energy‐saving programmes and recommends how officials can use communication, price, rationing and technology tools to achieve fast energy savings. It also describes how emergency energy‐saving measures can lead to sustained energy savings.
Richard A. Bradley Head, Energy Efficiency and Environment Division

© OECD/IEA 2011 Saving Electricity in a Hurry: Update 2011
Page | 7
Acknowledgements The lead author of this information paper is Sara Bryan Pasquier, International Energy Agency (IEA) Energy Policy Analyst. The paper greatly benefited from the expertise of Alan Meier, author of Saving Electricity in a Hurry (IEA, 2005), and Grayson Heffner, Senior IEA Energy Efficiency Analyst, who authored the sections on rationing and market mechanisms. Special thanks go to Yukari Yamashita, Institute of Energy Economics Japan (IEEJ), and the Japanese Ministry of Economy, Trade and Industry (METI) for the case study on Japan; Bart van Campen, University of Auckland, for his work on the New Zealand and Chile case studies; Alan Meier, Lawrence Berkeley National Laboratory (LBNL) and Wayne Leighty, University of California, Davis, who provided the Juneau, Alaska case study; Sea Rotmann and Andrew Robertson, Energy Efficiency and Conservation Authority (EECA), for their contribution to the New Zealand case study; and Dr. Luiz Maurer, World Bank, for his work on the South Africa case study.
Thanks are also in order for the input of IEA staff including Robert Arnot, Philippine de T’Serclaes, Rebecca Gaghen, Nigel Jollands, Jung-Ah Kang, Vida Rozite, Marilyn Smith and Laszlo Varro. Overall supervision was provided by Richard Bradley, Head of the Energy Efficiency and Environment Division, and Bo Diczfalusy, Director of Sustainable Energy Policy and Technology.
Saving Electricity in a Hurry: Update 2011 © OECD/IEA 2011
Page | 8
Introduction Electricity shortfalls occur when demand outpaces electricity available to customers. Shortages in energy supply for electricity generation can cause electricity shortfalls, as can insufficient generation, transmission and distribution capacity.
Prolonged electricity shortfalls can reduce economic competitiveness by creating uncertainty in electricity supply and increasing electricity costs. The impact of an electricity shortfall on an economy can be high. Load shedding cost the Pakistani economy several USD billion in 2007 alone (Burki, 2009). Power outages resulting from the 2009‐10 electricity shortfall in Ethiopia led to an estimated gross domestic product (GDP) loss of 1.5% (Tsehaye et al., 2010). Canada’s total GDP in August 2003 fell 0.7% following the summer blackout in Ontario (Statistics Canada, 2003).
The environmental impacts of a prolonged electricity shortfall can also be significant. Faced with mandatory rationing or indiscriminate blackouts caused by load shedding, consumers often invest in expensive on‐site electricity generation produced by air‐polluting fuels such as diesel (ESMAP, 2010).
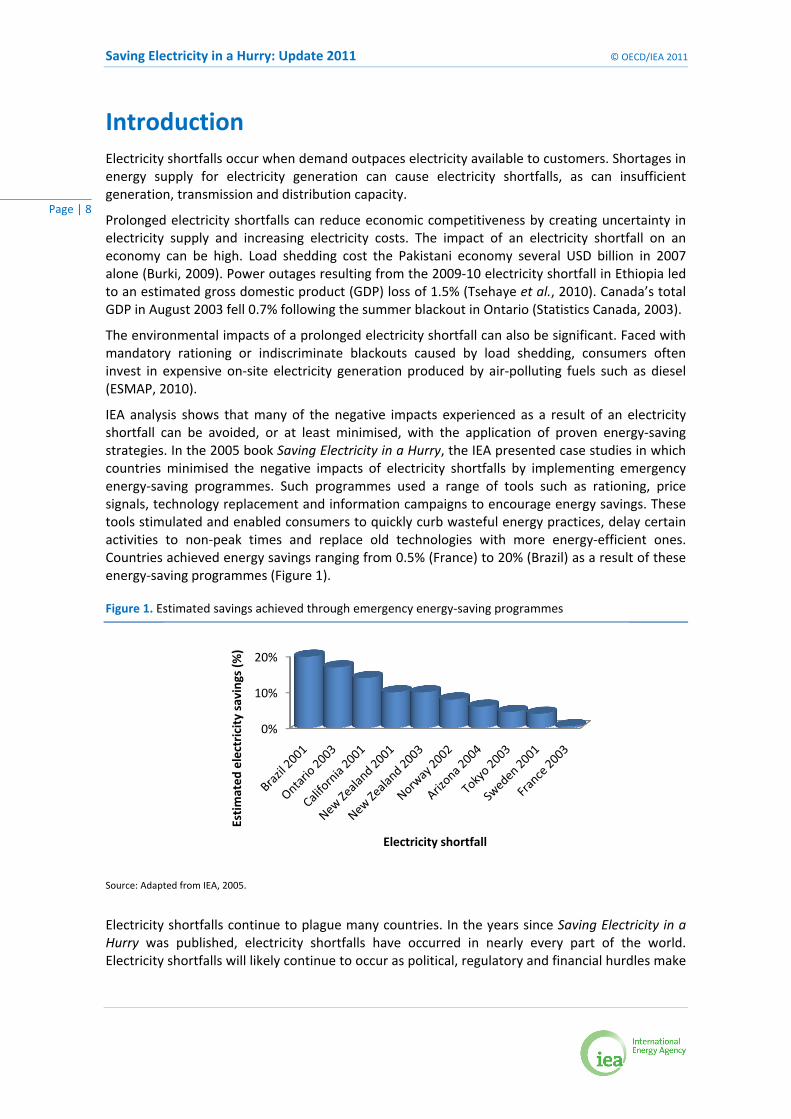
IEA analysis shows that many of the negative impacts experienced as a result of an electricity shortfall can be avoided, or at least minimised, with the application of proven energy‐saving strategies. In the 2005 book Saving Electricity in a Hurry, the IEA presented case studies in which countries minimised the negative impacts of electricity shortfalls by implementing emergency energy‐saving programmes. Such programmes used a range of tools such as rationing, price signals, technology replacement and information campaigns to encourage energy savings. These tools stimulated and enabled consumers to quickly curb wasteful energy practices, delay certain activities to non‐peak times and replace old technologies with more energy‐efficient ones. Countries achieved energy savings ranging from 0.5% (France) to 20% (Brazil) as a result of these energy‐saving programmes (Figure 1).
Figure 1. Estimated savings achieved through emergency energy‐saving programmes
Source: Adapted from IEA, 2005.
Electricity shortfalls continue to plague many countries. In the years since Saving Electricity in a Hurry was published, electricity shortfalls have occurred in nearly every part of the world. Electricity shortfalls will likely continue to occur as political, regulatory and financial hurdles make
0%
10%
20%
Estimated electricity savings (%)
Electricity shortfall
© OECD/IEA 2011 Saving Electricity in a Hurry: Update 2011
Page | 9
it difficult for government and energy utilities to invest the estimated USD 16.6 trillion needed to meet projected 2% annual electricity demand growth over the next 25 years (IEA, 2010d). Developing emergency demand‐side energy‐saving programmes as insurance against delays in supply additions may be an effective strategy for many governments to consider.
Relatively few studies analyse the impact of emergency energy‐saving programmes or describe proven practice in this area. This IEA information paper adds to the existing literature by highlighting preliminary findings and conclusions from recent case studies of electricity shortfalls in Japan, the United States, New Zealand, South Africa and Chile. It draws from recent work by the World Bank and others to:
reinforce well‐established guidelines on diagnosing electricity shortfalls, identifying energy‐saving opportunities and selecting a package of energy‐saving measures; and
highlight proven practice for implementing emergency energy‐saving programmes.
This paper will be valuable to government, academic, private‐sector and civil‐society stakeholders who inform, develop and implement electricity policy in general, and emergency energy‐saving programmes in particular.

Saving Electricity in a Hurry: Update 2011 © OECD/IEA 2011
Page | 10
Summary: Recent Electricity Shortfalls Case studies of recent electricity shortfalls in Japan, the United States, New Zealand, South Africa and Chile summarised below demonstrate the importance of quickly mobilising electricity end users to conserve energy and invest in energy‐efficient technologies (Table 1). The Annex provides more detailed case‐study descriptions.
Table 1. The role of energy‐saving programmes in recent electricity shortfalls
Japan 2011
Juneau, Alaska2008
New Zealand 2008
South Africa 2008/09
Chile 2007/08
Decrease in electricity consumption (%)
15% for most sectors during summer peak
period
25% to 40% across all sectors
3.6% to 6.7% in the residential
sector
20%, primarily for industry
No electricity demand growth
despite GDP growth
Approximate duration
Since March 2011
6 weeks June-July 2008 January 2008-
end 2009 Several months
Increase prices X X X X
Request changes in behaviour
X X X X X
Technology
replacements X X (CFLs only) X X X
Rationing X X X X
Fuel switching X X X
Daylight-saving time
X
Japan 2011
An earthquake and tsunami struck Eastern Japan on 11 March 2011, forcing several large nuclear and thermal power stations out of service for an extended period. Over 27 GW was estimated to be out of service by 21 March 2011 (IEEJ, 2011). Unable to meet electricity demand, Tokyo Electric Power Co (TEPCO) was forced to implement rolling blackouts, at great economic and social cost. Improved weather in April, and the return of thermal plants to service, allowed a cessation in rolling blackouts.
To avoid blackouts that might arise as the summer peak demand months caused demand to surpass electricity supply, the government decided to implement an energy‐saving strategy. On 13 March, the government established the Electricity Supply‐Demand Emergency Response Headquarters to lead the emergency energy‐saving effort. This Headquarters, which is led by the Chief Cabinet Secretary, co‐ordinates the participation of several government stakeholders, including the Agency for Natural Resources and Energy (ANRE) within the Ministry of Economy, Trade and Industry (METI) and the National Public Safety Commission.
Officials faced an early challenge: a lack of sector‐specific or end‐use specific load data made it difficult to determine which sectors could contribute the electricity savings needed to avoid blackouts. To address this problem, the government convened a group of researchers, officials
© OECD/IEA 2011 Saving Electricity in a Hurry: Update 2011
Page | 11
and TEPCO staff to estimate load curves, predict energy‐saving potential for each sector and develop specific recommendations for saving electricity.
In May, the government announced its summer electricity‐saving strategy and published revised electricity‐saving targets1 of 15% for most sectors. Special allowances were made for certain end‐users such as hospitals, nursing homes and schools.
At the time this paper went to press (June 2011), the government’s energy‐saving strategy included the following elements: mandatory rationing by large industry, information campaigns and technical energy‐saving assistance.
For industry consuming more than 500 kW, the government implemented Article 27 of the Electricity Business Act, which authorises the government to restrict electricity use. Between the hours of 9:00 and 20:00, players in this sector must cut electricity consumption by 15% compared with the same period last year (1 July to 22 September) – or face penalties of up to JPY 1 million (approximately USD 12,500) for each hour in which the target is not met.
Many large industries, and even medium and small enterprises (SMEs), have signalled their intention to achieve energy‐saving targets by shifting the work week and hours of operation. In addition, local METI offices and business associations have arranged for certified electrical engineers to meet with SMEs to offer advice on how to save energy. Other measures include telecommuting, the transfer of business operations to areas unaffected by the disaster and giving staff longer summer holidays.
A team of policy makers and an advertising consultancy, led by ANRE/METI, was tasked with preparing a multi‐dimensional energy‐saving information campaign. Elements included displaying electricity forecasts on peak‐power/supply‐demand balances on web sites, in major train stations and on television; promoting casual and cooler clothing through the Super Coolbiz campaign; publicising electricity‐saving tips; creating a power‐saving contest in the residential sector; and offering rewards2 to residential and commercial customers for meeting electricity ‐saving targets.
At press time, the Japanese summer electricity‐saving campaign still faced three main challenges. First, energy use in Japan is already quite efficient; much of the “low‐hanging” energy savings has already been captured. As a result, Japan will likely have to undertake deep energy‐efficiency and conservation actions. Second, absent regulatory measures, it is not clear to what extent SMEs and residential energy users will cut demand. Finally, every 13 months, nuclear‐power plants are shut down to undergo routine maintenance. To restart operations after maintenance, energy utilities must reach an agreement with the regional governor. Several governors have signalled their intention to prevent nuclear power plants from coming back on line, a move that might increase the extent and the duration of the electricity shortfall.
Juneau, Alaska, United States 2008
Over 90% of electricity supply to Juneau, Alaska, originates from hydroelectric facilities located 60 km from the city. In 2008, an avalanche severed Juneau’s transmission link to its hydroelectric‐power supply, prompting the utility to switch immediately to reserve diesel generators. Diesel fuel supplied almost all of the city’s demand until the line was repaired six weeks later.
1 Officials initially announced an energy‐saving target of 25% for industry. This figure was revised as TEPCO estimated it could increase supply capacity by 53.8 GW by the end of July, necessitating electricity savings of 10.3%. 2 At press time, the rewards programme was still under development
Saving Electricity in a Hurry: Update 2011 © OECD/IEA 2011
Page | 12
At the time, diesel prices were at record levels and much higher than the cost of hydropower. As a result, the cost of generating a kilowatt‐hour (kWh) of electricity delivered to customers rose from USD 0.11/kWh before the avalanche to over USD 0.50/kWh.
Juneau's municipal government realised the only way to prevent skyrocketing electricity bills was to prompt consumers to cut consumption. The city led the way by switching off alternating streetlights, certain equipment and lights in public buildings.
With the city's approval, the Juneau Economic Development Council (JEDC) organised a city‐wide energy‐saving campaign. The information campaign, called “Juneau Unplugged”, provided end users with advice on how to quickly and safely conserve electricity. This mass‐media campaign (using radio, newspaper and internet) was relatively inexpensive and easy to establish.
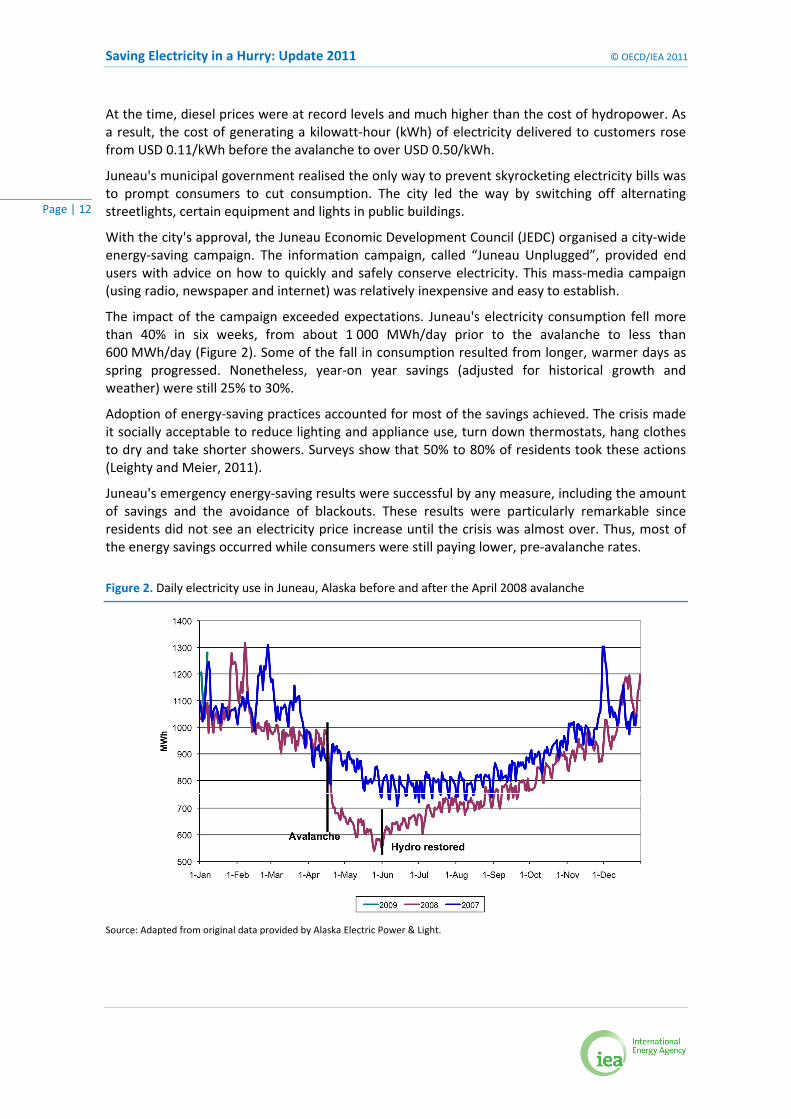
The impact of the campaign exceeded expectations. Juneau's electricity consumption fell more than 40% in six weeks, from about 1 000 MWh/day prior to the avalanche to less than 600 MWh/day (Figure 2). Some of the fall in consumption resulted from longer, warmer days as spring progressed. Nonetheless, year‐on year savings (adjusted for historical growth and weather) were still 25% to 30%.
Adoption of energy‐saving practices accounted for most of the savings achieved. The crisis made it socially acceptable to reduce lighting and appliance use, turn down thermostats, hang clothes to dry and take shorter showers. Surveys show that 50% to 80% of residents took these actions (Leighty and Meier, 2011).
Juneau's emergency energy‐saving results were successful by any measure, including the amount of savings and the avoidance of blackouts. These results were particularly remarkable since residents did not see an electricity price increase until the crisis was almost over. Thus, most of the energy savings occurred while consumers were still paying lower, pre‐avalanche rates.
Figure 2. Daily electricity use in Juneau, Alaska before and after the April 2008 avalanche
Source: Adapted from original data provided by Alaska Electric Power & Light.

© OECD/IEA 2011 Saving Electricity in a Hurry: Update 2011
Page | 13
Investment in more energy‐efficient appliances did not play a prominent role in the aggregate results either. Because of Juneau's geographic isolation, more energy‐efficient appliances were not available. Of all low‐cost technology measures, installation of CFLs was by far the most popular ‐ occurring in over 70% of homes. Some 10% of households put in place weather stripping; less than 5% invested in new insulation.
A year after the avalanche, one‐third of the crisis‐induced reduction in electricity persisted, suggesting that at least some of the crisis‐driven energy savings achieved are durable. Addressing longer electricity shortfalls may require different strategies, but the results from Juneau show that large and sustainable energy savings are feasible even without initial high prices and large‐scale technology replacements
New Zealand 2008
New Zealand faced the risk of an electricity shortfall in 2008 as a result of a drought. The initial response to the shortfall was left to price increases in the wholesale market. At the time, high international prices for New Zealand exports made production profitable regardless of electricity prices. Thus, higher electricity prices for industry did not cut electricity demand as much as expected (Hunt and Isles, 2009).
As the drought deepened and higher prices failed to reduce industrial demand, officials sought energy savings from the residential and commercial sectors. An information campaign was launched and included advertisements in newspapers, television, radio, public transport and websites. Officials also established a dedicated website with news, feedback on consumption data, regional comparisons of savings and information on hydro lake levels and inflows.
Several studies reveal decreased demand due to these measures. Temperature‐corrected national electricity savings in the residential and small commercial sectors were estimated at between 3.6% (Transpower, 2008, as quoted by Blackwell, 2009) and 6.9% (van Campen, 2010).
Because of the brevity of the conservation campaign, the savings do not seem to have had a structural influence on demand. Analysis of surveys undertaken in 2008 concludes that people responded primarily by turning off lights and fuel switching (Blackwell, 2009). As 66% of New Zealand households have multiple heat sources, many switched part of their heating from electricity to alternative fuels such as wood or gas (natural gas or liquid propane gas) (Statistics New Zealand).
A 2009 New Zealand government review concluded that households can contribute significantly to electricity savings in dry‐year crises. The review cautioned, however, that uncompensated voluntary campaigns can provide a moral hazard to the electricity market; if used too frequently, they can lead to consumer wariness or even resentment (ETAG, 2009). To guard against this effect, the Electricity Authority is developing a default demand‐response mechanism to compensate households in the case of future campaigns. As New Zealand is particularly vulnerable to brief dry spells due to its limited hydro storage, such enhanced residential demand response could effectively complement supply options and industrial demand reductions.
South Africa 2008/09
An acute electricity shortfall that first struck in January 2008 continues to affect South Africa. The shortfall was brought on by insufficient generation supply relative to growing demand, maintenance closures and unplanned generator outages.
Saving Electricity in a Hurry: Update 2011 © OECD/IEA 2011
Page | 14
In the years leading up to the electricity crisis, South Africa experienced sustained economic growth, supported by reliable and sufficient electricity supply. With this economic growth, electricity consumption increased up to 60% from 1994 to 2006. Investment in new electricity supply, however, did not match the increase in demand.
In response to the January 2008 shortfall, Eskom, the South African national electric utility, and the government (including the Department of Energy [DoE]3 and the National Electricity Regulator [NERSA]), implemented power rationing and other measures to prevent electricity‐system collapse. These measures were initiated across the economy, but especially in the industrial sector. To meet the country’s forecasted demand growth (more than 12 GW in 5‐7 years), Eskom has also embarked on a large New Build programme including two new coal‐fired plants (ESMAP, 2011).
By mid‐2008, Eskom and the government unveiled plans to reduce peak demand by 10% (around 3 000 MW) through a Power Conservation Programme (PCP). The PCP initially focused on large industrial users, which account for 58% of electricity consumption (IEA, 2010c), and targeted mines and smelters as key areas for energy savings. In 2008, electricity consumption from gold and platinum mines and metal smelters dropped 1 500 MW as a result of the PCP and the international financial crisis. Eskom continued the PCP for large industrial customers in 2009 (Energy Tribune, 2009). Eskom is now recommending that the country’s top 500 consumers agree to a mandatory Energy Conservation Scheme (ECS) that would set a savings target of 10% (against a 2006 baseline) during acute electricity shortfalls. The ECS would require participants to establish baselines and install monitoring and verification equipment. The DoE is currently developing a policy for ECS that will be the basis of government’s final position.
Although accounting for only 20% of electricity consumption (IEA, 2010c), the residential sector can play a key role in managing peak‐load demand. Consumers in this sector typically use more electricity during the early morning and late afternoon peak hours than at other times (ESMAP, 2010). Energy‐saving tools were thus designed to target electricity savings during those peak hours.
One such tool is a “Power Alert” message, displayed at 30‐minute intervals on the internet and on television between 17:30 and 20:30, which provides real‐time information on the electricity shortfall. The Power Alert message informs the public of immediate measures that can be taken to reduce the peak‐load crisis. According to Eskom, the average impact per message is a decrease of over 500 MW for brownout alerts and a little less than 100 MW for green alerts (when there is only limited strain on the system).
The 49 Million Initiative (launched in March 2011 by Eskom, the government and business partners) is another information campaign targeting the residential and commercial sectors. This initiative seeks to encourage 49 million South Africans to embrace energy savings as part of their national identity and culture. The campaign mobilises businesses and media to disseminate key messages such as “switch it off”.
To spread energy‐saving messages in areas without televisions, South Africa implemented innovative information campaigns in the form of road shows and demonstration projects. In the residential sector, the government and Eskom are also implementing programmes to provide residents with technologies for efficient lighting, solar water heating, installation of aerated shower heads and geyser blankets.
3 DoE was formerly part of the Department of Minerals and Energy (DME). Since 2009, DME has been divided into two ministries, the Department of Mineral Resources and DoE.
© OECD/IEA 2011 Saving Electricity in a Hurry: Update 2011
Page | 15
Chile 2007/08
In 2007/08, Chile experienced an electricity shortfall brought on by a drought, interrupted gas imports from Argentina and technical problems arising from fuel switching in thermal power stations.
Chile was able to avoid electricity interruptions by implementing a package of measures within the framework of the National Energy Efficiency Programme (Programa País Eficiencia Energética or PPEE), including public information campaigns and a programme to distribute CFLs. Also on the demand side, the government provided long‐term financing for energy‐efficiency investments, implemented rationing, extended daylight‐saving time and offered financial incentives for conservation. On the supply side, officials installed back‐up turbines and engines, and converted combined‐cycle gas turbines (CCGTs) to allow operation with diesel.
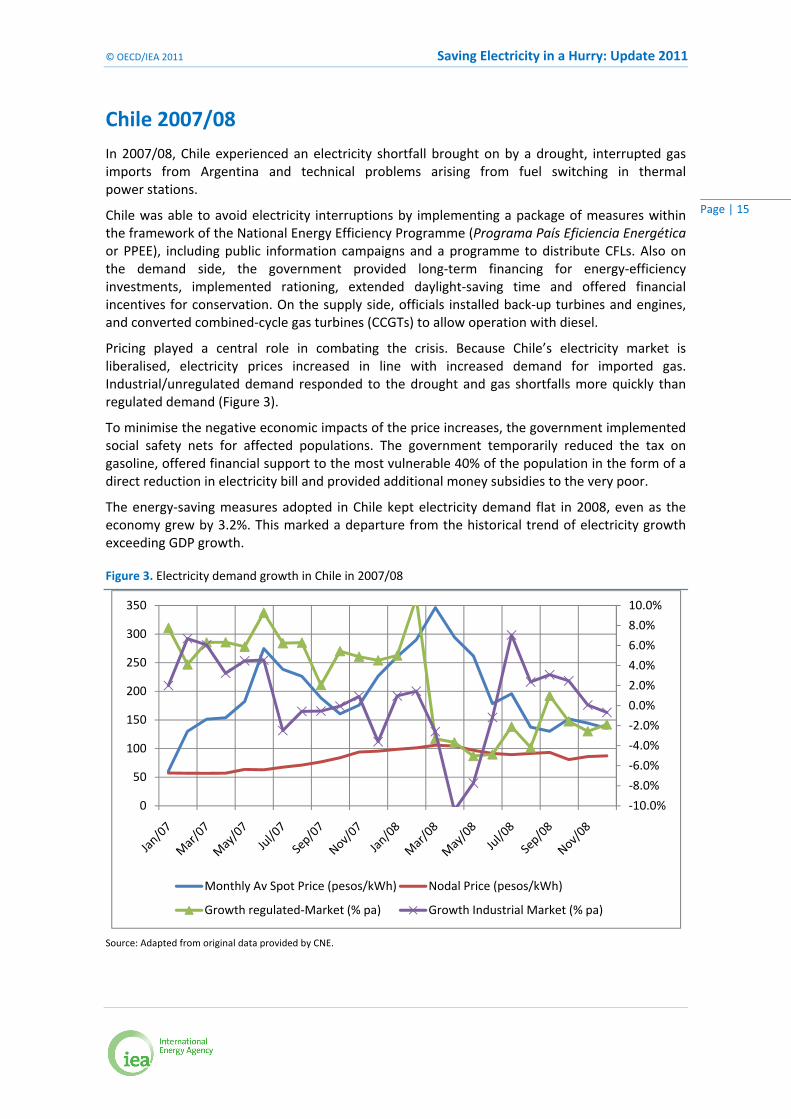
Pricing played a central role in combating the crisis. Because Chile’s electricity market is liberalised, electricity prices increased in line with increased demand for imported gas. Industrial/unregulated demand responded to the drought and gas shortfalls more quickly than regulated demand (Figure 3).
To minimise the negative economic impacts of the price increases, the government implemented social safety nets for affected populations. The government temporarily reduced the tax on gasoline, offered financial support to the most vulnerable 40% of the population in the form of a direct reduction in electricity bill and provided additional money subsidies to the very poor.
The energy‐saving measures adopted in Chile kept electricity demand flat in 2008, even as the economy grew by 3.2%. This marked a departure from the historical trend of electricity growth exceeding GDP growth.
Figure 3. Electricity demand growth in Chile in 2007/08
Source: Adapted from original data provided by CNE.
‐10.0%
‐8.0%
‐6.0%
‐4.0%
‐2.0%
0.0%
2.0%
4.0%
6.0%
8.0%
10.0%
0
50
100
150
200
250
300
350
Monthly Av Spot Price (pesos/kWh) Nodal Price (pesos/kWh)
Growth regulated‐Market (% pa) Growth Industrial Market (% pa)
Saving Electricity in a Hurry: Update 2011 © OECD/IEA 2011
Page | 16
Steps for Mitigating Electricity Shortfalls Recent electricity shortfalls reinforce three well‐established steps officials should follow when developing an energy‐saving programme:
Step 1 Analyse the cause and duration of an electricity shortfall before designing an energy‐saving programme. Each electricity shortfall has a different character, and not all energy‐saving measures are appropriate for every crisis.
Step 2 Identify opportunities for energy savings, including the sectors and end‐users from which energy savings can be captured at the least economic, social and political cost.
Step 3 Implement a comprehensive and balanced package of energy‐saving demand‐side tools. These tools can include rationing, price signals, information campaigns, technology replacement and market mechanisms.
Step 1: Analyse the cause and duration of an electricity shortfall
Analysing the cause and duration of an electricity shortfall is critical to determining which energy‐ saving measures should be put in place. In some cases, the cause (e.g. a transmission line outage) will help officials assess the anticipated duration (the time needed for repair); in others (e.g. drought), it is impossible to predict how long the cause will remain in effect.
Cause of electricity shortfall
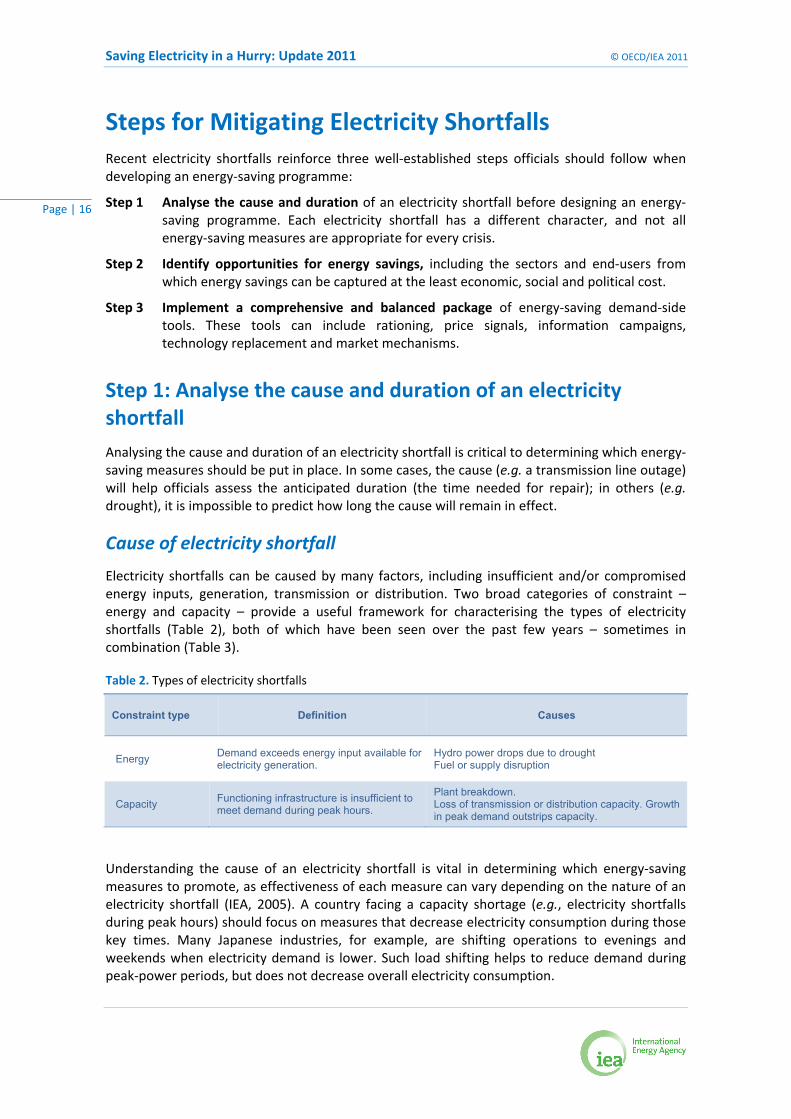
Electricity shortfalls can be caused by many factors, including insufficient and/or compromised energy inputs, generation, transmission or distribution. Two broad categories of constraint – energy and capacity – provide a useful framework for characterising the types of electricity shortfalls (Table 2), both of which have been seen over the past few years – sometimes in combination (Table 3).
Table 2. Types of electricity shortfalls
Constraint type Definition Causes
Energy Demand exceeds energy input available for electricity generation.
Hydro power drops due to drought Fuel or supply disruption
Capacity Functioning infrastructure is insufficient to meet demand during peak hours.
Plant breakdown. Loss of transmission or distribution capacity. Growth in peak demand outstrips capacity.
Understanding the cause of an electricity shortfall is vital in determining which energy‐saving measures to promote, as effectiveness of each measure can vary depending on the nature of an electricity shortfall (IEA, 2005). A country facing a capacity shortage (e.g., electricity shortfalls during peak hours) should focus on measures that decrease electricity consumption during those key times. Many Japanese industries, for example, are shifting operations to evenings and weekends when electricity demand is lower. Such load shifting helps to reduce demand during peak‐power periods, but does not decrease overall electricity consumption.

© OECD/IEA 2011 Saving Electricity in a Hurry: Update 2011
Page | 17
Table 3. Cause and type of select electricity shortfalls 2005‐11
Country/state Year Cause Constraint
Alaska 2008 Avalanche cut transmission line Capacity
Bangladesh 2005 Demand growth, insufficient investment Capacity
Chile 2007/08 Drought, gas shortfall, plant breakdowns Energy/capacity
China 2007 Drought Energy
Ethiopia 2009/10 Demand growth, insufficient investment Capacity
Japan 2011 Earthquake/tsunami causes plant failure Capacity
New Zealand 2008 Drought Energy
Pakistan 2007 Demand growth, insufficient investment Capacity
South Africa 2008 Demand growth, insufficient investment Capacity
In the case of an electricity shortfall caused by a drought and/or fuel disruption, such as the 2007/08 shortfall in Chile, officials must aim to reduce overall electricity consumption. Conservation measures such as turning off non‐essential lighting, reducing shower length and modifying thermostats can be effective.
Anticipated duration
Calculating the anticipated duration of an electricity shortfall helps determine appropriate policy responses. Some measures can quickly reduce demand, but only for a short period of time; others take longer to put in place, but lead to longer‐term savings. In Juneau, Alaska, officials knew that the electricity shortfall would end with the repair of the transmission line and short‐term measures would be enough to mitigate the crisis. Ultimately, the repairs were undertaken within six weeks and the crisis ended. In Chile and New Zealand, officials had no influence over the droughts and focused on short‐ and medium‐term energy‐saving measures to avoid shortfalls. In Japan and South Africa, shortfalls result from long‐term capacity constraints and require a range of demand‐ and supply‐side solutions.
Various measures are known to be effective in the short, near and long term to achieve energy savings.
Short‐run, no‐cost or low‐cost changes: turn off lights, unplug electronics, use electricity at different times of day;
Medium‐term, medium‐cost changes: install weather stripping, switch to CFLs, purchase a programmable thermostat;
Long‐term, infrastructure and policy changes: make window and building envelope improvements, strengthen energy‐performance requirements in building codes.
Step 2: Identify opportunities for energy savings
In planning an electricity‐shortfall response, officials should quickly identify the sectors in which the greatest energy savings can be captured at the least economic, social and political cost.
Energy‐saving opportunities vary widely depending on a country’s economic structure, climate, social practices, etc. Consider, for example, the diverse economic structures of New Zealand and

Saving Electricity in a Hurry: Update 2011 © OECD/IEA 2011
Page | 18
South Africa. Industry accounts for 37% of electricity consumption in New Zealand while the residential sector accounts for 33% (IEA, 2010c). In South Africa, the industry share is much higher (58%) and the residential share lower (20%). As a result, emergency energy‐saving programmes in these two countries must necessarily differ.
Availability of detailed data on sectoral end‐use consumption is critical to identifying energy‐saving opportunities. The IEA recommends countries develop detailed electricity final consumption data on the major consuming sectors, including time‐of‐use variations. As these data can take years to collect, it is important to gather data on an ongoing basis and well in advance of a potential crisis. For example, customer surveys conducted in the years preceding the 2007/08 crisis helped to inform officials in Chile as to which sectors to target and which measures to consider during the electricity shortfall.
In Japan, the energy utility did not release sector‐specific load curves; thus, it was unclear how much and in which sectors electricity savings were needed. The government had to convene experts to estimate load curves, predict energy‐saving potential for each sector and develop specific recommendations for saving electricity. Had these data been available at the time of the electricity shortfall, the energy‐saving campaign could have been more quickly implemented.
Once electricity consumption by sector and end‐use is known, policy makers can focus on specific measures. Chile estimated lighting and refrigeration accounted for 60% of residential electricity consumption and targeted these two end‐uses in its energy‐saving programme.
Time of electricity use is especially important in countries facing capacity constraints. In South Africa, residential consumers use more electricity during the early morning and the late afternoon (ESMAP, 2010), a usage pattern that coincides with the timing of capacity constraints. Targeting electricity savings during those peak hours is an effective capacity‐shortfall remedy.
Prior to implementation, promising energy‐saving measures identified in priority sectors should be screened for feasibility and practicality. Regulations, infrastructure and political realities make some tools or measures impossible or ineffective in some communities. For example the residential sector in New Zealand held a large potential for energy savings, but the use of fixed‐tariffs made it impossible to use price signals to influence residential‐consumer behaviour. In another example, because alternative heating infrastructures were already in place in most homes, the majority of Juneau residents were able to save electricity by switching to other fuels for space and water heating. Such examples underscore the importance of flexibility in pricing frameworks and energy‐using technology.
Step 3: Implement a package of demand‐side energy‐saving tools
Analysis of electricity shortfalls underscores the importance of a comprehensive crisis management approach including measures to address both supply and demand. Supply‐side measures include reducing energy production losses and removing transmission bottlenecks (ESMAP, 2010). Five main demand‐side tools (Table 4) are the focus of this paper:
Price signals;
Behaviour change;
Technology replacement;
Rationing;
Market mechanisms.

© OECD/IEA 2011 Saving Electricity in a Hurry: Update 2011
Page | 19
These demand‐side tools complement one another and are often used simultaneously to mitigate electricity shortfalls. Rationing, for example, is often implemented in conjunction with price signals. Information campaigns often reinforce technology replacement programmes. The mix of measures put in place depends on the shortfall context and opportunities for energy savings.
Table 4. Demand‐side tools for managing electricity shortfalls
Measure Description Prerequisites
Price signals
Industrial tariffs Signal crisis intensity through prices. Ability to adjust prices and advanced billing systems and metering.
Residential tariffs
Signal scarcity to residential users through prices. Ability to adjust prices, data on residential price elasticity, political will, time of use (TOU) pricing, smart meters.
Behaviour change
Information campaigns
Raise public awareness, advocate voluntary energy-saving measures.
Ability to select/coordinate media and messages.
Technology replacement
Lighting replacement
Replace less efficient bulbs with more efficient ones (CFLs, LEDs, traffic lights, street lights, etc.).
Requires a promotion capability, financing scheme, distribution channels and a mechanism for disposing of old bulbs.
Appliance and equipment replacement
Replace targeted inefficient appliances and equipment.
Requires a promotion capability financing scheme, distribution channels and a mechanism for disposing of scrapped appliances.
Rationing
Voluntary rationing
Request voluntary reductions in electricity use. Requires analysis to set reasonable reductions by customer type commensurate with economic impact.
Compulsory rationing
Mandate restricted electricity use. Requires analysis to set reasonable reductions commensurate with economic impact, social safety nets and penalties for non-compliance.
Load shedding Engineered electrical power outage. Easy to implement but can cause large and unpredictable economic losses, considered a rationing tool of last resort.
Load control TOU or dispatched current limiters or appliance control.
Need to identify end-uses to control, feasible control algorithms and compensation.
Market mechanisms
Bilateral trading of power quotas
Large energy users are afforded an opportunity to trade load reductions between themselves.
Requires contractual mechanisms, a third party referee, a basis for verification, and compensation.
Secondary markets
Over the counter or other mechanism for trading load reductions among multiple end-users.
Requires creation of a trading desk or OTC mechanisms, contracts, third party arbiter, and a basis for verification.
Source: Adapted from ESMAP, 2010.
Price signals
Increasing the price of electricity can both inform consumers of an electricity shortfall and create incentives for users to reduce consumption. Literature on the price elasticity of demand makes it possible to estimate the amount of energy savings that will result from such price signals.
Saving Electricity in a Hurry: Update 2011 © OECD/IEA 2011
Page | 20
Estimates of price elasticity derived from a variety of market circumstances and alternative pricing plans suggest that, in the short run, doubling prices can prompt electricity savings of 10% to 20% (Neenan and Eom 2008).
Price signals can better stimulate electricity savings under certain conditions. Price signals for end‐users should be tied to a wholesale market mechanism to ensure prices reflect supply and demand. Many liberalised markets include a direct link between wholesale markets and large users, but may have no such link to smaller (residential and commercial) users. In New Zealand, liberalised electricity markets allowed shortfalls to prompt increased spot prices, which often translated into increases in retail prices for large industrial users. The same was not true for residential and commercial consumers that benefit from regulated electricity prices or are supplied on fixed‐price tariffs.
Officials should ensure that the retail price structure and level (hereafter referred to as a tariff) prompts consumers to use electricity rationally and to invest in energy efficiency. In much of Latin America, increasing‐block tariffs – in which the price of electricity changes with the level of consumption – help to ensure the poor can afford a minimum amount of electricity. For increasing‐block tariffs, the price of electricity is lower for consumption up to a certain limit. Consumption exceeding this limit is charged a higher price. In order to preserve incentives for the efficient use of even small amounts of electricity, the price of the first block should be greater than the direct avoidable costs of the electricity (ESMAP, 2010).
Administrative, political and technical obstacles to changing electricity tariffs may make it impossible to implement large price increases in a short‐term emergency situation. Even if tariffs are increased, there is a further delay as smaller users receive the price signals infrequently –when their monthly electricity bill is delivered. This delay can limit the impact of a price signal in short‐term crises.
Shortfalls caused by capacity constraints can often be addressed through time‐differentiated price signals. These price signals encourage reduction in energy use at certain times of the day and year when demand is highest and electricity shortages may exist (IEA, 2004). Several pricing options can reduce demand during peak hours:
Time‐of‐use (TOU) pricing, in which price varies according to a preset schedule, e.g. time of day, day of week and season.
Real‐time pricing (RTP), in which the end‐user price is linked directly to hourly spot prices in a wholesale market.
Critical‐peak pricing (CPP), a hybrid of TOU and RTP in which a TOU rate is in effect all year except for a contracted number of peak days (exact dates unknown) during which electricity is charged at a higher price.
Technologies such as metering, communications and data‐processing systems must be in place for these more dynamic pricing options such as RTP and CPP to work. Until recently, only a few customers other than large energy users have had access to such technologies.
In market‐based electricity systems, shortfalls can result in price spikes. These price increases help to mitigate shortfall emergencies, but they can be devastating for low‐income households. Direct and indirect subsidies can be used in conjunction with market‐based pricing and rationing to induce energy savings while guaranteeing minimum electricity supplies for the poor. In Chile, the government allowed electricity prices to increase, but introduced a direct subsidy to protect poor residential consumers.
© OECD/IEA 2011 Saving Electricity in a Hurry: Update 2011
Page | 21
Behaviour changes and information campaigns
Experience shows that measures to request changes in behaviour, most often through tools such as information campaigns, can lead to large energy savings, especially during short‐duration electricity shortfalls. Information campaigns can be used to build awareness about the electricity shortfall and advocate for a wide range of energy‐saving actions – from transferring time of use, to decreasing or even eliminating use. Information campaigns supplement and reinforce all of the other demand‐side tools.
When deciding what kinds of electricity‐saving measures to ask of consumers, officials should remember that consumers are more willing to be inconvenienced during an electricity shortfall than in a normal situation (IEA, 2005). Requests for energy savings should reiterate that changes in behaviour will be needed only temporarily; however, information and awareness campaigns can also point out the continuing benefits of energy‐saving practices even after the shortfall is over.
Information campaigns are very effective at stimulating energy‐saving behaviour. They can be designed and launched quickly, and impact large number of consumers by reinforcing messages via multiple media (e.g. television, radio, newspapers, road shows and the internet).
When designing and implementing an information campaign, officials should focus on four areas: analysing the determinants of desired behaviour change; identifying the target group; choosing the most effective communications channels; and conveying urgency while keeping an upbeat tone (Mikkonen et al., 2010).
Analyse the determinants of desired behaviour change: Information campaigns seek to change certain behaviour, including habitual and investment behaviour (Hammer et al., 2010). To do this, campaigns must motivate and enable changes by improving awareness, creating understanding of the issues, and changing social norms and attitudes.
Carefully crafting information‐campaign messages so as not to blame the consumers for the problem is an important part of motivating energy savings, as is convincing them that their actions make a difference.
Explaining to consumers which measures will save electricity quickly is essential to enabling them to act. If the shortfall occurs during peak hours, then the campaign must explain when to save electricity. Many consumers need to be educated about energy before they can be expected to act. For example, if a campaign asks consumers to reduce standby power, the campaign will need to first explain what standby power is and then explain how it can be cut.
Identify target group: Officials should identify the group that they wish to target with the information campaign (Kyung‐Hee, 2007). The target audience can be anyone from school children (in Chile) to professionals in the industrial or commercial sectors (South Africa). Many aspects of the information campaign will depend on the target group, including the message(s) and the channel(s) used to communicate.
Too often information campaigns try to offer “everything to everybody.” These campaigns are less effective than targeted ones, and lead to inefficient use of resources (Mikkonen et al., 2010).
Choose which communication channels to use: Traditional mass media, including televisions, are still the most commonly used communication channels for energy‐saving information campaigns in developed and developing countries alike (Mikkonen et al., 2010). Some developing countries, such as South Africa, have implemented road shows and demonstration projects to spread messages in areas without televisions.
Saving Electricity in a Hurry: Update 2011 © OECD/IEA 2011
Page | 22
Convey urgency while keeping an upbeat tone: Several studies advocate that campaigns convey saving energy as “fun and feasible” rather than as “onerous tasks of self‐deprivation” (Hummer et al., 2010).
Juneau, Alaska launched a positive and upbeat information campaign called “Juneau Unplugged” during the 2008 electricity shortfall. The campaign sent the message that conserving electricity is part of being a good citizen. It played an important psychological role by diffusing fears of the unknown, and providing concrete actions to reduce the impact of higher prices.
The tone of Chile’s information campaign Inciativas con buena energia (Good Energy Initiatives) evolved during the course of the electricity shortfall. At first the campaign requested urgent action to counteract a threatening energy crisis. Towards the end of the crisis, the campaign was modified to send a lighter, positive message that thanked the population for undertaking energy‐saving measures (Mikkonen et al., 2010).
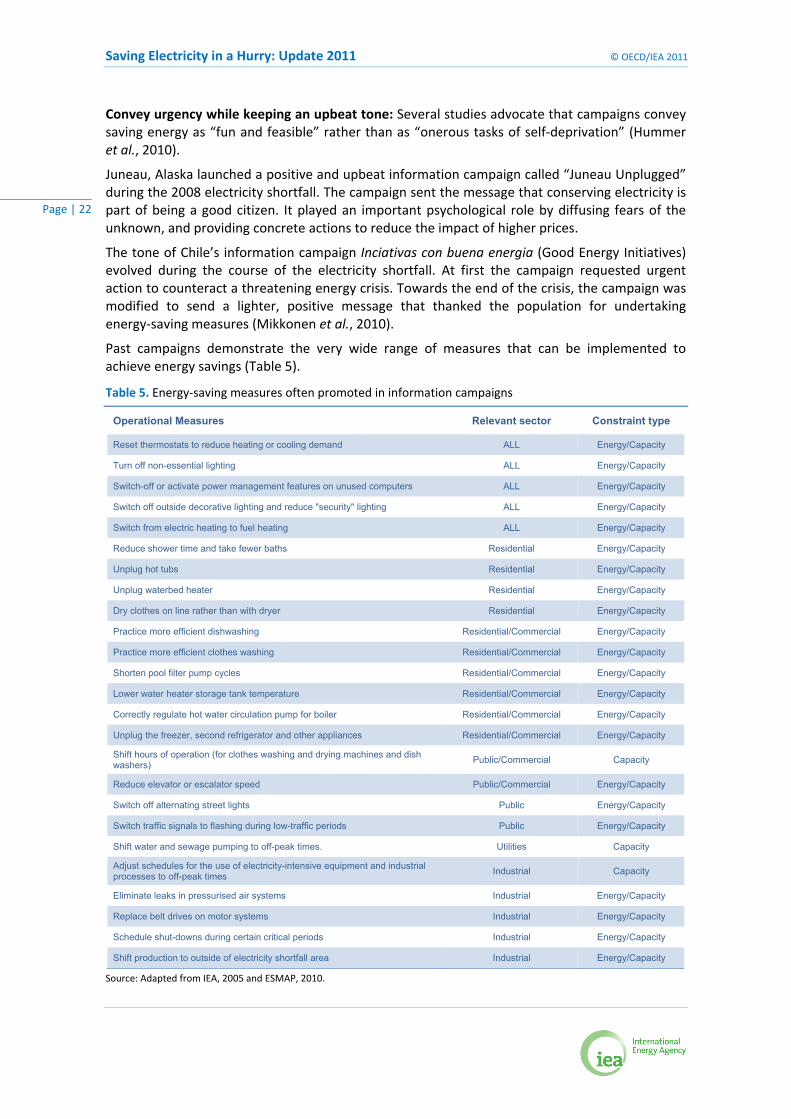
Past campaigns demonstrate the very wide range of measures that can be implemented to achieve energy savings (Table 5).
Table 5. Energy‐saving measures often promoted in information campaigns
Operational Measures Relevant sector Constraint type
Reset thermostats to reduce heating or cooling demand ALL Energy/Capacity
Turn off non-essential lighting ALL Energy/Capacity
Switch-off or activate power management features on unused computers ALL Energy/Capacity
Switch off outside decorative lighting and reduce "security" lighting ALL Energy/Capacity
Switch from electric heating to fuel heating ALL Energy/Capacity
Reduce shower time and take fewer baths Residential Energy/Capacity
Unplug hot tubs Residential Energy/Capacity
Unplug waterbed heater Residential Energy/Capacity
Dry clothes on line rather than with dryer Residential Energy/Capacity
Practice more efficient dishwashing Residential/Commercial Energy/Capacity
Practice more efficient clothes washing Residential/Commercial Energy/Capacity
Shorten pool filter pump cycles Residential/Commercial Energy/Capacity
Lower water heater storage tank temperature Residential/Commercial Energy/Capacity
Correctly regulate hot water circulation pump for boiler Residential/Commercial Energy/Capacity
Unplug the freezer, second refrigerator and other appliances Residential/Commercial Energy/Capacity
Shift hours of operation (for clothes washing and drying machines and dish washers)
Public/Commercial Capacity
Reduce elevator or escalator speed Public/Commercial Energy/Capacity
Switch off alternating street lights Public Energy/Capacity
Switch traffic signals to flashing during low-traffic periods Public Energy/Capacity
Shift water and sewage pumping to off-peak times. Utilities Capacity
Adjust schedules for the use of electricity-intensive equipment and industrial processes to off-peak times
Industrial Capacity
Eliminate leaks in pressurised air systems Industrial Energy/Capacity
Replace belt drives on motor systems Industrial Energy/Capacity
Schedule shut-downs during certain critical periods Industrial Energy/Capacity
Shift production to outside of electricity shortfall area Industrial Energy/Capacity
Source: Adapted from IEA, 2005 and ESMAP, 2010.

© OECD/IEA 2011 Saving Electricity in a Hurry: Update 2011
Page | 23
Experience shows that every electricity shortfall is unique. The energy‐saving measures promoted in information campaigns should take into account the electricity shortfall context and energy‐saving opportunities, including how electricity is used and when it can be saved. Regular collection of data related to energy consumption will help campaign organisers better target the message and audience. Combining information campaigns with other tools such as price signals and incentives for purchasing energy‐efficient technologies will increase overall energy savings.
Technology replacement
When electricity shortfalls are expected to persist, investing in high‐efficiency or demand‐response technology can complement price signals and information campaigns. Technology replacements take longer to implement than changes in behaviour, but they provide more reliable and sustainable electricity savings.
In some cases, the same implementation arrangements used to deliver non‐emergency energy efficiency improvements can be used to deliver emergency technology‐replacement programmes. These arrangements include trained staff, distribution networks, installation services and financing arrangements.
Some proven technology replacement emergency measures include:
deploying energy‐efficient lighting, especially compact fluorescent lamps (CFLs) and light‐emitting diodes (LED);
replacing old equipment (ranging from refrigerators to traffic signals) with new, more efficient technology;
retrofitting and/or adjusting existing equipment to make it more efficient;
installing load‐control devices on selected appliances and equipment.
Table 6. Common technology replacements
Measure Sector
Aerated-showerhead installation Residential
Appliance replacement Residential, commercial
CFL, LED replacement All
Direct load-control device installation Residential, commercial
Motor replacement Industrial, commercial, public
Street-light and traffic-light replacement Public
Source: Adapted from IEA, 2005 and ESMAP, 2010.
The 2011 electricity shortfall in Japan led to record sales of LED lighting. LED share of lighting sales reached 40%, double the pre‐crisis share, and for the first time surpassed incandescent‐lamp sales.
Rationing
Rationing allows officials to influence electricity consumption in a very direct way, by controlling the amount or timing of energy supply or obliging consumers to control their consumption subject to penalties (Table 7). Rationing can be specific, e.g. administrators decide which users will cut back, when and by how much (ESMAP, 2010), or more general, e.g. an entire geographic
Saving Electricity in a Hurry: Update 2011 © OECD/IEA 2011
Page | 24
area, economic activity or load type is targeted. Rationing can be voluntary, although it is usually mandatory, and different approaches can be used for different consumers (residential, commercial, industry, public sector, etc.). To maximise efficiency and cost effectiveness, rationing should provide an incentive for consumers to reduce their lowest‐value consumption (ESMAP, 2010). Price signals are often used simultaneously with rationing. In short, rationing is a flexible tool that can be tailored to help alleviate many energy‐shortfall situations.
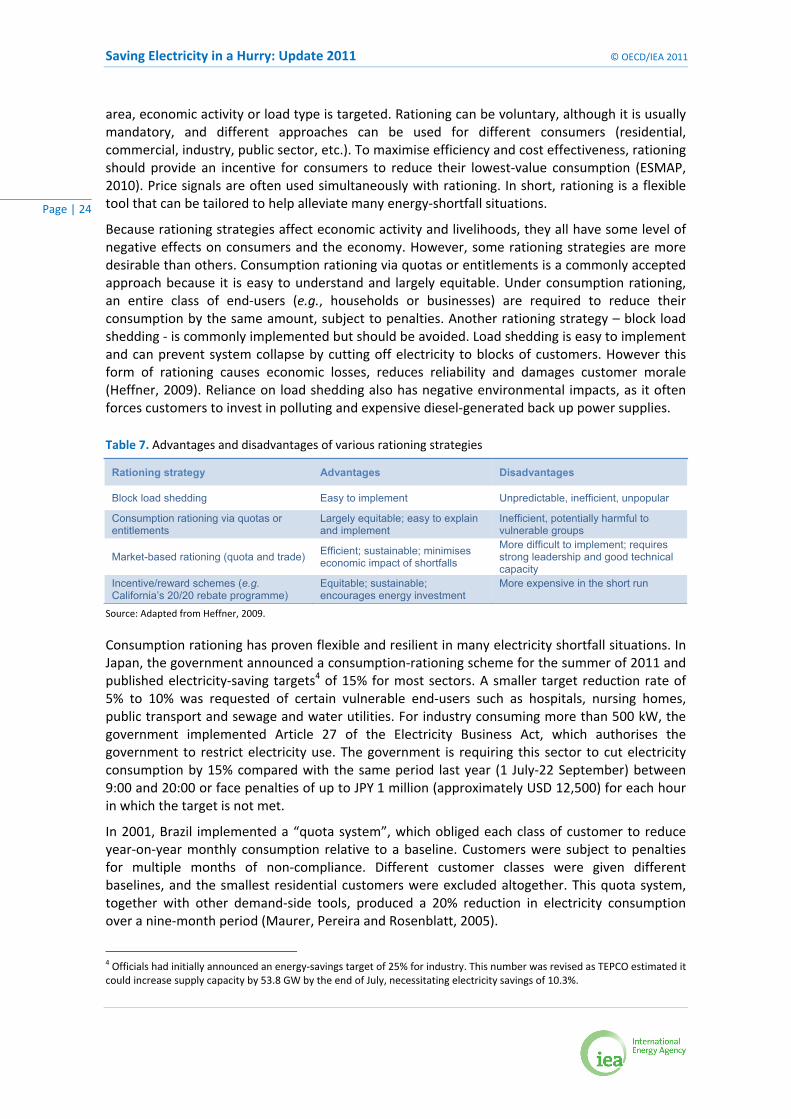
Because rationing strategies affect economic activity and livelihoods, they all have some level of negative effects on consumers and the economy. However, some rationing strategies are more desirable than others. Consumption rationing via quotas or entitlements is a commonly accepted approach because it is easy to understand and largely equitable. Under consumption rationing, an entire class of end‐users (e.g., households or businesses) are required to reduce their consumption by the same amount, subject to penalties. Another rationing strategy – block load shedding ‐ is commonly implemented but should be avoided. Load shedding is easy to implement and can prevent system collapse by cutting off electricity to blocks of customers. However this form of rationing causes economic losses, reduces reliability and damages customer morale (Heffner, 2009). Reliance on load shedding also has negative environmental impacts, as it often forces customers to invest in polluting and expensive diesel‐generated back up power supplies.
Table 7. Advantages and disadvantages of various rationing strategies
Rationing strategy Advantages Disadvantages
Block load shedding Easy to implement Unpredictable, inefficient, unpopular
Consumption rationing via quotas or entitlements
Largely equitable; easy to explain and implement
Inefficient, potentially harmful to vulnerable groups
Market-based rationing (quota and trade) Efficient; sustainable; minimises economic impact of shortfalls
More difficult to implement; requires strong leadership and good technical capacity
Incentive/reward schemes (e.g. California’s 20/20 rebate programme)
Equitable; sustainable; encourages energy investment
More expensive in the short run
Source: Adapted from Heffner, 2009.
Consumption rationing has proven flexible and resilient in many electricity shortfall situations. In Japan, the government announced a consumption‐rationing scheme for the summer of 2011 and published electricity‐saving targets4 of 15% for most sectors. A smaller target reduction rate of 5% to 10% was requested of certain vulnerable end‐users such as hospitals, nursing homes, public transport and sewage and water utilities. For industry consuming more than 500 kW, the government implemented Article 27 of the Electricity Business Act, which authorises the government to restrict electricity use. The government is requiring this sector to cut electricity consumption by 15% compared with the same period last year (1 July‐22 September) between 9:00 and 20:00 or face penalties of up to JPY 1 million (approximately USD 12,500) for each hour in which the target is not met.
In 2001, Brazil implemented a “quota system”, which obliged each class of customer to reduce year‐on‐year monthly consumption relative to a baseline. Customers were subject to penalties for multiple months of non‐compliance. Different customer classes were given different baselines, and the smallest residential customers were excluded altogether. This quota system, together with other demand‐side tools, produced a 20% reduction in electricity consumption over a nine‐month period (Maurer, Pereira and Rosenblatt, 2005).
4 Officials had initially announced an energy‐savings target of 25% for industry. This number was revised as TEPCO estimated it could increase supply capacity by 53.8 GW by the end of July, necessitating electricity savings of 10.3%.
© OECD/IEA 2011 Saving Electricity in a Hurry: Update 2011
Page | 25
Market mechanisms
Market mechanisms can be combined with other demand‐side tools to lower costs, improve effectiveness and reduce economic impacts of electricity shortfall management. For example, a consumption‐rationing scheme can be supplemented and improved by providing the means for bilateral trading or secondary markets for buying and selling power entitlements.5 Such market mechanisms allow large energy users to exercise their relative preferences for power entitlements. Trading among large energy users willing to pay more for or be compensated for using less than the rationed amount of electricity is a much more economically efficient solution than applying a fixed baseline to all customers. This market‐based supplement to the Brazilian quota system has been credited with reducing the impact on GDP of consumption rationing by as much as two‐thirds, from 2.4% to 0.8% (Heffner, 2009).
The 20/20 rebate programme used during the 2001 California power crisis is another example of a market mechanism. This simple and ingenious market mechanism provided a 20% reduction on the unit electricity price for any customer who reduced their year‐on‐year monthly summer electricity usage by 20% or more. The programme was unique both in its simplicity and in the fact that participation was automatic and available to all customer classes. Overall, almost one‐third of all customers received a rebate in at least one month, and many more customers were motivated to reduce their consumption. Analysis suggests that the rebate programme accounted for as much as one‐third of the total energy savings achieved in California, at a cost of about one‐third of the wholesale electricity price over the period (Goldman, Eto and Barbose, 2002).
5 Under bilateral trading, one energy user can purchase part or all of the power entitlement of another energy user. An organised secondary market makes it possible for multiple energy users to buy and sell power entitlements.
Saving Electricity in a Hurry: Update 2011 © OECD/IEA 2011
Page | 26
Other Considerations in Electricity Shortfall Emergency Management The case studies described in this report offer additional insights into best practice for formulating and implementing emergency energy‐saving programmes.
Don't kill the messenger
Electricity shortfalls can bring economic hardship and require sacrifices from consumers. One result may be political disputes within civil society or between stakeholders, government, and utilities regarding the cause of or remedies for the shortfall. Such disputes or finger‐pointing creates hostility, delays decision‐making and decreases motivation to save energy as a community or national responsibility. For these reasons assigning a neutral, non‐political group to lead energy‐saving campaigns may be an effective alternative to government‐ or utility‐led efforts.
In Alaska, the Juneau Economic Development Council (JEDC) organised the campaign to save electricity. This neutral group took the leadership role in order to diffuse the politically sensitive situation and allow the privately owned utility to keep a low profile and focus on repairing the transmission line. JEDC assembled a group of city leaders, including merchants, church elders, non‐profits, politicians and school representatives to establish a single voice and message. Successful reduction in energy consumption in Alaska is credited, in part, to the positive and upbeat message of the resulting “Juneau Unplugged” media campaign that portrayed conserving electricity as part of being a good citizen.
Keep the population informed ... the end is in sight
Consumers may be more willing to conserve energy if they know the shortfall is short term. In Juneau, the utility offered daily updates on progress with transmission‐line repairs through a website with photos showing the new towers airlifted into place and installed. These updates showed the community that the utility was doing its part to end the shortfall, and demonstrated that the end of the crisis was in sight.
Case studies also demonstrate the value of communicating quantitative, non‐price signals during a media campaign. In a country facing energy constraints because of a drought, such as Chile or New Zealand, information on the reservoir levels each day or the remaining number of days of electricity supply can be effective.
In countries facing capacity constraints, requests to decrease energy consumption at certain times of day – or face a blackout – can also be effective. South Africa implemented an innovative Power Alert message system to provide real‐time information on the shortfall and recommend specific measures that should be immediately taken. This message is broadcast on the television through main channels at 30‐minute intervals on weekdays between 17h30 and 20h30 and on the internet. The message aims to inform the public of measures that can be taken to reduce the capacity constraint. According to the South African utility Eskom, the average impact per message is a decrease in over 500 MW for brownout alerts (high strain on the system) and a little less than 100 MW for green alerts (low strain).
Short‐term crises can lead to long‐term savings
The case studies demonstrate that long‐term savings are possible from behaviour change, installation of more efficient technologies and from greater political attention to energy efficiency and conservation.
© OECD/IEA 2011 Saving Electricity in a Hurry: Update 2011
Page | 27
In Juneau, Alaska, after the transmission line was repaired and the mayor declared an end to the emergency, electricity consumption quickly rebounded, but not to original levels. A 10% reduction remained between the pre‐ and post‐shortfall consumption levels. Although some savings were a result of installation of more efficient technologies (like CFLs), Juneau’s isolated residents did not have easy access to many other efficient‐technologies. Much of the persistent savings resulted from changes in operations and behaviours, e.g. lower temperatures in water heater storage tanks and adoption of energy‐saving habits.
A recent survey conducted in Juneau identifies which energy‐saving habits have persisted. Many residents continue to reduce heating in unused rooms; however, half of the residents surveyed no longer unplug their appliances between use or line‐dry their clothes.
In some electricity shortfall situations, long‐term decreases in energy use reflect an economic down‐turn caused by the crisis.
After the 2008 New Zealand crisis ended, residential electricity demand remained subdued. This is likely due to the economic crisis. Although the shortfall did not lead to long‐term savings from behaviour change, it did make the electricity market and energy efficiency a political priority. The government has since strengthened the national programme for subsidising household insulation and efficient space heating, policies that will lead to long‐term savings.
In Chile, after the electricity shortfall ended, electricity use remained flat, even as the economy grew by 3.2%. In years leading up to the crisis, growth in electricity use in Chile typically exceeded GDP growth. For example, from 1990‐2003, Chile experienced an average annual growth in GDP of 5.8%. Electric power consumption during this period increased on average 8.2%.
Experiencing multiple shortfalls may lead to faster reductions ... or crisis fatigue
The case studies provide diverse conclusions about whether multiple electricity shortfalls in one country lead to faster energy savings or crisis fatigue. Electricity shortfalls that led to higher energy prices, however, did seem to lead to more energy savings.
In Juneau, Alaska, a second avalanche cut the transmission line in January 2009. Consumption fell 10% almost immediately thanks to a “been there, done that” attitude (Golden, 2009). Although the immediate savings were great, the overall energy savings were not as high as in 2008 for three reasons. The interruption occurred during the coldest month of the year and people needed electricity to heat their homes. As only one tower was damaged, the interruption was much briefer. The cost of diesel‐generated electricity was lower than in 2008.
In Chile, earlier shortfalls (1998‐99) led to important changes in regulation and to the establishment of the National Energy Efficiency Programme to promote energy efficiency and conservation. When the 2008 shortfall hit, prices increased and energy‐saving campaigns were launched. Studies conducted on energy‐saving potentials in the years leading up to the shortfall made officials more prepared to act.
New Zealand experienced several energy crises (1992, 2001 and 2003) in the years leading up to the 2008 electricity shortfall. Although energy‐saving campaigns in 2008 led to reduced consumption in the residential sector, the reduction was less than during previous crises. There is a danger that asking consumers too often to save energy, especially in a highly political context, can lead to consumer backlash or indifference. Market signals and financial incentives may be needed if consumers are to play a regular role in shortfall management.
Saving Electricity in a Hurry: Update 2011 © OECD/IEA 2011
Page | 28
The threat of higher prices may be as effective as actual price increases
In Juneau, Alaska, the price signal was initially communicated through media and word of mouth rather than through a higher electricity bill. In fact, regulatory authorities did not allow the utility to charge higher electricity rates until a few weeks before the transmission line was restored. This meant that residents saw higher electricity bills only just before the crisis ended. Despite this, Juneau's electricity consumption fell more than 40% in less than six weeks. Although some of this decrease can be attributed to warmer days as spring progressed, compared to the same period during the previous year, the savings were still between 25% and 30%.
Several conclusions can be made. One is that the threat of higher prices may be as effective for conserving energy as actual higher prices. Moreover, people are driven to conserve energy not only because of price increases; they want to be good citizens, conserving energy to help their community mitigate a crisis. As Juneau is a small, isolated community, this good citizen motivation may be stronger than in other communities.
New Zealand households, in contrast, have fixed‐price variable volume contracts that do not register increasing wholesale price signals during a drought. During the 2008 electricity shortfall, some electricity companies tried to reinforce voluntary power savings with financial contributions to “local causes” for achieving certain energy‐saving targets. These programmes did not lead to significantly greater savings than campaigns without community incentives (Blackwell, 2009).
Technology is a crucial part of any demand‐side management strategy
The case studies underscore the need for demand‐side tools that contribute to increased efficiency and flexibility within the power sector. Replacing older, inefficient technology (e.g. appliances, lighting, buildings) is crucial to a sustainable power‐sector development strategy. Rapid deployment of certain high‐impact efficient technologies, such as LEDs and CFLs, can be a linchpin of electricity shortfall crisis management.
In fact, bulk CFL programmes have proven the most effective demand‐side strategy in helping developing economies remedy power shortfalls. World Bank studies have found large‐scale deployment of CFLs for households and small businesses can be quickly implemented to alleviate capacity and energy constraints. CFLs are particularly effective at alleviating peak‐power capacity constraints, as household lighting hours often correspond with electricity peak demand (Heffner, 2009).
CFL replacement programmes provide other benefits, including lower customer bills and avoidance of costly peaking generation. The average cost of a CFL can be 1/20th of the cost of adding diesel generation capacity. Finally, programmes to install CFLs decrease greenhouse‐gas emissions and are often eligible for carbon finance (Limaye, Sarkar and Singh, 2009).
To be successful, a bulk CFL programme must deliver the bulbs into the hands of the consumers and ensure that incandescent bulbs in current use are removed from circulation. Programme implementers need to identify marketing, distribution and delivery channels. Distribution can be handled through a variety of channels, including through utilities and non‐profit or non‐governmental organisations. A demand‐side management team within the procuring entity can help ensure consumer awareness, monitor programme progress, conduct impact evaluation, process carbon‐financing opportunities, and implement monitoring and quality control protocols (Limaye, Sarkar and Singh, 2009).
© OECD/IEA 2011 Saving Electricity in a Hurry: Update 2011
Page | 29
Customer feedback systems
Customer feedback systems such as smart metering can be a useful emergency demand‐response tool because they allow for detailed, time‐differentiated monitoring of consumption. Customer feedback systems offer several benefits, including better understanding of consumer behaviour, the ability to deliver dynamic pricing and a platform for offering demand‐response services.
Most electricity end‐use consumers do not know when they use electricity and what contributes to the price they pay. Customer feedback systems could change this by providing continuous and detailed feedback that makes energy use more visible and amenable to understanding and control by end‐users (IEA, 2010b). Smart customer pilot projects have shown that time‐differentiated pricing can reduce peak demands by an average of 15%. This research reveals a relationship between information and consumer behaviour; i.e. more detailed and more frequent information yielded greater efficiency improvements.
For years, utilities have offered load limiters and load‐control switches to turn off technologies such as air conditioners and water heaters when load needs to be managed. Smart meters could be used to shut down certain pre‐selected appliances (such as washing machines or dish washers) in a crisis situation.
Saving Electricity in a Hurry: Update 2011 © OECD/IEA 2011
Page | 30
Conclusions and Recommendations No country is immune to electricity shortfalls: they can occur anytime and be caused by many factors. However, the economic and social impacts of such shortfalls can be minimised by implementing carefully planned emergency energy-saving programmes. The IEA recommends that governments lay the foundational work for emergency energy-saving strategies well before a crisis arises, and in doing so consider the following questions:
• What kinds of electricity shortfalls are most likely given country context?
Governments should consider the possible causes and effects of electricity shortfalls as part of emergency planning for the energy sector. Electricity-shortfall planning is particularly important if a country is highly reliant on power sources whose availability may be affected by weather conditions (e.g., New Zealand, Chile) or fuel imports (Chile). Governments should consider plausible scenarios for the scope and duration of electricity shortfalls, and develop contingency plans to manage electricity demand until the crisis ends.
If, for example, power plants are located on fault lines or tsunami-prone areas (Japan), transmission lines run through avalanche zones (Alaska) or demand growth exceeds supply investments (South Africa), leaders should consider scenarios in which capacity constraints lead to electricity shortfalls during peak electricity-demand hours. In these situations, measures should aim to cut electricity demand during specific times of the day.
• How and when is energy used, and where are emergency energy savings possible?
Understanding end-user demand is critical to identifying opportunities for emergency energy savings. Systematic collection of indicators and compilation of demand curves by sector and subsector can inform long-term energy policy and expedite action in crisis situations (Chile). Having a detailed understanding of customer and end-use load curves and the potential of energy-saving measures can avoid delays in selecting and implementing effective emergency energy-saving programmes (Japan).
Data on electricity use is especially helpful when preparing contingency rationing schemes. In the event of a crisis, these rationing schemes can be quickly tailored to reflect the duration and severity of the electricity shortfall.
• Which measures can lead to the most energy savings in the shortest time and at the lowest cost?
Once officials have a good grasp of how electricity is used – by whom, for what and when – specific energy-saving measures can be identified. In a country with heavy industry facing capacity peak-hour constraints, shifting industrial processes to the evening and weekends can be effective (Japan, South Africa). In a country with high residential electricity consumption, asking residents to change practices by taking shorter showers, line-drying their clothes, turning off lights in rooms not in use can, etc. can lead to large energy savings (Alaska, New Zealand). Some measures can produce results almost overnight, while other measures may take weeks or months. Some measures, such as block-load shedding, should be avoided except as a last resort (Japan, South Africa).
• Which combinations of emergency energy-saving tools (price signals, information campaigns, technology replacement, rationing, and market mechanisms) are effective?
Not all tools are quickly available in every country. Governments should take into account country context (institutional frameworks and technical and human capacity), to ensure energy-

© OECD/IEA 2011 Saving Electricity in a Hurry: Update 2011
Page | 31
saving measures are implemented. For example, regulations or lack of metering infrastructure may prevent tariff increases or dynamic pricing in certain sectors (Alaska, Japan, New Zealand, Chile and South Africa). A highly efficient lighting, appliance and equipment stock may limit energy savings possible through technology replacement campaigns (Japan), as can a lack of access to more energy‐efficient products (Alaska).
If officials identify these limitations in advance, they can develop contingency regulations that will be enforced only in the event of an electricity shortfall. Japan, for example, created Article 27 of the Electricity Business Act before the 2011 shortfall, thereby authorising the government in crisis situations to limit electricity use in large industry (more than 500 kW).
Who will be tasked with managing the emergency energy‐saving campaign? Which stakeholders will provide support to the lead, and how?
Case studies reveal many different models for entities tasked with planning, implementing and overseeing emergency energy‐saving campaigns. Entities with some independence from government and energy utilities appear to be effective as long as they enjoy a strong mandate, capacity and support from government and key stakeholders (Alaska).
Prior to an electricity shortfall, officials should consider the form and duties of such entities, and consult eventual participants about their roles and responsibilities. This will help the emergency‐management team hit the ground running in the event of a crisis.
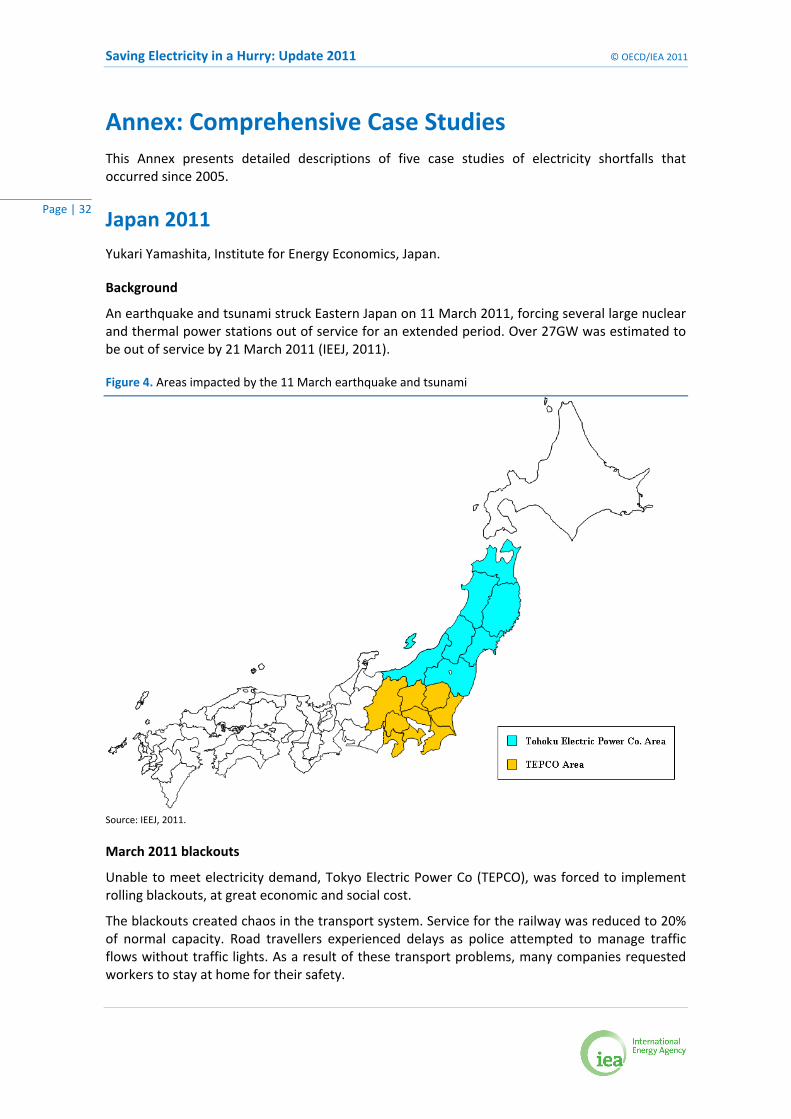
Saving Electricity in a Hurry: Update 2011 © OECD/IEA 2011
Page | 32
Annex: Comprehensive Case Studies This Annex presents detailed descriptions of five case studies of electricity shortfalls that occurred since 2005.
Japan 2011
Yukari Yamashita, Institute for Energy Economics, Japan.
Background
An earthquake and tsunami struck Eastern Japan on 11 March 2011, forcing several large nuclear and thermal power stations out of service for an extended period. Over 27GW was estimated to be out of service by 21 March 2011 (IEEJ, 2011).
Figure 4. Areas impacted by the 11 March earthquake and tsunami
Source: IEEJ, 2011.
March 2011 blackouts
Unable to meet electricity demand, Tokyo Electric Power Co (TEPCO), was forced to implement rolling blackouts, at great economic and social cost.
The blackouts created chaos in the transport system. Service for the railway was reduced to 20% of normal capacity. Road travellers experienced delays as police attempted to manage traffic flows without traffic lights. As a result of these transport problems, many companies requested workers to stay at home for their safety.

© OECD/IEA 2011 Saving Electricity in a Hurry: Update 2011
Page | 33
The blackouts also presented challenges to hospital and in‐home care patients. These vulnerable groups were initially not exempted from blackouts and lost power to medical equipment.
Although the energy utility attempted to put in place a schedule for the blackouts, the blackouts rarely occurred at designated hours or for predictable lengths of time – further creating uncertainty for industry, commercial and residential activity.
Fortunately, improved weather in April 2011, and the return of thermal plants to service, allowed a cessation in rolling blackouts.
Although the economic and social impacts of the blackouts have not yet been estimated, there is consensus in Japan that further rolling blackouts should be avoided at all cost.
Summer electricity‐saving strategy
Determined to avoid future blackouts, the government decided to implement an energy‐saving strategy before the summer peak‐demand months caused demand to once again surpass electricity supply.
On 13 March 2011 the government established the Electricity Supply‐Demand Emergency Response Headquarters to lead the emergency energy‐saving effort. This Headquarters coordinates the participation of several ministries, including the Agency for Natural Resources and Energy (ANRE/METI), and is led by the Chief Cabinet Secretary.
Officials faced an early challenge; no sector‐specific load curves were made available by the energy utility. It was thus unclear how much and in which sectors electricity savings were needed and could be made to avoid blackouts. To address this problem, the government convened a group of researchers, officials and TEPCO staff to estimate load curves, predict energy‐saving potential for each sector and develop specific recommendations for saving electricity.
Figure 5. Estimated hourly load curve on summer peak day (all sectors)
Source: ANRE/METI, 20116.
6 Provisional translation by IEEJ.
0
1000
2000
3000
4000
5000
6000
7000
0 1 2 3 4 5 6 7 8 9 10 11 12 13 14 15 16 17 18 19 20 21 22 23
家庭 大口業務
小口業務 大口産業
小口産業
(万
kW
)
Residential:18GW
Commercial:25GW
Industry:17GW
At 14:00hrs: 60 GW
Residential
Large Commercial
Small Commercial
Large Industries
Small Industries
(kw
)

Saving Electricity in a Hurry: Update 2011 © OECD/IEA 2011
Page | 34
Estimations were made for eight commercial subsectors, including office buildings, wholesale and retail, supermarkets, hospitals/clinics, hotels, restaurants, schools, and manufacturing factories. Estimations were also made for the residential sector using assumptions about occupancy, appliance diffusion and usage.
Figure 6. Estimated hourly electricity demand for all households, by appliance
Source: ANRE/METI, 20117.
In May, the government announced its summer electricity‐saving strategy and published revised electricity‐saving targets8 of 15% for most sectors. A target reduction rate of 5‐10% was proposed for certain end‐users such as hospitals, nursing homes, public transport and sewage and water utilities.
Based on the estimated load curves, targeted recommendations were made for each sector. Before announcing these recommendations, officials ensured that the recommendations would not jeopardise safety or break environmental regulations. Some noise and vibration regulations were “relaxed” during summer months to allow companies to shift operations over night.
At the time this paper went to press in June 2011, the government’s energy‐saving strategy included the following elements: mandatory rationing by large industry, information campaigns and technical energy‐saving assistance.
For industry consuming more than 500 kW, the government implemented Article 27 of the Electricity Business Act, which authorises the government to restrict electricity use. The government is requiring this sector to cut electricity consumption by 15% compared with the same period last year (1 July‐22 September) between 9‐20h or face penalties of up to 1 million yen (USD 12,500) for each hour when the target is not met.
7 Provisional translation by IEEJ. 8 Officials initially announced an energy‐savings target of 25% for industry. This number was revised as TEPCO estimated it could increase supply capacity by 53.8GW by the end of July, necessitating electricity savings of 10.3%.
0
500
1000
1500
2000
2500
3000
0 2 4 6 8 10 12 14 16 18 20 22 24
送電ロス
その他
待機電力
温水便座
パソコン
照明
テレビ
冷蔵庫
エアコン
Transmission Losses
Others
Standby Power
Toilet Seat Heater/Shower
PC
Lighting
TV
Refrigerator
A/C

© OECD/IEA 2011 Saving Electricity in a Hurry: Update 2011
Page | 35
Many large industries, and even medium and small enterprises (SMEs), have signalled their intention to achieve energy‐saving targets by shifting the work week and hours of operation. Other measures include telecommuting, the transfer of business operations to unaffected areas and longer summer holidays.
Figure 7. Residential sector energy‐saving recommendations
Source: ANRE/METI, 20119.
9 Provisional translation by IEEJ.
% WSave power by more than 15% (sum of power reductions)
Unplug unused appliances. 2% 25W
※Numbers listed for power saving effect are estimated as reduced power consumption and their % changes from the average daytime power consumption of about 1200W at 14:00 when family member(s) is(are) at home (ANRE estimation).
Standby Power
Apply ④⑦⑧&⑩ measures even when you are away from home.
! Beware of heat stroke. Save power with flexibility and comfort.
⑨
Cook rice for the day and store it in the refrigerator rather than keeping it warm in the rice cooker.
Rice cooker/jar
2% 25W
Refrigerator
Lighting
T.V.
Toilet heater/warm shower
Switch off seat-heating & hot-water functions.
>1% 5W
Reduction by either one of the two
⑦
5% 60WTurn off lights during the day and reduce lighting in the evening.
Use energy savings mode, decrease brightness, and switch off when not in use.
2% 25W
⑤
⑥
2% 25W
Change the refrigerator temperature setting from powerful to medium, minimise opening doors and limit amount of food kept inside.
Turn off A/C and use electric fan. 50% 600W③
Household Power Saving Menu
Set room temperature at 28 .
Suggested Menu for Household Power Saving ActionsPower Saving Effect
10% 130WA/C
Check
Use “sudare” or “yoshizu” (Japanese shades made of rattan and reed) to decrease sun exposure. 10% 120W
①②
Reduction Rate
Power Reduction
Check the actions below and prepare measures of your household.
※When setting the temperature by 2℃.
※Avoid Dry mode operation and frequent switching on/off as they increase power usage.
④
※Change mode from “standard” to “energy saving “mode and reduce hours of watching by 1/3.
⑧
Refrigerator
Lighting

Saving Electricity in a Hurry: Update 2011 © OECD/IEA 2011
Page | 36
Information campaigns
A team of policy makers and a PR company, led by ANRE/METI, were tasked with preparing a multi‐dimensional energy‐saving information campaign. Elements included displaying electricity forecasts on peak‐power/supply‐demand balances on web sites, in major train stations and on television; promoting casual and cooler clothing through the Super Coolbiz campaign; publicising electricity‐saving tips; creating a power‐saving contest in the residential sector and offering rewards10 to residential and commercial customers for meeting energy‐saving targets.
Technical assistance
Local METI offices and business associations have arranged for certified electrical engineers to meet with SMEs with electricity contracts of less than 500 kW to offer advice on how to save energy. SMEs are also provided with tailored checklists of electricity‐saving actions and associated energy‐saving potentials.
Figure 8. Energy‐saving information kit for office buildings
Source: ANRE/METI, 2011.
Conclusions
At press time, several challenges still faced the Japanese summer electricity‐saving campaign. First, compared to many countries, energy efficiency in Japan is already quite good. Much of the low‐hanging energy savings available in other countries has already been captured in Japan. As a result, Japan will have to undertake deep energy‐efficiency and conservation measures.
10 At the time this publication went to press, the nature of the “rewards” had not yet been determined.
© OECD/IEA 2011 Saving Electricity in a Hurry: Update 2011
Page | 37
Second, absent regulatory measures, it is not clear to what extent SMEs and residential energy users will cut demand.
Third, every thirteen months, nuclear‐power plants undergo routine maintenance. To restart operations after maintenance, energy utilities must reach an agreement with the regional governor. Several governors have signalled their intention to prevent nuclear power plants from coming back on line, moves that would further deepen the electricity shortfall.
Lastly, many of the energy‐saving measures designed to reduce peak demand require shifting operations to the evenings and weekends. Such changes in schedule require union approval in many companies. They will also require considerations for childcare for working parents.
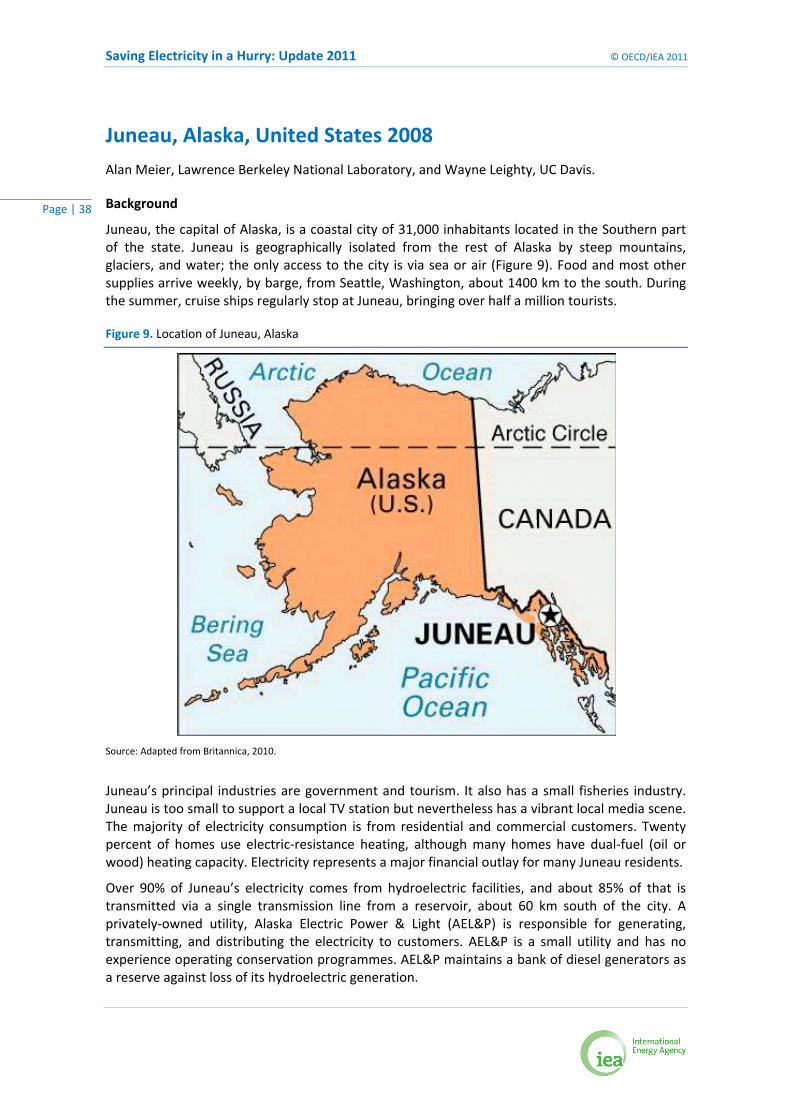
Saving Electricity in a Hurry: Update 2011 © OECD/IEA 2011
Page | 38
Juneau, Alaska, United States 2008
Alan Meier, Lawrence Berkeley National Laboratory, and Wayne Leighty, UC Davis.
Background
Juneau, the capital of Alaska, is a coastal city of 31,000 inhabitants located in the Southern part of the state. Juneau is geographically isolated from the rest of Alaska by steep mountains, glaciers, and water; the only access to the city is via sea or air (Figure 9). Food and most other supplies arrive weekly, by barge, from Seattle, Washington, about 1400 km to the south. During the summer, cruise ships regularly stop at Juneau, bringing over half a million tourists.
Figure 9. Location of Juneau, Alaska
Source: Adapted from Britannica, 2010.
Juneau’s principal industries are government and tourism. It also has a small fisheries industry. Juneau is too small to support a local TV station but nevertheless has a vibrant local media scene. The majority of electricity consumption is from residential and commercial customers. Twenty percent of homes use electric‐resistance heating, although many homes have dual‐fuel (oil or wood) heating capacity. Electricity represents a major financial outlay for many Juneau residents.
Over 90% of Juneau’s electricity comes from hydroelectric facilities, and about 85% of that is transmitted via a single transmission line from a reservoir, about 60 km south of the city. A privately‐owned utility, Alaska Electric Power & Light (AEL&P) is responsible for generating, transmitting, and distributing the electricity to customers. AEL&P is a small utility and has no experience operating conservation programmes. AEL&P maintains a bank of diesel generators as a reserve against loss of its hydroelectric generation.
© OECD/IEA 2011 Saving Electricity in a Hurry: Update 2011
Page | 39
On April 16, 2008 an avalanche severed the transmission line between the reservoir and Juneau. Repairs were expected to take at least three months. The diesel generators immediately switched on, and from that day, Juneau’s electricity was generated almost exclusively from diesel fuel. The timing was particularly unfortunate because the price of diesel was at record levels. The cost of a generating a kilowatt‐hour of electricity delivered to customers rose from about 11 cents/kWh—the normal level for the city’s hydropower‐‐to over 50 cents/kWh, almost a fivefold increase.
The utility immediately sought to pass the increased generation costs to its customers; however, political discussions initially delayed this. The city government recognised that many of its citizens could not afford the higher price and feared the impact on the city’s economy (Golden 2009). The city first tried to shift the costs to the state or federal government. This was at least partially justified because Alaska has traditionally subsidised fuel deliveries in villages. However, unlike Juneau, villages receiving this subsidy are remote and lack other, cheaper supplies, so most state politicians opposed a subsidy. The controversy was further complicated because of citizens’ anger towards the privately‐owned AEL&P.
In the meantime, the citizens acted to save electricity without any special plan or programme (Skinner 2008). They rushed to stores to buy energy‐saving equipment but quickly exhausted the stores’ supplies of insulation, compact fluorescent lamps (CFLs) and switchable power strips. Even lines for drying clothes were sold out. Knowing that their utility bills would soon rise fivefold, the citizens of Juneau lowered thermostat settings, switched to wood stoves, switched off lights and unplugged appliances. The Airport–the city of Juneau’s third largest end use–switched off runway lights from midnight to sunrise‐‐when the airport was closed anyway. Within a few days after the avalanche, electricity demand had fallen about 10%, although most of the reduction was a result of milder weather and increased sunlight. Still more savings would be needed to minimise the impact cost and the risk of blackouts (Yardley 2008).The technical opportunities for reducing electricity use through efficiency measures were limited, as supplies could be replenished only via the weekly barge from Seattle. Moreover, the technologies that could achieve larger electricity savings would take even longer to order, deliver, and install.
Juneau establishes a conservation plan
Juneau’s city government realised that the only way to avoid massive electricity bill increases was to use less electricity—much less electricity—immediately. The city began to search for strategies. They were especially concerned about the 40% of homes relying on electricity for space or water heating. There was no time to insulate homes, install alternative heating systems, or replace inefficient appliances. Moreover, many of these householders were too poor to afford such investments. Some citizens spoke little or no English, and were probably unaware of the avalanche, and thus unable to anticipate the coming hike in electricity prices.
The city was also concerned about its own electricity bill since it had not budgeted for this unexpected spike in electricity prices. Juneau requested the U.S. Department of Energy (DOE) to send the city an expert to advise them on emergency‐conservation programmes.11
The Juneau Economic Development Council (JEDC) took the lead in organising the campaign to save electricity. Because the situation was so politically charged, it was important for a neutral group to take a leadership role. For the same reason, the utility needed to keep a low profile. The JEDC assembled city leaders, including merchants, heads of non‐profit welfare groups, church elders,
11 The expert, Alan Meier, arrived several days after DOE received the request.
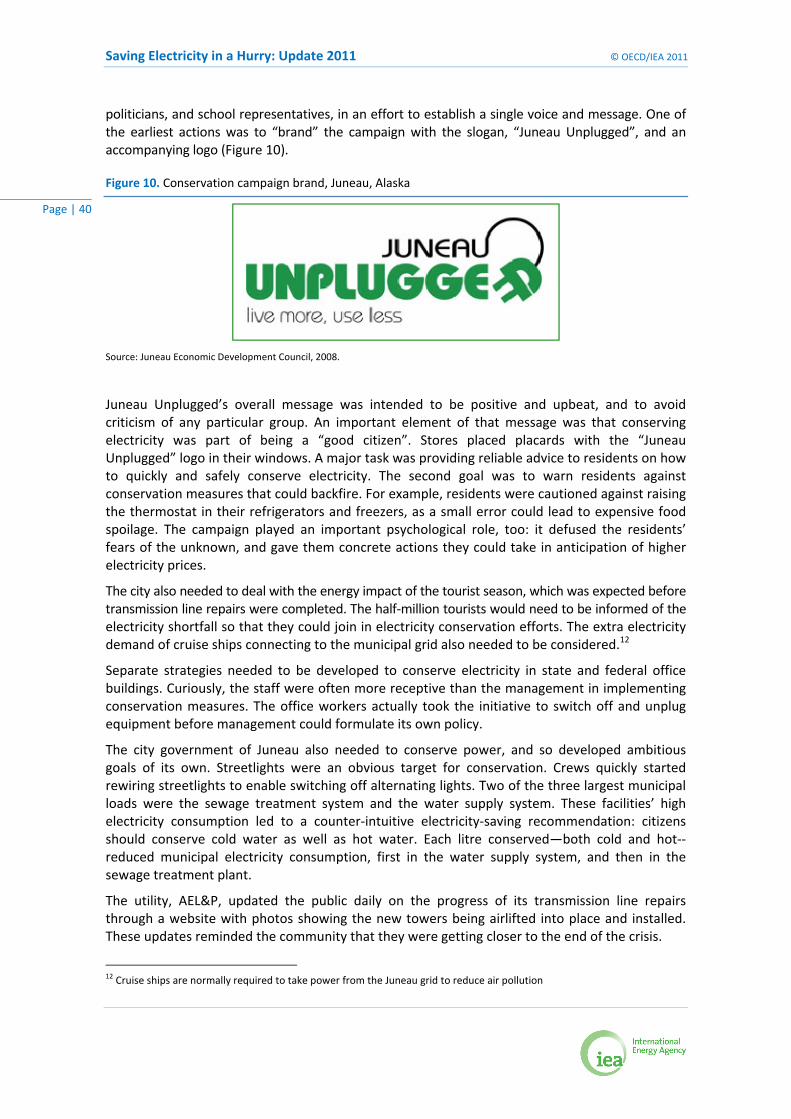
Saving Electricity in a Hurry: Update 2011 © OECD/IEA 2011
Page | 40
politicians, and school representatives, in an effort to establish a single voice and message. One of the earliest actions was to “brand” the campaign with the slogan, “Juneau Unplugged”, and an accompanying logo (Figure 10).
Figure 10. Conservation campaign brand, Juneau, Alaska
Source: Juneau Economic Development Council, 2008.
Juneau Unplugged’s overall message was intended to be positive and upbeat, and to avoid criticism of any particular group. An important element of that message was that conserving electricity was part of being a “good citizen”. Stores placed placards with the “Juneau Unplugged” logo in their windows. A major task was providing reliable advice to residents on how to quickly and safely conserve electricity. The second goal was to warn residents against conservation measures that could backfire. For example, residents were cautioned against raising the thermostat in their refrigerators and freezers, as a small error could lead to expensive food spoilage. The campaign played an important psychological role, too: it defused the residents’ fears of the unknown, and gave them concrete actions they could take in anticipation of higher electricity prices.
The city also needed to deal with the energy impact of the tourist season, which was expected before transmission line repairs were completed. The half‐million tourists would need to be informed of the electricity shortfall so that they could join in electricity conservation efforts. The extra electricity demand of cruise ships connecting to the municipal grid also needed to be considered.12
Separate strategies needed to be developed to conserve electricity in state and federal office buildings. Curiously, the staff were often more receptive than the management in implementing conservation measures. The office workers actually took the initiative to switch off and unplug equipment before management could formulate its own policy.
The city government of Juneau also needed to conserve power, and so developed ambitious goals of its own. Streetlights were an obvious target for conservation. Crews quickly started rewiring streetlights to enable switching off alternating lights. Two of the three largest municipal loads were the sewage treatment system and the water supply system. These facilities’ high electricity consumption led to a counter‐intuitive electricity‐saving recommendation: citizens should conserve cold water as well as hot water. Each litre conserved—both cold and hot‐‐reduced municipal electricity consumption, first in the water supply system, and then in the sewage treatment plant.
The utility, AEL&P, updated the public daily on the progress of its transmission line repairs through a website with photos showing the new towers being airlifted into place and installed. These updates reminded the community that they were getting closer to the end of the crisis.
12 Cruise ships are normally required to take power from the Juneau grid to reduce air pollution
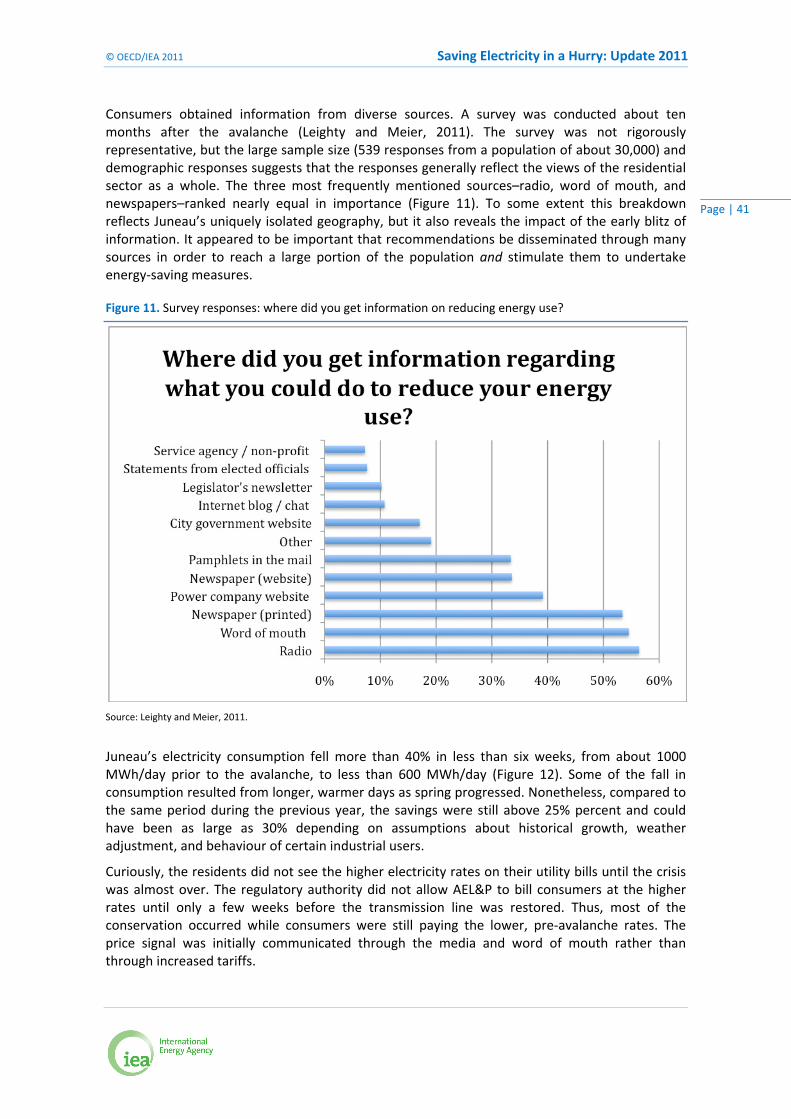
© OECD/IEA 2011 Saving Electricity in a Hurry: Update 2011
Page | 41
Consumers obtained information from diverse sources. A survey was conducted about ten months after the avalanche (Leighty and Meier, 2011). The survey was not rigorously representative, but the large sample size (539 responses from a population of about 30,000) and demographic responses suggests that the responses generally reflect the views of the residential sector as a whole. The three most frequently mentioned sources–radio, word of mouth, and newspapers–ranked nearly equal in importance (Figure 11). To some extent this breakdown reflects Juneau’s uniquely isolated geography, but it also reveals the impact of the early blitz of information. It appeared to be important that recommendations be disseminated through many sources in order to reach a large portion of the population and stimulate them to undertake energy‐saving measures.
Figure 11. Survey responses: where did you get information on reducing energy use?
Source: Leighty and Meier, 2011.
Juneau’s electricity consumption fell more than 40% in less than six weeks, from about 1000 MWh/day prior to the avalanche, to less than 600 MWh/day (Figure 12). Some of the fall in consumption resulted from longer, warmer days as spring progressed. Nonetheless, compared to the same period during the previous year, the savings were still above 25% percent and could have been as large as 30% depending on assumptions about historical growth, weather adjustment, and behaviour of certain industrial users.
Curiously, the residents did not see the higher electricity rates on their utility bills until the crisis was almost over. The regulatory authority did not allow AEL&P to bill consumers at the higher rates until only a few weeks before the transmission line was restored. Thus, most of the conservation occurred while consumers were still paying the lower, pre‐avalanche rates. The price signal was initially communicated through the media and word of mouth rather than through increased tariffs.
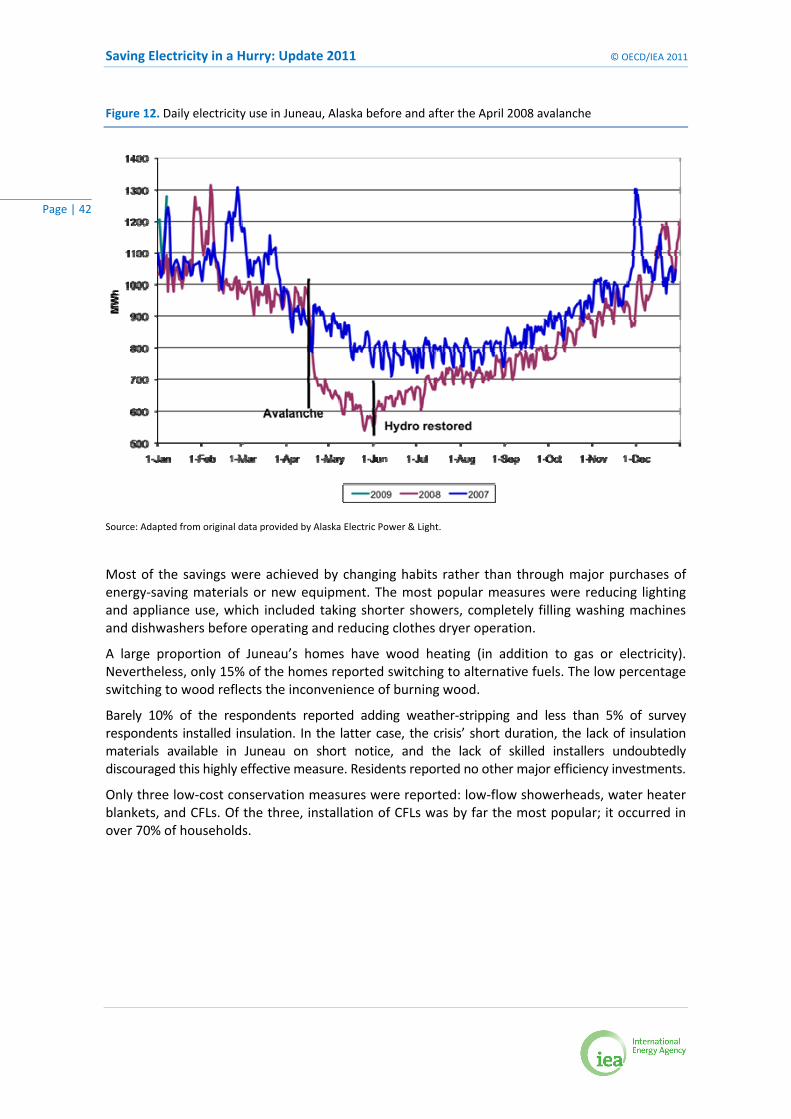
Saving Electricity in a Hurry: Update 2011 © OECD/IEA 2011
Page | 42
Figure 12. Daily electricity use in Juneau, Alaska before and after the April 2008 avalanche
Source: Adapted from original data provided by Alaska Electric Power & Light.
Most of the savings were achieved by changing habits rather than through major purchases of energy‐saving materials or new equipment. The most popular measures were reducing lighting and appliance use, which included taking shorter showers, completely filling washing machines and dishwashers before operating and reducing clothes dryer operation.
A large proportion of Juneau’s homes have wood heating (in addition to gas or electricity). Nevertheless, only 15% of the homes reported switching to alternative fuels. The low percentage switching to wood reflects the inconvenience of burning wood.
Barely 10% of the respondents reported adding weather‐stripping and less than 5% of survey respondents installed insulation. In the latter case, the crisis’ short duration, the lack of insulation materials available in Juneau on short notice, and the lack of skilled installers undoubtedly discouraged this highly effective measure. Residents reported no other major efficiency investments.
Only three low‐cost conservation measures were reported: low‐flow showerheads, water heater blankets, and CFLs. Of the three, installation of CFLs was by far the most popular; it occurred in over 70% of households.
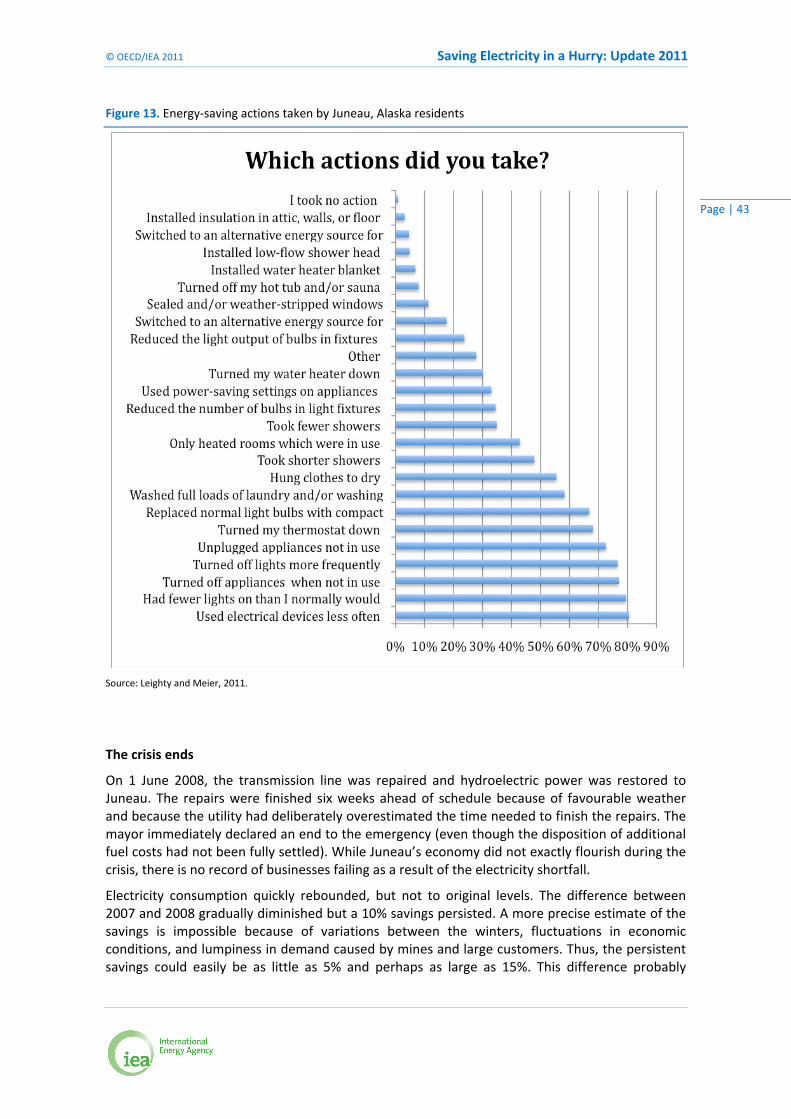
© OECD/IEA 2011 Saving Electricity in a Hurry: Update 2011
Page | 43
Figure 13. Energy‐saving actions taken by Juneau, Alaska residents
Source: Leighty and Meier, 2011.
The crisis ends
On 1 June 2008, the transmission line was repaired and hydroelectric power was restored to Juneau. The repairs were finished six weeks ahead of schedule because of favourable weather and because the utility had deliberately overestimated the time needed to finish the repairs. The mayor immediately declared an end to the emergency (even though the disposition of additional fuel costs had not been fully settled). While Juneau’s economy did not exactly flourish during the crisis, there is no record of businesses failing as a result of the electricity shortfall.
Electricity consumption quickly rebounded, but not to original levels. The difference between 2007 and 2008 gradually diminished but a 10% savings persisted. A more precise estimate of the savings is impossible because of variations between the winters, fluctuations in economic conditions, and lumpiness in demand caused by mines and large customers. Thus, the persistent savings could easily be as little as 5% and perhaps as large as 15%. This difference probably
Saving Electricity in a Hurry: Update 2011 © OECD/IEA 2011
Page | 44
represents the savings accomplished through some technical efficiency improvements, notably CFLs, certain semi‐permanent changes in operation (such as lowering the temperatures in water heater storage tanks), and new, energy‐saving habits. Whatever the underlying causes, Juneau’s electricity demand underwent a permanent downward shift as a result of the avalanche.
The survey provides clues as to which energy‐saving habits persisted post‐crisis and which have not. For example, about half of the respondents abandoned line‐drying their clothes and have ceased unplugging appliances when not in use. But they continue to reduce heating of unused rooms.
The citizens of Juneau appeared to be proud of their accomplishment. Some were aware of Brazil’s electricity conservation campaign–the most successful programme to date–and felt special pleasure that they had surpassed Brazil’s record.
In January 2009, a second avalanche cut the transmission line. This time, consumption fell 10% almost immediately, amidst a “been there, done that” atmosphere (Golden, 2009). Circumstances were somewhat different: the interruption occurred during the coldest month, but as only two transmission towers were damaged, the interruption was expected to be much briefer. Additionally, the price of diesel had fallen dramatically, so the cost of the replacement electricity was not so high. The transmission line was repaired before further conservation measures could be put in place.
Conclusions
Juneau’s 25% reduction in electricity consumption was remarkably quick and effective for a shortfall management strategy that did not involve compulsory rationing or load shedding. A fivefold increase in electricity prices provided the stimulus but the savings were accomplished mostly through voluntary changes in behaviour. Adoption of energy‐saving habits was clearly responsible for most of the savings simply because new, efficient, technologies could not be installed soon enough. When compared to programmes using economic and regulatory instruments, programmes relying on changing consumers’ behaviour are relatively easy to establish, inexpensive, highly visible, and suitable for mass media (although consumers can return to original habits just as quickly). The city‐wide crisis made it socially acceptable–indeed patriotic–to wear warmer clothes, switch off lights, and modify lifestyles in ways that people would ordinarily resist. However, for savings to persist for a longer period, technology replacement must complement energy‐saving behaviour.
A year later, about one third of the crisis‐induced reduction in electricity use persisted, showing that at least some of the crisis‐borne behavioural change is durable. Addressing longer energy shortfalls and tackling climate change may require different strategies, but the results from Juneau show that large energy savings are feasible given the right combination of conditions, incentives, and strategies.
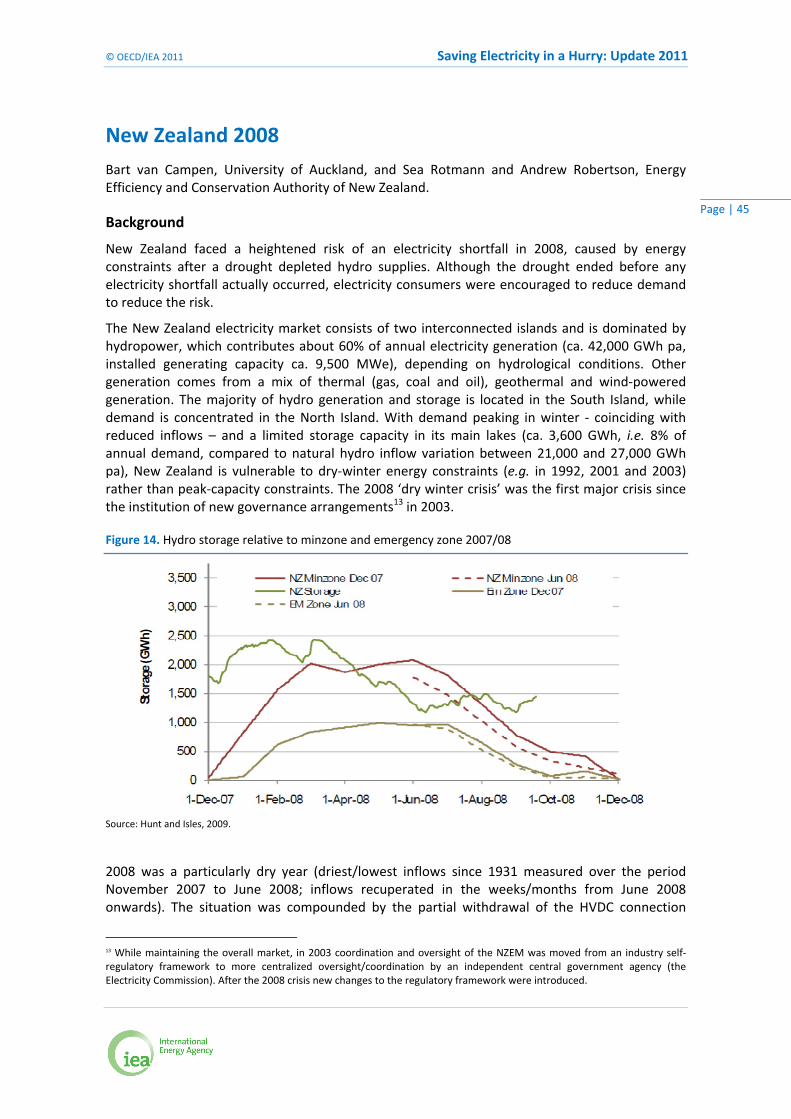
© OECD/IEA 2011 Saving Electricity in a Hurry: Update 2011
Page | 45
New Zealand 2008
Bart van Campen, University of Auckland, and Sea Rotmann and Andrew Robertson, Energy Efficiency and Conservation Authority of New Zealand.
Background
New Zealand faced a heightened risk of an electricity shortfall in 2008, caused by energy constraints after a drought depleted hydro supplies. Although the drought ended before any electricity shortfall actually occurred, electricity consumers were encouraged to reduce demand to reduce the risk.
The New Zealand electricity market consists of two interconnected islands and is dominated by hydropower, which contributes about 60% of annual electricity generation (ca. 42,000 GWh pa, installed generating capacity ca. 9,500 MWe), depending on hydrological conditions. Other generation comes from a mix of thermal (gas, coal and oil), geothermal and wind‐powered generation. The majority of hydro generation and storage is located in the South Island, while demand is concentrated in the North Island. With demand peaking in winter ‐ coinciding with reduced inflows – and a limited storage capacity in its main lakes (ca. 3,600 GWh, i.e. 8% of annual demand, compared to natural hydro inflow variation between 21,000 and 27,000 GWh pa), New Zealand is vulnerable to dry‐winter energy constraints (e.g. in 1992, 2001 and 2003) rather than peak‐capacity constraints. The 2008 ‘dry winter crisis’ was the first major crisis since the institution of new governance arrangements13 in 2003.
Figure 14. Hydro storage relative to minzone and emergency zone 2007/08
Source: Hunt and Isles, 2009.
2008 was a particularly dry year (driest/lowest inflows since 1931 measured over the period November 2007 to June 2008; inflows recuperated in the weeks/months from June 2008 onwards). The situation was compounded by the partial withdrawal of the HVDC connection
13 While maintaining the overall market, in 2003 coordination and oversight of the NZEM was moved from an industry self‐regulatory framework to more centralized oversight/coordination by an independent central government agency (the Electricity Commission). After the 2008 crisis new changes to the regulatory framework were introduced.
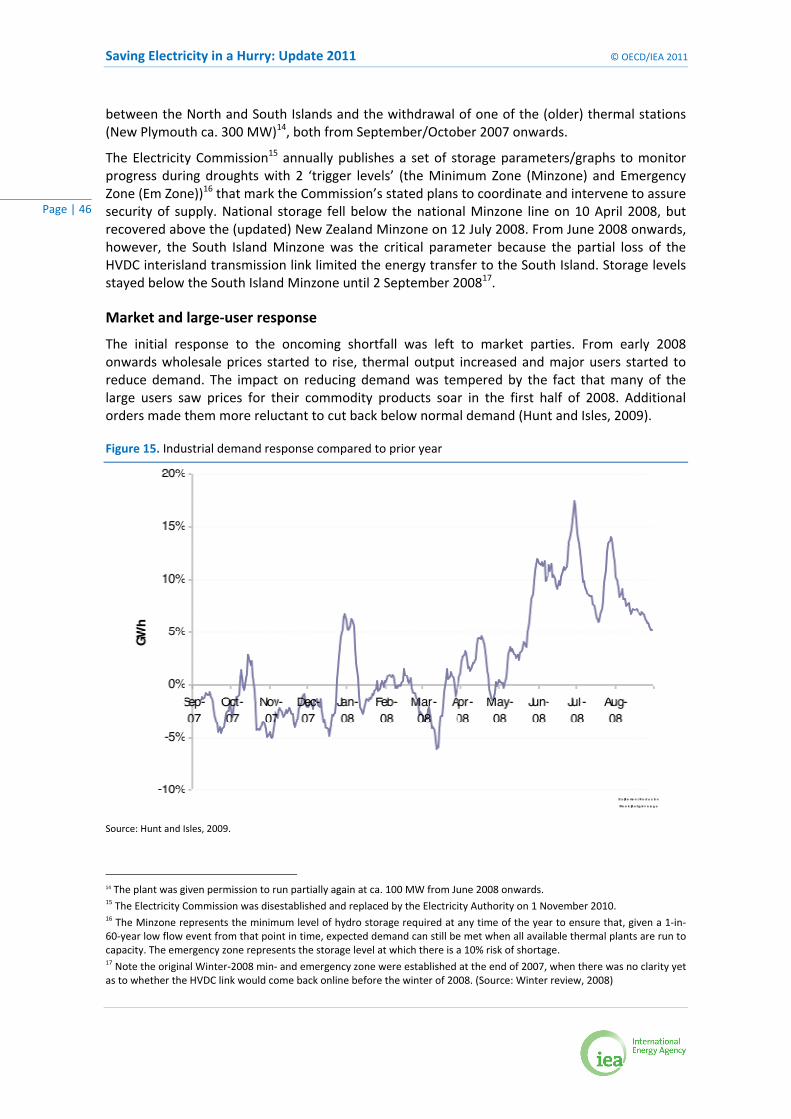
Saving Electricity in a Hurry: Update 2011 © OECD/IEA 2011
Page | 46
between the North and South Islands and the withdrawal of one of the (older) thermal stations (New Plymouth ca. 300 MW)14, both from September/October 2007 onwards.
The Electricity Commission15 annually publishes a set of storage parameters/graphs to monitor progress during droughts with 2 ‘trigger levels’ (the Minimum Zone (Minzone) and Emergency Zone (Em Zone))16 that mark the Commission’s stated plans to coordinate and intervene to assure security of supply. National storage fell below the national Minzone line on 10 April 2008, but recovered above the (updated) New Zealand Minzone on 12 July 2008. From June 2008 onwards, however, the South Island Minzone was the critical parameter because the partial loss of the HVDC interisland transmission link limited the energy transfer to the South Island. Storage levels stayed below the South Island Minzone until 2 September 200817.
Market and large‐user response
The initial response to the oncoming shortfall was left to market parties. From early 2008 onwards wholesale prices started to rise, thermal output increased and major users started to reduce demand. The impact on reducing demand was tempered by the fact that many of the large users saw prices for their commodity products soar in the first half of 2008. Additional orders made them more reluctant to cut back below normal demand (Hunt and Isles, 2009).
Figure 15. Industrial demand response compared to prior year
Source: Hunt and Isles, 2009.
14 The plant was given permission to run partially again at ca. 100 MW from June 2008 onwards. 15 The Electricity Commission was disestablished and replaced by the Electricity Authority on 1 November 2010. 16 The Minzone represents the minimum level of hydro storage required at any time of the year to ensure that, given a 1‐in‐60‐year low flow event from that point in time, expected demand can still be met when all available thermal plants are run to capacity. The emergency zone represents the storage level at which there is a 10% risk of shortage. 17 Note the original Winter‐2008 min‐ and emergency zone were established at the end of 2007, when there was no clarity yet as to whether the HVDC link would come back online before the winter of 2008. (Source: Winter review, 2008)
© OECD/IEA 2011 Saving Electricity in a Hurry: Update 2011
Page | 47
The Electricity Commission increased its monitoring of the hydro levels when they fell below the Minzone18 on 11 April 2008. The 155 MW diesel‐fired reserve generation plant (Whirinaki) was being dispatched most of the time from April to mid‐June (trigger nodal price NZ$200‐289/MWh).
In early June, storage levels started to approach the Emergency Zone, and the Electricity Commission began preparing other response options. It initiated discussions with network companies and the system operator about contingency arrangements, should load shedding be required. The Electricity Commission also started preparations to procure additional reserve energy19. Based on information provided by generator‐retailers, the Electricity Commission engaged in discussions with a small number of the largest electricity users about possible demand buyback agreements. The Electricity Commission also prepared a request for proposals (RFP) for further short‐term reserve energy resources, in the form of demand buybacks or emergency generation resources. In the end, no procurement of further reserve capacity was needed, as inflows recuperated and additional market measures were taken20.
Residential‐consumer response
Residential energy use is 33% of New Zealand’s annual electricity consumption (MED, 2008), but 52% of peak use during the winter season (Parliamentary Commissioner for the Environment, 2009, p.13). Widespread use of electricity for space heating makes the residential sector a promising target for energy‐saving efforts.
Following previous practice from 2001 and 2003, a mass media campaign organised by the electricity industry was launched at the height of the drought (15 June – 27 July 2008). The campaign comprised advertisements in newspapers, television, radio, public transport, websites etc. The industry also operated a website which included news, feedback on consumption data, regional comparisons of savings and information about hydro‐lake levels and inflows (www.powersavers.co.nz).
Several studies reveal decreased demand due to these measures. Temperature‐corrected national electricity savings in the residential and small commercial sectors were estimated at between 3.6% (Transpower, 2008, as quoted by Blackwell, 2009) and 6.9% (van Campen, 2010).
These results are of the same order as the savings reported for the 2001 and 2003 conservation campaigns. As winter residential electricity use is around 50% of national demand (Parliamentary Commissioner for the Environment, 2009) this is a significant contribution, although over a brief period.
Perhaps because of its brevity, the conservation campaign did not seem to have had a structural or persistent influence on demand. Measured savings are largely restricted to the period of the ‘official’ Savings Campaign. Blackwell (2009), drawing on surveys in 2008 and earlier ones in 2001, concludes that people responded mostly by turning off lights and fuel switching. Although data to unequivocally prove this are not yet available, households seem to have been switching part of their heating from electricity to alternative fuels such as wood or gas (NG or LPG) as 66% of New Zealand households have multiple sources to heat their houses (Statistics New Zealand). 18 Existing scenarios for Transpower and the Electricity Commission to monitor and prepare when Minzone is breached; emergency procedures (including potential rolling black‐outs) when emergency zone is breached. 19 On top of existing cutbacks by large industrials, mainly of parts of their electricity demand bought on the spot market instead of under contracts/hedges. 20 Other coordinated/market measures included: recommissioning of a New Plymouth unit (100 MW from June to August) with operators working in asbestos‐proof suits; advancement of the new Kawerau geothermal project (80MW from 21 July increasing to 106 MW from 1 August; and Ngawha geothermal project (15 MW from June).
Saving Electricity in a Hurry: Update 2011 © OECD/IEA 2011
Page | 48
Conclusions and lessons learned
Households are willing to voluntarily reduce electricity use when requested through mass media campaigns. Hydro electricity systems, especially with their gradual fall in water levels, lend themselves to well‐organised response strategies which capitalise on the experiences and lessons learned during previous campaigns. Strengths of the New Zealand electricity shortage strategy include:
Key players in the market (the regulator, generators, transmission, distribution, retailers and large users) all had response plans and strategies in place before the event;
A clear understanding of “when is this a problem”, the Minzone and Emergency zone definitions provided real clarity that all can understand;
A market which enabled rational responses from large users who have exposure to spot prices;
Robust published information which enabled robust decisions and published hydro reserve and output data which was clear for all to understand;
Strong co‐operation between the regulator, suppliers and users enabled industry led initiatives.
Ideally the actions should be managed jointly between the electricity industry and consumers, with financial incentives being used where necessary to constructively manage supply and demand responses. Maintaining some diversity in heating sources for households has also proven to be beneficial as a hedge against drought.
Following a review of the electricity market in 2009, the government noted that households can contribute significantly to electricity savings in dry year crises, but that uncompensated, ‘virtually free’, voluntary campaigns, though helpful, can provide a ‘moral hazard’ to the electricity market and, if called upon too frequently, can lead to consumer wariness or even resentment (ETAG, 2009). As a result, a default mechanism for compensating households in the case of future campaigns (default buy‐back for households) is being developed by the Electricity Authority. Electricity retailers should be able to develop options (e.g. residential variable price contracts) to pre‐empt the need for such default options in the case of (most) future droughts. As indicated by the Norwegian example of 2002/3, households exposed to variable pricing contracts can reduce their demand over a longer period and make significant contributions to balancing supply and demand in dry periods. As New Zealand is particularly vulnerable to brief dry spells due to its limited hydro storage, such increased residential demand response could very well complement supply options and industrial demand reductions, each of which might be faced with its own challenges during a crisis.
© OECD/IEA 2011 Saving Electricity in a Hurry: Update 2011
Page | 49
South Africa 2008/09
Luiz Maurer, World Bank, and Sara Bryan Pasquier, International Energy Agency.
Background
An acute electricity shortfall struck South Africa beginning in January 2008. This shortfall was brought on by delays in adding new generation supply, but was exacerbated by maintenance closures and plant failures caused by boiler tube leaks as well as unplanned generator outages resulting from poor‐quality coal supplies.
In the years leading up to the electricity crisis, South Africa experienced sustained economic growth, supported by reliable and sufficient electricity supply. With this economic growth, electricity consumption increased up to 60% from 1994‐2006. Unfortunately, investment in new electricity supply did not match the increase in demand.
The national South African electric utility, Eskom, along with the government (including the Department of Energy [DoE]21 and the National Electricity Regulator [NERSA]), immediately implemented a series of power rationing and other measures to prevent the electricity system from collapsing. Measures were initiated across the economy, but the industrial sector was a particular focus. The following is a list of steps taken, in order, by the South African system operator to maintain the integrity of the national electricity supply system (South African Government, 2008):
Run all available generation at maximum rating;
Demand market participation (pay customers to reduce load);
Bring gas plants into the system (expensive due to high cost of diesel);
Use emergency water resources;
Turn off electricity for customers with interruptible contracts;
Load shedding.
Energy‐saving measures
Industrial sector
In mid‐2008, Eskom sought to reduce 10% (or around 3,000 MW) of peak demand through a Power Conservation Programme (PCP). The PCP initially focused on large industrial users, which account for 58% of the countries’ electricity consumption (IEA, 2010c). In particular, the PCP identified mines and smelters as key areas for energy savings.
In January 2009, Eskom reported that demand was lower by 1,500 MW. The decrease is largely attributed to the reduced output of gold and platinum mines and metal smelters because of the PCP and the economic crisis. Eskom continued the PCP for large industrial customers in 2009 (Energy Tribune, 2009).
Eskom is now recommending that the country’s top 500 consumers sign up for a mandatory Energy Conservation Scheme (ECS). Under the ECS, a mandatory savings target of 10% (against a 2006 baseline) would be activated during acute electricity shortfalls. The proposed ECS would require participants to establish baselines and install monitoring and verification equipment. 21 DoE was formerly part of the Department of Minerals and Energy [DME]. Since 2009, DME has been divided into two ministries, the Department of Mineral Resources and DoE.

Saving Electricity in a Hurry: Update 2011 © OECD/IEA 2011
Page | 50
Residential sector
Behaviour change. The residential sector only accounts for 20% of electricity consumption (IEA, 2010c), but it can play a key role in managing peak demand. Peak demand is often a major problem in communities suffering from capacity shortfalls. In South Africa, consumers in the residential sector typically use more electricity during the early morning and the late afternoon than in any other time of the day (ESCOM, 2008). Energy‐saving tools were thus designed to target electricity savings during those peak hours.
Power Alert message is one tool implemented in South Africa to decrease peak‐electricity consumption. It provides real‐time information on the electricity shortfall and can be viewed on the internet or on television at 30‐minute intervals on weekdays between 17h30 and 20h30. The Power Alert message informs the public of immediate measures that can be taken to reduce the peak‐load crisis.
The Power Alert message includes the four following status levels, each calling for specific measures to be taken by consumers in all geographic areas:
Green: indicates limited strain on the system. The message requests consumers to save power as part of their everyday activities.
Orange: signals that demand on the system is increasing. The message prompts consumers to switch off some non‐essential power‐consuming appliances, including tumble dryers, dishwashers, pool pumps and unnecessary lights.
Red: shows strain on the system is increasing and that load shedding is imminent. Messages request consumers to switch off geysers, stoves, microwave ovens, kettles, heaters, air conditioning units and unnecessary lights.
Brown: indicates the most serious situation in which there is significant strain on the national grid and in which load shedding is being undertaken. Measures request consumers to switch off all unnecessary appliances, lighting and entertainment (such as tvs).
According to Eskom, the average impact per message is a decrease in over 500 MW for brownout alerts and a little less than 100 for green alerts (when there is only limited strain on the system).
Another information campaign targeting the residential and commercial sectors is the 49 million initiative, launched in March 2011 by Eskom, the government and business partners. This initiative seeks to encourage 49 million South Africans to embrace energy savings as part of their national identity and culture. The campaign mobilises businesses and media to disseminate key messages such as “switch it off”.
To spread energy‐saving messages in areas without televisions, South Africa implemented innovative information campaigns in the form of road shows and demonstration projects.
Technology replacement. In the residential sector, the government and Eskom are implementing programmes to provide residents with technologies for efficient lighting, solar water heating, installation of aerated shower heads and geyser blankets.
In 2004, for example, Eskom launched a national programme to replace incandescent globes with CFLs in some areas. To date, more than 18 million CFLs have been exchanged for incandescent globes. Four million CFLs were recently exchanged for incandescent globes in the Western Cape, Northern Province, Gauteng and Free State.
© OECD/IEA 2011 Saving Electricity in a Hurry: Update 2011
Page | 51
Saving electricity slowly
South Africa continues to suffer from capacity constraints that require solutions beyond the emergency demand‐side measures mentioned in this information paper. South Africa has developed an energy‐efficiency strategy which should result in not only more sustained energy savings but a reduction in the carbon intensity of the South African economy (South Africa is currently the 11th highest emitter of greenhouse gasses in the world).
Key elements of the South African energy efficiency strategy include:
Setting short‐, medium‐ and long‐term goals for energy efficiency that will support the country‘s economic growth.
Creating national awareness that electricity is a valuable commodity to be used wisely.
Promoting effective energy use through appropriate legislation aimed at:
Preventing the use of inefficient equipment.
Setting energy‐efficiency requirements for buildings.
Funding and establishing mechanisms for funding energy‐ efficiency projects.
Ensuring effective collaboration between Eskom and all electricity stakeholders, including the National Energy Efficiency Agency, the Department of Energy and the National Energy Regulator of South Africa.
Accelerating the evaluation, approval and implementation of energy‐efficiency projects.
Developing and implementing time of use (TOU) pricing for households.
Positioning Eskom and government as leaders in the energy efficiency process by:
o Identifying, implementing and tracking projects that contribute to an internal‐ efficiency drive.
o Implementing employee programmes to ensure energy efficiency at the workplace and household.
o Committing to energy efficiency improvements in government buildings.
Using the government ASGIS‐SA objectives to achieve advances in the industrial arena that provide the best short‐term benefits.
Ensuring that Eskom effectively manages its energy‐efficiency programmes (ESMAP, 2010).

Saving Electricity in a Hurry: Update 2011 © OECD/IEA 2011
Page | 52
Chile 2007/08
Bart van Campen, University of Auckland, and Sara Bryan Pasquier (International Energy Agency).
Background
In 2007/08, Chile experienced an electricity shortfall caused by a drought, interrupted gas imports from Argentina and technical problems.
The drought reduced hydroelectricity reserves by 38%. As a result, the share of electricity generated by hydro plants dropped from 70% in 2006 to 53% in 2007 (ESMAP, 2010). During the same period, gas imports from Argentina averaged only 9% of the contracted 25 million cubic meters per day. This resulted in the use of diesel, which increased maintenance costs and failure rates in several dual‐fuel power plants.
Figure 16 shows the primary Chilean long‐term storage facility, Lake Laja, has a storage capacity of over 6,000 GWh (other lakes total ca. 2,000 GWh). From 2007 onwards, lakes were drawn down because of the drought and increasing restrictions on imported Argentinean gas. Lakes did not refill to normal levels during the 2007‐08 summer, causing the 2008 energy shortfall.
Figure 16. Chilean long‐term storage facilities in the Central System
Source: CNE, 2009.
The 2007/08 crisis was not the first time Chile faced power shortfalls. An earlier drought led to reduced hydro‐power generation in 1998/99. The reduced hydro‐power generation led to outages and deficits during late 1998 and the first half of 1999 (Maurer, 2005). Chilean legislation gives the government the authority to put in place electricity rationing in the event of a shortfall.
0
1,000
2,000
3,000
4,000
5,000
6,000
7,000
Jan
-94
Jul-
94
Jan
-95
Jul-
95
Jan
-96
Jul-
96
Jan
-97
Jul-
97
Jan
-98
Jul-
98
Jan
-99
Jul-
99
Jan
-00
Jul-
00
Jan
-01
Jul-
01
Jan
-02
Jul-
02
Jan
-03
Jul-
03
Jan
-04
Jul-
04
Jan
-05
Jul-
05
Jan
-06
Jul-
06
Jan
-07
Jul-
07
Jan
-08
Jul-
08
Jan
-09
Jul-
09
Jan
-10
GIG
AW
AT
TS
HO
RA
(G
Wh
)
ENERGIA EMBALSADA SIC
RAPEL INVERNADA COLBUN CHAPO RALCO LAJA
© OECD/IEA 2011 Saving Electricity in a Hurry: Update 2011
Page | 53
Although they were advised to enact such a rationing regime in September 1998, the government chose not to do so until November 1998 in order to avoid a political backlash. The use of price signals to trigger demand reduction was virtually absent in that period, particularly from residential and commercial end users with regulated tariffs.
The 1999 crisis revealed that the existing regulatory and market framework provided insufficient incentives for generators to install back‐up units to avoid drought‐induced supply shortfalls. The government amended the 1982 electricity reform law in 1999 so that droughts were ruled out as force majeure events and penalties for failing to satisfy electricity supply contracts were substantially increased (IEA, 2005).
Chile’s energy‐efficiency programme
From 1990‐2003, Chile experienced an average annual growth in GDP of 5.8%, and a 5.1% growth in total secondary energy consumption. Electric power consumption during this period increased on average 8.2%. To mitigate the strains of consumption growth on the power sector, in 2005 the Ministry of Economy issued Decree No. 336 creating the National Energy Efficiency Programme (Programa País Eficiencia Energética – PPEE). PPEE sought to provide Chilean Ministries with guidance on energy efficiency plans, policies and actions.
In 2005, the PPEE developed the National Energy Efficiency Strategy. In the years leading up to the 2007‐2008 energy crisis, PPEE conducted several studies measuring electricity consumption and energy efficiency savings potential in the public, construction, industry, mining and home‐appliance sectors. These studies were instrumental in helping the government identify which measures to put in place to mitigate the electricity crisis.
The 2008 shortfall helped boost political support for PPEE. Its budget grew from USD 1 million in 2006 to USD 34 million in 2009 (IEA, 2009). From the outset, a strong relationship and involvement with the private sector has been a key feature of PPEE.
Response to the 2007/08 shortfall
When the energy crisis hit Chile in 2007/08, Chile was able to avoid interruptions to electricity supply and residential and commercial gas supply due to a package of measures implemented before and during the crisis. The PPEE led conservation efforts during the 2007/08 shortfall with a public information campaign and distribution of tens of thousands of compact fluorescent light bulbs (CFLs) into a largely untapped market. As a result, electricity use remained flat in 2008, even as the economy grew by 3.2 percent. As mentioned earlier, in years leading up to the energy crisis, growth in electricity use in Chile typically exceeded GDP growth.
Price signals
Perhaps the most powerful tool Chile used to combat the crisis was price signals. Because of its liberalised electricity market, electricity prices increased with international fluctuations in gas and electricity markets. These price increases dampened demand growth, thus helping avert a larger crisis.
Figure 17 shows monthly average spot (blue) and nodal (red) price growth (left scale: pesos/kWh). From Figure 17, it is clear that industrial/unregulated demand responded more quickly to the drought and gas shortfalls and correspondingly higher spot electricity prices (blue). Regulated (residential & commercial) demand is not directly exposed to spot prices, but to a six‐month tariff review linked to nodal prices (red) and therefore responded with a significant delay.
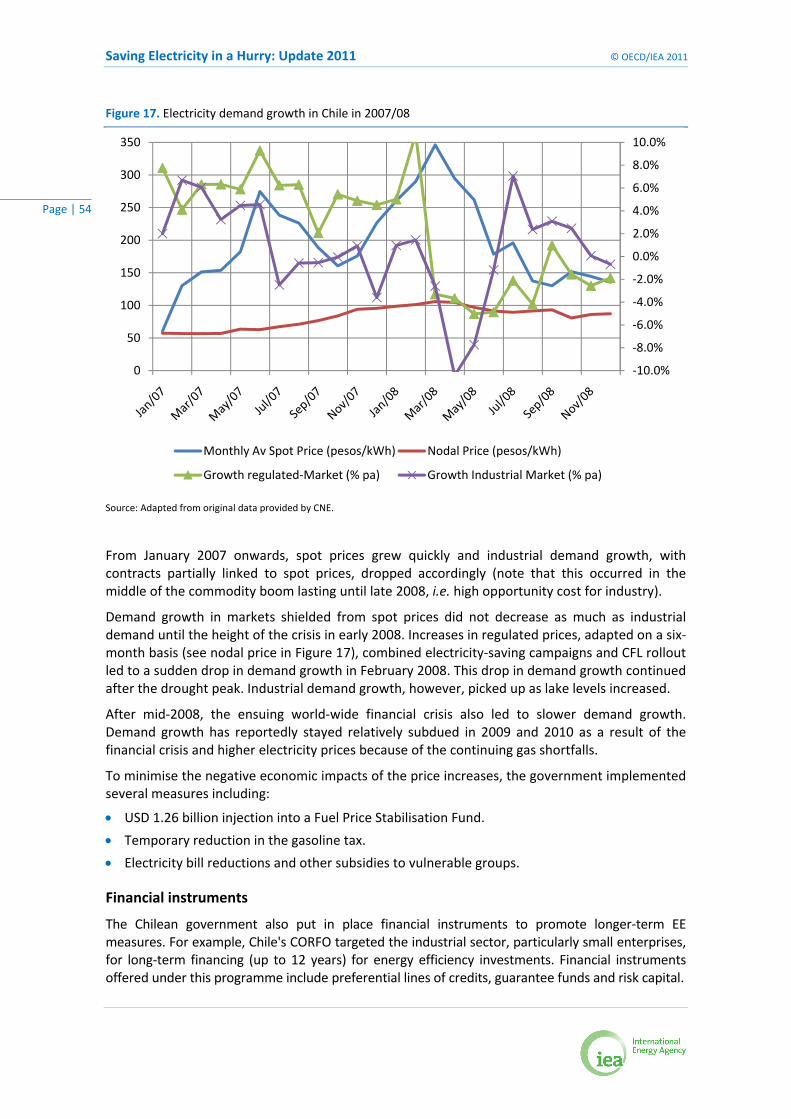
Saving Electricity in a Hurry: Update 2011 © OECD/IEA 2011
Page | 54
Figure 17. Electricity demand growth in Chile in 2007/08
Source: Adapted from original data provided by CNE.
From January 2007 onwards, spot prices grew quickly and industrial demand growth, with contracts partially linked to spot prices, dropped accordingly (note that this occurred in the middle of the commodity boom lasting until late 2008, i.e. high opportunity cost for industry).
Demand growth in markets shielded from spot prices did not decrease as much as industrial demand until the height of the crisis in early 2008. Increases in regulated prices, adapted on a six‐month basis (see nodal price in Figure 17), combined electricity‐saving campaigns and CFL rollout led to a sudden drop in demand growth in February 2008. This drop in demand growth continued after the drought peak. Industrial demand growth, however, picked up as lake levels increased.
After mid‐2008, the ensuing world‐wide financial crisis also led to slower demand growth. Demand growth has reportedly stayed relatively subdued in 2009 and 2010 as a result of the financial crisis and higher electricity prices because of the continuing gas shortfalls.
To minimise the negative economic impacts of the price increases, the government implemented several measures including:
USD 1.26 billion injection into a Fuel Price Stabilisation Fund.
Temporary reduction in the gasoline tax.
Electricity bill reductions and other subsidies to vulnerable groups.
Financial instruments
The Chilean government also put in place financial instruments to promote longer‐term EE measures. For example, Chile's CORFO targeted the industrial sector, particularly small enterprises, for long‐term financing (up to 12 years) for energy efficiency investments. Financial instruments offered under this programme include preferential lines of credits, guarantee funds and risk capital.
‐10.0%
‐8.0%
‐6.0%
‐4.0%
‐2.0%
0.0%
2.0%
4.0%
6.0%
8.0%
10.0%
0
50
100
150
200
250
300
350
Monthly Av Spot Price (pesos/kWh) Nodal Price (pesos/kWh)
Growth regulated‐Market (% pa) Growth Industrial Market (% pa)

© OECD/IEA 2011 Saving Electricity in a Hurry: Update 2011
Page | 55
Direct measures to avoid brownouts
Additional measures taken to avoid brownouts included:
Inclusion of April in peak‐hour measurement;
Enforcement of rationing decree (reduction in voltage ‐ hydro reserves);
Launch of energy‐saving campaigns (Sigue la Corriente, Ahorra Ahora, Gracias por Tu Energía);
Extension of daylight‐saving time;
Installation of back‐up turbines and engines;
Conversion of combined cycle gas turbines to allow operation with diesel;
Financial incentives for consumption reductions by regulated clients.
Long‐term savings measures
Over the past five years the government has put in place additional policies to develop long‐term energy efficiency programmes for the commercial, residential, industry (particularly mining) and transport sectors. Of note, in 2008 the government announced that it would improve energy efficiency policy by taking four steps (IEA, 2009):
1. Establish an institutional framework for energy efficiency.
2. Build a suitable knowledge base.
3. Promote energy efficiency across all sectors.
4. Provide incentives for energy efficiency, particularly in the electricity market.
The institutions tasked with improving energy efficiency have evolved in recent years. PPEE is under the Ministry of Energy and part of the newly created Chilean Energy Efficiency Agency (Agencia Chilena de Eficiencia Energética ‐ AChEE). AChEE is public‐private institution assigned with finalising a ten‐year Energy Efficiency Action Plan, developing incentives and support tools for energy efficiency and introducing energy efficiency in training programmes, among other tasks.
Conclusions
Recent electricity crises have raised the profile of energy‐efficiency policy in Chile. Before the 2007/08 crisis, Chile’s primary instrument to encourage energy efficiency was to ensure efficient energy‐pricing mechanisms (IEA, 2009). Now Chile has created a dedicated energy efficiency agency, implemented a portfolio of energy‐efficiency policies across the economy and increased funding for energy efficiency projects.
Saving Electricity in a Hurry: Update 2011 © OECD/IEA 2011
Page | 56
References ANRE/METI (Agency for Natural Resources and Energy within the Ministry of Economy, Trade and
Industry) (2011), Estimation of Demand Structure for Summer Peak Day in TEPCO Service Area, May 2011, available at http://www.meti.go.jp/english/electricity_supply/pdf/20110325_ electricity_prospect.pdf.
Benavente, J.M., A. Galetovic, R. Sanhueza and P. Serra (2005), “The Cost of Residential Electric Shortage in Chile: An Estimation Using the Demand Curve”, Revista de Analisis Economico, Vol. 20, No. 2, available at http://ssrn.com/abstract=1262483, accessed 28 January 2010.
Blackwell S. (2009), Electricity Conservation in Context: A Mixed Methods Study of Residential Conservation Behavior During an Electricity Shortage in New Zealand, Victoria University of Wellington, New Zealand, pp. 79‐82.
Encyclopaedia Britannica, Map of Alaska (2010), available at http://media‐2.web.britannica.com/eb‐media/99/64599‐004‐1912873A.gif.
Burki, S. (2009), “Cost of Power Outages to the Pakistan Economy”, 11 May 2009, Daily Dawn, available at http://news.dawn.com/wps/wcm/connect/dawn‐content‐library/dawn/in‐paper‐magazine/economic‐and‐business/cost‐of‐power‐outages‐to‐the‐economy‐159.
CNE (Comisión Nacional de Energía de Chile) (2005), Programa País Eficiencia Energética (PPEE), available at www.ppee.cl/.
CNE (2009), Deutsche Gesellschaft für Technische Zusammenarbeit (GTZ) GmbH, Las Energías Renovables No Convencionales en el Mercado Eléctrico Chileno, Santiago de Chile, 2009, available at http://www.cne.cl/cnewww/export/sites/default/05_Public_Estudios/descargas/ERNC_mercado_electrico_chileno_baja_resolucion.pdf.
Consumer Institute (2009), New Way to Buy Power, available at www.consumer.org.nz/news/view/new‐way‐to‐buy‐power.
Dahlbom B., H. Greer, C. Egmond and R. Jonkers (2009), “Changing Energy Behaviour: Guidelines for Behavioural Change Programmes”, Intelligent Energy Europe, 2009, Spain.
ESMAP (Energy Sector Management Assistance Programme) (2010), Central America Regional Programmatic Study for the Energy Sector: Managing An Electricity Shortfall ‐ A Guide for Policymakers, World Bank, Washington, DC.
ESMAP (2011), Best Practices for Market Based Power Rationing Implications for South Africa, World Bank, Washington, DC.
Energy Tribune (2009), South Africa Power Improves, Rationing at Mines Remains, 26 January 2009, available at http://www.energytribune.com/articles.cfm?aid=1252.
Electricity Technical Advisory Group (ETAG) (2009), Improving Electricity Market Performance – Discussion Paper: A Preliminary Report to the Ministerial Review of Electricity Market Performance, Wellington.
Golden, K. (2009) "This Time, We Know the Drill", Juneau Empire, 14 January 2009, available at http://juneauempire.com/stories/011409/loc_377248952.shtml.
Goldman, C., J. Eto and G. Barbose (2002), California Customer Load Reductions During the Electricity Crisis: Did they Help to Keep the Lights On?, LBNL‐49733, Environmental Energy Technologies Division, Lawrence Berkeley National Laboratory, May 2002, Berkeley, CA.
© OECD/IEA 2011 Saving Electricity in a Hurry: Update 2011
Page | 57
Heffner, G., L. Maurer, A. Sarkar and X. Wang (2009), “Minding the Gap: World Bank’s Assistance to Power Shortage Mitigation in the Developing World,” Energy Policy Volume 35, Issue 4, April 2010, Pages 1584‐1591.
Hummer J., J. Harris, R. Firestone and P. Thompson (2010), “The Time for (Behavior) Change is Now, Applying Social Marketing Principles to Residential Energy Efficiency Programs”, International Energy Program Evaluation Conference, 10 June 2010, Paris.
Hunt D. and J. Isles (2009), “Review of Winter 2008 and the Period Leading into Winter”, Report commissioned by Electricity Commission, available at www.electricitycommission.govt.nz/consultation/winter08.
IEEJ (Institute of Energy Economics Japan) (2011), Impacts of East Japan Great Earthquake on Power Supply, available at http://eneken.ieej.or.jp/data/3752.pdf.
IEA (International Energy Agency) (2004), The Power to Choose: Demand Response in Liberalised Electricity Markets, OECD/IEA, Paris.
IEA (2005), Saving Electricity in a Hurry, OECD/IEA, Paris.
IEA (2009), Chile Energy Policy Review, OECD/IEA, Paris.
IEA (2010b), “Smart Grid Customer Policy Needs”, Workshop Report, Washington DC.
IEA (2010c), Electricity Information, OECD/IEA, Paris.
IEA (2010d), World Energy Outlook 2010, OECD/IEA, Paris.
JEDC (Juneau Economic Development Council) (2008), Lessons Learned Commission Report: Juneau Hydroelectric Power Crisis, October 24 Draft, Juneau: Juneau Economic Development Council, available at http://jedc.org/unplugged/.
Kyung‐Hee, K. (2007), Overview on Public Benefit Campaigns to Promote Energy Conservation and Energy Efficiency, UN Forum on Energy Efficiency and Energy, available at www.un.org/esa/sustdev/sdissues/energy/op/forum_dec07/background2.pdf.
Leighty, W. and A. Meier (2011), “Accelerated electricity conservation in Juneau, Alaska: A study of household activities that reduced demand 25%.” Energy Policy 39 (5) (May), available at 2299‐2309. doi:16/j.enpol.2011.01.041.
Leighty, W. and A. Meier (2010), Short‐term Electricity Conservation in Juneau, Alaska: A Study of Household Activities, paper presented at American Council for an Energy‐Efficiency Economy (ACEEE) Summer Study on Energy Efficiency in Buildings, August 15‐20, Pacific Grove, CA.
Limaye, D., A. Sarkar and J. Singh (2009), Large‐Scale Residential Energy Efficiency Programs Based on Compact Fluorescent Lamps (CFLs): Approaches, Design Issues, and Lessons Learned, the World Bank Energy Sector Management Assistance Program (ESMAP), December 2009, available at www.esmap.org/esmap/sites/esmap.org/files/2162010114742_CFL_Toolkit_Report_Rev_Feb_15_2010_Final_PRINT_VERSION.pdf.
Maurer, L., M. Pereira and J. Rosenblatt (2005) Implementing Power Rationing in a Sensible Way: Lessons Learned and International Best Practices, Energy Sector Management Assistance Programme, World Bank, Washington, DC, available at http://www.teqs.net/PowerRationing.pdf.
Mikkonen, I., L. Gynther, K. Hamekoski, S. Mustonen and S. Silvonen (2010), Innovative Communication Campaign Packages on Energy Efficiency, World Energy Council, ADEME, Motiva, 2010, available at www.worldenergy.org/documents/ee_case_study__communication.pdf.
Saving Electricity in a Hurry: Update 2011 © OECD/IEA 2011
Page | 58
Neenan, B. and J. Eom (2008), Price Elasticity of Demand for Electricity: A Primer and Synthesis Intern, An Electric Power Institute (EPRI) White Paper for the Energy Efficiency Initiative, EPRI, January 2008, Palo Alto, CA.
Niederberger, A. (2007), Overview of Policies and Measures to Promote Household Equipment Efficiency, Background Paper, UN Forum on Energy Efficiency and Energy Security for Sustainable Development: Taking Collaborative Action on Mitigating Climate Change, 17‐18 December 2007, Seoul, Republic of Korea, available at www.policy‐solutions.com/Publications%20pdf/UN%20ee%20Forum%201207.pdf.
Parnell, R. and O. Popovic‐Larsen (2005), “Informing the Development of Domestic Energy Efficiency Initiatives: An Everyday Householder‐Centred Framework”, Environment and Behavior, Vol. 37, No.6 , pp. 787‐807.
PCE (Parliamentary Commissioner for the Environment) (2009), Smart Electricity Meters: How Household and the Environment Can Benefit, Parliamentary Commissioner for the Environment, Wellington, New Zealand, available at http://www.pce.parliament.nz/publications/all‐publications/smart‐electricity‐meters‐how‐households‐and‐the‐environment‐can‐benefit.
Skinner, G. (2008), "Electric Usage Drops 20 percent", Juneau Empire, 23 April 2008, available at http://juneauempire.com/stories/042308/loc_271344651.shtml
South African government (2008), National Response to South Africa's Electricity Shortage, January 2008, available at http://www.info.gov.za/otherdocs/2008/nationalresponse_sa_electricity1.pdf.
Statistics Canada (2003), Canadian Economic Accounts, 28 November, available at www.statcan.ca.
Statistics New Zealand, available at http://www.stats.govt.nz/browse_for_stats.aspx.
Tsehaye, E., S. Tamiru and E. Engida (2010), Economy‐wide Impact of Electricity Shortage: A CGE Analysis, Newsletter: Ethiopia Strategy Support Program II (ESSP‐II), July‐August 2010, available at www.edri.org.et/Documents/IFPRI‐ESSP%20II%20newsletter%20July‐August2010.pdf.
Tokman, M.R. (2009), The Energy Crisis and Its Lessons, The Case of Chile, Ministry of Energy Power Point Presentation, Chile, available at http://siteresources.worldbank.org/INTENERGY/Resources/335544‐1232567547944/5755469‐1239633250635/Marcelo_Tokman.pdf
van Campen, B. (2010), Efficiency and Fuel Switching in Norway and New Zealand’s Residential Electricity Sector During Droughts, 33rd International Association for Energy Economics (IAEE) Conference, 2010, available at http://docs.business.auckland.ac.nz/Doc/fficiency‐and‐fuel‐switching‐in‐Norway‐and‐NZs‐residential‐electricity‐sector‐during‐droughts.pdf.
World Bank (2008), Mainstreaming Carbon Finance and Clean Development Mechanism (CDM), Large Scale CFL Deployment Programs, World Bank, Washington DC, available at http://www.energyrating.gov.au/pubs/2008‐phase‐out‐session4‐sarkar.pdf.

9 rue de la Fédération 75739 Paris Cedex 15
www.iea.org