
Saturated and unsaturated salt transport in peat from a ...
19
SOIL, 4, 63–81, 2018 https://doi.org/10.5194/soil-4-63-2018 © Author(s) 2018. This work is distributed under the Creative Commons Attribution 4.0 License. SOIL Saturated and unsaturated salt transport in peat from a constructed fen Reuven B. Simhayov 1 , Tobias K. D. Weber 1,2,a , and Jonathan S. Price 1 1 Department of Geography, University of Waterloo, Waterloo, Ontario, N2L 3G1, Canada 2 Soil Science and Soil Physics Division, Institute of Geoecology, TU Braunschweig, Langer Kamp 19c, 38106 Braunschweig, Germany a now at: Institute for Soil Science and Land Evaluation, Biogeophysics, University of Hohenheim, Emil-Wolff-Straße 27, 70599 Stuttgart, Germany Correspondence: Reuven B. Simhayov ([email protected]) Received: 27 June 2017 – Discussion started: 14 July 2017 Revised: 18 December 2017 – Accepted: 21 December 2017 – Published: 15 February 2018 Abstract. The underlying processes governing solute transport in peat from an experimentally constructed fen peatland were analyzed by performing saturated and unsaturated solute breakthrough experiments using Na + and Cl - as reactive and non-reactive solutes, respectively. We tested the performance of three solute transport models, including the classical equilibrium convection–dispersion equation (CDE), a chemical non-equilibrium one-site adsorption model (OSA) and a model to account for physical non-equilibrium, the mobile–immobile (MIM) phases. The selection was motivated by the fact that the applicability of the MIM in peat soils finds a wide consensus. However, results from inverse modeling and a robust statistical evaluation of this peat provide evidence that the measured breakthrough of the conservative tracer, Cl - , could be simulated well using the CDE. Furthermore, the very high Damköhler number (which approaches infinity) suggests instantaneous equilibration between the mobile and immobile phases underscoring the redundancy of the MIM approach for this particular peat. Scanning electron microscope images of the peat show the typical multi-pore size distribution structures have been homogenized sufficiently by decomposition, such that physical non-equilibrium solute transport no longer governs the transport process. This result is corroborated by the fact the soil hydraulic properties were adequately described using a unimodal van Genuchten–Mualem model between saturation and a pressure head of ∼-1000 cm of water. Hence, MIM was not the most suitable choice, and the long tailing of the Na + break- through curve was caused by chemical non-equilibrium. Successful description was possible using the OSA model. To test our results for the unsaturated case, we conducted an unsaturated steady-state evaporation experi- ment to drive Na + and Cl - transport. Using the parameterized transport models from the saturated experiments, we could numerically simulate the unsaturated transport using Hydrus-1-D. The simulation showed a good pre- diction of observed values, confirming the suitability of the parameters for use in a slightly unsaturated transport simulation. The findings improve the understanding of solute redistribution in the constructed fen and imply that MIM should not be automatically assumed for solute transport in peat but rather should be evidence based. Published by Copernicus Publications on behalf of the European Geosciences Union.
Transcript of Saturated and unsaturated salt transport in peat from a ...

SOIL, 4, 63–81, 2018https://doi.org/10.5194/soil-4-63-2018© Author(s) 2018. This work is distributed underthe Creative Commons Attribution 4.0 License.
SOIL
Saturated and unsaturated salt transport in peatfrom a constructed fen
Reuven B. Simhayov1, Tobias K. D. Weber1,2,a, and Jonathan S. Price1
1Department of Geography, University of Waterloo, Waterloo, Ontario, N2L 3G1, Canada2Soil Science and Soil Physics Division, Institute of Geoecology, TU Braunschweig,
Langer Kamp 19c, 38106 Braunschweig, Germanyanow at: Institute for Soil Science and Land Evaluation, Biogeophysics, University of Hohenheim,
Emil-Wolff-Straße 27, 70599 Stuttgart, Germany
Correspondence: Reuven B. Simhayov ([email protected])
Received: 27 June 2017 – Discussion started: 14 July 2017Revised: 18 December 2017 – Accepted: 21 December 2017 – Published: 15 February 2018
Abstract. The underlying processes governing solute transport in peat from an experimentally constructed fenpeatland were analyzed by performing saturated and unsaturated solute breakthrough experiments using Na+
and Cl− as reactive and non-reactive solutes, respectively. We tested the performance of three solute transportmodels, including the classical equilibrium convection–dispersion equation (CDE), a chemical non-equilibriumone-site adsorption model (OSA) and a model to account for physical non-equilibrium, the mobile–immobile(MIM) phases. The selection was motivated by the fact that the applicability of the MIM in peat soils findsa wide consensus. However, results from inverse modeling and a robust statistical evaluation of this peat provideevidence that the measured breakthrough of the conservative tracer, Cl−, could be simulated well using the CDE.Furthermore, the very high Damköhler number (which approaches infinity) suggests instantaneous equilibrationbetween the mobile and immobile phases underscoring the redundancy of the MIM approach for this particularpeat. Scanning electron microscope images of the peat show the typical multi-pore size distribution structureshave been homogenized sufficiently by decomposition, such that physical non-equilibrium solute transport nolonger governs the transport process. This result is corroborated by the fact the soil hydraulic properties wereadequately described using a unimodal van Genuchten–Mualem model between saturation and a pressure headof ∼−1000 cm of water. Hence, MIM was not the most suitable choice, and the long tailing of the Na+ break-through curve was caused by chemical non-equilibrium. Successful description was possible using the OSAmodel. To test our results for the unsaturated case, we conducted an unsaturated steady-state evaporation experi-ment to drive Na+ and Cl− transport. Using the parameterized transport models from the saturated experiments,we could numerically simulate the unsaturated transport using Hydrus-1-D. The simulation showed a good pre-diction of observed values, confirming the suitability of the parameters for use in a slightly unsaturated transportsimulation. The findings improve the understanding of solute redistribution in the constructed fen and imply thatMIM should not be automatically assumed for solute transport in peat but rather should be evidence based.
Published by Copernicus Publications on behalf of the European Geosciences Union.

64 R. B. Simhayov et al.: Saturated and unsaturated salt transport in fen peat
1 Introduction
A large pool of leachable Na, Ca and S was introduced inthe tailings sand used to construct a fen watershed as part ofa novel attempt at landscape reclamation in the oil sands re-gion (Simhayov et al., 2017). The transport of these solutesin groundwater derived from these tailings are likely to affectfen vegetation (Simhayov et al., 2017); thus, a better under-standing of the transport processes through peat, and soluteaccumulation in the rooting zone of the fen, is needed.
The current assumption is that solute attenuation in peatis a result of solute adsorption and mass exchanges be-tween mobile and immobile phases (Hoag and Price, 1997;Rezanezhad et al., 2012). Generally, in Sphagnum-derivedpeat, hyaline cells and their skeletal remnants are thoughtto account for a large fraction of dead-end pores with dis-tinct pore size density distributions (Weber et al., 2017a, b)and a volumetric moisture content (VMC) between 10 and20 % (Hayward and Clymo, 1982; Weber et al., 2017a, b).This physical structure, along with surface adsorption of re-active solutes (Rezanezhad et al., 2012, 2016) will lead todelayed arrival of solutes which are likely to affect veg-etation community development in oil sands reclamationlandscapes. The physical and hydraulic properties of undis-turbed peat changes along a continuous vertical profile (We-ber et al., 2017b; Limpens et al., 2008), whereby deep peatlayers are generally more decomposed (Clymo, 1983). In ad-dition to pore-scale effects, the systematic layered hetero-geneity common in natural peatlands influences mixing andtransport (Hoag and Price, 1997). However, in constructedpeatlands, the decomposition gradient is destroyed becauseof the disruption caused by draining, stripping, transport andplacement (Nwaishi et al., 2015).
Solute transport in the subsurface may be subject to phys-ical and chemical non-equilibrium (Nielsen et al., 1986) in-validating the use of the conventional convection–dispersionequation (CDE) to simulate it. Physical non-equilibrium isthought to be a process of a heterogeneous flow field withspatial differences in hydraulic conductivity due to dead-endpores (Coats and Smith, 1964; Zurmühl and Durner, 1996),non-moving intra-aggregate water (Philip, 1968; Passioura,1971) or stagnant water in thin liquid films around soil par-ticles (Nielsen et al., 1986). In this mobile–immobile model(MIM; Coats and Smith, 1964; van Genuchten and Wierenga,1976), the liquid phase is partitioned into a mobile and an im-mobile region. Convective–dispersive transport occurs onlyin the mobile zone, while solute transport into the immobileregion is by diffusion, the rate of which can be determinedby experiments and inverse estimation of transport parame-ters (Vanderborght et al., 1997). In chemical non-equilibriummodels, it is assumed that sorption at the pore-water solidparticle interface is kinetically controlled (Cameron andKlute, 1977; Nkedi-Kizza et al., 1989). Both parametric non-equilibrium models may additionally account for chemicalequilibrium adsorption (Toride et al., 1993).
To distinguish between the governing solute transport pro-cess, inverse modeling can provide the necessary informationon model parameter estimates and associated uncertainties,and permits the calculation of model performance and selec-tion criteria (Vrugt and Dane, 2006; Iden and Durner, 2008;Weber et al., 2017a). The modeling can be based on mea-sured solute breakthrough experiments of reactive as well asnon-reactive solutes (Nkedi-Kizza et al., 1984). In the no-tation of the convection–dispersion equation, the retardationfactor is strictly referred and attributed to equilibrium adsorp-tion (Toride et al., 1995, Šimunek and van Genuchten, 2008,Šimunek et al., 2008) and is a function of bulk density, theslope of the adsorption isotherm and volumetric water con-tent (Toride et al., 1995). A problem in deriving a numericalvalue for the retardation factor during inverse modeling isthat it is mathematically directly negatively proportional tothe flow.
To the knowledge of the authors, the only literature re-ports with experiments of NaCl breakthrough on saturatedpeat columns conducted in the laboratory are from Price andWoo (1988), Hoag and Price (1997), Ours et al. (1997), Co-mas and Slater (2004) and Rezanezhad et al. (2012). Ourset al. (1997) speculate that the observed prolonged tailingof NaCl is a result of solutes diffusing into immobile zones.However, neither batch adsorption tests with the potentialto exclude kinetic chemical sorption are presented nor weresolute transport models fitted to breakthrough curves, leav-ing their conclusions tentative. Hoag and Price (1997) suc-cessfully described their observations with the CDE. How-ever, based on an effective porosity (ne) determined by photoimagery, the authors calculated the pore-water velocity byv = q/ne, where q is specific discharge. The method of es-timating ne from photo-imagery may easily lead to a sys-tematic miscalculation of effective pore-water velocity, re-sulting in different values of v than those calculated fromtotal porosity, ϕ or inverse estimation. By estimating CDEmodel parameters describing non-reactive Cl− breakthroughand keeping v fixed, their retardation factor (R), reflect-ing vwater/vsolute was > 1 and close to the ratio of ϕ to ne.They attributed the delay in solute transport to physical non-equilibrium processes, whereby solutes diffuse into inactivepores (i.e., solute transfer from the mobile to the immobileregion). The approach of Hoag and Price (1997) differs fromthe classical understanding where diffusion into the immo-bile zone is described by a kinetic constant, while R as-sumes chemical equilibrium of solutes with sorption sites(e.g., Coats and Smith, 1964; van Genuchten and Wierenga,1976). Rezanezhad et al. (2012) concluded MIM transportis observable on small peat samples. Moreover, parameteruncertainties and correlations are not shown and the perfor-mance of the MIM in comparison to the classical CDE is notgiven, such that a rigorous model selection is not possible.Additionally, acknowledging that Na+ and Cl− ions may in-teract with dissolved organic matter, inducing changes in the
SOIL, 4, 63–81, 2018 www.soil-journal.net/4/63/2018/
R. B. Simhayov et al.: Saturated and unsaturated salt transport in fen peat 65
pore size and geometry (Ours et al., 1997; Comas & Slater,2004) a pretreatment was implemented (see Sect. 2.3.1).
The goal of the study is to expand our understanding of thetransport processes in the vadose zone of decomposed peatby testing various transport models and scrutinizing the com-mon assumption that the mobile–immobile transport modelbest reflects the processes in saturated and unsaturated peat.We approach this objective by conducting lab-based experi-ments including saturated and unsaturated breakthrough ex-periments using NaCl. Cl− is generally uninvolved in chemi-cal reactions in peat, except for ultra-saline conditions (Ourset al., 1997), and its counter ion, Na+, is a prominent soluteand potential contaminant in the oil sands reclamation land-scape (Simhayov et al., 2017). To compare the performanceof models, model parameters were estimated using inversemodeling with the CXTFIT v2.0 code (Toride et al., 1995).Comparison was based on a statistical analysis to investigatethe information content of the data collected, enabling a care-ful assessment of the underlying processes. Subsequently, theparameterized models were used to numerically simulate thesolute transport in unsaturated steady-state evaporation ex-periments with Hydrus-1-D (Simunek et al., 2008). We testedif the model selection and parameterization based on satu-rated experiments can be extended to predict unsaturated so-lute transport. No further inverse estimation was done for theunsaturated transport of the non-reactive solute except forthe Freundlich–Langmuir parameters of the reactive solute.A sensitivity analysis was then carried out to estimate poten-tial errors caused by using parameters derived from saturatedtransport to simulate the unsaturated case.
2 Materials and methods
The peat used for the fen was moderately decomposed richfen, sedge peat with remnants of Sphagnum moss, originatingfrom a donor fen prior to stripping of overburden material toexpose the oil sands deposits (Price et al., 2011; Daly et al.,2012; Nwaishi et al., 2015). The donor fen had been drainedfor 2 years prior and the peat underwent accelerated decom-position due to exposure to oxygen (Nwaishi et al., 2015).Vegetation growth on the drained fen resulted in addition ofstems and leaves to the peat. The samples were shoveled into20 L buckets from a stockpile made by the heavy machin-ery that removed the peat layer from the donor fen, furtherdisturbing the peat, as it was placed in the fen. The peat hasa relatively open structure (Fig. 1), compared to Sphagnumpeat used in other transport studies (e.g., Hoag and Price,1997; Rezanezhad et al., 2012).
2.1 Research approach
Four soil physical experiments were conducted to estimatethe hydraulic properties and solute transport characteristicsof the fen peat material. The conducted experiments were(1) transient evaporation, (2) water retention characteristics
using tension disks, (3) saturated breakthrough and (4) un-saturated breakthrough. As previously noted, the peat wassampled from the stock of disturbed peat used to constructthe fen; in addition, we carefully removed woody inclusionsand intact leaves to homogenize it such that we could en-sure minimal variation between samples. The peat was gen-tly, yet thoroughly, mixed and packed into columns (see Ap-pendix A1); no milling or sieving was done. Prior to ex-perimentation, samples were saturated from the bottom insmall increments, over a 24 h period, using 18.2 M�cm wa-ter (ultra-pure water). All experiments were conducted ata target bulk density (ρB) of 0.12 gcm−3. Experiments wereconducted on triplicates, except for the tension disk experi-ments, which were conducted on four samples. For the de-termination of the solute transport properties, Cl− was usedas a non-reactive solute and Na+ as a reactive solute. Allbreakthrough experiments were performed using a solutionof 200 mgL−1 Na+ and 300 mgL−1 Cl− corresponding tovalues measured by Kessel (2016) in the constructed Nikan-otee Fen watershed. This solution was prepared by mixing500 mg of NaCl (1.06404.055, ACS grade, Merck, Germany)per liter of ultra-pure water.
2.2 Soil hydraulic properties
To determine the peat soil hydraulic properties, we conductedtransient evaporation experiments (Schindler, 1980; Peterset al., 2015; Weber et al., 2017a, b) for the retention proper-ties, supplemented with tension disk experiments (Klute andDirksen, 1986; McCarter et al., 2017). Tension disk experi-ments are considered to be a more reliable method to deter-mine the unsaturated hydraulic conductivity in the wet range,because transient evaporation experiments contain limited in-formation at pressure heads between 0 and −60 cm for theunsaturated hydraulic conductivity curve (Peters and Durner,2008). Water retention and unsaturated hydraulic conductiv-ity data were obtained with the tension disk experiments us-ing 10 cm i.d. and 5 cm high peat samples at−2.5,−5,−7.5,−10, −15, −20 and −25 cm pressure head (h; cm) steps,which was also the order in which the experiment was con-ducted. Outflow during each pressure step was monitored byscales with an accuracy of 0.1 g and logged at 1 min intervalsand the unsaturated hydraulic conductivity calculated withthe Darcy–Buckingham equation (Swartzendruber, 1969).The transient evaporation experiments were conducted onthe same samples using commercial UMS HYPROP devices(UMS GmbH, Munich, Germany). The water retention andunsaturated hydraulic conductivity data were then used toobtain parameters of the unimodal van Genuchten–Mualemmodel (van Genuchten, 1980; Mualem, 1976) by inversemodeling. For further details on parameters, the reader is re-ferred to Appendix A.2.
The volumetric water content, θ , was determined as thedifference between sample weight and the oven-dry mass forsamples dried at 80 ◦C until no difference in weight was mea-
www.soil-journal.net/4/63/2018/ SOIL, 4, 63–81, 2018

66 R. B. Simhayov et al.: Saturated and unsaturated salt transport in fen peat
Figure 1. Scanning electron microscope pictures of samples of the peat used in this study. (a) Moss with hyaline cells; note cells with intactmembrane at bottom right corner and larger pore spaces in bottom left and top right corners. (b) Hyaline cells with membranes missing; theview through the skeleton is evident. Modified from Rezanezhad et al. (2016).
sured (Gardner, 1986). Bulk density was determined as theratio of dry weight to the original sample volume. Volumetricwater content at saturation, θs, was assumed to be equivalentto the sample total porosity. Saturated hydraulic conductiv-ity (Ks; cmd−1) was determined with a constant head test(Freeze and Cherry, 1979) using the flowthrough chambersdescribed below and a hydraulic gradient of 1.
2.3 Saturated breakthrough experiments and inversemodeling
2.3.1 Sample preparation
Saturated breakthrough experiments were conducted in10 cm long, 10 cm i.d. PlexiglasTM (785 cm3) flowthroughchambers, fitted at each end with 2.5× 15× 15 cm high-density polyethylene (HDPE) end plates with silicon gas-kets. A polypropylene fiber pad was placed between theplate and the sample to enhance the distribution of the so-lution beneath the sample (see Appendix A1). The NaCl so-lute source was a 20 L magnetically stirred solution reser-voir pumped at a steady rate of 5 mLmin−1 (a flux den-sity of 0.064 cmmin−1) using a peristaltic pump (WT600–3J,LongerPump, China) and the outflow solute concentrationmonitored continuously (e.g., Skaggs and Leij, 2002). Priorto the breakthrough experiment, the samples were flushedwith two chamber volumes of the NaCl solution to reduce po-tential changes to the pore sizes as a result of swelling (Priceand Woo, 1988; Ours et al., 1997) or clogging due to floccu-lation. Subsequently, the samples were inverted and flushedwith ultra-pure water for six chamber volumes to remove thesolutes that were introduced. To determine sampling timesand the end of the experiment, an electrical conductivity (EC)electrode (11388–372, SympHony, VWR, USA) connectedto a portable meter (SP80PC, SympHony, VWR, USA) wasused. The EC meter was calibrated using a two-point cali-
bration with 84 and 1413 µScm−1 conductivity calibrationsolutions (HI-7033 and HI-7031), respectively (Hanna In-struments, USA). EC was checked every 5–10 min depend-ing on the trend observed. Sampling was done with observedchanges in EC and the experiment was continued until 1 hafter the outflow EC value was similar to the inflow. Sampleswere collected in 1.5 mL polypropylene micro centrifugetubes (Z336769, Sigma-Aldrich, USA) and kept frozen untilanalyzed. Water samples were analyzed for Na+ and Cl− us-ing an ion chromatograph (IC) (DIONEX ICS 3000, IonPacAS18 and CS16 analytical columns). Apparatus blank cor-rections were done as described in Rajendran et al. (2008),where no transport model for the apparatus blank was as-sumed but correction values generated using hermite cubicsplines.
2.3.2 Solute transport models
Two different parametric solute transport model types wereused to describe the observed breakthrough data of Cl− anda third additional model for the Na+ data. We list the modelin the order of testing. The first two consisted of the MIMequation (Eqs. 1 and 2; van Genuchten and Wagenet, 1989)and the classical CDE (Eq. 3; van Genuchten and Alves,1982; Nielsen et al., 1986), and the third is the one-site ad-sorption equation (OSA; Eqs. 5 and 6; van Genuchten et al.,1974; Nielsen et al., 1986) which was only used for Na+.
The MIM for a non-reactive solute with instantaneousequilibration is given by
βθ∂cm
∂t=D
∂2cm
∂2x− v
∂cm
∂x−αMIM(cm− cim) (1)
(1−β)θ∂cim
∂t= αMIM(cm− cim), (2)
where β is the ratio of the water content of the mobile regionto the total water content; θ (L3 L−3), Cm and Cim are the
SOIL, 4, 63–81, 2018 www.soil-journal.net/4/63/2018/

R. B. Simhayov et al.: Saturated and unsaturated salt transport in fen peat 67
concentrations in the water phase of the mobile and immo-bile regions (ML−3), respectively; D is the dispersion coef-ficient (L2 T−1); v is the average linear pore-water velocity(LT−1); and αMIM is the first-order rate coefficient betweenthe mobile and immobile regions (T−1).
The CDE is given by
∂c
∂t=D
R
∂2c
∂2z−v
R
∂c
∂z, (3)
where c is the concentration of the total water phase (ML−3),and R is a retardation factor for equilibrium adsorption,which for a non-reactive solute is typically assumed to be 1(but see Hoag and Price, 1997). In the classical interpreta-tion, R is related to the adsorption distribution coefficient,Kd (M3 L−3), by R = 1+ρB∗Kd/θ . The MIM reduces to theCDE equation under certain conditions, which can be ana-lyzed by the dimensionless Damköhler number (Da; Wehrerand Totsche, 1995; Vanderborght et al., 1997) (Eq. 4), givenby
Da =αMIML
v (1−β)θ, (4)
where L is the column length (L). Large Da values indi-cate very fast equilibration between the regions. From in-spection of Eq. (4), it becomes clear that Da→∞, and asαMIM increases, Da increases proportionally, signifying in-stantaneous equilibration; thus, a differentiation between thetwo regions cannot be determined. Moreover, Parker and Val-occhi (1986) showed that the CDE may also be applicablewhen a considerable part of the solute dispersion is causedby diffusion into the immobile region.
In physical non-equilibrium, the attenuation of both reac-tive and non-reactive solutes is affected. However, if only thereactive solute shows long tailing, then it can be assumedthat chemical non-equilibrium is affecting the flow process.In NaCl breakthrough experiments (Rezanezhad et al., 2012),only Na+ showed long tailings in fen peat so that the phys-ical non-equilibrium model should not be employed. Forthis case, first-order kinetic chemical non-equilibrium mod-els may be chosen. One typical model for solute transport inporous media is the one-site adsorption equation which is anexpansion of the CDE with the addition of a kinetic adsorp-tion member. It is given by
∂c
∂t=D
∂2c
∂2z− v
∂c
∂z−αOSA
[(R− 1)c−
ρB
θs]
(5)
ρB
θ
∂s
∂t= αOSA
[(R− 1)c−
ρB
θs], (6)
where s is the kinetically sorbed concentration to the solid(M), and αOSA is the first-order rate coefficient between dis-solved and adsorbed concentration (T−1) which has beenfound to be a function of pore-water velocity and cannot bederived by batch experiments alone (Nielsen et al., 1986).
Following the traditional approach for solute transport pa-rameterization in peat (Rezanezhad et al., 2012, 2017), weinitially assumed the MIM model and compared it with theperformance of the CDE for the non-reactive solute. ForNa+, transport parameters were additionally estimated witha one-site chemical adsorption model. The data used for thefitting were averages of three replicates. Parameterization ofthe model was done with CXTFIT (V2.0; Toride et al., 1995),which minimizes the least squares. We estimated the follow-ing parameters: v and D for the CDE; v, D, β and αMIM forMIM; and R and αOSA for the OSA model. The estimated Dand v from the Cl− data fit were used for the Na+ simula-tions, since dispersion is a physical material property, and Rcan only be determined if v is fixed from knowledge of a con-servative solute experiment. Using various starting values,we ensured that the global minimum was found. CXTFITcalculates the variance–covariance matrix, which is requiredfor the calculation of the standard errors of the parametersand the parameter correlation matrix.
The root mean squared error (RMSE) was used as an in-dex for model performance calculated for each of the testedmodels (Eq. 14 in Weber et al., 2017a). The corrected Akaikeinformation criterion (AICc; Eq. 2 in Ye et al., 2008) wasused as a method of model comparison where the model withthe smallest AICc is to be favored. It is a statistically robustand commonly used index to compare models in soil physics(e.g., Weber et al., 2017a).
2.4 Unsaturated breakthrough experiments andsensitivity analyses
2.4.1 Sample preparation
The unsaturated solute breakthrough experiments were de-signed as six steady-state evaporation columns 23 cm highand 10 cm i.d. (Fig. 2). Peat samples were placed in a col-umn constructed with a grooved HDPE base plate with aninlet a silicon washer and polypropylene fiber pad, and openat the top (see Appendix A1). The columns were slowly sat-urated from the bottom in small increments over 48 h to min-imize trapped gas bubbles. Once saturated, the columns wereflushed with two column volumes of the NaCl solution toreduce potential changes in hydraulic properties, as previ-ously described. The NaCl flushing was followed by flush-ing six column volumes of ultra-pure water to remove theNa+ and Cl−, with the water overflowing from the top of thesample. Flushing of Na+ did not remove all solute, result-ing in 40 mgL−1 of Na+ remaining in the time zero sampleswere taken at the bottom 8 cm of the column. Nevertheless,these concentrations were accounted for in the HYDRUSsimulation. Columns were then drained overnight with 0 cmpressure head at the bottom of the sample and connected toa Marriot device containing ultra-pure water. The water ta-ble was set to the base of the peat column, and the columnswere left to settle for 11 days, after which the columns were
www.soil-journal.net/4/63/2018/ SOIL, 4, 63–81, 2018

68 R. B. Simhayov et al.: Saturated and unsaturated salt transport in fen peat
Figure 2. Unsaturated column experiment column and water re-serve setup.
instrumented with the soil tensiometers and water samplers(further details below).
Each Marriot device was fitted with a low flow 12 V miniwater pump to circulate the water within it for 5 min ev-ery 2 h to prevent solute stratification. Three Marriot deviceswere filled with an 8.9 mM solution of NaCl as treatmentand three with ultra-pure water. The columns were fittedwith four unsaturated soil water samplers at 2.5, 7.5, 12.5and 17.5 cm above the water table (19.21.05, Rhizon, Rhi-zonsphere, Germany) and with two tensiometers at 10 cm(LM) 23 cm (UM), to determine if the water pressure devi-ated from hydrostatic conditions (see Appendix A3). Ten-siometers were composed of a porous clay cup and a flexiblesilicon tube, which was open to the atmosphere. The experi-ment was run for 120 days; evaporation was calculated basedon changes to the water level in the Marriot device (see Ap-pendix A3). The experiment was conducted in a room withcontrolled humidity maintained at ∼ 45 %, assisted by a fanto mix the air in the chamber. Relative humidity (RH) andtemperature were measured every 10 min (ECT, Decagon,USA) (see Appendix A3).
NaCl solution was introduced at the base of the columnand drawn upwards by evaporation. Marriot devices were at-tached to supply water over the bottom boundary for eachcolumn. The pressure head at the lower boundary was fixedto a pressure head of 0 cm for the duration of the experiment.Daily values of the water level in the Marriot were measuredwith a measuring tape, and the evaporative water flux overthe upper boundary was calculated by dividing the water lostby the cross-sectional surface area of the column (see Ap-pendix A3).
Pore-water samples were taken weekly from each sam-ple height through the Rhizon samplers. On average, 5.5 mL
of water were drawn from each sampler using a dedicated30 mL polypropylene syringe (Z683647, Sigma-Aldrich,USA). To ensure equal pull on each sampling point, 6× 4×4 cm HDPE spacers were fabricated and placed within the sy-ringe body and piston. Only samples from time steps of 0, 21,42, 63, 84 and 120 days were analyzed. After the experimentended, the cores were frozen, then sliced to∼ 2 cm thick sec-tions using a band saw. Sections were measured with cal-lipers, weighed and placed in pre-weighed, food-grade andheat-resistant bags. The slices were than thawed and ultra-pure water, twice the weight of the slice, was added to ex-tract the solutes and placed on a table shaker (MaxQ 3000,Thermo Fisher Scientific) for 48 h. All samples were frozenuntil analyzed for Na+ and Cl− via IC at the Biogeochem-istry Laboratory at the University of Waterloo (DIONEX ICS3000, IonPac AS18 and CS16 analytical columns). Resultswere adjusted to account for the dilution effect of the addedwater.
2.4.2 Numerical simulations and sensitivity analyses
The steady-state unsaturated evaporation experiment with so-lute transport was simulated with HYDRUS-1-D (Simuneket al., 2008), which numerically solves Richard’s equationfor water flow and the solute transport equations. For the wa-ter flow, the soil hydraulic properties are the necessary inputand were parameterized with a unimodal van Genuchten–Mualem equation using data collected in the tension disk ex-periments and transient evaporation experiments. The modeldomain represented the 23 cm high column with a spatial dis-cretization of 0.5 cm.
The lower boundary condition for the water flow wasat constant zero pressure representing the water table. Theupper boundary condition was a flux boundary based on mea-sured evaporation rates. For the solute transport, the lowerboundary was a fixed concentration in the liquid phase andthe upper boundary condition was a zero flux. To accountfor the soil solution sampling (that would otherwise lead toa misrepresentation of water flow and solute transport), weused the root water uptake function in HYDRUS by specify-ing an individual root at the height of each of the four Rhizonsamplers. The applied root water uptake model (Feddes et al.,1978) assumes no salinity stress, no pressure-dependent re-duction of given water uptake quantity and a quasi-infinitemaximum allowed concentration for passive root solute up-take. The total water volume extracted per sampling day wastaken to be equal at each root node.
Dispersion is dependent on the average linear velocity,which in turn is dependent on the water content (Perkinsand Johnston, 1963). To date, HYDRUS does not accountfor a water content dependency of dispersion (D(θ )) in so-lute transport modeling. Also, this information is not avail-able from the saturated experiment. Therefore, a sensitivityanalysis of D on the model response was done to approx-imate its quantitative influence on the solute transport. To
SOIL, 4, 63–81, 2018 www.soil-journal.net/4/63/2018/

R. B. Simhayov et al.: Saturated and unsaturated salt transport in fen peat 69
Table 1. Soil physical and hydraulic properties of prepared peat cores from different experiments. Values are averages; percentages inbrackets are the coefficients of variation. Porosity was calculated using particle density for the constructed fen peat from Ketcheson (2015).
Type of experiment n ρB Ks Porosity(gcm−3) (cmd−1) (–)
Saturated breakthrough 3 0.12 (1.7 %) 99.7 (2.1 %) 0.93 (1.3 %)Unsaturated columns 6 0.12 (4.1 %) 0.93 (2.8 %)Retention 4 0.12 (3.3 %) 0.93 (2.3 %)
Figure 3. Soil water retention and hydraulic conductivity curves with measurement results of the transient evaporation experiments (EEts)and tension disk experiments (TDEs) and parameterizations for the unimodal van Genuchten–Mualem model. Negative pressure was usedfor the retention experiment.
gauge the range of values for the sensitivity analysis, a cal-culation of the change in D was performed using data gath-ered from the unsaturated columns. The calculation used theequation forD in capillary flow under unsaturated conditionsin soils as a function of v, by Fried and Combarnous (1971)(not shown). The equation connects D to changes in watercontent and allows the calculation of changes in D due tomeasured changes in water content. Comparison of the cal-culated values provided with a range of change in D. Calcu-lations indicated that the change inD ranged from 8 to 15 %.Therefore, to add extra range, the sensitivity analysis for theHYDRUS model was performed using±20 % and a±100 %change in D.
3 Results and discussion
3.1 Soil physical properties
The bulk density and porosity of the prepared peat sam-ples in the various experiments was similar (Table 1), indi-cating a successful sample replication. The retention curve(Fig. 3) does not have the classical shape that would pointat discrimination between an active and inactive porosity(Rezanezhad et al., 2016; Weber et al., 2017b). Measuredwater retention and hydraulic conductivity data closely fit thevan Genuchten–Mualem unimodal model with an RMSE of0.03 and AICc value of −342 (Fig. 3; Table 2). Furthermore,the estimated Ks value of the unimodal fit (106 cmd−1; Ta-ble 2) is similar to the measured value (100 cmd−1; Table 1).
www.soil-journal.net/4/63/2018/ SOIL, 4, 63–81, 2018
70 R. B. Simhayov et al.: Saturated and unsaturated salt transport in fen peat
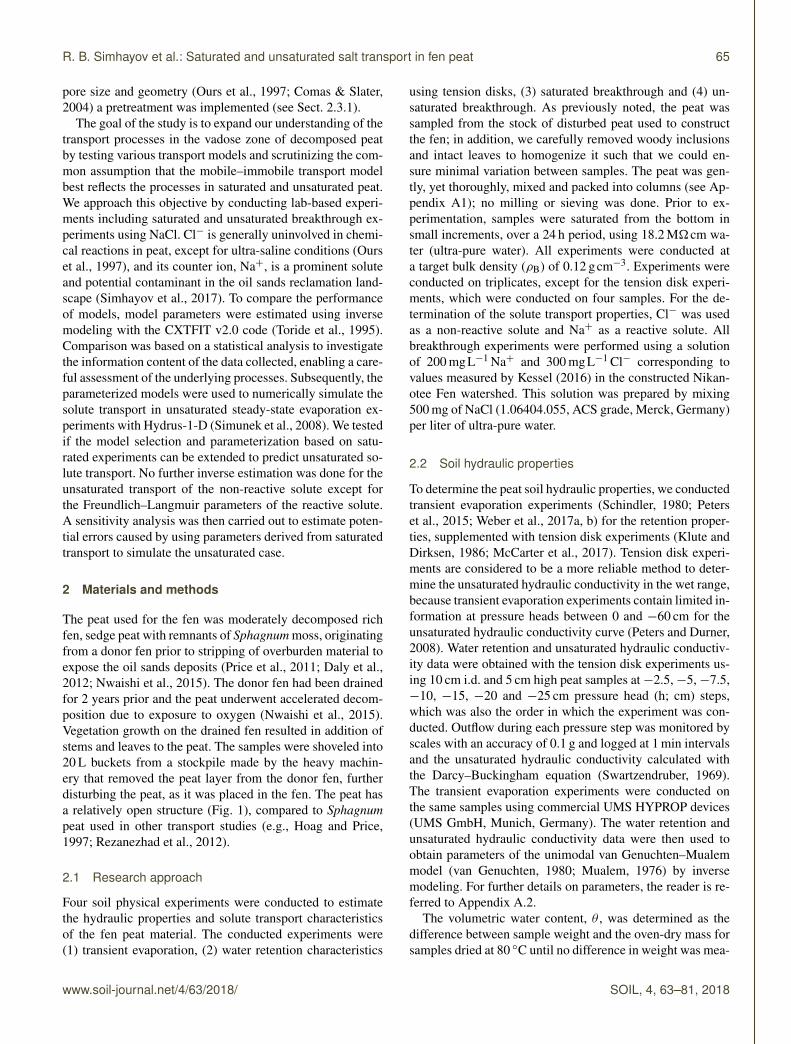
Table 2. Parameter results for the soil hydraulic properties function of the unimodal (uni) model saturation function; the parameter namesare explained in the text.
Model θr θs a1 n1 Ks τ w2 a2 n2 np RMSE θ (h) RMSE log10K(h) AICc(–) (–) (cm−1) (–) (cmd−1) (–) (–) (cm−1) (–) (–) (–) (cmd−1) (–)
Uni 0 0.93 0.015 1.6 106 10 – – – 5 0.03 0.19 −342
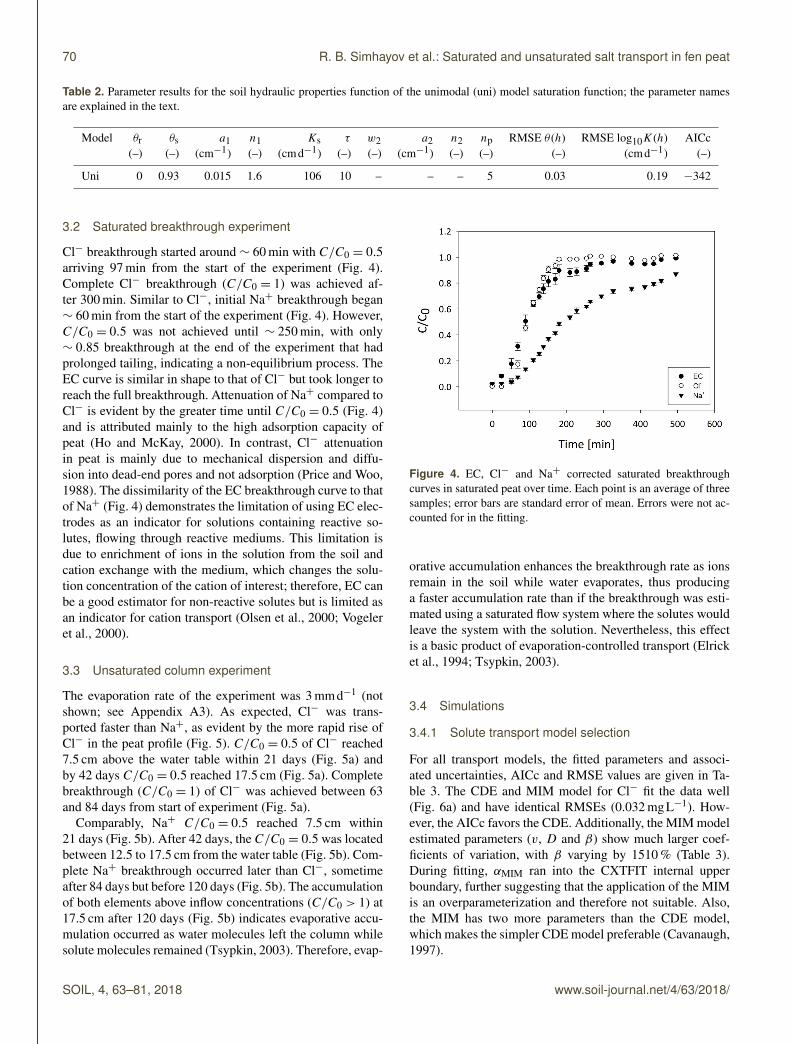
3.2 Saturated breakthrough experiment
Cl− breakthrough started around ∼ 60 min with C/C0 = 0.5arriving 97 min from the start of the experiment (Fig. 4).Complete Cl− breakthrough (C/C0 = 1) was achieved af-ter 300 min. Similar to Cl−, initial Na+ breakthrough began∼ 60 min from the start of the experiment (Fig. 4). However,C/C0 = 0.5 was not achieved until ∼ 250 min, with only∼ 0.85 breakthrough at the end of the experiment that hadprolonged tailing, indicating a non-equilibrium process. TheEC curve is similar in shape to that of Cl− but took longer toreach the full breakthrough. Attenuation of Na+ compared toCl− is evident by the greater time until C/C0 = 0.5 (Fig. 4)and is attributed mainly to the high adsorption capacity ofpeat (Ho and McKay, 2000). In contrast, Cl− attenuationin peat is mainly due to mechanical dispersion and diffu-sion into dead-end pores and not adsorption (Price and Woo,1988). The dissimilarity of the EC breakthrough curve to thatof Na+ (Fig. 4) demonstrates the limitation of using EC elec-trodes as an indicator for solutions containing reactive so-lutes, flowing through reactive mediums. This limitation isdue to enrichment of ions in the solution from the soil andcation exchange with the medium, which changes the solu-tion concentration of the cation of interest; therefore, EC canbe a good estimator for non-reactive solutes but is limited asan indicator for cation transport (Olsen et al., 2000; Vogeleret al., 2000).
3.3 Unsaturated column experiment
The evaporation rate of the experiment was 3 mmd−1 (notshown; see Appendix A3). As expected, Cl− was trans-ported faster than Na+, as evident by the more rapid rise ofCl− in the peat profile (Fig. 5). C/C0 = 0.5 of Cl− reached7.5 cm above the water table within 21 days (Fig. 5a) andby 42 days C/C0 = 0.5 reached 17.5 cm (Fig. 5a). Completebreakthrough (C/C0 = 1) of Cl− was achieved between 63and 84 days from start of experiment (Fig. 5a).
Comparably, Na+ C/C0 = 0.5 reached 7.5 cm within21 days (Fig. 5b). After 42 days, the C/C0 = 0.5 was locatedbetween 12.5 to 17.5 cm from the water table (Fig. 5b). Com-plete Na+ breakthrough occurred later than Cl−, sometimeafter 84 days but before 120 days (Fig. 5b). The accumulationof both elements above inflow concentrations (C/C0 > 1) at17.5 cm after 120 days (Fig. 5b) indicates evaporative accu-mulation occurred as water molecules left the column whilesolute molecules remained (Tsypkin, 2003). Therefore, evap-
Figure 4. EC, Cl− and Na+ corrected saturated breakthroughcurves in saturated peat over time. Each point is an average of threesamples; error bars are standard error of mean. Errors were not ac-counted for in the fitting.
orative accumulation enhances the breakthrough rate as ionsremain in the soil while water evaporates, thus producinga faster accumulation rate than if the breakthrough was esti-mated using a saturated flow system where the solutes wouldleave the system with the solution. Nevertheless, this effectis a basic product of evaporation-controlled transport (Elricket al., 1994; Tsypkin, 2003).
3.4 Simulations
3.4.1 Solute transport model selection
For all transport models, the fitted parameters and associ-ated uncertainties, AICc and RMSE values are given in Ta-ble 3. The CDE and MIM model for Cl− fit the data well(Fig. 6a) and have identical RMSEs (0.032 mgL−1). How-ever, the AICc favors the CDE. Additionally, the MIM modelestimated parameters (v, D and β) show much larger coef-ficients of variation, with β varying by 1510 % (Table 3).During fitting, αMIM ran into the CXTFIT internal upperboundary, further suggesting that the application of the MIMis an overparameterization and therefore not suitable. Also,the MIM has two more parameters than the CDE model,which makes the simpler CDE model preferable (Cavanaugh,1997).
SOIL, 4, 63–81, 2018 www.soil-journal.net/4/63/2018/
R. B. Simhayov et al.: Saturated and unsaturated salt transport in fen peat 71
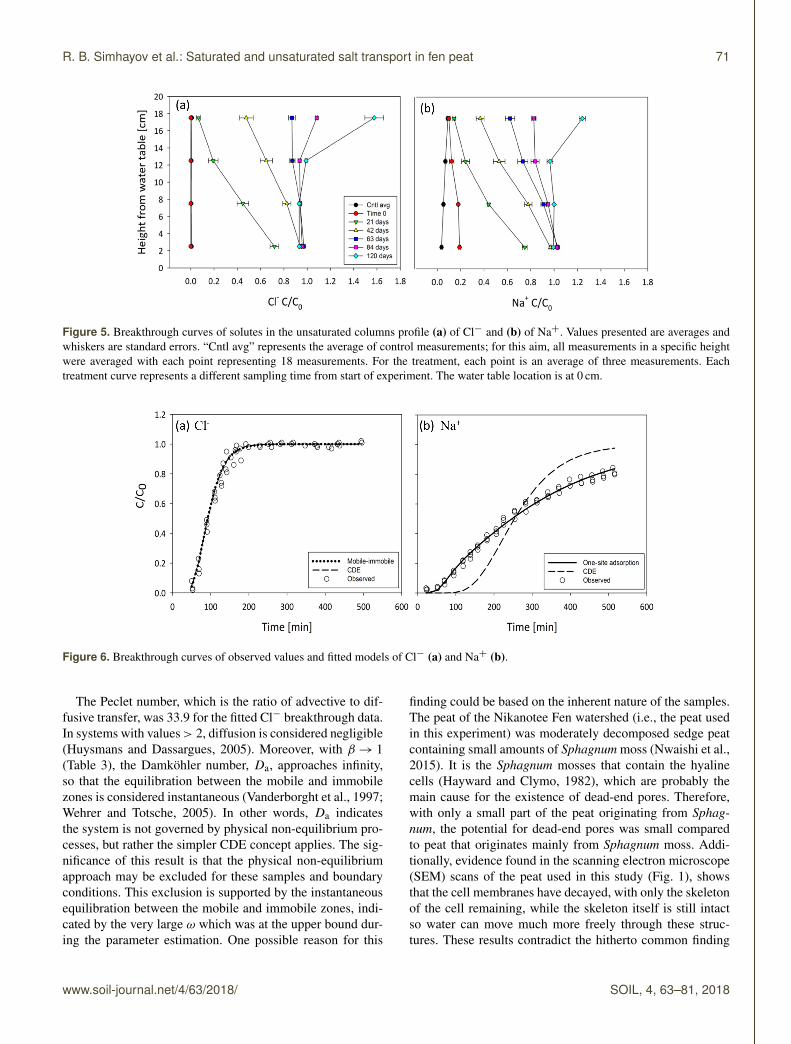
Figure 5. Breakthrough curves of solutes in the unsaturated columns profile (a) of Cl− and (b) of Na+. Values presented are averages andwhiskers are standard errors. “Cntl avg” represents the average of control measurements; for this aim, all measurements in a specific heightwere averaged with each point representing 18 measurements. For the treatment, each point is an average of three measurements. Eachtreatment curve represents a different sampling time from start of experiment. The water table location is at 0 cm.
Figure 6. Breakthrough curves of observed values and fitted models of Cl− (a) and Na+ (b).
The Peclet number, which is the ratio of advective to dif-fusive transfer, was 33.9 for the fitted Cl− breakthrough data.In systems with values> 2, diffusion is considered negligible(Huysmans and Dassargues, 2005). Moreover, with β→ 1(Table 3), the Damköhler number, Da, approaches infinity,so that the equilibration between the mobile and immobilezones is considered instantaneous (Vanderborght et al., 1997;Wehrer and Totsche, 2005). In other words, Da indicatesthe system is not governed by physical non-equilibrium pro-cesses, but rather the simpler CDE concept applies. The sig-nificance of this result is that the physical non-equilibriumapproach may be excluded for these samples and boundaryconditions. This exclusion is supported by the instantaneousequilibration between the mobile and immobile zones, indi-cated by the very large ω which was at the upper bound dur-ing the parameter estimation. One possible reason for this
finding could be based on the inherent nature of the samples.The peat of the Nikanotee Fen watershed (i.e., the peat usedin this experiment) was moderately decomposed sedge peatcontaining small amounts of Sphagnum moss (Nwaishi et al.,2015). It is the Sphagnum mosses that contain the hyalinecells (Hayward and Clymo, 1982), which are probably themain cause for the existence of dead-end pores. Therefore,with only a small part of the peat originating from Sphag-num, the potential for dead-end pores was small comparedto peat that originates mainly from Sphagnum moss. Addi-tionally, evidence found in the scanning electron microscope(SEM) scans of the peat used in this study (Fig. 1), showsthat the cell membranes have decayed, with only the skeletonof the cell remaining, while the skeleton itself is still intactso water can move much more freely through these struc-tures. These results contradict the hitherto common finding
www.soil-journal.net/4/63/2018/ SOIL, 4, 63–81, 2018

72 R. B. Simhayov et al.: Saturated and unsaturated salt transport in fen peat
Table 3. Estimated saturated transport parameters and the models’ goodness of fit data. “n/a” – not applicable; N/E – not evaluated: theparameter is at the upper feasible bound of the parameter estimation. Toride et al. (1995) estimated values are presented with coefficient ofvariation as percentages in brackets; the parameters are explained in the text.
Solute Model v D R β ω α RMSE AICc(cmmin−1) (cm2 min−1) – – (–) (min−1) (mgL−1) (–)
Cl− MIM 9.81× 10⁻² 6.66× 10⁻² fixed to 1 1.00 100a 0.9 0.032 −406(91 %) (19 %) (1510 %) (N/E) (N/E)
CDE 9.79× 10⁻² 6.66× 10⁻² fixed to 1 n/a n/a n/a 0.032 −408(1 %) (7 %)
Na+ CDE fixed fixed 2.65 n/a n/a n/a 0.145 −229(3 %)
OSA fixed fixed 3.07 n/a 0.5b 1.12× 10⁻³ 0.024 −443(1 %) (3 %) (3 %)
a ωMIM = α×L/(θ × v).b ωOSA = (α (R− 1)×L)/v.
Figure 7. Observed values (Obs) from the unsaturated column experiment vs. simulated values (Sim) of (a) Cl− and (b) Na+. Observedvalues are averages and standard error; n= 3. T stands for time, and the number that follows is the number of days. Extract T120 representsvalues measured via extraction as part of post-experiment processing. Depth of 0 cm marks the top of the column. The dashed reference linemarks C/C0 = 0.5.
in laboratory studies that breakthrough experiments on peatneed to be described by the MIM (Hoag and Price, 1997;Rezanezhad et al., 2012; Liu et al., 2016; Rezanezhad et al.,2017; Thiemeyer et al., 2017). Additionally, this finding isreflected in the fact that a multimodal retention curve wasnot observable, which would have been indicative for a two-domain flow of solute transport.
Since the CDE model provides a good description of thesaturated Cl− breakthrough, physical non-equilibrium can beneglected as the underlying process (Table 3; Fig. 6b). There-fore, the non-equilibrium effect observed in the Na+ break-through (Fig. 6b) must be due to chemical processes such asan interaction of Na+ ions with negatively charged sites onthe peat surface. Having shown that the MIM is not parsi-monious in its parameters, the robust estimates of v and Dfor the CDE were fixed when fitting the remaining model pa-
rameters of the CDE and one-site adsorption model for Na+.First, the CDE was fitted with R to the Na+ data; the re-sulting curve shows that equilibrium adsorption does not fit(Fig. 6b). In comparison, the one-site adsorption model fitwell (Fig. 6b) and had a lower RMSE and a considerablylower AICc value (Table 3). Based on the estimated R valueof the one-site adsorption model, the Kd value of Na+ was15.6 Lkg−1. The parameters from the CDE for Cl− and fromone-site adsorption for Na+ were then used for the HYDRUSsimulation of the unsaturated columns.
3.4.2 Unsaturated column simulations and sensitivityanalyses
The HYDRUS predictions of solute concentrations at thefour observation points were good for both solutes (Fig. 7),even though the solute transport model parameterization was
SOIL, 4, 63–81, 2018 www.soil-journal.net/4/63/2018/
R. B. Simhayov et al.: Saturated and unsaturated salt transport in fen peat 73
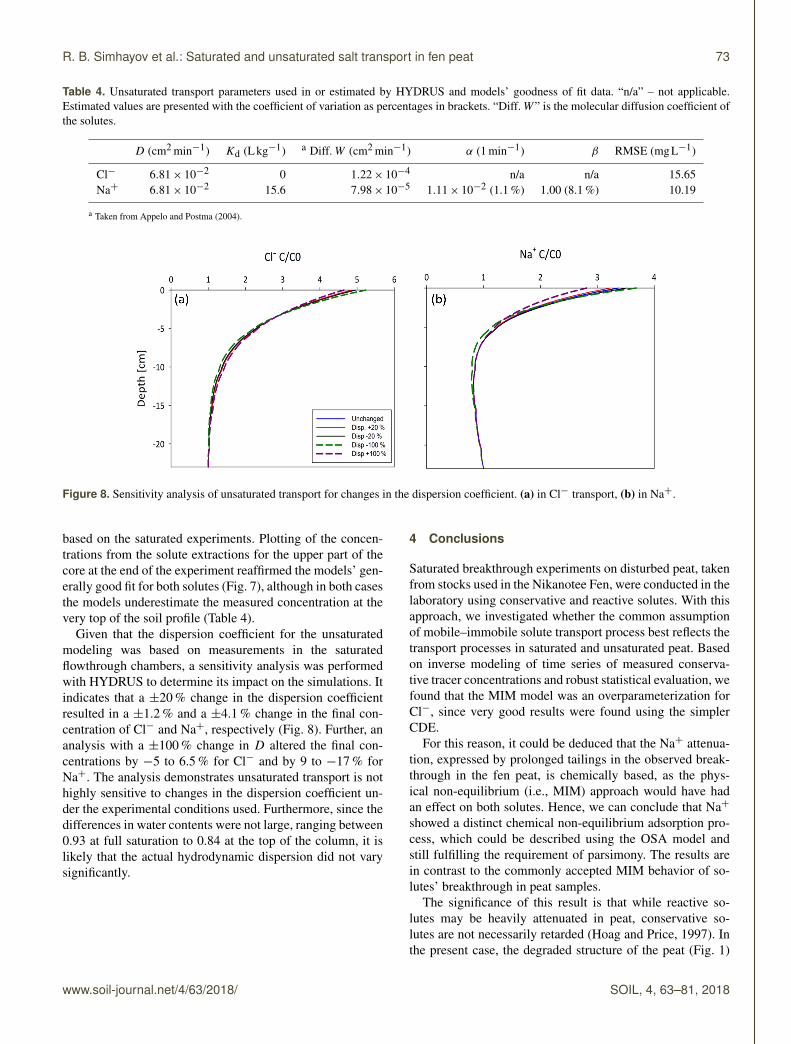
Table 4. Unsaturated transport parameters used in or estimated by HYDRUS and models’ goodness of fit data. “n/a” – not applicable.Estimated values are presented with the coefficient of variation as percentages in brackets. “Diff.W” is the molecular diffusion coefficient ofthe solutes.
D (cm2 min−1) Kd (Lkg−1) a Diff.W (cm2 min−1) α (1 min−1) β RMSE (mgL−1)
Cl− 6.81× 10⁻² 0 1.22× 10⁻⁴ n/a n/a 15.65Na+ 6.81× 10⁻² 15.6 7.98× 10⁻⁵ 1.11× 10⁻² (1.1 %) 1.00 (8.1 %) 10.19
a Taken from Appelo and Postma (2004).
Figure 8. Sensitivity analysis of unsaturated transport for changes in the dispersion coefficient. (a) in Cl− transport, (b) in Na+.
based on the saturated experiments. Plotting of the concen-trations from the solute extractions for the upper part of thecore at the end of the experiment reaffirmed the models’ gen-erally good fit for both solutes (Fig. 7), although in both casesthe models underestimate the measured concentration at thevery top of the soil profile (Table 4).
Given that the dispersion coefficient for the unsaturatedmodeling was based on measurements in the saturatedflowthrough chambers, a sensitivity analysis was performedwith HYDRUS to determine its impact on the simulations. Itindicates that a ±20 % change in the dispersion coefficientresulted in a ±1.2 % and a ±4.1 % change in the final con-centration of Cl− and Na+, respectively (Fig. 8). Further, ananalysis with a ±100 % change in D altered the final con-centrations by −5 to 6.5 % for Cl− and by 9 to −17 % forNa+. The analysis demonstrates unsaturated transport is nothighly sensitive to changes in the dispersion coefficient un-der the experimental conditions used. Furthermore, since thedifferences in water contents were not large, ranging between0.93 at full saturation to 0.84 at the top of the column, it islikely that the actual hydrodynamic dispersion did not varysignificantly.
4 Conclusions
Saturated breakthrough experiments on disturbed peat, takenfrom stocks used in the Nikanotee Fen, were conducted in thelaboratory using conservative and reactive solutes. With thisapproach, we investigated whether the common assumptionof mobile–immobile solute transport process best reflects thetransport processes in saturated and unsaturated peat. Basedon inverse modeling of time series of measured conserva-tive tracer concentrations and robust statistical evaluation, wefound that the MIM model was an overparameterization forCl−, since very good results were found using the simplerCDE.
For this reason, it could be deduced that the Na+ attenua-tion, expressed by prolonged tailings in the observed break-through in the fen peat, is chemically based, as the phys-ical non-equilibrium (i.e., MIM) approach would have hadan effect on both solutes. Hence, we can conclude that Na+
showed a distinct chemical non-equilibrium adsorption pro-cess, which could be described using the OSA model andstill fulfilling the requirement of parsimony. The results arein contrast to the commonly accepted MIM behavior of so-lutes’ breakthrough in peat samples.
The significance of this result is that while reactive so-lutes may be heavily attenuated in peat, conservative so-lutes are not necessarily retarded (Hoag and Price, 1997). Inthe present case, the degraded structure of the peat (Fig. 1)
www.soil-journal.net/4/63/2018/ SOIL, 4, 63–81, 2018
74 R. B. Simhayov et al.: Saturated and unsaturated salt transport in fen peat
eliminated many of the enclosed spaces commonly visiblein less decomposed Sphagnum peat (see Hoag and Price,1997; Rezanezhad et al., 2016). Measured water retentiondata were adequately described using a unimodal expres-sion for the underlying pore size distribution, corroboratingthe finding that a physical dual porosity structure was notpresent. On a side note, we can attest that the use of EC asan indirect measurement for a reactive solute will result inoverestimation of breakthrough if the solute interacts withthe solid phase.
This research implies that automatically assuming mobileand immobile regions in peat is incorrect. The sedge peatwith remnants of Sphagnum moss used in this experimenthad relatively few dead-end pores, due to the low content ofSphagnum moss with intact hyaline cells. Furthermore, evi-dence suggests that the peat used has decayed enough to losethe cell membranes but not enough to break the cell skele-ton and is likely why the peat lacks the classically assumedMIM regions. The decomposition may have been enhancedby aeration of the peat in the donor fen (Nwaishi et al., 2015).Although we acknowledge that any manipulation of a sam-ple alters it, the prior disturbance (see introduction of the“Materials and methods” section) is likely to have had a sig-nificantly greater impact. Furthermore, the peat was not ma-nipulated in a destructive manner such as sieving or milling,and was handled carefully. The reduced inter-sample vari-ability caused by the careful homogenization of the peat im-proved the certainty in our results and thus our ability to un-derstand the hydraulic properties of the peat. Additionally, itis concluded that transport parameters gathered in saturatedbreakthrough experiments can be used to simulate transportin slightly unsaturated media under near steady-state condi-tions. Data gathered show that the accumulation of solutesvia evaporation causes concentration to rise quickly abovethe initial concentration. While these results are valid forthe described boundary conditions and initial conditions, the
fate of salt accumulation is not clear under more natural con-ditions such as complex meteorological evapotranspiration–precipitation cycles with, for example, surface inundationand overland flow export of solutes. Additionally, differentsalt concentration levels at the lower boundary of the exper-iment were not investigated, which has been documented inthe case of the Nikanotee Fen watershed (Kessel, 2016). Asa first assessment of the effect D has on salt accumulation,a synthetic parameter sensitivity analysis was carried out forNa+. To further understand the rates of the evaporative accu-mulation, a more complex numerical transport model shouldbe used, including flushing due to precipitation and runoff,using the parameters reported in this study along with var-ious weather scenarios. Considering the complex hydraulicretention and conductivity properties of Sphagnum mossesand peat, it is conceivable that a wide range of tested watercontents could affect the choice of the underlying transportprocess. Additionally, the experiment was carried out understeady-state conditions, unlike the complex meteorologicalpatterns in the field. Furthermore, the implications for recla-mation projects are that if one of the goals is to enhance so-lute attenuation, the origin and composition of the peat, itswater retention properties along with its decomposition stateshould be characterized, as not all peats will perform equally.Hence, from the industry perspective, if solute attenuation isthe goal, then peat with a larger amount of Sphagnum anda confirmed dual porosity structure would be a better choice.Finally, our findings imply that MIM should not be automat-ically assumed for solute transport in peat but rather shouldbe evidence based.
Data availability. The data can be made available upon request [email protected].
SOIL, 4, 63–81, 2018 www.soil-journal.net/4/63/2018/

R. B. Simhayov et al.: Saturated and unsaturated salt transport in fen peat 75
Appendix A
A1 Pictures of saturated and unsaturated experiments
A2 Soil hydraulic properties
A2.1 Measurements of water retention properties
The tension disk experiment (TDE) was conducted on 10 cmi.d. and 5 cm high peat samples at seven different pressuresteps under unsaturated unit gradient vertical flow conditionsusing a tension disk apparatus that used 15 µm Nytex screensto prevent air entry below the air entry pressure (∼ 35 cm)(Price et al., 2008; McCarter et al., 2017). Samples were ini-tially saturated for 48 h and two layers of cheese cloth cov-ered the top and bottom of the sample to maintain the in-tegrity of the surfaces. The pressure steps (h; cm) were−2.5,−5, −7.5, −10, −15, −20 and −25 cm, which was also theorder in which the experiment was conducted. During theexperiment, outflow was monitored for each pressure stepby a scale with an accuracy of at least 0.1 g and logged at1 min intervals. The experiment stopped when there was nochange from past measurements over a 30 min period. Aftereach step, the weight of the sample was determined to en-able calculation of the water content. From the outflow, theunsaturated hydraulic conductivity was calculated from theDarcy–Buckingham equation (Swartzendruber, 1969).
Saturated hydraulic conductivity
The flowthrough columns (FTCs) were used for the determi-nation of the saturated conductivity (Ks; cmd−1), too, whichwere connected to a Marriot bottle supplying a constant pres-sure head. The adopted method was a constant head test(Freeze and Cherry, 1979) with a gradient of 0.44. Once theoutflow stabilized, it was measured in a 250 mL glass gradu-ated cylinder (S63459, Fischer Scientific, USA) every 2 minover 20 min.
Transient evaporation experiment
The transient evaporation experiment (EEt) was conductedon the same samples as the TDE with a 0 cm pressure headat the bottom prior to the beginning of the EEt with the com-mercial UMS HYPROP device (UMS GmbH, Munich, Ger-many). The samples had a larger diameter than the UMSHYPROP device so that Plexiglas screens were used at thebottom to seal and prop the sample. The pressure head wasdirectly measured in the middle of the sample, and thus di-rectly related to the calculated water content to obtain theretention information, which is a valid approximation at ornear a linear pressure distribution (Becher, 1971). Hence, theevaluation for conductivity is not reliable.
Inverse fitting of soil hydraulic properties
The water retention and unsaturated hydraulic conductivitydata were used to parameterize soil hydraulic property (SHP)models. We used the unimodal van Genuchten–Mualemmodel combination (van Genuchten, 1980; Mualem, 1976).We used the analytical expression derived by Priesack andDurner (2006). The soil water retention function is given by
θ (h)= θr+ (θs− θr)0(h), (A1)
where θr is the residual, θs the saturated water content(cm3 cm−3) and 0(h) (–) the effective saturation given by
0(h)=∑k
i=10i(h)=
∑k
i=1wi[1+ (−αih)ni
]mi , (A2)
where wi is a weighting coefficient between the modal poresize distributions, αi (cm−1) and ni (–) are shape parame-ters with constraining and mi = 1− 1/ni . The unimodal vanGenuchten saturation function is obtained by k = 1. The un-saturated hydraulic conductivity is expressed as
K (0)=Ks0τ
(k∑i=1
wiαi
)−2
(A3)
×
(k∑i=1
wiαi
[1−
(1− (0)1/mi
)mi])2
,
where Ks is the saturated hydraulic conductivity (cmd−1)and τ is sometimes referred to as a tortuosity constant, whichshould be positive.
All parameters were estimated except for θs, which was setto 0.925, i.e., the porosity value. Estimation was done in Rv3.2.1 (R Core Team, 2015) with implementation of the dif-ferential evolution optimizer to minimize the sum of squarederrors for the retention and hydraulic conductivity curves(Mullen et al., 2011). The estimation of the soil hydraulicproperties of the fen peat by inverse estimation was done asdescribed in Peters and Durner (2008). After all procedureswere concluded, bulk densities for all samples were deter-mined gravimetrically based on an oven-dry mass basis forsamples dried at 80 ◦C until no difference in weight was mea-sured (Gardner, 1986). From knowledge of the dry weightand experimental system weight, water contents could be cal-culated for the soil hydraulic properties.
A2.2 Statistical parameters
The RMSE is used as a metric to describing the model pre-diction quality, such that
RMSE=
√√√√ 1m
m∑l=1
(yl − yl
)2, (A4)
where m is the number of observations, yl is the observedand yl the model predicted value (solute concentration,
www.soil-journal.net/4/63/2018/ SOIL, 4, 63–81, 2018

76 R. B. Simhayov et al.: Saturated and unsaturated salt transport in fen peat
Figure A1. Pictures from saturated transport experiment: (a) cleaning and mixing the peat; (b) flowthrough cell plates (the green pad isbelow the sample, redistributing the water beneath it); (c) packing cell with peat; and (d) flowthrough experiment setup (cells are connectedto a pump drawing the solution from a container on a magnetic stirrer).
Figure A2. Pictures from the unsaturated transport experiment: (a) columns with peat (note the laptop for scale); (b) Marriot bottles andpumps; (c) columns connected and instrumented (blue caps are the soil pore-water samplers; large tubes are the tensiometers); and (d) sliceof a peat column before extraction at the end of the experiment.
water content or hydraulic conductivity). The AICc (Yeet al., 2008) was also used as a method of model compari-son where the model with the smallest AICc is to be favored.Applications so soil hydrological model testing can be found
in Weber et al. (2017a, b).
AICc=m ln
(1m
m∑l=1
(yl − yl
)2)+ 2np (A5)
+ 2np(np+ 1)m− np− 1
+C,
SOIL, 4, 63–81, 2018 www.soil-journal.net/4/63/2018/
R. B. Simhayov et al.: Saturated and unsaturated salt transport in fen peat 77
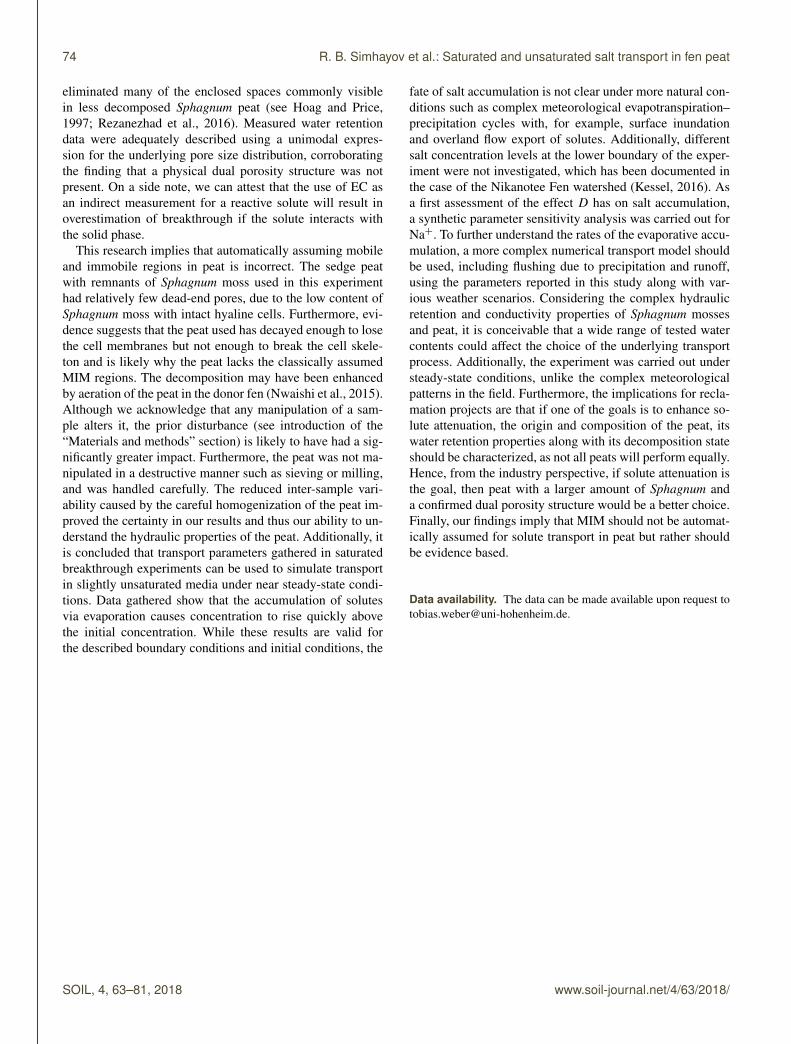
Figure A3. Measured temperature and relative humidity during theunsaturated column experiment. Each point is a daily average of144 measurements and corresponding standard error.
where np is the number of parameters of a respective model.Estimation of model parameters was done by minimizing
the sum of squared errors for the retention and hydraulic con-ductivity curves in R.3.2.1 (R Core Team, 2015) with an im-plementation of the differential evolution optimizer (Mullenet al., 2011) by adopting the multi-objective function as de-scribed in Peters and Durner (2008).
A3 Unsaturated experiment conditions
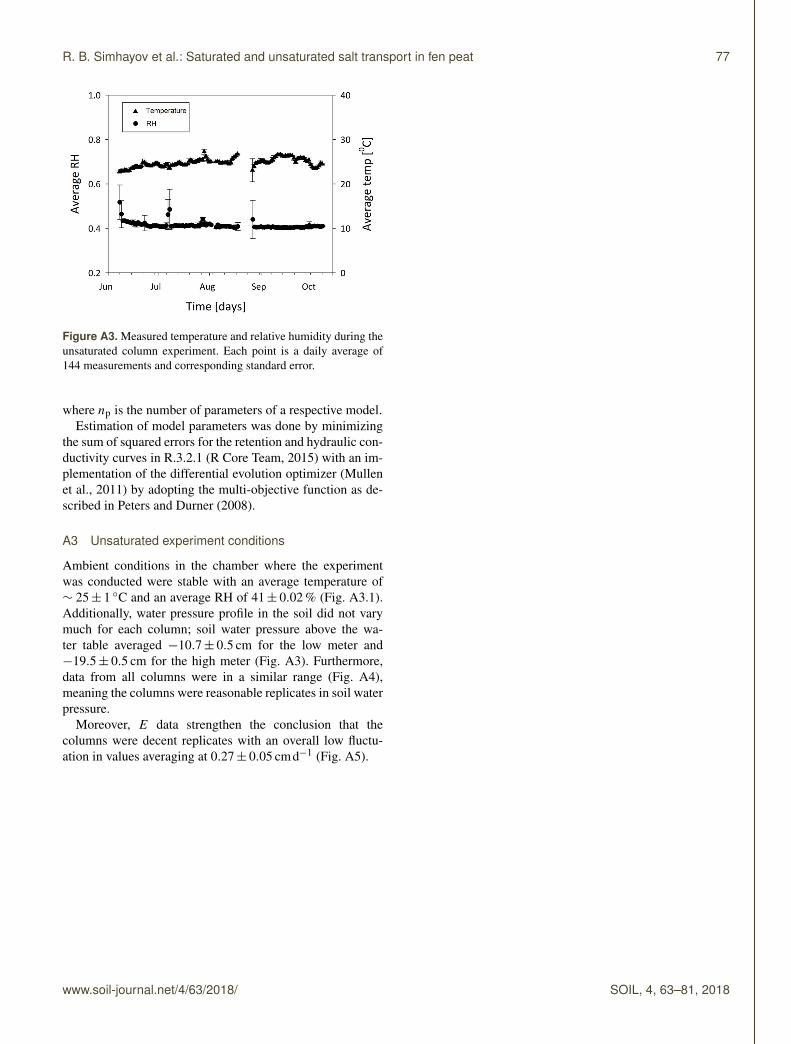
Ambient conditions in the chamber where the experimentwas conducted were stable with an average temperature of∼ 25± 1 ◦C and an average RH of 41± 0.02 % (Fig. A3.1).Additionally, water pressure profile in the soil did not varymuch for each column; soil water pressure above the wa-ter table averaged −10.7± 0.5 cm for the low meter and−19.5± 0.5 cm for the high meter (Fig. A3). Furthermore,data from all columns were in a similar range (Fig. A4),meaning the columns were reasonable replicates in soil waterpressure.
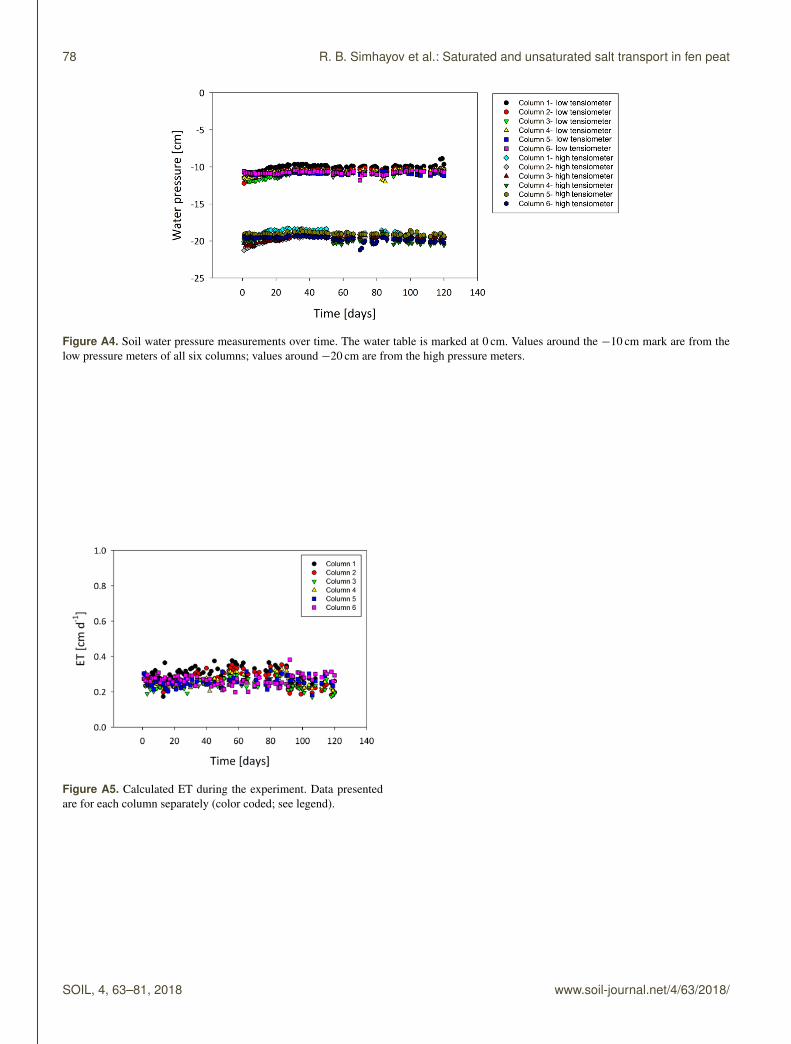
Moreover, E data strengthen the conclusion that thecolumns were decent replicates with an overall low fluctu-ation in values averaging at 0.27± 0.05 cmd−1 (Fig. A5).
www.soil-journal.net/4/63/2018/ SOIL, 4, 63–81, 2018
78 R. B. Simhayov et al.: Saturated and unsaturated salt transport in fen peat
Figure A4. Soil water pressure measurements over time. The water table is marked at 0 cm. Values around the −10 cm mark are from thelow pressure meters of all six columns; values around −20 cm are from the high pressure meters.
Figure A5. Calculated ET during the experiment. Data presentedare for each column separately (color coded; see legend).
SOIL, 4, 63–81, 2018 www.soil-journal.net/4/63/2018/
R. B. Simhayov et al.: Saturated and unsaturated salt transport in fen peat 79
Competing interests. The authors declare that they have no con-flict of interest.
Acknowledgements. The authors would like to thank HarmenVander Heide, Dan Beaver, Andrew Urschel, Scott Ketcheson, EricKessel, Tasha-Leigh Gauthier, James Sherwood, Corey Wells andVito Lam for their help with logistics, fabrication and analysis.Additionally, the authors thank Mazda Kompanizare, BehradGharedaghloo, Fereidoun Rezanezhad and Sascha Christian Idenfor their advice. Funding from the following sources is gratefullyacknowledged: Natural Science and Engineering Research CouncilCollaborative Research and Development (NSERC-CRD), SuncorEnergy Inc., Shell Canada Limited and Esso Imperial Oil Limitedand the German Academic Exchange Service.
Edited by: David DunkerleyReviewed by: two anonymous referees
References
Appelo, C. A. J. and Postma, D.: Geochemistry, Groundwater andPollution, CRC press, Belkama, Rotterdam, the Netherlands,2004.
Becher, H. H.: Ein Verfahren zur Messung der ungesättigtenWasserleitfähigkeit, J. Plant Nutr. Soil Sc., 128, 1–12, 1971.
Cameron, D. R. and Klute, A.: Convective-dispersive solute trans-port with a combined equilibrium and kinetic adsorption model,Water Resour. Res., 13, 183–188, 1977.
Cavanaugh, J. E.: Unifying the derivations of the Akaike and cor-rected Akaike information criteria, Stat. Probabil. Lett., 31, 201–208, 1997.
Clymo, R. S.: Peat, in: Mires, Swamp, Bog, Fen and Moor, GeneralStudies (Ecosystem of the World 4A), edited by: Gore, A. J. P.,Elsevier, Amsterdam, 159–224, 1983.
Coats, K. H. and Smith, B. D.: Dead-end pore volume and disper-sion in porous media, Soc. Petrol. Eng. J., 4, 73–84, 1964.
Comas, X. and Slater, L.: Low-frequency electrical prop-erties of peat, Water Resour. Res., 40, W12414,https://doi.org/10.1029/2004WR003534, 2004.
Daly, C., Price, J. S., Rezanezhad, F., Pouliot, R., Rochefort, L., andGraf, M.: Initiatives in oil sand reclamation: considerations forbuilding a fen peatland in a post-mined oil sands landscape, in:Restoration and Reclamation of Boreal Ecosystems – AttainingSustainable Development, edited by: Vitt, D. and Bhatti, J. S.,Cambridge University Press, 179–201, 2012.
Elrick, D. E., Mermoud, A., and Monnier, T.: An analysis of so-lute accumulation during steady-state evaporation in an initiallycontaminated soil, J. Hydrol., 155, 27–38, 1994.
Feddes, R. A., Kowalik, P. J., and Zaradny, H.: Simulation of FieldWater Use and Crop Yield, Centre for Agricultural Publishingand Documentation, Wiley, New York, USA, 188 pp., 1978.
Freeze, R. A. and Cherry, J. A.: Groundwater (No. 629.1 F7),Prentice-Hall, The University of Michigan, USA, 604 pp., 1979.
Fried, J. J. and Combarnous, M. A.: Dispersion in porous media,edited by: Chow, V. T., Adv. Hydrosci, 9, Academic Press, NewYork, USA, 169–282, 1971.
Gardner, W. H.: Water content, in: Methods of Soil Analysis: Phys-ical and Mineralogical 29 Methods, edited by: Kiute, A., Agron-omy Series 9 (Part 1), Soil Science Society of America, 30 Madi-son, Wisconsin, 493–544, 1986.
Hayward, M. P. and Clymo, S. R.: Profiles of Water Contentand Pore Size in Sphagnum and Peat, and their Relation toPeat Bog Ecology, P Roy. Soc. Lond. B. Bio., 215, 299–325,https://doi.org/10.1098/rspb.1982.0044, 1982.
Ho, Y. S. and McKay, G.: The kinetics of sorption of divalent metalions onto sphagnum moss peat, Water Res., 34, 735–742, 2000.
Hoag, R. S. and Price, J. S.: The effects of matrix diffusion on so-lute transport and retardation in undisturbed peat in laboratorycolumns, J. Contam. Hydrol., 28, 193–205, 1997.
Huysmans, M. and Dassargues, A.: Review of the use of Pécletnumbers to determine the relative importance of advection anddiffusion in low permeability environments, Hydrogeol. J., 13,895–904, 2005.
Iden, S. C. and Durner, W.: Multiple batch extraction test to esti-mate contaminant release parameters using a Bayesian approach,J. Contam. Hydrol., 95, 168–182, 2008.
Kessel, E.: The hydrogeochemisty of a constructed fen peatland ina post-mined landscape in the Athabasca Oil Sands Region, Al-berta, Canada, M.Sc. Thesis, Department of Geography and En-vironmenal Management, University of Waterloo, Waterloo, ON,Canada, 2016.
Ketcheson, S. J.: Hydrology of a constructed fen watershed in apost-mined landscape in the Athabasca oil sands region, Alberta,Canada, (Doctoral dissertation), University of Waterloo, Water-loo, ON, Canada, 2015.
Klute, A. and Dirksen, C.: Hydraulic conductivity and diffusivity:laboratory methods, in: Methods of Soil Analysis. Part 1. Phys-ical and Mineralogical Methods, 2nd ed, edited by: Klute, A.,Agronomy Monograph., 9. ASA, Madison, WI, 687–734, 1986.
Limpens, J., Berendse, F., Blodau, C., Canadell, J. G., Freeman,C., Holden, J., Roulet, N., Rydin, H., and Schaepman-Strub,G.: Peatlands and the carbon cycle: from local processes toglobal implications – a synthesis, Biogeosciences, 5, 1475–1491,https://doi.org/10.5194/bg-5-1475-2008, 2008.
Liu, H., Janssen, M., and Lennartz, B.: Changes in flow and trans-port patterns in fen peat following soil degradation, Eur. J. SoilSci., 67, 763–772, 2016.
McCarter, C., Ketcheson, S. J., Weber, T. K. D., Whitting-ton, P. N., Scarlett, S., and Price, J. S.: Modified Techniquefor Measuring Unsaturated Hydraulic Conductivity in Sphag-num Moss and Peat., Soil Sci. Soc. Am. J., 81, 747–757,https://doi.org/10.2136/sssaj2017.01.0006, 2017.
Mualem, Y.: A new model for predicting the hydraulic conductivityof unsaturated porous media, Water Resour. Res., 12, 513–522,1976.
Mullen, K., Ardia, D., Gil, D., Windover, D., and Cline, J.: “DE-optim”: An R Package for Global Optimization by DifferentialEvolution, J. Stat. Softw., 40, 1–26, 2011.
Nielsen, D. R., Van Genuchten, M. Th., and Biggar, J.W.: Water flow and solute transport processes in theunsaturated zone, Water Resour. Res., 22, 89S–108S,https://doi.org/10.1029/WR022i09Sp0089S, 1986.
Nkedi-Kizza, P., Biggar, J. W., Selim, H. M., Van Genuchten, M. T.,Wierenga, P. J., Davidson, J. M., and Nielsen, D. R.: On theequivalence of two conceptual models for describing ion ex-
www.soil-journal.net/4/63/2018/ SOIL, 4, 63–81, 2018

80 R. B. Simhayov et al.: Saturated and unsaturated salt transport in fen peat
change during transport through an aggregated oxisol, Water Re-sour. Res., 20, 1123–1130, 1984.
Nkedi-Kizza, P., Brusseau, M. L., Rao, P. S. C., and Hornsby, A. G.:Nonequilibrium sorption during displacement of hydrophobic or-ganic chemicals and calcium-45 through soil columns with aque-ous and mixed solvents, Environ. Sci. Technol., 23, 814–820,1989.
Nwaishi, F., Petrone, R. M., Price, J. S., Ketcheson, S. J., Slaw-son, R., and Andersen, R.: Impacts of donor-peat managementpractices on the functional characteristics of a constructed fen,Ecol. Eng., 81, 471–480, 2015.
Olsen, H., Gui, S., and Lu, N.: Critical review of coupled flow the-ories for clay barriers, Transport Res. Rec., 1714, 57–64, 2000.
Ours, D. P., Siegel, D. I., and Glaser, P. H.: Chemical dilation andthe dual porosity of humified bog peat, J. Hydrol., 196, 348–360,1997.
Parker, J. C. and Valocchi, A.: Constraints on the validity of equi-librium and first-order kinetic transport models in structural soils,Water Resour. Res., 22, 399–407, 1986.
Passioura, J. B.: Hydrodynamic dispersion in aggregated media:1. Theory, Soil Sci., 111, 339–344, 1971.
Perkins, T. K. and Johnston, O. C.: A review of diffusion and dis-persion in porous media, Soc. Petrol. Eng. J., 3, 70–84, 1963.
Peters, A. and Durner, W.: A simple model for describing hy-draulic conductivity in unsaturated porous media accountingfor film and capillary flow, Water Resour. Res., 44, W11417,https://doi.org/10.1029/2008WR007136, 2008.
Peters, A., Iden, S. C., and Durner, W.: Revisiting the simplifiedevaporation method: Identification of hydraulic functions con-sidering vapor, film and corner flow, J. Hydrol., 527, 531–542,https://doi.org/10.1016/j.jhydrol.2015.05.020, 2015.
Philip, J. R.: Diffusion, dead-end pores, and linearized absorptionin aggregated media, Soil Res., 6, 21–30, 1968.
Price, J. S. and Woo, M. K.: Wetlands as waste repositories? Solutetransport in peat, in: Proc. Nat. Student Conference on NorthernStudies, Assoc. of Canadian Universities for Northern Studies,Ottawa, Ont., 18–19 November 1986, 392–395, 1988.
Price, J. S., Whittington, P. N., Elrick, D. E., Strack, M., Brunet,N., and Faux, E.: A method to determine unsaturated hydraulicconductivity in living and undecomposed moss, Soil Sci. Soc.Am. J., 72, 487–491, 2008.
Price, J. S., Rochefort, L., Rezanezhad, F., Pouliot, R., Graf, M. D.,and Andersen, R.: Fen creation in the Athabasca oil sands re-gion, Final Report and Implications, Suncor Energy Inc., 178 pp.,2011.
Priesack, E. and Durner, W.: Closed-form expression for the multi-modal unsaturated conductivity function, Vadose Zone J., 5,121–124, 2006.
R Core Team: R (version 3.1.2): A language and environment forstatistical computing, R Foundation for Statistical Computing,Vienna, Austria, 2014.
Rajendran, A., Kariwala, V., and Farooq, S.: Correction proceduresfor extra-column effects in dynamic column breakthrough exper-iments, Chem. Eng. Sci., 63, 2696–2706, 2008.
Rezanezhad, F., Price, J. S., and Craig, J. R.: The effect of dual-porosity on transport and retardation in peat: a laboratory exper-iment, Can. J. Soil Sci., 92, 1–10, 2012.
Rezanezhad, F., Price, J. S., Quinton, W. L., Lennartz, B., Miloje-vic, T., and Van Cappellen, P.: Structure of peat soils and im-
plications for water storage, flow and solute transport: a reviewupdate for geochemists, Chem. Geol., 419, 75–84, 2016.
Rezanezhad, F., Kleimeier, C., Milojevic, T., Liu, H., WeberT. K. D., Van Cappellen, P., and Lennartz, B.: The Role of PoreStructure on Nitrate Reduction in Peat Soil: A Physical Charac-terization of Pore Distribution and Solute Transport, Wetlands,37, 951–960, https://doi.org/10.1007/s13157-017-0930-4, 2017.
Schindler, U.: Ein Schnellverfahren zur Messung der Wasserleit-fähigkeit im teilgesättigten Boden an Stechzylinderproben, Arch.Acker Pfl. Boden., 24, 1–7, 1980.
Simhayov, R. B., Price, J. S., Smeaton, C. M., Parsons, C.,Rezanezhad, F., and Van Cappellen, P.: Solute pools in Nikan-otee Fen watershed in the Athabasca oil sands region, Environ.Pollut., 225, 150–162, 2017.
Šimunek, J. and van Genuchten, M. T.: Modeling nonequilibriumflow and transport processes using HYDRUS, Vadose Zone J., 7,782–797, 2008.
Šimunek, J., van Genuchten, M. T., and Šejna, M.: Developmentand applications of the HYDRUS and STANMOD softwarepackages and related codes, Vadose Zone J., 7, 587–600, 2008.
Skaggs, T. H. and Leij, F. J.: Chapter 6.3: Solute transport: theoret-ical background, in: Methods of Soil Analysis: Part 4. PhysicalMethods, edited by: Dane, J. H. and Topp, C. G., SSSA, Madi-son, Wisc., 1353–1380, 2002.
Swartzendruber, D.: The flow of water in unsaturated soils, Flowthrough porous media, Academic Press, New York, 215–291,1969.
Tiemeyer, B., Pfaffner, N., Frank, S., Kaiser, K., Fiedler, S.: Porewater velocity and ionic strength effects on DOC release frompeat-sand mixtures: results from laboratory and field experi-ments, Geoderma, 296, 86–97, 2017.
Toride, N., Leij, F. J., and Genuchten, M. T.: A comprehensive setof analytical solutions for nonequilibrium solute transport withfirst-order decay and zero-order production, Water Resour. Res.,29, 2167–2182, 1993.
Toride, N., Leij, F. J., and Van Genuchten, M. T.: The CXTFIT codefor estimating transport parameters from laboratory or filed tracerexperiments, US Salinity Laboratory, Riverside, 1995.
Tsypkin, G. G.: Accumulation and precipitation of salts duringgroundwater evaporation and flow, Fluid Dyn., 38, 900–907,2003.
Vanderborght, J., Mallants, D., Vanclooster, M., and Feyen, J.:Parameter uncertainty in the mobile-immobile solute transportmodel, J. Hydrol., 190, 75–101, 1997.
van Genuchten, M. T. and Wierenga, P. J.: MassTransfer Studies in Sorbing Porous Media I, Ana-lytical Solutions1, Soil Sci. Soc. Am. J. 40, 473,https://doi.org/10.2136/sssaj1976.03615995004000040011x,1976.
Van Genuchten, M. T.: A closed-form equation for predicting thehydraulic conductivity of unsaturated soils, Soil Sci. Soc. Am. J.,44, 892–898, 1980.
Van Genuchten, M. T. and Alves, W. J.: Analytical solutions of theone-dimensional convective-dispersive solute transport equation(No. 157268), United States Department of Agriculture, Eco-nomic Research Service, 1982.
Van Genuchten, M. T. and Wagenet, R. J.: Two-site/two-regionmodels for pesticide transport and degradation: theoretical de-
SOIL, 4, 63–81, 2018 www.soil-journal.net/4/63/2018/

R. B. Simhayov et al.: Saturated and unsaturated salt transport in fen peat 81
velopment and analytical solutions, Soil Sci. Soc. Am. J., 53,1303–1310, 1989.
Van Genuchten, M. T., Davidson, J. M., and Wierenga, P. J.: Anevaluation of kinetic and equilibrium equations for the predic-tion of pesticide movement through porous media, Soil Sci. Soc.Am. J., 38, 29–35, 1974.
Vogeler, I., Duwig, C., Clothier, B. E., and Green, S. R.: A simpleapproach to determine reactive solute transport using time do-main reflectometry, Soil Sci. Soc. Am. J., 64, 12–18, 2000.
Vrugt, J. A. and Dane, J. H.: Inverse modelling of soil hy-draulic properties, Encyclopaedia of Hydrological Sciences, 6,77, https://doi.org/10.1002/0470848944.hsa079, 2006.
Weber, T. K. D., Iden, S. C., and Durner, W.: Unsaturated hydraulicproperties of Sphagnum moss and peat reveal trimodal pore-sizedistributions, Water Resour. Res., 53, 415–434, 2017a.
Weber, T. K. D., Iden, S. C., and Durner, W.: A pore-sizeclassification for peat bogs derived from unsaturated hy-draulic properties, Hydrol. Earth Syst. Sci., 21, 6185–6200,https://doi.org/10.5194/hess-21-6185-2017, 2017b.
Wehrer, M. and Totsche, K. U.: Determination of effective releaserates of polycyclic aromatic hydrocarbons and dissolved organiccarbon by column outflow experiments, Eur. J. Soil Sci., 56, 803–813, 1995.
Ye, M., Meyer, P. D., and Neuman, S. P.: On model selection cri-teria in multimodel analysis, Water Resour. Res., 44, W03428,https://doi.org/10.1029/2008WR006803, 2008.
Zurmühl, T. and Durner, W.: Modeling transient water and solutetransport in a biporous soil, Water Resour. Res., 32, 819–829,1996.
www.soil-journal.net/4/63/2018/ SOIL, 4, 63–81, 2018