São Paulo | Rio de Janeiro | Brasília | Curitiba | Porto Alegre | Recife London | Lisbon |...
47
São Paulo | Rio de Janeiro | Brasília | Curitiba | Porto Alegre | Recife London | Lisbon | Shanghai | Miami | Buenos Aires Durval de Noronha Goyos Jr. Noronha Advogados São Paulo, 27 February 2008.
-
Upload
tabitha-wyant -
Category
Documents
-
view
221 -
download
2
Transcript of São Paulo | Rio de Janeiro | Brasília | Curitiba | Porto Alegre | Recife London | Lisbon |...
São Paulo | Rio de Janeiro | Brasília | Curitiba | Porto Alegre | Recife
London | Lisbon | Shanghai | Miami | Buenos Aires
Durval de Noronha Goyos Jr.Noronha Advogados
São Paulo, 27 February 2008.
1. Fundamentals of Brazil's Economy
2. Brazil's external trade and trade with selected partners
3. Some Social Aspects of Brazil
4. General Aspects of Brazil's Foreign Policy
POINTS OF PRESENTATIONPOINTS OF PRESENTATIONPOINTS OF PRESENTATIONPOINTS OF PRESENTATION
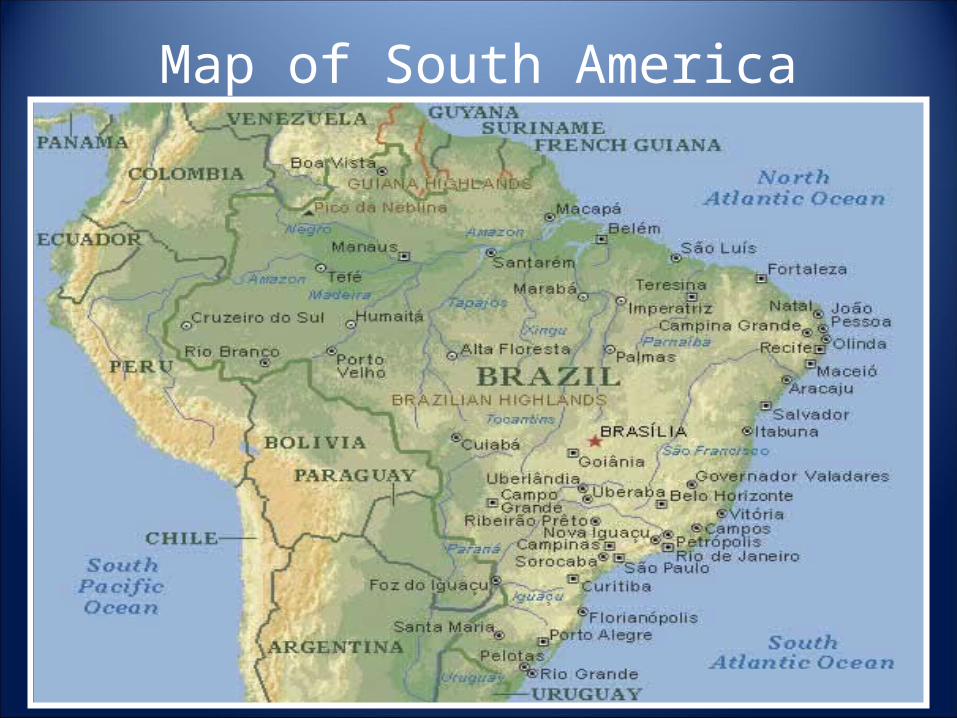
Map of South America
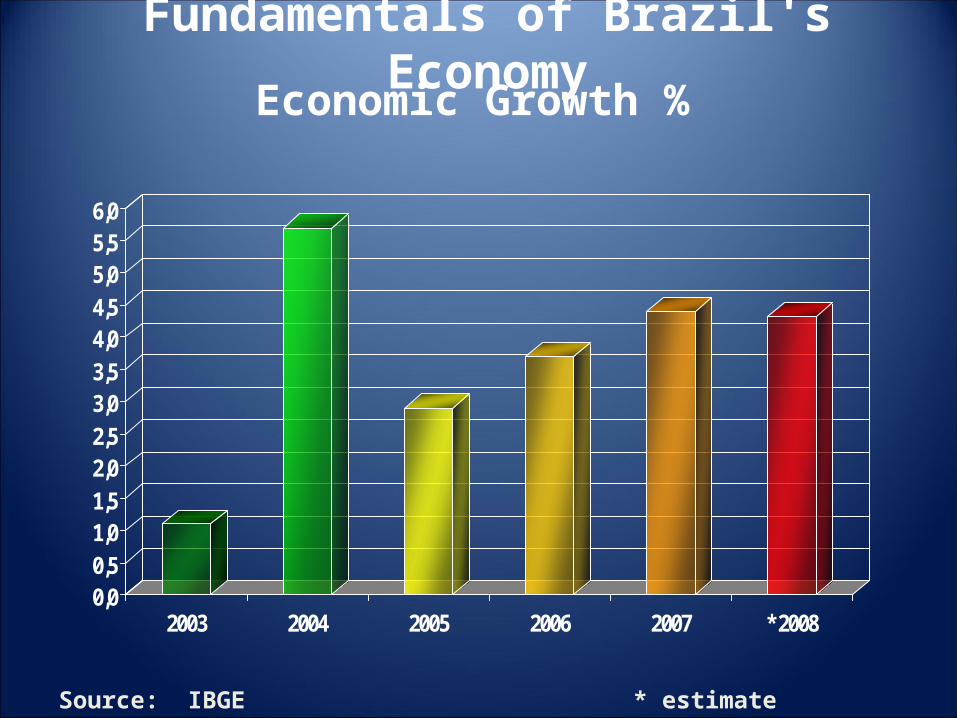
Economic Growth %
0,00,51,01,52,02,53,03,54,04,55,05,56,0
2003 2004 2005 2006 2007 * 2008
Source: IBGE * estimate Central Bank
Fundamentals of Brazil's Economy
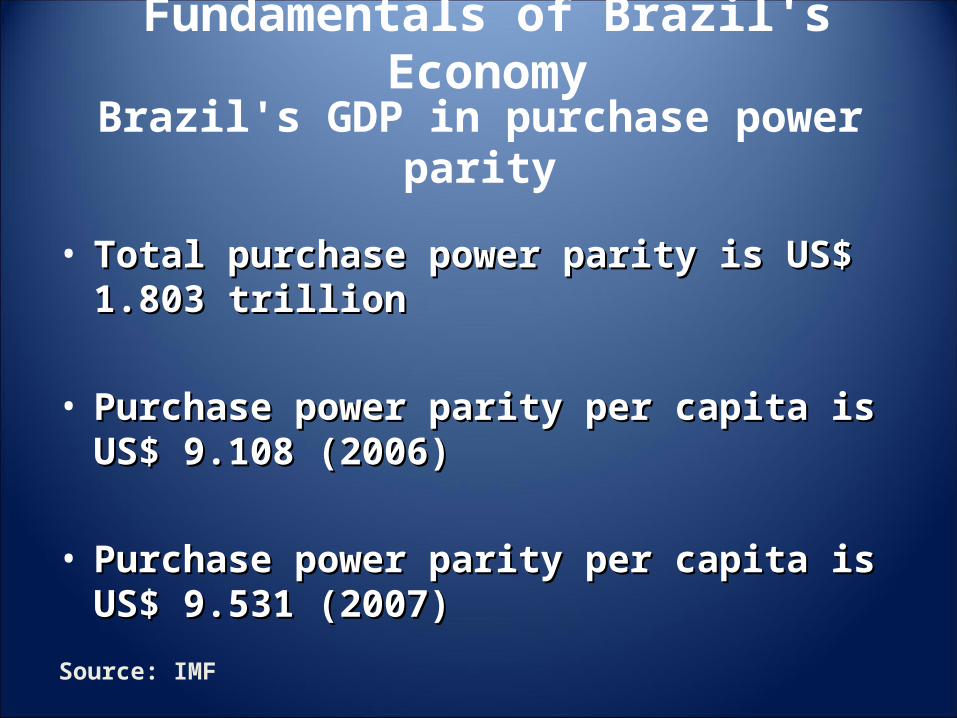
Brazil's GDP in purchase power parity
• Total purchase power parity is US$ 1.803 trillionTotal purchase power parity is US$ 1.803 trillion
• Purchase power parity per capita is US$ 9.108 Purchase power parity per capita is US$ 9.108 (2006)(2006)
• Purchase power parity per capita is US$ 9.531 Purchase power parity per capita is US$ 9.531 (2007)(2007)
Source: IMF
Fundamentals of Brazil's Economy
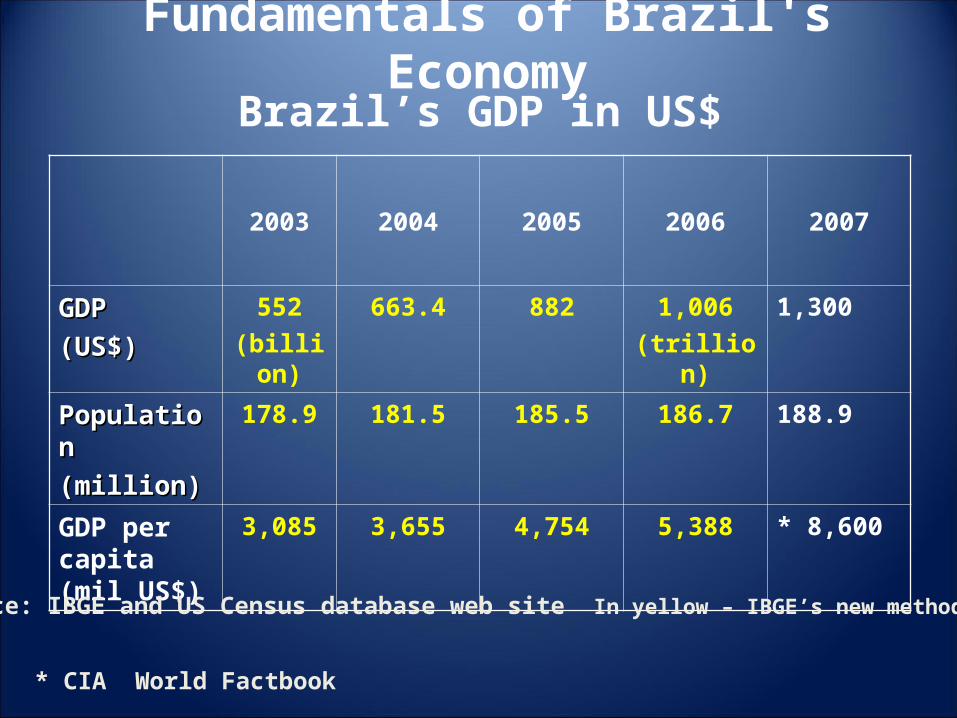
Brazil’s GDP in US$
2003 2004 2005 2006 2007
GDPGDP
(US$)(US$)
552
(billion)
663.4 882 1,006
(trillion)
1,300
PopulationPopulation
(million)(million)
178.9 181.5 185.5 186.7 188.9
GDP per capita (mil US$)
3,085 3,655 4,754 5,388 * 8,600
Source: IBGE and US Census database web site In yellow – IBGE’s new methodology .
Fundamentals of Brazil's Economy
* CIA World Factbook
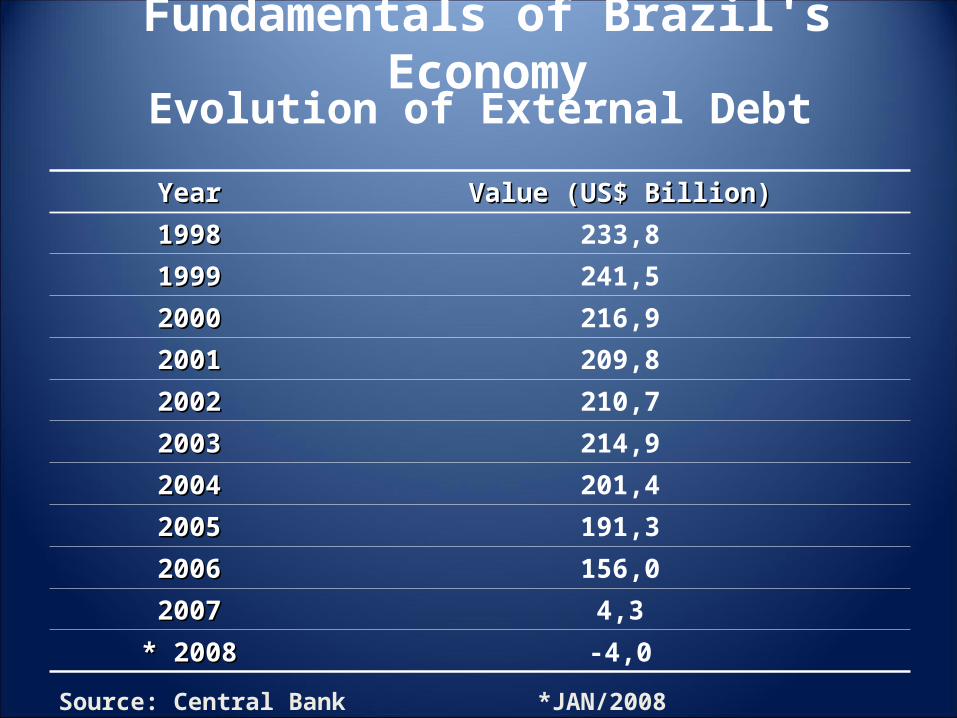
Evolution of External Debt
YearYear Value (US$ Billion)Value (US$ Billion)
19981998 233,8
19991999 241,5
20002000 216,9
20012001 209,8
20022002 210,7
20032003 214,9
20042004 201,4
20052005 191,3
20062006 156,0
20072007 4,3
* 2008* 2008 -4,0
Fundamentals of Brazil's Economy
Source: Central Bank *JAN/2008
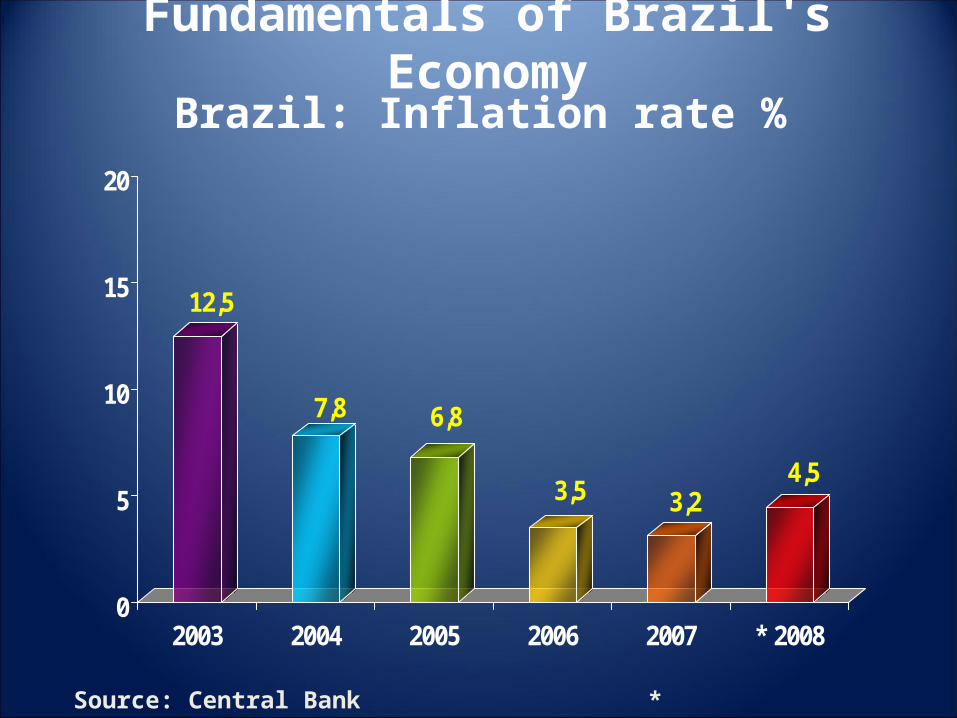
Brazil: Inflation rate %
12,5
7,8 6,8
3,5 3,24,5
0
5
10
15
20
2003 2004 2005 2006 2007 * 2008
Source: Central Bank * Estimate
Fundamentals of Brazil's Economy
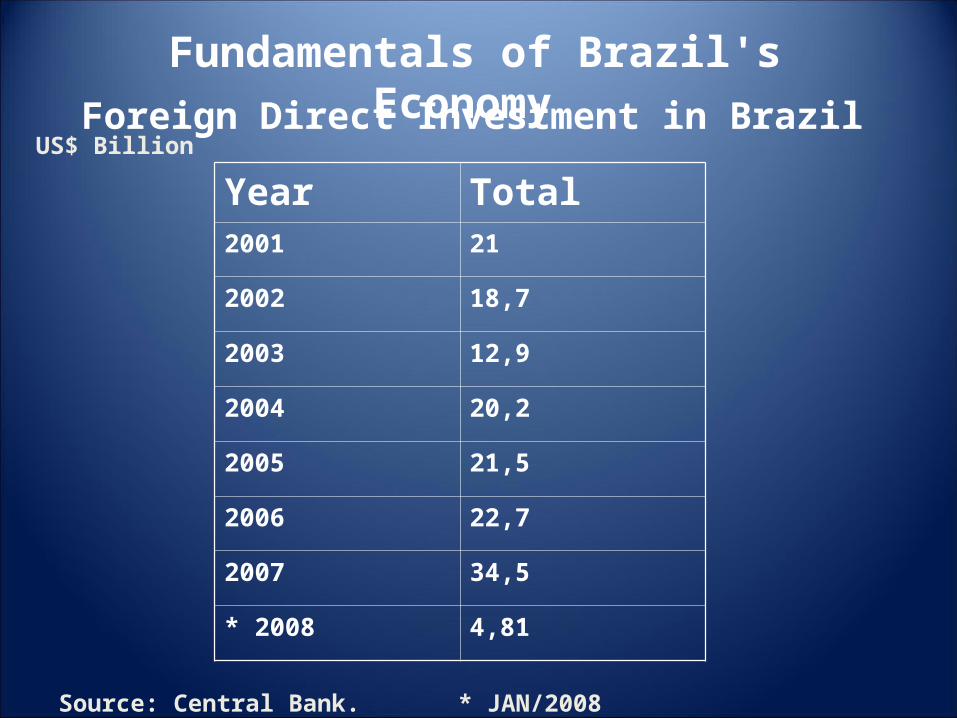
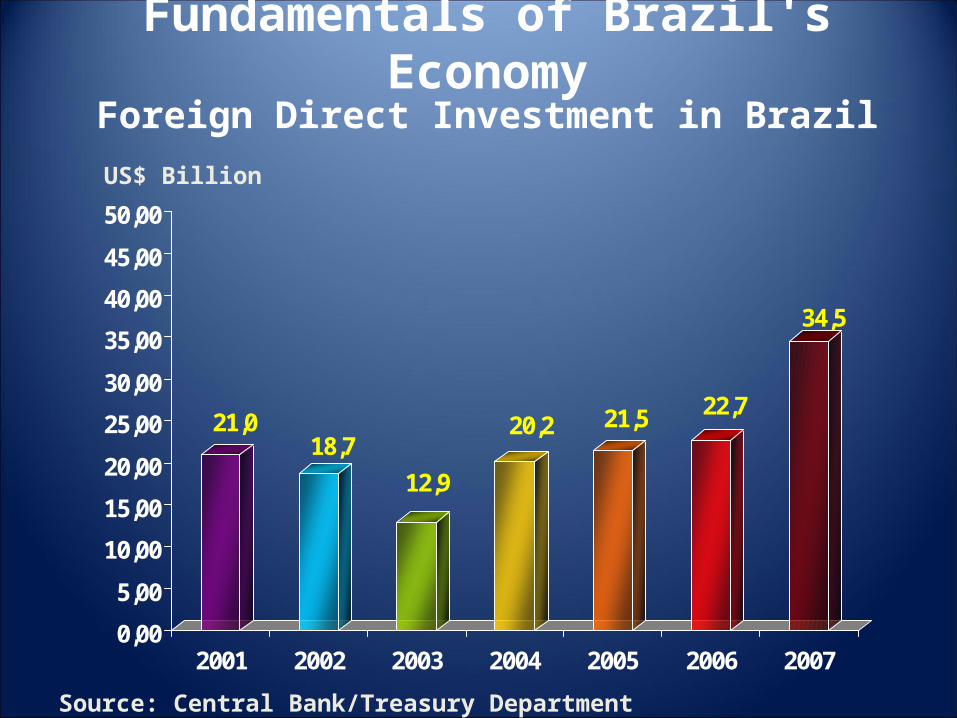
Foreign Direct Investment in Brazil
Source: Central Bank.
Fundamentals of Brazil's Economy
Year Total2001 21
2002 18,7
2003 12,9
2004 20,2
2005 21,5
2006 22,7
2007 34,5
* 2008 4,81
* JAN/2008
US$ Billion
Foreign Direct Investment in Brazil
21,018,7
12,9
20,2 21,5 22,7
34,5
0,00
5,00
10,00
15,00
20,00
25,00
30,00
35,00
40,00
45,00
50,00
2001 2002 2003 2004 2005 2006 2007
Source: Central Bank/Treasury Department
US$ Billion
Fundamentals of Brazil's Economy
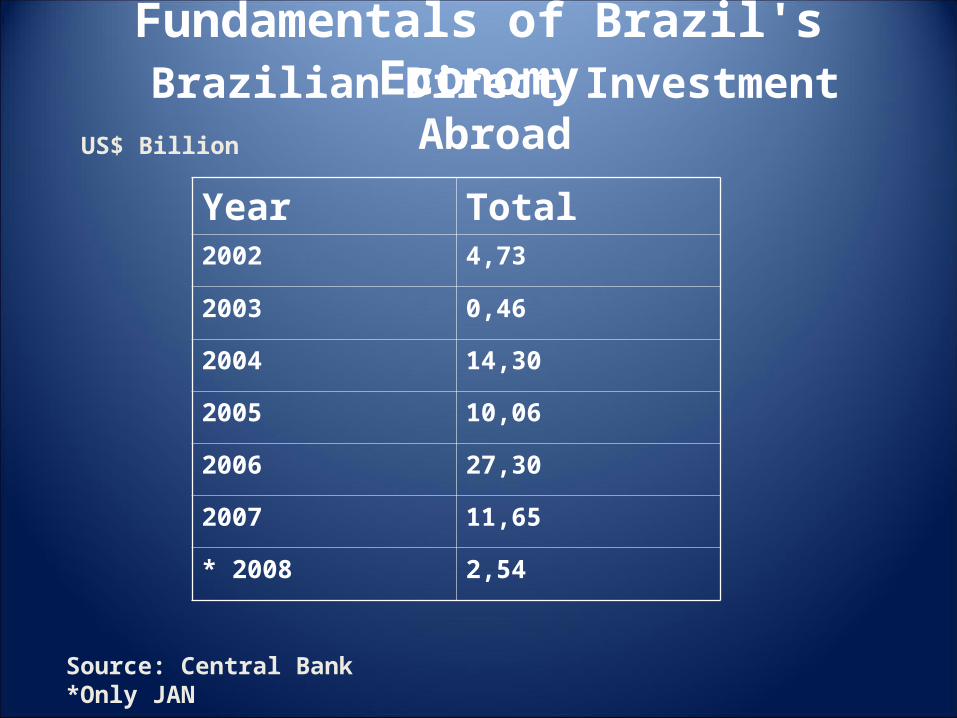
Year Total2002 4,73
2003 0,46
2004 14,30
2005 10,06
2006 27,30
2007 11,65
* 2008 2,54
Fundamentals of Brazil's EconomyBrazilian Direct Investment Abroad
Source: Central Bank*Only JAN
US$ Billion
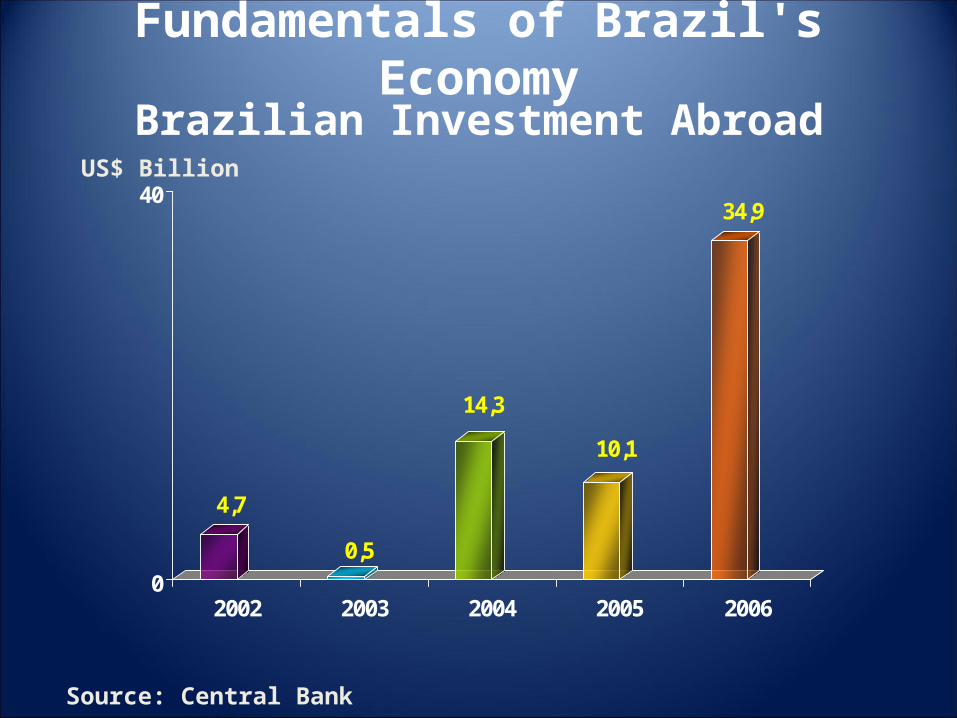
4,7
0,5
14,3
10,1
34,9
0
40
2002 2003 2004 2005 2006
Brazilian Investment Abroad
Fundamentals of Brazil's Economy
Source: Central Bank
US$ Billion
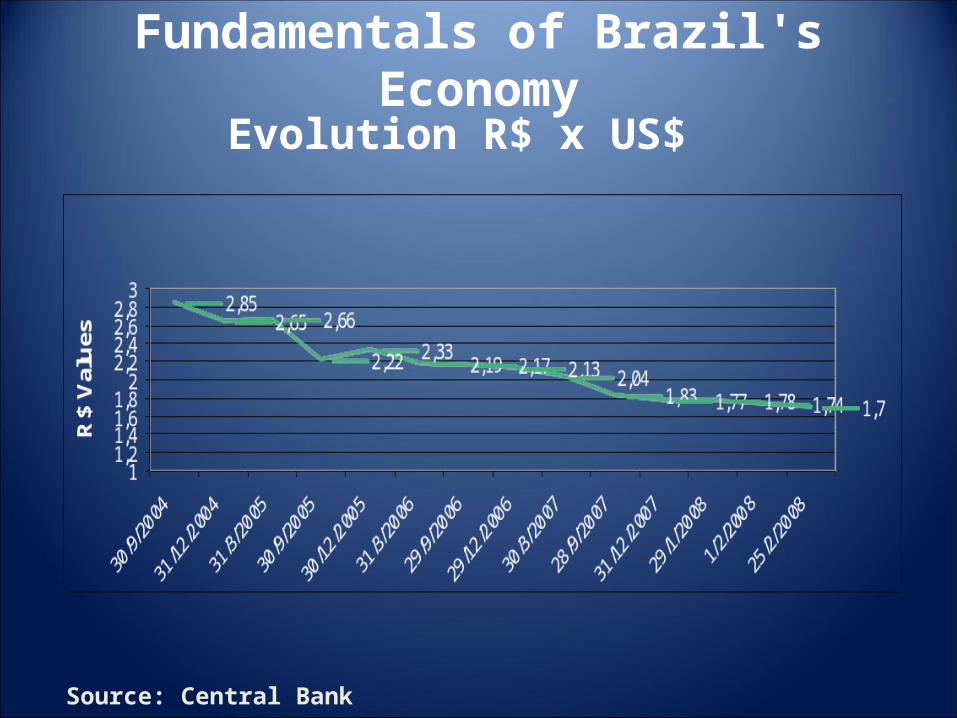
Fundamentals of Brazil's Economy
Evolution R$ x US$
Source: Central Bank
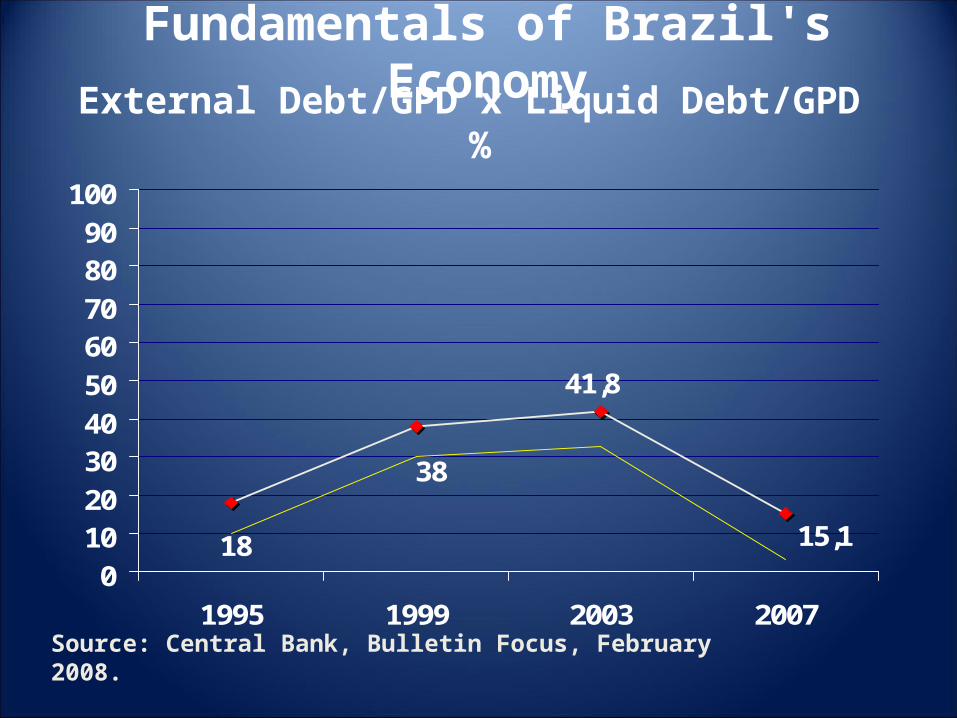
External Debt/GPD x Liquid Debt/GPD %
15,1
41,8
38
180
1020
3040
50
6070
8090
100
1995 1999 2003 2007Source: Central Bank, Bulletin Focus, February 2008. RED: External Debt/GDP; YELLOW: Liquid Debt/GDP
Fundamentals of Brazil's Economy
Main problems yet to be solved
taxes are not competitive;
interest rates are very high;
exchange rates are overestimated.
Fundamentals of Brazil's Economy
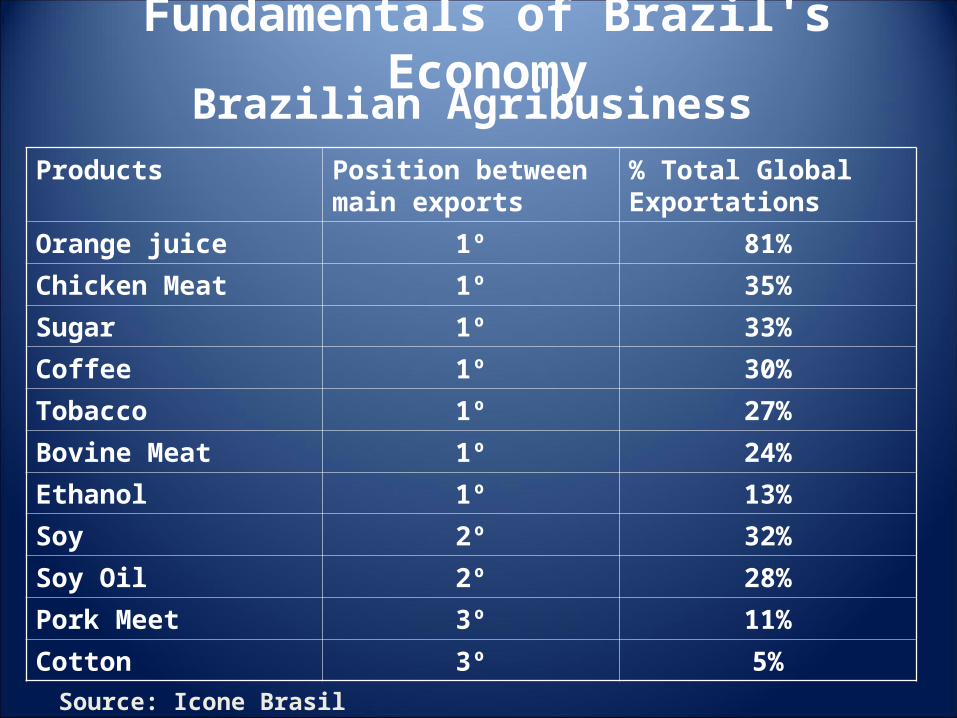
Brazilian Agribusiness
Products Position between main exports
% Total Global Exportations
Orange juice 1º 81%
Chicken Meat 1º 35%
Sugar 1º 33%
Coffee 1º 30%
Tobacco 1º 27%
Bovine Meat 1º 24%
Ethanol 1º 13%
Soy 2º 32%
Soy Oil 2º 28%
Pork Meet 3º 11%
Cotton 3º 5%
Source: Icone Brasil
Fundamentals of Brazil's Economy
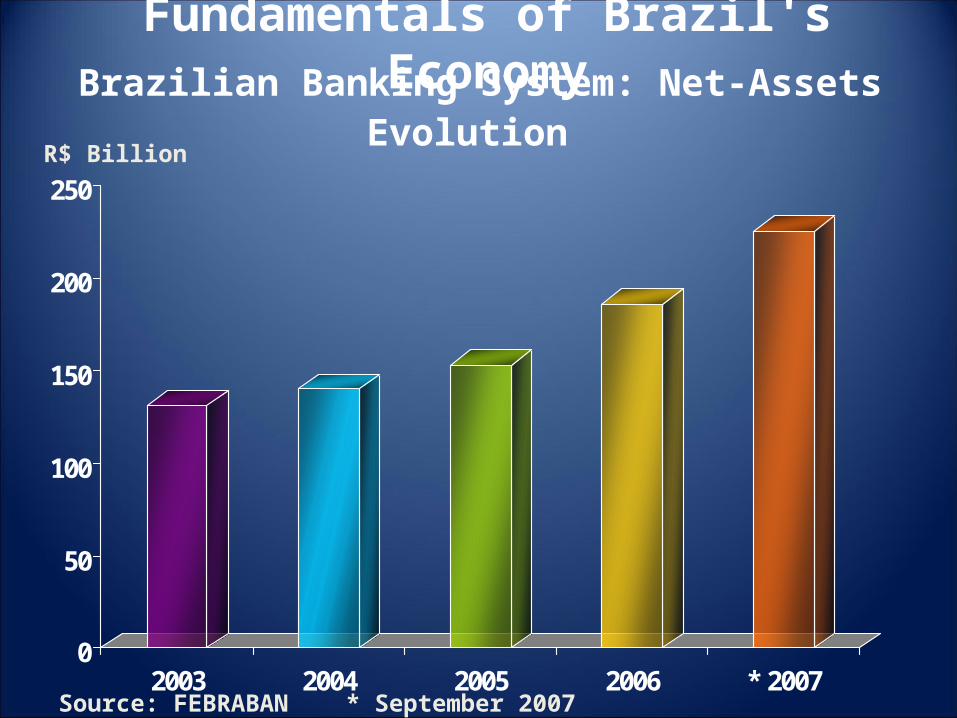
Brazilian Banking System: Net-Assets Evolution
0
50
100
150
200
250
2003 2004 2005 2006 * 2007Source: FEBRABAN * September 2007
R$ Billion
Fundamentals of Brazil's Economy
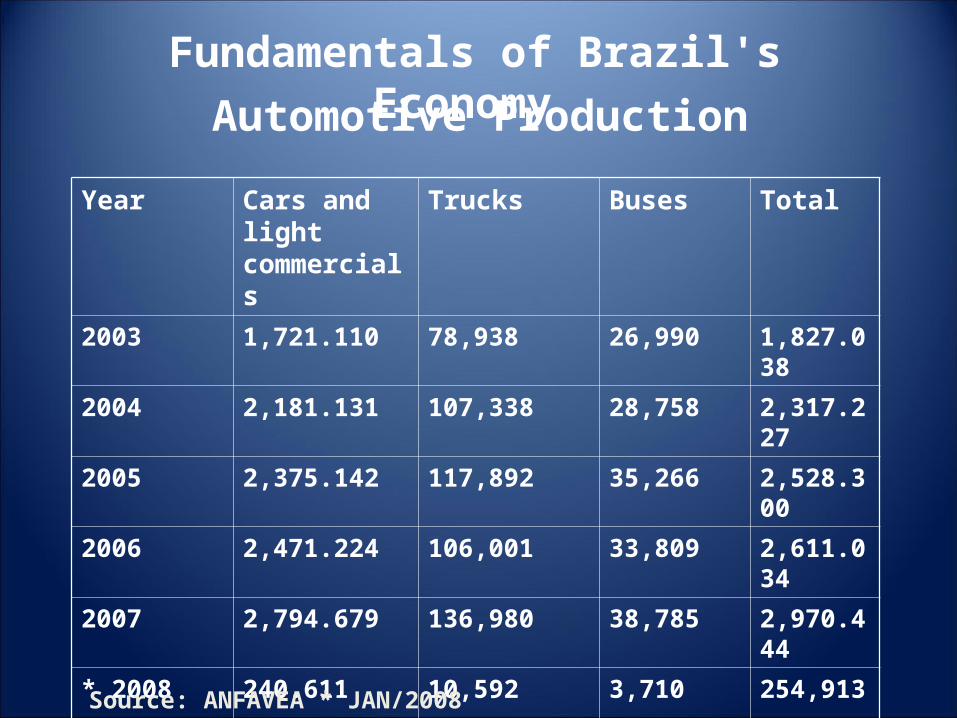
Automotive Production
Year Cars and light commercials
Trucks Buses Total
2003 1,721.110 78,938 26,990 1,827.038
2004 2,181.131 107,338 28,758 2,317.227
2005 2,375.142 117,892 35,266 2,528.300
2006 2,471.224 106,001 33,809 2,611.034
2007 2,794.679 136,980 38,785 2,970.444
* 2008 240.611 10,592 3,710 254,913
Source: ANFAVEA * JAN/2008
Fundamentals of Brazil's Economy
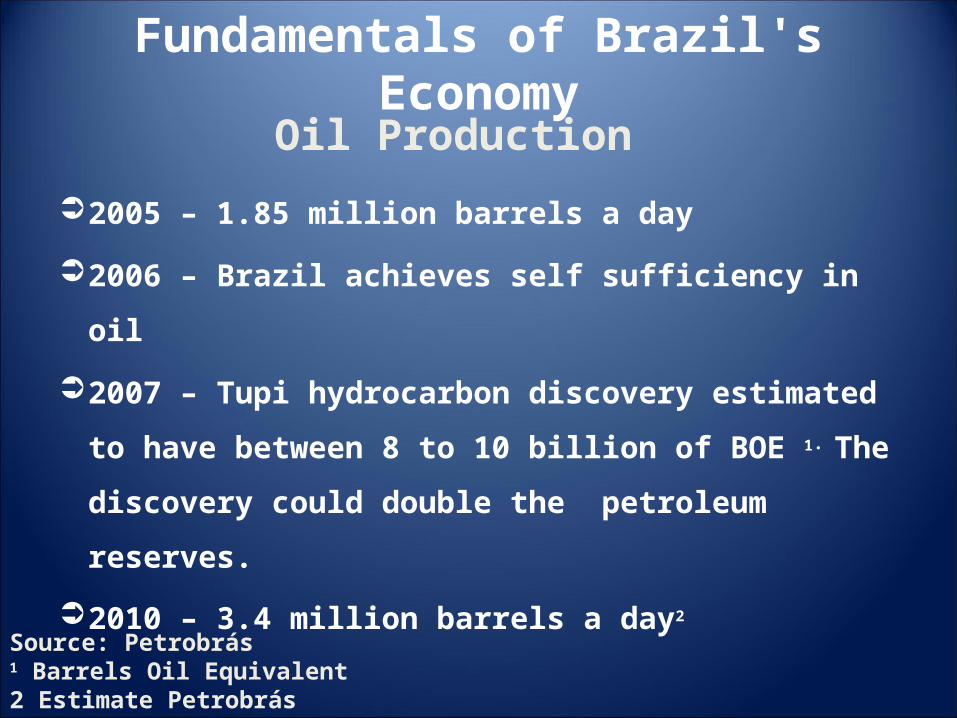
2005 – 1.85 million barrels a day
2006 – Brazil achieves self sufficiency in oil
2007 – Tupi hydrocarbon discovery estimated to
have between 8 to 10 billion of BOE 1. The
discovery could double the petroleum reserves.
2010 – 3.4 million barrels a day2
Fundamentals of Brazil's Economy
Source: Petrobrás 1 Barrels Oil Equivalent2 Estimate Petrobrás
Oil Production

Fundamentals of Brazil's Economy
• 500 million liters/years
• Increase in cultivated area by 67,000 hectares
• Creation of 20,000 direct jobs and 60,000 indirect jobs
• Investments in productive chain estimated at around USD 150 million/year
• CO2 emission reduction by 3.5 million tons/years
Ethanol Production
Source: UNICA
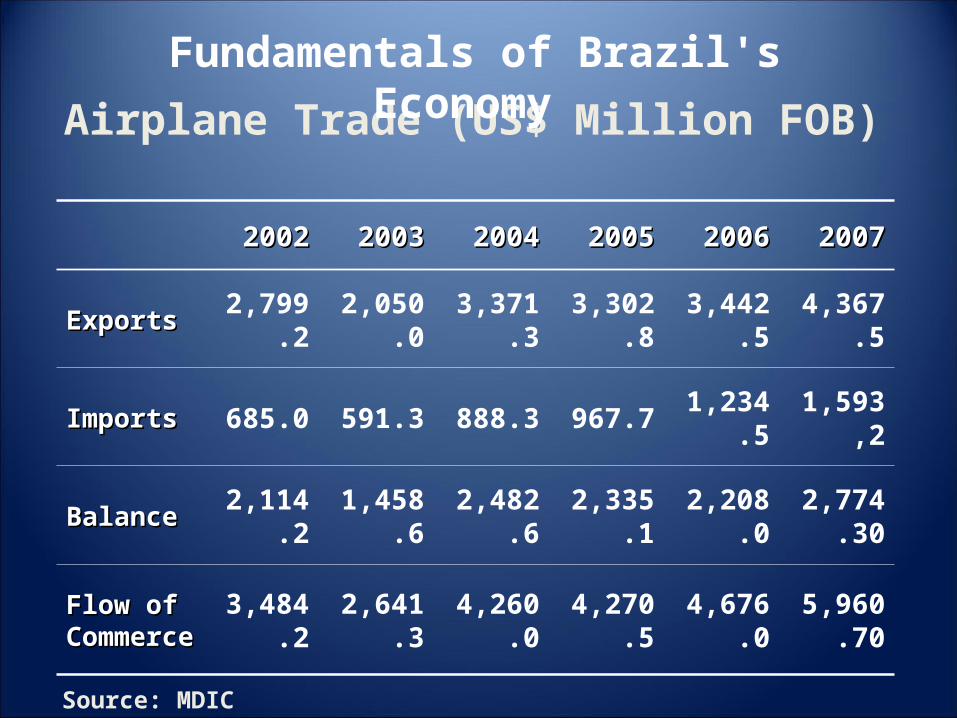
Airplane Trade (US$ Million FOB)
20022002 20032003 20042004 20052005 20062006 20072007
ExportsExports 2,799.2 2,050.0 3,371.3 3,302.8 3,442.5 4,367.5
ImportsImports 685.0 591.3 888.3 967.7 1,234.5 1,593,2
BalanceBalance 2,114.2 1,458.6 2,482.6 2,335.1 2,208.0 2,774.30
Flow of Flow of CommerceCommerce
3,484.2 2,641.3 4,260.0 4,270.5 4,676.0 5,960.70
Source: MDIC
Fundamentals of Brazil's Economy
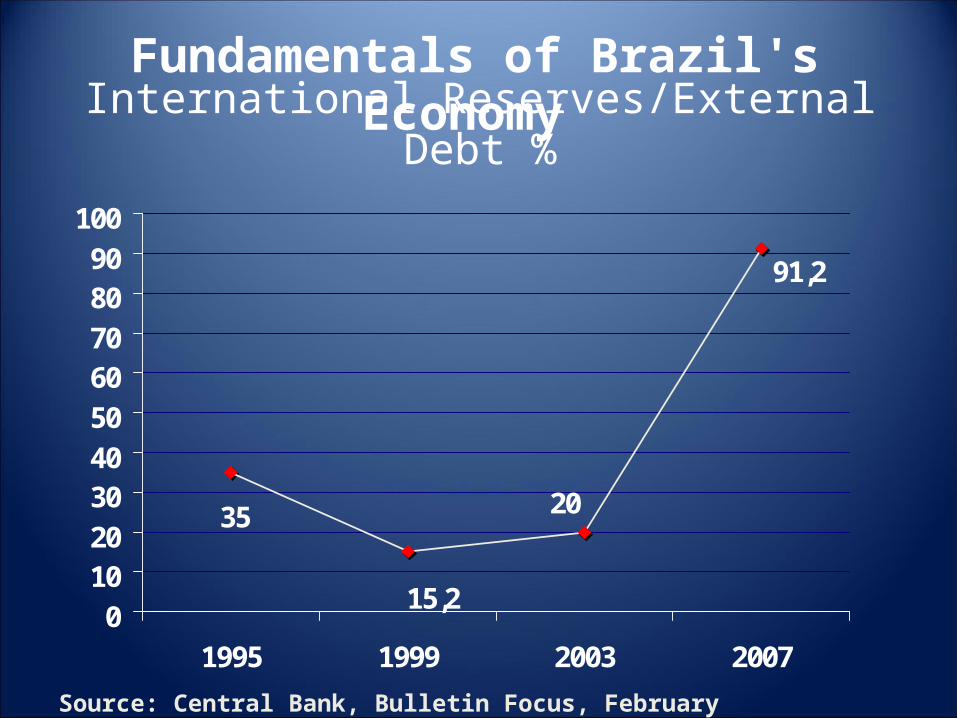
International Reserves/External Debt %
91,2
20
15,2
35
0
1020
3040
50
6070
8090
100
1995 1999 2003 2007
Source: Central Bank, Bulletin Focus, February 2008.
Fundamentals of Brazil's Economy
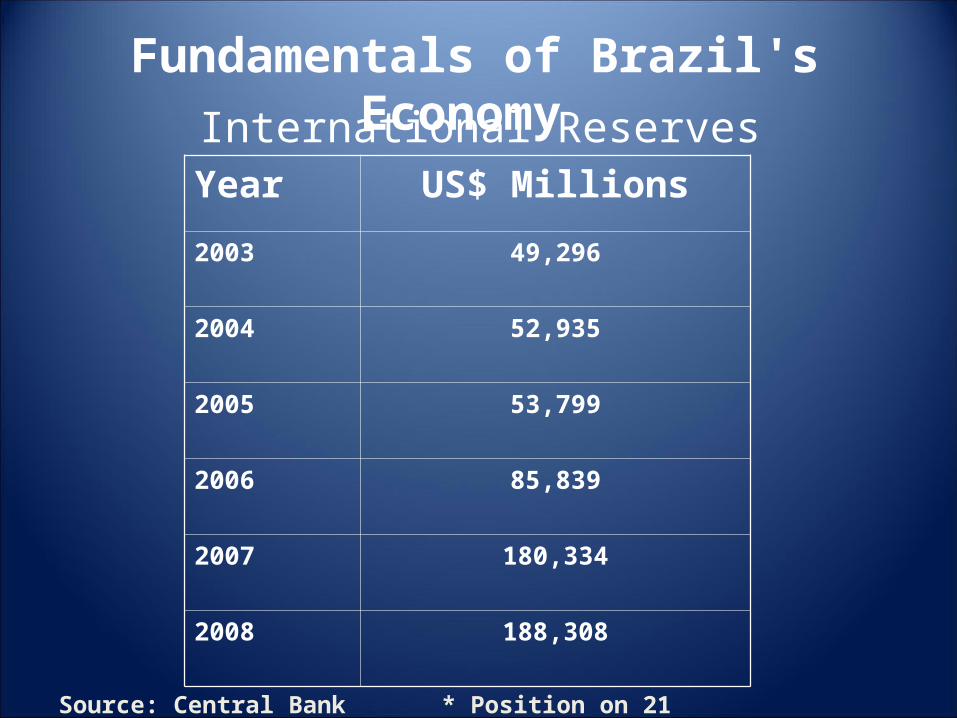
International ReservesYear US$ Millions
2003 49,296
2004 52,935
2005 53,799
2006 85,839
2007 180,334
2008 188,308
Source: Central Bank * Position on 21 February 2008
Fundamentals of Brazil's Economy
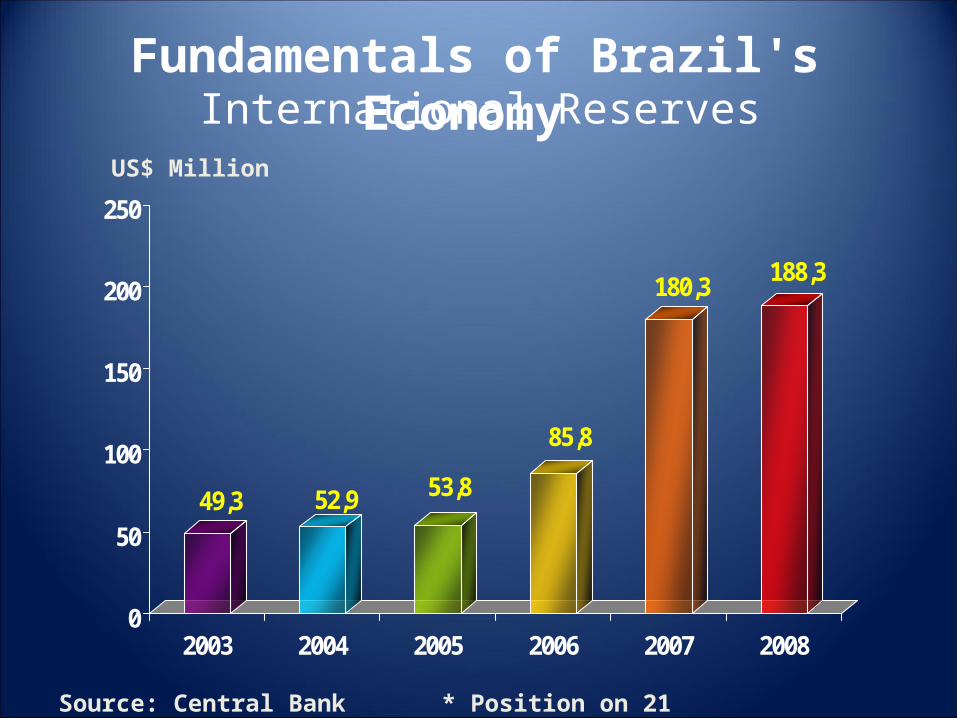
International Reserves
49,3 52,9 53,8
85,8
180,3188,3
0
50
100
150
200
250
2003 2004 2005 2006 2007 2008
Source: Central Bank * Position on 21 February 2008
US$ Million
Fundamentals of Brazil's Economy
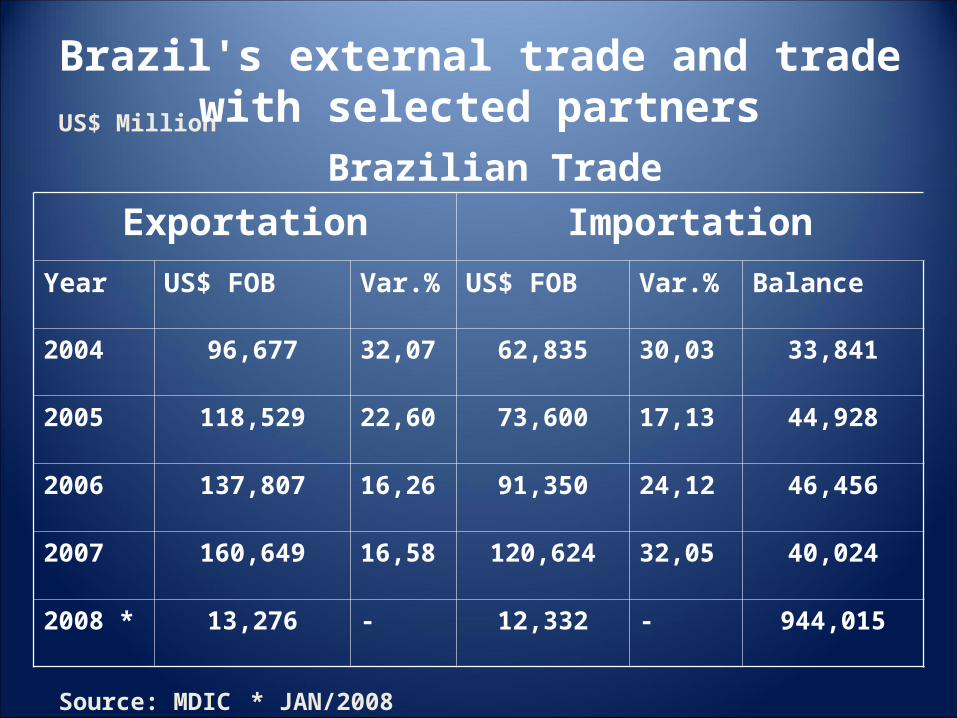
Exportation Importation
Year US$ FOB Var.% US$ FOB Var.% Balance
2004 96,677 32,07 62,835 30,03 33,841
2005 118,529 22,60 73,600 17,13 44,928
2006 137,807 16,26 91,350 24,12 46,456
2007 160,649 16,58 120,624 32,05 40,024
2008 * 13,276 - 12,332 - 944,015
Source: MDIC * JAN/2008
US$ Million
Brazil's external trade and trade with selected partners
Brazilian Trade
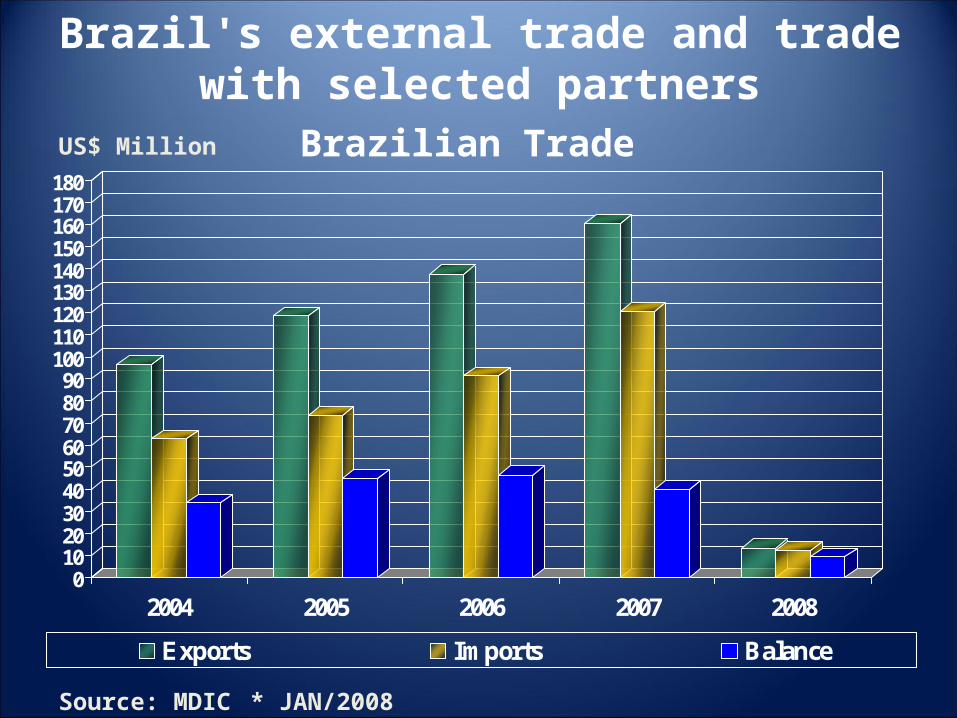
0102030405060708090
100110120130140150160170180
2004 2005 2006 2007 2008
Exports Imports Balance
Source: MDIC * JAN/2008
Brazilian Trade US$ Million
Brazil's external trade and trade with selected partners
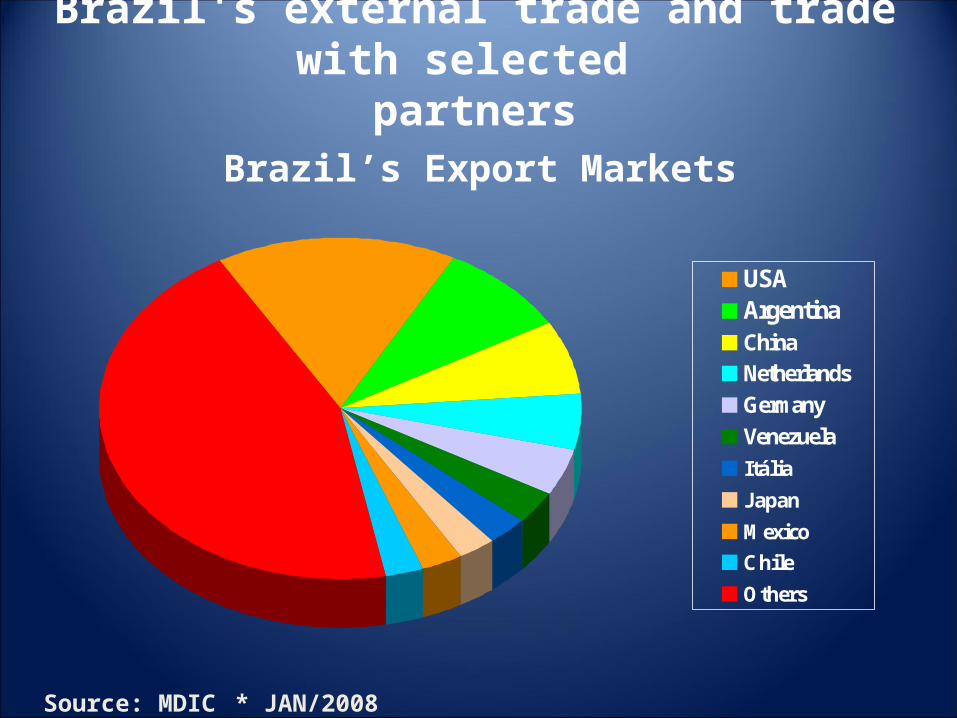
USAArgentinaChinaNetherlands
Germany
Venezuela
Itália
Japan
Mexico
Chile
Others
Brazil's external trade and trade with selected partners
Brazil’s Export Markets
Source: MDIC * JAN/2008
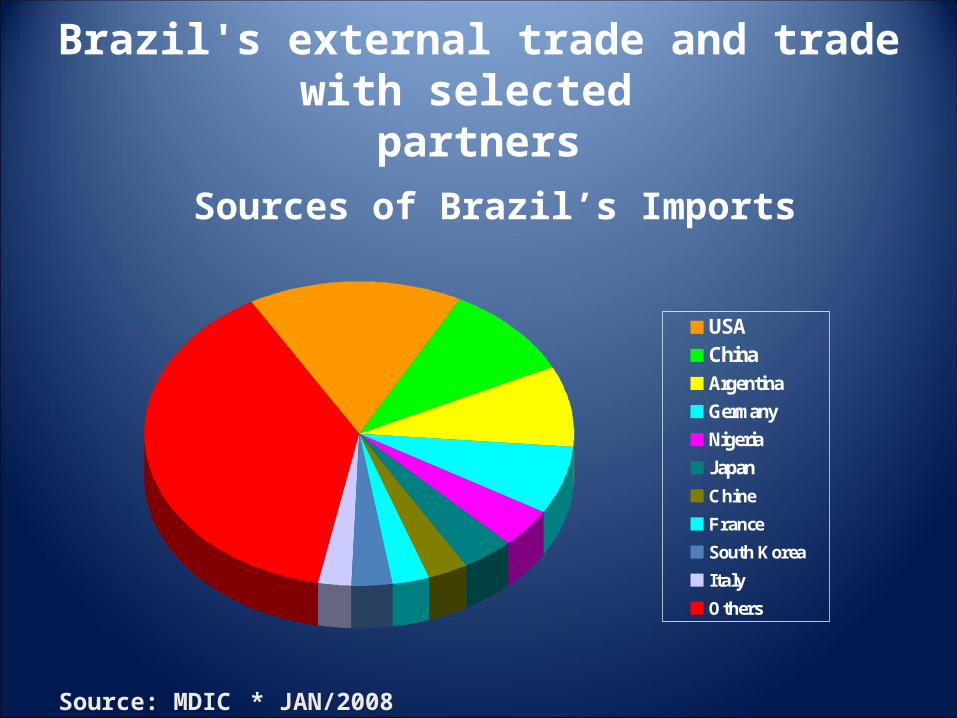
Brazil's external trade and trade with selected
partners
Sources of Brazil’s Imports
USAChinaArgentina
Germany
Nigeria
Japan
Chine
France
South Korea
Italy
Others
Source: MDIC * JAN/2008
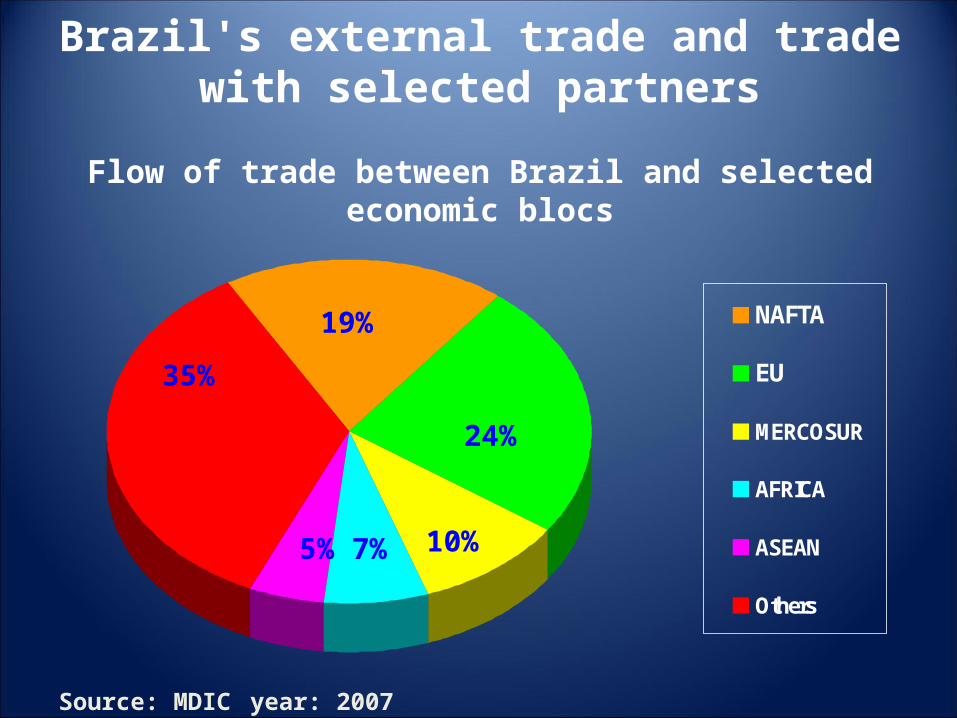
Brazil's external trade and trade with selected partners
NAFTA
EU
MERCOSUR
AFRICA
ASEAN
Others
19%
35%
24%
10%7%5%
Flow of trade between Brazil and selected economic blocs
Source: MDIC year: 2007
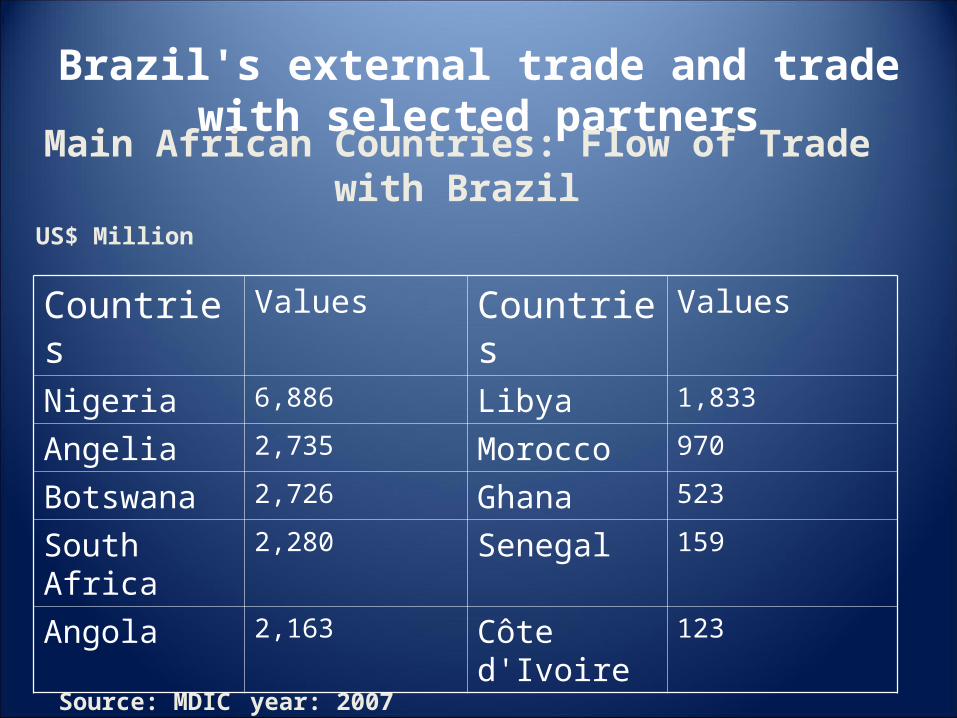
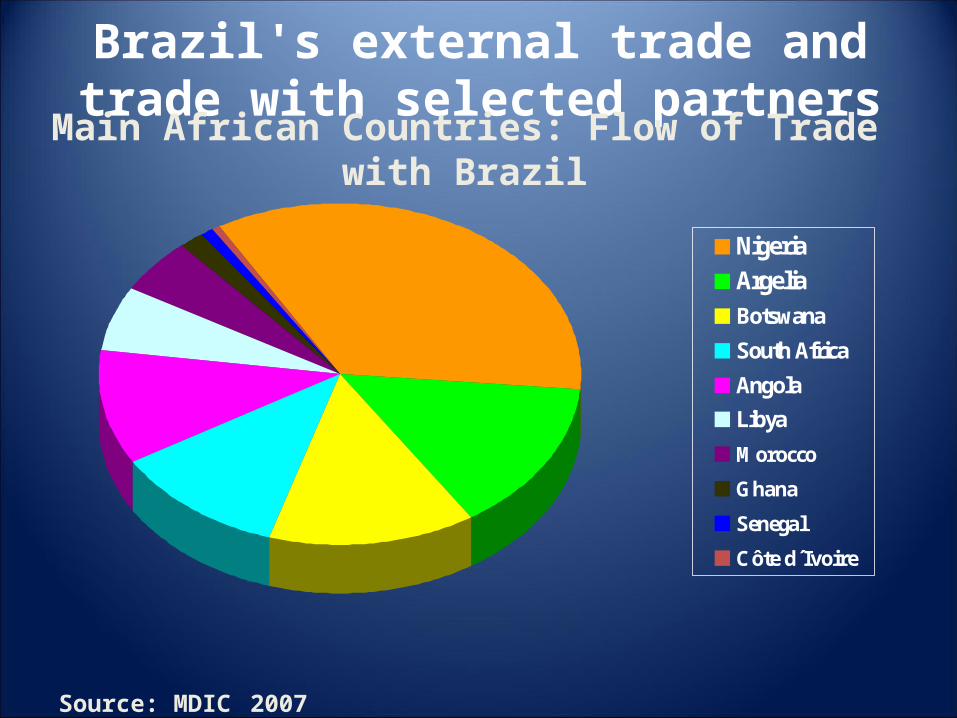
Countries Values Countries Values
Nigeria 6,886 Libya 1,833
Angelia 2,735 Morocco 970
Botswana 2,726 Ghana 523
South Africa 2,280 Senegal 159
Angola 2,163 Côte d'Ivoire 123
Brazil's external trade and trade with selected partners
Main African Countries: Flow of Trade with Brazil
Source: MDIC year: 2007
US$ Million
NigeriaArgeliaBotswana
South Africa
Angola
Libya
Morocco
Ghana
Senegal
Côte d´Ivoire
Source: MDIC 2007
Brazil's external trade and trade with selected partners
Main African Countries: Flow of Trade with Brazil
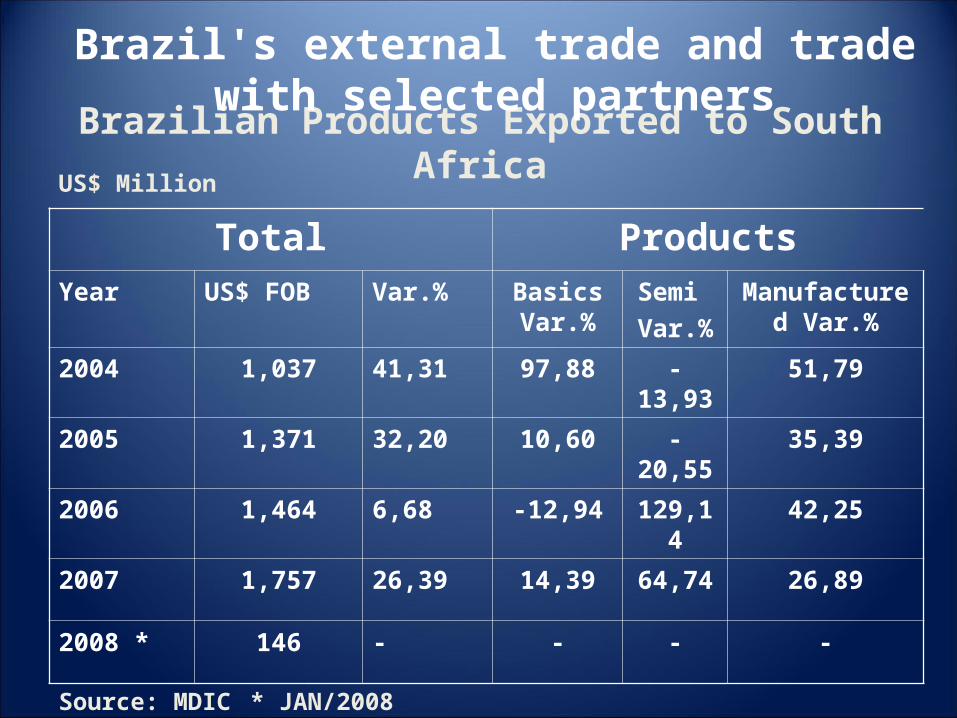
Total ProductsYear US$ FOB Var.% Basics
Var.%Semi
Var.%
Manufactured Var.%
2004 1,037 41,31 97,88 -13,93 51,79
2005 1,371 32,20 10,60 -20,55 35,39
2006 1,464 6,68 -12,94 129,14 42,25
2007 1,757 26,39 14,39 64,74 26,89
2008 * 146 - - - -
Source: MDIC * JAN/2008
Brazilian Products Exported to South AfricaUS$ Million
Brazil's external trade and trade with selected partners
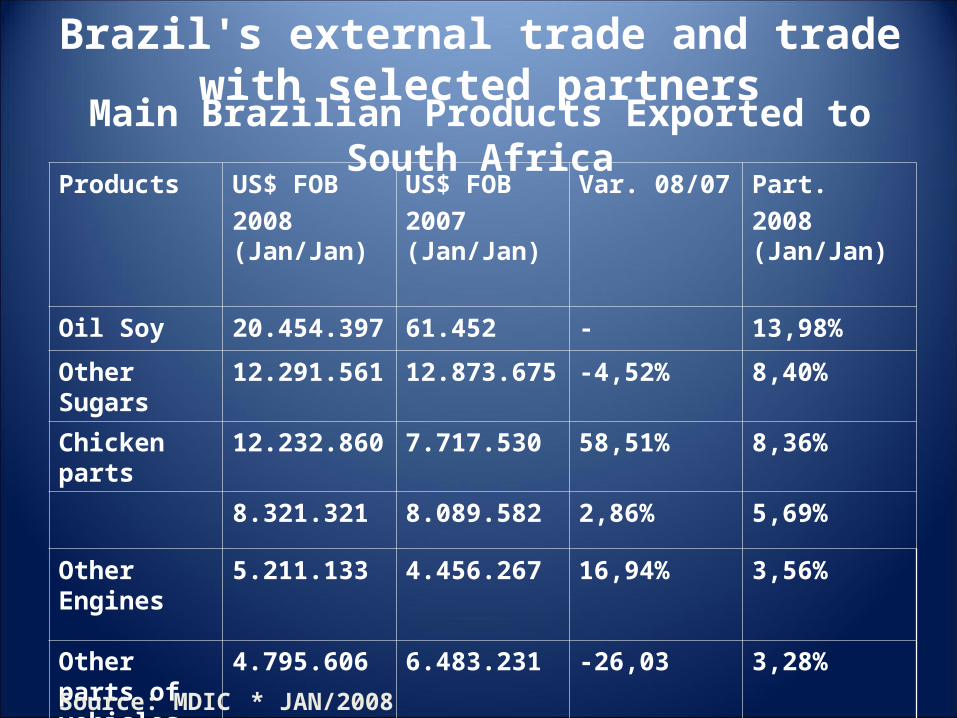
Products US$ FOB
2008 (Jan/Jan)
US$ FOB
2007 (Jan/Jan)
Var. 08/07 Part.
2008 (Jan/Jan)
Oil Soy 20.454.397 61.452 - 13,98%
Other Sugars 12.291.561 12.873.675 -4,52% 8,40%
Chicken parts 12.232.860 7.717.530 58,51% 8,36%
8.321.321 8.089.582 2,86% 5,69%
Other Engines
5.211.133 4.456.267 16,94% 3,56%
Other parts of vehicles
4.795.606 6.483.231 -26,03 3,28%
Source: MDIC * JAN/2008
Main Brazilian Products Exported to South Africa
Brazil's external trade and trade with selected partners
Brazil's external trade and trade with selected partners
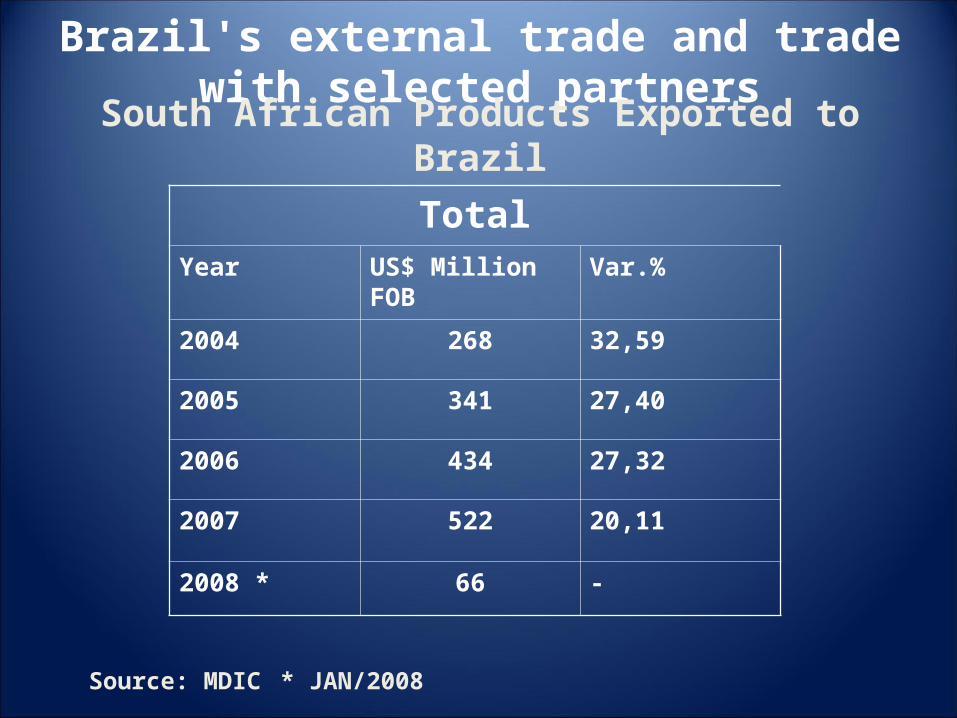
South African Products Exported to Brazil
TotalYear US$ Million FOB Var.%
2004 268 32,59
2005 341 27,40
2006 434 27,32
2007 522 20,11
2008 * 66 -
Source: MDIC * JAN/2008
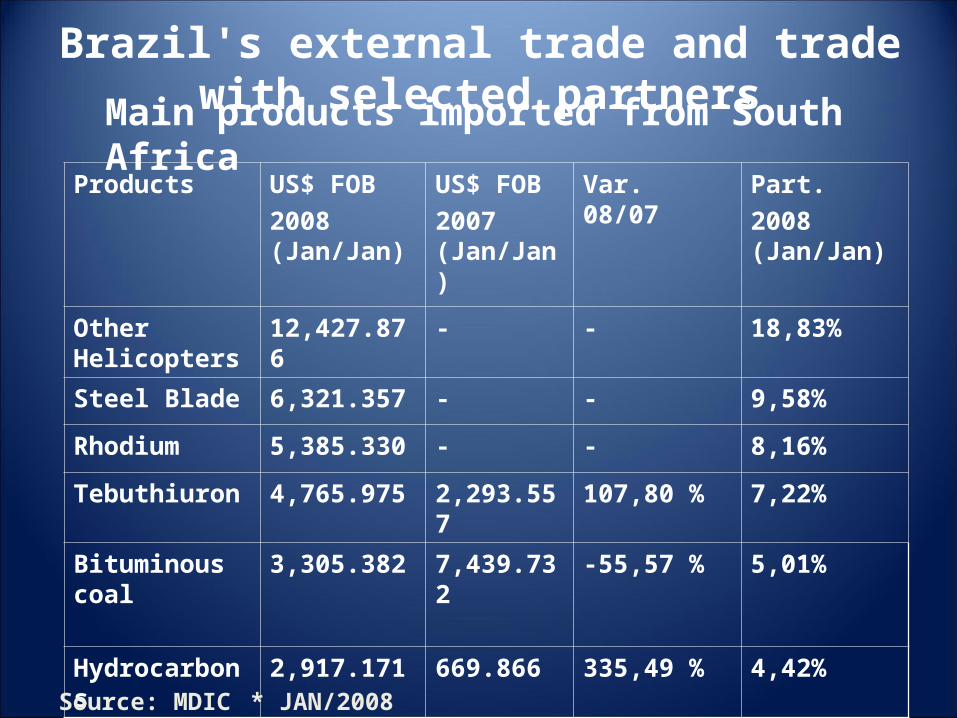
Products US$ FOB
2008 (Jan/Jan)
US$ FOB
2007 (Jan/Jan)
Var. 08/07 Part.
2008 (Jan/Jan)
Other Helicopters
12,427.876 - - 18,83%
Steel Blade 6,321.357 - - 9,58%
Rhodium 5,385.330 - - 8,16%
Tebuthiuron 4,765.975 2,293.557 107,80 % 7,22%
Bituminous coal 3,305.382 7,439.732 -55,57 % 5,01%
Hydrocarbons 2,917.171 669.866 335,49 % 4,42%
Source: MDIC * JAN/2008
Main products imported from South Africa
Brazil's external trade and trade with selected partners
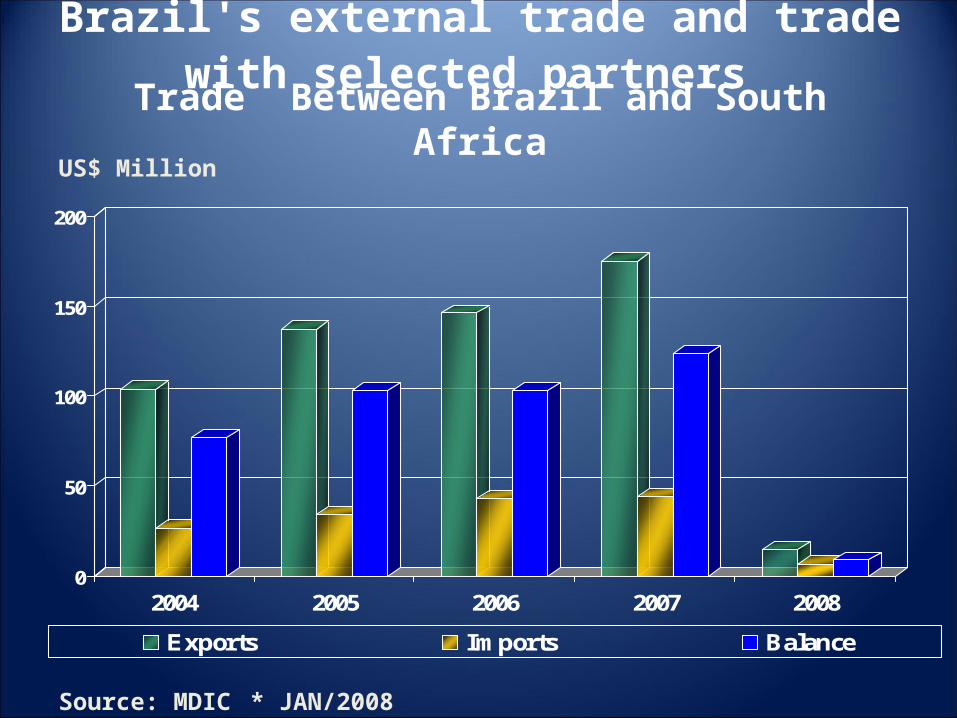
0
50
100
150
200
2004 2005 2006 2007 2008
Exports Imports Balance
Source: MDIC * JAN/2008
Trade Between Brazil and South AfricaUS$ Million
Brazil's external trade and trade with selected partners
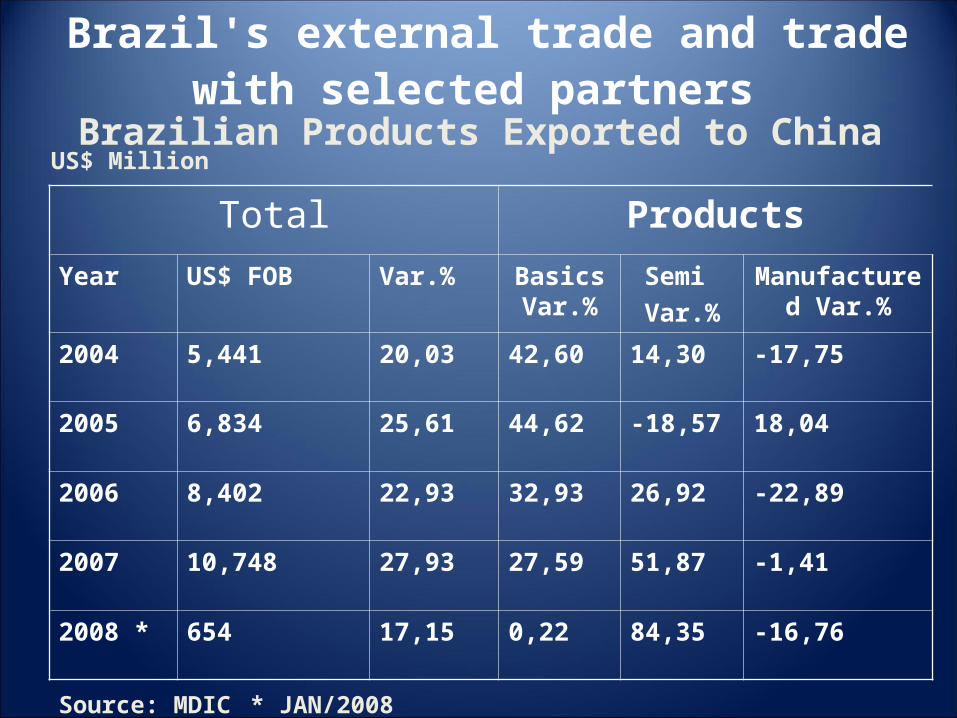
Brazilian Products Exported to China
Total Products
Year US$ FOB Var.% Basics Var.%
Semi
Var.%
Manufactured Var.%
2004 5,441 20,03 42,60 14,30 -17,75
2005 6,834 25,61 44,62 -18,57 18,04
2006 8,402 22,93 32,93 26,92 -22,89
2007 10,748 27,93 27,59 51,87 -1,41
2008 * 654 17,15 0,22 84,35 -16,76
Source: MDIC * JAN/2008
US$ Million
Brazil's external trade and trade with selected partners
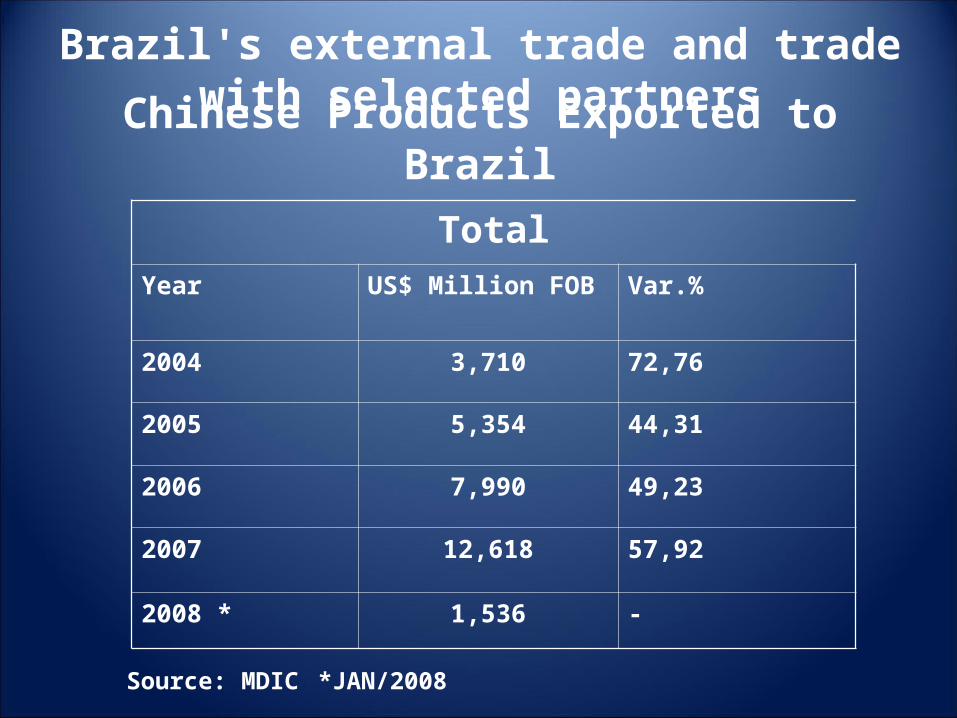
Brazil's external trade and trade with selected partners
Total
Year US$ Million FOB Var.%
2004 3,710 72,76
2005 5,354 44,31
2006 7,990 49,23
2007 12,618 57,92
2008 * 1,536 -
Chinese Products Exported to Brazil
Source: MDIC *JAN/2008
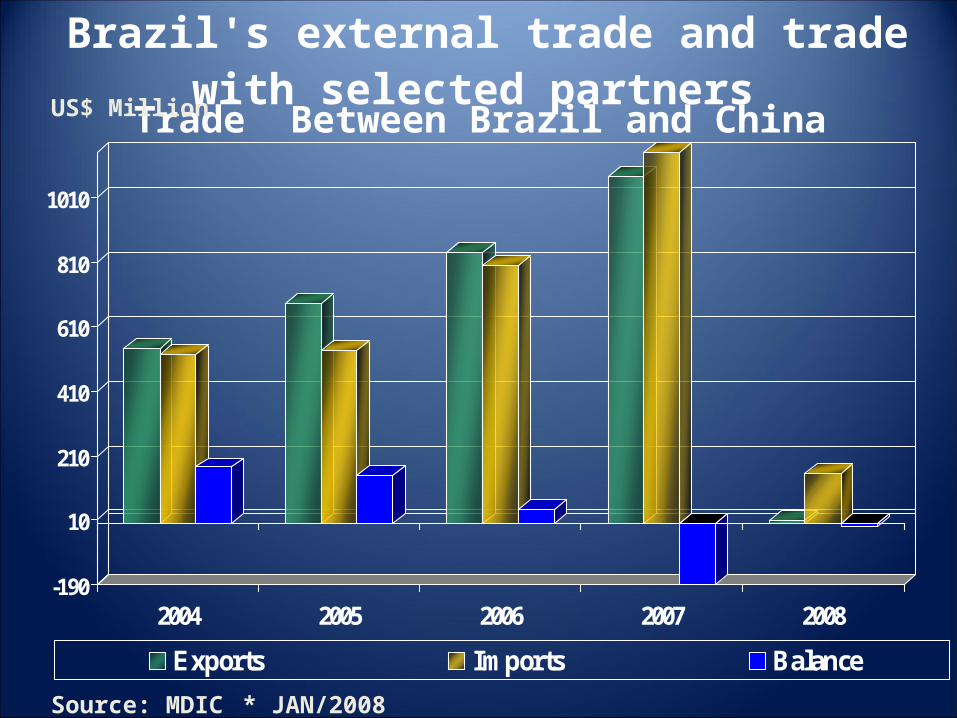
Trade Between Brazil and China
-190
10
210
410
610
810
1010
2004 2005 2006 2007 2008
Exports Imports Balance
Source: MDIC * JAN/2008
US$ Million
Brazil's external trade and trade with selected partners
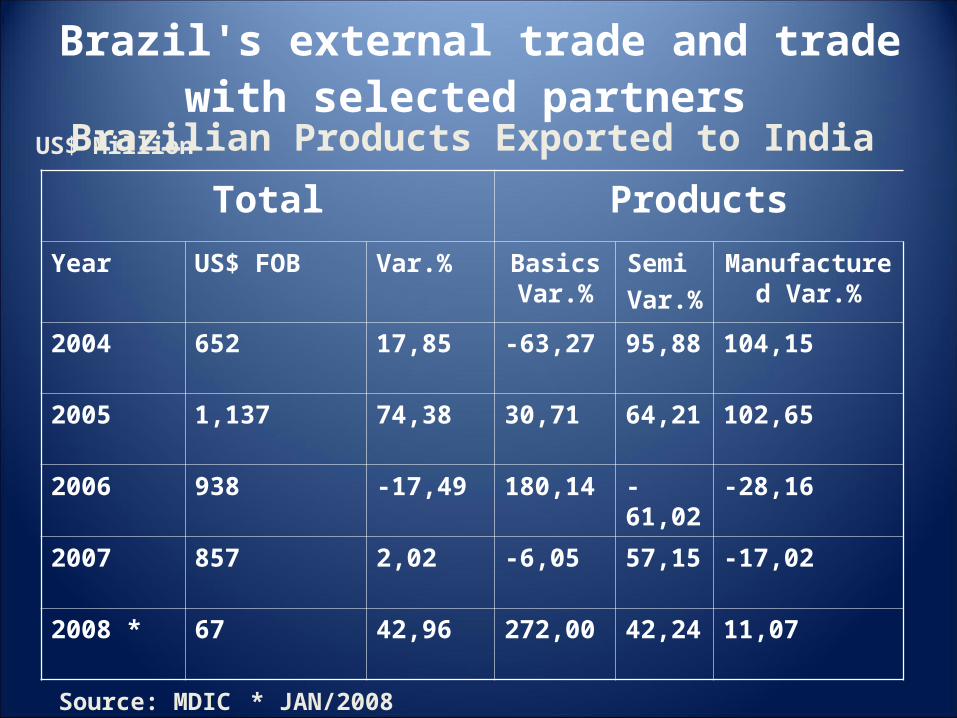
Brazilian Products Exported to India
Total Products
Year US$ FOB Var.% Basics Var.%
Semi
Var.%
Manufactured Var.%
2004 652 17,85 -63,27 95,88 104,15
2005 1,137 74,38 30,71 64,21 102,65
2006 938 -17,49 180,14 -61,02 -28,16
2007 857 2,02 -6,05 57,15 -17,02
2008 * 67 42,96 272,00 42,24 11,07
Source: MDIC * JAN/2008
Brazil's external trade and trade with selected partners
US$ Million
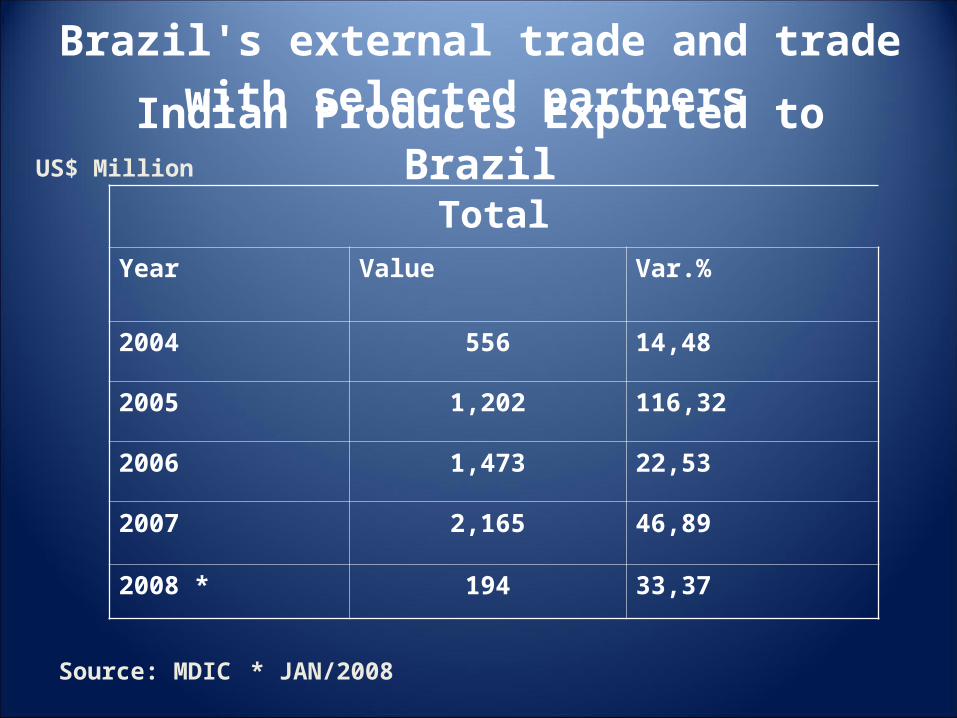
Indian Products Exported to Brazil
TotalYear Value Var.%
2004 556 14,48
2005 1,202 116,32
2006 1,473 22,53
2007 2,165 46,89
2008 * 194 33,37
Source: MDIC * JAN/2008
Brazil's external trade and trade with selected partners
US$ Million
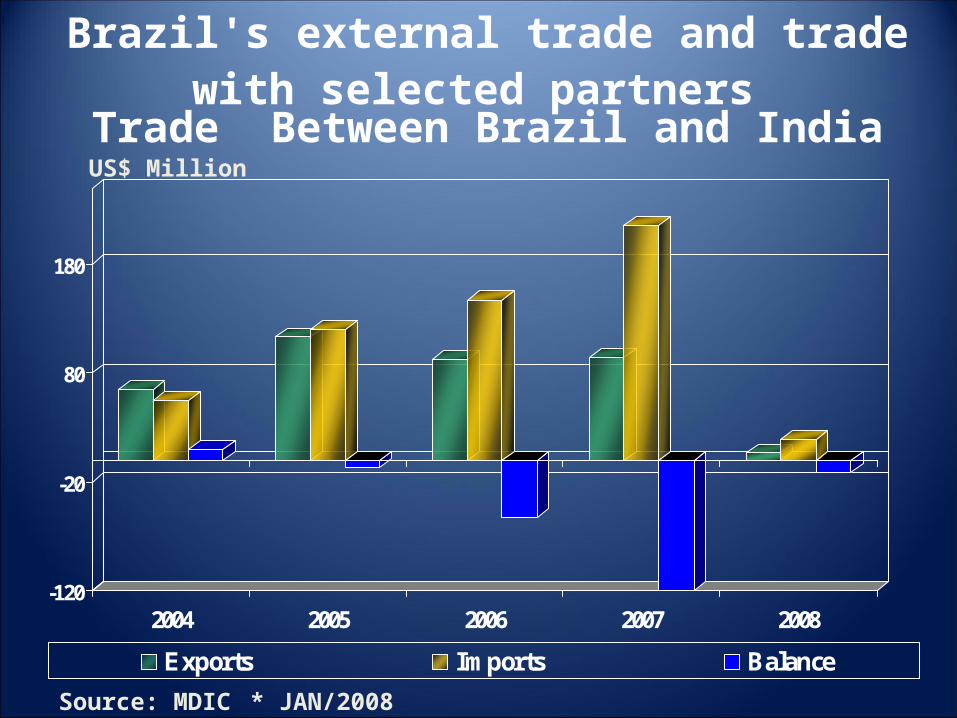
Trade Between Brazil and India
-120
-20
80
180
2004 2005 2006 2007 2008
Exports Imports Balance
Source: MDIC * JAN/2008
US$ Million
Brazil's external trade and trade with selected partners
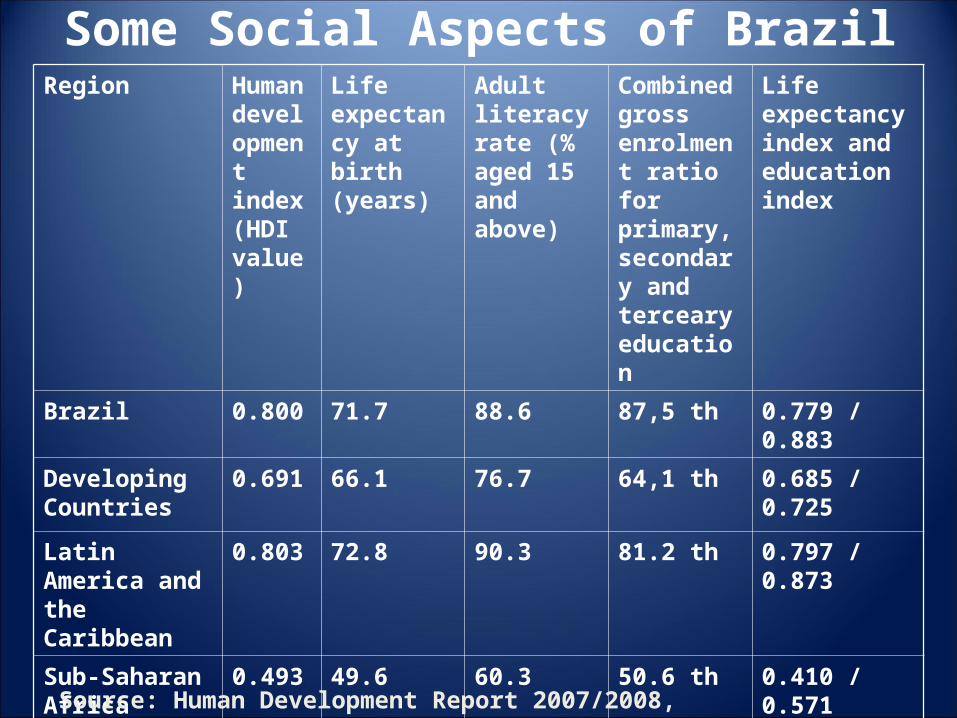
Region Human development index (HDI value)
Life expectancy at birth (years)
Adult literacy rate (% aged 15 and above)
Combined gross enrolment ratio for primary, secondary and terceary education
Life expectancy index and education index
Brazil 0.800 71.7 88.6 87,5 th 0.779 / 0.883
Developing Countries
0.691 66.1 76.7 64,1 th 0.685 / 0.725
Latin America and the Caribbean
0.803 72.8 90.3 81.2 th 0.797 / 0.873
Sub-Saharan Africa
0.493 49.6 60.3 50.6 th 0.410 / 0.571
World 0.743 68.1 78.6 67.8 th
0.718 / 0.750
Source: Human Development Report 2007/2008, United Nations
Some Social Aspects of Brazil
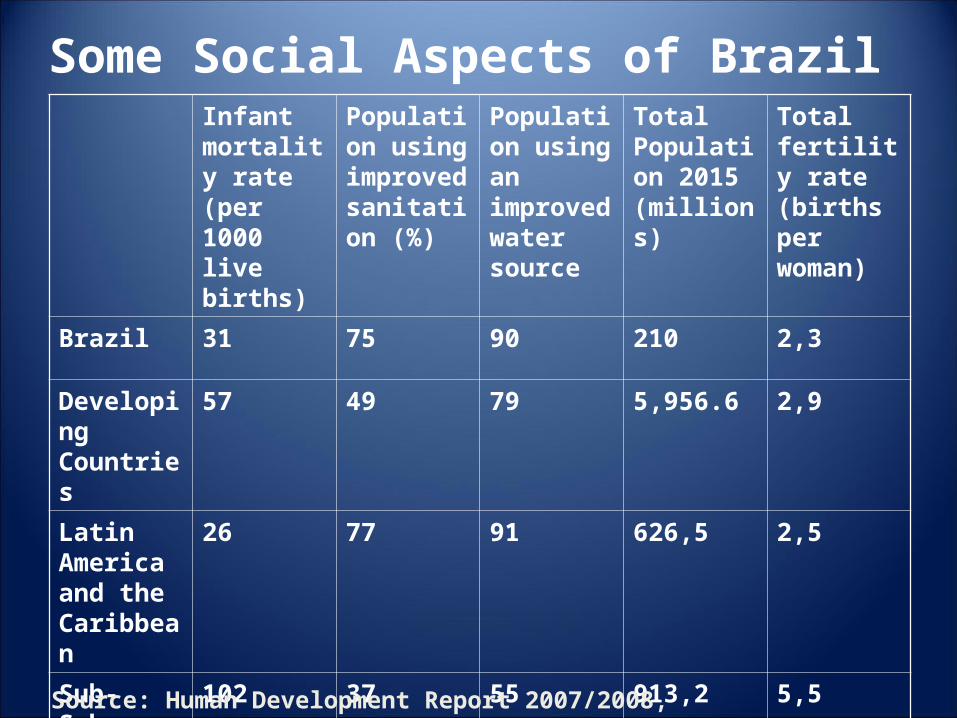
Infant mortality rate (per 1000 live births)
Population using improved sanitation (%)
Population using an improved water source
Total Population 2015 (millions)
Total fertility rate (births per woman)
Brazil 31 75 90 210 2,3
Developing Countries
57 49 79 5,956.6 2,9
Latin America and the Caribbean
26 77 91 626,5 2,5
Sub-Saharan Africa
102 37 55 913,2 5,5
World 52 59 83 7,295 2,6
Source: Human Development Report 2007/2008, United Nations.
Some Social Aspects of Brazil

General Aspects of Brazil's Foreign Policy
Brazil’s prevailing foreign policy doctrine recognizes
the country's:
• Economic;
• Technological;
• Political;
• Commercial; and
• Military vulnerabilities
Source: Ministry of External Relations of Brazil
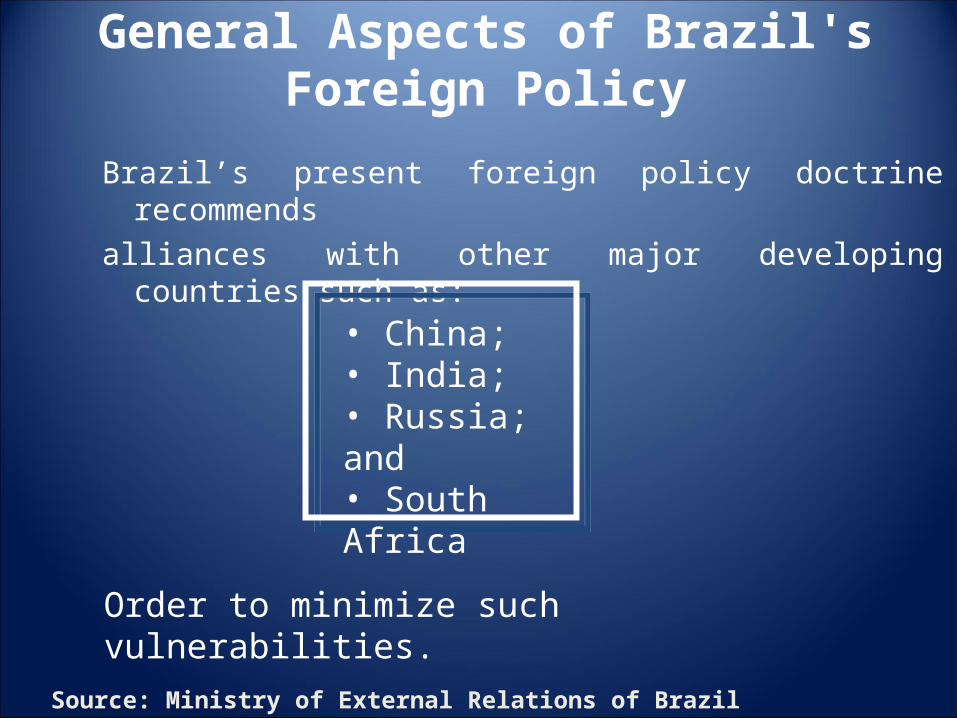
General Aspects of Brazil's Foreign Policy
Brazil’s present foreign policy doctrine recommends
alliances with other major developing countries such as:
• China;• India;• Russia; and• South Africa
Order to minimize such vulnerabilities.
Source: Ministry of External Relations of Brazil
Durval de Noronha Goyos Jr.Durval de Noronha Goyos Jr.
www.noronhaadvogados.com.br