Santos Ordóñez, Adriana Patricia
64
Academic year 2010-2011 DETERMINANTS FACTORS OF BIO-FERTILIZER AND TECHNICAL ADOPTION TO REHABILITATE COCOA FARMS VARIETY ‘NATIONAL’ IN GUAYAS AND EL ORO PROVINCES-ECUADOR Santos Ordóñez, Adriana Patricia Promotor: Dr.ir. Jeroen Buysse Co-promoter: Dr. ir. Esther Lilia Peralta Thesis submitted in partial fulfilment of the requirements for the joint academic degree of International Master of Science in Rural Development from Ghent University (Belgium), Agrocampus Ouest (France), Humboldt University of Berlin (Germany), Slovak University of Agriculture in Nitra (Slovakia) and University of Pisa (Italy) in collaboration with Wageningen University (The Netherlands), This thesis was elaborated and defended at Ghent University within the framework of the European Erasmus Mundus Programme “Erasmus Mundus International Master of Science in Rural Development " (Course N° 2004-0018/001- FRAME MUNB123)
Transcript of Santos Ordóñez, Adriana Patricia

Academic year 2010-2011
DETERMINANTS FACTORS OF BIO-FERTILIZER AND
TECHNICAL ADOPTION TO REHABILITATE COCOA
FARMS VARIETY ‘NATIONAL’ IN GUAYAS AND EL
ORO PROVINCES-ECUADOR
Santos Ordóñez, Adriana Patricia
Promotor: Dr.ir. Jeroen Buysse
Co-promoter: Dr. ir. Esther Lilia Peralta
Thesis submitted in partial fulfilment of the requirements for the joint academic degree of International Master of Science in Rural Development from Ghent
University (Belgium), Agrocampus Ouest (France), Humboldt University of Berlin (Germany), Slovak University of Agriculture in Nitra (Slovakia) and University of Pisa (Italy) in collaboration with Wageningen
University (The Netherlands),
This thesis was elaborated and defended at Ghent University within the framework of the European
Erasmus Mundus Programme “Erasmus Mundus International Master of Science in Rural Development "
(Course N° 2004-0018/001- FRAME MUNB123)

Certification
This is an unpublished M.Sc. thesis and is not prepared for further distribution. The
author and the promoter give the permission to use this thesis for consultation and
to copy parts of it for personal use. Every other use is subject to the copyright laws,
more specifically the source must be extensively specified when using results from
this thesis.
The Promoter The Author
Dr. ir. Jeroen Buysse Adriana Santos Ordóñez
The Co-promoter
Dr. ir. Esther Lilia Peralta
Thesis online access release
I hereby authorize the IMRD secretariat to make this thesis available on line on the
IMRD website
The Author
Adriana Santos Ordóñez

i
Abstract
Ecuador has been in history one of the major producer of fine cocoa aroma, currently it is
producing around 60% of world production of this variety. The fine cocoa aroma is one of the
most required at international level for its characteristics of aroma and flavor. Despite to this
advantage, the advanced age trees and the high level of diseases incidences generate a low
productivity level in the country. The lack of appropriate farm management technique such as
pruning practices, fertilization, and control diseases are the main drivers of these consequences.
Therefore, an alternative for the recovery cocoa plantation of variety National has been
developed by CIBE – ESPOL. This alternative involves the rehabilitation through an integrated
pruning farm management technique, associated with the application of an organic fertilizer –
biol - in order to increase productivity and reduce diseases incidences.
This study attempt to provide and empirical explanation of the factors associated with farmers’
decisions to adopt or not to adopt this technical improvement at a farm level. It is to found out
factors on the probability of its adoption exploring socioeconomic and farm characteristics, by
collecting primary data from a structured questionnaire survey to small cocoa farmers. These are
members of MCCH, a second- tier organization within two provinces of the country – Guayas
and El Oro.
The results of this study showed that the logistic regression model predicted five factors
influencing the technical adoption in the study area including gender, availability of family labor,
additional source of income, pruning practices on cocoa trees and high level of monilia disease
incidence. Therefore, these factors have an influence on the adoption probability of the
rehabilitation technique. Furthermore, the project contributes considerably at the level of
production since this study analyzes the impact on productivity and disease incidences on small
producers that already adopted the technical innovation. After the implementation, cocoa plant
disease significantly decreases while yields increase by 33% compared to productivity levels
before the implementation and the current situation of non-adopters. In addition, the profitability
of the technique for one hectare of cocoa variety National at the level of small producer was
performed. Resulting with a positive NPV of $1,980.09 per hectare at 10% discount rate and the
IRR calculated is 13%. Thus, the rehabilitation management technique is viable since the
producer is able to pay off the production costs and make some profit. Finally, some impact
indicators at the level of the farmers’ organization were observed mainly on how the innovation
technique gave an effect on the social capital components such as knowledge, practices and
network within farmers’ organizations.

ii
Acknoledgements
I am deeply thankful to my promoter Dr. ir. Jeroen Buysse for being supportive since the genesis
of this research, and throughout the path of this master’s dissertation. I am sincerely grateful for
his time and patient guidance with his intellectual input, advice and support. Thank you for being
part of this learning process and for always encourages me to do better. I would like to
acknowledge my gratitude to Catherine Darrot for her valuables suggestions in some aspects
along this research study.
I am deeply grateful to my co-promoter Dra. Esther Lilia Peralta – Director of CIBE-ESPOL and
the entire team. This study would not be possible without her unconditional support, absolute
confidence allowing me to contribute within the project. I am grateful to Ing. Celso Averos on
behalf of MCCH and the entire team from Guayas and El Oro provinces. They enormously
contributed and assistance during the field study.
My immensely gratitude to every small cocoa farmer who have been part of this study. I am
indebted for providing valuable information without conditions. Thanks for being the core and
the main reason for this study.
I would like to give my gratitude to IMRD team for the work and support that make possible a
great program. I am thankful to Prof. Dr. ir. Guido Van Huylenbroek for the valuable knowledge
disseminated throughout the course of the master program. I warmly thank Prof. Dr. ir. Marijke
D’ Haese for providing different approaches for a better understanding the rural development
matters. My sincere thanks to Pr.Dr.ir. Guy Durand and the whole rural development team in
Agrocampus Ouest. They provided me a broad vision in rural development experienced also in
Andean countries. Special thanks to Dr. Ramon Espinel for always encourage me to go beyond
on academic preparation.
I would like to take this opportunity to express my gratitude to my family for their moral support
during my study and to my husband, for always being by my side on every step of my life.

iii
Table of Contents
Abstract ............................................................................................................................................ i
Acknoledgements ............................................................................................................................ ii
Table of Contents ........................................................................................................................... iii
List of Tables .................................................................................................................................. v
List of Figures ................................................................................................................................. v
List of Abbreviations ..................................................................................................................... vi
CHAPTER 1: Introduction ............................................................................................................. 1
1.1. Description of the problem .................................................................................................. 2
1.2. Research questions, objectives and hypothesis .................................................................... 3
CHAPTER 2: Theoretical and conceptual framework ................................................................... 6
2.1. Cocoa: International scale ................................................................................................ 6
2.1.1. World production and consumption.......................................................................... 6
2.1.2. Trade in cocoa ........................................................................................................... 6
2.1.3. Market price .............................................................................................................. 7
2.2. Cocoa in Ecuador ............................................................................................................. 8
2.3. Rehabilitation farm management techniques ................................................................... 8
2.3.1. Bio-fertilizer .............................................................................................................. 9
2.3.2. Formulas’ components and function for anaerobic fermentation ........................... 10
2.3.3. Nutrition uptake and control diseases through leaves ............................................. 11
2.4. Adoption factors for innovation techniques ................................................................... 11
2.4.1. Adoption definition ................................................................................................. 11
2.4.2. Socio-economic household characteristics ............................................................. 12
2.4.3. Farm practices and characteristics .......................................................................... 14
2.5. Effectiveness of the innovation information - technical diffusion ................................. 15
2.6. Impact assessment .......................................................................................................... 16
2.7. Social impact – social capital ......................................................................................... 17
CHAPTER 3: Material and methods ............................................................................................ 19
3.1. Study area ....................................................................................................................... 19
3.2. Survey methods .............................................................................................................. 20

iv
3.2.1. Determination of the sample ................................................................................... 21
3.3. Data analysis methodologies .......................................................................................... 22
3.3.1. Quantitative approach ............................................................................................. 22
3.3.2. Qualitative approach ............................................................................................... 23
CHAPTER 4: Results and discussion ........................................................................................... 25
4.1. Descriptive statistical analysis ....................................................................................... 25
4.2. Binary logistic model ..................................................................................................... 29
4.2.1. Model interpretation................................................................................................ 29
4.2.2. Assessment of the fitted model ............................................................................... 31
4.2.3. Discussion of the binary logistic model ...................................................................... 31
4.2.3.1. Socioeconomic characteristics .............................................................................. 31
4.2.3.2. Farm practices and characteristics ........................................................................ 33
4.3. Impact of the project intervention on farm..................................................................... 35
4.4.Profitability of the rehabilitation technique ........................................................................ 37
4.4.1. Sensibility analysis ...................................................................................................... 39
4.5.Social Impact – social capital .............................................................................................. 39
CHAPTER 5: General conclusions ............................................................................................... 43
5.1. Recommendations for further research .............................................................................. 44
List of references........................................................................................................................... 45
List of Appendices

v
List of Tables
Table 2-1 Technologies associated with cocoa grown systems .................................................... 14
Table 4-1 Description and summary statistics .............................................................................. 25
Table 4-2 Analysis of determinants using binary logistic regression ........................................... 30
Table 4-3 Profitability of the rehabilitation technique based on 1 ha of cocoa National variety . 39
Table 4-4 Biol processing scheme vs. social capital components ................................................ 40
List of Figures
Figure 2-1 Adoption framework for this study ............................................................................. 16
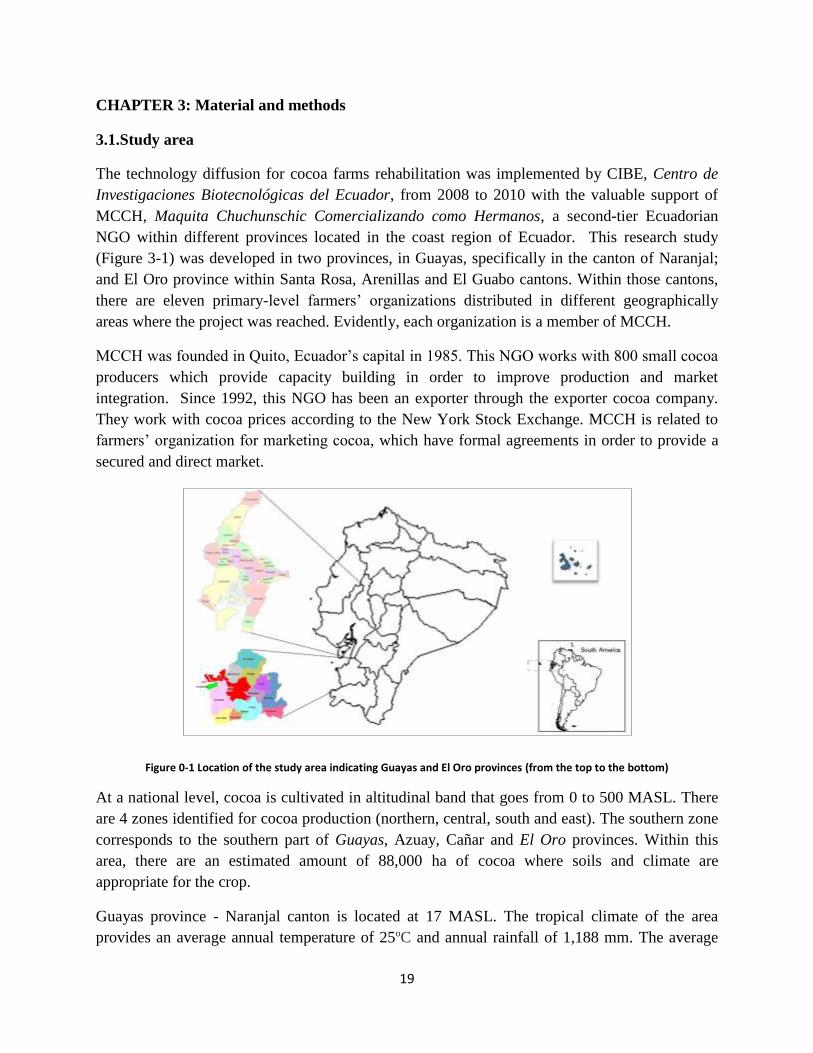
Figure 3-1 Location of the study area indicating Guayas and El Oro provinces .......................... 19
Figure 3-2 Description-classification-connection scheme ............................................................ 23
Figure 4-1 Income source of cocoa producers within the sample including adopters and non-
adopters ......................................................................................................................................... 26
Figure 4-2 Comparison the number of family members working on farm among adopters and
non-adopters .................................................................................................................................. 26
Figure 4-3 Comparison percentage between adopters and non-adopters of pruning practices
before the application of the project technique implementation ................................................... 27
Figure 4-4 Comparison proportion among adopters and non-adopters of replanting cocoa
seedlings before the application of project innovation ................................................................. 28
Figure 4-5 Comparison of project participation and monilia disease incidence before the
application of project innovation .................................................................................................. 28
Figure 4-6 Comparison of project participation and witches’ broomstick incidence before the
application of project innovation .................................................................................................. 28
Figure 4-7 Comparison of percentage between adopters and non-adopters receiving visits from
technicians to the farms ................................................................................................................ 29
Figure 4-8 Comparison of monilia disease incidence level before and after the intervention
technique on the farm within adopters group ............................................................................... 36
Figure 4-9 Comparison of witches’broomstick disease incidence level before and after the
intervention technique on the farm within adopters group ........................................................... 36
Figure 4-10 Comparison of mean yields between adopters and non adopters before and after the
application of the project implementation technique on farms ..................................................... 37
Figure 4-11 Cocoa price fluctuation 2005-2011 ........................................................................... 38
vi
List of Abbreviations
ANECACAO = Asociación Nacional de Exportadores de Cacao
CCN 51 = Colección Castro Naranjal-51
CIBE = Centro de Investigación Biotecnológicas del Ecuador
INEC = Instituto Nacional de Estadísticas y Censos de Ecuador
ESPOL= Escuela Superior Politécnica del Litoral
FOB = Free On Board
GDP = Gross Domestic Product
Ha= Hectares
HYV = High-yielding varieties
ICCO = International Cocoa Organization
IRR = Internal Rate of Return
MASL= Meters Above Sea Level
MAGAP = Ministerio de Agricultura, Ganadería, Acuacultura y Pesca
MCCH= Maquita Chuchunschic Comercializando como Hermanos
MLE = Maximum Likelihood Estimation
NGO= Non-Governmental Organization
NPV = Net Present Value
qq = quintal
RH = Relative humidity
SPSS = Statistical Package for Social Sciences
TON = Tonne
UBN= Unsatisfied Basic Needs

1
CHAPTER 1: Introduction
For many years, cocoa has represented a significant factor in Ecuador’s economy, since the last
decade of the nineteenth century; cocoa boom was reached by natural resource endowments as
well as the availability labor. Later on, as a consequence of diseases and low international prices
in the middle of the past decade, cocoa lost its importance at the national economy declining
exports levels (Correa, 2010). During the period, 1996-2000 for the national total exports, cocoa
represented an average of 2.19% (Rosero, 2002) nowadays it is the third export commodity in
Ecuador; it stands for 0.40% of GDP in the country and 6.7% of the GDP of agriculture and
livestock sector (Quingaísa, 2007). According to the III National Agriculture Census, at a
national level more than 96.000 cocoa farms have been registered representing a total surface of
468.841 ha covered with only cocoa, as well as associated with other crops (INEC, 2009).
There are different cocoa varieties in the country; the most important are National variety and the
clone called CCN51. This clone is cultivated extensively because it is tolerant to diseases and it
is highly productive although, it is considered an ordinary cocoa. On the other hand, National
variety is a Criollo cocoa, botanically known as forastero amazonico. It is susceptible to diseases
but its aroma and characteristic produces high quality chocolates. Traditionally, Ecuador is
considered as a world’s largest producer of fine flavor cocoa for this variety because it stands for
60% of the world production. It is characterized for a short fermentation and gives a special
flavor and aroma to chocolates making it internationally recognized (Quingaísa, 2007). Ecuador
has a comparative advantage for this cocoa variety which is exclusive from the country and its
production and commercialization should be optimized.
There are different issues related to cocoa crop that directly affects its production especially in
National variety such as (i) Low productivity, due to deficient farm management and agriculture
techniques which makes plants vulnerable to diseases incidence; (ii) Inappropriate post harvest
management at the level of producers reduces beans quality; (iii) Adoption of the clone CCN51
at farm level, created a mix varieties together with National variety affecting country reputation
as an international export commodity; and (iv) Difficulties for small cocoa producers in order to
access to the commercialization chain do not allow its market integration. Taking into
consideration high transaction costs that at the same time makes them price takers.
This research is focused mainly on the adoption of a farm management technique associated with
an organic fertilizer as an alternative to increase productivity of National variety. Its content is
structured by the following parts:
In the first - Description of the problem – chapter, a background of the problem is provided with
a brief explanation of its causes and consequences for small cocoa producers. Then, a project is
described that can be an opportunity to build up a solution developed by an Ecuadorian research
institution. Through this research, it is assumed there are many factors that influence the
2
probability of its adoption, as well as drivers’ decisions effects. In addition, the research
questions with hypotheses to be tested in the study are presented.
In the second – Theoretical and conceptual framework – chapter, a brief explanation of cocoa
production at international as well as national context is presented. In addition, relevant literature
concerning to the rehabilitation farm management technique and its importance for cocoa
production are summarized. Moreover, the chapter describes the bio fertilizer -biol- production
and the main components formula, including its benefits as plant fertilization and sustainable
practices. In addition, adoption factors such as socioeconomic, farm characteristics and diffusion
of the innovation technique at the level of small producers. The chapter also describes an
adoption framework in order to have a relationship in a system to analyze the research problem
with its variables and hypothesis. Furthermore, impact analysis literature is summarized for the
project outcome evaluation. Finally, it is also including relevant information of social capital for
the social impact as a project contribution at the level of small farmers’ organization.
In the third – Material and methods – chapter, with the description of the study area, as well as
tools and methodologies used with specific reasons for its choice; in order to give scientific
rationality to this study results for the quantitative and qualitative approach.
In the fourth – Results and discussion- chapter presents the research findings firstly with
descriptive statistics analysis. Later on, results are presented based on previous tools with
quantitative applications in social sciences. A probability model is built with its interpretation, by
making a review of research hypothesis about adoption factors of the rehabilitation technique.
Besides, remarks on their validity based on research results. Furthermore it is presented the
impact of the project explaining changes on farm taking into consideration the effects on
productivity and diseases incidences. It is also developed the profitability of the rehabilitation
technique. Likewise, the social impact is described specifically at the biol elaboration scheme
within farmers’ organization, in order to assess the effect of the project within farmers’
organization as a complement for results analysis and further discussions.
In the final – Conclusions and recommendations – chapter by addressing general conclusions,
recommendation and implication for further research.
1.1.Description of the problem
The cacao variety National predominates due to its physical and organoleptic characteristics
which depend on various factors such as genetic diversity, plant health environment,
fermentation process, drying and beans’ classification during post harvest stage (Enríquez,
2004). Just taking into account yields aspect, the variety National has shown low productivity
affected by advanced age trees, presence of disease mainly witches’ broomstick (Crinipellis
perniciosa) and frosty pod or monilia (Moniliophthora roreri), that it is mostly caused by
deficient agricultural management. It could be the consequence of the bad socioeconomic
conditions which is the case of small farmers (Quiroz et al, 2002). In addition, plant fertilization
3
demonstrate a significantly raise in yields, plant absorption increases rapidly during the first five
years of the plant, later on it stabilizes keeping the absorption rate for the following years. If the
plants nutrients requirements are adequate and the farm techniques are appropriate, they would
not be highly susceptible to diseases. When cocoa crops have problems with diseases incidence,
it could cause losses between 40 and 80% (Pastorelly et al., 2006). The diseases mentioned
before, have the perfect environment to attack because they are able to grow in high humidity
setting like in cocoa plantation. Usually these settings could reach more than 80% of R.H. One
way to control plant health is through pruning practices by providing (i) balanced structure, (ii)
allow access to light and (iii) air circulation within cultivated area. All of these practices are not
always applied at small cocoa producers’ level causing poor farm management and low
productivity.
Therefore, an alternative technique is proposed by CIBE-ESPOL in order to rehabilitate
traditional cocoa farms variety National. Rehabilitation consists in correct management
agricultural practice that eliminates useless or unnecessary parts of cocoa trees or pruning
techniques. It simultaneously reduces its altitude and allows shade regulation that trees needs to
fulfill for its physiological functions. This also contributes gradually on reducing diseases
incidence. The main purpose is to stimulate primary branches to facilitate photosynthetic
activity. Additionally the rehabilitation provides an ideal environment that does not allow
diseases propagation.
These rehabilitation practices are associated with the application of a liquid organic fertilizer -
biol- which results from organic compounds fermentation made by the microbiological activity
producing minerals, amino acids, organic acids under anaerobic conditions. It complements the
stimulation of cocoa trees in order to increase productivity and reducing diseases propagation.
This is a technique that has been developed in different regions over the country. Besides its
advantage for cocoa crops, there are benefits being a sustainable practice without the use of
pesticides and building social capital within small farmers’ organization.
1.2.Research questions, objectives and hypothesis
This research attempts to identify what factors are influencing the adoption of technical
rehabilitation practices by small cocoa farmers, with reference of the previous project developed
by CIBE-ESPOL. Similar to other innovated techniques, adoption is a complex process that
could be influenced by a number of factors, such as socioeconomic farmers’ characteristics,
access to and level of resources, and provision of extension related to technical diffusion. In
addition, to determine what the principles drivers are those which motivate farmers to adopt it.
Thus, farm level studies could provide insights into particular key factors affecting use and
management of rehabilitation techniques and its sustainability.
In addition, within the adopters group of the technical rehabilitation, it is possible to assess
changes in the farm related to productivity and plants disease incidences after the

4
implementation of the technical innovation. Therefore, this study also attempts to identify
whether changes on the farm related to the technical innovation gave an effect on improving
productivity and declining disease incidences. Thereby, to determine whether the rehabilitation
technique provided beneficial effects on farm taking into consideration yields (tonne/ha) as an
impact measure and level of diseases incidences.
Furthermore, within the framework of the rehabilitation technique, it is also a contribution for
adopters and prospective adopters to determine whether the rehabilitation technique is profitable
and viable at the level of small cocoa producers. The profitability is calculated by the estimation
of the economic return per hectare under these innovation practices (adequate pruning cocoa
trees and biol application). Taking into consideration the costs and returns of rehabilitating cocoa
farms at the level of smallholders.
Lastly, established beforehand that the rehabilitation technique was diffused at the level of small
farmers organizations; it is complimentary to recognize how the effect of the technical innovation
influenced on the social capital within farmers’ organization. The effect on social capital is done
by identifying changes on the components of social capital with the technical innovation.
In order to meet these research questions the following objectives are presented and hypothesis
will be tested with quantitative and qualitative approaches through the most appropriate
methodologies.
Objectives
Determine factors that encourage small farmers’ decision on the adoption of
rehabilitation technique on cocoa farms.
Identify the impact on productivity and plant disease incidence at a farm level for
adopters group of the rehabilitation technique.
Determine the profitability of the rehabilitation farm management technique on cocoa
production.
Establish how the rehabilitation technique generates changes on social capital within
small farmers’ organization.
Hypothesis
Socio economic characteristics have an influence on the probability of adoption
rehabilitation technique.
Farm practices and characteristics have an effect on the probability to adopt the
rehabilitation technique.
There is a positive effect on yields and plant diseases incidences on cocoa farms due to
the adoption technique.
The rehabilitation technique is cost effective and viable for small cocoa producers.
Adoption technique has an effect within farmers’ organizations.

5
The adoption rehabilitation technique generates an effect on farmers’ decision-making
towards tendencies over organic agriculture practices.
There is a significant knowledge acquisition from extension practices, and technical
diffusion expressed by small cocoa farmers related to technical farm management, and
biol production.

6
CHAPTER 2: Theoretical and conceptual framework
2.1.Cocoa: International scale
Cocoa, Theobroma cacao, is native from Central and South America. The Mayan civilization
began to cultivate cocoa trees over 2000 years ago. Within this civilization, cocoa seeds were
given a high value because they were used as currency. Aztec civilization continued with the
tradition of making a strong tasting drink called “xocolatl” giving energy and vitality. Cocoa was
considered food of gods and reserved its uses for people with high social standing. From the
nineteenth century with the development of the chocolate industry in Europe the cocoa
production increases rapidly. Within this context, countries like Brazil and Ecuador became main
producers. Later on, during the colonial times in Africa was promoted cocoa cultivations first to
Ghana and then spreads through Nigeria, Cameroon and Ivory Coast.
2.1.1. World production and consumption
World cocoa production is concentrated in tropical countries of Africa, Asia, Central and South
America. The main global producers are Ivory Coast (38%), Ghana (21%), Indonesia (13%),
Nigeria (5%), Cameroon (5%), Brazil (4%), Ecuador (3%) and Malaysia (1%) covering over
90% of world production. ICCO (International Cocoa Organization) estimates the production of
cocoa beans will increase by 2% in the coming years compared to a rate of 1.7% over the
previous 10 years. Production could reach 3.9 million tons by the year 2012.
The main producer of fine cocoa aroma is Ecuador (61%) followed by Indonesia (10%). In the
2007/2008 which is considered a cocoa year, the world cocoa production was 3’634.000 tons
while the world production of fine cocoa aroma for the same year was 173,000 tonnes
representing 4.77% of the total production. The fine cocoa aroma is one of the most required in
the international market for its particular characteristics of aroma and flavor.
The consumption of chocolate products increased at an annual growth rate of 1.3%. Although it
represents a relative low level in volume, the cocoa and chocolate market has observed changes
in consumer’s taste. Besides, the consumers perceptions of the chocolates benefits with dark high
cocoa content chocolate consumption.
The market for fine cocoa aroma are concentrated in European countries, the main countries are
Belgium, Luxembourg, France, Italy, Germany, Switzerland and Britain. The Unite States is also
developing this cocoa market of aroma and scent. Therefore, these countries are potential
consumers of this special cocoa with flavor and aroma characteristics.
2.1.2. Trade in cocoa
Regarding the cocoa beans and cocoa products exports, African regions account for 77% of net
world exports being the largest supplier of cocoa to the world market followed by Asia and
Oceania for 17% and Americas for 6%. The market remains on behalf of Ivory Coast,

7
representing 39% of global net exports followed by Ghana and Indonesia for 20% and 16%
respectively. Although there are countries like Brazil and Malaysia considered also main
producers, they are not necessarily large exporters due to the size of their processing industry
that depends on the local production. In Latin American, the main exporters are Ecuador with
3% and Dominican Republic with 2%.
According to ICCO annual report (2010), European countries account for 50% of total world
cocoa consumption, followed by America (33%), Asia (15%) and Africa (3%) in 2007/08. The
main consuming countries were United States (750,000 tonnes), Germany (317,000 tonnes),
France (235,000 tonnes), United Kingdom (225,000 tonnes), Russian Federation (200,000
tonnes), Japan (166,000 tonnes), Brazil (143,000 tonnes), Italy (106,000 tonnes), Spain (105,000
tonnes) and Poland (73,000 tonnes). It is important to highlight that the average per caput
consumption is 6.14 kg in 2007/08, and it surpassed 4 kg in countries located in Northern Europe
like Belgium, Estonia and Denmark. The highest was Switzerland with 5.62 kg followed by
Belgium with 5.59 kg per caput consumption during 2008/09.
2.1.3. Market price
Cocoa prices are internationally set according to the world supply and demand. These are subject
to significant fluctuations between periods. Clearly these prices are a long – term pattern linked
to the cocoa production cycle that lasts twenty years. During this cycle it is found periods of
boom and bust, the first generates a surplus of production that initially causes a fall in prices and
then stagnation. That is, prices fall as a result of overproduction, which gives a negative impact
on producers, in response of this they tend to diversify that allows prices to recover.
According to the ICCO report (2010) which cover the period from 2000/01 to 2009/10 mention
that cacao surplus and demand have been characterized by wide fluctuations in both. It has
yearly growth rates between minus ten per cent and plus thirteen per cent of production. There
have been great fluctuations because of changes in international cocoa prices, specific local
markets and conditions, and distance from the port and quality.
With regards to farm gate prices, for the majority of cocoa producing countries it has been
determined by international prices. The difference between countries in the share of international
price is captured by farmers, depends on several economic variables such as the efficiency of the
internal market system, the quality of the beans, the cost of transportation, and the level of
internal taxation.
The average international price measured by the ICCO daily price, increased by 3% compared to
the previous season, to USD 2,599 per tonne in the 2008/09 period. This rise could be explained
by the production deficit experienced in the previous season. Although, environmental
macroeconomic issues like the US dollar fluctuation against to other currencies, and the global
economy perspective had an impact on cocoa market.
8
2.2.Cocoa in Ecuador
At national level, cocoa exports account for the third important commodity after bananas and
flowers. In 2009/10, the cocoa beans exports were 130,737 tonnes while for processed cocoa
(pasta, liquor and butter) was 19,966 tonnes. Cocoa sector creates employment for about 600,000
people of different cultures and ethnic groups that are directly linked to the activity. The cocoa
market chain represents 4% of the economically active population and 12.5% of the agriculture
economically active population. According to the National Agriculture Census (2000), 49% of
plantations are less than 10 ha, 38% are among 11 and less than 50 ha and 13% are greater than
50 ha. The total cocoa production surface at national level is 468,841 ha whereby 233,259 ha are
more than 20 years old of production, and 95,444 ha are associated with other crops such as fruit
or timber species, which contributes to biodiversity and soil protections (INEC, 2009).
In the domestic market, besides the influence of the international prices behavior, is affected by
the intermediaries who buy cocoa beans from producers with a lower price, and then it is offered
to different exporters or chocolate industries. This reveals that cocoa market within the country is
still informal and harms especially small producers.
The Ecuadorian cocoa consumption in the international market are mainly from European Union
(40%) and United States (48%), representing about 88% in the form of cocoa beans and
processed products. Although the quality of aroma and flavor of National variety is highly
demand, it is low productive compared to cocoa CCN 51. Small producers inter alia, have
difficulties at the level of production due to mix varieties and lack of renewal plantations,
whereby cocoa crop present acceptable yields up to 8-10 years as long as it receives good farm
management. At the internal market stage, small producers are the base of a long market chain,
which does not allow getting an appropriate price. In addition, only 10% of producers are
members of an association which creates low performance in the market chain and low access to
resources and information.
2.3.Rehabilitation farm management techniques
After several years, cocoa farms became unproductive when they were abandoned and not
treated with correct farm management techniques along the time. For this reason, it is necessary
to start a rehabilitation process. It is a procedure that implements different practices step by step,
reducing the factors that cause low productivity. In this case, pruning rehabilitation is
recommended which consists on cutting old or infected branches leaving only 25% of better
branches (Enríquez, 2004). The main purpose is to regenerate cocoa trees, in order to stimulate
sprouting and flowering for future healthy pods. Before doing this type of pruning, it is necessary
to make an appropriate diagnostic by identifying possible issues within the cultivated area. It
consists on shade regulation, as well as recognizing tree by tree with the intention of pruning,
cutting until a determined height or if it is required replacing it with new plant material
(Pastorelly et al., 2006). Within the project, this was the first step in order to rehabilitate cocoa

9
farms, to remove old and infected branches for two reasons; (i) elimination of inoculum source
of plant diseases and (ii) shade regulation for entry light plus aeration, to be able to stimulate
new shoots and proceed with the selection of the best ones that will assure a better production.
For a correct farm management technique in cocoa production, having pruning practices is the
key component for a proper plant grow, occasionally this is not the case of small or medium
cocoa producers. There are different types of pruning according to plant age and conditions.
These are pruning for shaping, maintenance, plant health maintenance and rehabilitation. Giving
shape to the plant is basically to leave three or four primary branches during the first two years.
The idea is to maintain a plant balance, eliminating unnecessary branches, which at the same
time promote an accurate leaf area with high photosynthetic capacity. After two years, plants
need to keep a balance between pods production and functional leaves as each pod demand nine
to ten leaves for the normal plant physiology (Enríquez, 2006). Besides it removes dead branches
and maintains an appropriate plant height. For plant health maintenance, it is essential to
remove infected parts and pods from the plant. When this type of pruning is not made, it is
common to find infected cocoa pods with monilia or frosty pod (Monilia roreri) during the
harvesting process and before. Finally, pruning for rehabilitation as was mentioned before is to
regenerate trees that grew without any practices techniques from the beginning of the plant grow.
2.3.1. Bio-fertilizer
Bio-fertilizer is a liquid organic fertilizer produced by the fermentation of organic compounds.
This process comes from an intensive microbial activity. The organic compounds are used to
transform minerals, vitamins, amino acids, organic acids and other metabolic substances
(Robalino, 2011). The main purpose is to increase the number of these microorganisms that
accelerate microbial processes in such a way enlarges the nutrient quantities that can be
assimilated by plants (Suarez, 2009). These microorganisms normally live on soils, and can be
reproduced through a biodigestor system where artificial inoculation is required (Castilla, 2006).
This process is made possible based on cow manure dissolved in water, enriched with milk,
molasses and ash which are placed to ferment for several days in plastic tanks under anaerobic
conditions (Pinheiro, 2000) to accomplish a correct energy balance. Its function is principally the
nutritional activation through organic acids, vitamins, minerals, enzymes, amino acids and sugars
(Basantes, 2009). The importance of these compounds is the capacity to provide or mobilize
nutrients in the plants with a minimal use of nonrenewable resources (Castilla, 2006).
Furthermore biol enriched with ash, rocks or mineral salts during the fermentation period allow
the production of a balance colloidal solution where the effects are superior compared with
micronutrients technically recommended by agro industry mainly in foliar application (Pinheiro,
2000)
Biol is basically a product coming from organic substrate fermentation through microorganism
activity; bio fermentation process takes place when microorganisms are able to transform organic
elements into essential compounds for nutritional plant balance (Restrepo, 2001). It occurs

10
without external electron acceptor that takes place under anaerobic process where organic
compound is partially oxidized; and microorganism only gets a small amount of energy. The rest
is left in products of oxidation and other part takes form of heat. Therefore, fermentation is a
process of energy release in the absence of oxygen where biological oxidation is carried out by a
microbial population activity (Suarez, 2009). In addition, Weiland (2009) recognizes anaerobic
treatments minimize the survival of pathogens which is important for using the digested residue
as fertilizer.
2.3.2. Formulas’ components and function for anaerobic fermentation
This process is possible to do it at a farm level. In addition, this technical diffusion was carried
out by CIBE during the rehabilitation project of cocoa farms. The elements that make it possible
according to this project are water, fresh cow manure, molasses, milk, burned rice husk,
phosphate rocks, minerals in low quantities such as potassium, magnesium and sulphur and
microorganism. According to Pinheiro, (2000) these materials are basic ingredients to prepare
organic fertilizer, that can be applied on any crop and can be prepared by any farmer although
the addition of mineral is optional, that depends on crop requirements and availability.
Furthermore, all these are stored in a biodigestor system under anaerobic conditions. The basic
principle of a digester operation is the same of animals, which is breaking down food into simple
compound for bacteria absorption on intestine conditions of humidity, temperature and acidity
levels (Basantes, 2009).
The main function of every component is (i) cow manure, which gives active ingredients for the
fermentation process that is microorganism. It is constituted by bacteria responsible for
digestion, metabolism and break down compounds into nutrients, available for plants during
fermentation period (Basantes, 2009). Cow manure is rich on nitrogen levels, as well as
phosphorus and potassium (ii) Molasses provide the main energy source for fermentation
procedure, which allows the microbiological reproduction (Restrepo, 2001) (iii) Milk has lactic
bacteria that are able to control pH levels, as an important function for the fermentation period
(Ito, 2006) (iv) Burned husk rice offers a source of silica, phosphorus and potassium (v)
Phosphate rocks, and mineral which enrich biol with micronutrients elements for plants
fertilization and, (vi) water is the liquid medium that allow chemical reaction under anaerobic
fermentation process.
According to Ito (2006) the fermentation process could be accelerated by adding microorganism
into the bio fertilizer. Pacheco (2006) states that microorganism collected in the forest are able to
form an active microbial inoculum for bio fertilizer under anaerobic conditions. Once
microorganisms are collected, they are placed in a nutrient substrate with adequate conditions, to
achieve a mass reproduction in organic waste. Besides biol production, another main component
of the technical diffusion of CIBE was the optimal microorganism collection in mountains and
forest areas.
11
2.3.3. Nutrition uptake and control diseases through leaves
Enriquez (2004) suggests in production of organic cocoa, the use of liquid organic fertilizer
produced by the biodigestion process specifically over leaves. It is necessary to estimate an
adequate proportion dilution in water; otherwise leaves could be burned due to high concentrate
substance found within biol. Basantes (2009) states that, leaves are not specialized organs for
nutrients absorption as roots, although studies have shown that nutrients are absorbed in solution
in some area points of leaf cuticle. These areas serve excrete aqueous solutions from leaves
therefore, it is suitable for the penetration of aqueous solutions of nutrients to the leaf.
In addition, bio ferments can play a significant role by reducing pest incidences during the
colonization of plants surfaces; microorganisms in fermented fertilizers are able to present an
antagonism relationship and competition with different pathogenic microorganism and prevent
plant diseases (Pacheco, 2006). Foliar spray application must be taking into consideration. It is a
practice which allows immediate incorporation of the metabolites essential elements generated in
the photosynthesis process.
Additionally, there are some factors that influence foliar absorption such as pH concentrated
solution, drop size of liquid fertilizer, plant status and environmental factors such as wind, light,
humidity and application time. Therefore, the technical diffusion was achieved with the
recommendation for the correct application (with the use of pump motor and electrostatic
nuzzles), which gives an appropriate drop size in order to make an effective practice.
2.4.Adoption factors for innovation techniques
As it was mentioned previously, the rehabilitation process on cocoa farms has two main
approaches; pruning on cocoa trees and the application of bio- fertilizer. During the rehabilitation
project carried out by CIBE and MCCH, the main activity was the diffusion on how to prepare
and apply this organic fertilizer. This is elaborated by small cocoa farmers or farmers’
organization. It is relevant to develop an analytical framework for studying adoption process,
where a model of farmer’s decision-making for adoption innovation is built.
2.4.1. Adoption definition
A range of factors can be seen for adoption innovative techniques. Rogers (1962) gives an
adoption definition, as a mental process that individual passes from first hearing about an
innovation to final adoption. Lewellyn (2007) states that for considering and overall adoption
learning process, it is helpful to unbundle the range of factors, which could lead to perceptions of
overall relative value of innovation that is new for the farmer. Therefore, adoption decision
making could be assessed separately within socioeconomic factors, farm characteristics, and
diffusion techniques aspects. Tiwari et al. (2008) cited that individuals pass through some
learning and experimenting phases, from the problem’s awareness, possible solutions and, finally
deciding whether adopt or not adopt the particular technology. De Graaf et al. (2008) mention
12
that according to sociologists like Rogers and Shoemaker in 1971, the adoption process can be
considered as a learning process involving four different stages such as awareness stage,
evaluation stage, trial stage and adoption stage. On the other hand, within economics studies
there is assumed that farmers’ decision-making strive to utility maximization. The mainly
potential profits as well as other factors are considered. That is, households will adopt a
particular technique whether the expected value of benefits from using the technique, goes
beyond the value of benefits of using current practices or simply not using it (Odendo et al.,
2009). De Graaf et al. (2008) in studies of long-term soil and water conservation adoption,
consider three phases in the adoption process (i) the acceptance phase that includes the
awareness, evaluation and trial stages as mentioned by Rogers and Shoemaker (1971), (ii) the
actual adoption phase whereby investments such as capital and labor are implemented, and (iii)
the continued use phase or final adoption whereby adoption is maintained over the years, besides
new ones are replicated on other fields. According to Rogers (2003) adopters could be classified
into five different categories based on its innovative ratio normally distributed, which are
innovators, early adopters, early majority, late majority and laggards.
Ommani et al. (2009) cited diffusion on innovation definition by Rogers (1983) as a process,
whereby an innovation is communicating through diverse channels over time amongst members
of a social system. It is a way of releasing a particular innovation hence; it can be assumed that
there is a positive correlation between awareness about innovation and its adoption. Within a
social system, it could be different drivers that motivate an adoption innovation. Baerenklay et
al. (2005) mention that there are two drivers which determine if a farmer could adopt a new
technique: whether it is profitable and whether his or her peers accept it. This is more common
within innovation techniques that are diffused at the level of farmers’ organization.
2.4.2. Socio-economic household characteristics
Socio-economic condition such as age, gender, education, income, ability of diversifying
income, presence of cash crops on the farm, and household labor availability, could be possibly
factors that determine adoption of an innovation on cocoa farms.
For the effect of adoption related to farmers’ age, previous research evidence that the younger
the household head, its probability of adoption will be higher (Tiwari et al., 2008). Hence,
younger farmers will be more willing to adopt innovative techniques, while older farmers
probably for investing time in new practices may not be willing to take it. Therefore, age of the
household head is expected to be negatively associated with the adoption (Odendo et al., 2009).
With regard to gender, different empirical studies examined whether gender has an effect on
adoption innovation. It is found that man and women farmers made the same adoption decision,
within some others studies, it is observed that female household head are less likely to adopt new
techniques (Doss, 2006). The fact is that in developing countries males are expected to have
13
higher possibilities of adoption of innovation because of greater access to resources and
information (Odendo et al., 2009).
Concerning to the farmers education level, Tiwari et al., (2008) found when household head is
better educated has and increased ability to assess information, strengthened the analytical
capabilities and better understanding of new technologies. In addition, it is evidenced by
Marenya and Barret, (2007) that the marginal effect of secondary education on the probability of
adoption, it is larger compared with primary education of the innovative technique. On the other
hand, related to knowledge on agriculture practice, Llewellyn (2007) state that farmers are
becoming better educated and have greater access to information technology. There appears to be
a growing demand for ‘in my backyard’ research information.
In relation to household labor availability, according to the findings by Marenya and Barret
(2007) in a soil fertility management adoption, the number of adults per household was
statistically significant and positively associated with its adoption. Family labor is important to
avoid the cost of hiring wage laborers. Therefore, when family is larger hence more labour is
available. Family size members could have a positive correlation with adoption of the
innovation, because a larger family has more labour available for production and adoption. Graff
et al. (2008) state that the amount of labour will depend on the amount of effort required for the
adoption.
Regarding the income diversification at the level of smallholders, Bentley et al. (2004) mention
that a survey on cocoa farms has shown that citrus is a source of income able to manage the
fluctuations of household cash requirements. Whereby among cocoa plants, citrus fruit is
produced and consumed while the surplus is sold as a supplement cash income from cocoa
production. In addition, Bentley et al. (2004) state that trials demonstrated the growth
performance of cocoa associated with annual crops was either superior or equal, compared with
cocoa performance in monoculture.
Tiwari et al., (2008) mention that cash crop production has a rapid net return, whereby it was
hypothesized that high income from cash crops positively influences adoption of improved soil
conservation technology. It also raises the point, that farm household who have family members
employed locally in off-farm activities; they are able to invest higher amounts on the adoption.
However, from other empirical studies it was hypothesized that off–farm income could motivate
adoption, because having family income implies the ability to invest and to bear the risk
associated with its adoption (Tiwari et al., 2008), (Doss, 2006). On the other hand, De Graaff et
al., (2008) point out that off-farm work was one of the most significant factors that negatively
affected the adoption decision. It was concluded that farmers engage themselves in off-farm
income earning activities in the nearby town. This discourages them to make continued use
innovative practice on farm.

14
2.4.3. Farm practices and characteristics
Farm characteristics and practices are considered relevant variables for producers’ decision for
the adoption innovation. These are farm size, type of agriculture, farm system, farm
management practices, presences of diseases and yields.
Tiwari et al., (2008) found the effect of land holding size is positively and significantly
correlated to adoption innovation, meaning that producers with more land are more likely to
invest and can take more risks. Odendo et al., (2009) have found evidence that farm size was
negatively associated with adoption of the combination of organic and inorganic fertilizers. This
implies that results do not support the arguments that larger producers that have more investment
capacity also have higher probabilities of adoption. Hence, empirical results are no always
confirming standard economic assumptions.
Rise and Greenberg (2000) state that cocoa farms may offer environmental benefits depending
on its management system. On one hand, there is a low yield system with few agrochemicals
requirements where generally shade forest remnant is found. On the other hand, farm systems
with high input level without shades trees obtain high yields. These are different production
patterns where biodiversity and livelihood strategies differ among them. Rise and Greenberg
(2000) establish differences between cocoa farm management system which are; (i) rustic cocoa
management, (ii) planted shade system, and (iii) zero-shade cocoa. Rustic cocoa is planted
generally under naturally regeneration forest, while planted shade farm system is a form of
traditional polycultural method. Under this system, cocoa is grown under or intercropped
primary with fruits and fast growing timber trees. Zero-shade cocoa cultivation with few or any
shade trees species supports low level of biological diversity.
Bentley et al. (2004) conclude on the intercropping cocoa study in Ecuador, that shade, fruit or
timber trees are part of intercropped cultivation. Sun cocoa could be considered as a package of
HYVs monoculture system with agrochemical, fertilizer and irrigation. Although small farmers
are more likely to use traditional and aromatics cocoa associated with shade trees, taking into
account that this traditional cocoa is slowly disappearing (Table 2-1). Therefore, it is also
suggested that would be easier for farmers to keep traditional and aromatics cocoa whether they
received a price premium for aroma and quality.
Table 0-1 Technologies associated with cocoa grown systems (Source: Bentley et al., 2004)

15
According to Hebbar (2007) the fine flavored National cocoa variety cultivars in Ecuador are
highly susceptible to frosty pod (Moniliophthora roreri), and witches’ broomstick (Crinipellis
perniciosa) where losses can range from 30 to 80%. Even though, recommendations for
integrated farm management exist, they have been adopted only by few farmers. The mixing of
healthy and fungus infested pods lead to a low overall quality. The application of cultural
practices and fungicide application is very difficult especially for trees higher than 5 to 6 m.
Whereby, reduction of tree height can reduce diseases significantly and double yields from a
current 300 kg/ha (6.6 qq/ha) to at least 600 kg/ha (13.3qq/ha). The control of cocoa plant
diseases is through farm practices eliminating branches, parts or pods infected with the purpose
of gradually eliminating the diseases and its source infestation (Anecacao, 2006).
2.5.Effectiveness of the innovation information - technical diffusion
The quality of the information and the effectiveness of the technical diffusion could be
considered significant factors for adoption decision.
Baerenklau et al., (2005) state that technology adoption models have made explicit the role of
information uncertainty and endogenous learning procedure in the technology adoption process.
It has been identifying two different types of the learning process, which are learning by doing
and learning from others. When farmers apply innovations they observe own output and this
increase confidence, which can lead to the continued application of the innovation. In contrast,
farmers learning from others, do not have own observations of the realized output which can lead
to uncertainty. This uncertainty can explains why the adoption rate is lower when farmers have
to learn from others.
Doss (2006) states that some adoption studies consider the number of extension visits received
the farmer or whether the farmer attends to a demonstration field day. These measures indicate if
the information was available to the farmer but it does not indicate whether the farmer took
advantage of it. Thus, farmers could have access to adoption information but do not completely
use it. For this reason, by measuring whether the farmer is aware of relevant information about
adoption, it truly captures if the information was available and if farmer took advantage of it.
Therefore, farmers who are aware of the adoption information and understand the reason of it
uses are more probably to adopt it.
Feder et al. (1985) determine there are several kinds of equation of motion which reflects
variations along the time in farmer’s effectiveness with the innovation. Farmers can be more
practiced with the innovation as he or she accumulates information by using it. In order to
measure experience with the new technique, extent of time or total amount of land used with the
innovation could be considered. Therefore, extension efforts and human capital could be an
important measure for adoption probability.
Llewellyn (2007) has recognized that the adoption decision consumes two limited on-farm
resources, time and capacity to integrate new information. Making reliable and relevant quality

16
information available to the decision maker reduces information seeking and learning costs. It
was concluded that information and learning-related factors are important in adoption decisions.
Besides, how information quality and effectiveness can be increased to achieve more rapid
adoption decisions.
Extension and technical advice are one of the important means by which farmers gain
information on new technologies, taking into account the effectiveness of the extension. It could
be measured in the sense that information resources were available and whether the farmer took
effective advantage of them. The role of the organization for transferring the technology is very
important concerning on how effective should be in terms of farmers´ opportunity cost for
building capacity.
In order to sum up the possible factors may influence on decision-making for the adoption of the
rehabilitation farm management technique including the production of the bio-fertilizer carried
out by CIBE, Centro de Investigaciones Biotecnológicas del Ecuador, it is suitable to make the
link between the current problematic, household characteristics and farm characteristics to
improve it. Therefore, the following adoption framework is built to facilitate the relationship in a
system to analyze the research problem, variables and hypothesis.
Figure 0-1 Adoption framework for this study
2.6.Impact assessment
Appraising the impact of an agricultural project or programs can give support by demonstrating
the actual benefits provided from the project outcomes. Impact evaluations can be classified in
ex ante and ex post assessments. Ex ante evaluations are undertaken before the project or
program is initiated, and ex post evaluations are taken after the diffusion of a research product,

17
when has been initiated in order to assess actual impacts (Maredia et al., 2000). Frequently, the
objective of impact studies is to analyze the outcome, the effect of the project on participants and
an indication of the magnitude of this effect (Vaessen, 2003). Research design for impact
evaluation is to involve comparisons between groups affected by certain intervention, and
control groups. Another approach used especially in programs of agricultural research, it is to
make the linkages between the intervention and rural livelihood (Alene et al., 2006). Meaning
that at the level of rural livelihood, there are five different types of assets on this framework that
are taken into account, such as natural capital, physical capital, financial capital, human capital
and social capital. This framework has to be adapted to explicitly account for the interactions
between livelihood assets and agricultural technology. This is the aim of research-for-
development, to analyze the effect of an intervention taking into consideration the role of
institutions, processes and determining policies. These interactions have several implications for
research on the adoption and impact of agricultural technologies; whereby livelihood assets and
agriculture technology are combined. In order to follow an agriculture production based
livelihood, it is favorable to analyze several livelihood outcomes like more yields, more income,
improve food security, reduced vulnerability, sustainable use of natural resources and better-
functioning groups in the community (Alene et al., 2006).
In terms of adoption and diffusion at the level of the project, output is used as a several outcome
indicator comparing significant differences between participants and control group. This will
provide evidences of an adoption effect caused by the project (Vaessen, 2003). Hence,
comparisons can constitute an important framework by building the analysis of outcome and
impact. Attributions for the project could be established by the indication of the magnitude of
different adoption effects, regarding information before joining the project, adoption level and
similar for non-participants.
2.7.Social impact – social capital
In the sustainable livelihood framework, is considered different assets at a farm level whereby
collective action and social network represent impacts on social capital. It is indicated by several
means such as networks that increase trust, the ability of working together, reciprocity, access to
opportunities, informal safety nets and membership in organizations (Alene et al., 2006).
There are different perspectives of social capital, according to Tisenkopfs et al., (2008) it is the
ability of get things done collectively by the cooperation, employ and use of social relation for a
common purpose, and benefit. At the same time, it is considered an asset which provides access
to resources in combination with other factors. It allows obtaining common benefits supported by
social relations (Durston, 2002). The application of social capital in rural development is a
significant factor, because it explains how people interact and collaborate for common benefits,
and tackling common problems by building mutual support (Tisenkopfs et al., 2008).

18
The social capital development is determined by different perspectives. It could be identified by
the engagement and practicing of the relations for collective activities within communities. In
addition, the social capital changes are recognized when groups are learning and experiencing
how to interact and cooperate for overcoming difficulties. It is also, seeing when populations are
getting benefits from collective gains by creating positive results, and are able to institutionalize
the norms and required habits for cooperation (Tisenkopfs et al., 2008).
In order to determine how changes on social capital within farmers’ organization are made, it is
useful to identify the components of the social capital. These are knowledge, network or
relations, practices, trust, agents and institutions, values and norms. Within this study framework,
the components of knowledge, network and practices are taken into consideration for the
analysis. In order to establish how social capital is used and influenced to get things done
collectively, particularly on the adoption of the rehabilitation technique.
For the network or relations component, it is identified as the core of the social capital especially
within the collective perspective, which focuses the analysis on relations between individuals
and institutions. It enhances cohesion and social integration within groups that are able to have
higher quality of social relations when have a high level of involvement.
For practices within social capital is included participation, relations, collaborations, collective
action, learning and sharing in communities. Therefore, these are processes of learning by doing
when in rural communities are developed strategies that individuals learn on how to cooperate in
facing individual and collective problems. At the same time it is improved the network
organization by strengthening trust which leads to adoption of institutional norms.
For the component of knowledge in social capital, it takes into consideration experiences,
traditions, skills, advice and training support. It could be distinguished between individual,
groups, farmers’ organizations communities or institutional organizations. For instance, within
this study framework it is taking into consideration the analysis of farming before and after the
adoption innovation technique.
19
CHAPTER 3: Material and methods
3.1.Study area
The technology diffusion for cocoa farms rehabilitation was implemented by CIBE, Centro de
Investigaciones Biotecnológicas del Ecuador, from 2008 to 2010 with the valuable support of
MCCH, Maquita Chuchunschic Comercializando como Hermanos, a second-tier Ecuadorian
NGO within different provinces located in the coast region of Ecuador. This research study
(Figure 3-1) was developed in two provinces, in Guayas, specifically in the canton of Naranjal;
and El Oro province within Santa Rosa, Arenillas and El Guabo cantons. Within those cantons,
there are eleven primary-level farmers’ organizations distributed in different geographically
areas where the project was reached. Evidently, each organization is a member of MCCH.
MCCH was founded in Quito, Ecuador’s capital in 1985. This NGO works with 800 small cocoa
producers which provide capacity building in order to improve production and market
integration. Since 1992, this NGO has been an exporter through the exporter cocoa company.
They work with cocoa prices according to the New York Stock Exchange. MCCH is related to
farmers’ organization for marketing cocoa, which have formal agreements in order to provide a
secured and direct market.
Figure 0-1 Location of the study area indicating Guayas and El Oro provinces (from the top to the bottom)
At a national level, cocoa is cultivated in altitudinal band that goes from 0 to 500 MASL. There
are 4 zones identified for cocoa production (northern, central, south and east). The southern zone
corresponds to the southern part of Guayas, Azuay, Cañar and El Oro provinces. Within this
area, there are an estimated amount of 88,000 ha of cocoa where soils and climate are
appropriate for the crop.
Guayas province - Naranjal canton is located at 17 MASL. The tropical climate of the area
provides an average annual temperature of 25ºC and annual rainfall of 1,188 mm. The average

20
relative humidity is 87.4 per cent. It has very fertile lands where it is found mainly cocoa, coffee,
tobacco, sugar cane, rice, bananas and other fruits.
It has a total population of approximately 48,000 inhabitants. Despite its high natural resources,
61.9 per cent of the population is poor according to Unsatisfied Basic Needs (UBN) which is a
method obtained by the measurement of the degree of satisfaction of basic needs. The indicators
used are eleven basic needs related to household services, level of education and health
population which are obtained from national data census.
El Oro province – it is located in the south-occidental territory. It has plain surface but, some
areas have low dry mountains. Its climate provides an average annual temperature of 23 º C and
annual rainfall is between 200 and 1,500 mm. Mainly on agriculture production, cocoa was the
most important crop due to the climate and ecological conditions. Later on, banana crops started
to replace cocoa cultivated area during the 50’s due to serious outbreaks of diseases, and high
prices of banana. Despite of this situation, cocoa remains traditionally important like other crops
like coffee. This province is highly connected to external market of cocoa, bananas and shrimps
due to the Bolivar port that is located on this province.
The average education level of the population in El Oro province is between 5 years of schooling
(lowest) and 8 (highest). There is no difference between males and females. According to
national statistics, it is reported 45 per cent of chronic malnutrition on children under 5 years old.
The approximately population in El Guabo canton is 41, 078 inhabitants, while for Santa Rosa is
47,765 and Arenillas has 17,699 inhabitants. Poverty rates within these rural cantos that belong
to El Oro remain high, mainly due to lack of basic household and health services that could
ensure minimum levels of appropriate living standard. According to UBN; 64.9 per cent of El
Guabo remains under poor situation, while for Arenillas is 64 per cent and Santa Rosa is 55.4 per
cent.
3.2.Survey methods
Before doing the data collection for the quantitative approach, a structured questionnaire was
prepared after an extensive literature review related to the research. Later on, it was pre-tested
and used for collection of quantitative data through face-to-face interviews. The questionnaire
covered a wide range of issues including personal characteristics of the farmer, resource
endowments, farm characteristics, farm management practices, and awareness on rehabilitation
technique to improve cocoa farms diffused by the research center.
Additional qualitative information, such as knowledge and ways of farming, networking, farm
practices and information related to adoption were collected through individual interviews. A
checklist was prepared a priori and with the consent of each respondent’s interviewed, the
interviews were recorded. The main purpose was to have a better understanding of the project’s

21
effect within farmers’ organization, whereby 17 interviews were gathering from three farmers’
organizations.
3.2.1. Determination of the sample
For the completion of the quantitative approach through structured questionnaires, the sample
size was determined whereby the following formula was used:
) ( )) ( ) ))
N is the size of the population (population on this research is considered the total number of
cocoa farmers that belong to farmers’ organization where the project reached within the cantons
named before)
K is the constant where it was assigned at 95% level of confidence which indicates the
probability that results are certain
e is the sampling error whereby is the difference that may exist between the results obtained from
the sample of the population and could be obtained from the total
p is the proportion of farmers that heard about the project and are members of any organization
willing to participate in the project, and q is the proportion do not.
MCCH’s records provided to this study that approximately 80 per cent of producers, who
receives technical diffusion of the innovation, adopted it.
n is the sample size which are the number of cocoa farmers that were interviewed.
and
With these values, the sample size is calculated:
) ( )) ( ) ))
Where the simple size obtained is 111 later on, in order to save time and resources, a cluster
sampling method was applied whereby clusters are considering the geographical group of each
farmer organization. As it was mention before there are eleven farmers’ organizations, therefore,
there are 11 clusters within the study area. In order to obtain the average size of the clusters, the
population was divided into the number of clusters;
x is the average cluster size
N is the size of the population

22
N is the number of clusters in the study area
The average size per cluster is 18,54; then, to obtain the number of cluster for the study, the
sample size was divided into the average size of the cluster;
n is the number of cluster for the research
n is the sample size
The number of clusters randomly selected for the research is six, where two of them are located
in Naranjal while four are in Santa Rosa, Arenillas and El Guabo cantons. Every farmer within
the farmers organization selected was interviewed except six farmers that could not participate in
the study.
3.3.Data analysis methodologies
3.3.1. Quantitative approach
Quantitative information collected from individual interviews was processed using the Statistical
Package for Social Sciences (SPSS). Frequency tables were generated for overall information;
besides t-tests were applied to compare the mean differences between adopters and non-adopters,
chi square tests were also applied to be able to analyze categorical variables. Besides, cross
tabulation and correlation were used to identify inter dependence between factors influencing the
adoption of rehabilitation farm management technique, and binary logistic regression was used
to observe the level of relationship between dependent and independent variables that might
influence on the adoption innovation.
Logistic regression is a statistical technique where the probability of a dichotomous outcome-
adoption and non-adoption- is related to a set of explanatory variables (Idrisa et al., 2010). In a
probability model, the test used is the Maximum Likelihood Estimation (MLE), it finds the
parameters that make it the most likely that the observed pattern of events in the sample would
have occurred, and therefore, it maximizes the likelihood. The dependent variable becomes the
natural logarithm of the odds where this logistic transformation will expand the range from (0, 1)
to ( , + ). The odds ratio and the predicted probability of the explanatory variables, specify
the influence of these variables on the likelihood of adoption technique when other variables
remain the same (Tiwari et al., 2008). The estimated coefficients do not indicate directly the
effect on change of the corresponding explanatory variables on the probability of adoption
occurring; the coefficients reflect the effect of an individual explanatory variable on its log odds.

23
Therefore, if the log odds are positively (negatively) related to an explanatory variable, the
adoption probability is also positively (negatively) related to that variable. In the logistic model,
independent variables have a linear effect on the logit – natural logarithm of the odds- not the
probability, nor the odds.
Consequently, the logistic regression model is an appropriate tool to determine the effect of the
independent variables when the dependent variable has only two groups or dichotomous
variable. The model is specified as:
) )) ∑
Where the probability of adoption occurs is Prob(y=1) and 1-P(y=1), is the probability of non
adoption and k are the coefficients of the explanatory variables k.
3.3.2. Qualitative approach
In addition, qualitative information was collected from individual interviews which were
processed analyze and used in the study to complement quantitative results.
The purpose of the qualitative study is to make a description and better understanding of the
social change with the project; this is achieved through the field study and later on, the
categorization or classification technique brings order the concepts/theory and the data. Then,
type identification and classing similar cases was applied through an analytical framework to be
able to interpret what has been observed.
The qualitative analysis is based on description of the interviews, its classification and finding
the relationships between the concepts identified on the field (Figure 3-2).
Figure 0-2 Description-classification-connection scheme (Source: Schneider, 2007)
The description is based on reporting and interpreting the meaning of the observations,
classification is to categorize the data according to the principles derived from the concepts and
the connection is to re-structure the analysis which goes beyond categories.

24
On the study, for the qualitative information gathered in the fields; a structured table was built
initially with three relevant components of social capital, in order to see the relationship between
the project contribution and the effect on farmers within farmers’ organization (Appendix 1). The
main components related to social capital and rehabilitation farm management technique are
knowledge, network and practices where the adoption practices are also considered. Farmers that
participated on this part of the study were asked according to these social capital components.
Later on, during the field research it was found that biol elaboration was made collectively in
some farmers’ organizations while in others was made in groups of two or three farmers.
Besides, some others were elaborating it individually. Therefore, the individual and holistic
perspective view of social capital was evidenced, in a distinguish biol processing scheme adapted
by farmers according to the organizations.
Qualitative data was processed manually in order to describe, identify and classify producers
according to the individual and collectively perspective in the course of biol elaboration.
Furthermore a double entry table was filled whereby the individual and holistic perspective view
of the social capital and the relevant components of the social capital such as education,
knowledge and practices are connected. The purpose of this methodology is to be able to express
what have been observed during the field study.
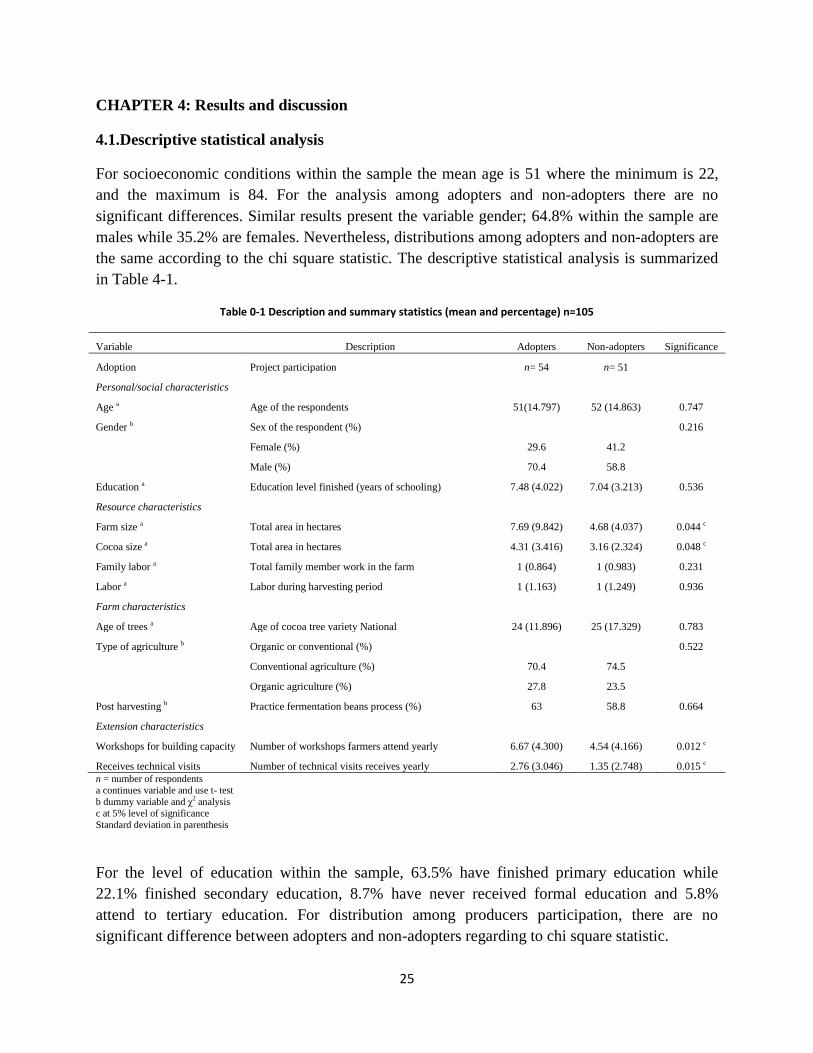
25
CHAPTER 4: Results and discussion
4.1.Descriptive statistical analysis
For socioeconomic conditions within the sample the mean age is 51 where the minimum is 22,
and the maximum is 84. For the analysis among adopters and non-adopters there are no
significant differences. Similar results present the variable gender; 64.8% within the sample are
males while 35.2% are females. Nevertheless, distributions among adopters and non-adopters are
the same according to the chi square statistic. The descriptive statistical analysis is summarized
in Table 4-1.
Table 0-1 Description and summary statistics (mean and percentage) n=105
Variable Description Adopters Non-adopters Significance
Adoption Project participation n= 54 n= 51
Personal/social characteristics
Age a Age of the respondents 51(14.797) 52 (14.863) 0.747
Gender b Sex of the respondent (%)
0.216
Female (%) 29.6 41.2
Male (%) 70.4 58.8
Education a Education level finished (years of schooling) 7.48 (4.022) 7.04 (3.213) 0.536
Resource characteristics
Farm size a Total area in hectares 7.69 (9.842) 4.68 (4.037) 0.044
c
Cocoa size a Total area in hectares 4.31 (3.416) 3.16 (2.324) 0.048
c
Family labor a Total family member work in the farm 1 (0.864) 1 (0.983) 0.231
Labor a Labor during harvesting period 1 (1.163) 1 (1.249) 0.936
Farm characteristics
Age of trees a Age of cocoa tree variety National 24 (11.896) 25 (17.329) 0.783
Type of agriculture b Organic or conventional (%)
0.522
Conventional agriculture (%) 70.4 74.5
Organic agriculture (%) 27.8 23.5
Post harvesting b Practice fermentation beans process (%) 63 58.8 0.664
Extension characteristics
Workshops for building capacity Number of workshops farmers attend yearly 6.67 (4.300) 4.54 (4.166) 0.012
c
Receives technical visits Number of technical visits receives yearly 2.76 (3.046) 1.35 (2.748) 0.015 c
n = number of respondents
a continues variable and use t- test
b dummy variable and χ2 analysis
c at 5% level of significance
Standard deviation in parenthesis
For the level of education within the sample, 63.5% have finished primary education while
22.1% finished secondary education, 8.7% have never received formal education and 5.8%
attend to tertiary education. For distribution among producers participation, there are no
significant difference between adopters and non-adopters regarding to chi square statistic.

26
0 10 20 30 40 50
0
1
2
3
4
5
Nu
mb
er
of
fam
ily la
bo
r av
aila
ble
on
farm
Percentage of producers
Adopter
Non-adopter
Concerning to income per farmers, 80% from the sample has other source of income, meaning
not only from cocoa production. It was evidenced, within the sample that there is a significant
proportion of producers that have on-farm income, not only from cocoa but as well from other
crops (Figure 4-1). In addition, there is a considerable proportion of producer that has off-farm
income source which means farmers working in other farms. In order to test the association
between producers and adoption, the chi square statistic was applied; it was evidenced that
adopters (90.7%) and non-adopters (68.6%) are significant different according to the chi square
value=8.02 (sig=0.005).
Figure 0-1 Income source of cocoa producers within the sample including adopters and non-adopters
Regarding labor availability, it was mainly found one and two family members working on the
farm and the proportion of adopters evidences more available family members compared to non-
adopters specifically for two and three people (Figure 4-2). Nevertheless, there are no significant
differences on the distribution of adopters and non-adopters.
Figure 0-2 Comparison the number of family members working on farm among adopters and non-adopters

27
9.8
70.4
90.2
29.6
0 20 40 60 80 100 120
Non-adopter
Adopter
No-pruning
Pruning
With regards to land tenure, 95.2% is the owner of the farm while 2.9% is the renter. The mean
farm size is 6.2 ha within the sample. In addition, for information concerning to cocoa farm size,
it was observed the mean value of size of cocoa production in hectares are 3.16 and 4.31 for non-
adopters and adopters respectively, whereas there is significance difference (p=0.049). For the
farm system, producers have not only cocoa but also other crops such as fruits, and/or forest
trees. There is 81% within the entire sample who have cocoa associated with other crops. The
distribution among adopters and non-adopters are the same regarding to chi square analysis.
Cocoa production has pruning practices as an important farm management technique for proper
plant growth. Pruning activities give shape to maintain a plant balance, and eliminate
unnecessary branches promoting an accurate leaf area with high photosynthetic capacity, which
reduces diseases incidences. It is evidenced that 90.2% of non-adopters significantly practices
pruning activities compare to only 29.6% of adopters before the project technique
implementation (Figure 4-3). Hence, the distribution between the groups is significantly different
according to the chi square analysis (p=0.00). In addition, the comparison of the number of
pruning yearly on cocoa farms between adopters and non-adopters shows a mean for adopters of
0.43 and non-adopters 1.37 giving highly significant differences (p=0.00).
Figure 0-3 Comparison percentage between adopters and non-adopters of pruning practices before the project implementation
An additional activity evaluated was re-planting cocoa seedlings on farm; resulting that 84.3% of
non-adopters practice it while 57.4% of adopters practice it before adapting the project technique
(Figure 4-4). It is observed significant differences on the distribution between adopters and non-
adopters at the chi square value=9.13 (sig=0.003).

28
31.4
64.8
17.614.8
43.1
14.8
7.8 5.6
Non-adopter Adopter
High Medium Low Non presence
15.7
42.6
84.3
57.4
0
20
40
60
80
100
Non-adopter Adopter
Replanting
No-replanting
30
75.9
24
11.1
42
13
40
Non-adopter Adopter
High Medium Low Non presence
Figure 0-4 Comparison proportion among adopters and non-adopters of replanting cocoa seedlings before the application of project innovation
Usually, the presence of diseases such as witches’ broomstick (Crinipellis perniciosa) and frosty
pod or monilia (Monilia roreri) on cocoa production can cause significant losses affecting cocoa
pods. The most influential factor is to prevent it or tackle it at the right moment. Within the
sample, there are marked differences among adopters and non-adopters before application of the
project technique. It is illustrated 75.9% of adopters reporting a high level of monilia disease
before the innovation while 30% of non-adopters reported it (Figure 4-5). Similar results for
witches’ broomstick, whereas 64.8% of adopters stated high level of broomstick before the
application of project innovation while 31.4% of non-adopters reported high incidence (Figure 4-
6). Therefore, with the chi square statistic there is evidenced the association between the level of
plant diseases and adoption (p=0.003) for broomstick; (p=0.000) for monilia.
Figure 0-5 Comparison of project participation and monilia disease incidence before the application of project
innovation
Figure 0-6 Comparison of project participation and witches’ broomstick incidence before the application of project
innovation
The farm level fermentation process is also studied. The fermentation process is where beans
from cocoa pods are cleaned; the mucilage is removed providing an excellent introduction to the
bean for further transformations. Within the sample, there are 65.7% respondents that make this
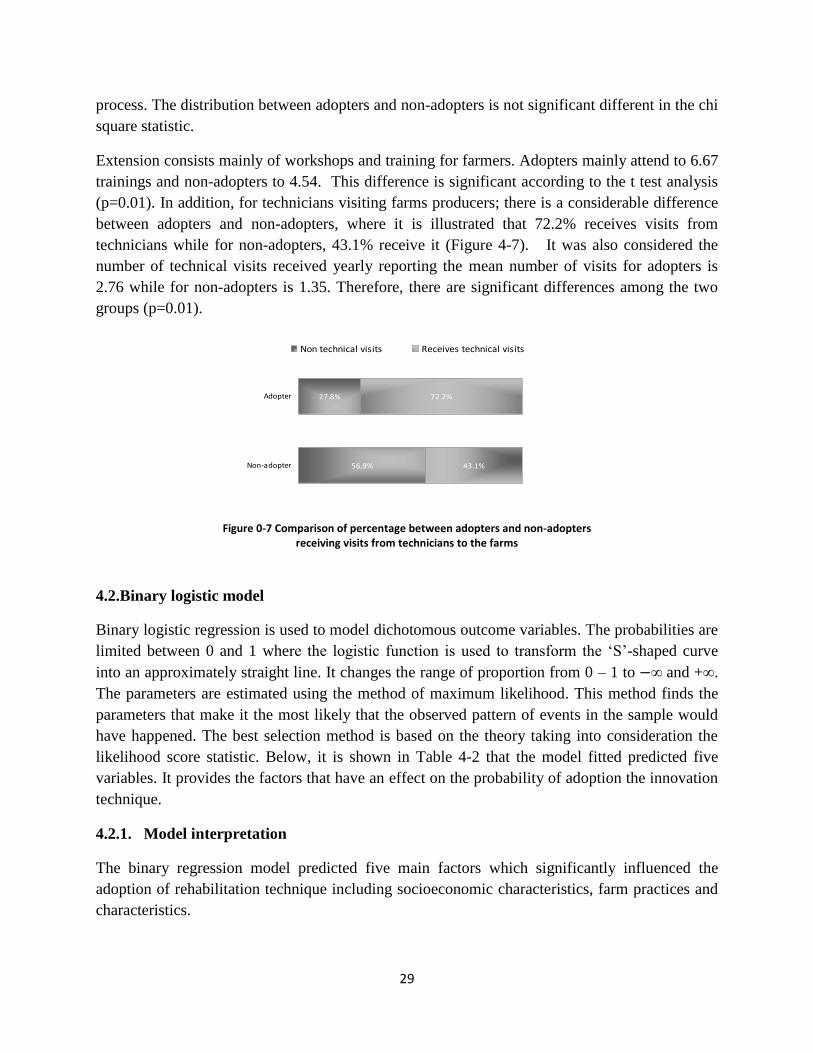
29
process. The distribution between adopters and non-adopters is not significant different in the chi
square statistic.
Extension consists mainly of workshops and training for farmers. Adopters mainly attend to 6.67
trainings and non-adopters to 4.54. This difference is significant according to the t test analysis
(p=0.01). In addition, for technicians visiting farms producers; there is a considerable difference
between adopters and non-adopters, where it is illustrated that 72.2% receives visits from
technicians while for non-adopters, 43.1% receive it (Figure 4-7). It was also considered the
number of technical visits received yearly reporting the mean number of visits for adopters is
2.76 while for non-adopters is 1.35. Therefore, there are significant differences among the two
groups (p=0.01).
Figure 0-7 Comparison of percentage between adopters and non-adopters receiving visits from technicians to the farms
4.2.Binary logistic model
Binary logistic regression is used to model dichotomous outcome variables. The probabilities are
limited between 0 and 1 where the logistic function is used to transform the ‘S’-shaped curve
into an approximately straight line. It changes the range of proportion from 0 – 1 to and + .
The parameters are estimated using the method of maximum likelihood. This method finds the
parameters that make it the most likely that the observed pattern of events in the sample would
have happened. The best selection method is based on the theory taking into consideration the
likelihood score statistic. Below, it is shown in Table 4-2 that the model fitted predicted five
variables. It provides the factors that have an effect on the probability of adoption the innovation
technique.
4.2.1. Model interpretation
The binary regression model predicted five main factors which significantly influenced the
adoption of rehabilitation technique including socioeconomic characteristics, farm practices and
characteristics.
56.9%
27.8%
43.1%
72.2%
Non-adopter
Adopter
Non technical visits Receives technical visits

30
For the interpretation of the model, in logistic regression is more accurate to assess the odds ratio
which is the odds of an event occurring in one group to the odds of it occurring in another group,
used for dichotomous classification like adoption. It measures the effect size or association
among the two binary values. Whether the odds are greater than one then the event is more likely
to occur; if the odds are less than one then the event is less likely to occur.
Table 0-2 Analysis of determinants using binary logistic regression
Variables β SE Sig Odd ratio(eβ)
Gender(1) 1.343 0.679 0.046b 3.831
Age -0.008 0.022 0.729 0.993
Education 0.052 0.087 0.548 1.054
Other source of income(1) 1.512 0.731 0.039b 4.534
Labor family on farm 0.791 0.401 0.049b 2.205
Number of cocoa trees pruning -1.183 0.404 0.003a 0.306
Monilia plant disease(1) 2.476 0.755 0.001a 11.889
Constant -3.588 1.819 0.049 0.028 Hosmer and Lemeshow test= Chi square= 8.168, df=8, Sig.=0.417, -2Loglikelihod= 80.922, Cox&Snell r2= 0.43; Nagelkerke
r2=0.57, overall percentage of right prediction= 83.8%; Sample size= 105
a at 1% level of significance
b at 5% level of significance
The factors that represent an effect on adoption innovation on this study are gender, additional
source of income, number of the family members working on the farm, number of pruning
practices of cocoa trees and a high level incidence of monilia diseases. Factors such as
producers’ age and education do not influence on adoption probability on the model.
Since there are more than one explanatory variable including on the model, the interpretation of
the odds ratio for one variable depends on the value of other variables being fixed. For the
variable gender, the parameter coding for male=1; therefore the odds for males to adopt the
technique are estimated to be 3.83 times as higher as females, other things being equal. This
implies that for male is positive and have a significant effect on the probability of the adoption.
Concerning to the variable of other source of income; the parameter coding for having another
source of income=1; resulting the odds for having it are estimated to be 4.53 times as higher as
for not having another source of income meaning not only from cocoa production, other things
being equal. Therefore, the probability of adoption is higher when producers have an additional
source of income.
With regards to the number of the family member available for working on the farm; it is
observed that having an additional person available would increase the odds by 2.21 units, other
things being equal. Therefore, the number of the family member working on the farm is
positively correlated to the rehabilitation technique. In other words, producers with a higher
number of family labors, have a higher probability of adoption innovation. Relating to the
number of pruning practices on cocoa trees; it is observed that having an additional pruning

31
practice would reduce the odds by 0.31 units, other things being equal. This implies that the
number of pruning is negatively correlated with the probability of adoption. Related to monilia
disease incidence, the parameter coding for high level is equal to 1. Thus, the odds for having a
high level of monilia to adopt the innovation are estimated to be 11.89 times as higher as not
having a high incidence level, other things being equal. Hence, producers with high level of
monilia disease on cocoa production are more likely to adopt the technique.
For the variables age and education taken into consideration as farmers’ years of schooling; there
are no association with adoption probability as a result, there is no influence on age and
education for adoption choice.
4.2.2. Assessment of the fitted model
After the prediction of the model, it is necessary to assess the appropriateness and usefulness of
the model where is applied the likelihood ratio test and the overall goodness of fit of the model.
It is to assess how close values predicted by the model are to the observed values. The common
test used is the hosmer-lemeshow test which is calculated using the observed and expected count
for both, adopters and non adopters, it has an approximately χ2 distribution with 8 degrees of
freedom because the observations are grouped into deciles based on predicted probabilities into
groups of approximately equal size. The null hypothesis is that the number of adopters is not
significantly different from those predicted by the model. Therefore, the Sig=0.417 indicates that
the overall model fit is good. The r2 statistic does not measure the goodness of fit of the model;
but it indicates whether the explanatory variables are useful for the adoption prediction. Here, the
value indicates that the model is useful for adoption prediction.
4.2.3. Discussion of the binary logistic model
On this section, it is discussed the principal drivers for adoption of the farm management
innovation technique which includes pruning practices, elaboration and application of biol to
rehabilitate cocoa farms for improving productivity.
4.2.3.1. Socioeconomic characteristics
As it was hypothesized some personal characteristics influence on the adoption rehabilitation
technique, particularly in gender whereby it is found that for the male is positive and has a
significant effect for the adoption probability. Similar to other empirical evidences, one could
assume that male have higher access to resources and information, that give them greater
capacity to adopt technologies (Odendo et al., 2009). The model predicted that the variable
gender is significant as it is illustrated in Table 4-2. It is found; the odds ratio for males (3.83) is
greater than 1 which indicates an increased chance of the adoption probability versus not
occurring.
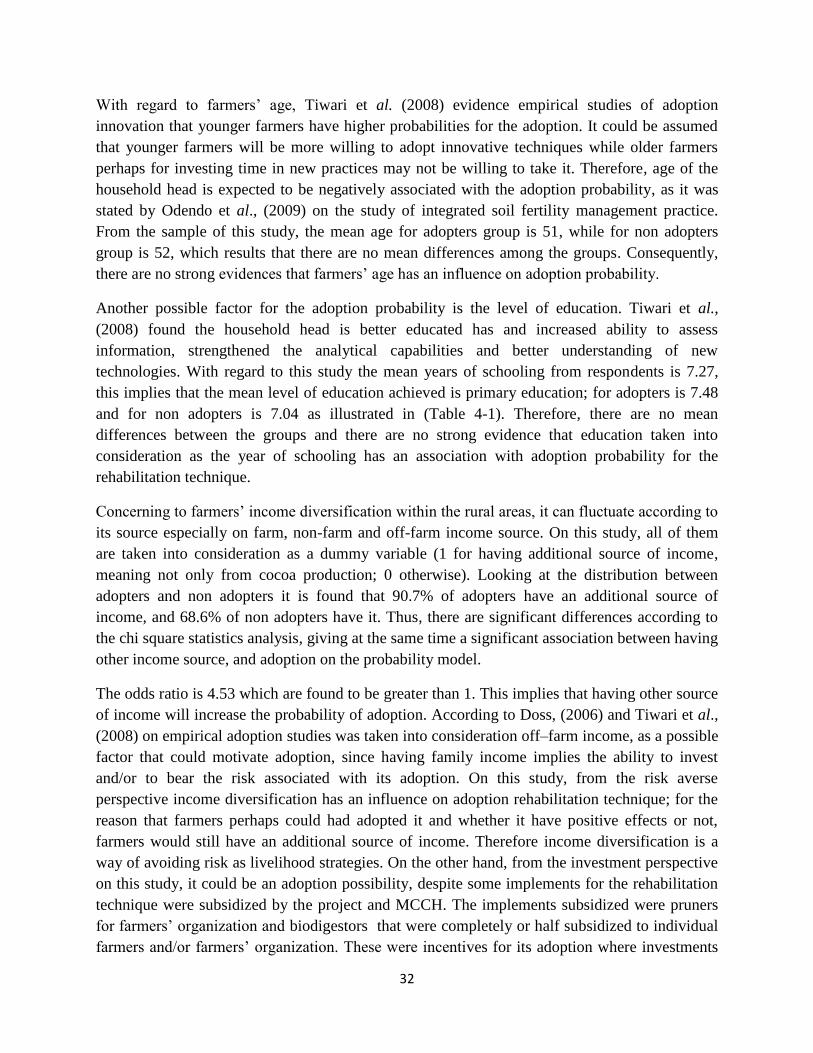
32
With regard to farmers’ age, Tiwari et al. (2008) evidence empirical studies of adoption
innovation that younger farmers have higher probabilities for the adoption. It could be assumed
that younger farmers will be more willing to adopt innovative techniques while older farmers
perhaps for investing time in new practices may not be willing to take it. Therefore, age of the
household head is expected to be negatively associated with the adoption probability, as it was
stated by Odendo et al., (2009) on the study of integrated soil fertility management practice.
From the sample of this study, the mean age for adopters group is 51, while for non adopters
group is 52, which results that there are no mean differences among the groups. Consequently,
there are no strong evidences that farmers’ age has an influence on adoption probability.
Another possible factor for the adoption probability is the level of education. Tiwari et al.,
(2008) found the household head is better educated has and increased ability to assess
information, strengthened the analytical capabilities and better understanding of new
technologies. With regard to this study the mean years of schooling from respondents is 7.27,
this implies that the mean level of education achieved is primary education; for adopters is 7.48
and for non adopters is 7.04 as illustrated in (Table 4-1). Therefore, there are no mean
differences between the groups and there are no strong evidence that education taken into
consideration as the year of schooling has an association with adoption probability for the
rehabilitation technique.
Concerning to farmers’ income diversification within the rural areas, it can fluctuate according to
its source especially on farm, non-farm and off-farm income source. On this study, all of them
are taken into consideration as a dummy variable (1 for having additional source of income,
meaning not only from cocoa production; 0 otherwise). Looking at the distribution between
adopters and non adopters it is found that 90.7% of adopters have an additional source of
income, and 68.6% of non adopters have it. Thus, there are significant differences according to
the chi square statistics analysis, giving at the same time a significant association between having
other income source, and adoption on the probability model.
The odds ratio is 4.53 which are found to be greater than 1. This implies that having other source
of income will increase the probability of adoption. According to Doss, (2006) and Tiwari et al.,
(2008) on empirical adoption studies was taken into consideration off–farm income, as a possible
factor that could motivate adoption, since having family income implies the ability to invest
and/or to bear the risk associated with its adoption. On this study, from the risk averse
perspective income diversification has an influence on adoption rehabilitation technique; for the
reason that farmers perhaps could had adopted it and whether it have positive effects or not,
farmers would still have an additional source of income. Therefore income diversification is a
way of avoiding risk as livelihood strategies. On the other hand, from the investment perspective
on this study, it could be an adoption possibility, despite some implements for the rehabilitation
technique were subsidized by the project and MCCH. The implements subsidized were pruners
for farmers’ organization and biodigestors that were completely or half subsidized to individual
farmers and/or farmers’ organization. These were incentives for its adoption where investments

33
costs were not paid by producers; although, the cost of biol components, the preparation, the
application, and the labor for pruning cocoa trees are completely assumed by producers. For this
reason, investment for the technique could or could not be a possible rationale for adoption
probability.
With regards to labor availability, family labor is taken into consideration in order to avoid hiring
wage laborers. According to the amount of effort required on the adoption, it depends on the
association of the amount of labor invested in the implementation, as it was mention by De Graff
et al. (2008), that more labor is applied when family is larger thus, more labor is available.
Tiwari et al., (2008) state that labor constraints frequently limit farmer’s use of adoption,
consequently with a large family size available for working on the farm, it is expected a positive
influence on adoption probability.
On this study, it was surveyed family size but also in order to be more accurate it was surveyed
and assessed the number of family members that works on farm. Hence the number of family
members working on the farm was considered for the analysis. The proportion between adopters
and non adopters group is no significant different, although adopters group evidenced more
number of family workers on farm; resulting from the adoption model that for one more family
member working on the farm, the odds increases by 2.2 units; meaning that the higher number of
family labor, higher probability of adoption innovation. This can be explained due to the fact that
for the rehabilitation technique it is implemented pruning practices on farm, elaboration and
application of biol. For these activities labor is demanding. In addition the intervention’s aim is
to increase yields therefore; more labor is demand for farm management practices and harvesting
period. Similar results from other empirical evidences on adoption innovation studies (De Graff
et al., 2008).
4.2.3.2. Farm practices and characteristics
For a correct farm management technique in cocoa production, pruning practices are considering
a main activity for proper plants grow (Enriquez, 2004) for several reasons such as the regulation
of plant balance, entry light, and aeration that reduce a suitable environment for plant grow
diseases. The distribution between adopters and non adopters is highly significant different. In
addition, as it was mention before, the mean number of pruning yearly for adopters is 0.43 and
for non adopters is 1.37 which also indicates highly significant differences among the groups
(p=0.00).
Looking at the number of pruning from non adopters is higher compared to adopters practiced
before the project intervention on adopters’ farm. In the model, it is observed that number of
pruning is negatively correlated with the probability of adoption. In other words, the odds ratio is
0.31 units which indicate that having an additional pruning practice will decrease the chance of
occurring adoption. This can imply (i) for producers that already practices the pruning activity it
is not necessary to adopt the technique, although biol is part of the innovation; (ii) adopters and
34
non adopters that make pruning practices are not doing it properly; (iii) by the time of the field
study, non adopters began to make pruning and the effect is not yet seen.
Frequently presence of disease can cause considerable losses that can range from 30 to 80%;
National variety has shown low productivity affected by advanced age trees, low resistance to
monilia disease (Monilia roreri), which it is mostly caused by deficient agricultural management
(Quiroz et al., 2002). Looking at the chi square statistic analysis, 75.9% of adopters have a high
level of monilia diseases before the project intervention on the farm, while 30% of non adopters
have a high level. Therefore, adopters show significantly higher incidence level than non
adopters (p=0.000). It is also evidenced in the probability model, that the odds ratio for producers
with a high level of monilia is 11.89 units that are for producers with none a high incidence level.
This indicates that farmers with monilia problems have higher probability of adoption
innovation.
It is important to mention that pruning practices and/or biol application will possibly gives and
indirect effect for control disease. Especially these types of fungus plant diseases, which are able
to grow in very humid and shadow areas. For this reason pruning practices are also a type of
diseases control, giving regulation which allows entry light and more aeration. Besides, biol’s
function as an input organic fertilizer, it could also present effects on plant diseases. At the
moment, there are experimental designs for biol as a disease control. It is done at the level of
laboratory through in vitro experiments, and different doses of biol are tested with the diseases
inoculation. The hypothesis is that at a certain biol dose, it will inhibit the disease grows.
So far the model interpretation has been discussed, although there have been other variables that
in the descriptive analyses shown an association with the adoption rehabilitation but, did not give
any influence on adoption probability. Only two of them will be considered for the discussion,
one is related to farm management characteristics and the other is related to the extension
characteristics.
Re-planting or planting cocoa seedlings is considered as a different alternative to rehabilitate
cocoa farms. The project intervention only took into consideration pruning rehabilitation for
advanced cocoa trees associated with biol application. However, before the project diffusion and
simultaneously, MCCH was giving seedling of National variety to the farmers, as an incentive to
produce it. The NGO was also facilitating workshops and building capacity to reproduce
appropriate seedling from farmers cultivated area. Perhaps for these reasons, it is found a high
proportion of producers (70.5%) within the entire sample were re-planting cocoa, even before the
project intervention for adopters group. It is also analyzed the distribution between the groups,
and it is observed that 84.3% of non adopters implement it, while 57.4% of adopters before the
project intervention on farm practice it (Figure 4-4). Therefore, distribution among adopters is
significant.

35
In order to rehabilitate cocoa farms at the level of small producer, it is favorable to have the
alternative of re-planting seedlings. Because during the problems identification on cocoa farms,
before the intervention of the rehabilitation technique; it is possibly to found some cocoa trees in
very poor conditions that could be better to replace it. Although, it will take two years to start the
production of that seedling, rather than practicing the pruning activity that will take at least one
year to recover it.
Regarding to extension characteristics, Doss (2006) states that some adoption studies consider
the number of extension visits received by the farmer or whether farmer attended to a
demonstration field day. These measures indicate whether the information was available since
farmers must have information about new technologies before they can consider adopting them.
On this study, it was surveyed the yearly number of workshops and training regarding to the
rehabilitation farm management technique. It includes building capacity for pruning practices
and the elaboration plus biol application. These were available for adopters and non adopters
within farmers’ organization which it is confirmed because within non adopters groups were
aware about the rehabilitation technique.
Therefore, both groups were compared on the number of yearly workshops attendance, where it
is reported that mean for adopters is 6.67 while for non adopters is 4.54. This illustrates that the
mean number of adopters is significant higher that for non adopters. In addition, it was also
surveyed the number of visits from technicians on farms producers; whereas it is found that
72.2% receives visits from technicians while for non adopters, 43.1% receive it. This indicates
that there is a considerable difference between adopters and non adopters.
It is important to highlight that project diffusion was possible due to MCCH second-tier
organization; because small farmers’ organizations were already members of this NGO. On this
study, this was a key element, to be able to reach farmers for technical diffusion, they need to be
associated and organized in order to have solutions and alternatives for facing common
problems. Even for future projects or programs, it is more likely to receive resource and
information to farmers’ organizations rather than individual farmers.
4.3.Impact of the project intervention on farm
Despite this study is focused on determining factors for the adoption rehabilitation technique, the
effect of the project was also possible to assess at a farm level. Previously it was illustrated how
the approach of the project enhanced technology adoption, in order to determine what factors
encourage or limit the achievement of changes on farm. However, in order to demonstrate
achieving of projects’ objectives, the evaluation effect is an alternative to analyze how adoption
innovations are giving outcomes in rural livelihoods.
There are different means for assessing the impact of an intervention, where the main goal is to
estimate the effect of the intervention in relation to a comparison group. On this study, the
approach for assessing outcomes effect was to use cross-sectional survey designed by selecting a
36
0
15
30
45
High Medium Low Non presence
Level of incidence on farm
Nu
mb
er o
f ad
op
ters
Before
After
0
5
10
15
20
25
30
35
High Medium Low Non presence
Level of incidence on farm
Num
ber
of a
dopt
ers Before
After
random sample. Later on compare the performance intervention of those within the sample who
participated in the project, and who were no participants of the project. It is known that is not the
best approach for impact assessment but it still gives an indication of the intervention effect.
Impact on agricultural productivity and rural incomes are observed on how changes allow to
strength existing assets with farm and livelihood outcomes such as yields, income and better-
functioning social networks through new agricultural techniques. The aim of the project was to
increase productivity through farm management practices, which creates different positive
effects on participants at the level of assets such as financial, human and social capital.
Firstly it is determined how farmers have modified in a consistent manner after the new
recommendations given by the project. For instance, the way of farming like pruning practices. It
is reported by adopters that before the project, 71% did not practice pruning activities on the
farm and with the project intervention this proportion practiced it. Likewise, the adopters’
proportion, 29% that was already practicing before, it continues to do it with the project
intervention.
Related to input foliar fertilizer before the project 60% of adopters did not make any application,
23% apply agro chemicals, 11% is already applying organic fertilizer and 6% applied both. With
the project, 92% apply biol as an organic fertilizer, and 6% stay with both types of input. Thus,
adopters did make changes according to technological farm management diffusion from the
project. This is also evidence through the incidence level of monilia (Figure 4-8) and witches’
broomstick plant diseases (Figure 4-9) before and after the project intervention on the farm,
where it is illustrating how diseases performance noticeable changes with the farm management
implementation technique.
The main contribution of the project was to improve farming performance by increasing
productivity levels. Therefore, yields are a useful impact indicator by comparing the differences
in mean yield of adopters and non adopters. The mean for participants before the project is 0.28
tonne/ha and for non participants is 0.27 tonne/ha; there are no significant differences of means
Figure 0-8 Comparison of monilia disease incidence level before and after the intervention technique on
the farm within adopters group
Figure 0-9 Comparison of witches’broomstick disease incidence level before and after the intervention
technique on the farm within adopters group

37
0
0.1
0.2
0.3
0.4
0.5
Non-adopter Adopter National average
Ton
ne
/ha
Before
After
(p=0.927). However for participants, the mean yield after the changes on farm management
techniques is 0.44 tonne/ha whereas the means yield after the project is significantly higher than
before (p=0.000) (Figure 4-10). For this reason, the project has a positive influence on cocoa
farms that adopted the rehabilitation technique, taking into account that the mean national yield
in Ecuador for cocoa production is 0.51tonne/ha (Appendix 2). Although yields are still
remaining below to the national average, there is a substantial increase due to the project
contribution.
Figure 0-10 Comparison of mean yields between adopters and non adopters before and after the application of the project implementation
technique on farms
4.4.Profitability of the rehabilitation technique
With the positive impact indicators from the rehabilitation technique on yields (tonne/ha), it is
useful to estimate the economic return per hectare under this farm management technique. The
concepts of the net present value (NPV) and internal rate of return (IRR) are used to evaluate the
economic returns. The analysis involves projections costs and benefits per hectare assuming 20
years of the production cycle of cocoa trees.
Costs are taken from references provided by the El Oro provincial direction, MAGAP and
primary data collected during the field study. The cocoa price during the periods 2005 and 2011
was taken from the ICCO monthly prices (Figure 4-11). It is observed that cocoa is an active
market due to the price volatility. World supply fluctuates from one year to another because
cocoa is affected by a cyclical production pattern like other crops. The periods of oversupply
generate a stock accumulation that forces prices to fall. However, the major source of price
volatility depends on the side of developed countries as main consumers of the commodity.
Despite the high volatility, the cocoa market price tends to increase gradually year by year.
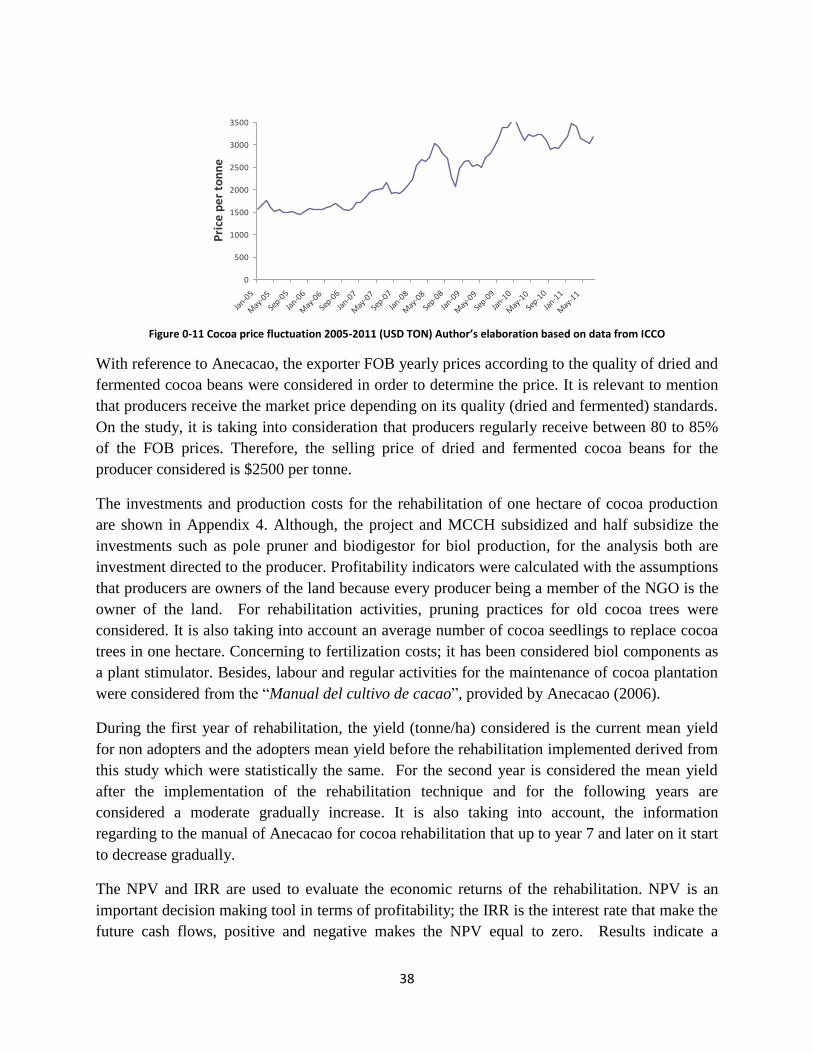
38
0
500
1000
1500
2000
2500
3000
3500
Jan-0
5
May
-05
Sep-0
5
Jan-0
6
May
-06
Sep-0
6
Jan-0
7
May
-07
Sep-0
7
Jan-0
8
May
-08
Sep-0
8
Jan-0
9
May
-09
Sep-0
9
Jan-1
0
May
-10
Sep-1
0
Jan-1
1
May
-11
Pri
ce p
er
ton
ne
Figure 0-11 Cocoa price fluctuation 2005-2011 (USD TON) Author’s elaboration based on data from ICCO
With reference to Anecacao, the exporter FOB yearly prices according to the quality of dried and
fermented cocoa beans were considered in order to determine the price. It is relevant to mention
that producers receive the market price depending on its quality (dried and fermented) standards.
On the study, it is taking into consideration that producers regularly receive between 80 to 85%
of the FOB prices. Therefore, the selling price of dried and fermented cocoa beans for the
producer considered is $2500 per tonne.
The investments and production costs for the rehabilitation of one hectare of cocoa production
are shown in Appendix 4. Although, the project and MCCH subsidized and half subsidize the
investments such as pole pruner and biodigestor for biol production, for the analysis both are
investment directed to the producer. Profitability indicators were calculated with the assumptions
that producers are owners of the land because every producer being a member of the NGO is the
owner of the land. For rehabilitation activities, pruning practices for old cocoa trees were
considered. It is also taking into account an average number of cocoa seedlings to replace cocoa
trees in one hectare. Concerning to fertilization costs; it has been considered biol components as
a plant stimulator. Besides, labour and regular activities for the maintenance of cocoa plantation
were considered from the “Manual del cultivo de cacao”, provided by Anecacao (2006).
During the first year of rehabilitation, the yield (tonne/ha) considered is the current mean yield
for non adopters and the adopters mean yield before the rehabilitation implemented derived from
this study which were statistically the same. For the second year is considered the mean yield
after the implementation of the rehabilitation technique and for the following years are
considered a moderate gradually increase. It is also taking into account, the information
regarding to the manual of Anecacao for cocoa rehabilitation that up to year 7 and later on it start
to decrease gradually.
The NPV and IRR are used to evaluate the economic returns of the rehabilitation. NPV is an
important decision making tool in terms of profitability; the IRR is the interest rate that make the
future cash flows, positive and negative makes the NPV equal to zero. Results indicate a
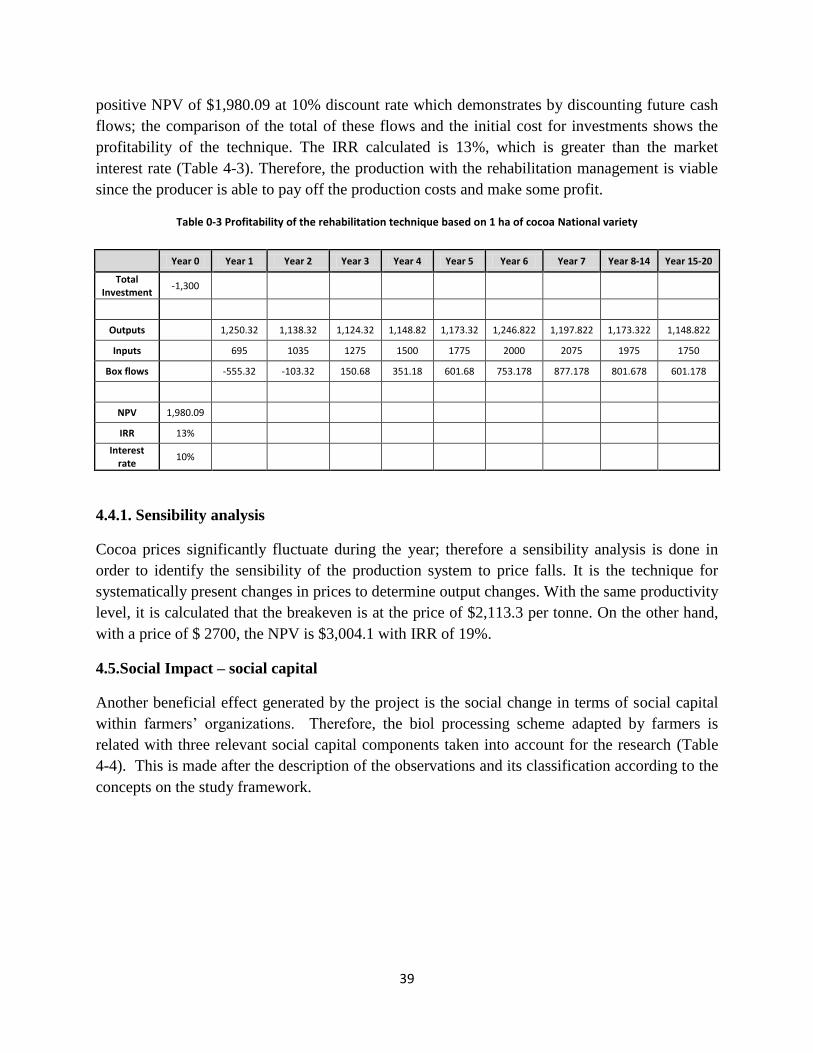
39
positive NPV of $1,980.09 at 10% discount rate which demonstrates by discounting future cash
flows; the comparison of the total of these flows and the initial cost for investments shows the
profitability of the technique. The IRR calculated is 13%, which is greater than the market
interest rate (Table 4-3). Therefore, the production with the rehabilitation management is viable
since the producer is able to pay off the production costs and make some profit.
Table 0-3 Profitability of the rehabilitation technique based on 1 ha of cocoa National variety
4.4.1. Sensibility analysis
Cocoa prices significantly fluctuate during the year; therefore a sensibility analysis is done in
order to identify the sensibility of the production system to price falls. It is the technique for
systematically present changes in prices to determine output changes. With the same productivity
level, it is calculated that the breakeven is at the price of $2,113.3 per tonne. On the other hand,
with a price of $ 2700, the NPV is $3,004.1 with IRR of 19%.
4.5.Social Impact – social capital
Another beneficial effect generated by the project is the social change in terms of social capital
within farmers’ organizations. Therefore, the biol processing scheme adapted by farmers is
related with three relevant social capital components taken into account for the research (Table
4-4). This is made after the description of the observations and its classification according to the
concepts on the study framework.
Year 0 Year 1 Year 2 Year 3 Year 4 Year 5 Year 6 Year 7 Year 8-14 Year 15-20
Total Investment
-1,300
Outputs
1,250.32 1,138.32 1,124.32 1,148.82 1,173.32 1,246.822 1,197.822 1,173.322 1,148.822
Inputs
695 1035 1275 1500 1775 2000 2075 1975 1750
Box flows
-555.32 -103.32 150.68 351.18 601.68 753.178 877.178 801.678 601.178
NPV 1,980.09
IRR 13%
Interest rate
10%

40
Table 0-4 Biol processing scheme vs. social capital components
Biol processing scheme adapted
by farmers Knowledge Network Practices
Biol produced by farmers that are
only family/relatives
Appropriation of
information
Demonstrations on
farm
Individual
perspective
Different practices on
farm
Biol produced by 2-3 farmers
jointly within the organization
Motivation on
producing organic Low social cohesion
Innovative practices on
farm
Biol produced jointly by all
members’ organization
Demonstrative farms
Learning-by-doing
Collective work
Responsibility-
informal rules
On farm implementation
techniques
Appropriate tools
available
Knowledge
At the level of individual or collective perspective view, it has been changes over building
capacity and knowledge especially on pruning practices, which is corroborated with the
quantitative analysis. It is found that adopters did not have the tendency or the total reasoning for
pruning activities on the farm before the project. With the project, it is observed that this
procedure was diffused and learnt by adopters.
“We are leading with the pruning practices; the project gave us support and we are
appropriated, full of knowledge.”
Helio Romero – Represa Tahuín
Something relevant to highlight is the point on how the project’s agents diffused the
rehabilitation means that simultaneously was the adopters learning process. On every farmer’s
group, the technique was diffused through workshops and field demonstrations on farms; for
both - pruning practices and biol elaboration. It is confirmed that farmer needs to be convinced at
every social capital approach in order to adopt the technique. In addition, the importance of
making constant field visits as technical assistance for the implementation. This was also
evidenced on the quantitative analysis where the number of technical visits on the farm was
significant higher for adopters compared than non adopters.
“We went to workshops on farms that already had the project running and we saw results; we
decided to experience it… particularly on my farm, I see results because I practice it with
discipline.”
Abdon Belarmino Vega- San Jacinto
It is observed that some producers were well motivated on learning how to produce under
organic system. The project promotes organic agriculture having biol production as plant

41
stimulation after the pruning implementation on farm. It is pertinent to mention that Represa
Tahuín farmers’ group had the experience years ago with a church organization on producing
compost and organic fertilizer. For some reason, the organization discontinued but producers
captured and stayed with motivations for producing under organic system. Therefore, biol
elaboration was a well accepted alternative, especially on learning organic production.
Practices
Regarding to practices on the farm, there are evidences on how the project generated an effect on
farm activities. After encouraging producers through capacity building on field demonstrations,
they applied these innovations on their farms. It was not only observed with pruning practices
and biol application; it was also observed how producers begin to control plant diseases by
removing infected parts. Producers stated that few activities were developed on the farm before
the project, primarily on just avoiding weeds or activities for irrigation.
Changes on farm implementation techniques were also possible with the aim of materials and
tools for the adoption innovation at the level of farmers’ organization as common properties.
Particularly pole pruner, biodigestor for biol, and motor pump for the foliar application. These
implements were facilitated by the project and the second-tier organization MCCH directly to
farmers’ organization. On this way, producers were able to prune cocoa trees in a correct
manner. In addition, farmers’ organizations could start the biol elaboration and implementation.
Although producers had these incentives, it was observed some problems at the level of farmers’
organization. These implements are common properties and these should be control, and gave
with fair treatment to every producer within the organization. Implements are rent with a fixed
amount of money for members of the organization and for other producers that are not part; they
can rent it with a higher price. Some producers stated that these amounts are not always
respected.
Network
With regards to the network component within farmers’ organizations, it was determining
specifically on the relations between individuals and their capacity to get things done
collectively. On the project framework, it was evidenced on biol processing scheme. It is
identified the individual perspective of social capital on having access to resources like biol’s
components, reducing transaction costs and reducing risk on its preparation. This was observed
on two or three producers of biol preparation scheme.
In addition, it was observed producers preparing its own biol, where it is observed low level of
cohesion within farmers’ organization. These producers do not take the risk and prefer to prepare
it by themselves. They make their own biol but for collecting the manure they do it together with
other members of the organization. This was practiced in Represa Tahuín farmers’ organization.

42
Here, it is distinguished an instrumental approach; while the source of social capital is collective,
the accumulation, mobilization and use in inherently individualistic.
“I prepare my biol and I also help others, each one has his own tank but together we collect
manure.”
Edgar Romero-Represa Tahuín
On the other hand, it was identified the holistic approach mainly for the biol processing scheme
made by the whole members of the organization. They have common biodigestors; this implies
that high numbers of producers have access to common biol. In general, producers collect biol’s
components by taking shifts for preparing it in groups and later on, the biol is distributed.
This holistic perspective and the way of getting things collectively were evidenced in Comunas
Riberanas. Every member of this organization that participates in the project prepares common
biol. Elements like active participation and reciprocity are observed because it was reported
many times that producers within the organization prepare biol together for components
collection and elaboration.
It is essential to mention that within the same organization, social capital is institutionalized
through informal norms and rules. This allows the cooperation and creates a network of
participation and responsibility. Several producers stated that for those who attend at the moment
of biol preparation, will take the biol during its distribution, while for those who do not attend for
its preparation, they will not carry it.

43
CHAPTER 5: General conclusions
The main objective of this study is to determine what factors influence on the technical adoption
for the rehabilitation of cocoa variety National. The rehabilitation technique is a farm
management alternative that promotes the recovery plantations of cocoa variety National. Its
quality and aroma provide the raw material for high quality chocolates been highly demanded.
Therefore, this technical innovation is an option to supply this market that simultaneously
contributes to rural livelihoods. Nevertheless, the rehabilitation technique is a possibility that
small farmers have the opportunity to adopt it. The adoption is a complex process that could
encourage or limit the acceptance of an innovation. For this reason, it is relevant to determine
whether factors have an effect on the probability of adoption. The hypotheses were formulated
regarding to socioeconomic characteristics, cocoa farm characteristics and technical diffusion of
the project innovation. The determinant and significant factors are regarding to socioeconomic
aspects and farm practices and characteristics. The probability model predicted that male farmers
have a higher probability to adopt the innovation. It also evidenced that higher availability of
family labor increases the likelihood for the adoption. Therefore, the number of family members
working on the farm is positively correlated with the adoption. The model also predicted that for
producers having an additional source of income are more likely to adopt the innovation. On the
other hand, for producers with an additional number of pruning practices annual, will reduce the
chance of adoption. Finally, the model includes that producer of cocoa farms with a high level of
monilia plant disease is more likely to adopt the rehabilitation technique.
There are some variables that the probability model did not predict. However, it is also relevant
to consider it in the analysis such as ‘replanting cocoa seedlings’ as a favorable choice for facing
low productivity levels. In addition, replacing cocoa trees can be associated with the
rehabilitation innovation that depends on the plant status. The same for the variables ‘number of
workshops attendance’ for building capacity, and ‘number of technical visits’ on producers’
farm. These are the connection for technical diffusion innovation at the level of small cocoa
producers. More frequencies of these activities were observed within adopters group and non-
adopters.
In addition, the study shows the effect of the project rehabilitation technique at the level of cocoa
plant diseases and yields. These aspects are relevant as an outcome project with the aim of
increasing productivity thus, rural livelihoods. According to the literature, plant diseases might
causes losses in a range of 40 to 80 percent on cocoa farms. Therefore, cocoa trees with less
disease incidences are able to increase productivity which was reported by adopters before and
after the implementation. Consequently, farmers who adopted the rehabilitation technique
compared to the control group reported a decrease of plant disease while yields increase by 33%
compared to productivity levels without its implementation and control group.
Moreover, the calculation of the profitability from the rehabilitation technique determined the
economic returns from the practices per hectare. The pruning practices and biol applications on

44
cocoa trees of variety National were included. Resulting, a positive NPV of $1,980.09 and an
IRR of 13% greater than the market interest rate. This shows that the practice is beneficial. A
sensibility analyzes was taken into consideration due to the prices fluctuations calculating that
the breakeven, is at the price of $2,113.3 per tonne.
In addition, it was possible to demonstrate how the rehabilitation technique has an effect on
small farmers’ organization on the level of social capital. The three components of social capital
related to the farmers’ organization such as knowledge, practices and network within its
organization were taken into account. Adopters reported that there have been changes on farming
in every form of organization. Nevertheless, within every organization and different biol
preparation scheme, it has been observed positive changes. It has been positive changes in
knowledge and practices with the biol application and pruning activities being applied on farm
practices. Finally for the network component, it is giving changes particularly on biol preparation
on farmers’ organization where relationships have a significant factor for its achievement.
5.1.Recommendations for further research
The findings from this study derived from descriptive statistical analysis, and probability model
from the sample. Although, it is recommended to have greater sample size in order to avoid large
variations within the sample. It is also suggested to analyze the implication of this technique
within other settlement at a regional level. In order to determine whether there are similar results
compared to these findings for more accurate future projects recommendations.
For the impact assessment of the rehabilitation farm management technique, it is recommended
to do a randomly selection farmers group for the treatment doing the same for the comparison
group. In other words, the selection for the rehabilitation technique on producers should be
randomly selected in order to ensure no difference between groups.
For further studies, it could be possible to analyze whether the positive impact at the level of
productivity is derived from the association of the pruning cocoa trees and biol application.
Similar to this rehabilitation alternative and comparing productivity level only taking into
consideration the pruning practices apart from biol application. In other words, it is to identify
whether the increase in yields are affected from both practices or only from one of them.
For profitability analysis, it was made according to information regarding to El Oro province in
order to give a general idea for the economic returns of the rehabilitation technique for cocoa
variety National. It is recommended to do it for other provinces and regions of Ecuador for
having a better analysis at national level.
This study evidenced how yields increased from the effect of the rehabilitation technique.
However, it is suggested that the technical diffusion should be complemented with post
harvesting (drying and fermentation cocoa beans process) techniques in order to get a good
quality beans, therefore, a fair price at the level of small cocoa producers.

45
List of references
1. Alene, A.D., Manyong, V.M. , Gockowski, J., Coulibaly, O., and Abele, S. (2006). A framework for
conceptualizing impact assessment and promoting impact culture in agricultural research. Impact
series. International Institute of Tropical Agriculture, Ibadan, Nigeria, pp30.
2. Asociación Nacional de Exportadores de Cacao-Ecuador (Anecacao) [Website]. (2009). Importancia
del Cacao de Aroma. Available from: <http://www.anecacao.com/spanish/MercadoAroma.aspx>
[Accessed: 10 April 2010].
3. Baerenklau, K.A. (2005). Toward an Understanding of Technology Adoption: Risk, Learning, and
Neighborhood Effects. Land Economics 81 (1), 1-19.
4. Basantes, E.D. (2009). Elaboración y aplicación de dos tipos de biol en el cultivo de brócoli. Tesis de
grado. ESPOCH, pp. 123.
5. Bentley, J.W., Boa, E., and Stonehouse, J. (2004). Neighbor Tress: Shade, Intercopping, and Cacao
in Ecuador. Human Ecology, Volume 32, No 2, pp.241-270.
6. Castilla, L. (2006). Biofertilización: alternativa viable para la nutrición vegetal. Sociedad
Colombiana de la ciencia del suelo. Ibagué. Colombia. 196pp.
7. Correa, R. (2010). Ecuador: de Banana Republic a la No República. Bogotá, Colombia.
8. De Graaff, J., Amsalu, A., Bodnar, F., Kessler, A., Posthumus, H., and Tenge, A. (2008). Factors
influencing adoption and continued use of long-term soil and water conservation measures in five
developing countries. Applied Geography 28, 271-280.
9. Doss, C.R. (2006). Analyzing technology adoption using microstudies: limitations, challenges, and
opportunities for improvement. Agricultural Economics 34, 207-219.
10. Durston, J. (2002). El Capital Social Campesino en la Gestión del Desarrollo Rural. CEPAL, pp.8.
11. Enríquez, G.A. (2004). Cacao orgánico: Guía para productores ecuatorianos. Instituto Nacional
Autónomo de Investigaciones Agropecuarias (INIAP). Manual No54. Quito, Ecuador, pp. 360.
12. Feder, G. Just, R.E. and Zilberman, D. (1985). Adoption of Agricultural Innovations in Developing
Countries: A Survey. Economic Development and Cultural Change, 255-288.
13. Hebbar, P.K. (2007). Cacao diseases: A global perspective from an Industry point of view.
Phytopathology 97:1658-1663.
14. Idrisa, Y.L., Ogunbameru, B.O., and Amaza, P.S. (2010). Influence of farmers’socio-economic and
technology characteristics on soybean seeds technology adoption in Southern Borno State, Nigeria.
African Journal of Agricultural Research, Volume 5 (12), pp 1394-1398.
15. Instituto Nacional de Estadisticas y Censos de Ecuador (INEC). [Website 2009]. Estadisticas
Agropecuarias. Available from: http://www.ecuadorencifras.com [Accessed: May 1st, 2011].
16. International Cocoa Organization (IICO) (2010). The world cocoa economy: Past and present.
Executive Committee.
17. Ito, S. (2006). Caracterización y evaluación de los factores que determinan la calidad nutricional e
inocuidad en la producción de fertilizantes orgánicos fermentados. CATIE. Tesis de maestría.
Turrilba. Costa Rica. 119 pp.
18. Llewellyn, R.S. (2007). Information quality and effectiveness for more rapid adoption decisions by
farmers. Field Crops Research 104, 148-156.
19. Maredia, M., Byerlee, D., and Anderson, J. (2000). Ex Post Evaluation of Economic Impacts of
Agricultural Research Programs: A Tour of Good Practice. In the Workshop of ‘The future of impact
assessment in CGIAR: needs, constraints, and options’Standing Panel on Impact Assessment (SPIA)
of the Technical Advisory Committee, Rome, May 3-5, Rome.
20. Marenya, P.P. and Barrett, C.B. (2007). Household-level determinants of adoption of improved
natural resources management practices among smallholder farmers in western Kenya. Food Policy
32, 515-536.
21. Odendo, M., Obare, G., and Salasya, B. (2009). Factors responsible for differences uptake of
integrated soil fertility management practices amongst smallholders in Western Kenya. African
Journal for Agricultural Research. Volume 4 (11), pp. 1303-1311.
46
22. Ommani, A., Chizari, M., Salmanzadeh, C. and Hosaini, J. (2009). Predicting adoption behavior of
farmers regarding on-farm sustainable water resources management. (SWRM): comparison models.
Journal of Sustainable Agriculture, 33:5, 595-616.
23. Pacheco, F. (2006). Producción, utilización y algunos aspectos técnicos de los biofermentos. Centro
de Investigaciones Agronómicas de la Universidad de Costa Rica, pp. 18.
24. Pastorelly, D., Vera, M., Pilamunga, M., Izquierdo, L., Mejía, Y., Posligua, W., Zambrano, D., and
Rodríguez, R. (2006). Manual del cultivo del cacao. Asociación Nacional de Exportadores de Cacao
(ANECACAO). Guayaquil. Ecuador, pp. 80.
25. Pinheiro, S. (2000). Manual práctico de Agricultura Orgánica. Capítulo Biofertilizantes. Fundación
Junquira Candiru. Porto Alegre. Brasil 98 pp.
26. Quingaísa, E. (2007). Estudio de caso: Denominación de origen ¨Cacao Arriba¨. FAO, IICA, Quito,
Ecuador.
27. Quiroz, J. and Amores, F. (2002). Rehabilitación de plantaciones tradicionales de cacao en Ecuador.
Manejo integrado de plagas No 63, Costa Rica, p. 63-80.
28. Restrepo, J. (2001). Elaboración de abonos orgánicos fermentados y biofertilizantes foliares:
experiencias con agricultores en Mesoamérica y Brasil. San José, Costa Rica, pp. 156.
29. Rice, R.A., and Greenberg, R. (2000). Cacao cultivation and the conservation of biological diversity.
Royal Swedish academic science. Ambio. Volume 29. No 3, pp. 167-173.
30. Rick, S. (2007). Information quality and effectiveness for more rapid adoption decisions by farmers.
Field Crops Research.
31. Robalino, H. (2011). Evaluación de la actividad nutricional y biológica de diferentes formulaciones
de biofertilizantes líquidos fermentados y la respuesta a su aplicación en cultivos de arroz (Oriza
sativa) y maíz (Zea mays). Tesis de maestría, Guayaquil. Ecuador, 58 pp.
32. Rogers, E.M., (2003). Diffusion of innovations. The Free Press., New York, USA.
33. Rosero, J. (2002). La ventaja comparativa del cacao ecuatoriano. Apuntes de Economía No20.
Dirección General de Estudios.
34. Schneider, D. (2007). Méthodes qualitatives en sciences sociales. TECFA, Faculté de Psychologie et
des Sciences de l’education. Université de Genève.
35. Suarez, M. (2009). Caracterización de un compuesto orgánico producido en forma artesanal por
pequeños agricultores en el departamento de Magdalena. Maestría en Ciencias Agrarias con énfasis
en suelos, pp 93. Santa Marta, Colombia.
36. Tisenkopfs, T., Lace, I., and Mierina, I. (2008). Social Capital. In: Van der Ploeg, Marsden, T. (Eds.),
Unfolding Webs: The Dynamics of Regional Rural Development, pp. 87-110.
37. Tiwari, K.R., Brishal, K., Situala, I., and Paudel, G.S. (2008). Determinants of farmer’s adoptions of
improved soil conservation technology in a Middle Mountain Watershed of Central Nepal.
Environmental Management. Volume 42. Number 2, pp. 210-222.
38. Vaessen, J and De Groot, J. (2003). Measuring outcome and impact of small development projects:
lessons from the evaluation of a training project on low external input agriculture in Guatemala.
Discussion paper. Institute of Development Policy and Management (UDPM/UA).
39. Weiland, P. (2009). Biogas production: current state and perspectives. Mini review. Johann Heinrich
vonThunen-Institute. Braunschweig, Germany, pp.12.

List of Appendices

Appendix 1: Guide interview for cocoa producers for the assessment of social capital within
farmers’ organization.
Social capital components
Questions Objectives
Knowledge
How do they learn their farming manner from the beginning?
From whom was it learn?
Have been major changes so far?
Determine how farmers learn farm management techniques
Determine if farmers are willing to accept changes and innovation for farming
Network
Since when are they member of the farmers’ organization?
What are the benefits to be part of it?
How often do they attend to meetings?
What topics are discussed?
How often do they attend to training workshops?
Establish their level of participation at the farmers’ organization
Determine how farmers benefit from being member of the farmers’ organization
Practices: Adoption
innovation technique
pruning cocoa trees associated
with biol production and
application
How do they know about the innovation technique?
Why was it adopted? / Why is it willing to adopt?
Do they visit farms where there are demonstratives or experimental plots?
How is the pruning practice carried out within their organization?
Is biol produced at their farm or at the organization?
How do they have access to biol ingredients?
Is it better to produce biol alone or in groups as a common biol?
Establish the adoption process at a farm level and within farmers’ organization
Determine how farmers develop the innovation technique is it for them an individual or a common benefit?
How do they prefer to do the biol?

Appendix 2: Cocoa: area, production, and yield in Ecuador (Source: MAGAP, 2010)
Year
Planted
area
(has)
Harvested
area (has)
Production
of dry
beans (tn)
Yield
(tn/ha)
2000 434.419 402.836 107.911 0,27
2001 415.327 389.134 101.693 0,26
2002 383.711 363.575 91.632 0,25
2003 374.045 348.434 122.451 0,35
2004 366.927 336.358 131.164 0,39
2005 406.866 357.706 144.143 0,40
2006 407.868 350.028 139.498 0,40
2007 422.985 356.657 131.419 0,37
2008 455.414 376.604 143.945 0,38
2009 468.84 398.104 189.755 0,48
2010* 491.221 415.615 212.249 0,51
* Data for 2010 are provisional, they have been calculated
considering the average change percentage during the last 3 years.
Appendix 3: Requirements for quality cocoa benefited (NTE INEN-176)
REQUERIMENTS UNITS CACAO ARRIBA NATIONAL
CCN-51 ASSPS ASSS ASS ASN ASE
One hundred cocoa beans
weigh g
135-
140
130-
135
120-
125
110-
115
105-
110
135-
140
Fermentation (minimum) % 85 75 65 54 53 76
Violet (maximum) % 10 15 21 25 25 18
Slate (maximum) % 4 9 12 18 18 5
ASSPS Arriba Superior Summer Plantation Selecta; ASSS Arriba Superior Summer Selecto; ASS Arriba Superior Selecto; ASN Arriba Superior
Navidad; ASE Arriba Superior Epoca

Appendix 4: Rehabilitation costs (1 ha) of traditional cocoa plantation variety National
Year 1 Year 2 Year 3 Year 4 Year 5 Year 6 Year 7 Year 8-14 Year 15-20
Unit Cost
Unit Cost($) Unit Cost($) Unit Cost($) Unit Cost($) Unit Cost($) Unit Cost($) Unit Cost($) Unit Cost($) Unit Cost($)
A. Rehabilitation investments Pole pruner 380 1 380
Biol tanks (200lts) 200 4 800
Cocoa plants for replanting 0.8 150 120 150 120
Total A 1300
B. Activities
Weed control 7 18 126 15 105 15 105 15 105 15 105 15 105 15 105 15 105 15 105
Problems identification 7 0.5 3.5
Pull out old cocoa trees 7 3 21 3 21
Distribution and replanting 7 4 28 4 28
Pruning 7 20 140 10 70 5 35 5 35 5 35 5 35 5 35 5 35 5 35
Shade regulation 7 2 14 1 7 1 7 1 7 1 7 1 7 1 7 1 7 1 7
Fertilization 7 14 98 14 98 14 98 14 98 14 98 14 98 14 98 14 98 14 98
Control diseases 7 3 21 3 21 3 21 3 21 3 21 3 21 3 21 3 21 3 21
Watering 7 12 84 12 84 12 84 12 84 12 84 12 84 12 84 12 84 12 84
Maintenance canals 7 3 21 3 21 3 21 3 21 3 21 3 21 3 21 3 21 3 21
Cocoa harvest 7 8 56 12 84 14 98 16 112 18 126 20 140 20 140 18 126 16 112
Postharvest process 7 2 14 3.5 24.5 4.5 31.5 6 42 7.5 52.5 9 63 9 63 7.5 52.5 6 42
Transportation 10 10 100 10 100 10 100 10 100 10 100 10 100 10 100 10 100 10 100
Subtotal B 726.5 614.5 600.5 625 649.5 723 674 649.5 625
C. Inputs and materials
Molassess 8.5 12 102 12 102 12 102 12 102 12 102 12 102 12 102 12 102 12 102
Sulpomag 0.33 52.8 17.42 52.8 17.42 52.8 17.42 52.8 17.42 52.8 17.42 53 17.42 52.8 17.42 53 17.42 53 17.42
Rock phosphate 0.16 52.8 8.45 52.8 8.45 52.8 8.45 52.8 8.45 52.8 8.45 53 8.45 52.8 8.45 53 8.45 53 8.45
Rice husk ash 0.05 21 1.05 21 1.05 21 1.05 21 1.05 21 1.05 21 1.05 21 1.05 21 1.05 21 1.05
Milk 0.6 6 3.6 6 3.6 6 3.6 6 3.6 6 3.6 6 3.6 6 3.6 6 3.6 6 3.6
Microorganism (EM) 0.45 144 64.8 144 64.8 144 64.8 144 64.8 144 64.8 144 64.8 144 64.8 144 64.8 144 64.8
Cow manure 0.05 330 16.5 330 16.5 330 16.5 330 16.5 330 16.5 330 16.5 330 16.5 330 16.5 330 16.5
Irrigation water 8 30 240 30 240 30 240 30 240 30 240 30 240 30 240 30 240 30 240
Water pumping irrigation 7 10 70 10 70 10 70 10 70 10 70 10 70 10 70 10 70 10 70
Subtotal C 523.8 523.8 523.8 523.8 523.8 523.8 523.8 523.8 523.8
Total cost (D)(B+C) 1250.3 1138.3 1124.3 1148.8 1173.3 1246.8 1197.8 1173.3 1148.8
Costs and benefits from year 1 to 20
Yield/ha (E) (ton/ha) 0.278 0.414 0.552 0.69 0.79 0.9 1 0.825 0.65
Price per unit (F) ($/ton) 2500 2500 2500 2500 2500 2500 2500 2500 2500
Total gross income (G) (E*F) 695 1035 1380 1725 1975 2250 2500 2062.5 1625
Total net income (H) (G-D) -555.3 -103.3 255.7 576.2 801.7 1003.2 1302.2 889.2 476.2

# Questionnaire Yes
No
Start date:
SP- without project
CP- with project
Q1. Age single unido
married other
Q4. Education
none
primary yes distance: foot/vehicule
secondary no ______________ male female children
tertiary
water tank
cane pump water yes Q10,Q11Name______________
cement other no
mixed light
other toiletlatrine
$/year market owner
capacity building renter
biol workshops
other
I am Adriana Santos, a master student in rural development. I'm conducting a study with CIBE-ESPOL in the project for the rehabilitation of cocoa
plantations variety National. The objective is to determine what factors influence on the adoption of the rehabilitation technique at the level of small
producers. All the information collected through this questionnaire is for this study and it is strictly confidential. It will be used for academic purposes. It
will take 45 minutes. Thank you.
Q5. The producer lives on the farm
borrow/ rent tools or
material
DateProject participation
Name of the producer Name of the farm
Q10. Cost for being a memberQ11. What are the benefits of being a
member
Location
A. PRODUCER DATA
male
female
Q8. Basic housing needs
Q7. Type of house Q9. The producer is member of an association
Q12. Land tenure
other contribution ________
Q2. Gender Q3.Marital status
Q6. Number of people living in the house
Appendix 5: Questionnaire for cocoa producers
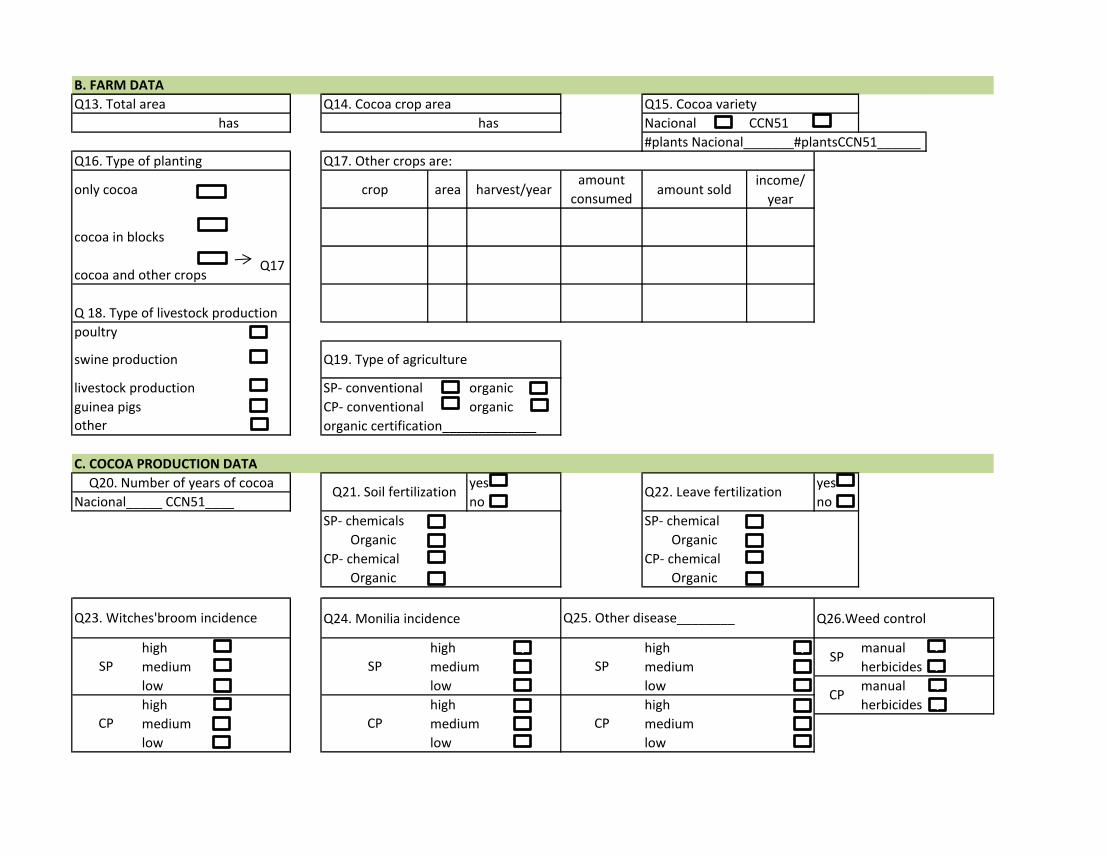
Q13. Total area Q14. Cocoa crop area
Nacional CCN51
#plants Nacional_______#plantsCCN51______
Q17. Other crops are:
only cocoa crop area harvest/yearamount
consumedamount sold
income/
year
Q17
poultry
livestock production SP- conventional organic
guinea pigs CP- conventional organic
organic certification_____________
yes yes
Nacional_____ CCN51____ no no
SP- chemicals SP- chemical
Organic Organic
CP- chemical CP- chemical
Organic Organic
Q24. Monilia incidence Q26.Weed control
manual
herbicides
manual
herbicides
Q25. Other disease________Q23. Witches'broom incidence
high
medium
low
high
medium
low
SP
high
medium
low
CP
high
medium
low
Q16. Type of planting
Q19. Type of agriculture
Q20. Number of years of cocoaQ21. Soil fertilization Q22. Leave fertilization
cocoa in blocks
cocoa and other crops
C. COCOA PRODUCTION DATA
has
B. FARM DATA
has
Q15. Cocoa variety
CP
SP
high
medium
low
CP
high
medium
low
Q 18. Type of livestock production
swine production
other
SP
CP
SPv v
v
v
v
v

Q27. Pruning practices Q28. Pull out old cocoa trees
#/yearly SP yes yes
yes no no
no CP yes if yes, origen and variety___________
yes no yes
no no
Q30. Grafting practices if yes, origen and variety___________
yes
no
yes
no
SP qq/has/year yes
CP qq/has/year no
yes
no
Q31. Harvest months per year yes
no
Q31. Number of harvest monthly yes
no
organization dried cocoa bean
intermediary not dried
Q33. Market:
SP
member of the family
Q29. Re-planting and/or replacing cocoa
trees?
off-farm workers outside
harvesting period
Cost of a day work $________
SP
CP
SP
CP
off- farm workers in harvest
period
Q35. Number of day-work for cocoa
Q32. Post harvesting practices:
SP
CP
fermentation
drying
fermentation
drying
D. SOCIO-ECONOMIC PRODUCER DATA
manner:
________
manner:
________
SP
CP
Q31. Average yield of cocoa
Q34. Price received per qq
$_______
$_______
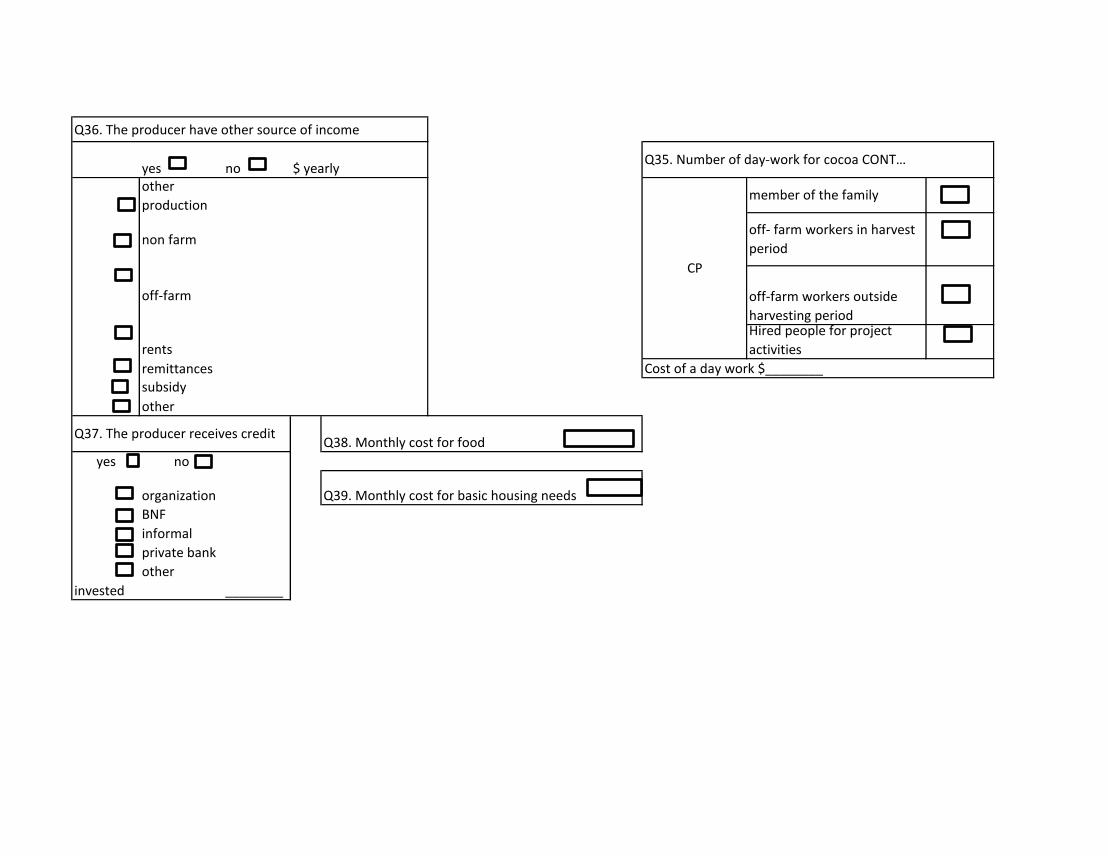
Q36. The producer have other source of income
yes no $ yearlyother
production
non farm
off-farm
rents
remittances
other
yes no
organization
BNF
informal
invested ________
private bank
other
member of the family
off- farm workers in harvest
period
subsidy
Q37. The producer receives credit
off-farm workers outside
harvesting periodHired people for project
activities
CP
Q35. Number of day-work for cocoa CONT…
Cost of a day work $________
Q38. Monthly cost for food
Q39. Monthly cost for basic housing needs

yes yes _______ number yearly
no no
biol components
prepared biol other
Q46. Rehabilitated area of cocoa
yes institutions____________ (has) at the beginning
no (has) at the moment
yes
where_____
yes
where_____
nodistance_____
no donde_____ distancia____distance_____
on farm
Q45 The producer receives technical assistance from
other organizations
Q48. The producer reproduces microorganism on
farm Q49. The producer obtains biol's components:
Q42. Number of technical visits received
on farm yearly
Q43. Number of visits on farm from
other producers
Q47. The producer prepares biol on farm
Q44. The producer receives capacity
building on:
pole pruner
capacity building
takes too much time
too difficult
too far away
F. BIOL-PREPARATION /APPLICATION [only for project participants]
E. EXTENSION PRACTICES
through the organization
other
post harvesting
market
artesanal chocolate making
Q40. The producer receives project'
subsidy
tanks
Q41.The producer attends to workshops for biol
elaboration and pruning practices
cocoa farm management
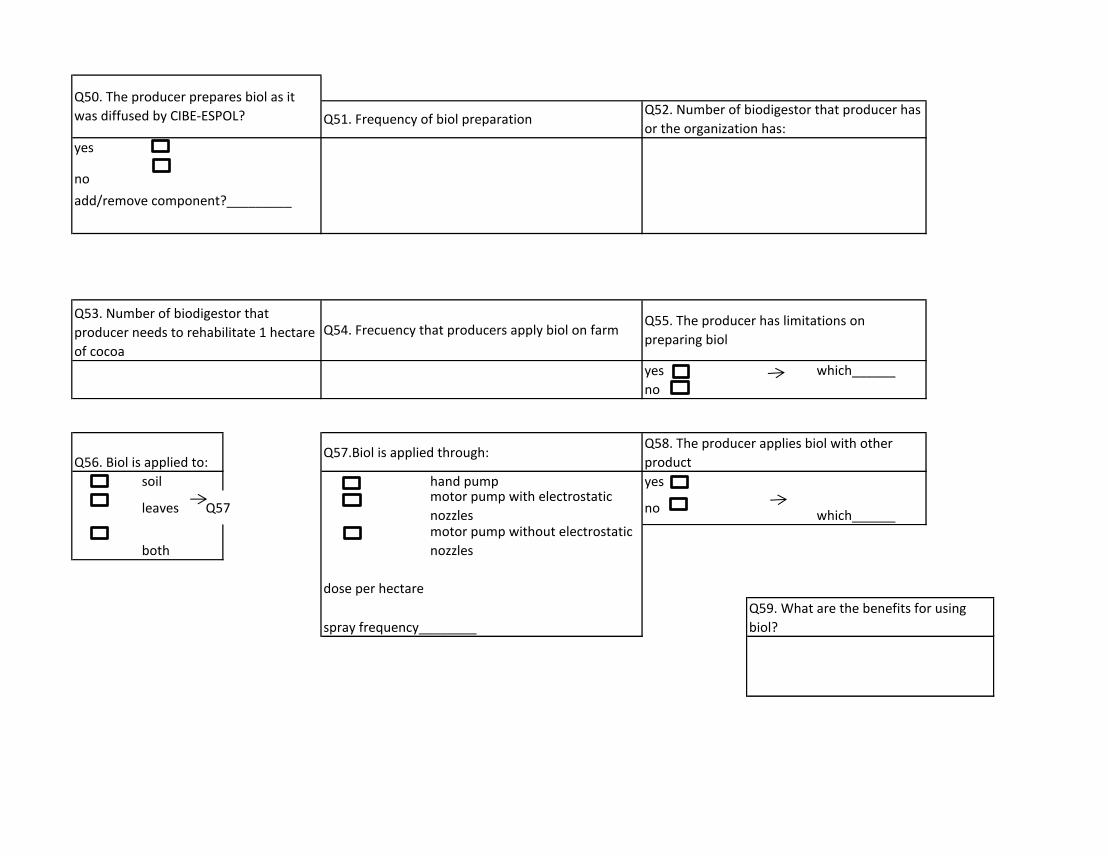
yes
no
add/remove component?_________
yes which______
no
Q57.Biol is applied through:
soil hand pump yes
leaves Q57 nowhich______
both
dose per hectare
spray frequency________
Q59. What are the benefits for using
biol?
motor pump with electrostatic
nozzles motor pump without electrostatic
nozzles
Q51. Frequency of biol preparationQ52. Number of biodigestor that producer has
or the organization has:
Q56. Biol is applied to:
Q58. The producer applies biol with other
product
Q53. Number of biodigestor that
producer needs to rehabilitate 1 hectare
of cocoa
Q54. Frecuency that producers apply biol on farmQ55. The producer has limitations on
preparing biol
Q50. The producer prepares biol as it
was diffused by CIBE-ESPOL?