San Diego Metropolitan Transit System...Chula Vista and a Chula Vista City Council Member), one...
146
Transcript of San Diego Metropolitan Transit System...Chula Vista and a Chula Vista City Council Member), one...


San Diego Metropolitan Transit System
San Diego, California
Comprehensive Annual Financial Report
and Independent Auditors’ Report
For the Years Ended June 30, 2019 and 2018
PREPARED BY SAN DIEGO METROPOLITAN TRANSIT SYSTEM FINANCE DEPARTMENT


San Diego Metropolitan Transit System
Table of Contents
Page Introductory Section (Unaudited):
Letter of Transmittal ......................................................................................................................................... i Listing of Board of Directors and Management ............................................................................................. vii Executive Level Organization Chart ............................................................................................................... ix Certificate of Achievement for Excellence in Financial Reporting – GFOA................................................... x
Financial Section:
Independent Auditors' Report ...................................................................................................................... 1 Management's Discussion and Analysis (Required Supplementary Information) (Unaudited) ................................................................................. 3 Basic Financial Statements:
Statements of Net Position ......................................................................................................................... 8 Statements of Revenues, Expenses, and Changes in Net Position .......................................................... 11 Statements of Cash Flows ........................................................................................................................ 12 Notes to Basic Financial Statements ........................................................................................................ 16
Required Supplementary Information (Unaudited):
Schedule of Proportionate Share of the Net Pension Liability ................................................................ 72 Schedule of Changes in Net Pension Liability and Related Ratios ......................................................... 73 Schedule of Contributions ....................................................................................................................... 76 Schedule of Changes in the Total OPEB Liability and Related Ratios ................................................... 80
Supplementary Information:
Combining Schedule of Net Position ...................................................................................................... 84 Combining Schedule of Revenues, Expenses, and Changes in Net Position .......................................... 87 Combining Schedule of Cash Flows ........................................................................................................ 89 Schedules of Revenues, Expenses, and Changes in Net Position – Budget and Actual:
Combined Operations ......................................................................................................................... 91 General Operations:
General Operations ........................................................................................................................ 93 Taxicab Administration ................................................................................................................. 95 San Diego and Arizona Eastern Railway ....................................................................................... 96 Contracted Services ....................................................................................................................... 97 San Diego Transit Corporation ...................................................................................................... 99 San Diego Trolley Incorporated. .................................................................................................. 101

San Diego Metropolitan Transit System
Table of Contents (Continued)
Page Statistical Section (Unaudited):
Financial Trends: Net Position by Component ................................................................................................................... 106 Changes in Net Position ......................................................................................................................... 107
Revenue Capacity: Operating Revenues by Source .............................................................................................................. 110 Fare Structure ........................................................................................................................................ 111 Farebox Recovery Percentage ............................................................................................................... 112
Debt Capacity: Ratio of Outstanding Debt by Type ....................................................................................................... 114
Demographic and Economic Information: Regional Population and Personal Income Statistics ............................................................................. 116 Full-Time and Part-Time Employees by Function ................................................................................ 117 Ten Largest Employers in San Diego County ....................................................................................... 118
Operating Information: Operating Indicator by Function ............................................................................................................ 120 Service Performance Data ..................................................................................................................... 121 Capital Assets Statistics by Function ..................................................................................................... 122 Ridership ................................................................................................................................................ 123 Operating Subsidy ................................................................................................................................. 124
Independent Auditors' Report on Internal Control Over Financial Reporting and on Compliance and Other Matters Based on an Audit of Financial Statements Performed in Accordance with Government Auditing Standards ....................................................... 125

INTRODUCTORY SECTION

This page intentionally left blank.
i
Board of Directors and Transit Riders San Diego Metropolitan Transit System The comprehensive annual financial report of the San Diego Metropolitan Transit System (MTS) for the fiscal years ended June 30, 2019 and 2018 is hereby submitted. Responsibility for both the accuracy of the data, and the completeness and fairness of the presentation, including all disclosures, rests with management. The MTS Board of Directors has established an Audit Oversight Committee to provide an additional level of scrutiny to the preparation of the comprehensive annual financial report. Management of MTS is responsible for establishing and maintaining an internal control structure designed to ensure that the assets of MTS are protected from loss, theft, or misuse and to ensure that adequate accounting data are compiled to allow for preparation of financial statements in conformity with generally accepted accounting principles in the United States of America (U.S. GAAP). The internal control structure is designed to provide reasonable, but not absolute, assurance that these objectives are met. The concept of reasonable assurance recognizes that (1) the cost of a control should not exceed the benefits likely to be derived and (2) the valuation of costs and benefits requires estimates and judgments by management. As management, we assert that, to the best of our knowledge and belief, this financial report is complete and reliable in all material respects. State statutes require an annual audit by independent certified public accountants. The Pun Group LLP, Accountants and Advisors, has been retained to meet this requirement. The goal of the independent audit was to provide reasonable assurance that the financial statements of MTS for the fiscal years ended June 30, 2019 and 2018 are free of material misstatement. The independent audit involved examining, on a test basis, evidence supporting the amounts and disclosures in the financial statements; assessing the accounting principles used and significant estimates made by management; and evaluating the overall financial statement presentation. The independent auditors concluded, based upon the audit, that there was a reasonable basis for rendering an unmodified opinion that MTS's financial statements for the fiscal years ended June 30, 2019 and 2018 are fairly presented, in all material respects, in conformity with U.S. GAAP. The independent auditors' report is presented as the first component of the financial section of this report. The independent audit was also designed to meet the requirements of a broader, federally mandated "Single Audit" and to meet the special needs of federal grantor agencies. The standards governing Single Audit engagements required the independent auditor to report not only on the fair presentation of the financial statements, but also on the audited government’s compliance with the requirements described in OMB Compliance Supplement that could have a direct and material effect on each of MTS’s major federal programs. The auditors are required to test and report on internal control over compliance in accordance with the Uniform Guidance, but not for the purpose of expressing an opinion on the effectiveness of internal control over compliance. The reports related specifically to the Single Audit are issued under separate cover. U.S. GAAP requires that management provide a narrative introduction, overview, and analysis to accompany the financial statements in the form of Management’s Discussion and Analysis (MD&A). This letter of transmittal is designed to complement the MD&A and should be read in conjunction with it. The MD&A can be found immediately following the report of the independent auditors. REPORTING ENTITY
The San Diego Metropolitan Transit System was created effective January 26, 1976 to provide the policy setting and overall management coordination of the public transportation system in the San Diego metropolitan service area. This service area encompasses approximately 3 million people residing in a 570 square mile area of San Diego County, including the cities of Chula Vista, Coronado, El Cajon, Imperial Beach, La Mesa, Lemon Grove, National City, Poway, Santee, and San Diego and the unincorporated area of the County of San Diego.

ii
MTS’s mission statement, adopted by the Board of Directors, is to enhance the personal mobility of San Diego metropolitan area residents and visitors by:
Obtaining maximum benefit for every dollar spent. Being the community’s major public transportation advocate. Increasing public transportation usage per capita. Taking a customer-oriented approach. Implementing capital projects on schedule and within budget. Offering high-quality public transportation services. Responding to the community’s socioeconomic interests.
California law establishes the San Diego Association of Governments (SANDAG) as the planning agency for San Diego County. The responsibility and decision-making for all transportation-related planning, programming and development activities occurs within SANDAG's ten member Transportation Committee. Approved transportation plans and programs are subsequently executed by SANDAG staff. Within this structure, MTS and the North County Transit District (NCTD) focus primarily on operating activities. MTS is effectively an umbrella agency. MTS owns the assets of San Diego Trolley, Inc. (SDTI) and San Diego Transit Corporation (SDTC), the area’s two largest transit operators. These two transit units were formed under California law as not-for-profit public corporations and function as operating subsidiaries of MTS. SDTI and SDTC are considered component units and are blended component units for financial reporting purposes. SDTI operates four Light Rail Transit (LRT) routes: the UC San Diego Blue Line from the America Plaza Station to San Ysidro at the International Border, the Orange Line from the Courthouse station through Centre City and then east to El Cajon, the Sycuan Green Line from the 12th and Imperial Transit Center Bayside platform to Santee and the SDG&E Silver Line that makes stops along the downtown loop using three restored vintage cars from the 1940's and 1981. SDTI operates on a total of 54.3 miles of track. SDTC operates 27 routes with an active fleet of 270 buses. The relationship between MTS and the transit operating subsidiaries, SDTI and SDTC, is formally established through operating agreements and MTS-adopted corporate policies. These agreements and corporate policies specify the roles and responsibilities of each of the organizations and outline the procedures in numerous functional areas including accounting and budgeting, fare setting, marketing and public information, revenue-producing advertising, service contracts, and programming of federal, state and local subsidies. The MTS Board of Directors has the policy-setting responsibility for the operation and development of MTS’s transit operating subsidiaries as well as for the planning and approval of capital expenditures by or on behalf of these entities. The day-to-day operating functions, labor matters and maintenance of facilities are managed by the individual transit operators. MTS has centralized and consolidated Security, Planning, Human Resources, Finance, Information Technology, Stores, and Purchasing for MTS and all subsidiaries. In addition to the bus routes operated by SDTC, MTS is financially accountable for the operation of certain additional bus routes. MTS contracts with outside parties for the operation of 73 fixed-route bus lines and paratransit services with an active fleet of 530 buses. The contracts require full operation and maintenance of the bus services. Contract services are accounted for in the MTS - Contracted Services Fund for financial reporting purposes. MTS owns the San Diego and Arizona Eastern Railway Company (SD&AE), a not-for-profit railroad holding company entrusted with assets which include 108 miles of rail line and over 2,000 acres of property. MTS has a contract with the San Diego and Imperial Valley Railway Co. (SDIV) for the operation of freight rail services over the UC San Diego Blue Line (downtown San Diego south to San Ysidro) and Orange Line (downtown San Diego east to El Cajon) trolley segments. MTS provides no subsidy to SDIV, but does receive a portion of its gross revenue. SD&AE is considered a blended component unit for financial reporting purposes.
iii
In December 2012, SD&AE entered into a 99-year lease and operating agreement with Pacific Imperial Railroad, Inc. (PIR) over the 70-mile Desert Line freight right of way in East San Diego County. PIR filed for bankruptcy in September 2016 and the lease was transferred to Baja California Rail Road, Inc. (BJRR) as part of the bankruptcy process. In September 2017, MTS executed an amended and restated Desert Line lease agreement with BJRR. The BJRR agreement provides specific performance milestones which begin after the US and Mexico governments formally approve construction and operation of a customs inspection facility serving the Desert Line, with a minimum of $1 million in annual revenue required. The agreement may be terminated if BJRR fails to meet the specified milestones, or at BJRR’s election with six months’ notice. If BJRR meets all milestones and commences freight operations along the Desert Line, MTS's revenue will increase to 7% of gross freight revenue. MTS is financially accountable for the operation of Taxicab Administration and currently has contracts with the following cities through June 30, 2024: San Diego, National City, El Cajon, Imperial Beach, La Mesa, Lemon Grove, Poway, Santee and Chula Vista. The agreements include licensing and regulating taxicabs, jitneys, nonemergency medical, charter, low speed vehicle, and sightseeing for-hire vehicles.
The MTS Board of Directors is comprised of 15 members with four appointed from the City of San Diego (the Mayor of San Diego and three San Diego City Council Members), two appointed from the City of Chula Vista (the Mayor of Chula Vista and a Chula Vista City Council Member), one appointed from each City Council of Coronado, El Cajon, Imperial Beach, La Mesa, Lemon Grove, National City, Poway, and Santee, and one appointed from the San Diego County Board of Supervisors. ECONOMIC CONDITION AND OUTLOOK
San Diego region's economy is geared toward continued prosperity in 2019. Industries projected to lead the region's growth include Biotech and Healthcare. San Diego's gross domestic product (GDP), the total value of the region's economy, soared to $246 billion in 2018 compared to the $231.8 billion earned in 2017, and is forecasted to grow 2.5 percent in 2019. The unemployment rate was 3.3% in June 2019. This is consistent with the 3.3% average for the first half of 2019, unchanged from 3.3% in 2018 yet down from 4.0% in 2017. San Diego continues to compare favorably to the unemployment rate in California and the national average.
Long-term financial planning
The long-term goal of MTS is to fund operations solely with recurring revenues. While sales tax receipts throughout California, which impacts subsidy revenue available to MTS from both TDA and TransNet funds, increased again for the ninth consecutive year, MTS experienced three years of ridership declines over FY16-FY18, with overall passenger levels down by almost 12% compared to the FY15 peaks. This had a similar impact on passenger revenue levels, and to compensate, MTS utilized one-time funding to balance both the FY18 amended budget and the FY19 operating budget. However, in FY19 passenger levels grew over FY18 by 0.2%, and passenger revenue increased by $2.0 million. In addition, State Transit Assistance (STA) funding has stabilized after the defeat of the Senate Bill 1 (SB1) repeal in the November 2018 elections. For FY20, the operating budget was balanced without using any one-time funding. MTS still has a contingency reserve balance of 12.2% of the operating budget at its disposal.
Major Initiatives
MTS addressed the ridership decline in a number of different ways. In Fall 2016, MTS launched its Transit Optimization Plan (TOP) to evaluate MTS’ current network of services and ensure that it is efficient and effective for the region’s travel needs. MTS has now fully implemented all phases of its TOP. Among the goals of TOP was to create a network of services that would attract more riders to the system and reverse the decline in ridership and fare revenue MTS was experiencing. The TOP process included nearly 6,000 surveys, more than 50 outreach events across the region and a public hearing. Using rider input in conjunction with system performance data and ridership patterns, proposals were made for adjustments to over 60% of MTS’ bus services. On the 11 routes with increased frequency, ridership increased by 5.5% in calendar year 2018, compared to a 2.7% drop for the non-TOP adjusted routes.
In another effort to spur ridership, MTS held Free Ride Day on Tuesday, October 2, 2018. MTS recorded almost 53,000 more rides than the same Tuesday one year before, a huge 17% increase. Every region in the MTS territory experienced substantial gains. Significantly, the Sycuan Green Line Trolley, which skirts the doorstep to thousands of middle income condo and rental units, saw a 37% jump in ridership. The media coverage for Free Ride Day also generated 3.5 million impressions.

iv
As part of this ridership review and ease of use of the system, MTS had undertaken an initiative upgrading the region’s current fare collection system. After more than two years of work by MTS staff, in December 2018, the MTS Board approved staff’s recommendation to hire Innovations in Transportation, Inc. (INIT) to develop and implement a new fare collection system. Part of the criteria was to select a proven system that is operational at another transit agency. INIT has implemented the highly successful HOP system for TriMet in Portland, Oregon. This is a tremendous step toward implementing a new fare system that keeps pace with technologies the riders’ desire, such as guaranteed best fare based on the number of trips, real-time account management and much more. The goal is to have this new fare collection system implemented in 2021.
The UCSD student association recently extended the student transportation fee that provides a Regional Transit Pass (U-Pass) for all undergraduate, graduate and professional students who pay this fee. The U-Pass gives unlimited ridership during the fall, winter and spring quarters on all mass transit bus and light rail routes in the San Diego region provided by MTS and North County Transit District (NCTD), excluding the MTS rural and premium express routes. Due to buy-in from all students, MTS is able to keep the Triton U-Pass fare significantly lower than its typical fare structure. With U-Pass, UCSD students enjoy unlimited transit for less than 20% of the standard monthly pass cost. This extension is set to begin July 1, 2019 and run for six years, with total estimated revenue for the six years exceeding $33 million.
MTS also has a couple major service enhancements under way. Construction on the majority of the South Bay Rapid project, the full 26-mile route between the Otay Mesa Transit Center and downtown San Diego, is nearing completion. This includes five new Rapid stations on a dedicated bus-only lane along East Palomar Street and a transit guideway over the SR-125. The final segment is still under construction along East Palomar Street between Interstate 805 and Heritage Road and is expected to be complete in summer 2019. The new route went into full service on Sunday, January 27, 2019, operating from 5 a.m. to 11 p.m. daily with service every 15 minutes during peak commuting hours (6-9 a.m. and 3-6 p.m.), and every 30 minutes during the rest of the day and on weekends. This TransNet funded route is part of the region’s continuing effort to connect suburban commuters with major employment and entertainment centers. The 11-mile extension of the UC San Diego Blue Line, named the Mid-Coast Corridor Transit Project (Mid-Coast) is also currently under construction from the Old Town Transit Center to the University City community. It will feature nine new stations, serving major activity centers such as the Veterans Administration Medical Center, UCSD, and Westfield UTC. The project is funded by SANDAG and the Federal Transit Administration (FTA) New Starts Program. Mid-Coast is anticipated to begin service in November 2021.
Over the last decade, MTS has made funding the Capital Improvement Plan (CIP) a priority to bring the system up to a state of good repair, with over $900 million of funding spent on Capital. MTS and SANDAG completed the rehabilitation of the UC San Diego Blue Line and also replaced both the East County and South Bay Bus facilities. The bus fleet replacement plan has been adjusted to keep the number of buses replaced to a manageable figure each year. The U2 light rail vehicle (LRV) fleet has been replaced and in June the MTS Board approved a contract with Siemens to purchase up to 47 new, low-floor Trolley cars to replace the 2000 vehicle series (SD100 fleet) which are now nearing 25-years old. This will be the final step for MTS to become 100% low-floor across the entire Trolley fleet. MTS has committed $121 million for CIP in FY20, funding 51 projects focused on fleet replacement, maintaining a state of good repair, and a number of rehabilitation projects along the Orange Line.
MTS recently updated its joint Transit Oriented Development (TOD) program to more aggressively cultivate other partnerships to redevelop its top-tier park and ride locations into TODs. Program changes include prioritizing density, setting aside 20% of units for qualified low-income families, and identifying partners through a competitive bidding process. Going forward, MTS plans to be more aggressive in seeking development at Trolley stations and other owned properties. MTS sees the potential to transform the area at 12th & Imperial into a much more efficient transit center with a residential tower and low-rise offices adjacent to it. There is also a major project moving forward at the Grantville Station that would combine market rate student oriented housing and affordable housing. In addition, MTS has received a proposal for Palm Avenue and are actively working in a partnership with the City of Chula Vista to identify a developer for property at E Street. Other properties MTS is actively looking for redevelopment partners include the El Cajon Transit Center and the H Street Transit Center. These projects will not only help ensure the region’s need for affordable housing, but provide MTS with new riders.
v
For the fourth consecutive cycle, MTS received a perfect score from the FTA’s Triennial Review of the agency. That means for the last 12 years the FTA has found zero deficiencies in MTS's financial management of FTA funds’ management, technical capacity, program management, legal capacity, or any other areas governed by FTA. The purpose of the FTA’s Triennial Review is to ensure compliance with regulations and also provide a forward-looking assessment of each agency’s risk in the management and implementation of FTA grant programs. Mandated by Congress in 1982, the Triennial Review examines how recipients of Urbanized Area Formula Program funds meet statutory and administrative requirements. These formula funds represent approximately 36% of all grant funds awarded by FTA each year.
In 2017, Assembly Bill (AB) 805 was passed, giving MTS the ability to place a half-cent sales tax on the ballot for transit-only improvements within its service territory. In 2018, an Ad Hoc committee of MTS Board members was formed to guide the development of a project list for a potential ballot measure. To do so, it created Elevate San Diego 2020, an unprecedented public participation campaign to gauge public opinion on transit improvements that can help define the future of mobility in the region. Over the next six months, MTS will convene industry-sector focus groups, a Community Advisory Committee made up of civic-minded, neighborhood-based organizations and dozens of meetings in communities and transit stations to gain more insights about how transit can help address housing, traffic congestion, carbon emissions reduction and more. The input received from this public participation effort will be analyzed. A proposed expenditure and financing plan will then be developed and announced tentatively by the end of the year. AWARDS AND ACKNOWLEDGMENTS
The Government Finance Officers Association of the United States and Canada (GFOA) awarded a Certificate of Achievement for Excellence in Financial Reporting to MTS for its Comprehensive Annual Financial Report (CAFR) for the fiscal year ended June 30, 2018. This was the thirteenth consecutive year and the twenty-third year overall that MTS has achieved this prestigious award. To be awarded a Certificate of Achievement, MTS must publish an easily readable and efficiently organized Comprehensive Annual Financial Report. This report must satisfy both generally accepted accounting principles and applicable legal requirements.
The Certificate of Achievement is valid for a period of one year only. We believe that our current CAFR continues to meet the Certificate of Achievement Program's requirements and we are submitting it to the GFOA to determine its eligibility for another certificate. Acknowledgments The staff of the finance department is to be commended for their efficient and dedicated service to the production of this report. In addition, we express our appreciation for the assistance and cooperation provided by management and staff in all departments throughout the organization.
Paul Jablonski Larry Marinesi Chief Executive Officer Chief Financial Officer October 29, 2019

vi
This page intentionally left blank.
San Diego Metropolitan Transit System
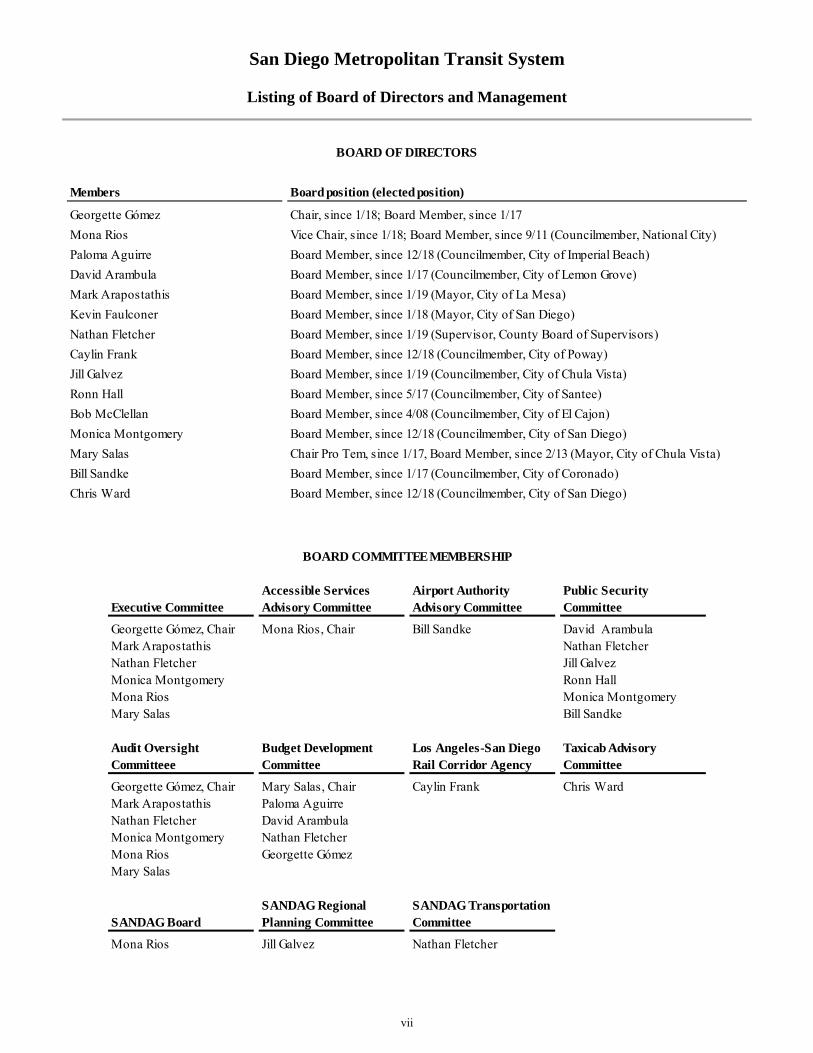
Listing of Board of Directors and Management
vii
Members Board position (elected position)
Georgette Gómez Chair, since 1/18; Board Member, since 1/17
Mona Rios Vice Chair, since 1/18; Board Member, since 9/11 (Councilmember, National City)
Paloma Aguirre Board Member, since 12/18 (Councilmember, City of Imperial Beach)
David Arambula Board Member, since 1/17 (Councilmember, City of Lemon Grove)
Mark Arapostathis Board Member, since 1/19 (Mayor, City of La Mesa)
Kevin Faulconer Board Member, since 1/18 (Mayor, City of San Diego)
Nathan Fletcher Board Member, since 1/19 (Supervisor, County Board of Supervisors)
Caylin Frank Board Member, since 12/18 (Councilmember, City of Poway)
Jill Galvez Board Member, since 1/19 (Councilmember, City of Chula Vista)
Ronn Hall Board Member, since 5/17 (Councilmember, City of Santee)
Bob McClellan Board Member, since 4/08 (Councilmember, City of El Cajon)
Monica Montgomery Board Member, since 12/18 (Councilmember, City of San Diego)
Mary Salas Chair Pro Tem, since 1/17, Board Member, since 2/13 (Mayor, City of Chula Vista)
Bill Sandke Board Member, since 1/17 (Councilmember, City of Coronado)
Chris Ward Board Member, since 12/18 (Councilmember, City of San Diego)
BOARD OF DIRECTORS
Accessible Services Airport Authority Public SecurityExecutive Committee Advisory Committee Advisory Committee Committee
Georgette Gómez, Chair Mona Rios, Chair Bill Sandke David ArambulaMark Arapostathis Nathan FletcherNathan Fletcher Jill GalvezMonica Montgomery Ronn HallMona Rios Monica MontgomeryMary Salas Bill Sandke
Audit Oversight Budget Development Los Angeles-San Diego Taxicab AdvisoryCommitteee Committee Rail Corridor Agency Committee
Georgette Gómez, Chair Mary Salas, Chair Caylin Frank Chris WardMark Arapostathis Paloma AguirreNathan Fletcher David ArambulaMonica Montgomery Nathan FletcherMona Rios Georgette GómezMary Salas
SANDAG Regional SANDAG TransportationSANDAG Board Planning Committee Committee
Mona Rios Jill Galvez Nathan Fletcher
BOARD COMMITTEE MEMBERSHIP
San Diego Metropolitan Transit System
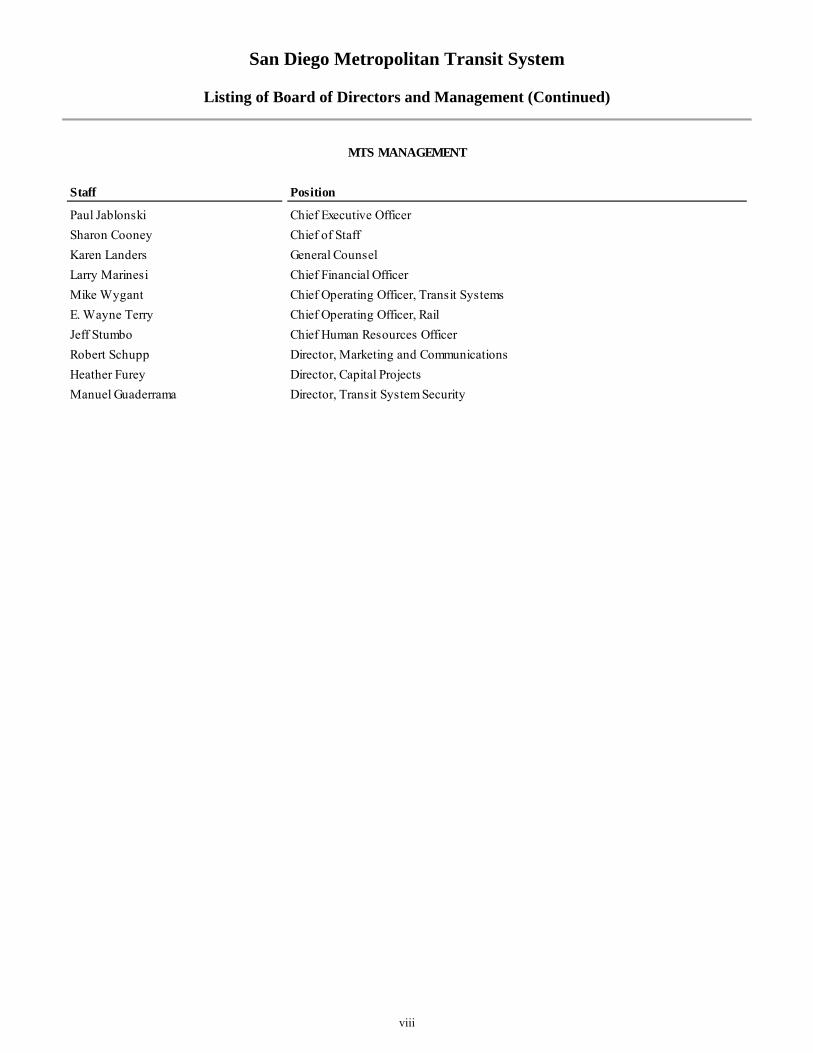
Listing of Board of Directors and Management (Continued)
viii
Staff Position
Paul Jablonski Chief Executive Officer
Sharon Cooney Chief of Staff
Karen Landers General Counsel
Larry Marinesi Chief Financial Officer
Mike Wygant Chief Operating Officer, Transit Systems
E. Wayne Terry Chief Operating Officer, Rail
Jeff Stumbo Chief Human Resources Officer
Robert Schupp Director, Marketing and Communications
Heather Furey Director, Capital Projects
Manuel Guaderrama Director, Transit System Security
MTS MANAGEMENT

San Diego Metropolitan Transit System
Executive Level Organization Chart
ix
San Diego Metropolitan Transit System
Certificate of Achievement for Excellence in Financial Reporting – GFOA
x

FINANCIAL SECTION

This page intentionally left blank.

To the Board of Directors
San Diego Metropolitan Transit System San Diego, California Report on Financial Statements We have audited the accompanying basic financial statements of the San Diego Metropolitan Transit System (MTS), which comprise the statements of net position as of June 30, 2019 and 2018, and the related statements of revenues, expenses and changes in net position, and cash flows for the years then ended, and the related notes to the financial statements. Management’s Responsibility for the Financial Statements Management is responsible for the preparation and fair presentation of these financial statements in accordance with accounting principles generally accepted in the United States of America; this includes the design, implementation, and maintenance of internal control relevant to the preparation and fair presentation of financial statements that are free from material misstatement, whether due to fraud or error. Auditor’s Responsibility Our responsibility is to express an opinion on these financial statements based on our audits. We conducted our audits in accordance with auditing standards generally accepted in the United States of America, and the standards applicable to financial audits contained in Government Auditing Standards, issued by the Comptroller General of the United States. Those standards require that we plan and perform the audit to obtain reasonable assurance about whether the financial statements are free from material misstatement. An audit involves performing procedures to obtain audit evidence about the amounts and disclosures in the financial statements. The procedures selected depend on the auditor’s judgment, including the assessment of the risks of material misstatement of the financial statements, whether due to fraud or error. In making those risk assessments, the auditor considers internal control relevant to the entity’s preparation and fair presentation of the financial statements in order to design audit procedures that are appropriate in the circumstances, but not for the purpose of expressing an opinion on the effectiveness of the entity’s internal control. Accordingly, we express no such opinion. An audit also includes evaluating the appropriateness of accounting policies used and the reasonableness of significant accounting estimates made by management, as well as evaluating the overall presentation of the financial statements. We believe that the audit evidence we have obtained is sufficient and appropriate to provide a basis for our audit opinion. Opinion In our opinion, the financial statements referred to above present fairly, in all material respects, the respective financial position of MTS, as of June 30, 2019 and 2018, and the respective changes in financial position, and cash flows for the years then ended in accordance with accounting principles generally accepted in the United States of America.
4365 Executive Drive, Suite 710, San Diego, California 92121 Tel: 858-242-5100 • Fax: 858-242-5150
www.pungroup.com
3939352 Pun & McGeady_L_final.pdf 2 1/14/14 3:48 PM
1

To the Board of Directors San Diego Metropolitan Transit System
San Diego, California Page 2
Other Matters
Required Supplementary Information
Accounting principles generally accepted in the United States of America require that the Management’s Discussion and Analysis, Schedules of Proportionate Share of the Net Pension Liability and Related Ratio, Schedules of Changes in Net Pension Liability and Related Ratios, Schedules of Contributions – Pension Plans, and Schedules of Changes in Total OPEB Liability and Related Ratios be presented to supplement the basic financial statements. Such information, although not a part of the basic financial statements, is required by the Governmental Accounting Standards Board, who considers it to be an essential part of financial reporting for placing the basic financial statements in an appropriate operational, economic, or historical context. We have applied certain limited procedures to the required supplementary information in accordance with auditing standards generally accepted in the United States of America, which consisted of inquiries of management about the methods of preparing the information and comparing the information for consistency with management’s responses to our inquiries, the basic financial statements, and other knowledge we obtained during our audit of the basic financial statements. We do not express an opinion or provide any assurance on the information because the limited procedures do not provide us with sufficient evidence to express an opinion or provide any assurance.
Other Information
Our audit was conducted for the purpose of forming opinions on the financial statements that collectively comprise MTS’s basic financial statements. The introductory section, combining and individual fund financial statements, and statistical section are presented for purposes of additional analysis and are not a required part of the basic financial statements.
The combining and individual fund financial statements are the responsibility of management and were derived from and relate directly to the underlying accounting and other records used to prepare the basic financial statements. Such information has been subjected to the auditing procedures applied in the audit of the basic financial statements and certain additional procedures, including comparing and reconciling such information directly to the underlying accounting and other records used to prepare the basic financial statements or to the basic financial statements themselves, and other additional procedures in accordance with auditing standards generally accepted in the United States of America. In our opinion, the combining and individual fund financial statements are fairly stated, in all material respects, in relation to the basic financial statements as a whole.
The introductory and statistical sections have not been subjected to the auditing procedures applied in the audit of the basic financial statements and, accordingly, we do not express an opinion or provide any assurance on them.
Other Reporting Required by Government Auditing Standards
In accordance with Government Auditing Standards, we have also issued our report dated October 29, 2019, on our consideration of MTS’s internal control over financial reporting and on our tests of its compliance with certain provisions of laws, regulations, contracts, and grant agreements and other matters. The purpose of that report is to describe the scope of our testing of internal control over financial reporting and compliance and the results of that testing, and not to provide an opinion on internal control over financial reporting or on compliance. That report is an integral part of an audit performed in accordance with Government Auditing Standards in considering MTS’s internal control over financial reporting and compliance.
San Diego, California October 29, 2019
2

San Diego Metropolitan Transit System Management's Discussion and Analysis (Unaudited)
June 30, 2019 and 2018
The following discussion and analysis of the financial performance of the San Diego Metropolitan Transit System (MTS) is intended to provide an overview of MTS’s financial activities for the fiscal years ended June 30, 2019 and 2018. This information should be used in conjunction with the Letter of Transmittal, which can be found on pages i through iv of this report. Financial Highlights Net position, as reported in the statement of net position, totaled $1,770 million as of June 30, 2019, $1,735
million as of June 30, 2018 and $1,724 million as of June 30, 2017. Of this amount, $(53) million was the unrestricted deficit as of June 30, 2019, $(55) million was the unrestricted deficit as of June 30, 2018 and $(20) million was the unrestricted deficit as of June 30, 2017. Total net position increased by $35 million in the current year and increased by $11 million in the prior year. The current year increase is primarily due to a $36 million increase in capital assets.
For the year ended June 30, 2019, the combined farebox recovery ratio (the measure of the ability to recover operating costs through fare revenue) for San Diego Trolley, Inc., San Diego Transit Corporation, and MTS - Contracted Services was 34.21% compared to 33.33% for the year ended June 20, 2018 and 36.14% for the year ended June 30, 2017. The current year increase is primarily due to an increase in passenger revenue and decrease in risk management costs, partially offset by an increase in outside services and energy.
Overview of the Financial Statements This discussion and analysis is intended to serve as an introduction to MTS’s financial statements. The financial statements are comprised of two components: 1) financial statements and, 2) notes to financial statements. This report also contains other supplementary information in addition to the financial statements themselves. Financial statements. The financial statements are designed to provide readers with a broad overview of MTS’s finances, in a manner similar to a private-sector business. The statement of net position presents information on all of MTS’s assets, deferred outflow of resources, liabilities, and deferred inflow of resources with the difference between the four reported as net position. Over time, increases or decreases in net position may serve as a useful indicator of whether the financial position of MTS is improving or deteriorating. The statement of revenues, expenses and changes in net position presents information showing how net position changed during the most recent fiscal year. All changes in net position are reported as soon as the underlying event giving rise to the change occurs, regardless of the timing of related cash flows. Thus, revenues and expenses are reported in this statement for some items that will only result in cash flows in future fiscal periods (e.g., earned but unused vacation leave). The statement of cash flows presents information showing the sources and uses of cash related to operating activities, noncapital financing activities, capital and related financing activities and investing activities. In addition, the statement provides information about significant non-cash investing, capital and financing activities. Since MTS’s primary function is to provide transportation services to the region’s citizens and recover costs through user fees and charges, the financial statements include business-type activities. In addition, the financial statements include not only MTS itself (known as the primary government), but also two legally separate transit operators and one legally separate freight railway, for which MTS is financially accountable: San Diego and Arizona Eastern Railway Company (SD&AE).
3

San Diego Metropolitan Transit System Management's Discussion and Analysis (Unaudited)(Continued)
June 30, 2019 and 2018
Notes to basic financial statements. The notes provide additional information that is essential to a full understanding of the data provided in the financial statements. Other information. In addition to the financial statements and accompanying notes, this report also presents certain required supplementary information concerning MTS’s net pension liability and net other post-employment benefits liability for its employees. Financial Analysis As noted earlier, net position may serve over time as a useful indicator of an entity’s financial stability. In the case of MTS, net position was $1,770 million at the close of the most recent fiscal year and $1,735 million at the end of FY2018. The largest portion of MTS’s net position reflects the investment in capital assets, net of accumulated depreciation and reduced by any outstanding bonds or other borrowings and deferred inflows and outflows of resources (Net Investment in Capital Asset). Most of the investment in capital assets is comprised of trolley system assets, buses, and construction-in-progress totaling $42 million, of which the largest projects are the Courthouse trolley station and the Transit Asset Management project, at $12.8 and $9.7 million respectively. Prior year construction-in-progress totaled $53 million, of which the largest projects were the procurement of new Siemens SD8 Light Rail Vehicles (LRVs) and the Courthouse trolley station, at $12.8 and $12.4 million respectively. The capital assets that are represented by construction-in-progress will be used to provide services to citizens; consequently, these assets are not available for future spending. In FY2019, MTS transferred completed projects worth $60.2 million to SDTC, SDTI and MTS - Contracted Services compared to $51.2 million in FY2018. The balance in the unrestricted component of net position increased by $2.2 million during the current year and decreased by $35.8 million in the prior year. Total assets increased by $79 million primarily due to capital assets increasing by $36 million and cash increasing by $19 million. In FY2018, total assets increased by $49 million. In the current fiscal year, total liabilities increased by $29 million primarily due to an increase in unearned revenue of $23 million and an increase in accounts payable of $11 million. In the previous year, total liabilities increased by $26 million.
2019 2018 Change 2017 Change
Current and other assets 258,548,635$ 215,737,517$ 42,811,118$ 212,694,682$ 3,042,835$ Capital assets 1,823,323,569 1,787,009,020 36,314,549 1,741,107,404 45,901,616
Total assets 2,081,872,204 2,002,746,537 79,125,667 1,953,802,086 48,944,451
Deferred outflows of resources 39,436,807 54,287,513 (14,850,706) 70,889,473 (16,601,960)
Current and other liabilities 91,121,531 57,240,387 33,881,144 58,940,833 (1,700,446) Long-term liabilities outstanding 251,475,903 256,544,202 (5,068,299) 228,646,665 27,897,537
Total liabilities 342,597,434 313,784,589 28,812,845 287,587,498 26,197,091
Deferred inflows of resources 8,736,010 8,303,149 432,861 12,919,118 (4,615,969)
Net position:Net investment in capital assets 1,822,922,233 1,785,807,650 37,114,583 1,739,359,691 46,447,959 Restricted 212,422 4,545,522 (4,333,100) 4,440,262 105,260 Unrestricted (deficit) (53,159,088) (55,406,860) 2,247,772 (19,615,010) (35,791,850)
Total net position 1,769,975,567$ 1,734,946,312$ 35,029,255$ 1,724,184,943$ 10,761,369$
4
San Diego Metropolitan Transit System Management's Discussion and Analysis (Unaudited)(Continued)
June 30, 2019 and 2018
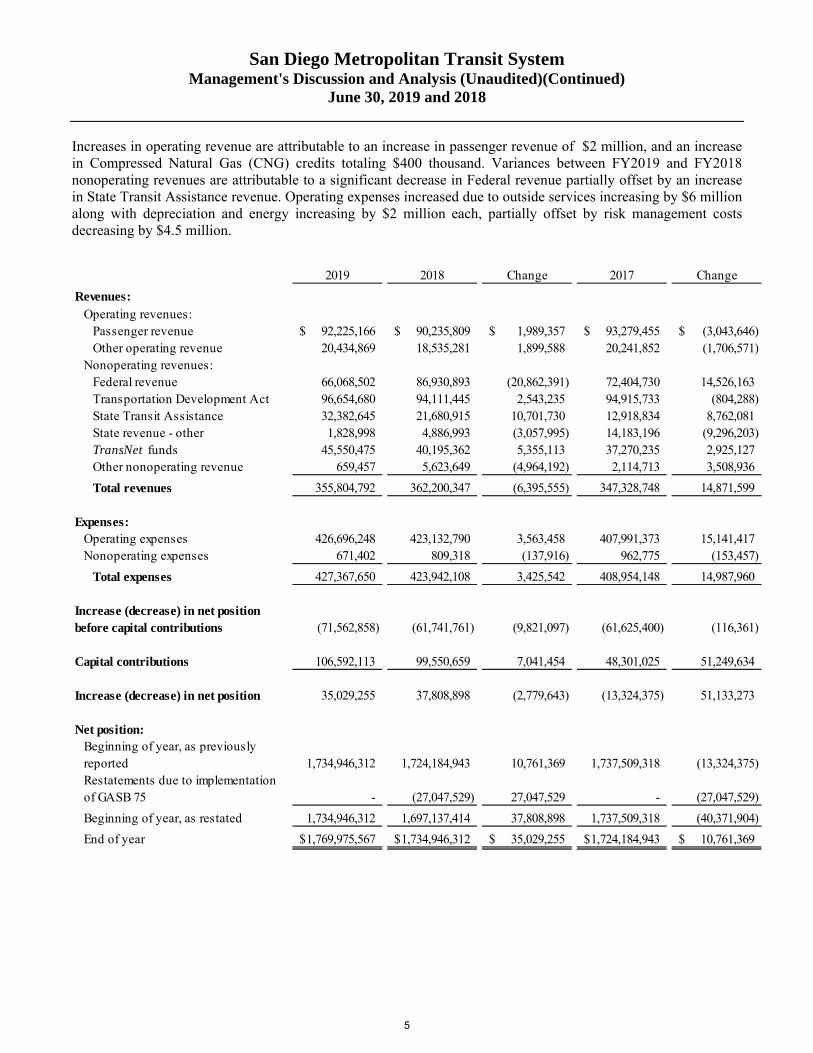
Increases in operating revenue are attributable to an increase in passenger revenue of $2 million, and an increase in Compressed Natural Gas (CNG) credits totaling $400 thousand. Variances between FY2019 and FY2018 nonoperating revenues are attributable to a significant decrease in Federal revenue partially offset by an increase in State Transit Assistance revenue. Operating expenses increased due to outside services increasing by $6 million along with depreciation and energy increasing by $2 million each, partially offset by risk management costs decreasing by $4.5 million.
2019 2018 Change 2017 Change
Revenues:Operating revenues:
Passenger revenue 92,225,166$ 90,235,809$ 1,989,357$ 93,279,455$ (3,043,646)$ Other operating revenue 20,434,869 18,535,281 1,899,588 20,241,852 (1,706,571)
Nonoperating revenues:Federal revenue 66,068,502 86,930,893 (20,862,391) 72,404,730 14,526,163 Transportation Development Act 96,654,680 94,111,445 2,543,235 94,915,733 (804,288) State Transit Assistance 32,382,645 21,680,915 10,701,730 12,918,834 8,762,081 State revenue - other 1,828,998 4,886,993 (3,057,995) 14,183,196 (9,296,203) TransNet funds 45,550,475 40,195,362 5,355,113 37,270,235 2,925,127 Other nonoperating revenue 659,457 5,623,649 (4,964,192) 2,114,713 3,508,936
Total revenues 355,804,792 362,200,347 (6,395,555) 347,328,748 14,871,599
Expenses:Operating expenses 426,696,248 423,132,790 3,563,458 407,991,373 15,141,417 Nonoperating expenses 671,402 809,318 (137,916) 962,775 (153,457)
Total expenses 427,367,650 423,942,108 3,425,542 408,954,148 14,987,960
Increase (decrease) in net position before capital contributions (71,562,858) (61,741,761) (9,821,097) (61,625,400) (116,361)
Capital contributions 106,592,113 99,550,659 7,041,454 48,301,025 51,249,634
Increase (decrease) in net position 35,029,255 37,808,898 (2,779,643) (13,324,375) 51,133,273
Net position:Beginning of year, as previously reported 1,734,946,312 1,724,184,943 10,761,369 1,737,509,318 (13,324,375) Restatements due to implementation of GASB 75 - (27,047,529) 27,047,529 - (27,047,529)
Beginning of year, as restated 1,734,946,312 1,697,137,414 37,808,898 1,737,509,318 (40,371,904)
End of year 1,769,975,567$ 1,734,946,312$ 35,029,255$ 1,724,184,943$ 10,761,369$
5

San Diego Metropolitan Transit System Management's Discussion and Analysis (Unaudited)(Continued)
June 30, 2019 and 2018
Capital Asset and Debt Administration Capital assets. MTS’s investment in capital assets net of accumulated depreciation as of June 30, 2019 and 2018 amounted to $1,823 million and $1,787 million, respectively. This investment in capital assets includes land, buildings, vehicles, equipment, and construction-in-progress. Major capital asset events during the current fiscal year included the following:
MTS continues to modernize the revenue vehicle fleet. In FY2019, 11 light rail vehicles (LRVs) were capitalized for a total cost of $44 million, two of those vehicles were contributed by SANDAG. MTS also placed 35 new buses into service totaling $6.9 million.
MTS completed the direct current (DC) circuit breaker project which replaced rectifiers and DC circuit breakers at twelve Traction Power Substations along the Green Line at a total cost of $6 million.
Completed capital projects and inventory parts totaling $107 million were transferred from SANDAG to MTS and its component units during FY2019, the largest being the South Bay BRT expansion which included guideway, a transit center, seven stations, shelters and technology.
2019 2018 2017
Land $ 256,922,883 $ 256,922,883 $ 256,922,883 Buildings 1,041,617,309 996,361,733 968,444,183 Vehicles 437,802,630 432,560,716 426,479,686 Equipment & other 45,059,343 48,553,881 53,087,922 Construction-in-progress 41,921,404 52,609,807 36,172,730
Total $ 1,823,323,569 $ 1,787,009,020 $ 1,741,107,404
CAPITAL ASSETS(Net of Accumulated Depreciation)
Additional information on MTS’s capital assets can be found in Note 5 to the financial statements. Long-term debt. At the end of the current fiscal year, MTS has one capital lease obligation outstanding in the amount of $363,000. In addition, MTS has one finance obligation outstanding relating to Pension Obligation Bonds issued in fiscal year 2005 for a total obligation of $12.9 million. Additional information about MTS's long-term debt can be found in Note 8 to the financial statements. Bond Ratings Standard & Poor's Ratings Services provided an underlying rating for the Pension Obligation Bonds at "AA-" with a stable outlook in 2019, the same rating that was received in 2018. Additional information on MTS’s long-term debt can be found in Note 8 to the financial statements. Requests for Information This financial report is designed to provide a general overview of MTS’s finances for all those with an interest in the government’s finances. If you have questions concerning any of the information provided in this report or need additional financial information, visit our website at www.sdmts.com or direct inquiries to the Controller, MTS, 1255 Imperial Avenue, Suite 1000, San Diego, CA 92101.
6

This page intentionally left blank.
7
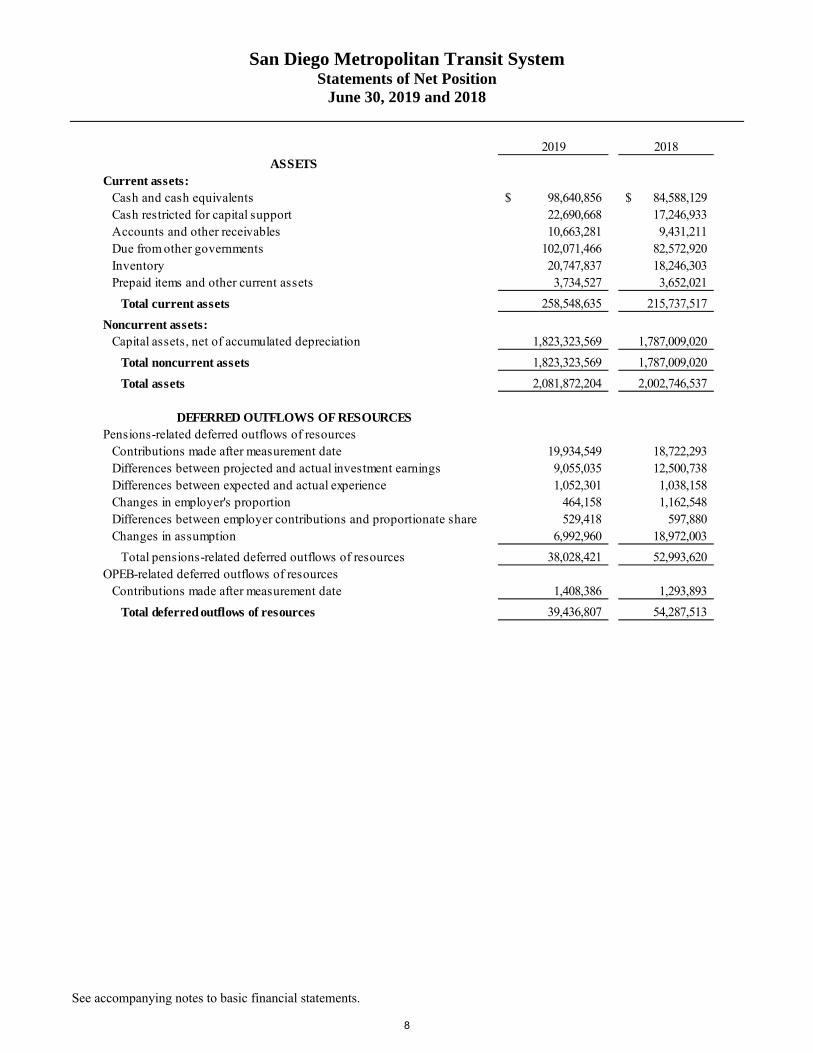
San Diego Metropolitan Transit System Statements of Net Position
June 30, 2019 and 2018
See accompanying notes to basic financial statements.
2019 2018ASSETS
Current assets:Cash and cash equivalents 98,640,856$ 84,588,129$ Cash restricted for capital support 22,690,668 17,246,933 Accounts and other receivables 10,663,281 9,431,211 Due from other governments 102,071,466 82,572,920 Inventory 20,747,837 18,246,303 Prepaid items and other current assets 3,734,527 3,652,021
Total current assets 258,548,635 215,737,517
Noncurrent assets:Capital assets, net of accumulated depreciation 1,823,323,569 1,787,009,020
Total noncurrent assets 1,823,323,569 1,787,009,020
Total assets 2,081,872,204 2,002,746,537
DEFERRED OUTFLOWS OF RESOURCESPensions-related deferred outflows of resources
Contributions made after measurement date 19,934,549 18,722,293 Differences between projected and actual investment earnings 9,055,035 12,500,738 Differences between expected and actual experience 1,052,301 1,038,158 Changes in employer's proportion 464,158 1,162,548 Differences between employer contributions and proportionate share 529,418 597,880 Changes in assumption 6,992,960 18,972,003
Total pensions-related deferred outflows of resources 38,028,421 52,993,620 OPEB-related deferred outflows of resources
Contributions made after measurement date 1,408,386 1,293,893
Total deferred outflows of resources 39,436,807 54,287,513
8

San Diego Metropolitan Transit System Statements of Net Position (Continued)
June 30, 2019 and 2018
See accompanying notes to basic financial statements.
2019 2018LIABILITIES
Current liabilities:Accounts payable 29,425,726 18,584,841 Due to other governments 6,908,807 8,574,860 Unearned revenue 32,259,264 9,419,707 Accrued expenses 3,114,362 2,990,766 Retentions payable 5,446,937 3,090,699 Due within one year:
Compensated absences 6,049,951 6,179,497 Accrued damage, injury, and employee claims 4,998,412 5,261,820 Long-term debt, current portion 2,918,072 3,138,197
Total current liabilities 91,121,531 57,240,387
Noncurrent liabilities:Due in more than one year:
Compensated absences 4,808,050 4,574,257 Accrued damage, injury, and employee claims 10,838,239 12,028,332 Long-term debt 10,355,000 13,273,072 Aggregate net pension liability 178,363,411 181,271,712 Aggregate total OPEB liability 47,111,203 45,396,829
Total noncurrent liabilities 251,475,903 256,544,202
Total liabilities 342,597,434 313,784,589
DEFERRED INFLOWS OF RESOURCESDeferred gain on debt refunding related to capital assets 38,264 130,101 Pensions-related deferred inflows of resources
Differences between expected and actual experience 2,939,943 3,480,013 Changes in employer's proportion 246,648 166,559 Changes in assumptions 2,119,531 1,167,117
Total pensions-related deferred inflows of resources 5,306,122 4,813,689 OPEB-related deferred inflows of resources
Changes in assumptions 3,391,624 3,359,359
Total deferred inflows of resources 8,736,010 8,303,149
NET POSITIONNet investment in capital assets 1,822,922,233 1,785,807,650 Restricted for capital assets 212,422 4,545,522 Unrestricted (deficit) (53,159,088) (55,406,860)
Total net position 1,769,975,567$ 1,734,946,312$
9

This page intentionally left blank.
10
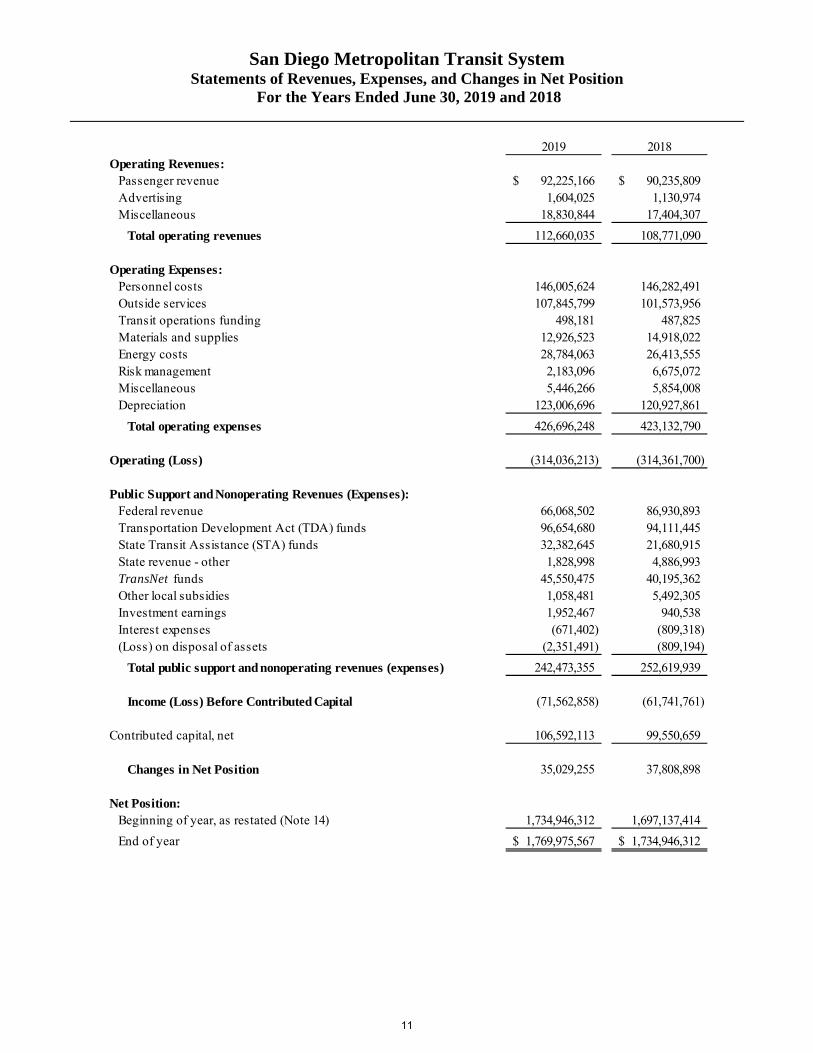
San Diego Metropolitan Transit System Statements of Revenues, Expenses, and Changes in Net Position
For the Years Ended June 30, 2019 and 2018
2019 2018Operating Revenues:
Passenger revenue 92,225,166$ 90,235,809$ Advertising 1,604,025 1,130,974 Miscellaneous 18,830,844 17,404,307
Total operating revenues 112,660,035 108,771,090
Operating Expenses:Personnel costs 146,005,624 146,282,491 Outside services 107,845,799 101,573,956 Transit operations funding 498,181 487,825 Materials and supplies 12,926,523 14,918,022 Energy costs 28,784,063 26,413,555 Risk management 2,183,096 6,675,072 Miscellaneous 5,446,266 5,854,008 Depreciation 123,006,696 120,927,861
Total operating expenses 426,696,248 423,132,790
Operating (Loss) (314,036,213) (314,361,700)
Public Support and Nonoperating Revenues (Expenses):Federal revenue 66,068,502 86,930,893 Transportation Development Act (TDA) funds 96,654,680 94,111,445 State Transit Assistance (STA) funds 32,382,645 21,680,915 State revenue - other 1,828,998 4,886,993 TransNet funds 45,550,475 40,195,362 Other local subsidies 1,058,481 5,492,305 Investment earnings 1,952,467 940,538 Interest expenses (671,402) (809,318) (Loss) on disposal of assets (2,351,491) (809,194)
Total public support and nonoperating revenues (expenses) 242,473,355 252,619,939
Income (Loss) Before Contributed Capital (71,562,858) (61,741,761)
Contributed capital, net 106,592,113 99,550,659
Changes in Net Position 35,029,255 37,808,898
Net Position:Beginning of year, as restated (Note 14) 1,734,946,312 1,697,137,414
End of year 1,769,975,567$ 1,734,946,312$
11

San Diego Metropolitan Transit System Statements of Cash Flows
For the Years Ended June 30, 2019 and 2018
2019 2018Cash Flows From Operating Activites:
Receipts from customers and users 113,620,347$ 107,429,785$ Payments to suppliers (153,840,907) (151,152,671) Payments to employees (132,594,038) (131,934,361) Payments for damage and injury (1,478,061) (1,541,026)
Net cash (used in) operating activities (174,292,659) (177,198,273)
Cash Flows From Noncapital Financing Activities:Public support funds received 252,016,258 251,301,566
Net cash provided by noncapital financing activities 252,016,258 251,301,566
Cash Flows From Capital and Related Financing Activities:Debt service costs (3,865,578) (3,825,507) Property acquisition (55,892,229) (67,493,671) Proceeds from disposal of assets 122,231 998,974
Net cash (used in) capital and related financing activities (59,635,576) (70,320,204)
Cash Flows From Investing Activites:Interest received on investments 1,408,439 965,283
Net cash provided by investing activities 1,408,439 965,283
Net increase in cash and cash equivalents 19,496,462 4,748,372
Cash and Cash Equivalents:Beginning of year 101,835,062 97,086,690
End of year 121,331,524$ 101,835,062$
Reconciliation of Cash and Cash Equivalents to Statement of Net Position:Cash and cash equivalents 98,640,856$ 84,588,129$ Cash restricted for capital support 22,690,668 17,246,933
Total cash and cash equivalents 121,331,524$ 101,835,062$
12

San Diego Metropolitan Transit System Statements of Cash Flows (Continued)
For the Years Ended June 30, 2019 and 2018
2019 2018Reconciliation of Operating (Loss) to Net Cash (Used In) Operating Activities:
Operating (loss) (314,036,213)$ (314,361,700)$ Adjustments to reconcile operating (loss) to net cash (used in)
operating activities: Depreciation 123,006,696 120,927,861 (Increase) decrease in:
Accounts and other receivables (1,232,070) 420,923 Due from other governments 799,454 (1,762,228) Inventory (2,501,534) 1,688,973 Prepaid items and other current assets (82,506) (864,219)
Increase (decrease) in: Accounts payable 3,960,874 (1,277,354) Due to other governments (487,022) 1,042,817 Accrued expenses 123,596 (29,847) Unearned revenue 1,482,067 3,083,287 Aggregate net pension liabiltiy 11,598,598 12,259,210 Aggregate total OPEB liabiltiy 1,517,653 3,292,972 Compensated absences 104,247 36,342 Accrued damage, injury and employee claims 1,453,501 (1,655,310)
Total adjustments 139,743,554 137,163,427
Net cash (used in) operating activities (174,292,659)$ (177,198,273)$
Noncash investing, capital, and financing activities:Contributions of capital assets and inventory parts from SANDAG 106,592,113$ 99,550,659$
Increase (decrease) in fair value of investments 59,251$ (33,508)$
13

This page intentionally left blank.
14

NOTES TO BASIC FINANCIAL STATEMENTS
15

San Diego Metropolitan Transit System Notes to Basic Financial Statements
For the Years Ended June 30, 2019 and 2018
Table of Contents Page
Note 1 – Summary of Significant Accounting Policies ..................................................................................... 18
A. Reporting Entity ....................................................................................................................................... 18 B. Financial Statements ................................................................................................................................. 19 C. Measurement Focus, Basis of Accounting, and Financial Statement Presentation .................................. 19 D. Use of Restricted/Unrestricted Assets ...................................................................................................... 21 E. Cash, Cash Equivalents, and Investments ................................................................................................ 21 F. Inventory .................................................................................................................................................. 22 G. Prepaid Items and Other Current Assets .................................................................................................. 22 H. Capital Assets ........................................................................................................................................... 22 I. Construction-in-Progress .......................................................................................................................... 23 J. Compensated Absences ............................................................................................................................ 23 K. Long-Term Obligations ............................................................................................................................ 23 L. Refunding of Debt .................................................................................................................................... 23 M. Pension ..................................................................................................................................................... 23 N. Other Postemployment Benefits ............................................................................................................... 24 O. Net Position .............................................................................................................................................. 24 P. Use of Estimates ....................................................................................................................................... 24 Q. Implementation of New GASB Pronouncements for the Year Ended June 30, 2019 .............................. 24 R. Upcoming Governmental Accounting Standards for the Year Ending June 30, 2020 ............................. 25
Note 2 – Cash, Cash Equivalents, and Investments .......................................................................................... 25 Note 3 – Accounts Receivable ............................................................................................................................. 28
A. Accounts and Other Receivables .............................................................................................................. 28 B. Due from Other Governments .................................................................................................................. 29
Note 4 – Inventory ............................................................................................................................................... 29 Note 5 – Capital Assets ........................................................................................................................................ 30 Note 6 – Due to Other Governments .................................................................................................................. 32 Note 7 – Unearned Revenue ................................................................................................................................ 32 Note 8 – Long-Term Debt ................................................................................................................................... 33
A. Summary .................................................................................................................................................. 33 B. Capital Lease ............................................................................................................................................ 35 C. Pension Obligation Bonds ........................................................................................................................ 35
Note 9 – Risk Management ................................................................................................................................. 36 Note 10 – Contingencies ...................................................................................................................................... 37
16
San Diego Metropolitan Transit System Notes to Basic Financial Statements (Continued)
For the Years Ended June 30, 2019 and 2018
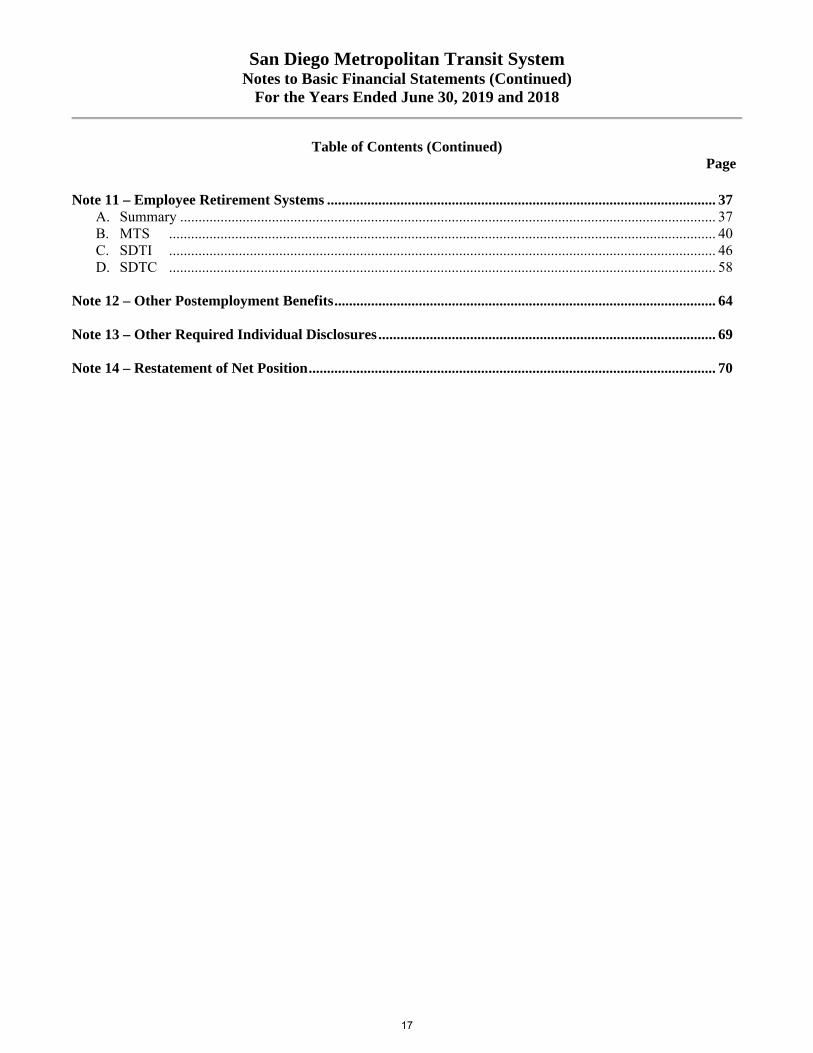
Table of Contents (Continued) Page
Note 11 – Employee Retirement Systems .......................................................................................................... 37
A. Summary .................................................................................................................................................. 37 B. MTS ..................................................................................................................................................... 40 C. SDTI ..................................................................................................................................................... 46 D. SDTC ..................................................................................................................................................... 58
Note 12 – Other Postemployment Benefits ........................................................................................................ 64 Note 13 – Other Required Individual Disclosures ............................................................................................ 69 Note 14 – Restatement of Net Position ............................................................................................................... 70
17
San Diego Metropolitan Transit System Notes to Basic Financial Statements (Continued)
For the Years Ended June 30, 2019 and 2018
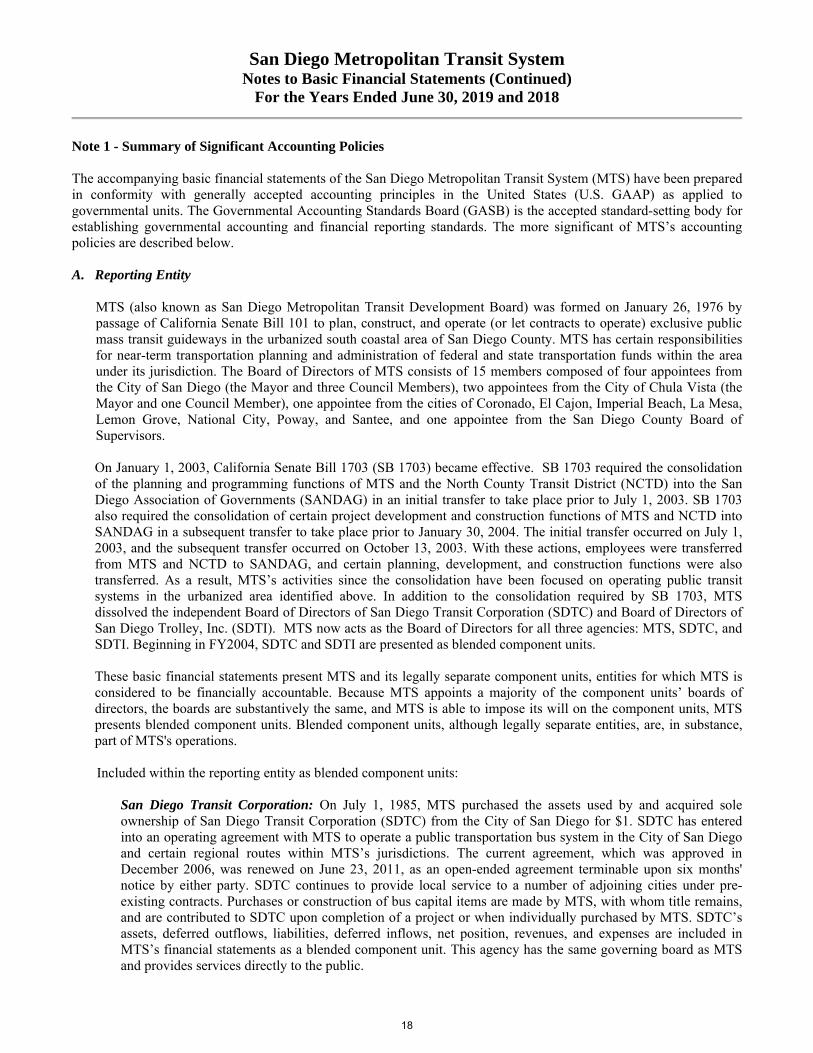
Note 1 - Summary of Significant Accounting Policies
The accompanying basic financial statements of the San Diego Metropolitan Transit System (MTS) have been prepared in conformity with generally accepted accounting principles in the United States (U.S. GAAP) as applied to governmental units. The Governmental Accounting Standards Board (GASB) is the accepted standard-setting body for establishing governmental accounting and financial reporting standards. The more significant of MTS’s accounting policies are described below. A. Reporting Entity
MTS (also known as San Diego Metropolitan Transit Development Board) was formed on January 26, 1976 by passage of California Senate Bill 101 to plan, construct, and operate (or let contracts to operate) exclusive public mass transit guideways in the urbanized south coastal area of San Diego County. MTS has certain responsibilities for near-term transportation planning and administration of federal and state transportation funds within the area under its jurisdiction. The Board of Directors of MTS consists of 15 members composed of four appointees from the City of San Diego (the Mayor and three Council Members), two appointees from the City of Chula Vista (the Mayor and one Council Member), one appointee from the cities of Coronado, El Cajon, Imperial Beach, La Mesa, Lemon Grove, National City, Poway, and Santee, and one appointee from the San Diego County Board of Supervisors.
On January 1, 2003, California Senate Bill 1703 (SB 1703) became effective. SB 1703 required the consolidation of the planning and programming functions of MTS and the North County Transit District (NCTD) into the San Diego Association of Governments (SANDAG) in an initial transfer to take place prior to July 1, 2003. SB 1703 also required the consolidation of certain project development and construction functions of MTS and NCTD into SANDAG in a subsequent transfer to take place prior to January 30, 2004. The initial transfer occurred on July 1, 2003, and the subsequent transfer occurred on October 13, 2003. With these actions, employees were transferred from MTS and NCTD to SANDAG, and certain planning, development, and construction functions were also transferred. As a result, MTS’s activities since the consolidation have been focused on operating public transit systems in the urbanized area identified above. In addition to the consolidation required by SB 1703, MTS dissolved the independent Board of Directors of San Diego Transit Corporation (SDTC) and Board of Directors of San Diego Trolley, Inc. (SDTI). MTS now acts as the Board of Directors for all three agencies: MTS, SDTC, and SDTI. Beginning in FY2004, SDTC and SDTI are presented as blended component units.
These basic financial statements present MTS and its legally separate component units, entities for which MTS is considered to be financially accountable. Because MTS appoints a majority of the component units’ boards of directors, the boards are substantively the same, and MTS is able to impose its will on the component units, MTS presents blended component units. Blended component units, although legally separate entities, are, in substance, part of MTS's operations.
Included within the reporting entity as blended component units:
San Diego Transit Corporation: On July 1, 1985, MTS purchased the assets used by and acquired sole ownership of San Diego Transit Corporation (SDTC) from the City of San Diego for $1. SDTC has entered into an operating agreement with MTS to operate a public transportation bus system in the City of San Diego and certain regional routes within MTS’s jurisdictions. The current agreement, which was approved in December 2006, was renewed on June 23, 2011, as an open-ended agreement terminable upon six months' notice by either party. SDTC continues to provide local service to a number of adjoining cities under pre-existing contracts. Purchases or construction of bus capital items are made by MTS, with whom title remains, and are contributed to SDTC upon completion of a project or when individually purchased by MTS. SDTC’s assets, deferred outflows, liabilities, deferred inflows, net position, revenues, and expenses are included in MTS’s financial statements as a blended component unit. This agency has the same governing board as MTS and provides services directly to the public.
18

San Diego Metropolitan Transit System Notes to Basic Financial Statements (Continued)
For the Years Ended June 30, 2019 and 2018
Note 1 - Summary of Significant Accounting Policies (Continued) A. Reporting Entity (Continued)
San Diego Trolley, Inc.: San Diego Trolley, Inc. (SDTI) was organized by MTS in August 1980. SDTI was created to operate and maintain the Light Rail Transit (LRT) system pursuant to an operating agreement with MTS. The current agreement, which was approved in December 2006, was renewed on June 23, 2011, as an open-ended agreement terminable upon six months' notice by either party. Purchases or construction of LRT capital items are made by MTS, with whom title remains, and are contributed to SDTI upon completion of a project or when individually purchased by MTS. SDTI’s assets, deferred outflows, liabilities, deferred inflows, net position, revenues, and expenses are included in MTS’s financial statements as a blended component unit. This agency has the same governing board as MTS and provides services directly to the public.
San Diego and Arizona Eastern Railway Company: MTS purchased the San Diego and Arizona Eastern Railway Company (SD&AE) in 1979. SDTI operates on a portion of the line and private operators provide freight service on a portion of the line. Purchases of capital items are made by MTS, with whom title remains, and are contributed to SD&AE. Since SD&AE provides almost exclusive benefit to MTS, its assets, deferred outflows, liabilities, deferred inflows, net position, revenues, and expenses are included in MTS’s financial statements as a blended component unit. Separate financial reports are not available.
B. Financial Statements
The Financial Statements (i.e., the statement of net position, the statement of revenues, expenses and changes in net position, and statement of cash flows) report information on all of the activities of the primary government and its component units. The statement of revenues, expenses, and changes in net position demonstrates the degree to which the direct expenses of a given function or segment are offset by program revenues. Direct expenses are those that are clearly identifiable with a specific function or segment.
C. Measurement Focus, Basis of Accounting, and Financial Statement Presentation
The Financial Statements are reported using the “economic resources” measurement focus and the accrual basis of accounting. Revenues are recorded when earned and expenses are recorded when a liability is incurred, regardless of the timing of related cash flows. Grants and similar items are recognized as revenue as all eligibility requirements have been met. Interest associated with the current fiscal period is considered to be susceptible to accrual and so has been recognized as revenue of the current fiscal period. In accordance with GASB Statement No. 63, Financial Reporting of Deferred Outflows of Resources, Deferred Inflows of Resources, and Net Position, the Statement of Net Position reports separate sections for Deferred Outflows of Resources, and Deferred Inflows of Resources, when applicable. Deferred Outflows of Resources represent outflows of resources (consumption of net position) that apply to future periods and that, therefore, will not be recognized as an expense until that time. Deferred Inflows of Resources (acquisition of net position) that apply to future periods and that, therefore, are not recognized as revenue until that time. MTS receives funding primarily from the following revenue sources:
Passenger Revenue Passenger fares comprised approximately 32 percent of MTS's $290.5 million and $277.8 million operating budget for both FY2019 and FY2018 respectively.
19

San Diego Metropolitan Transit System Notes to Basic Financial Statements (Continued)
For the Years Ended June 30, 2019 and 2018
Note 1 - Summary of Significant Accounting Policies (Continued) C. Measurement Focus, Basis of Accounting, and Financial Statement Presentation (Continued)
Other Operating Revenues MTS receives a variety of operating revenues that are not received directly from passenger fares. The sources of these revenues are advertising, naming rights, interest income, energy credits, rental and land management income, income related to Taxicab administration, income from the SD&AE Railway Company, and other miscellaneous income. Non Operating Revenues MTS receives subsidies that are derived from federal, state and local tax revenues. MTS does not levy or collect any tax funds, but receives allocated portions of tax funds through federal, state and local granting agencies. Federal Transit Administration (FTA) FTA revenues are funded by a federal gas tax and revenues of the federal general fund. Moving Ahead for Progress in the 21st Century (MAP-21) was reauthorized on a short-term basis multiple times before being replaced by the Fixing America's Surface Transportation (FAST) Act, signed into law on December 4, 2015. The FAST Act reauthorized surface transportation programs through September 30, 2020. Under the FAST Act, MTS receives Section 5307 and Section 5337 grants which are earmarked for capital assistance and preventive maintenance. Under MAP-21, transit agencies were not eligible to be direct recipients of Section 5339 Bus and Bus Facilities Funding. However, under FAST Act, MTS is now an eligible direct recipient of Section 5339 formula funds. In addition, MTS also receives Section 5311 and Section 5311F grants for operations. Transportation Development Act (TDA) TDA provides funding for public transit operators. This state fund is one quarter of a percent of the 7.75 percent sales tax assessed in the region. SANDAG is responsible for apportionment of these funds within the San Diego region. As economic conditions improve, sales tax receipts have increased over the prior year, and as a result the TDA funds available for disbursement have increased as well. State Transit Assistance (STA) STA funding comes from the Public Transportation Act (PTA) which derives its revenue from the state sales tax on gasoline. These funds are designated as discretionary or formula. The former is appropriated by the legislature. The latter is a formula based upon population and fares generated. STA State of Good Repair Program (SGR) The SGR Program is another new revenue source as a result of Senate Bill (SB) 1 and is funded from a portion of a new Transportation Improvement Fee on vehicle registrations due on or after January 1, 2018. The funds are allocated with the same STA Program formula. TransNet TransNet funds are derived from the Proposition A one-half cent local transportation sales tax that was approved by area voters in November 1987. The original ordinance expired in 2008, but has since been extended to 2048 by subsequent voter approval. The ordinance allocated one-third of the sales tax proceeds for transit purposes, which are further divided between MTS and NCTD based on the proportion of the population within the area of each jurisdiction. The TransNet Program also reimburses MTS for the net operating cost of the Bus Rapid Transit and Superloop projects that were approved as part of the extension. These costs are billed to SANDAG on a monthly basis. TransNet funds are also apportioned by SANDAG.
20

San Diego Metropolitan Transit System Notes to Basic Financial Statements (Continued)
For the Years Ended June 30, 2019 and 2018
Note 1 - Summary of Significant Accounting Policies (Continued) C. Measurement Focus, Basis of Accounting, and Financial Statement Presentation (Continued)
Transit and Intercity Rail Capital Program (TIRCP) The TIRCP is a discretionary program that was created by Senate Bill (SB) 862 (Chapter 36, Statutes of 2014) and modified by Senate Bill 9 (Chapter 710, Statutes of 2015) to provide grants from the Greenhouse Gas Reduction Fund to fund transformative capital improvements that will modernize California’s intercity, commuter, and urban rail systems, and bus and ferry transit systems to reduce emissions of greenhouse gases by reducing congestion and vehicle miles travelled throughout California. MTS was awarded $40.1 million in 2018 for the Blue Line Rail Corridor Transit Enhancements projects which we expect to receive in Fiscal Years 2021-2023 as expenses are incurred. Low Carbon Transit Operations Program (LCTOP): The Low Carbon Transit Operations Program (LCTOP) is one of several programs that are part of the Transit, Affordable Housing, and Sustainable Communities Program established by the California Legislature in 2014 by Senate Bill 862. The LCTOP was created to provide operating and capital assistance for transit agencies to reduce greenhouse gas emission and improve mobility, with a priority on serving disadvantaged communities. Approved projects in LCTOP will support new or expanded bus or rail services, expand intermodal transit facilities, and may include equipment acquisition, fueling, maintenance and other costs to operate those services or facilities, with each project reducing greenhouse gas emissions. Senate Bill 862 continuously appropriates five percent of the annual auction proceeds in the Greenhouse Gas Reduction Fund for LCTOP. Other State Revenue MediCal provides further funding support specifically tied to several ADA Paratransit routes to aid patients in their transportation to medical appointments. Compressed Natural Gas Rebate Alternative fuel credits are issued by the IRS to MTS for utilizing compressed natural gas to power its vehicles. This rebate program expired on December 31, 2017. It continues to be discussed within the legislature, but has not yet been reauthorized. Other Local Subsidies The City of San Diego provides Maintenance of Effort funds to aid ADA efforts. In addition, SANDAG provides funds for the operation of certain express bus routes and NCTD provides partial subsidy for the Sorrento Valley Coaster Connection.
D. Use of Restricted/Unrestricted Assets When both restricted and unrestricted resources are available for use, it is MTS’s policy to use restricted resources first, then unrestricted resources as they are needed.
E. Cash, Cash Equivalents, and Investments Investments of pooled cash consist primarily of pooled investment funds, liquidity funds and governmental bonds. Investments are stated at fair value, which is based on quoted market price. Money market investments and participating interest earning investment contracts that have a remaining maturity at the time of purchase of one year or less are reported at amortized cost, which approximates fair value. For purposes of the statement of cash flows, all highly liquid temporary investments purchased with a maturity of three months or less are considered cash equivalents.
21

San Diego Metropolitan Transit System Notes to Basic Financial Statements (Continued)
For the Years Ended June 30, 2019 and 2018
Note 1 - Summary of Significant Accounting Policies (Continued) E. Cash, Cash Equivalents, and Investments (Continued)
MTS participates in an investment pool managed by the State of California titled Local Agency Investment Fund (LAIF), which has invested a portion of the pool funds in structured notes and asset-backed securities. LAIF’s investments are subject to credit risk with the full faith and credit of the State of California collateralizing these investments. In addition, these structured notes and asset-backed securities are subject to market risk and to change in interest rates. The reported value of the pool is the same as the fair value of the pool shares. MTS also participates in the San Diego County Treasurer's Pooled Money Fund, which is a local government investment pool managed by the County Treasurer's Office on behalf of the Investment Pool participants. Certain disclosure requirements, if applicable for deposit and investment risk, are specified for the following areas:
Interest Rate Risk Credit Risk
Overall Custodial Credit Risk Concentration of Credit Risk
Foreign Currency Risk
GASB Statement No. 72, Fair Value Measurement and Application, defines fair value, establishes a framework for measuring fair value and establishes disclosures about fair value measurement. Investments, unless otherwise specified, recorded at fair value in the Statements of Net Position, are categorized based upon the level of judgement associated with the inputs used to measure their fair value. Levels of inputs are as follows:
Level 1 - Inputs are unadjusted, quoted prices for identical assets and liabilities in active markets at the measurement date.
Level 2 - Inputs, other than quoted prices included in Level 1, that are observable for the asset or liability through corroboration with market data at the measurement date.
Level 3 - Unobservable inputs that reflect management's best estimate of what market participants would use in pricing the asset or liability at the measurement date.
F. Inventory
Inventories are valued at the weighted average unit cost.
G. Prepaid Items and Other Assets Payments made to vendors for services that will benefit periods beyond the fiscal year ended are recorded as prepaid items.
H. Capital Assets Capital assets include land and right-of-way, buildings and infrastructure assets, vehicles, and equipment. Capital assets are defined by the government as assets with an initial, individual cost of more than $5,000. Such assets are recorded at historical cost or estimated historical cost if purchased or constructed. Donated capital assets, donated works of art and similar items, and capital assets received in a service concession arrangement are recorded at acquisition value. The costs of normal maintenance and repairs that do not add to the value of the asset or materially extend the asset’s life are not capitalized. Major outlays for capital asset improvements are recorded as assets.
22

San Diego Metropolitan Transit System Notes to Basic Financial Statements (Continued)
For the Years Ended June 30, 2019 and 2018
Note 1 - Summary of Significant Accounting Policies (Continued)
H. Capital Assets (Continued) Under the operating agreements between MTS and SDTC and SDTI, SDTC and SDTI are required to pay a license fee to MTS for the use of certain capital assets. Due to SDTC’s and SDTI’s continued shortage of operating funds sufficient to cover recurring expenditures, the payment of these fees is considered remote, and therefore, these amounts were not recorded in the accompanying basic financial statements. Buildings, vehicles, and equipment of the primary government, as well as the component units, are depreciated using the straight-line method over the following estimated useful lives:
Assets Years
Building and structures 20 to 30Vehicles and buses 5 to 25Equipment and other capital assets 3 to 10Capital leases 3 to 40
I. Construction-in-Progress
Costs incurred for construction associated with the bus and trolley systems are capitalized as construction-in-progress until such time as they are complete and operational. Upon completion, they are contributed to SDTC, SDTI and MTS - Contracted Services to reflect their custodial accountability for the assets. Depreciation commences at the time of contribution. Assets acquired through capital leases are capitalized.
J. Compensated Absences It is MTS’s policy to permit employees to accumulate earned but unused personal leave time up to a maximum of 400 hours, which includes both vacation and sick pay benefits. All personal leave time is accrued when incurred.
K. Long-Term Obligations Debt premiums and discounts, if any, are deferred and amortized over the life of the debt using the straight-line method. Long-term debt is reported net of the applicable bond premium or discount. Debt issuance costs are expensed when incurred.
L. Refunding of Debt Gains or losses occurring from current or advance refunding of debt are reported as deferred inflows or outflows of resources and are being amortized using the straight-line method over the original remaining life of the old debt or the life of the new debt, whichever is less.
M. Pension For purposes of measuring the net pension liability and deferred outflows/inflows of resources related to pensions and pension expense, information about the fiduciary net position of MTS, SDTC and SDTI's pension plans and additions to/deductions from the Plans' fiduciary net position have been determined on the same basis as they are reported by CalPERS. For this purpose, benefit payments (including refunds of employee contributions) are recognized when due and payable in accordance with benefit terms.
23
San Diego Metropolitan Transit System Notes to Basic Financial Statements (Continued)
For the Years Ended June 30, 2019 and 2018
Note 1 - Summary of Significant Accounting Policies (Continued)
N. Other Postemployment Benefits For purposes of measuring the total OPEB liability, deferred outflows of resources and deferred inflows of resources related to OPEB, and OPEB expense, of the MTS, SDTC, and SDTI’s OPEB Plan (“OPEB Plan”) have been determined on the same basis as they are reported by the Plan (Note 12). For this purpose, the OPEB Plan recognizes benefit payments when due and payable in accordance with the benefit terms.
O. Net Position Net Position is classified as follows:
Net investments in capital assets - This component of net position consists of capital assets, net of accumulated depreciation, reduced by the outstanding balances of debt and deferred inflows and outflows of resources that are attributable to the acquisition, construction, or improvement of those assets. Restricted - This component of net position consists of restricted assets reduced by liabilities and deferred inflows of resources related to those assets. Unrestricted - This component of net position is the amount of the assets, deferred outflows of resources, liabilities, and deferred inflows of resources that are not included in the determination of net investments in capital assets or the restricted component of net position.
P. Use of Estimates
The preparation of the basic financial statements in conformity with generally accepted accounting principles in the United States requires management to make estimates and assumptions that affect certain reported amounts of assets and liabilities and disclosure of contingent assets and liabilities at the date of the financial statements, and the reported amounts of revenues and expenditures during the reported period. Actual results could differ from these estimates.
Q. Implementation of New GASB Pronouncements for the Year Ended June 30, 2019 During fiscal year ended June 30, 2019, MTS has implemented the following new GASB Pronouncements:
GASB Statement No. 83 - In November 2016, GASB issued Statement No. 83, Certain Asset Retirement Obligations. This Statement addresses accounting and financial reporting for certain asset retirement obligations (AROs). An ARO is a legally enforceable liability associated with the retirement of a tangible capital asset. A government that has legal obligations to perform future asset retirement activities related to its tangible capital assets should recognize a liability based on the guidance in this Statement. Application of this statement is effective for MTS's fiscal year ending June 30, 2019. GASB Statement No. 88 - In April 2018, GASB issued Statement No. 88, Certain Disclosures Related to Debt, including Direct Borrowings and Direct Placements. This Statement improves the information that is disclosed in notes to government financial statements related to debt, including direct borrowings and direct placements. It also clarifies which liabilities governments should include when disclosing information related to debt. Application of this statement is effective for MTS's fiscal year ending June 30, 2019.
24
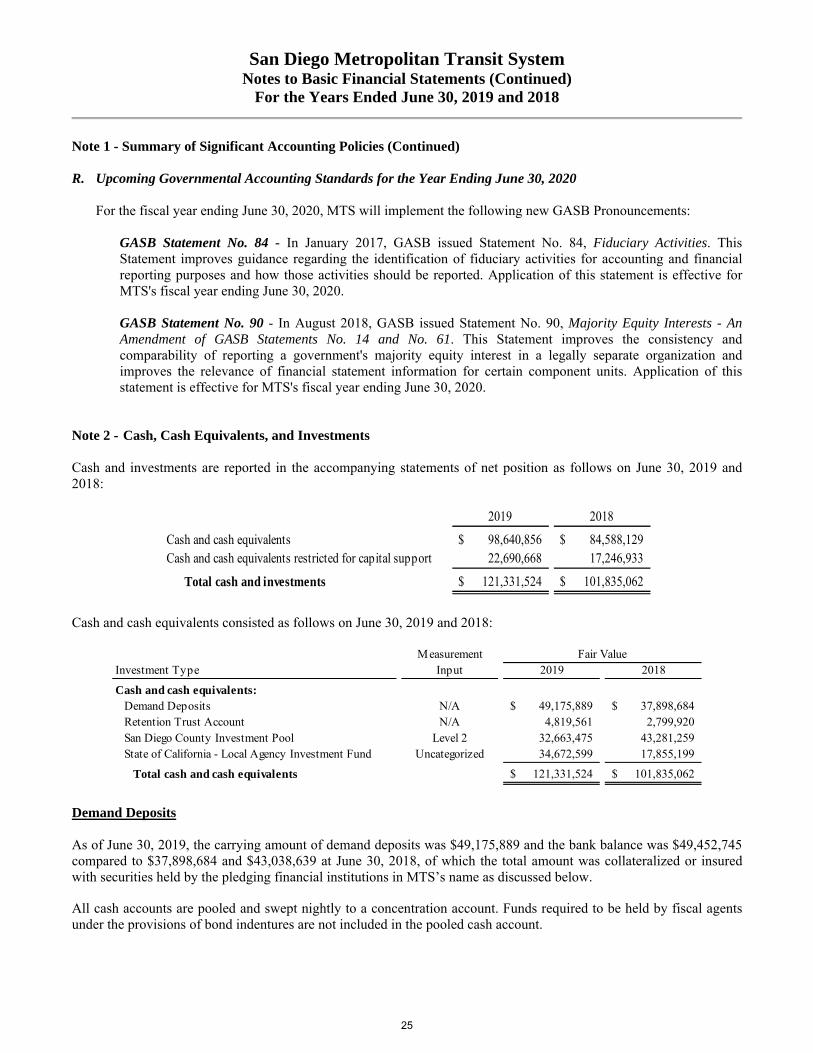
San Diego Metropolitan Transit System Notes to Basic Financial Statements (Continued)
For the Years Ended June 30, 2019 and 2018
Note 1 - Summary of Significant Accounting Policies (Continued)
R. Upcoming Governmental Accounting Standards for the Year Ending June 30, 2020 For the fiscal year ending June 30, 2020, MTS will implement the following new GASB Pronouncements:
GASB Statement No. 84 - In January 2017, GASB issued Statement No. 84, Fiduciary Activities. This Statement improves guidance regarding the identification of fiduciary activities for accounting and financial reporting purposes and how those activities should be reported. Application of this statement is effective for MTS's fiscal year ending June 30, 2020. GASB Statement No. 90 - In August 2018, GASB issued Statement No. 90, Majority Equity Interests - An Amendment of GASB Statements No. 14 and No. 61. This Statement improves the consistency and comparability of reporting a government's majority equity interest in a legally separate organization and improves the relevance of financial statement information for certain component units. Application of this statement is effective for MTS's fiscal year ending June 30, 2020.
Note 2 - Cash, Cash Equivalents, and Investments Cash and investments are reported in the accompanying statements of net position as follows on June 30, 2019 and 2018:
2019 2018
Cash and cash equivalents $ 98,640,856 $ 84,588,129 Cash and cash equivalents restricted for capital support 22,690,668 17,246,933
Total cash and investments $ 121,331,524 $ 101,835,062
Cash and cash equivalents consisted as follows on June 30, 2019 and 2018:
Measurement
Investment Type Input 2019 2018
Cash and cash equivalents:Demand Deposits N/A 49,175,889$ 37,898,684$ Retention Trust Account N/A 4,819,561 2,799,920 San Diego County Investment Pool Level 2 32,663,475 43,281,259 State of California - Local Agency Investment Fund Uncategorized 34,672,599 17,855,199
Total cash and cash equivalents 121,331,524$ 101,835,062$
Fair Value
Demand Deposits As of June 30, 2019, the carrying amount of demand deposits was $49,175,889 and the bank balance was $49,452,745 compared to $37,898,684 and $43,038,639 at June 30, 2018, of which the total amount was collateralized or insured with securities held by the pledging financial institutions in MTS’s name as discussed below. All cash accounts are pooled and swept nightly to a concentration account. Funds required to be held by fiscal agents under the provisions of bond indentures are not included in the pooled cash account.
25

San Diego Metropolitan Transit System Notes to Basic Financial Statements (Continued)
For the Years Ended June 30, 2019 and 2018
Note 2 - Cash, Cash Equivalents, and Investments (Continued) Investments Under the provisions of MTS’s investment policy and in accordance with California Government Code, MTS is authorized to invest or deposit in the following:
United States Treasury bills, notes, bonds, or strips Federal Agency or U.S. government-sponsored enterprise obligations, participations, or other instruments,
including those issued by or fully guaranteed as to principal and interest by Federal agencies or U.S. government-sponsored enterprises
Eligible Banker’s Acceptances Prime Commercial Paper issued by a U.S. organization with a rating category of “A” or “A-1”, its equivalent
or higher Non-negotiable certificates of deposit that meet the requirements for deposit under California Government
Code Section 53630 Negotiable Certificates of Deposit with issuers rated in a rating category of “A”, its equivalent or higher Repurchase Agreements collateralized by U.S. Treasury obligations, Federal Agency securities, or Federal
Instrumentality securities Reverse Repurchase Agreements State of California’s Local Agency Investment Fund (LAIF) The San Diego County Treasurer’s Pooled Money Fund A Joint Powers Authority Pool rated among the top two rating categories by a nationally recognized statistical
rating organization (NRSRO) Medium Term Notes issued by corporations organized and operating within the U.S. with issuers rated in a
rating category of “A”, its equivalent, or higher by a NRSRO Money Market Funds registered under the Investment Company Act of 1940 Municipal bonds issued by MTS Registered State warrants or treasury notes or bonds of the State of California Bonds, notes, warrants, or other evidences of indebtedness of a local agency within California Registered treasury notes or bonds of any of the other 49 states in addition to California Supranational obligatons
For full details on the authorized investments and associated limitations, please refer to MTS Board Policy 30 on our website. https://www.sdmts.com/about-mts-reports-records-and-policies/policies-and-procedures Local Agency Investment Funds MTS’s investments with Local Agency Investment Fund (LAIF) include a portion of the pool funds invested in structured notes and asset-backed securities. These investments include the following:
Structured Notes - debt securities (other than asset-backed securities) whose cash flow characteristics (coupon rate, redemption amount, or stated maturity) depend upon one or more indices and/or that have embedded forwards or options. They are issued by corporations and by government-sponsored enterprises.
Asset-Backed Securities - entitle their purchaser to receive a share of the cash flows from a pool of assets such as principal and interest repayments from a pool of mortgages (such as CMO’s), small business loans or credit card receivables.
LAIF is overseen by the Local Investment Advisory Board, which consists of five members, in accordance with State statute. The fair value of our position in the pool is the same as the value of the pool shares.
26

San Diego Metropolitan Transit System Notes to Basic Financial Statements (Continued)
For the Years Ended June 30, 2019 and 2018
Note 2 - Cash, Cash Equivalents, and Investments (Continued) Local Agency Investment Funds (Continued) As of June 30, 2019, MTS had $34,672,599 invested in LAIF, which had invested 1.77% of the pool investment funds in structured notes and asset-backed securities compared to $17,855,199 and 2.67% at June 30, 2018. San Diego County Treasurer's Pooled Money Fund The San Diego County Treasurer's Pooled Money Fund is a local government investment pool managed by the County Treasurer’s Office on behalf of Investment Pool participants. Depositors in the Investment Pool include both mandatory participants, those agencies required by law to deposit their funds with the County Treasurer’s Office, and voluntary participants, agencies that place their funds in the Investment Pool as an investment option. Voluntary participants, including cities, fire districts, and various special districts accounted for approximately 6.78% and 7.88% of the Investment Pool as of June 30, 2019 and 2018, respectively. At June 30, 2019 and 2018, the fair value of our position in the pool is 99.92% and 99.48%, respectively, of the value of the pool shares. Pursuant to Section 27130-27137 of the California Government Code, the County Board of Supervisors has established the Treasurer's Oversight Committee ("TOC") that monitors and reviews the Investment Policy. The TOC consists of members appointed from the districts or offices that they represent, and up to five members of the public having expertise in, or an academic background in public finance. To mitigate credit risk, the Investment Pool's Investment Policy, which is more restrictive than the Government Code, places a minimum standard on the ratings of investments held in the Investment Pool. Investments in securities other than those guaranteed by the U.S. Treasury or Government Sponsored Enterprises must have a credit rating of no less than "A" for long-term or "A1" for short-term. Non-rated securities include sweep accounts, collateralized certificates of deposit and repurchase agreements. Sweep accounts and collateralized certificates of deposit must be FDIC insured and collateralized with securities held by a named agent of the depository. Repurchase agreements are collateralized by securities, authorized by the California Government Code Section 53601, having fair market value of 102% or greater than the amount of the repurchase agreement. The Investment Pool does not hold any investments in structured notes. MTS’s investments with the County Treasurer's Office include a portion of the pool funds invested in asset-backed securities as defined in the preceding section for LAIF investments. As of June 30, 2019, MTS had $32,663,475 invested with the San Diego County Treasurer's Pooled Fund, which had invested 7.20% of the pool investment funds in asset-backed securities compared to $43,281,259 and 2.11% at June 30, 2018. Disclosures Relating to Interest Rate Risk As a means of limiting its exposure to market value losses arising from rising interest rates, MTS’s investment policy limits investments to maturities dependent on the investment vehicle. Disclosures Relating to Credit Risk MTS’s investment policy limits investments in commercial paper and negotiable certificates of deposit to instruments rated "A", its equivalent or better by a NRSRO. In the current year, MTS does not hold investments in commercial paper or certificates of deposit. MTS investment instruments include deposits in LAIF and the San Diego County Treasurer's Pooled Market Fund which are not rated and do not require ratings.
27

San Diego Metropolitan Transit System Notes to Basic Financial Statements (Continued)
For the Years Ended June 30, 2019 and 2018
Note 2 - Cash, Cash Equivalents, and Investments (Continued) Disclosures Relating to Concentration of Credit Risk The investment policy limits the amount of the percentage of the portfolio that can be invested by the type of investment for certain types of investments. MTS is in compliance with investment type percentages of the total portfolio of the investment policy. Disclosures Relating to Custodial Credit Risk Custodial credit risk for deposits is the risk that, in the event of the failure of a depository financial institution, a government will not be able to recover collateral securities that are in the possession of an outside party. The custodial credit risk for investments is the risk that, in the event of the failure of the broker or dealer to a transaction, a government will not be able to recover the value of its investments or collateral securities that are in the possession of another party. The California Government Code requires California banks and savings and loan associations to secure MTS’s cash deposits by pledging securities as collateral. This Code states that collateral pledged in this manner shall have the effect of perfecting a security interest in such collateral superior to those of a general creditor. Thus, collateral for cash deposits is considered to be held in MTS’s name. The fair value of pledged securities must equal at least 110% of MTS’s cash deposits. California law also allows institutions to secure MTS deposits by pledging first trust deed mortgage notes having a value of 150% of MTS’s total cash deposits. MTS may waive collateral requirements for cash deposits which are fully insured up to $250,000 by the Federal Deposit Insurance Corporation. MTS has waived the collateralization requirements. Summary of Investments to Maturity Investments held by MTS grouped by maturity date at June 30, 2019 and 2018, are shown below:
Maturity 2019 2018
Current to one year 121,331,524$ 101,835,062$
Total 121,331,524$ 101,835,062$
Note 3 - Accounts Receivable A. Accounts and Other Receivables
At June 30, 2019 and 2018, the net realizable accounts and other receivables consisted of the following:
2019 2018
Passenger revenue - General Public 2,590,781$ 3,239,372$ Other trade receivables 6,373,594 4,582,072 Pension plan receivable 1,698,906 1,609,767
Total accounts and other receivables 10,663,281$ 9,431,211$
28

San Diego Metropolitan Transit System Notes to Basic Financial Statements (Continued)
For the Years Ended June 30, 2019 and 2018
Note 3 - Accounts Receivable (Continued)
B. Due From Other Governments At June 30, 2019 and 2018, amounts due from other governments consisted of the following:
2019 2018
FTA Grant Funds $ 60,851,790 $ 59,537,420 SANDAG - Project/Route reimbursement 25,274,333 753,333 STA Funds 7,523,824 6,875,454 SANDAG - TransNet 5,187,851 6,248,861 Passenger Revenue - Other Governments 1,306,541 1,762,228 County of San Diego 951,154 4,692,714 North County Transit District - passenger revenue and shared costs 575,904 957,362 State of California 254,850 1,638,020 Other Local Governments 99,546 52,444 Department of Homeland Security 45,673 35,869 City of San Diego - 19,215
Total due from other governments $ 102,071,466 $ 82,572,920
Note 4 – Inventory At June 30, 2019 and 2018, inventory consisted of the following repair and maintenance parts and administrative supplies:
2019 2018
San Diego Transit Corp. 4,173,162$ 3,458,589$ San Diego Trolley, Inc. 16,574,675 14,787,714
Total inventory 20,747,837$ 18,246,303$
29
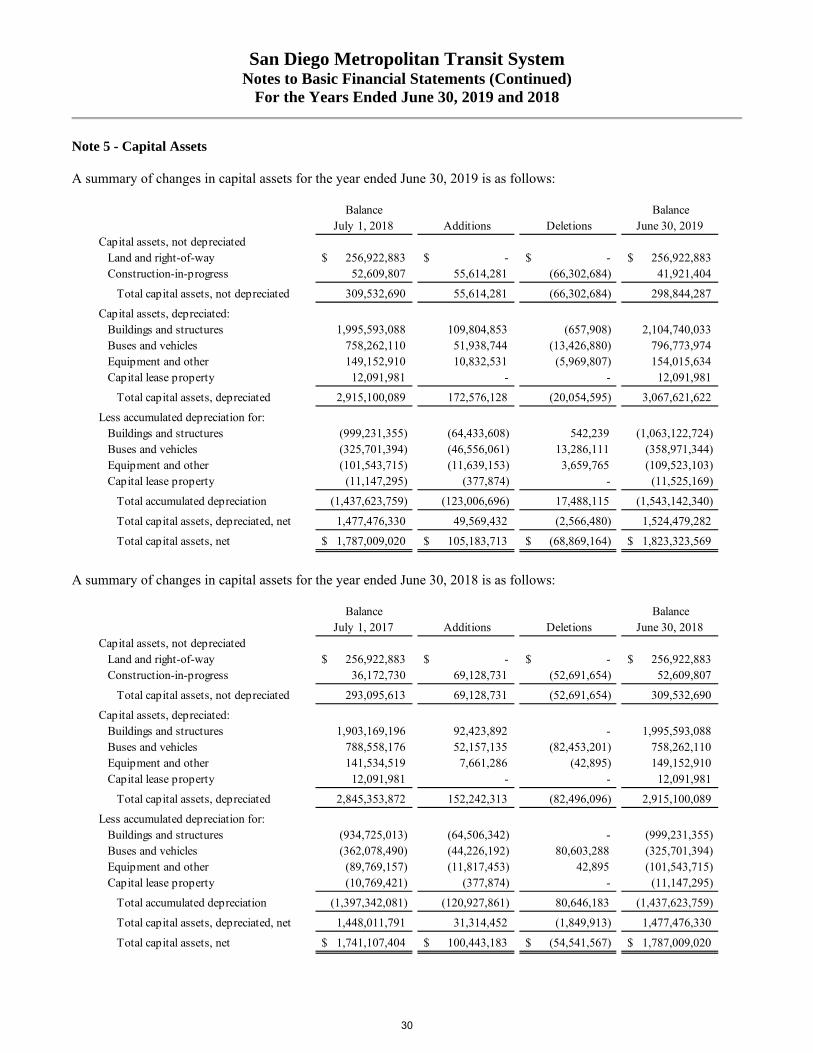
San Diego Metropolitan Transit System Notes to Basic Financial Statements (Continued)
For the Years Ended June 30, 2019 and 2018
Note 5 - Capital Assets A summary of changes in capital assets for the year ended June 30, 2019 is as follows:
Balance Balance
July 1, 2018 Additions Deletions June 30, 2019Capital assets, not depreciated
Land and right-of-way $ 256,922,883 $ - $ - $ 256,922,883 Construction-in-progress 52,609,807 55,614,281 (66,302,684) 41,921,404
Total capital assets, not depreciated 309,532,690 55,614,281 (66,302,684) 298,844,287
Capital assets, depreciated:Buildings and structures 1,995,593,088 109,804,853 (657,908) 2,104,740,033 Buses and vehicles 758,262,110 51,938,744 (13,426,880) 796,773,974 Equipment and other 149,152,910 10,832,531 (5,969,807) 154,015,634 Capital lease property 12,091,981 - - 12,091,981
Total capital assets, depreciated 2,915,100,089 172,576,128 (20,054,595) 3,067,621,622
Less accumulated depreciation for:Buildings and structures (999,231,355) (64,433,608) 542,239 (1,063,122,724)Buses and vehicles (325,701,394) (46,556,061) 13,286,111 (358,971,344)Equipment and other (101,543,715) (11,639,153) 3,659,765 (109,523,103)Capital lease property (11,147,295) (377,874) - (11,525,169)
Total accumulated depreciation (1,437,623,759) (123,006,696) 17,488,115 (1,543,142,340)
Total capital assets, depreciated, net 1,477,476,330 49,569,432 (2,566,480) 1,524,479,282
Total capital assets, net $ 1,787,009,020 $ 105,183,713 $ (68,869,164) $ 1,823,323,569
A summary of changes in capital assets for the year ended June 30, 2018 is as follows:
Balance Balance
July 1, 2017 Additions Deletions June 30, 2018Capital assets, not depreciated
Land and right-of-way $ 256,922,883 $ - $ - $ 256,922,883 Construction-in-progress 36,172,730 69,128,731 (52,691,654) 52,609,807
Total capital assets, not depreciated 293,095,613 69,128,731 (52,691,654) 309,532,690
Capital assets, depreciated:Buildings and structures 1,903,169,196 92,423,892 - 1,995,593,088 Buses and vehicles 788,558,176 52,157,135 (82,453,201) 758,262,110 Equipment and other 141,534,519 7,661,286 (42,895) 149,152,910 Capital lease property 12,091,981 - - 12,091,981
Total capital assets, depreciated 2,845,353,872 152,242,313 (82,496,096) 2,915,100,089
Less accumulated depreciation for:Buildings and structures (934,725,013) (64,506,342) - (999,231,355)Buses and vehicles (362,078,490) (44,226,192) 80,603,288 (325,701,394)Equipment and other (89,769,157) (11,817,453) 42,895 (101,543,715)Capital lease property (10,769,421) (377,874) - (11,147,295)
Total accumulated depreciation (1,397,342,081) (120,927,861) 80,646,183 (1,437,623,759)
Total capital assets, depreciated, net 1,448,011,791 31,314,452 (1,849,913) 1,477,476,330
Total capital assets, net $ 1,741,107,404 $ 100,443,183 $ (54,541,567) $ 1,787,009,020
30

San Diego Metropolitan Transit System Notes to Basic Financial Statements (Continued)
For the Years Ended June 30, 2019 and 2018
Note 5 - Capital Assets (Continued) MTS converted $66 million in capital assets from CIP to assets in service in FY2019 compared to $53 million in FY2018. A summary of capital asset additions contributed by MTS is as follows:
2019 2018
MTS - General Operations 6,075,926$ 1,448,245$ MTS - Contracted Services 7,416,853 36,947,032 San Diego Transit Corporation 4,562,728 7,394,755 San Diego Trolley, Inc. 48,247,177 6,901,622
Total 66,302,684$ 52,691,654$
Capital asset additions totaling $106 million were contributed by SANDAG in FY2019 compared to $100 million in FY2018. SANDAG also contributed spare parts for the new LRVs to SDTI. A summary of capital asset additions contributed by SANDAG is as follows:
2019 2018
MTS - Contracted Services 90,287,543$ 2,724,742$ San Diego Transit Corporation 1,991,933 89,506,033 San Diego Trolley, Inc. 13,993,969 7,319,884
Total 106,273,445 99,550,659 San Diego Trolley, Inc - LRV Spare Parts Inventory 318,668 -
Total contributed capital 106,592,113$ 99,550,659$
Depreciation Depreciation expense for capital assets for the years ended June 30, 2019 and 2018 were comprised of the following:
2019 2018
MTS - General Operations 3,106,473$ 3,098,695$ MTS - Contracted Services 22,706,135 21,236,046 San Diego Transit Corporation 29,467,429 25,998,089 San Diego Trolley, Inc. 67,726,659 70,595,031
Total 123,006,696$ 120,927,861$
31

San Diego Metropolitan Transit System Notes to Basic Financial Statements (Continued)
For the Years Ended June 30, 2019 and 2018
Note 6 – Due To Other Governments At June 30, 2019 and 2018, amounts due to other governments consisted of the following:
2019 2018
SANDAG - subsidy revenue for construction projects in process $ 4,480,475 $ 5,165,754 State of California - miscellaneous 919,015 561,701 City of La Mesa - Miscellaneous 586,030 17,486 North County Transit District-passenger revenue 416,368 1,509,661 City of Lemon Grove - TDA Funds 129,847 126,065 City of San Diego - miscellaneous 103,131 39,726 City of El Cajon - TDA Funds 97,392 94,555 County of San Diego - miscellaneous 56,819 103,362 Other Governments - miscellaneous 53,179 50,956 City of Coronado - TDA Funds 37,738 46,431 SANDAG - project reimbursements 28,813 859,163
Total due to other governments $ 6,908,807 $ 8,574,860
Note 7 – Unearned Revenue At June 30, 2019 and 2018, unearned revenue consisted of the following:
2019 2018
TransNet Funds for LRVs received in advance $ 12,921,047 $ - Caltrans LCTOP funds received in advance 8,852,223 1,689,717 STA State of Good Repair funds received in advance 4,319,957 3,046,020 Fare media payments received in advance 1,999,924 2,806,245 Insurance recoveries received in advance 1,596,242 - Lease payments received in advance 1,594,871 1,577,725 Naming Rights payment received in advance 975,000 300,000
Total unearned revenue $ 32,259,264 $ 9,419,707
32

San Diego Metropolitan Transit System Notes to Basic Financial Statements (Continued)
For the Years Ended June 30, 2019 and 2018
Note 8 – Long-Term Debt A. Summary
A summary of changes in long-term obligations for the year ended June 30, 2019 is as follows:
Amounts due Amounts dueBalance Balance within one in more than
July 1, 2018 Additions Reductions June 30, 2019 year one yearMTS:
Capital lease obligations $ 1,071,269 $ - $ (708,197) $ 363,072 $ 363,072 $ - Compensated absences payable 1,144,305 676,009 (671,456) 1,148,858 671,456 477,402 Accrued damage, injury, and employee claims 952,955 449,867 (412,000) 990,822 439,332 551,490 Aggregate net pension liability 13,418,753 7,912,254 (8,348,344) 12,982,663 - 12,982,663 Aggregate total OPEB liability 5,575,125 653,863 (203,914) 6,025,074 - 6,025,074
Total MTS 22,162,407 9,691,993 (10,343,911) 21,510,489 1,473,860 20,036,629
San Diego Transit Corporation:Pension Obligation Bonds 15,340,000 - (2,430,000) 12,910,000 2,555,000 10,355,000 Compensated absences payable 6,831,941 3,031,119 (3,049,850) 6,813,210 3,049,850 3,763,360 Accrued damage, injury, and employee claims 13,346,566 3,138,584 (4,454,554) 12,030,596 3,289,320 8,741,276 Aggregate net pension liability 134,375,705 24,130,606 (24,444,935) 134,061,376 - 134,061,376 Aggregate total OPEB liability 28,722,883 2,176,297 (1,378,967) 29,520,213 - 29,520,213
Total San Diego Transit Corporation 198,617,095 32,476,606 (35,758,306) 195,335,395 8,894,170 186,441,225
San Diego Trolley, Inc.:Compensated absences payable 2,777,508 2,447,070 (2,328,645) 2,895,933 2,328,645 567,288 Accrued damage, injury, and employee claims 2,990,631 929,646 (1,105,044) 2,815,233 1,269,760 1,545,473 Aggregate net pension liability 33,477,254 15,925,962 (18,083,844) 31,319,372 - 31,319,372 Aggregate total OPEB liability 11,098,821 830,012 (362,917) 11,565,916 - 11,565,916
Total San Diego Trolley, Inc. 50,344,214 20,132,690 (21,880,450) 48,596,454 3,598,405 44,998,049
Total $ 271,123,716 $ 62,301,289 $ (67,982,667) $ 265,442,338 $ 13,966,435 $ 251,475,903
33

San Diego Metropolitan Transit System Notes to Basic Financial Statements (Continued)
For the Years Ended June 30, 2019 and 2018
Note 8 – Long-Term Debt (Continued) A. Summary (Continued)
A summary of changes in long-term obligations for the year ended June 30, 2018 is as follows:
Balance Amounts due Amounts dueJuly 1, 2017 Balance within one in more than
(As Restated) Additions Reductions June 30, 2018 year one yearMTS:
Capital lease obligations $ 1,747,713 $ - $ (676,444) $ 1,071,269 $ 708,197 $ 363,072 Compensated absences payable 1,081,927 972,967 (910,589) 1,144,305 910,589 233,716 Accrued damage, injury, and employee claims 531,592 828,363 (407,000) 952,955 359,151 593,804 Aggregate net pension liability 11,480,319 7,401,043 (5,462,609) 13,418,753 - 13,418,753 Aggregate total OPEB liability 5,562,352 109,394 (96,621) 5,575,125 - 5,575,125
Total MTS 20,403,903 9,311,767 (7,553,263) 22,162,407 1,977,937 20,184,470
San Diego Transit Corporation:Pension Obligation Bonds 17,655,000 - (2,315,000) 15,340,000 2,430,000 12,910,000 Compensated absences payable 7,244,573 2,637,867 (3,050,499) 6,831,941 3,050,499 3,781,442 Accrued damage, injury, and employee claims 12,189,894 6,656,672 (5,500,000) 13,346,566 3,604,736 9,741,830 Aggregate net pension liability 136,322,951 24,966,384 (26,913,630) 134,375,705 - 134,375,705 Aggregate total OPEB liability 29,858,990 (206,937) (929,170) 28,722,883 - 28,722,883
Total San Diego Transit Corporation 203,271,408 34,053,986 (38,708,299) 198,617,095 9,085,235 189,531,860
San Diego Trolley, Inc.:Compensated absences payable 2,663,379 2,332,538 (2,218,409) 2,777,508 2,218,409 559,099 Accrued damage, injury, and employee claims 2,913,356 1,180,275 (1,103,000) 2,990,631 1,297,933 1,692,698 Aggregate net pension liability 30,302,011 20,276,699 (17,101,456) 33,477,254 - 33,477,254 Aggregate total OPEB liability 11,414,062 (126,202) (189,039) 11,098,821 - 11,098,821
Total San Diego Trolley, Inc. 47,292,808 23,663,310 (20,611,904) 50,344,214 3,516,342 46,827,872
Total $ 270,968,119 $ 67,029,063 $ (66,873,466) $ 271,123,716 $ 14,579,514 $ 256,544,202
Long-term debt is reported in the accompanying statement of net position as follows:
Due Within Noncurrent Due Within NoncurrentOne Year Liabilities One Year Liabilities
Long-Term Liabilities:Compensated absences payable 6,049,951$ 4,808,050$ 6,179,497$ 4,574,257$ Accrued damage, injury, and employee claims 4,998,412 10,838,239 5,261,820 12,028,332 Long-term debt 2,918,072 10,355,000 3,138,197 13,273,072 Aggregate net pension liability - 178,363,411 - 181,271,712 Aggregate total OPEB liability - 47,111,203 - 45,396,829
Total long-term liabilities 13,966,435$ 251,475,903$ 14,579,514$ 256,544,202$
2019 2018
34

San Diego Metropolitan Transit System Notes to Basic Financial Statements (Continued)
For the Years Ended June 30, 2019 and 2018
Note 8 – Long-Term Debt (Continued) B. Capital Lease
The County of San Diego (the County) has a master lease agreement with the MTS Joint Powers Agency (Agency) for the lease of the MTS Tower building. MTS entered into a sublease agreement with the County for a portion (27.61%) of the MTS Tower building. The sublease is classified as a capital lease because 27.61% of the title transfers to MTS at the end of the County’s master lease. The master lease terminates on November 1, 2086; however, the County has the option to terminate the agreement on November 1, 2041 and each tenth anniversary thereafter. In May 2011, San Diego County refunded the underlying debt obligation in order to secure a more favorable interest rate, which results in a $1.3 million reduction in future principal and interest payments under the terms of the lease agreement. A $788,266 net economic capital gain from the refunding, which is the difference between the present value of the minimum payments on the refunded debt and the present value of the minimum payments on the refunding debt, has been deferred. The deferred gain will be amortized as a component of interest expense over the life of the refunding debt, which is the same life as the refunded debt. The asset acquired through the capital lease is as follows:
2019 2018
Building – MTS Tower $ 12,091,981 $ 12,091,981 Less accumulated depreciation (11,525,169) (11,147,295)
Total $ 566,812 $ 944,686
At June 30, 2019 the future minimum payments under the capital lease were $363,072 summarized below:
Tower LeaseYear ending June 30: Payments
2020 $ 372,148
Total minimum lease payments 372,148 Less amount representing interest (9,076)
Present value of minimum lease payments $ 363,072
C. Pension Obligation Bonds
In October 2004, MTS issued $77,490,000 of Taxable Pension Obligation Bonds (POBs) for the benefit of SDTC. The purpose of the bonds was to make contributions to the San Diego Transit Corporation Retirement Plan and reduce its unfunded liability. This is in essence a hedge versus the assumed investment rate of 8% used by the actuary to determine the Actuarial Accrued Liability. The proceeds less fees were invested into the retirement plan. The bonds consist of the following:
Series A Bonds of $38,690,000 are fixed rate bonds that mature in annual installments between 2006 and 2024 and bear an interest rate from 2.58% to 5.15% increasing progressively over the maturities. Interest is due and payable semi-annually on June 1 and December 1. Principal is due and payable each year on December 1.
35

San Diego Metropolitan Transit System Notes to Basic Financial Statements (Continued)
For the Years Ended June 30, 2019 and 2018
Note 8 – Long-Term Debt (Continued)
C. Pension Obligation Bonds (Continued) At June 30, 2019 and 2018, the outstanding balance of the Pension Obligation Bonds is $12,910,000 and $15,340,000, respectively. The required payments for the Pension Obligation Bonds, including interest, are:
Year ending June 30 Principal Interest Total
2020 $ 2,555,000 $ 599,074 $ 3,154,074 2021 2,690,000 464,015 3,154,015 2022 2,835,000 321,746 3,156,746 2023 2,985,000 171,881 3,156,881 2024 1,845,000 47,509 1,892,509
Total $ 12,910,000 $ 1,604,225 $ 14,514,225
Note 9 - Risk Management MTS (including SDTC, SDTI, and MTS - Contracted Services) is self-insured for third party liability claims to a maximum of $2,000,000 per occurrence. Amounts in excess of the self-insured retention limits for public liability are covered through commercial insurance carriers up to $75,000,000. No stop loss or cap coverage is purchased above the $75,000,000 limits. MTS, SDTC, and SDTI purchase all-risk (excluding earthquake) insurance coverage for property damage up to $600,000,000 per occurrence with deductibles ranging from $25,000 to $250,000, depending on the type of property and peril involved. In addition, MTS, SDTC, and SDTI are self-insured for costs arising from employee workers’ compensation act benefit claims including employer’s liability to a retained limit of $1,000,000 per occurrence. Amounts in excess of $1,000,000 are insured up to statutory limits. MTS, SDTC, and SDTI all finance their respective unemployment insurance liabilities. MTS, SDTC and SDTI have policies for crime coverage through commercial insurance as well as cyber liability insurance to protect the agencies from third party claims alleging computer security breaches. The crime coverage policy has a limit of $1,000,000 subject to a $2,500 deductible and the cyber liability policy has a limit of $5,000,000 subject to a $100,000 deductible. These policies protect against theft, loss or unauthorized disclosure of personally identifiable information. Claim expenditures and liabilities in connection with these self-insurance programs are reported when it is probable that a loss has occurred and the amount of that loss can be reasonably estimated. These losses include an estimate of claims that have been incurred but not reported based upon past experience, modified for current trends and information. Claim payments up to $2,000,000 per incident are recorded as risk management expenses in the statements of revenues, expenses, and changes in net position. Claim payments did not exceed insurance coverage in any of the past three years.
Current yearclaims and
Beginning of changes Claims End offiscal year in estimates payments fiscal year
2017 $ 15,595,150 $ 3,599,692 $ (3,560,000) $ 15,634,842 2018 15,634,842 8,665,310 (7,010,000) 17,290,152 2019 17,290,152 1,128,499 (2,582,000) 15,836,651
36
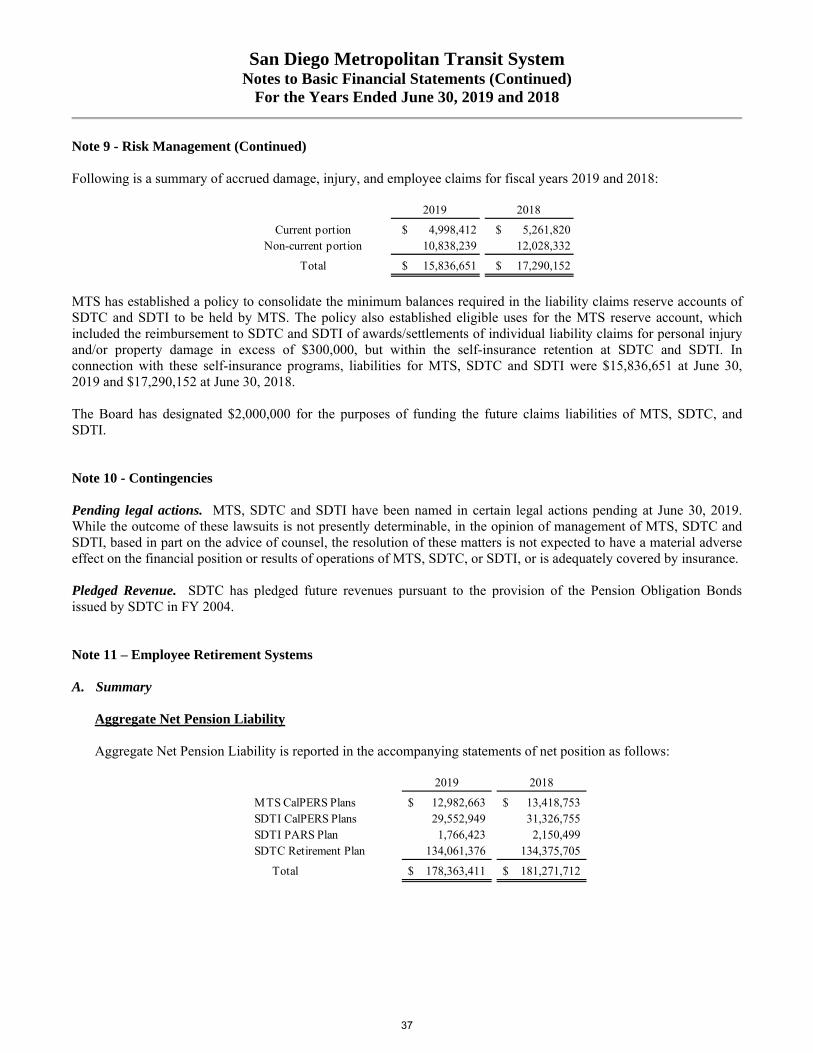
San Diego Metropolitan Transit System Notes to Basic Financial Statements (Continued)
For the Years Ended June 30, 2019 and 2018
Note 9 - Risk Management (Continued) Following is a summary of accrued damage, injury, and employee claims for fiscal years 2019 and 2018:
2019 2018
Current portion $ 4,998,412 $ 5,261,820 Non-current portion 10,838,239 12,028,332
Total $ 15,836,651 $ 17,290,152
MTS has established a policy to consolidate the minimum balances required in the liability claims reserve accounts of SDTC and SDTI to be held by MTS. The policy also established eligible uses for the MTS reserve account, which included the reimbursement to SDTC and SDTI of awards/settlements of individual liability claims for personal injury and/or property damage in excess of $300,000, but within the self-insurance retention at SDTC and SDTI. In connection with these self-insurance programs, liabilities for MTS, SDTC and SDTI were $15,836,651 at June 30, 2019 and $17,290,152 at June 30, 2018. The Board has designated $2,000,000 for the purposes of funding the future claims liabilities of MTS, SDTC, and SDTI. Note 10 - Contingencies Pending legal actions. MTS, SDTC and SDTI have been named in certain legal actions pending at June 30, 2019. While the outcome of these lawsuits is not presently determinable, in the opinion of management of MTS, SDTC and SDTI, based in part on the advice of counsel, the resolution of these matters is not expected to have a material adverse effect on the financial position or results of operations of MTS, SDTC, or SDTI, or is adequately covered by insurance. Pledged Revenue. SDTC has pledged future revenues pursuant to the provision of the Pension Obligation Bonds issued by SDTC in FY 2004. Note 11 – Employee Retirement Systems A. Summary
Aggregate Net Pension Liability Aggregate Net Pension Liability is reported in the accompanying statements of net position as follows:
2019 2018
MTS CalPERS Plans $ 12,982,663 $ 13,418,753 SDTI CalPERS Plans 29,552,949 31,326,755 SDTI PARS Plan 1,766,423 2,150,499 SDTC Retirement Plan 134,061,376 134,375,705
Total $ 178,363,411 $ 181,271,712
37

San Diego Metropolitan Transit System Notes to Basic Financial Statements (Continued)
For the Years Ended June 30, 2019 and 2018
Note 11 – Employee Retirement Systems (Continued) A. Summary (Continued)
Deferred Outflows of Resources Deferred Outflows of Resources at June 30, 2019 are reported in the accompanying statement of net position as
follows:
Differences DifferencesBetween Between
Differences Projected Employer's Contributions Between and Actual ContributionsMade After Expected and Earnings on Changes in and Proportionate
Measurement Actual Pension Plan Changes in Employer's Share ofDate Experience Investments Assumptions Proportion Contributions Total
MTS CalPERS Plans $ 2,041,117 $ 498,122 $ 64,183 $ 1,480,062 $ 464,158 $ 529,418 5,077,060$ SDTI CalPERS Plans 3,824,864 158,950 285,018 5,085,955 - - 9,354,787 SDTI PARS Plan 435,748 - 40,356 426,943 - - 903,047 SDTC Retirement Plan 13,632,820 395,229 8,665,478 - - - 22,693,527
Total $ 19,934,549 $ 1,052,301 $ 9,055,035 $ 6,992,960 $ 464,158 $ 529,418 $ 38,028,421
Deferred Outflows of Resources at June 30, 2018 are reported in the accompanying statement of net position as
follows:
Differences DifferencesBetween Between
Differences Projected Employer's Contributions Between and Actual ContributionsMade After Expected and Earnings on Changes in and Proportionate
Measurement Actual Pension Plan Changes in Employer's Share ofDate Experience Investments Assumptions Proportion Contributions Total
MTS CalPERS Plans $ 1,896,639 $ 16,501 $ 463,033 $ 2,047,380 $ 1,162,548 $ 597,880 6,183,981$ SDTI CalPERS Plans 3,266,081 231,199 1,495,441 6,839,732 - - 11,832,453 SDTI PARS Plan 539,350 - 128,350 184,933 - - 852,633 SDTC Retirement Plan 13,020,223 790,458 10,413,914 9,899,958 - - 34,124,553
Total $ 18,722,293 $ 1,038,158 $ 12,500,738 $ 18,972,003 $ 1,162,548 $ 597,880 $ 52,993,620
38

San Diego Metropolitan Transit System Notes to Basic Financial Statements (Continued)
For the Years Ended June 30, 2019 and 2018
Note 11 – Employee Retirement Systems (Continued) A. Summary (Continued)
Deferred Inflows of Resources Deferred Inflows of Resources at June 30, 2019 are reported in the accompanying statement of net position as
follows:
DifferencesBetween
Expected and Changes inActual Changes in Employer's
Experience Assumptions Proportion Total
MTS CalPERS Plans $ 169,508 $ 362,735 $ 246,648 778,891$ SDTI CalPERS Plans 2,162,417 1,436,635 - 3,599,052 SDTI PARS Plan 487,781 - - 487,781 SDTC Retirement Plan 120,237 320,161 - 440,398
Total $ 2,939,943 $ 2,119,531 $ 246,648 $ 5,306,122
Deferred Inflows of Resources at June 30, 2018 are reported in the accompanying statement of net position as follows:
DifferencesBetween
Expected and Changes inActual Changes in Employer's
Experience Assumptions Proportion Total
MTS CalPERS Plans $ 236,407 $ 156,115 $ 166,559 559,081$ SDTI CalPERS Plans 2,423,342 1,011,002 - 3,434,344 SDTI PARS Plan 95,439 - - 95,439 SDTC Retirement Plan 724,825 - - 724,825
Total $ 3,480,013 $ 1,167,117 $ 166,559 $ 4,813,689
Pension Expense Pension expenses are included in the accompanying statements of revenues, expenses, and changes in net position as follows:
2019 2018
MTS CalPERS Plans 2,931,758$ 3,230,287$ SDTI CalPERS Plans 4,769,974 5,391,273 SDTI PARS Plan 403,546 528,123 SDTC Retirement Plan 24,465,090 24,640,931
Total $ 32,570,368 $ 33,790,614
39

San Diego Metropolitan Transit System Notes to Basic Financial Statements (Continued)
For the Years Ended June 30, 2019 and 2018
Note 11 – Employee Retirement Systems (Continued) B. MTS
General Information about the Pension Plans
Plan Description – All MTS management employees working the equivalent of 1,000 hours per fiscal year are eligible to participate in the MTS Miscellaneous, MTS Miscellaneous PEPRA, or MTS Miscellaneous Second Tier cost-sharing multiple employer defined benefit plans administered by California Public Employees’ Retirement System (CalPERS), which acts as a common investment and administrative agent for its participating member employers. Benefit Provisions under the Plans are established by State statutes within the Public Employee’s Retirement Law. CalPERS issues publicly available reports that include a full description of the pension plans regarding benefit provisions, assumptions and membership information that can be found on the CalPERS website. Copies of the CalPERS annual financial report may be obtained from the CalPERS Executive Office – 400 P Street, Sacramento, CA 95814. Benefits Provided – CalPERS provides service retirement and disability benefits, annual cost-of-living adjustments, and death benefits to plan members and beneficiaries. Benefits are based on years of credited service, equal to one year of full time employment and can only be amended by the MTS Board of Directors. The Plan’s provisions and benefits in effect as of June 30, 2019 are summarized as follows:
MTS Miscellaneous Plan-1223 CLOSED TO NEW MEMBERS
Hire date Prior to December 24, 2012 Benefit formula 2.7% @ 55 Benefit vesting schedule 5 years service Benefit payments Monthly for life Final Average Compensation Period 12 months Retirement age 50-55 Monthly benefits, as a % of eligible compensation 2.0%-2.7% Required employee contribution rates 8.00% Required employer contribution rates 25.21% Pre-Retirement Death Benefit Optional Settlement 2W Post-Retirement Death Benefit $500 Lump Sum Non-Industrial Standard Disability 1.8% of final compensation multiplied by service COLA 2.00%
MTS Miscellaneous Second Tier Plan - 30134
Hire date On or Between December 24 and 31, 2012 or Grandfathered classic members
Benefit formula 2.0% @ 60 Benefit vesting schedule 5 years service Benefit payments Monthly for life Final Average Compensation Period 12 months Retirement age 50-63 Monthly benefits, as a % of eligible compensation 1.092%-2.418% Required employee contribution rates 7.00% Required employer contribution rates 8.19% Pre-Retirement Death Benefit Optional Settlement 2W Post-Retirement Death Benefit $500 Lump Sum Non-Industrial Standard Disability 1.8% of final compensation multiplied by service COLA 2.00%
40

San Diego Metropolitan Transit System Notes to Basic Financial Statements (Continued)
For the Years Ended June 30, 2019 and 2018
Note 11 – Employee Retirement Systems (Continued) B. MTS (Continued)
General Information about the Pension Plans (Continued)
MTS PEPRA Miscellaneous Plan - 26789
Hire date On or after January 1, 2013 Benefit formula 2.0% @ 62 Benefit vesting schedule 5 years service Benefit payments Monthly for life Final Average Compensation Period 36 months Retirement age 52-67 Monthly benefits, as a % of eligible compensation 1.0-2.5% Required employee contribution rates 6.25% Required employer contribution rates 6.91% Pre-Retirement Death Benefit Optional Settlement 2W Post-Retirement Death Benefit $500 Lump Sum Non-Industrial Standard Disability 1.8% of final compensation multiplied by service COLA 2.00%
Employees Covered – At June 30, 2019 (measurement date 2018) and June 30, 2018 (measurement date 2017), the following employees were covered by the benefit terms:
2019 2018
Inactive employees or beneficiaries currently receiving benefits 136 126Inactive employees entitled to but not yet receiving benefits 68 47Active employees 163 159
Total 367 332
Contributions – Section 20814(c) of the California Public Employees’ Retirement Law (PERL) requires that the employer contribution rates for all public employers be determined on an annual basis by the actuary and shall be effective on the July 1 following notice of a change in the rate. The total plan contributions are determined through the CalPERS’ annual actuarial valuation process. For public agency cost-sharing plans, the Plan’s actuarially determined rate is based on the estimated amount necessary to pay the Plan’s allocated share of the risk pool’s costs of benefits earned by employees during the year, and any unfunded accrued liability. The employer is required to contribute the difference between the actuarially determined rate and the contribution rate of employees. For the years ended June 30, 2019 and 2018 (measurement dates 2018 and 2017), the active employee contribution rates and average employer contribution rates were as follows:
Employee Contribution
Rate
Employer Contribution
Rate
Employee Contribution
Rate
Employer Contribution
Rate
MTS - Miscellaneous Plan-1223 8.00% 22.08% 8.00% 20.35%MTS Miscellaneous Second Tier Plan - 30134 7.00% 7.65% 7.00% 7.61%MTS PEPRA Miscellaneous Plan - 26789 6.25% 6.53% 6.25% 6.56%
2019 2018
41
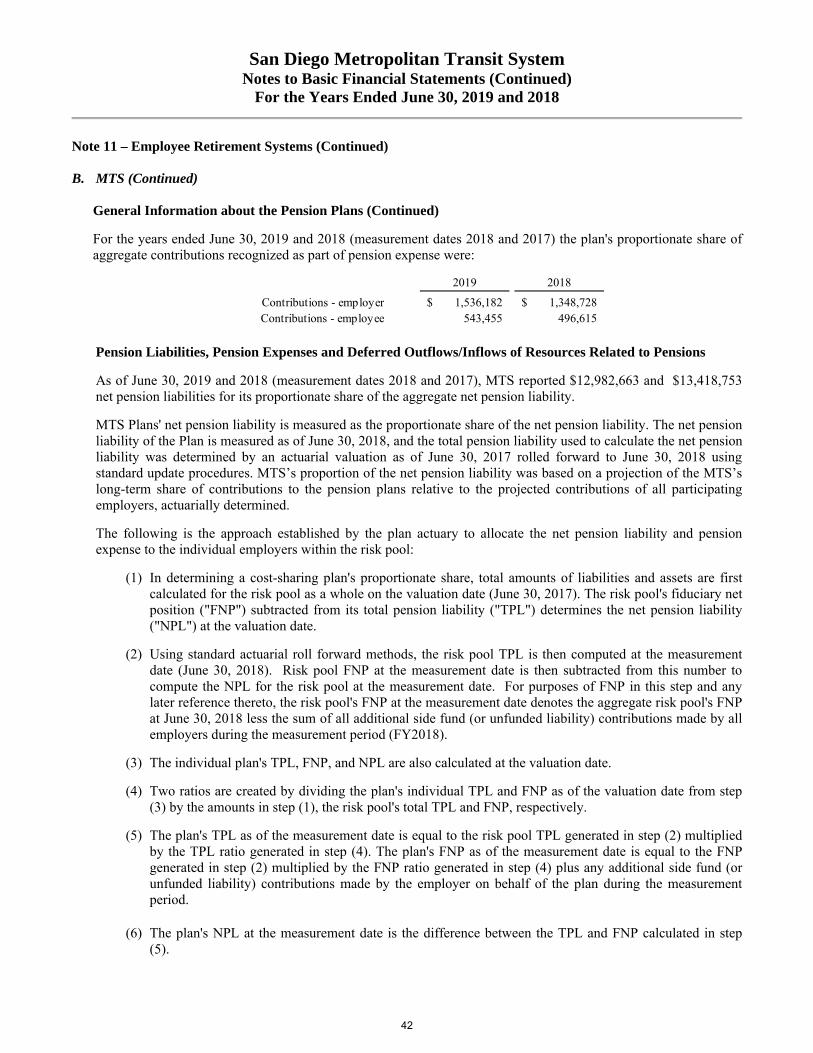
San Diego Metropolitan Transit System Notes to Basic Financial Statements (Continued)
For the Years Ended June 30, 2019 and 2018
Note 11 – Employee Retirement Systems (Continued)
B. MTS (Continued)
General Information about the Pension Plans (Continued)
For the years ended June 30, 2019 and 2018 (measurement dates 2018 and 2017) the plan's proportionate share of aggregate contributions recognized as part of pension expense were:
2019 2018
1,536,182$ 1,348,728$ 543,455 496,615
Contributions - employerContributions - employee
Pension Liabilities, Pension Expenses and Deferred Outflows/Inflows of Resources Related to Pensions
As of June 30, 2019 and 2018 (measurement dates 2018 and 2017), MTS reported $12,982,663 and $13,418,753 net pension liabilities for its proportionate share of the aggregate net pension liability.
MTS Plans' net pension liability is measured as the proportionate share of the net pension liability. The net pension liability of the Plan is measured as of June 30, 2018, and the total pension liability used to calculate the net pension liability was determined by an actuarial valuation as of June 30, 2017 rolled forward to June 30, 2018 using standard update procedures. MTS’s proportion of the net pension liability was based on a projection of the MTS’s long-term share of contributions to the pension plans relative to the projected contributions of all participating employers, actuarially determined.
The following is the approach established by the plan actuary to allocate the net pension liability and pension expense to the individual employers within the risk pool:
(1) In determining a cost-sharing plan's proportionate share, total amounts of liabilities and assets are first calculated for the risk pool as a whole on the valuation date (June 30, 2017). The risk pool's fiduciary net position ("FNP") subtracted from its total pension liability ("TPL") determines the net pension liability ("NPL") at the valuation date.
(2) Using standard actuarial roll forward methods, the risk pool TPL is then computed at the measurement date (June 30, 2018). Risk pool FNP at the measurement date is then subtracted from this number to compute the NPL for the risk pool at the measurement date. For purposes of FNP in this step and any later reference thereto, the risk pool's FNP at the measurement date denotes the aggregate risk pool's FNP at June 30, 2018 less the sum of all additional side fund (or unfunded liability) contributions made by all employers during the measurement period (FY2018).
(3) The individual plan's TPL, FNP, and NPL are also calculated at the valuation date.
(4) Two ratios are created by dividing the plan's individual TPL and FNP as of the valuation date from step (3) by the amounts in step (1), the risk pool's total TPL and FNP, respectively.
(5) The plan's TPL as of the measurement date is equal to the risk pool TPL generated in step (2) multiplied by the TPL ratio generated in step (4). The plan's FNP as of the measurement date is equal to the FNP generated in step (2) multiplied by the FNP ratio generated in step (4) plus any additional side fund (or unfunded liability) contributions made by the employer on behalf of the plan during the measurement period.
(6) The plan's NPL at the measurement date is the difference between the TPL and FNP calculated in step
(5).
42
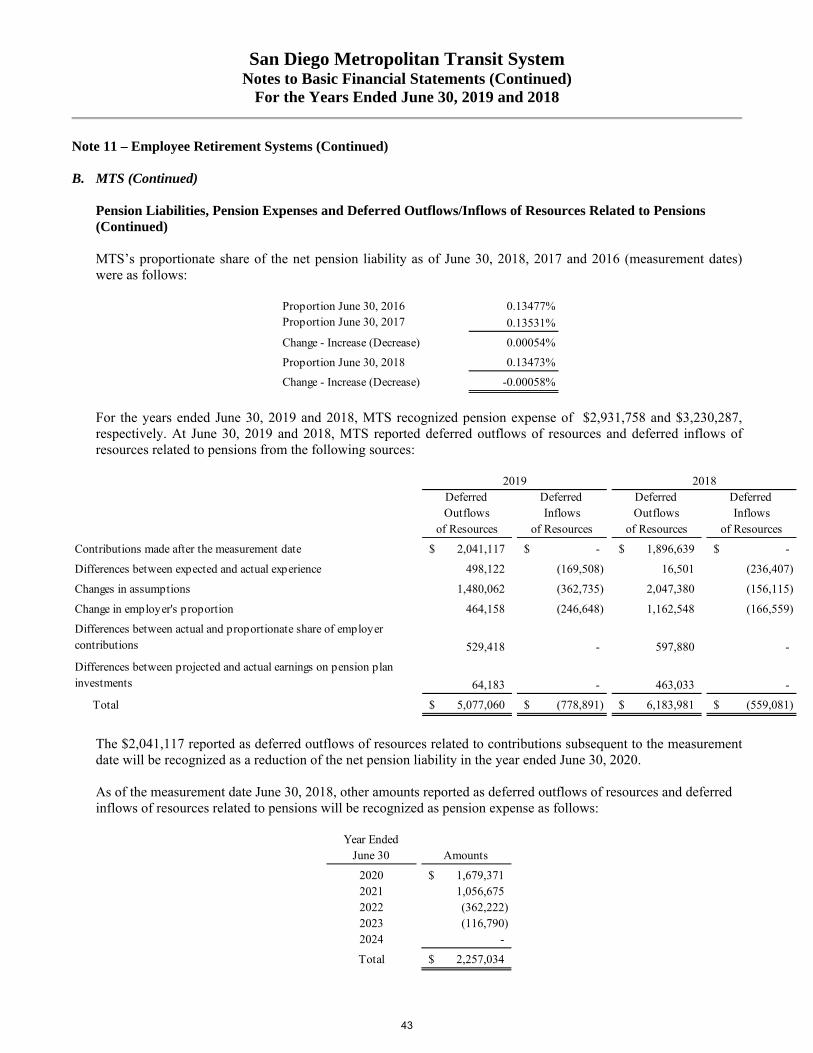
San Diego Metropolitan Transit System Notes to Basic Financial Statements (Continued)
For the Years Ended June 30, 2019 and 2018
Note 11 – Employee Retirement Systems (Continued) B. MTS (Continued)
Pension Liabilities, Pension Expenses and Deferred Outflows/Inflows of Resources Related to Pensions (Continued)
MTS’s proportionate share of the net pension liability as of June 30, 2018, 2017 and 2016 (measurement dates) were as follows:
0.13477%
0.13531%
0.00054%
0.13473%
-0.00058%
Proportion June 30, 2016Proportion June 30, 2017
Proportion June 30, 2018
Change - Increase (Decrease)
Change - Increase (Decrease)
For the years ended June 30, 2019 and 2018, MTS recognized pension expense of $2,931,758 and $3,230,287, respectively. At June 30, 2019 and 2018, MTS reported deferred outflows of resources and deferred inflows of resources related to pensions from the following sources:
Deferred Deferred Deferred Deferred Outflows Inflows Outflows Inflows
of Resources of Resources of Resources of Resources
2,041,117$ -$ 1,896,639$ -$
498,122 (169,508) 16,501 (236,407)
1,480,062 (362,735) 2,047,380 (156,115)
464,158 (246,648) 1,162,548 (166,559)
529,418 - 597,880 -
64,183 - 463,033 -
Total 5,077,060$ (778,891)$ 6,183,981$ (559,081)$
Contributions made after the measurement date
Differences between expected and actual experience
Changes in assumptions
Change in employer's proportion
Differences between actual and proportionate share of employer contributions
Differences between projected and actual earnings on pension plan investments
2019 2018
The $2,041,117 reported as deferred outflows of resources related to contributions subsequent to the measurement date will be recognized as a reduction of the net pension liability in the year ended June 30, 2020. As of the measurement date June 30, 2018, other amounts reported as deferred outflows of resources and deferred inflows of resources related to pensions will be recognized as pension expense as follows:
Year Ended June 30 Amounts
2020 1,679,371$ 2021 1,056,675 2022 (362,222) 2023 (116,790) 2024 -
Total 2,257,034$
43

San Diego Metropolitan Transit System Notes to Basic Financial Statements (Continued)
For the Years Ended June 30, 2019 and 2018
Note 11 – Employee Retirement Systems (Continued) B. MTS (Continued)
Pension Liabilities, Pension Expenses and Deferred Outflows/Inflows of Resources Related to Pensions (Continued)
In the previous year, other amounts reported as deferred outflows of resources and deferred inflows of resources related to pensions will be recognized as pension expense as follows:
Year Ended June 30 Amounts
2019 1,430,994$ 2020 1,567,698 2021 1,004,481 2022 (274,911) 2023 -
Total 3,728,262$
Actuarial Assumptions – The total pension liability in the June 30, 2017 actuarial valuation was determined using the following actuarial assumptions:
Valuation Date June 30, 2017Measurement Date June 30, 2018Actuarial Cost Method Entry Age NormalActuarial Assumptions:
Discount Rate 7.15%Inflation 2.50%Projected Salary Increase varies by entry age and servicePayroll Growth 2.88%Investment Rate of Return 7.15% (1)Mortality derived using CalPERS's membership
data for all funds (2)
(2) The mortality table used was developed based on CalPERS's specific data. The table includes 15 years of mortality improvements using Society of Actuaries Scales 90% of scale MP 2016.
(1) Net of pension plan investment expenses.
Change in Assumptions – GASB 68, paragraph 30 states that the long-term expected rate of return should be determined net of pension plan investment expense, but without reduction for pension plan administrative expense. In the current year, the actuarial report did not have a change of assumption. In the prior year, the discount rate was reduced from 7.65 percent to 7.15 percent. All other actuarial assumptions used in the June 30, 2017 valuation were based on the results of an actuarial experience study for the period 1997 to 2011, including updates to salary increase, mortality and retirement rates. Further details of the Experience Study can be found on the CalPERS website.
44
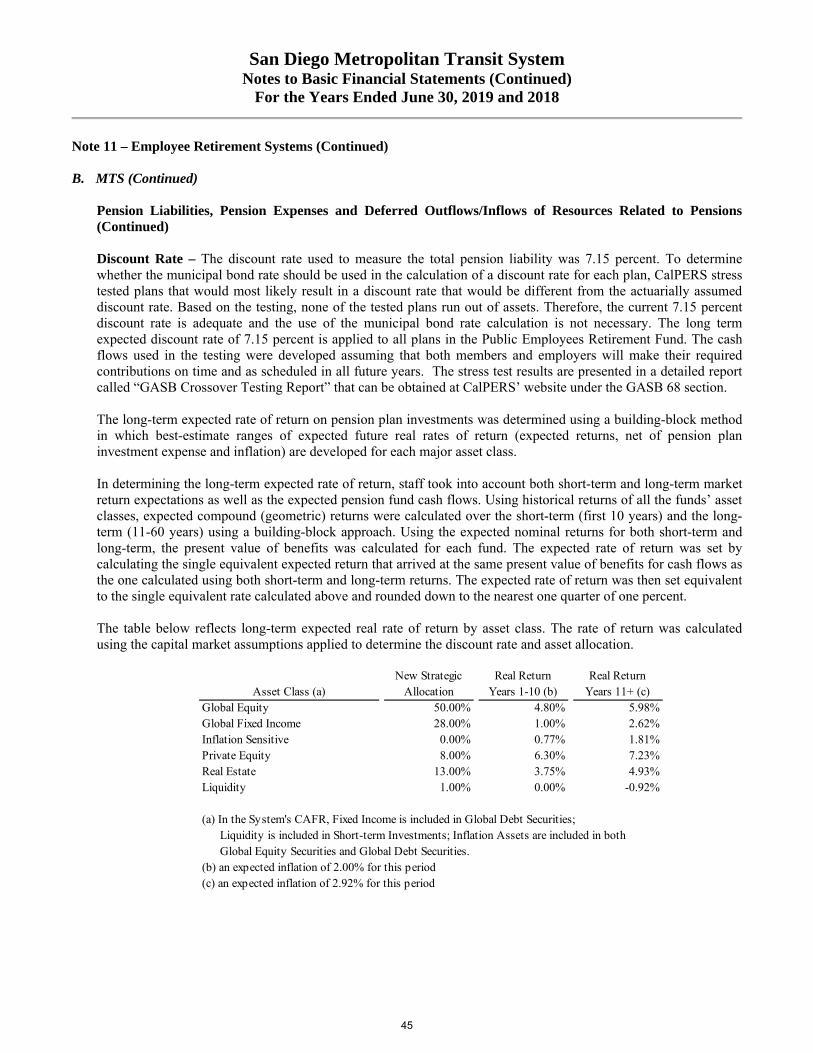
San Diego Metropolitan Transit System Notes to Basic Financial Statements (Continued)
For the Years Ended June 30, 2019 and 2018
Note 11 – Employee Retirement Systems (Continued)
B. MTS (Continued) Pension Liabilities, Pension Expenses and Deferred Outflows/Inflows of Resources Related to Pensions (Continued) Discount Rate – The discount rate used to measure the total pension liability was 7.15 percent. To determine whether the municipal bond rate should be used in the calculation of a discount rate for each plan, CalPERS stress tested plans that would most likely result in a discount rate that would be different from the actuarially assumed discount rate. Based on the testing, none of the tested plans run out of assets. Therefore, the current 7.15 percent discount rate is adequate and the use of the municipal bond rate calculation is not necessary. The long term expected discount rate of 7.15 percent is applied to all plans in the Public Employees Retirement Fund. The cash flows used in the testing were developed assuming that both members and employers will make their required contributions on time and as scheduled in all future years. The stress test results are presented in a detailed report called “GASB Crossover Testing Report” that can be obtained at CalPERS’ website under the GASB 68 section. The long-term expected rate of return on pension plan investments was determined using a building-block method in which best-estimate ranges of expected future real rates of return (expected returns, net of pension plan investment expense and inflation) are developed for each major asset class. In determining the long-term expected rate of return, staff took into account both short-term and long-term market return expectations as well as the expected pension fund cash flows. Using historical returns of all the funds’ asset classes, expected compound (geometric) returns were calculated over the short-term (first 10 years) and the long-term (11-60 years) using a building-block approach. Using the expected nominal returns for both short-term and long-term, the present value of benefits was calculated for each fund. The expected rate of return was set by calculating the single equivalent expected return that arrived at the same present value of benefits for cash flows as the one calculated using both short-term and long-term returns. The expected rate of return was then set equivalent to the single equivalent rate calculated above and rounded down to the nearest one quarter of one percent. The table below reflects long-term expected real rate of return by asset class. The rate of return was calculated using the capital market assumptions applied to determine the discount rate and asset allocation.
Asset Class (a)New Strategic
AllocationReal Return
Years 1-10 (b)Real Return
Years 11+ (c)Global Equity 50.00% 4.80% 5.98%Global Fixed Income 28.00% 1.00% 2.62%Inflation Sensitive 0.00% 0.77% 1.81%Private Equity 8.00% 6.30% 7.23%Real Estate 13.00% 3.75% 4.93%Liquidity 1.00% 0.00% -0.92%
(b) an expected inflation of 2.00% for this period(c) an expected inflation of 2.92% for this period
(a) In the System's CAFR, Fixed Income is included in Global Debt Securities; Liquidity is included in Short-term Investments; Inflation Assets are included in both Global Equity Securities and Global Debt Securities.
45

San Diego Metropolitan Transit System Notes to Basic Financial Statements (Continued)
For the Years Ended June 30, 2019 and 2018
Note 11 – Employee Retirement Systems (Continued)
B. MTS (Continued)
Sensitivity of the Proportionate Share of the Net Pension Liability to Changes in the Discount Rate The following presents MTS’s proportionate share of the net pension liability as of June 30, 2019 and 2018, calculated using the discount rate, as well as what MTS’s proportionate share of the net pension liability would be if it were calculated using a discount rate that is one percentage point lower or one percentage point higher than the current rate:
2019 2018
1% Decrease 6.15% 6.15%Net Pension Liability 20,194,220$ 20,167,504$
Current Discount Rate 7.15% 7.15%Net Pension Liability 12,982,663$ 13,418,753$
1% Increase 8.15% 8.15%Net Pension Liability 7,029,640$ 7,829,316$
Pension Plan Fiduciary Net Position – Detailed information about MTS's pension plan’s fiduciary net position is available in the separately issued CalPERS financial reports. Payable to the Pension Plan – At June 30, 2019, MTS reported a payable of $171,024 for the outstanding amount of contributions to the pension plan required for the current year compared to $154,017 for the year ended June 30, 2018.
C. SDTI 1. CalPERS Plans
Plan Description – All SDTI employees working the equivalent of 1,000 hours per fiscal year are eligible to participate in the SDTI Miscellaneous or PEPRA Miscellaneous single employer defined benefit plans administered by California Public Employees’ Retirement System (CalPERS), which acts as a common investment and administrative agent for its participating member employers. Benefit Provisions under the Plans are established by State statutes within the Public Employee’s Retirement Law. CalPERS issues publicly available reports that include a full description of the pension plans regarding benefit provisions, assumptions and membership information that can be found on the CalPERS website. Copies of the CalPERS annual financial report may be obtained from the CalPERS Executive Office – 400 P Street, Sacramento, CA 95814. Benefits Provided – CalPERS provides service retirement and disability benefits, annual cost-of-living adjustments, and death benefits to plan members and beneficiaries. Plan members include both contract and non-contract employees. Benefits are based on years of credited service, equal to one year of full time employment and can only be amended by the MTS Board of Directors.
46
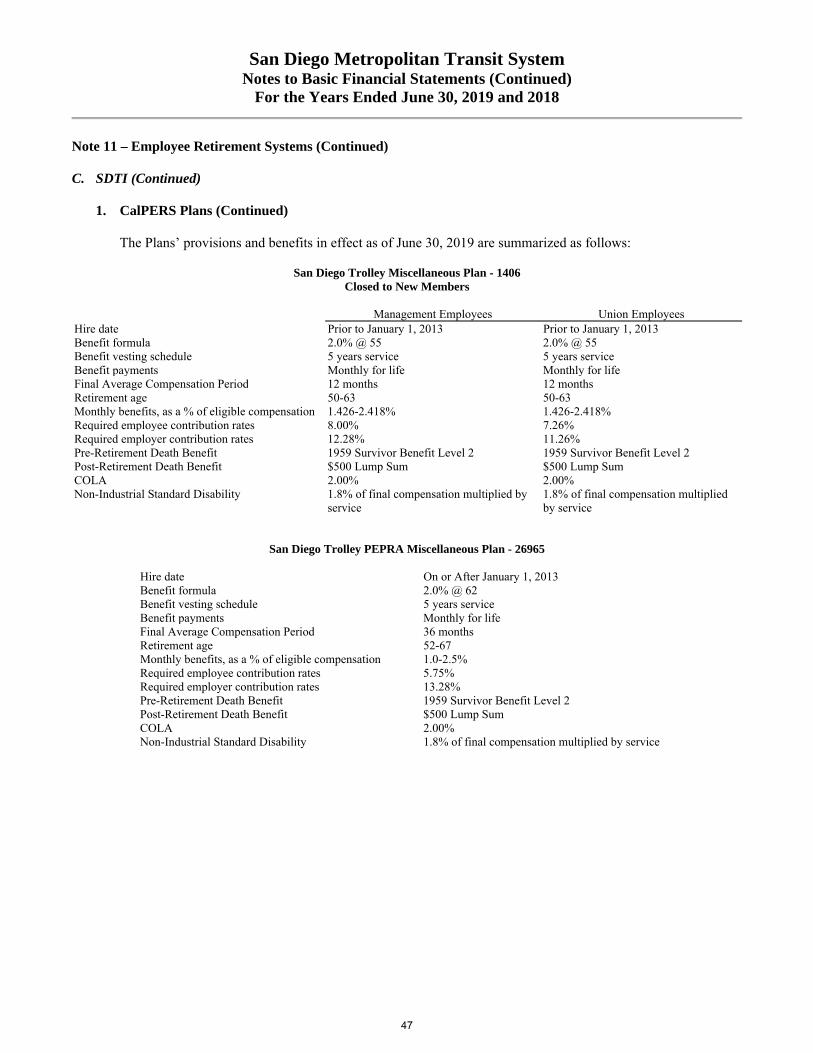
San Diego Metropolitan Transit System Notes to Basic Financial Statements (Continued)
For the Years Ended June 30, 2019 and 2018
Note 11 – Employee Retirement Systems (Continued)
C. SDTI (Continued) 1. CalPERS Plans (Continued)
The Plans’ provisions and benefits in effect as of June 30, 2019 are summarized as follows:
San Diego Trolley Miscellaneous Plan - 1406 Closed to New Members
Management Employees Union Employees Hire date Prior to January 1, 2013 Prior to January 1, 2013 Benefit formula 2.0% @ 55 2.0% @ 55 Benefit vesting schedule 5 years service 5 years service Benefit payments Monthly for life Monthly for life Final Average Compensation Period 12 months 12 months Retirement age 50-63 50-63 Monthly benefits, as a % of eligible compensation 1.426-2.418% 1.426-2.418% Required employee contribution rates 8.00% 7.26% Required employer contribution rates 12.28% 11.26% Pre-Retirement Death Benefit 1959 Survivor Benefit Level 2 1959 Survivor Benefit Level 2 Post-Retirement Death Benefit $500 Lump Sum $500 Lump Sum COLA 2.00% 2.00% Non-Industrial Standard Disability
1.8% of final compensation multiplied by service
1.8% of final compensation multiplied by service
San Diego Trolley PEPRA Miscellaneous Plan - 26965
Hire date On or After January 1, 2013 Benefit formula 2.0% @ 62 Benefit vesting schedule 5 years service Benefit payments Monthly for life Final Average Compensation Period 36 months Retirement age 52-67 Monthly benefits, as a % of eligible compensation 1.0-2.5% Required employee contribution rates 5.75% Required employer contribution rates 13.28% Pre-Retirement Death Benefit 1959 Survivor Benefit Level 2 Post-Retirement Death Benefit $500 Lump Sum COLA 2.00% Non-Industrial Standard Disability 1.8% of final compensation multiplied by service
47
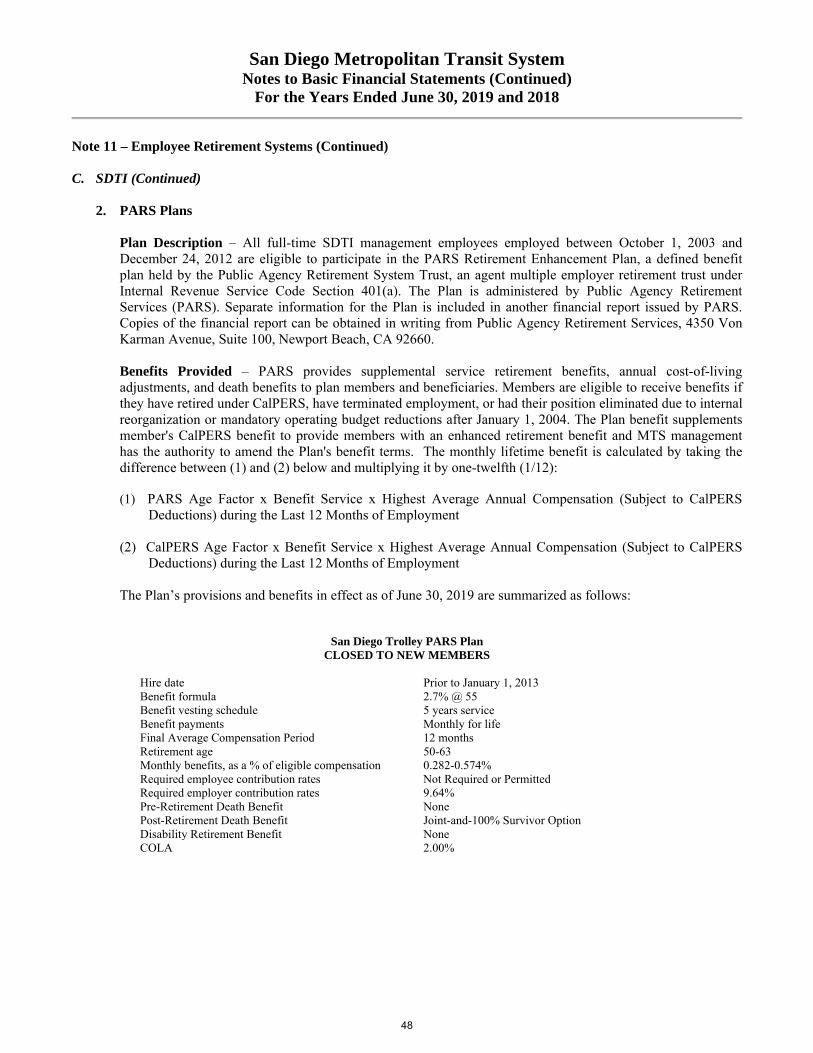
San Diego Metropolitan Transit System Notes to Basic Financial Statements (Continued)
For the Years Ended June 30, 2019 and 2018
Note 11 – Employee Retirement Systems (Continued)
C. SDTI (Continued)
2. PARS Plans Plan Description – All full-time SDTI management employees employed between October 1, 2003 and December 24, 2012 are eligible to participate in the PARS Retirement Enhancement Plan, a defined benefit plan held by the Public Agency Retirement System Trust, an agent multiple employer retirement trust under Internal Revenue Service Code Section 401(a). The Plan is administered by Public Agency Retirement Services (PARS). Separate information for the Plan is included in another financial report issued by PARS. Copies of the financial report can be obtained in writing from Public Agency Retirement Services, 4350 Von Karman Avenue, Suite 100, Newport Beach, CA 92660. Benefits Provided – PARS provides supplemental service retirement benefits, annual cost-of-living adjustments, and death benefits to plan members and beneficiaries. Members are eligible to receive benefits if they have retired under CalPERS, have terminated employment, or had their position eliminated due to internal reorganization or mandatory operating budget reductions after January 1, 2004. The Plan benefit supplements member's CalPERS benefit to provide members with an enhanced retirement benefit and MTS management has the authority to amend the Plan's benefit terms. The monthly lifetime benefit is calculated by taking the difference between (1) and (2) below and multiplying it by one-twelfth (1/12):
(1) PARS Age Factor x Benefit Service x Highest Average Annual Compensation (Subject to CalPERS
Deductions) during the Last 12 Months of Employment (2) CalPERS Age Factor x Benefit Service x Highest Average Annual Compensation (Subject to CalPERS
Deductions) during the Last 12 Months of Employment The Plan’s provisions and benefits in effect as of June 30, 2019 are summarized as follows:
San Diego Trolley PARS Plan CLOSED TO NEW MEMBERS
Hire date Prior to January 1, 2013 Benefit formula 2.7% @ 55 Benefit vesting schedule 5 years service Benefit payments Monthly for life Final Average Compensation Period 12 months Retirement age 50-63 Monthly benefits, as a % of eligible compensation 0.282-0.574% Required employee contribution rates Not Required or Permitted Required employer contribution rates 9.64% Pre-Retirement Death Benefit None Post-Retirement Death Benefit Joint-and-100% Survivor Option Disability Retirement Benefit None COLA 2.00%
48

San Diego Metropolitan Transit System Notes to Basic Financial Statements (Continued)
For the Years Ended June 30, 2019 and 2018
Note 11 – Employee Retirement Systems (Continued)
C. SDTI (Continued) Employees Covered – At June 30, 2019 and 2018 (measurement dates 2018 and 2017), the following employees were covered by the benefit terms for each Plan:
2019 2018 2019 2018
Inactive employees or beneficiaries currently receiving benefits 241 241 43 45Inactive employees entitled to but not yet receiving benefits 85 92 0 0Active employees 548 549 53 54
*SDTI PEPRA Plan is included in the SDTI Miscellaneous Plan June 30, 2017 valuation report.
PARS PlanCalPERS Plan
Contributions 1. CalPERS Plans
Section 20814(c) of the California Public Employees’ Retirement Law (PERL) requires that the employer contribution rates for all public employers be determined on an annual basis by the actuary and shall be effective on the July 1 following notice of a change in the rate. Funding contributions for both Plans are determined annually on an actuarial basis as of June 30 by CalPERS. The actuarially determined rate is the estimated amount necessary to finance the costs of benefits earned by employees during the year, with an additional amount to finance any unfunded accrued liability. SDTI is required to contribute the difference between the actuarially determined rate and the contribution rate of employees. For the years ended June 30, 2019 and 2018 (measurement dates 2018 and 2017), the active employee contribution rates and average employer contribution rates were as follows:
Employee Employer Employee Employer
SDTI Miscellaneous Plan 1406 - Management EE 8.00% 10.53% 8.00% 9.85%SDTI Miscellaneous Plan 1406 - Union EE 7.26% 11.26% 7.00% 10.85%SDTI Miscellaneous PEPRA Plan 26965 5.75% 11.53% 5.75% 10.85%
2019 2018
For the years June 30, 2019 and 2018 (measurement dates 2018 and 2017), the contributions recognized as part of pension expense were:
2019 2018
3,342,623$ 2,835,680$ 2,034,672 1,806,506
Contributions - employerContributions - employee
49
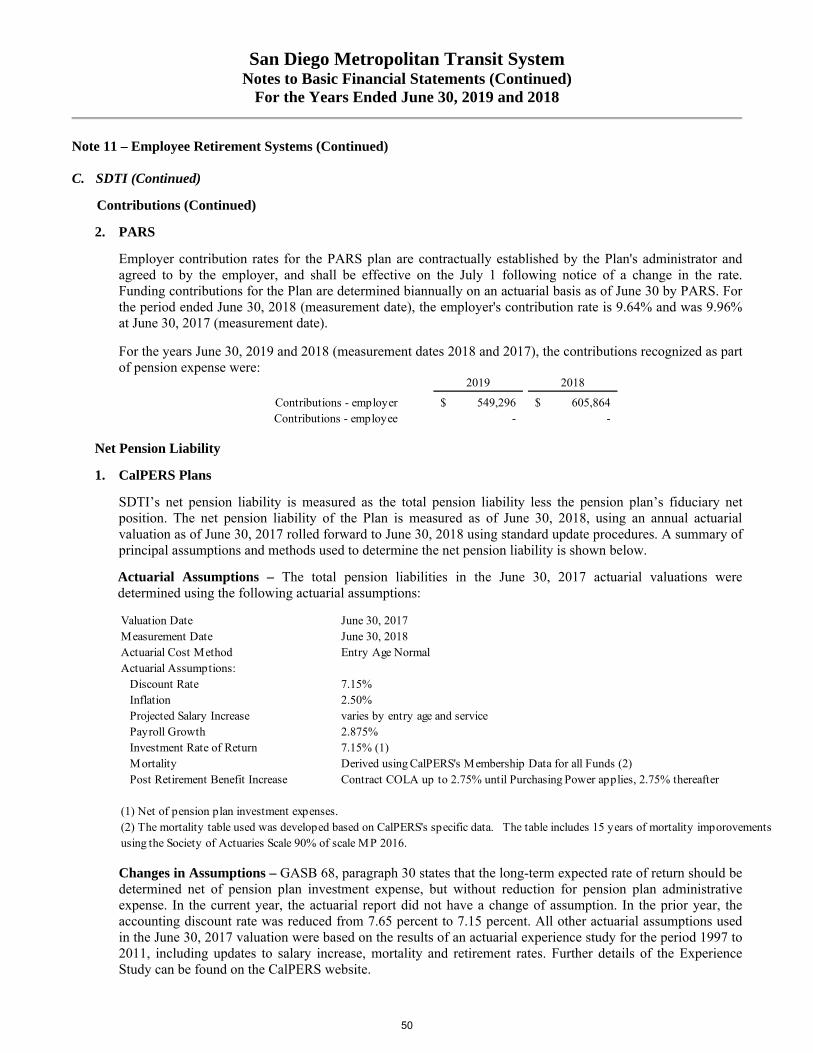
San Diego Metropolitan Transit System Notes to Basic Financial Statements (Continued)
For the Years Ended June 30, 2019 and 2018
Note 11 – Employee Retirement Systems (Continued)
C. SDTI (Continued)
Contributions (Continued)
2. PARS
Employer contribution rates for the PARS plan are contractually established by the Plan's administrator and agreed to by the employer, and shall be effective on the July 1 following notice of a change in the rate. Funding contributions for the Plan are determined biannually on an actuarial basis as of June 30 by PARS. For the period ended June 30, 2018 (measurement date), the employer's contribution rate is 9.64% and was 9.96% at June 30, 2017 (measurement date).
For the years June 30, 2019 and 2018 (measurement dates 2018 and 2017), the contributions recognized as part of pension expense were:
2019 2018
549,296$ 605,864$ - -
Contributions - employerContributions - employee
Net Pension Liability
1. CalPERS Plans
SDTI’s net pension liability is measured as the total pension liability less the pension plan’s fiduciary net position. The net pension liability of the Plan is measured as of June 30, 2018, using an annual actuarial valuation as of June 30, 2017 rolled forward to June 30, 2018 using standard update procedures. A summary of principal assumptions and methods used to determine the net pension liability is shown below.
Actuarial Assumptions – The total pension liabilities in the June 30, 2017 actuarial valuations were determined using the following actuarial assumptions: Valuation Date June 30, 2017Measurement Date June 30, 2018Actuarial Cost Method Entry Age NormalActuarial Assumptions:
Discount Rate 7.15%Inflation 2.50%Projected Salary IncreasePayroll Growth 2.875%Investment Rate of Return 7.15% (1)MortalityPost Retirement Benefit Increase
Derived using CalPERS's Membership Data for all Funds (2)Contract COLA up to 2.75% until Purchasing Power applies, 2.75% thereafter
(1) Net of pension plan investment expenses.(2) The mortality table used was developed based on CalPERS's specific data. The table includes 15 years of mortality imporovements using the Society of Actuaries Scale 90% of scale MP 2016.
varies by entry age and service
Changes in Assumptions – GASB 68, paragraph 30 states that the long-term expected rate of return should be determined net of pension plan investment expense, but without reduction for pension plan administrative expense. In the current year, the actuarial report did not have a change of assumption. In the prior year, the accounting discount rate was reduced from 7.65 percent to 7.15 percent. All other actuarial assumptions used in the June 30, 2017 valuation were based on the results of an actuarial experience study for the period 1997 to 2011, including updates to salary increase, mortality and retirement rates. Further details of the Experience Study can be found on the CalPERS website.
50

San Diego Metropolitan Transit System Notes to Basic Financial Statements (Continued)
For the Years Ended June 30, 2019 and 2018
Note 11 – Employee Retirement Systems (Continued)
C. SDTI (Continued)
Net Pension Liability (Continued) 1. CalPERS Plans (Continued)
Discount Rate – The discount rate used to measure the total pension liability was 7.15 percent. To determine whether the municipal bond rate should be used in the calculation of a discount rate for each plan, CalPERS stress tested plans that would most likely result in a discount rate that would be different from the actuarially assumed discount rate. Based on the testing, none of the tested plans run out of assets. Therefore, the current 7.15 percent discount rate is adequate and the use of the municipal bond rate calculation is not necessary. The long term expected discount rate of 7.15 percent is applied to all plans in the Public Employees Retirement Fund (PERF). The cash flows used in the testing were developed assuming that both members and employers will make their required contributions on time and as scheduled in all future years. The stress test results are presented in a detailed report called “GASB Crossover Testing Report” that can be obtained at CalPERS’ website under the GASB 68 section. The long-term expected rate of return on pension plan investments was determined using a building-block method in which best-estimate ranges of expected future real rates of return (expected returns, net of pension plan investment expense and inflation) are developed for each major asset class. In determining the long-term expected rate of return, staff took into account both short-term and long-term market return expectations as well as the expected pension fund cash flows. Using historical returns of all the funds’ asset classes, expected compound (geometric) returns were calculated over the short-term (first 10 years) and the long-term (11-60 years) using a building-block approach. Using the expected nominal returns for both short-term and long-term, the present value of benefits was calculated for each fund. The expected rate of return was set by calculating the single equivalent expected return that arrived at the same present value of benefits for cash flows as the one calculated using both short-term and long-term returns. The expected rate of return was then set equivalent to the single equivalent rate calculated above and rounded down to the nearest one quarter of one percent. The table below reflects long-term expected real rate of return by asset class. The rate of return was calculated using the capital market assumptions applied to determine the discount rate and asset allocation.
Asset Class (a)New Strategic
AllocationReal Return
Years 1-10 (b)Real Return
Years 11+ (c)Global Equity 50.00% 4.80% 5.98%Global Fixed Income 28.00% 1.00% 2.62%Inflation Sensitive 0.00% 0.77% 1.81%Private Equity 8.00% 6.30% 7.23%Real Estate 13.00% 3.75% 4.93%Liquidity 1.00% 0.00% -0.92%
Global Equity Securities and Global Debt Securities. Liquidity is included in Short-term Investments; Inflation Assets are included in both(a) In the System's CAFR, Fixed Income is included in Global Debt Securities;
(b) an expected inflation of 2.00% for this period(c) an expected inflation of 2.92% for this period
51

San Diego Metropolitan Transit System Notes to Basic Financial Statements (Continued)
For the Years Ended June 30, 2019 and 2018
Note 11 – Employee Retirement Systems (Continued)
C. SDTI (Continued)
Net Pension Liability (Continued) 2. PARS Plan
The net pension liability for the PARS Plan is measured as the total pension liability, less the pension plan’s fiduciary net position. The net pension liability of the Plan is measured as of June 30, 2018, using an actuarial valuation as of June 30, 2017 rolled forward to June 30, 2018 using standard update procedures. A summary of principal assumptions and methods used to determine the net pension liability is shown below. Actuarial Assumptions – The total pension liability in the June 30, 2017 actuarial valuation was determined using the following actuarial assumptions: Valuation Date June 30, 2017Measurement Date June 30, 2018Actuarial Cost Method Entry Age NormalActuarial Assumptions:
Discount Rate 6.50%Inflation 2.75%Salary Increases Including InflationPayroll Growth 3.00%Investment Rate of Return 6.50%Pre-Retirement Mortality
Post Retirement Benefit Increase
Graded rates based on years of services, 3.50% after 30 years of services
Consistent with Non-Industrial rates used to value the Miscellaneous CALPERS Pension Plans
CalPERS Miscellaneous Public Agency rates for "2.7% at 55" plans. Increased 20% at each age.
Change in Assumptions – In the current year, discount rate and investment rate of return were lowered from 7.00% to 6.50%. Discount Rate – The discount rate used to measure the total pension liability was 6.50 percent. A formal cash flow projection was not performed as described under Paragraph 27 of GASB Statement 68. However, Paragraph 29 allows for alternative methods to confirm the sufficiency of the Net Position if the evaluations “can be made with sufficient reliability without a separate projection of cash flows into and out of the pension plan…” In our professional judgment, adherence to the actuarial funding policy described above will result in the pension plan’s projected Fiduciary Net Position being greater than or equal to the benefit payments projected for each future period. Therefore, the long-term expected rate of return on Plan investments was applied to all periods of projected benefit payments to determine the Total Pension Liability. The best estimate for the long-term expected rate of return of 6.50 percent was determined by adding expected inflation to expected long-term real returns and reflecting expected volatility and correlation. The rate of return was calculated using the capital market assumptions applied to determine the discount rate and asset allocation. The table below reflects long-term expected real rate of return presented as arithmetic and geometric means by asset class.
52

San Diego Metropolitan Transit System Notes to Basic Financial Statements (Continued)
For the Years Ended June 30, 2019 and 2018
Note 11 – Employee Retirement Systems (Continued)
C. SDTI (Continued) Net Pension Liability (Continued) 2. PARS Plan (Continued)
Asset Class Target Allocation
Long-Term Expected
Arithmetic Real Rate of Return (a)
Long-Term Expected
Geometric Real Rate of Return (b)
U.S. Cash 2.82% 0.31% 0.31%U.S. Core Fixed Income 36.21% 2.14% 2.02%U.S. Equity Market 45.26% 4.59% 3.32%Foreign Developed Equity 9.95% 5.52% 3.91%Emerging Market Equities 4.07% 7.82% 4.59%U.S. REITs 1.69% 5.04% 3.27%
(a) Assumed inflation: 2.32% mean and 1.85% standard deviation
(b) Assumed inflation: 2.30% mean and 1.85% standard deviation
Sensitivity of the Net Pension Liability to Changes in the Discount Rate The following presents SDTI’s net pension liability at June 30, 2019 and 2018, calculated using the discount rate, as well as what SDTI’s net pension liability would be if it were calculated using a discount rate that is one percentage point lower or one percentage point higher than the current rate:
2019 2018 2019 2018
1% Decrease 6.15% 6.15% 5.50% 6.00%Net Pension Liability 51,421,098$ 52,557,834$ 2,795,751$ 3,175,995$
Current Discount Rate 7.15% 7.15% 6.50% 7.00%Net Pension Liability 29,552,949$ 31,326,755$ 1,766,423$ 2,150,499$
1% Increase 8.15% 8.15% 7.50% 8.00%Net Pension Liability 11,540,308$ 13,888,356$ 843,767$ 1,293,730$
PARS PlanCalPERS Plan
53
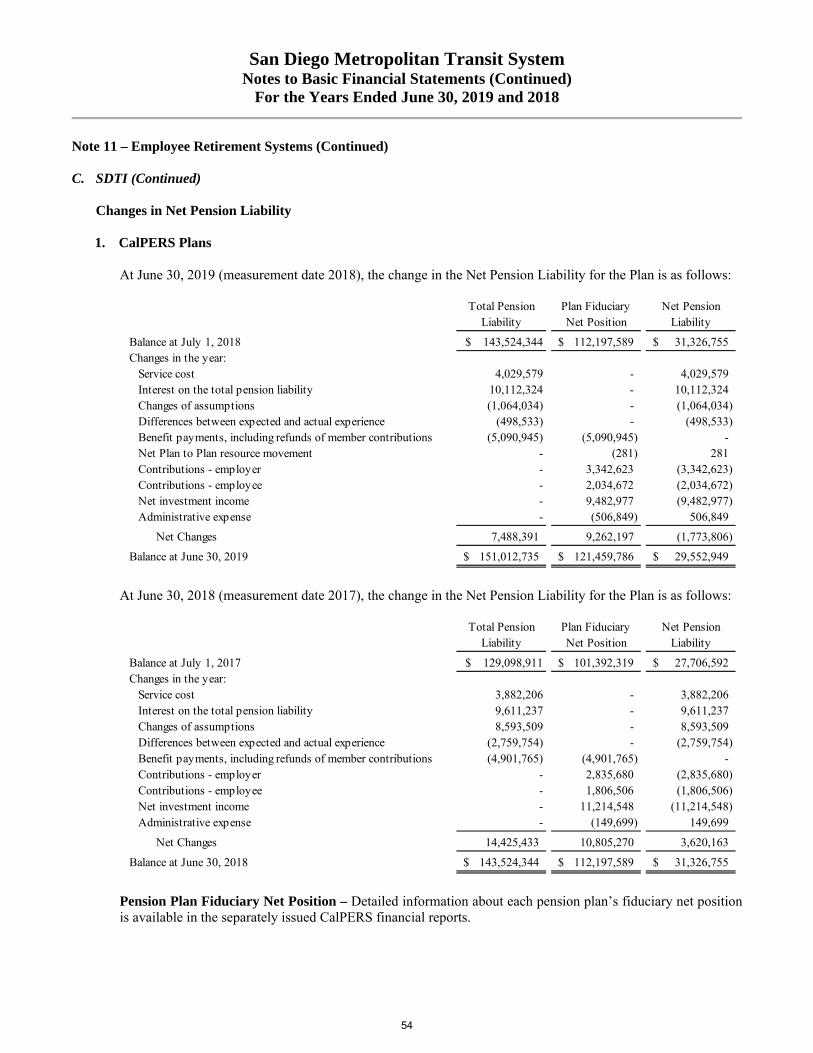
San Diego Metropolitan Transit System Notes to Basic Financial Statements (Continued)
For the Years Ended June 30, 2019 and 2018
Note 11 – Employee Retirement Systems (Continued)
C. SDTI (Continued)
Changes in Net Pension Liability 1. CalPERS Plans
At June 30, 2019 (measurement date 2018), the change in the Net Pension Liability for the Plan is as follows:
Total Pension Plan Fiduciary Net Pension
Liability Net Position Liability
Balance at July 1, 2018 $ 143,524,344 112,197,589$ 31,326,755$ Changes in the year:
4,029,579 - 4,029,579 10,112,324 - 10,112,324 (1,064,034) - (1,064,034) (498,533) - (498,533) (5,090,945) (5,090,945) - - (281) 281 - 3,342,623 (3,342,623) - 2,034,672 (2,034,672) - 9,482,977 (9,482,977) - (506,849) 506,849
Net Changes 7,488,391 9,262,197 (1,773,806)
Balance at June 30, 2019 151,012,735$ 121,459,786$ 29,552,949$
Service costInterest on the total pension liabilityChanges of assumptionsDifferences between expected and actual experienceBenefit payments, including refunds of member contributions
Contributions - employerContributions - employeeNet investment incomeAdministrative expense
Net Plan to Plan resource movement
At June 30, 2018 (measurement date 2017), the change in the Net Pension Liability for the Plan is as follows:
Total Pension Plan Fiduciary Net PensionLiability Net Position Liability
Balance at July 1, 2017 $ 129,098,911 101,392,319$ 27,706,592$ Changes in the year:
3,882,206 - 3,882,206 9,611,237 - 9,611,237 8,593,509 - 8,593,509 (2,759,754) - (2,759,754) (4,901,765) (4,901,765) - - 2,835,680 (2,835,680) - 1,806,506 (1,806,506) - 11,214,548 (11,214,548) - (149,699) 149,699
Net Changes 14,425,433 10,805,270 3,620,163
Balance at June 30, 2018 143,524,344$ 112,197,589$ 31,326,755$
Contributions - employeeNet investment incomeAdministrative expense
Service costInterest on the total pension liabilityChanges of assumptionsDifferences between expected and actual experienceBenefit payments, including refunds of member contributionsContributions - employer
Pension Plan Fiduciary Net Position – Detailed information about each pension plan’s fiduciary net position is available in the separately issued CalPERS financial reports.
54

San Diego Metropolitan Transit System Notes to Basic Financial Statements (Continued)
For the Years Ended June 30, 2019 and 2018
Note 11 – Employee Retirement Systems (Continued)
C. SDTI (Continued) Changes in Net Pension Liability 2. PARS Plan
At June 30, 2019 (measurement date 2018), the change in the Net Pension Liability for the Plan is as follows:
Total Pension Plan Fiduciary Net Pension
Liability Net Position Liability
Balance at July 1, 2018 $ 8,346,429 6,195,930$ 2,150,499$ Changes in the year:
198,627 - 198,627 587,363 - 587,363 473,927 - 473,927 (652,788) - (652,788) (313,613) (313,613) - - 549,296 (549,296) - - - - 458,921 (458,921) - (17,012) 17,012
Net Changes 293,516 677,592 (384,076)
Balance at June 30, 2019 8,639,945$ 6,873,522$ 1,766,423$
Service costInterest on the total pension liabilityChanges of assumptionsDifferences between expected and actual experienceBenefit payments, including refunds of member contributionsContributions - employerContributions - employeeNet investment incomeAdministrative expense
At June 30, 2018 (measurement date 2017), the change in the Net Pension Liability for the Plan is as follows:
Total Pension Plan Fiduciary Net PensionLiability Net Position Liability
Balance at July 1, 2017 $ 7,862,504 5,267,085$ 2,595,419$ Changes in the year:
230,296 - 230,296 556,089 - 556,089 - - - - - -
(302,460) (302,460) - - 605,864 (605,864) - - - - 638,858 (638,858) - (13,417) 13,417
Net Changes 483,925 928,845 (444,920)
Balance at June 30, 2018 8,346,429$ 6,195,930$ 2,150,499$
Contributions - employer
Service costInterest on the total pension liabilityChanges of assumptionsDifferences between expected and actual experienceBenefit payments, including refunds of member contributions
Contributions - employeeNet investment incomeAdministrative expense
Pension Plan Fiduciary Net Position – Detailed information about the PARS Plan’s fiduciary net position is available in the separately issued financial reports.
55

San Diego Metropolitan Transit System Notes to Basic Financial Statements (Continued)
For the Years Ended June 30, 2019 and 2018
Note 11 – Employee Retirement Systems (Continued)
C. SDTI (Continued) Pension Expenses and Deferred Outflows/Inflows of Resources Related to Pensions For the year ended June 30, 2019 and 2018, SDTI recognized pension expense of $5,173,520 and $5,919,396, respectively. At June 30, 2019 and 2018, SDTI reported deferred outflows of resources and deferred inflows of resources related to pensions from the following sources:
Deferred Deferred Deferred Deferred Outflows Inflows Outflows Inflows
of Resources of Resources of Resources of Resources
Contributions made after measurement date 3,824,864$ -$ 3,266,081$ -$
Differences between expected and actual experience 158,950 (2,162,417) 231,199 (2,423,342)
Changes in assumptions 5,085,955 (1,436,635) 6,839,732 (1,011,002)
Net differences between projected and actual earnings on pension plan investments 285,018 - 1,495,441 -
Total 9,354,787$ (3,599,052)$ 11,832,453$ (3,434,344)$
Deferred Deferred Deferred Deferred Outflows Inflows Outflows Inflows
of Resources of Resources of Resources of Resources
Contributions made after measurement date 435,748$ -$ 539,350$ -$
Differences between expected and actual experience - (487,781) - (95,439)
Changes in assumptions 426,943 - 184,933 -
Net differences between projected and actual earnings on pension plan investments 40,356 - 128,350 -
Total 903,047$ (487,781)$ 852,633$ (95,439)$
2019 2018
2019 2018
CalPERS Plans
PARS Plan
The combined $4,260,612 reported as deferred outflows of resources related to contributions subsequent to the measurement date for the two plans will be recognized as a reduction of the net pension liability in the year ended June 30, 2020 compared to $3,805,431 for the previous year.
56

San Diego Metropolitan Transit System Notes to Basic Financial Statements (Continued)
For the Years Ended June 30, 2019 and 2018
Note 11 – Employee Retirement Systems (Continued)
C. SDTI (Continued) Pension Expenses and Deferred Outflows/Inflows of Resources Related to Pensions (Continued) As of the measurement date, June 30, 2018, other amounts reported as deferred outflows of resources and deferred inflows of resources related to pensions will be recognized as pension expense as follows:
Year Ended SDTI CalPERS SDTI PARSJune 30 Plan Plan
2020 1,796,861$ 41,782$ 2021 1,049,660 (3,154) 2022 (331,015) (55,572) 2023 (584,635) (3,538) 2024 - -
Total 1,930,871$ (20,482)$
In the previous year, other amounts reported as deferred outflows of resources and deferred inflows of resources related to pensions will be recognized as pension expense as follows:
Year Ended SDTI CalPERS SDTI PARSJune 30 Plan Plan
2019 766,947$ 106,995$ 2020 2,413,386 106,994 2021 1,666,185 55,891 2022 285,510 (52,036) 2023 - -
Total 5,132,028$ 217,844$
Payable to the Pension Plan At June 30, 2019, SDTI reported a payable of $343,069 to CalPERS and $48,765 to PARS for the outstanding amount of contributions to the pension plans required for the fiscal year compared to $446,881 payable to CalPERS and $75,283 payable to PARS for the year ended June 30, 2018.
57
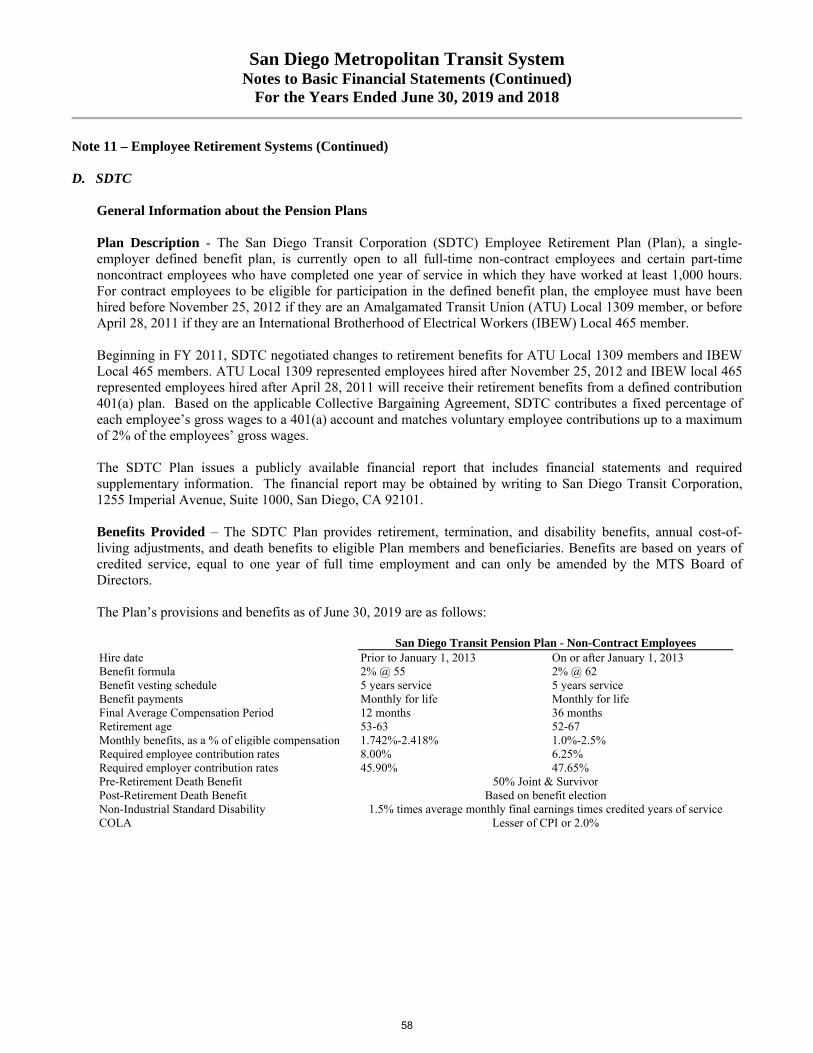
San Diego Metropolitan Transit System Notes to Basic Financial Statements (Continued)
For the Years Ended June 30, 2019 and 2018
Note 11 – Employee Retirement Systems (Continued) D. SDTC
General Information about the Pension Plans
Plan Description - The San Diego Transit Corporation (SDTC) Employee Retirement Plan (Plan), a single-employer defined benefit plan, is currently open to all full-time non-contract employees and certain part-time noncontract employees who have completed one year of service in which they have worked at least 1,000 hours. For contract employees to be eligible for participation in the defined benefit plan, the employee must have been hired before November 25, 2012 if they are an Amalgamated Transit Union (ATU) Local 1309 member, or before April 28, 2011 if they are an International Brotherhood of Electrical Workers (IBEW) Local 465 member. Beginning in FY 2011, SDTC negotiated changes to retirement benefits for ATU Local 1309 members and IBEW Local 465 members. ATU Local 1309 represented employees hired after November 25, 2012 and IBEW local 465 represented employees hired after April 28, 2011 will receive their retirement benefits from a defined contribution 401(a) plan. Based on the applicable Collective Bargaining Agreement, SDTC contributes a fixed percentage of each employee’s gross wages to a 401(a) account and matches voluntary employee contributions up to a maximum of 2% of the employees’ gross wages. The SDTC Plan issues a publicly available financial report that includes financial statements and required supplementary information. The financial report may be obtained by writing to San Diego Transit Corporation, 1255 Imperial Avenue, Suite 1000, San Diego, CA 92101.
Benefits Provided – The SDTC Plan provides retirement, termination, and disability benefits, annual cost-of-living adjustments, and death benefits to eligible Plan members and beneficiaries. Benefits are based on years of credited service, equal to one year of full time employment and can only be amended by the MTS Board of Directors. The Plan’s provisions and benefits as of June 30, 2019 are as follows:
San Diego Transit Pension Plan - Non-Contract Employees Hire date Prior to January 1, 2013 On or after January 1, 2013 Benefit formula 2% @ 55 2% @ 62 Benefit vesting schedule 5 years service 5 years service Benefit payments Monthly for life Monthly for life Final Average Compensation Period 12 months 36 months Retirement age 53-63 52-67 Monthly benefits, as a % of eligible compensation 1.742%-2.418% 1.0%-2.5% Required employee contribution rates 8.00% 6.25% Required employer contribution rates 45.90% 47.65% Pre-Retirement Death Benefit 50% Joint & Survivor Post-Retirement Death Benefit Based on benefit election Non-Industrial Standard Disability 1.5% times average monthly final earnings times credited years of service COLA Lesser of CPI or 2.0%
58

San Diego Metropolitan Transit System Notes to Basic Financial Statements (Continued)
For the Years Ended June 30, 2019 and 2018
Note 11 – Employee Retirement Systems (Continued)
D. SDTC (Continued) General Information about the Pension Plans (Continued)
SDTC Contract Employees ATU - Closed Plan IBEW - Closed Plan
Hire date Prior to November 25, 2012 Prior to January 1, 2013 Benefit formula 2% @ 55 2% @ 55 Benefit vesting schedule 5 years service 5 years service Benefit payments Monthly for life Monthly for life Final Average Compensation Period 36 months 36 months Retirement age 53-63 55-65 Monthly benefits, as a % of eligible compensation 1.742%-2.418% 2.0%-2.418% Required employee contribution rates 8.00% 8.00% Required employer contribution rates 45.90% 45.90% Pre-Retirement Death Benefit 50% Joint & Survivor Post-Retirement Death Benefit Based on benefit election Disability 1.5% times average monthly final earnings times credited years of service
Employees Covered – At June 30, 2019 and 2018 (measurement date 2018 and 2017), the following employees were covered by the benefit terms for the Plan:
2019 2018
Inactive employees or beneficiaries currently receiving benefits 975 952Inactive employees entitled to but not yet receiving benefits 230 214Active employees 462 513
Contributions – Section 20814(c) of the California Public Employees’ Retirement Law (PERL) requires that the employer contribution rates for all public employers be determined on an annual basis by the actuary and shall be effective on the July 1 following notice of a change in the rate. The employer is required to contribute the difference between the actuarially determined rate and the contribution rate of employees. For the period ended June 30, 2018 (measurement date), the active employee contribution rate is 6.25- 8.00% of annual pay, and the average employer’s contribution rate is 46.34% of annual payroll compared to 6.25-8.00% and 43.52% for the previous year. For the year ended June 30, 2019 and 2018 (measurement dates 2018 and 2017), the contributions recognized as part of pension expense for the Plan were as follows:
2019 2018
13,020,223$ 12,649,101$ 1,751,616 2,047,593
Contributions - employerContributions - employee
59
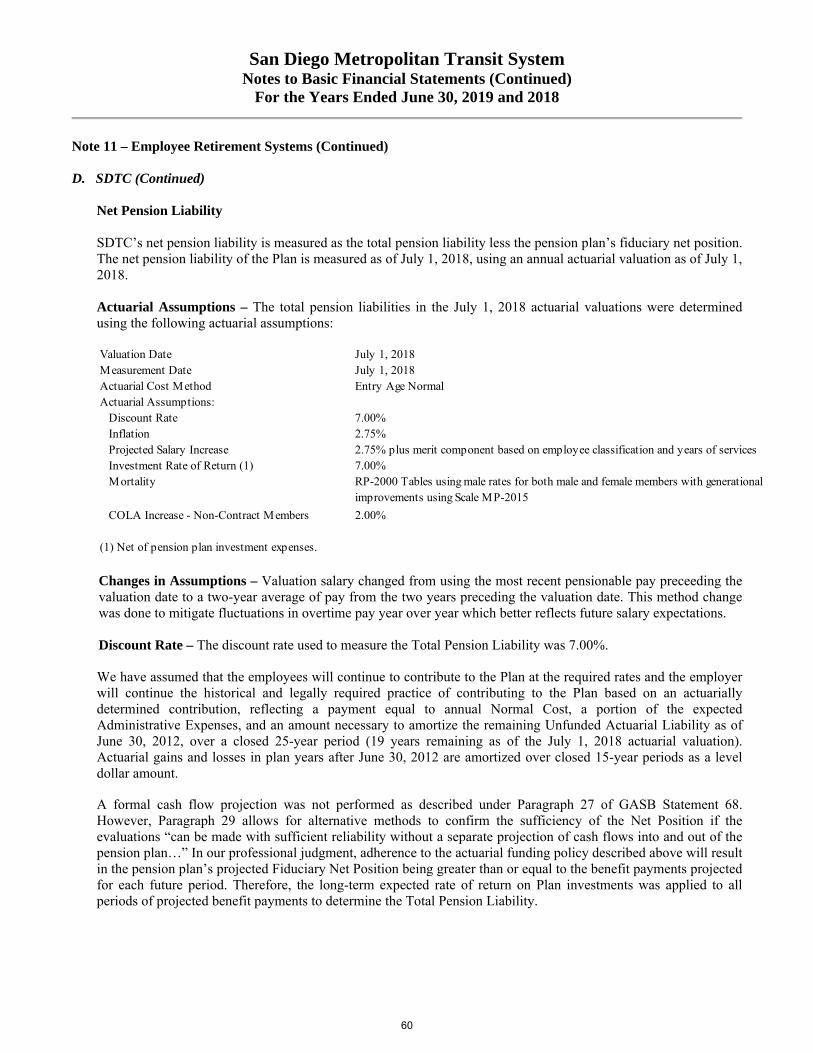
San Diego Metropolitan Transit System Notes to Basic Financial Statements (Continued)
For the Years Ended June 30, 2019 and 2018
Note 11 – Employee Retirement Systems (Continued)
D. SDTC (Continued) Net Pension Liability SDTC’s net pension liability is measured as the total pension liability less the pension plan’s fiduciary net position. The net pension liability of the Plan is measured as of July 1, 2018, using an annual actuarial valuation as of July 1, 2018. Actuarial Assumptions – The total pension liabilities in the July 1, 2018 actuarial valuations were determined using the following actuarial assumptions: Valuation Date July 1, 2018Measurement Date July 1, 2018Actuarial Cost Method Entry Age NormalActuarial Assumptions:
Discount Rate 7.00%Inflation 2.75%Projected Salary IncreaseInvestment Rate of Return (1) 7.00%Mortality
COLA Increase - Non-Contract Members 2.00%
2.75% plus merit component based on employee classification and years of services
RP-2000 Tables using male rates for both male and female members with generational improvements using Scale MP-2015
(1) Net of pension plan investment expenses.
Changes in Assumptions – Valuation salary changed from using the most recent pensionable pay preceeding the valuation date to a two-year average of pay from the two years preceding the valuation date. This method change was done to mitigate fluctuations in overtime pay year over year which better reflects future salary expectations. Discount Rate – The discount rate used to measure the Total Pension Liability was 7.00%.
We have assumed that the employees will continue to contribute to the Plan at the required rates and the employer will continue the historical and legally required practice of contributing to the Plan based on an actuarially determined contribution, reflecting a payment equal to annual Normal Cost, a portion of the expected Administrative Expenses, and an amount necessary to amortize the remaining Unfunded Actuarial Liability as of June 30, 2012, over a closed 25-year period (19 years remaining as of the July 1, 2018 actuarial valuation). Actuarial gains and losses in plan years after June 30, 2012 are amortized over closed 15-year periods as a level dollar amount. A formal cash flow projection was not performed as described under Paragraph 27 of GASB Statement 68. However, Paragraph 29 allows for alternative methods to confirm the sufficiency of the Net Position if the evaluations “can be made with sufficient reliability without a separate projection of cash flows into and out of the pension plan…” In our professional judgment, adherence to the actuarial funding policy described above will result in the pension plan’s projected Fiduciary Net Position being greater than or equal to the benefit payments projected for each future period. Therefore, the long-term expected rate of return on Plan investments was applied to all periods of projected benefit payments to determine the Total Pension Liability.
60

San Diego Metropolitan Transit System Notes to Basic Financial Statements (Continued)
For the Years Ended June 30, 2019 and 2018
Note 11 – Employee Retirement Systems (Continued)
D. SDTC (Continued)
Net Pension Liability (Continued) According to Paragraph 30 of GASB Statement 68, the long-term expected rate of return should be determined net of pension plan investment expenses but without reduction for pension plan administrative expenses. The 7.00% investment return assumption used in the Total Pension Liability is net of investment expenses only. The table below reflects long-term expected real rate of return by asset class. The critical inputs of the asset allocation model are the expected risk, return and correlations of different asset classes.
Asset ClassStrategic
AllocationReal Return Years 1-10
Real Return Years 11+
United States Equity 25.00% 4.30% 4.30%International Equity 20.00% 6.40% 6.40%Fixed Income 32.50% 1.25% 1.25%Alternatives (Multi-Asset) 22.50% 3.75% 3.75%
Sensitivity of the Net Pension Liability to Changes in the Discount Rate The following presents the net pension liability for the SDTC Plan as of June 30, 2019 and 2018, calculated using the discount rate, as well as what SDTC’s net pension liability would be if it were calculated using a discount rate that is one percentage point lower or one percentage point higher than the current rate:
2019 2018
1% Decrease 6.00% 6.00%Net Pension Liability 165,940,641$ 166,180,628$
Current Discount Rate 7.00% 7.00%Net Pension Liability 134,061,376$ 134,375,705$
1% Increase 8.00% 8.00%Net Pension Liability 106,995,199$ 107,378,009$
61

San Diego Metropolitan Transit System Notes to Basic Financial Statements (Continued)
For the Years Ended June 30, 2019 and 2018
Note 11 – Employee Retirement Systems (Continued)
D. SDTC (Continued) Changes in Net Pension Liability At June 30, 2019 (measurement date 2018), the change in the Net Pension Liability for the SDTC Plan is as follows:
Total Pension Plan Fiduciary Net PensionLiability Net Position Liability
Balance at July 1, 2018 296,010,712$ 161,635,007$ 134,375,705$ Changes in the year:
3,559,738 - 3,559,738 20,325,978 - 20,325,978 (640,322) - (640,322) (240,474) - (240,474) (18,715,199) (18,715,199) - - 13,020,223 (13,020,223) - 1,751,616 (1,751,616) - 8,792,300 (8,792,300) - (244,890) 244,890
Net Changes 4,289,721 4,604,050 (314,329)
Balance at June 30, 2019 300,300,433$ 166,239,057$ 134,061,376$
Contributions - employerContributions - employeeNet investment incomeAdministrative expense
Service costInterest on the total pension liabilityChanges of assumptionsDifferences between expected and actual experienceBenefit payments, including refunds of member contributions
At June 30, 2018 (measurement date 2017), the change in the Net Pension Liability for the SDTC Plan is as follows:
Total Pension Plan Fiduciary Net Pension
Liability Net Position Liability
Balance at July 1, 2017 289,255,802$ 152,932,851$ 136,322,951$ Changes in the year:
3,660,961 - 3,660,961 19,885,608 - 19,885,608 - - - 1,185,687 - 1,185,687 (17,977,346) (17,977,346) - - 12,649,101 (12,649,101) - 2,047,593 (2,047,593) - 12,216,936 (12,216,936) - (234,128) 234,128
Net Changes 6,754,910 8,702,156 (1,947,246)
Balance at June 30, 2018 296,010,712$ 161,635,007$ 134,375,705$
Contributions - employeeNet investment incomeAdministrative expense
Service costInterest on the total pension liabilityChanges of assumptionsDifferences between expected and actual experienceBenefit payments, including refunds of member contributionsContributions - employer
Pension Plan Fiduciary Net Position – Detailed information about the SDTC Plan’s fiduciary net position is available in the separately issued financial reports. The financial report may be obtained by writing to San Diego Transit Corporation, 1255 Imperial Avenue, Suite 1000, San Diego, CA 92101.
62
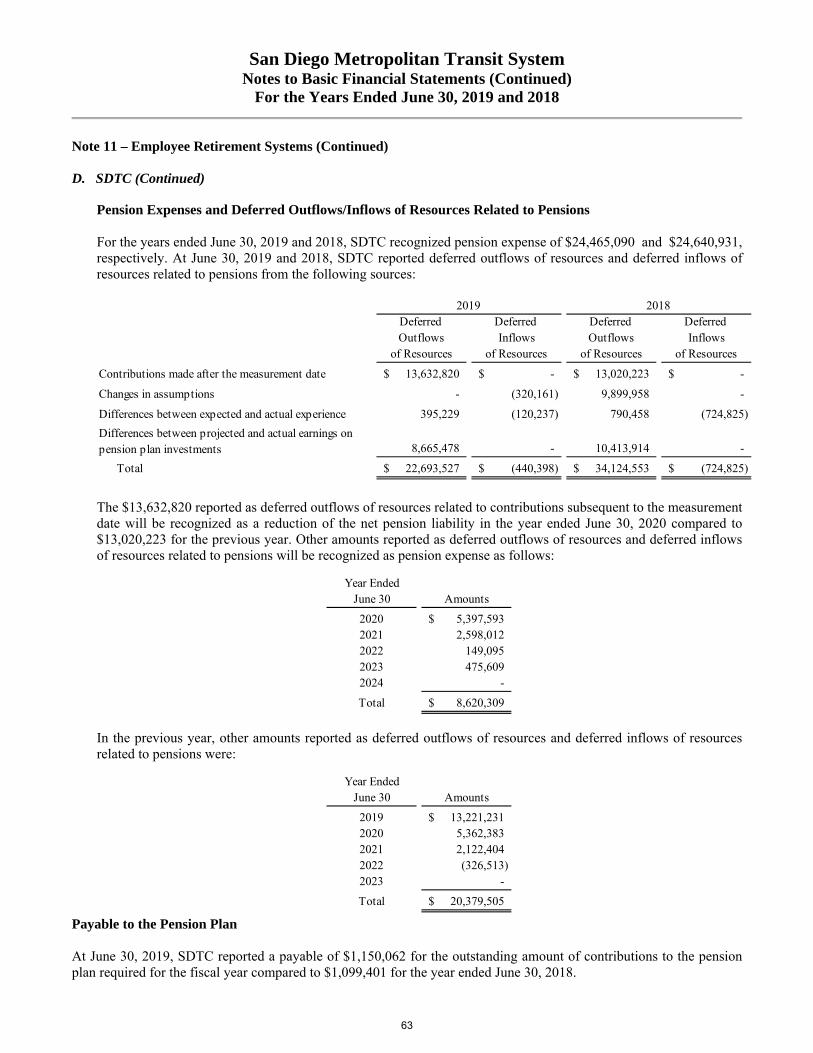
San Diego Metropolitan Transit System Notes to Basic Financial Statements (Continued)
For the Years Ended June 30, 2019 and 2018
Note 11 – Employee Retirement Systems (Continued)
D. SDTC (Continued) Pension Expenses and Deferred Outflows/Inflows of Resources Related to Pensions For the years ended June 30, 2019 and 2018, SDTC recognized pension expense of $24,465,090 and $24,640,931, respectively. At June 30, 2019 and 2018, SDTC reported deferred outflows of resources and deferred inflows of resources related to pensions from the following sources:
Deferred Deferred Deferred Deferred Outflows Inflows Outflows Inflows
of Resources of Resources of Resources of Resources
13,632,820$ -$ 13,020,223$ -$
- (320,161) 9,899,958 -
395,229 (120,237) 790,458 (724,825)
8,665,478 - 10,413,914 -
Total 22,693,527$ (440,398)$ 34,124,553$ (724,825)$
2019 2018
Contributions made after the measurement date
Changes in assumptions
Differences between expected and actual experience
Differences between projected and actual earnings on pension plan investments
The $13,632,820 reported as deferred outflows of resources related to contributions subsequent to the measurement date will be recognized as a reduction of the net pension liability in the year ended June 30, 2020 compared to $13,020,223 for the previous year. Other amounts reported as deferred outflows of resources and deferred inflows of resources related to pensions will be recognized as pension expense as follows:
Year Ended
June 30 Amounts
2020 5,397,593$ 2021 2,598,012 2022 149,095 2023 475,609 2024 -
Total 8,620,309$
In the previous year, other amounts reported as deferred outflows of resources and deferred inflows of resources related to pensions were:
Year Ended
June 30 Amounts
2019 13,221,231$ 2020 5,362,383 2021 2,122,404 2022 (326,513) 2023 -
Total 20,379,505$
Payable to the Pension Plan
At June 30, 2019, SDTC reported a payable of $1,150,062 for the outstanding amount of contributions to the pension plan required for the fiscal year compared to $1,099,401 for the year ended June 30, 2018.
63
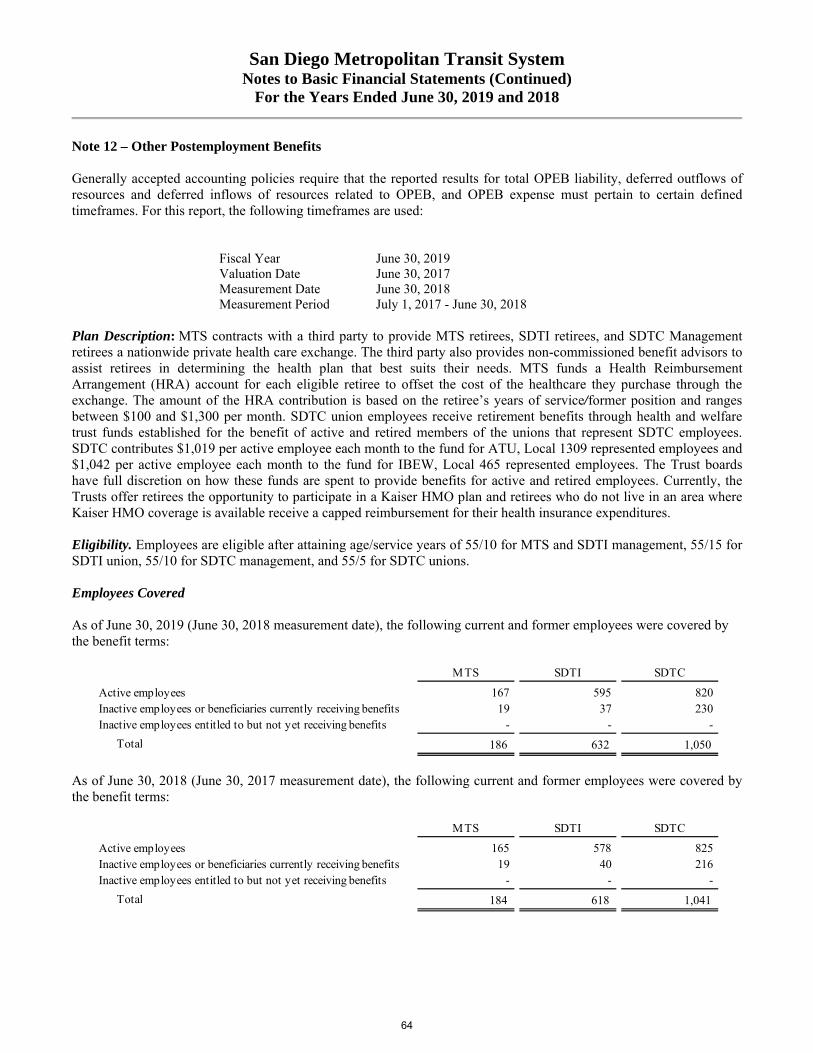
San Diego Metropolitan Transit System Notes to Basic Financial Statements (Continued)
For the Years Ended June 30, 2019 and 2018
Note 12 – Other Postemployment Benefits Generally accepted accounting policies require that the reported results for total OPEB liability, deferred outflows of resources and deferred inflows of resources related to OPEB, and OPEB expense must pertain to certain defined timeframes. For this report, the following timeframes are used:
Fiscal Year June 30, 2019 Valuation Date June 30, 2017 Measurement Date June 30, 2018 Measurement Period July 1, 2017 - June 30, 2018
Plan Description: MTS contracts with a third party to provide MTS retirees, SDTI retirees, and SDTC Management retirees a nationwide private health care exchange. The third party also provides non-commissioned benefit advisors to assist retirees in determining the health plan that best suits their needs. MTS funds a Health Reimbursement Arrangement (HRA) account for each eligible retiree to offset the cost of the healthcare they purchase through the exchange. The amount of the HRA contribution is based on the retiree’s years of service/former position and ranges between $100 and $1,300 per month. SDTC union employees receive retirement benefits through health and welfare trust funds established for the benefit of active and retired members of the unions that represent SDTC employees. SDTC contributes $1,019 per active employee each month to the fund for ATU, Local 1309 represented employees and $1,042 per active employee each month to the fund for IBEW, Local 465 represented employees. The Trust boards have full discretion on how these funds are spent to provide benefits for active and retired employees. Currently, the Trusts offer retirees the opportunity to participate in a Kaiser HMO plan and retirees who do not live in an area where Kaiser HMO coverage is available receive a capped reimbursement for their health insurance expenditures.
Eligibility. Employees are eligible after attaining age/service years of 55/10 for MTS and SDTI management, 55/15 for SDTI union, 55/10 for SDTC management, and 55/5 for SDTC unions. Employees Covered As of June 30, 2019 (June 30, 2018 measurement date), the following current and former employees were covered by the benefit terms:
MTS SDTI SDTC
Active employees 167 595 820 Inactive employees or beneficiaries currently receiving benefits 19 37 230 Inactive employees entitled to but not yet receiving benefits - - -
Total 186 632 1,050
As of June 30, 2018 (June 30, 2017 measurement date), the following current and former employees were covered by the benefit terms:
MTS SDTI SDTC
Active employees 165 578 825 Inactive employees or beneficiaries currently receiving benefits 19 40 216 Inactive employees entitled to but not yet receiving benefits - - -
Total 184 618 1,041
64

San Diego Metropolitan Transit System Notes to Basic Financial Statements (Continued)
For the Years Ended June 30, 2019 and 2018
Note 12 – Other Postemployment Benefits (Continued) Actuarial Assumptions The total OPEB liability as of June 30, 2019, was determined using the following actuarial assumptions:
MTS SDTI SDTC
Actuarial Cost MethodValuation DateMeasurement DateActuarial Assumptions:
Discount RateInflationSalary IncreasesInvestment Rate of ReturnMedical Trend RatesDental Trend RatesMortality Rate Based on the Society of Actuaries 2014 RPH-2014 using
retirement plans mortality study scale MP 2017Pre-Retirement Turnover with the updates to the mortality Management-3-10%
projection scale Union 2-25%
Entry Age Normal
6.5%, decreasing 0.5% per yearN/A
3.0% per annum in aggregate2.75% per annum3.5% per annum
June 30, 2017June 30, 2018
4% per annum
Discount Rate The discount rate used to measure the total OPEB liability was 3.5% percent as of the measurement date June 30, 2018 and 3.4% as of the measurement date June 30, 2017. This discount rate is the average, rounded to 5 basis points, of the range of 3-20 year municipal bond rate indices: S&P Municipal Bond 20 Year High Grade Rate Index, Bond Buyer 20-Bond GO index, Fidelity GO AA 20 year Bond Index. Sensitivity of the Total OPEB Liability to Changes in the Discount Rate The following presents the total OPEB liability of MTS, SDTI and SDTC, as well as what the total OPEB liability would be if it were calculated using a discount rate that is one percentage point lower or one percentage point higher than the current rate, for June 30, 2019:
MTS SDTI SDTC Aggregate
1% Decrease 2.50% 2.50% 2.50% 2.50%Total OPEB Liability 7,187,160$ 13,413,321$ 34,179,661$ 54,780,142$
Current Discount Rate 3.50% 3.50% 3.50% 3.50%Total OPEB Liability 6,025,074$ 11,565,916$ 29,520,213$ 47,111,203$
1% Increase 4.50% 4.50% 4.50% 4.50%Total OPEB Liability 5,102,051$ 10,056,141$ 25,754,218$ 40,912,410$
65
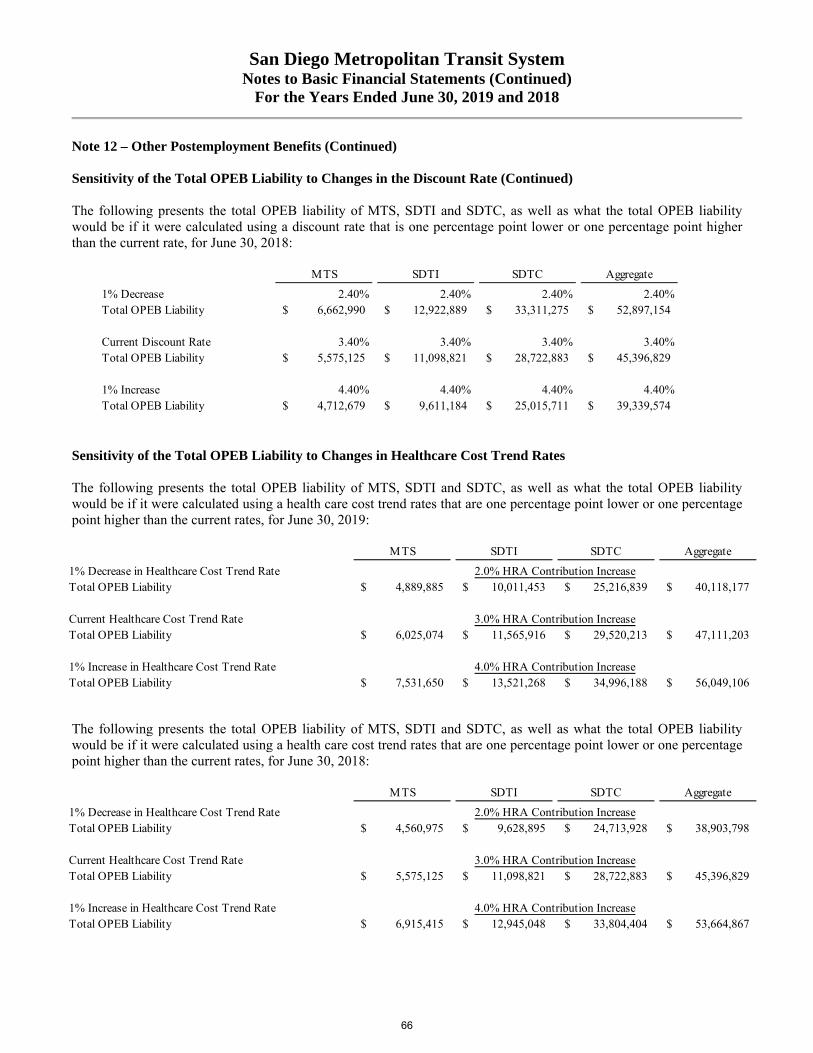
San Diego Metropolitan Transit System Notes to Basic Financial Statements (Continued)
For the Years Ended June 30, 2019 and 2018
Note 12 – Other Postemployment Benefits (Continued) Sensitivity of the Total OPEB Liability to Changes in the Discount Rate (Continued) The following presents the total OPEB liability of MTS, SDTI and SDTC, as well as what the total OPEB liability would be if it were calculated using a discount rate that is one percentage point lower or one percentage point higher than the current rate, for June 30, 2018:
MTS SDTI SDTC Aggregate
1% Decrease 2.40% 2.40% 2.40% 2.40%Total OPEB Liability 6,662,990$ 12,922,889$ 33,311,275$ 52,897,154$
Current Discount Rate 3.40% 3.40% 3.40% 3.40%Total OPEB Liability 5,575,125$ 11,098,821$ 28,722,883$ 45,396,829$
1% Increase 4.40% 4.40% 4.40% 4.40%Total OPEB Liability 4,712,679$ 9,611,184$ 25,015,711$ 39,339,574$
Sensitivity of the Total OPEB Liability to Changes in Healthcare Cost Trend Rates The following presents the total OPEB liability of MTS, SDTI and SDTC, as well as what the total OPEB liability would be if it were calculated using a health care cost trend rates that are one percentage point lower or one percentage point higher than the current rates, for June 30, 2019:
MTS SDTI SDTC Aggregate
1% Decrease in Healthcare Cost Trend RateTotal OPEB Liability 4,889,885$ 10,011,453$ 25,216,839$ 40,118,177$
Current Healthcare Cost Trend RateTotal OPEB Liability 6,025,074$ 11,565,916$ 29,520,213$ 47,111,203$
1% Increase in Healthcare Cost Trend RateTotal OPEB Liability 7,531,650$ 13,521,268$ 34,996,188$ 56,049,106$
2.0% HRA Contribution Increase
3.0% HRA Contribution Increase
4.0% HRA Contribution Increase
The following presents the total OPEB liability of MTS, SDTI and SDTC, as well as what the total OPEB liability would be if it were calculated using a health care cost trend rates that are one percentage point lower or one percentage point higher than the current rates, for June 30, 2018:
MTS SDTI SDTC Aggregate
1% Decrease in Healthcare Cost Trend RateTotal OPEB Liability 4,560,975$ 9,628,895$ 24,713,928$ 38,903,798$
Current Healthcare Cost Trend RateTotal OPEB Liability 5,575,125$ 11,098,821$ 28,722,883$ 45,396,829$
1% Increase in Healthcare Cost Trend RateTotal OPEB Liability 6,915,415$ 12,945,048$ 33,804,404$ 53,664,867$
2.0% HRA Contribution Increase
3.0% HRA Contribution Increase
4.0% HRA Contribution Increase
66

San Diego Metropolitan Transit System Notes to Basic Financial Statements (Continued)
For the Years Ended June 30, 2019 and 2018
Note 12 – Other Postemployment Benefits (Continued)
Change in Total OPEB Liability At June 30, 2019, the change in the Total OPEB liability is as follows:
MTS SDTI SDTC Aggregate
Balance at June 30, 2018 5,575,125$ 11,098,821$ 28,722,883$ 45,396,829$ Changes Recognized for the Measurement Period:
Service Cost 450,678 440,969 1,176,005 2,067,652 Interest on the total OPEB liability 203,185 389,043 1,000,292 1,592,520 Changes in assumptions (104,394) (168,207) (421,922) (694,523) Benefit payments (99,520) (194,710) (957,045) (1,251,275)
Net Changes 449,949 467,095 797,330 1,714,374
Balance at June 30, 2019 6,025,074$ 11,565,916$ 29,520,213$ 47,111,203$
At June 30, 2018, the change in the Total OPEB liability is as follows:
MTS SDTI SDTC Aggregate
Balance at June 30, 2017 (as restated) 5,562,352$ 11,414,062$ 29,858,990$ 46,835,404$ Changes Recognized for the Measurement Period:
Service Cost 504,282 493,375 1,317,293 2,314,950 Interest on the total OPEB liability 171,522 336,668 875,283 1,383,473 Changes in assumptions (566,410) (956,245) (2,399,513) (3,922,168) Benefit payments (96,621) (189,039) (929,170) (1,214,830)
Net Changes 12,773 (315,241) (1,136,107) (1,438,575)
Balance at June 30, 2018 5,575,125$ 11,098,821$ 28,722,883$ 45,396,829$
Contributions The contribution requirements of plan members and MTS, SDTI and SDTC are established and may be amended by MTS Management or the Board of Directors. The contribution required to be made is based on a pay-as-you-go basis (i.e., as medical insurance premiums become due). For fiscal years 2019 and 2018, the following contributions were made:
MTS SDTI SDTC Aggregate
2019 Contributions 108,036$ 186,118$ 1,114,232$ 1,408,386$
2018 Contributions 92,802$ 168,599$ 1,032,492$ 1,293,893$
67

San Diego Metropolitan Transit System Notes to Basic Financial Statements (Continued)
For the Years Ended June 30, 2019 and 2018
Note 12 – Other Postemployment Benefits (Continued)
OPEB Expense and Deferred Outflows/Inflows of Resources Related to OPEB For the years ended June 30, 2019 and 2018, OPEB expense is included in the accompanying statement of revenues, expenses, and changes in net position as follows:
MTS SDTI SDTC Aggregate
2019 OPEB Expense 586,783$ 705,073$ 1,706,058$ 2,997,914$
2018 OPEB Expense 619,163$ 723,794$ 1,792,657$ 3,135,614$ At June 30, 2019, MTS, SDTI and SDTC reported deferred outflows of resources and deferred inflows of resources related to OPEB from the following sources:
Deferred Outflows Deferred Inflows Deferred Outflows Deferred Inflowsof Resources of Resources of Resources of Resources
Contributions made after measurement date 108,036$ -$ 186,118$ -$ Changes in assumptions - (547,083) - (893,264)
Total 108,036$ (547,083)$ 186,118$ (893,264)$
Deferred Outflows Deferred Inflows Deferred Outflows Deferred Inflowsof Resources of Resources of Resources of Resources
Contributions made after measurement date 1,114,232$ -$ 1,408,386$ -$ Changes in assumptions - (1,951,277) - (3,391,624)
Total 1,114,232$ (1,951,277)$ 1,408,386$ (3,391,624)$
Aggregate
MTS SDTI
SDTC
At June 30, 2018, MTS, SDTI and SDTC reported deferred outflows of resources and deferred inflows of resources related to OPEB from the following sources:
Deferred Outflows Deferred Inflows Deferred Outflows Deferred Inflowsof Resources of Resources of Resources of Resources
Contributions made after measurement date 92,802$ -$ 168,599$ -$ Changes in assumptions - (509,769) - (849,996)
Total 92,802$ (509,769)$ 168,599$ (849,996)$
Deferred Outflows Deferred Inflows Deferred Outflows Deferred Inflowsof Resources of Resources of Resources of Resources
Contributions made after measurement date 1,032,492$ -$ 1,293,893$ -$ Changes in assumptions - (1,999,594) - (3,359,359)
Total 1,032,492$ (1,999,594)$ 1,293,893$ (3,359,359)$
SDTC Aggregate
MTS SDTI
68
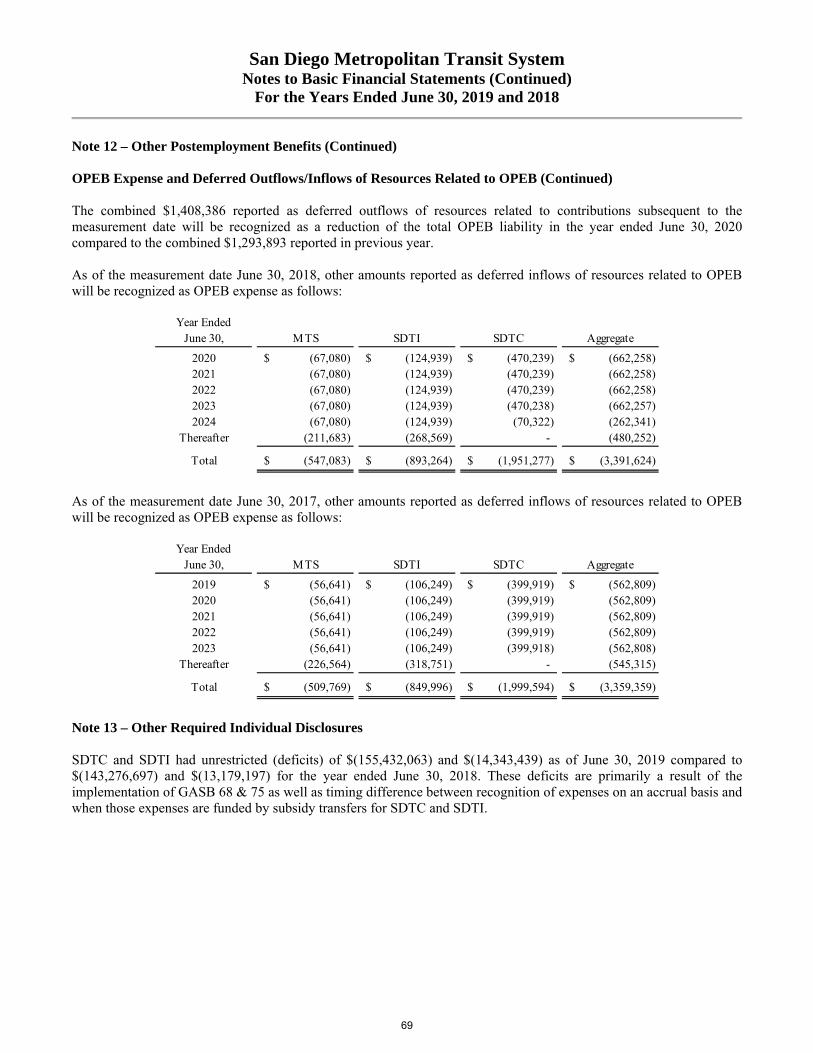
San Diego Metropolitan Transit System Notes to Basic Financial Statements (Continued)
For the Years Ended June 30, 2019 and 2018
Note 12 – Other Postemployment Benefits (Continued) OPEB Expense and Deferred Outflows/Inflows of Resources Related to OPEB (Continued) The combined $1,408,386 reported as deferred outflows of resources related to contributions subsequent to the measurement date will be recognized as a reduction of the total OPEB liability in the year ended June 30, 2020 compared to the combined $1,293,893 reported in previous year. As of the measurement date June 30, 2018, other amounts reported as deferred inflows of resources related to OPEB will be recognized as OPEB expense as follows:
Year EndedJune 30, MTS SDTI SDTC Aggregate
2020 (67,080)$ (124,939)$ (470,239)$ (662,258)$ 2021 (67,080) (124,939) (470,239) (662,258) 2022 (67,080) (124,939) (470,239) (662,258) 2023 (67,080) (124,939) (470,238) (662,257) 2024 (67,080) (124,939) (70,322) (262,341)
Thereafter (211,683) (268,569) - (480,252)
Total (547,083)$ (893,264)$ (1,951,277)$ (3,391,624)$
As of the measurement date June 30, 2017, other amounts reported as deferred inflows of resources related to OPEB will be recognized as OPEB expense as follows:
Year EndedJune 30, MTS SDTI SDTC Aggregate
2019 (56,641)$ (106,249)$ (399,919)$ (562,809)$ 2020 (56,641) (106,249) (399,919) (562,809) 2021 (56,641) (106,249) (399,919) (562,809) 2022 (56,641) (106,249) (399,919) (562,809) 2023 (56,641) (106,249) (399,918) (562,808)
Thereafter (226,564) (318,751) - (545,315)
Total (509,769)$ (849,996)$ (1,999,594)$ (3,359,359)$
Note 13 – Other Required Individual Disclosures SDTC and SDTI had unrestricted (deficits) of $(155,432,063) and $(14,343,439) as of June 30, 2019 compared to $(143,276,697) and $(13,179,197) for the year ended June 30, 2018. These deficits are primarily a result of the implementation of GASB 68 & 75 as well as timing difference between recognition of expenses on an accrual basis and when those expenses are funded by subsidy transfers for SDTC and SDTI.
69

San Diego Metropolitan Transit System Notes to Basic Financial Statements (Continued)
For the Years Ended June 30, 2019 and 2018
Note 14 – Restatement of Net Position As a result of the implementation of GASB Statement No. 75, net position as of July 1, 2017 was restated as follows:
Net position at July 1, 2017, as previously reported 1,724,184,943$
Restatement to remove net OPEB liability from the statement of net position 18,573,045 Restatement to recognize total OPEB liability (46,835,404) Restatement to recognize OPEB contributions made subsequent to the measurement date as deferred outflow of resources 1,214,830
Total restatements (27,047,529)
Net position at July 1, 2017, as restated 1,697,137,414$
70
REQUIRED SUPPLEMENTARY INFORMATION (Unaudited)
71

San Diego Metropolitan Transit System Required Supplementary Information (Unaudited)
For the Years Ended June 30, 2019 and 2018
SCHEDULE OF PROPORTIONATE SHARE OF THE NET PENSION LIABILITY MTS
(LAST TEN YEARS*)
Measurement Period, Year Ended June 30: 2018 2017 2016 2015 2014
Proportion of the net pension liability 0.13473% 0.13531% 0.13477% 0.14142% 0.13277%
Proportionate share of the net pension liability 12,982,663$ 13,418,753$ 11,661,984$ 9,707,169$ 8,261,550$
Covered payroll 12,873,186$ 11,809,510$ 11,078,469$ 9,954,718$ 9,277,782$
Proportionate share of the net pension liability as percentage of covered payroll 100.85% 113.63% 105.27% 97.51% 89.05%
Plan's fiduciary net position as percentage of the total pension liability 75.65% 72.65% 72.53% 75.07% 77.50%
Proportionate share of aggregate employer contributions 1,536,182$ 1,348,728$ 1,896,142$ 1,998,897$ 755,170$
*Ten year historical information is not yet available.
72
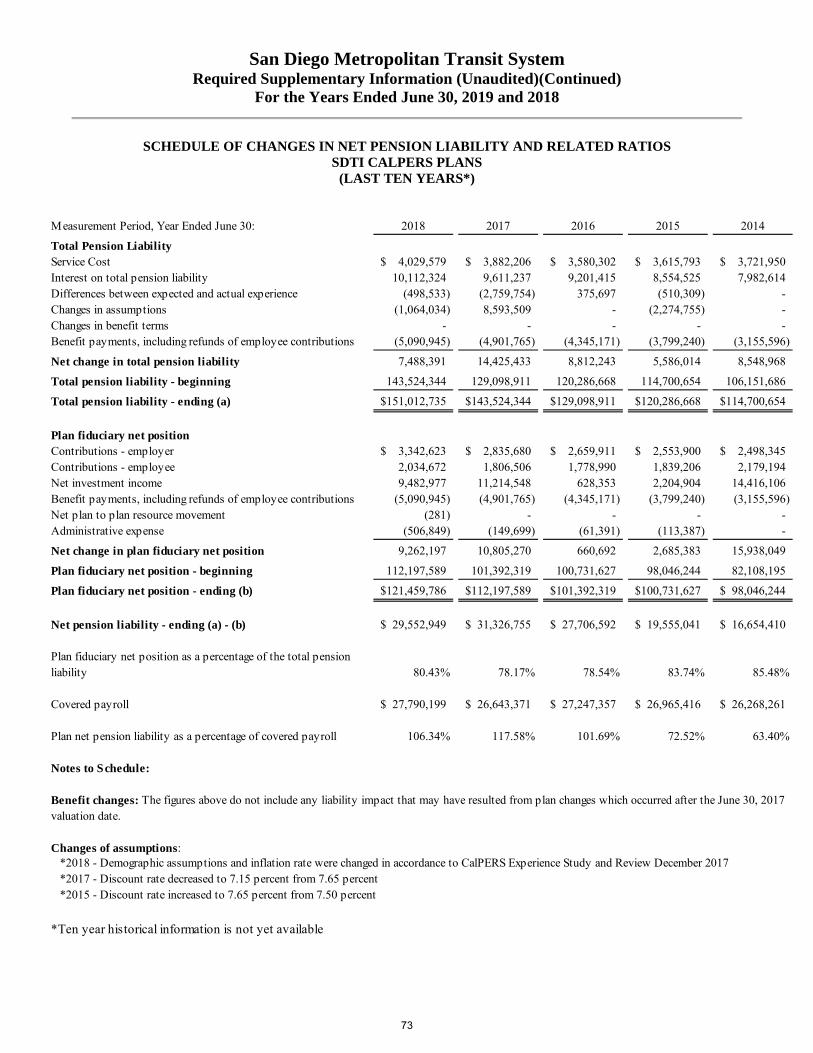
San Diego Metropolitan Transit System Required Supplementary Information (Unaudited)(Continued)
For the Years Ended June 30, 2019 and 2018
SCHEDULE OF CHANGES IN NET PENSION LIABILITY AND RELATED RATIOS SDTI CALPERS PLANS
(LAST TEN YEARS*)
Measurement Period, Year Ended June 30: 2018 2017 2016 2015 2014
Total Pension LiabilityService Cost 4,029,579$ 3,882,206$ 3,580,302$ 3,615,793$ 3,721,950$ Interest on total pension liability 10,112,324 9,611,237 9,201,415 8,554,525 7,982,614 Differences between expected and actual experience (498,533) (2,759,754) 375,697 (510,309) - Changes in assumptions (1,064,034) 8,593,509 - (2,274,755) - Changes in benefit terms - - - - - Benefit payments, including refunds of employee contributions (5,090,945) (4,901,765) (4,345,171) (3,799,240) (3,155,596)
Net change in total pension liability 7,488,391 14,425,433 8,812,243 5,586,014 8,548,968
Total pension liability - beginning 143,524,344 129,098,911 120,286,668 114,700,654 106,151,686
Total pension liability - ending (a) 151,012,735$ 143,524,344$ 129,098,911$ 120,286,668$ 114,700,654$
Plan fiduciary net positionContributions - employer 3,342,623$ 2,835,680$ 2,659,911$ 2,553,900$ 2,498,345$ Contributions - employee 2,034,672 1,806,506 1,778,990 1,839,206 2,179,194 Net investment income 9,482,977 11,214,548 628,353 2,204,904 14,416,106 Benefit payments, including refunds of employee contributions (5,090,945) (4,901,765) (4,345,171) (3,799,240) (3,155,596) Net plan to plan resource movement (281) - - - - Administrative expense (506,849) (149,699) (61,391) (113,387) -
Net change in plan fiduciary net position 9,262,197 10,805,270 660,692 2,685,383 15,938,049
Plan fiduciary net position - beginning 112,197,589 101,392,319 100,731,627 98,046,244 82,108,195
Plan fiduciary net position - ending (b) 121,459,786$ 112,197,589$ 101,392,319$ 100,731,627$ 98,046,244$
Net pension liability - ending (a) - (b) 29,552,949$ 31,326,755$ 27,706,592$ 19,555,041$ 16,654,410$
Plan fiduciary net position as a percentage of the total pension liability 80.43% 78.17% 78.54% 83.74% 85.48%
Covered payroll 27,790,199$ 26,643,371$ 27,247,357$ 26,965,416$ 26,268,261$
Plan net pension liability as a percentage of covered payroll 106.34% 117.58% 101.69% 72.52% 63.40%
Notes to Schedule:
Changes of assumptions:
*Ten year historical information is not yet available
*2015 - Discount rate increased to 7.65 percent from 7.50 percent
Benefit changes: The figures above do not include any liability impact that may have resulted from plan changes which occurred after the June 30, 2017 valuation date.
*2018 - Demographic assumptions and inflation rate were changed in accordance to CalPERS Experience Study and Review December 2017*2017 - Discount rate decreased to 7.15 percent from 7.65 percent
73

San Diego Metropolitan Transit System Required Supplementary Information (Unaudited)(Continued)
For the Years Ended June 30, 2019 and 2018
SCHEDULE OF CHANGES IN NET PENSION LIABILITY AND RELATED RATIOS SDTI PARS PLAN
(LAST TEN YEARS*)
Measurement Period, Year Ended June 30: 2018 2017 2016 2015
Total Pension LiabilityService Cost 198,627$ 230,296$ 223,588$ 267,889$ Interest on total pension liability 587,363 556,089 523,457 480,808 Differences between expected and actual experience (652,788) - (166,133) - Changes in assumptions 473,927 - 321,921 - Changes in benefit terms - - - - Benefit payments, including refunds of employee contributions (313,613) (302,460) (273,201) (229,364)
Net change in total pension liability 293,516 483,925 629,632 519,333
Total pension liability - beginning 8,346,429 7,862,504 7,232,872 6,713,539
Total pension liability - ending (a) 8,639,945$ 8,346,429$ 7,862,504$ 7,232,872$
Plan fiduciary net positionContributions - employer 549,296$ 605,864$ 547,473$ 590,203$ Contributions - employee - - - - Net investment income 458,921 638,858 (59,981) 127,592 Benefit payments, including refunds of employee contributions (313,613) (302,460) (273,201) (229,364) Administrative expense (17,012) (13,417) (14,665) (12,186)
Net change in plan fiduciary net position 677,592 928,845 199,626 476,245
Plan fiduciary net position - beginning 6,195,930 5,267,085 5,067,459 4,591,214
Plan fiduciary net position - ending (b) 6,873,522$ 6,195,930$ 5,267,085$ 5,067,459$
Net pension liability - ending (a) - (b) 1,766,423$ 2,150,499$ 2,595,419$ 2,165,413$
Plan fiduciary net position as a percentage of the total pension liability 79.56% 74.23% 66.99% 70.06%
Covered payroll 4,766,641$ 5,170,611$ 5,020,011$ 4,943,557$
Plan net pension liability as a percentage of covered payroll 37.06% 41.59% 51.70% 43.80%
Notes to Schedule:
*Ten year historical information is not yet available
Changes in Assumption: *2018 - Investment rate of return decreased from 7.0 to 6.5 percent*2016 - Inflation rate decreased from 3.0 to 2.75 percent*2016 - Salary scale, retirement and pre-retirement mortality assumptions were updated.
Benefit changes. The figures above do not include any liability impact that may have resulted from plan changes which occurred after the June 30, 2017 valuation date.
74
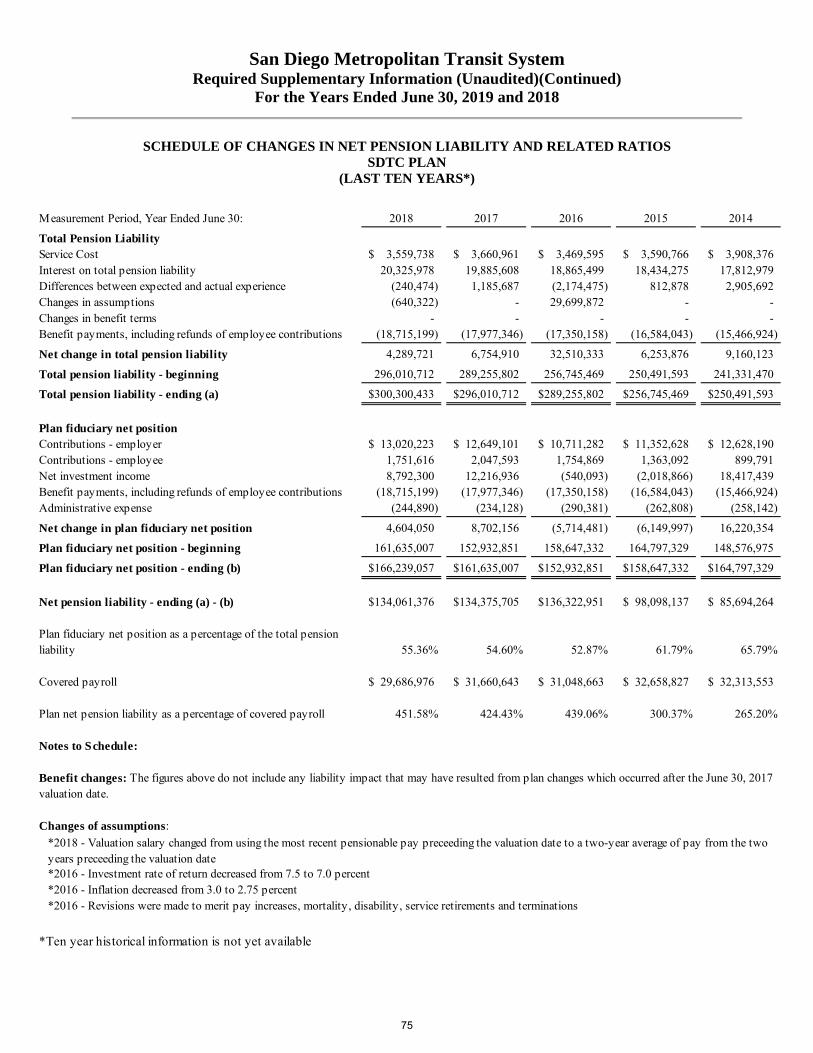
San Diego Metropolitan Transit System Required Supplementary Information (Unaudited)(Continued)
For the Years Ended June 30, 2019 and 2018
SCHEDULE OF CHANGES IN NET PENSION LIABILITY AND RELATED RATIOS SDTC PLAN
(LAST TEN YEARS*)
Measurement Period, Year Ended June 30: 2018 2017 2016 2015 2014
Total Pension LiabilityService Cost 3,559,738$ 3,660,961$ 3,469,595$ 3,590,766$ 3,908,376$ Interest on total pension liability 20,325,978 19,885,608 18,865,499 18,434,275 17,812,979 Differences between expected and actual experience (240,474) 1,185,687 (2,174,475) 812,878 2,905,692 Changes in assumptions (640,322) - 29,699,872 - - Changes in benefit terms - - - - - Benefit payments, including refunds of employee contributions (18,715,199) (17,977,346) (17,350,158) (16,584,043) (15,466,924)
Net change in total pension liability 4,289,721 6,754,910 32,510,333 6,253,876 9,160,123
Total pension liability - beginning 296,010,712 289,255,802 256,745,469 250,491,593 241,331,470
Total pension liability - ending (a) 300,300,433$ 296,010,712$ 289,255,802$ 256,745,469$ 250,491,593$
Plan fiduciary net positionContributions - employer 13,020,223$ 12,649,101$ 10,711,282$ 11,352,628$ 12,628,190$ Contributions - employee 1,751,616 2,047,593 1,754,869 1,363,092 899,791 Net investment income 8,792,300 12,216,936 (540,093) (2,018,866) 18,417,439 Benefit payments, including refunds of employee contributions (18,715,199) (17,977,346) (17,350,158) (16,584,043) (15,466,924) Administrative expense (244,890) (234,128) (290,381) (262,808) (258,142)
Net change in plan fiduciary net position 4,604,050 8,702,156 (5,714,481) (6,149,997) 16,220,354
Plan fiduciary net position - beginning 161,635,007 152,932,851 158,647,332 164,797,329 148,576,975
Plan fiduciary net position - ending (b) 166,239,057$ 161,635,007$ 152,932,851$ 158,647,332$ 164,797,329$
Net pension liability - ending (a) - (b) 134,061,376$ 134,375,705$ 136,322,951$ 98,098,137$ 85,694,264$
Plan fiduciary net position as a percentage of the total pension liability 55.36% 54.60% 52.87% 61.79% 65.79%
Covered payroll 29,686,976$ 31,660,643$ 31,048,663$ 32,658,827$ 32,313,553$
Plan net pension liability as a percentage of covered payroll 451.58% 424.43% 439.06% 300.37% 265.20%
Notes to Schedule:
Changes of assumptions:
*Ten year historical information is not yet available
*2016 - Inflation decreased from 3.0 to 2.75 percent*2016 - Revisions were made to merit pay increases, mortality, disability, service retirements and terminations
Benefit changes: The figures above do not include any liability impact that may have resulted from plan changes which occurred after the June 30, 2017 valuation date.
*2018 - Valuation salary changed from using the most recent pensionable pay preceeding the valuation date to a two-year average of pay from the two years preceeding the valuation date*2016 - Investment rate of return decreased from 7.5 to 7.0 percent
75
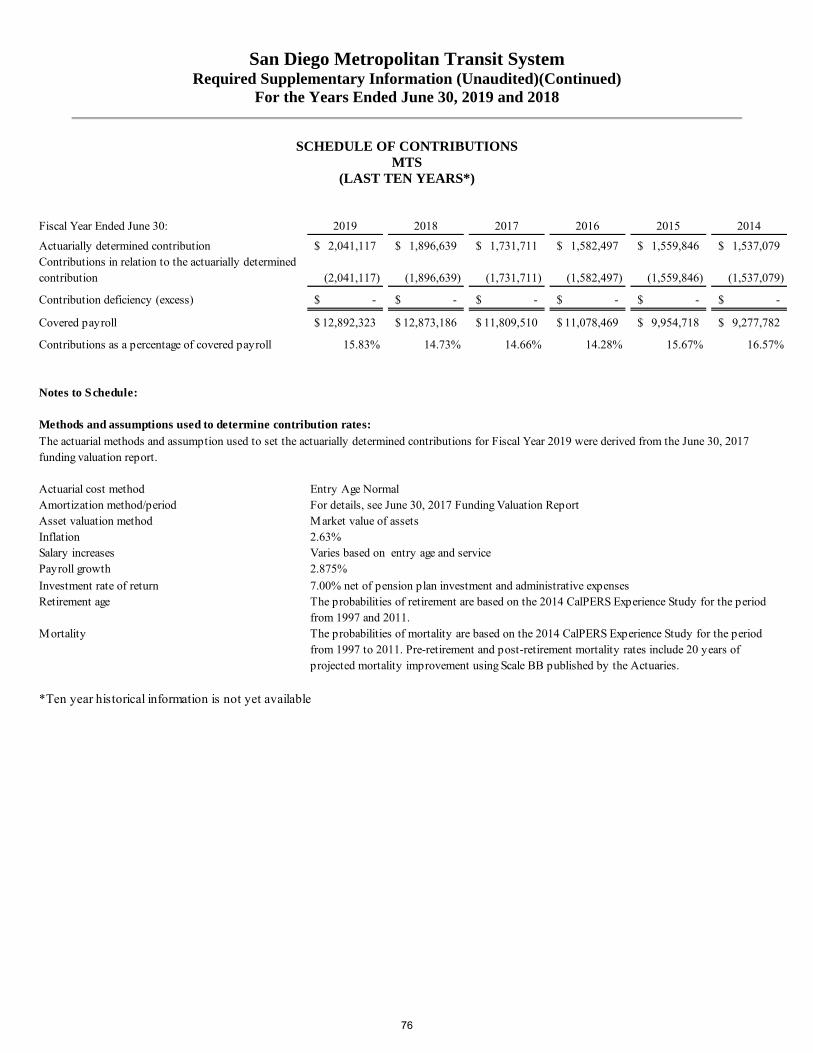
San Diego Metropolitan Transit System Required Supplementary Information (Unaudited)(Continued)
For the Years Ended June 30, 2019 and 2018
SCHEDULE OF CONTRIBUTIONS MTS
(LAST TEN YEARS*)
Fiscal Year Ended June 30: 2019 2018 2017 2016 2015 2014
Actuarially determined contribution 2,041,117$ 1,896,639$ 1,731,711$ 1,582,497$ 1,559,846$ 1,537,079$ Contributions in relation to the actuarially determined contribution (2,041,117) (1,896,639) (1,731,711) (1,582,497) (1,559,846) (1,537,079)
Contribution deficiency (excess) -$ -$ -$ -$ -$ -$
Covered payroll 12,892,323$ 12,873,186$ 11,809,510$ 11,078,469$ 9,954,718$ 9,277,782$
Contributions as a percentage of covered payroll 15.83% 14.73% 14.66% 14.28% 15.67% 16.57%
Notes to Schedule:
Methods and assumptions used to determine contribution rates:
Actuarial cost methodAmortization method/period For details, see June 30, 2017 Funding Valuation ReportAsset valuation methodInflationSalary increases Varies based on entry age and servicePayroll growth
Investment rate of returnRetirement age
Mortality
The actuarial methods and assumption used to set the actuarially determined contributions for Fiscal Year 2019 were derived from the June 30, 2017 funding valuation report.
*Ten year historical information is not yet available
Entry Age Normal
Market value of assets2.63%
2.875%
7.00% net of pension plan investment and administrative expensesThe probabilities of retirement are based on the 2014 CalPERS Experience Study for the period from 1997 and 2011.The probabilities of mortality are based on the 2014 CalPERS Experience Study for the period from 1997 to 2011. Pre-retirement and post-retirement mortality rates include 20 years of projected mortality improvement using Scale BB published by the Actuaries.
76

San Diego Metropolitan Transit System Required Supplementary Information (Unaudited)(Continued)
For the Years Ended June 30, 2019 and 2018
SCHEDULE OF CONTRIBUTIONS SDTI CALPERS PLAN (LAST TEN YEARS*)
Fiscal Year Ended June 30: 2019 2018 2017 2016 2015 2014
Actuarially determined contribution 3,824,864$ 3,266,081$ 2,835,680$ 2,659,911$ 2,553,900$ 2,498,345$ Contributions in relation to the actuarially determined contribution (3,824,864) (3,266,081) (2,835,680) (2,659,911) (2,553,900) (2,498,345)
Contribution deficiency (excess) -$ -$ -$ -$ -$ -$
Covered payroll 30,126,573$ 27,790,199$ 26,643,371$ 27,247,357$ 26,965,416$ 26,268,261$
Contributions as a percentage of covered payroll 12.70% 11.75% 10.64% 9.76% 9.47% 9.51%
Notes to Schedule:
Methods and assumptions used to determine contribution rates:
Actuarial cost methodAmortization method/period For details, see June 30, 2017 Funding Valuation ReportAsset valuation methodInflationSalary increases Varies based on entry age and servicePayroll growth
Investment rate of returnRetirement age
Mortality
*Ten year historical information is not yet available
Entry Age Normal
2.63%
2.875%
The actuarial methods and assumptions used to set the actuarially determined contributions for Fiscal Year 2019 were derived from the June 30, 2017 funding valuation report.
Market value of assets
7.00% net of pension plan investment and administrative expensesThe probabilities of retirement are based on the 2014 CalPERS Experience Study for the period from 1997 and 2011.The probabilities of mortality are based on the 2014 CalPERS Experience Study for the period from 1997 to 2011. Pre-retirement and post-retirement mortality rates include 20 years of projected mortality improvement using Scale BB published by the Actuaries.
77

San Diego Metropolitan Transit System Required Supplementary Information (Unaudited)(Continued)
For the Years Ended June 30, 2019 and 2018
SCHEDULE OF CONTRIBUTIONS SDTI PARS PLAN
(LAST TEN YEARS*)
Fiscal Year Ended June 30: 2019 2018 2017 2016 2015 2014
Actuarially determined contribution 459,504$ 460,930$ 499,993$ 445,465$ 546,873$ 463,079$ Contributions in relation to the actuarially determined contribution (435,748) (539,350) (605,864) (547,473) (590,203) (453,934)
Contribution deficiency (excess) 23,756$ (78,420)$ (105,871)$ (102,008)$ (43,330)$ 9,145$
Covered payroll 4,909,640$ 4,766,641$ 5,170,611$ 5,020,011$ 4,943,557$ 5,984,089$
Contributions as a percentage of covered payroll 8.88% 11.32% 11.72% 10.91% 11.94% 7.59%
Notes to Schedule:
Methods and assumptions used to determine contribution rates:
Valuation date June 30, 2017Actuarial cost method
Amortization method Level dollar
Amortization period 16 years as of valuation date
Asset valuation methodInflationSalary increases Varies based on entry age and servicePayroll growthInvestment rate of return
*Ten year historical information is not yet available
2.75%
Entry Age Normal
The actuarial methods and assumptions used to set the actuarially determined contributions for Fiscal Year 2019 were derived from the June 30, 2017 funding valuation report.
5-year smoothed market
3.00%6.50%
78

San Diego Metropolitan Transit System Required Supplementary Information (Unaudited)(Continued)
For the Years Ended June 30, 2019 and 2018
SCHEDULE OF CONTRIBUTIONS SDTC PLAN
(LAST TEN YEARS*)
Fiscal Year Ended June 30: 2019 2018 2017 2016 2015 2014
Actuarially determined contribution 13,632,820$ 13,020,223$ 12,649,101$ 10,711,282$ 11,352,628$ 12,628,190$ Contributions in relation to the actuarially determined contribution (13,632,820) (13,020,223) (12,649,101) (10,711,282) (11,352,628) (12,628,190)
Contribution deficiency (excess) -$ -$ -$ -$ -$ -$
Covered payroll 27,121,687$ 29,672,305$ 31,660,643$ 31,048,663$ 32,658,827$ 32,313,553$
Contributions as a percentage of covered payroll 50.27% 43.88% 39.95% 34.50% 34.76% 39.08%
Notes to Schedule:
Methods and assumptions used to determine contribution rates:
Valuation date July 1, 2017Actuarial cost methodAmortization method/period Level percent of payroll, closed 25-year periodAsset valuation methodSalary increasesInvestment rate of return
Mortality Actives: RP-2000 tables using male rates for both male and female members with generational improvements using scale MP-2015
*Ten year historical information is not yet available
The actuarial methods and assumptions used to set the actuarially determined contributions for Fiscal Year 2019 were derived from the June 30, 2017 funding valuation report.
Entry Age
5-year smoothed market
7.00% net of pension plan investment expenses2.75% plus merit component based on employee classification and years of services
79
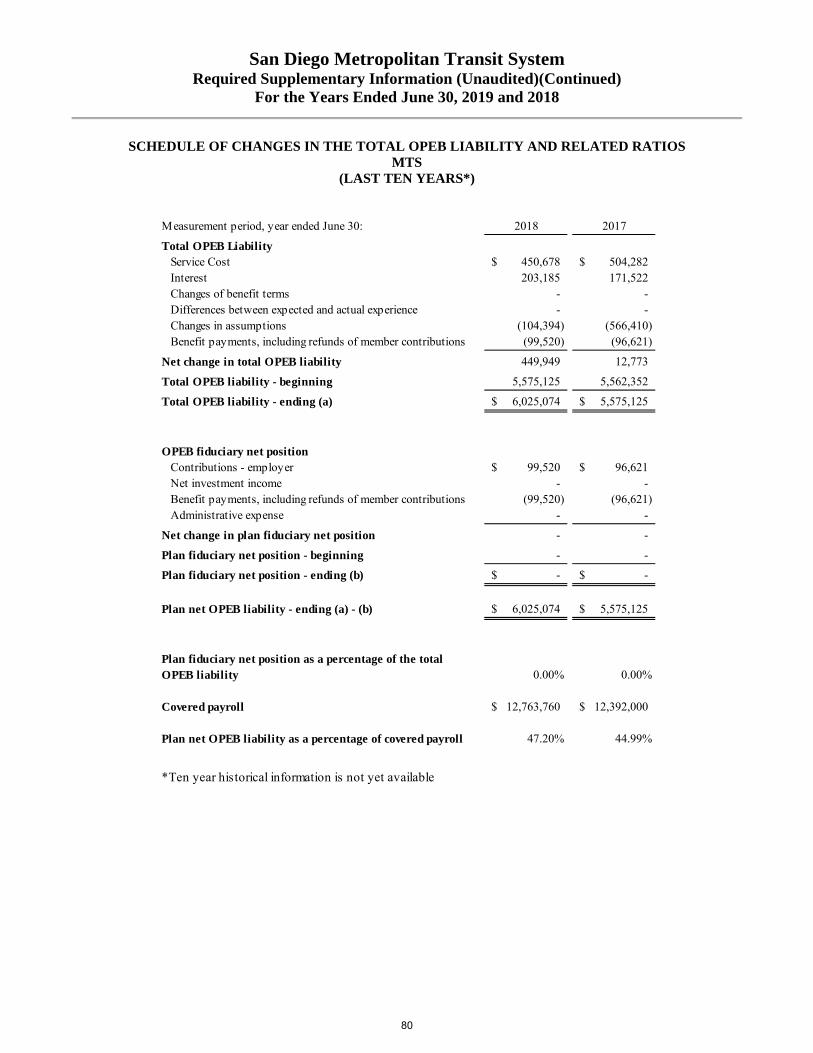
San Diego Metropolitan Transit System Required Supplementary Information (Unaudited)(Continued)
For the Years Ended June 30, 2019 and 2018
SCHEDULE OF CHANGES IN THE TOTAL OPEB LIABILITY AND RELATED RATIOS MTS
(LAST TEN YEARS*)
Measurement period, year ended June 30: 2018 2017
Total OPEB LiabilityService Cost 450,678$ 504,282$ Interest 203,185 171,522 Changes of benefit terms - - Differences between expected and actual experience - - Changes in assumptions (104,394) (566,410) Benefit payments, including refunds of member contributions (99,520) (96,621)
Net change in total OPEB liability 449,949 12,773
Total OPEB liability - beginning 5,575,125 5,562,352
Total OPEB liability - ending (a) 6,025,074$ 5,575,125$
OPEB fiduciary net positionContributions - employer 99,520$ 96,621$ Net investment income - - Benefit payments, including refunds of member contributions (99,520) (96,621) Administrative expense - -
Net change in plan fiduciary net position - -
Plan fiduciary net position - beginning - -
Plan fiduciary net position - ending (b) -$ -$
Plan net OPEB liability - ending (a) - (b) 6,025,074$ 5,575,125$
Plan fiduciary net position as a percentage of the total OPEB liability 0.00% 0.00%
Covered payroll 12,763,760$ 12,392,000$
Plan net OPEB liability as a percentage of covered payroll 47.20% 44.99%
*Ten year historical information is not yet available
80

San Diego Metropolitan Transit System Required Supplementary Information (Unaudited)(Continued)
For the Years Ended June 30, 2019 and 2018
SCHEDULE OF CHANGES IN THE TOTAL OPEB LIABILITY AND RELATED RATIOS SDTI
(LAST TEN YEARS*)
Measurement period, year ended June 30: 2018 2017
Total OPEB LiabilityService Cost 440,969$ 493,375$ Interest 389,043 336,668 Changes of benefit terms - - Differences between expected and actual experience - - Changes in assumptions (168,207) (956,245) Benefit payments, including refunds of member contributions (194,710) (189,039)
Net change in total OPEB liability 467,095 (315,241)
Total OPEB liability - beginning 11,098,821 11,414,062
Total OPEB liability - ending (a) 11,565,916$ 11,098,821$
OPEB fiduciary net positionContributions - employer 194,710$ 189,039$ Net investment income - - Benefit payments, including refunds of member contributions (194,710) (189,039) Administrative expense - -
Net change in plan fiduciary net position - -
Plan fiduciary net position - beginning - -
Plan fiduciary net position - ending (b) -$ -$
Plan net OPEB liability - ending (a) - (b) 11,565,916$ 11,098,821$
Plan fiduciary net position as a percentage of the total OPEB liability 0.00% 0.00%
Covered payroll 31,280,070$ 30,369,000$
Plan net OPEB liability as a percentage of covered payroll 36.98% 36.55%
*Ten year historical information is not yet available
81

San Diego Metropolitan Transit System Required Supplementary Information (Unaudited)(Continued)
For the Years Ended June 30, 2019 and 2018
SCHEDULE OF CHANGES IN TOTAL OPEB LIABILITY AND RELATED RATIOS SDTC
(LAST TEN YEARS*)
Measurement period, year ended June 30: 2018 2017
Total OPEB LiabilityService Cost 1,176,005$ 1,317,293$ Interest 1,000,292 875,283 Changes of benefit terms - - Differences between expected and actual experience - - Changes in assumptions (421,922) (2,399,513) Benefit payments, including refunds of member contributions (957,045) (929,170)
Net change in total OPEB liability 797,330 (1,136,107)
Total OPEB liability - beginning 28,722,883 29,858,990
Total OPEB liability - ending (a) 29,520,213$ 28,722,883$
OPEB fiduciary net positionContributions - employer 957,045$ 929,170$ Net investment income - - Benefit payments, including refunds of member contributions (957,045) (929,170) Administrative expense - -
Net change in plan fiduciary net position - -
Plan fiduciary net position - beginning - -
Plan fiduciary net position - ending (b) -$ -$
Plan net OPEB liability - ending (a) - (b) 29,520,213$ 28,722,883$
Plan fiduciary net position as a percentage of the total OPEB liability 0.00% 0.00%
Covered payroll 40,561,400$ 39,380,000$
Plan net OPEB liability as a percentage of covered payroll 72.78% 72.94%
*Ten year historical information is not yet available
82

SUPPLEMENTARY INFORMATION Combining Schedule of Net Position Combining Schedule of Revenues, Expenses, and Changes in Net Position Combining Statement of Cash Flows Schedule of Revenues, Expenses, and Changes in Net Position – Budget and Actual: Combined Operations General Fund Taxicab Administration San Diego & Arizona Eastern Railway MTS - Contracted Services San Diego Transit Corporation San Diego Trolley, Inc.
83

San
Die
go M
etro
pol
itan
Tra
nsi
t S
yste
m
Com
bin
ing
Sch
edu
le o
f N
et P
osit
ion
Ju
ne
30, 2
019
Gen
eral
Con
trac
ted
Ope
ratio
nsSe
rvic
esSD
TC
SDT
IT
otal
AS
SET
SC
urre
nt a
sset
s:C
ash
and
cash
equ
ival
ents
$
9
8,05
5,41
4 $
212
,006
$
(14,
759)
$
3
88,1
95
98,6
40,8
56$
C
ash
and
cash
equ
ival
ents
rest
ricte
d fo
r cap
ital s
uppo
rt
22,
690,
668
-
-
-
22,6
90,6
68
A
ccou
nts
and
othe
r rec
eiva
bles
8,6
58,5
77
-
1,7
00,8
06
3
03,8
98
10,6
63,2
81
D
ue fr
om o
ther
gov
ernm
ents
10
1,62
6,81
4
62
,476
52
,865
329
,311
10
2,07
1,46
6
Inte
rnal
bal
ance
s
(39,
873,
195)
8,8
24,6
18
1
6,62
0,53
7
14,
428,
040
-
Inve
ntor
y
-
-
4
,173
,162
16,
574,
675
20,7
47,8
37
Pr
epai
d ite
ms
and
othe
r cur
rent
ass
ets
1,2
99,4
27
1
62,7
37
8
85,8
73
1,3
86,4
90
3,73
4,52
7
Tot
al c
urre
nt a
sset
s19
2,45
7,70
5
9,26
1,83
7
23
,418
,484
33,4
10,6
09
25
8,54
8,63
5
Non
curr
ent a
sset
s:C
apita
l ass
ets
(net
of a
ccum
ulat
ed d
epre
ciat
ion)
10
2,38
0,01
5
295,
538,
041
28
8,56
3,86
2
1,
136,
841,
651
1,82
3,32
3,56
9
Tot
al n
oncu
rren
t ass
ets
10
2,38
0,01
5
295,
538,
041
28
8,56
3,86
2
1,
136,
841,
651
1,82
3,32
3,56
9
Tot
al a
sset
s29
4,83
7,72
0
304,
799,
878
31
1,98
2,34
6
1,17
0,25
2,26
0
2,
081,
872,
204
DEF
ERR
ED O
UT
FLO
WS
OF
RES
OU
RC
ESPe
nsio
n-re
late
d de
ferr
ed o
utflo
ws
of re
sour
ces
Con
trib
utio
ns m
ade
afte
r the
mea
sure
men
t dat
e
2
,041
,117
-
13,
632,
820
4,2
60,6
12
19,9
34,5
49
D
iffer
ence
s be
twee
n pr
ojec
ted
and
actu
al in
vest
men
t ea
rnin
gs
64
,183
-
8
,665
,478
325
,374
9,
055,
035
Diff
eren
ces
betw
een
expe
cted
and
act
ual e
xper
ienc
e
498
,122
-
395
,229
158
,950
1,
052,
301
Cha
nges
in e
mpl
oyer
's p
ropo
rtio
n
464
,158
-
-
- 46
4,15
8
Diff
eren
ces
betw
een
empl
oyer
con
trib
utio
ns a
nd
prop
ortio
nate
sha
re
529
,418
-
-
- 52
9,41
8
Cha
nges
in a
ssum
ptio
ns
1
,480
,062
-
-
5
,512
,898
6,
992,
960
Tot
al p
ensi
on-r
elat
ed d
efer
red
outf
low
s of
reso
urce
s
5
,077
,060
-
22,
693,
527
1
0,25
7,83
4
38,
028,
421
OPE
B-r
elat
ed d
efer
red
outf
low
s of
reso
urce
sC
ontr
ibut
ions
mad
e af
ter t
he m
easu
rem
ent d
ate
1
08,0
36
-
1,1
14,2
32
1
86,1
18
1,40
8,38
6
Tot
al d
efer
red
outf
low
s of
res
ourc
es5,
185,
096
-
23,8
07,7
59
10
,443
,952
39,4
36,8
07
84

San
Die
go M
etro
pol
itan
Tra
nsi
t S
yste
m
Com
bin
ing
Sch
edu
le o
f N
et P
osit
ion
(C
onti
nu
ed)
Jun
e 30
, 201
9
Gen
eral
Con
trac
ted
Ope
ratio
nsSe
rvic
esSD
TC
SDT
IT
otal
LIA
BIL
ITIE
SC
urre
nt li
abil
itie
s:A
ccou
nts
paya
ble
1
5,36
9,63
0
7
,651
,193
3
,628
,816
2
,776
,087
29
,425
,726
Due
to o
ther
gov
ernm
ents
6,3
42,8
51
45,6
60
1
20,5
32
3
99,7
64
6,90
8,80
7
U
near
ned
reve
nue
3
2,12
0,99
2
-
-
138
,272
32
,259
,264
Acc
rued
exp
ense
s
611
,740
16
,891
1
,181
,421
1
,304
,310
3,
114,
362
Ret
entio
ns p
ayab
le
5
,443
,454
-
467
3
,016
5,
446,
937
Due
with
in o
ne y
ear:
Com
pens
ated
abs
ence
s pa
yabl
e
671
,456
-
3
,049
,850
2
,328
,645
6,
049,
951
Acc
rued
dam
age,
inju
ry, a
nd e
mpl
oyee
cla
ims
4
39,3
32
-
3,2
89,3
20
1,2
69,7
60
4,99
8,41
2
Lo
ng-t
erm
deb
t
363
,072
-
2
,555
,000
- 2,
918,
072
Tot
al c
urre
nt li
abil
itie
s61
,362
,527
7,71
3,74
4
13
,825
,406
8,21
9,85
4
91
,121
,531
Non
curr
ent l
iabi
liti
es:
Due
in m
ore
than
one
yea
r:C
ompe
nsat
ed a
bsen
ces
paya
ble
477,
402
-
3,
763,
360
567,
288
4,
808,
050
Acc
rued
dam
age,
inju
ry, a
nd e
mpl
oyee
cla
ims
551,
490
-
8,
741,
276
1,54
5,47
3
10
,838
,239
Long
-ter
m d
ebt
-
-
10,3
55,0
00
-
10
,355
,000
Agg
rega
te n
et p
ensi
on li
abili
ty12
,982
,663
-
134,
061,
376
31
,319
,372
178,
363,
411
A
ggre
gate
tota
l OPE
B li
abili
ty6,
025,
074
-
29,5
20,2
13
11
,565
,916
47,1
11,2
03
Tot
al n
oncu
rren
t lia
bili
ties
20,0
36,6
29
-
18
6,44
1,22
5
44,9
98,0
49
25
1,47
5,90
3
Tot
al li
abil
itie
s81
,399
,156
7,71
3,74
4
20
0,26
6,63
1
53,2
17,9
03
34
2,59
7,43
4
85
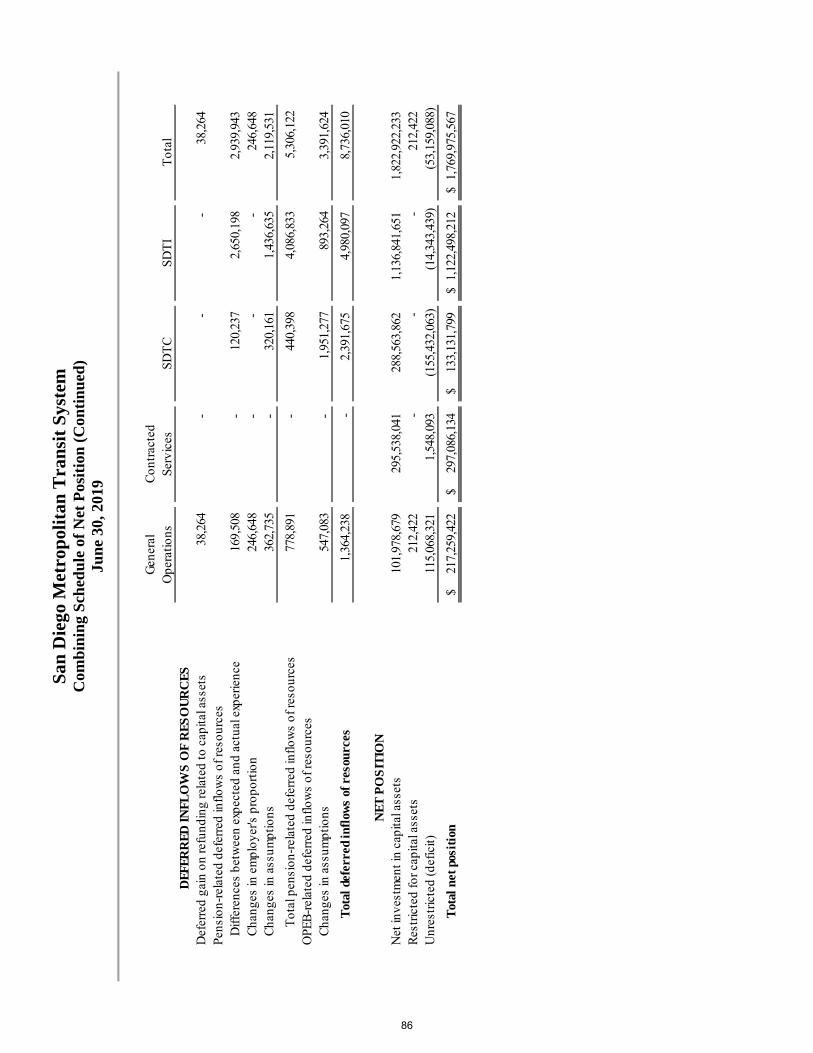
San
Die
go M
etro
pol
itan
Tra
nsi
t S
yste
m
Com
bin
ing
Sch
edu
le o
f N
et P
osit
ion
(C
onti
nu
ed)
Jun
e 30
, 201
9
Gen
eral
Con
trac
ted
Ope
ratio
nsSe
rvic
esSD
TC
SDT
IT
otal
DEF
ERR
ED IN
FLO
WS
OF
RES
OU
RC
ESD
efer
red
gain
on
refu
ndin
g re
late
d to
cap
ital a
sset
s
38
,264
-
-
- 38
,264
Pens
ion-
rela
ted
defe
rred
inflo
ws
of re
sour
ces
Diff
eren
ces
betw
een
expe
cted
and
act
ual e
xper
ienc
e
169
,508
-
120
,237
2
,650
,198
2,
939,
943
Cha
nges
in e
mpl
oyer
's p
ropo
rtio
n
246
,648
-
-
- 24
6,64
8
Cha
nges
in a
ssum
ptio
ns
362
,735
-
320
,161
1
,436
,635
2,
119,
531
Tot
al p
ensi
on-r
elat
ed d
efer
red
inflo
ws
of re
sour
ces
7
78,8
91
-
4
40,3
98
4,0
86,8
33
5,3
06,1
22
OPE
B-r
elat
ed d
efer
red
inflo
ws
of re
sour
ces
Cha
nges
in a
ssum
ptio
ns
547
,083
-
1
,951
,277
893
,264
3,
391,
624
Tot
al d
efer
red
infl
ows
of r
esou
rces
1,36
4,23
8
-
2,
391,
675
4,98
0,09
7
8,
736,
010
NET
PO
SIT
ION
Net
inve
stm
ent i
n ca
pita
l ass
ets
101,
978,
679
29
5,53
8,04
1
288,
563,
862
1,
136,
841,
651
1,82
2,92
2,23
3
R
estr
icte
d fo
r cap
ital a
sset
s21
2,42
2
-
-
-
212,
422
U
nres
tric
ted
(def
icit)
115,
068,
321
1,
548,
093
(155
,432
,063
)
(14,
343,
439)
(5
3,15
9,08
8)
Tot
al n
et p
osit
ion
217,
259,
422
$
29
7,08
6,13
4$
133,
131,
799
$
1,
122,
498,
212
$
1,76
9,97
5,56
7$
86

San
Die
go M
etro
pol
itan
Tra
nsi
t S
yste
m
Com
bin
ing
Sch
edu
le o
f R
even
ues
, Exp
ense
s, a
nd
Ch
ange
s in
Net
Pos
itio
n F
or t
he
Yea
r E
nd
ed J
un
e 30
, 201
9
Gen
eral
Con
trac
ted
Ope
ratio
nsSe
rvic
esSD
TC
SDT
IEl
imin
atio
nsT
otal
Ope
rati
ng r
even
ues:
Pass
enge
r rev
enue
$
-
$
2
8,17
8,28
5 $
22,
041,
356
$
4
2,00
5,52
5 $
- 92
,225
,166
$
Adv
ertis
ing
1,6
04,0
25
-
-
-
-
1,60
4,02
5
M
isce
llane
ous
1
8,03
3,89
9
1
,365
6
,127
789
,453
- 18
,830
,844
Tot
al o
pera
ting
rev
enue
s19
,637
,924
28,1
79,6
50
22
,047
,483
42,7
94,9
78
-
11
2,66
0,03
5
Ope
rati
ng e
xpen
ses:
Pers
onne
l cos
ts
23,
688,
427
7
05,7
66
8
2,15
2,28
4
39,
459,
147
-
146,
005,
624
O
utsi
de s
ervi
ces
1
7,90
7,13
7
79,
094,
438
2,0
75,7
49
8,7
68,4
75
-
107,
845,
799
T
rans
it op
erat
ions
fund
ing
11
7,42
6,98
1
-
-
-
(1
16,9
28,8
00)
498,
181
M
ater
ials
and
sup
plie
s
21
,064
25
,635
6
,409
,354
6
,470
,470
- 12
,926
,523
Ener
gy c
osts
2
46,3
27
8,2
33,7
69
5,5
78,0
23
1
4,72
5,94
4
- 28
,784
,063
Ris
k m
anag
emen
t
325
,645
15
,300
1
,122
,273
719
,878
- 2,
183,
096
Mis
cella
neou
s
(20,
698,
557)
2,8
67,4
83
7,5
94,6
11
1
5,68
2,72
9
- 5,
446,
266
Dep
reci
atio
n
3
,106
,473
22,
706,
135
2
9,46
7,42
9
67,
726,
659
-
123,
006,
696
Tot
al o
pera
ting
exp
ense
s14
2,02
3,49
7
113,
648,
526
13
4,39
9,72
3
153,
553,
302
(1
16,9
28,8
00)
42
6,69
6,24
8
Ope
rati
ng in
com
e (l
oss)
(122
,385
,573
)
(85,
468,
876)
(1
12,3
52,2
40)
(1
10,7
58,3
24)
11
6,92
8,80
0
(314
,036
,213
)
87

San
Die
go M
etro
pol
itan
Tra
nsi
t S
yste
m
Com
bin
ing
Sch
edu
le o
f R
even
ues
, Exp
ense
s, a
nd
Ch
ange
s in
Net
Pos
itio
n (
Con
tin
ued
) F
or t
he
Yea
r E
nd
ed J
un
e 30
, 201
9
Gen
eral
Con
trac
ted
Ope
ratio
nsSe
rvic
esSD
TC
SDT
IEl
imin
atio
nsT
otal
Pub
lic
supp
ort a
nd n
onop
erat
ing
reve
nues
(exp
ense
s):
Fede
ral r
even
ue
66,
068,
502
1
5,61
2,91
1
20,
500,
000
2
4,75
0,99
3
(60,
863,
904)
66,0
68,5
02
T
rans
port
atio
n D
evel
opm
ent A
ct (T
DA
) fun
ds
96,
654,
680
4
1,37
1,33
9
2
,925
,267
15,
508,
830
(5
9,80
5,43
6)96
,654
,680
Stat
e T
rans
it A
ssis
tanc
e (S
TA
) fun
ds
32,
382,
645
-
6,8
66,1
13
1,2
66,6
34
(
8,13
2,74
7)32
,382
,645
Stat
e re
venu
e - o
ther
1,8
28,9
98
73,4
73
2
58,8
57
2
36,1
68
(56
8,49
8)1,
828,
998
Tran
sNet
fun
ds
51,
050,
475
4,9
24,5
37
4
0,62
5,93
8
-
(51,
050,
475)
45,5
50,4
75
O
ther
loca
l sub
sidi
es
1
,058
,481
780
,481
278
,000
-
(1,
058,
481)
1,05
8,48
1
In
vest
men
t ear
ning
s
1
,952
,467
-
-
-
- 1,
952,
467
Inte
rest
exp
ense
55,9
79
-
(72
7,38
1)
-
- (6
71,4
02)
G
ain
(loss
) on
disp
osal
of a
sset
s
(44,
602)
-
(9,3
20)
(
2,29
7,56
9)
- (2
,351
,491
)
Tot
al p
ubli
c su
ppor
t and
non
oper
atin
g re
venu
es
(exp
ense
s)25
1,00
7,62
5
62,7
62,7
41
70
,717
,474
39,4
65,0
56
(1
81,4
79,5
41)
24
2,47
3,35
5
Inco
me
(los
s) b
efor
e tr
ansf
ers
and
cont
ribu
ted
capi
tal
128,
622,
052
(2
2,70
6,13
5)
(41,
634,
766)
(7
1,29
3,26
8)
(64,
550,
741)
(7
1,56
2,85
8)
Tra
nsfe
rs
(64,
550,
741)
-
-
-
6
4,55
0,74
1 -
C
ontr
ibut
ed c
apita
l, ne
t
(59,
947,
310)
9
7,70
4,39
6
6
,554
,661
62,
280,
366
-
106,
592,
113
Cha
nges
in n
et p
osit
ion
4,12
4,00
1
74
,998
,261
(35,
080,
105)
(9
,012
,902
)
-
35
,029
,255
Net
Pos
itio
n:
Beg
inni
ng o
f yea
r21
3,13
5,42
1
222,
087,
873
16
8,21
1,90
4
1,13
1,51
1,11
4
-
1,
734,
946,
312
End
of y
ear
217,
259,
422
$
29
7,08
6,13
4$
133,
131,
799
$
1,
122,
498,
212
$
-$
1,76
9,97
5,56
7$
88

San
Die
go M
etro
pol
itan
Tra
nsi
t S
yste
m
Com
bin
ing
Sch
edu
le o
f C
ash
Flo
ws
For
th
e Y
ear
En
ded
Ju
ne
30, 2
019
Gen
eral
Con
trac
ted
Ope
ratio
nsSe
rvic
esSD
TC
SDT
IT
otal
Cas
h fl
ows
from
ope
rati
ng a
ctiv
itie
s:R
ecei
pts
from
cus
tom
ers
and
user
s $
20,9
19,4
52
$
28
,179
,731
$
21,8
68,1
79
$
42
,652
,985
11
3,62
0,34
7$
Pa
ymen
ts to
sup
plie
rs
3,7
51,3
99
(89,
483,
940)
(21,
647,
227)
(46,
461,
139)
(153
,840
,907
)
Pa
ymen
ts to
em
ploy
ees
(22,
462,
190)
(7
05,8
11)
(71,
120,
053)
(3
8,30
5,98
4)
(132
,594
,038
)
Pa
ymen
ts fo
r dam
age
and
inju
ry
(1
76,6
80)
-
(3
63,4
83)
(937
,898
)(1
,478
,061
)
Net
cas
h pr
ovid
ed b
y (u
sed
in) o
pera
ting
act
ivit
ies
2,03
1,98
1
(6
2,01
0,02
0)
(71,
262,
584)
(4
3,05
2,03
6)
(174
,292
,659
)
Cas
h fl
ows
from
non
capi
tal f
inan
cing
act
ivit
ies:
Publ
ic s
uppo
rt fu
nds
rece
ived
69
,833
,847
63,6
79,5
90
74
,739
,765
43,7
63,0
56
252,
016,
258
Net
cas
h pr
ovid
ed b
y no
ncap
ital
fina
ncin
g ac
tivi
ties
69
,833
,847
63,6
79,5
90
74
,739
,765
43,7
63,0
56
252
,016
,258
Cas
h fl
ows
from
cap
ital
and
rel
ated
fina
ncin
g ac
tivi
ties
:D
ebt s
ervi
ce c
osts
(708
,197
)
-
(3
,157
,381
)
-
(3,8
65,5
78)
Pr
oper
ty a
cqui
sitio
n
(5
5,89
2,22
9)
-
-
-
(55,
892,
229)
Pr
ocee
ds fr
om d
ispo
sal o
f ass
ets
112
,831
-
2,65
0
6,
750
122,
231
Net
cas
h pr
ovid
ed b
y (u
sed
in) c
apit
al a
nd r
elat
ed fi
nanc
ing
acti
viti
es
(5
6,48
7,59
5)
-
(3
,154
,731
)
6,
750
(59,
635,
576)
Cas
h fl
ows
from
inve
stin
g ac
tivi
ties
:In
tere
st re
ceiv
ed o
n in
vest
men
ts1,
408,
439
-
-
-
1,40
8,43
9
Net
cas
h pr
ovid
ed b
y in
vest
ing
acti
viti
es1,
408,
439
-
-
-
1,40
8,43
9
Net
incr
ease
in c
ash
and
cash
equ
ival
ents
16,7
86,6
72
1,66
9,57
0
32
2,45
0
717,
770
19
,496
,462
Cas
h an
d ca
sh e
quiv
alen
ts:
Beg
inni
ng o
f yea
r10
3,95
9,41
0
(1
,457
,564
)
(337
,209
)
(3
29,5
75)
101,
835,
062
End
of y
ear
120,
746,
082
$
212,
006
$
(1
4,75
9)$
388,
195
$
12
1,33
1,52
4$
Cas
h an
d ca
sh e
quiv
alen
ts:
Cas
h an
d ca
sh e
quiv
alen
ts98
,055
,414
$
21
2,00
6$
(14,
759)
$
38
8,19
5$
98,6
40,8
56$
Cas
h re
stric
ted
for c
apita
l sup
port
22,6
90,6
68
-
-
-
22,6
90,6
68
Tot
al c
ash
and
cash
equ
ival
ents
120,
746,
082
$
212,
006
$
(1
4,75
9)$
388,
195
$
12
1,33
1,52
4$
89

San
Die
go M
etro
pol
itan
Tra
nsi
t S
yste
m
Com
bin
ing
Sch
edu
le o
f C
ash
Flo
ws
(Con
tin
ued
) F
or t
he
Yea
r E
nd
ed J
un
e 30
, 201
9
Gen
eral
Con
trac
ted
Ope
ratio
nsSe
rvic
esSD
TC
SDT
IT
otal
Rec
onci
liat
ion
of O
pera
ting
(L
oss)
to N
et C
ash
(Use
d In
) Ope
rati
ng
Act
ivit
ies
Ope
rati
ng (l
oss)
: $
(5,4
56,7
73)
$
(85,
468,
876)
$ (
112,
352,
240)
$ (
110,
758,
324)
(314
,036
,213
)$
A
djus
tmen
ts to
reco
ncile
ope
ratin
g (lo
ss) t
o ne
t cas
h (u
sed
in) o
pera
ting
activ
ities
Dep
reci
atio
n
3,1
06,4
73
22
,706
,135
29,4
67,4
29
67
,726
,659
12
3,00
6,69
6
(I
ncre
ase)
dec
reas
e in
:A
ccou
nts
and
othe
r rec
eiva
bles
(925
,284
)
81
(90
,165
)
(2
16,7
02)
(1,2
32,0
70)
D
ue fr
om o
ther
gov
ernm
ents
799
,454
-
-
-
799,
454
In
vent
ory
-
-
(714
,573
)
(1,7
86,9
61)
(2,5
01,5
34)
Pr
epai
d ex
pens
es a
nd o
ther
cur
rent
ass
ets
(29
,940
)
15,
300
2
2,97
2
(
90,8
38)
(82,
506)
In
crea
se (d
ecre
ase)
in:
Acc
ount
s pa
yabl
e
2,7
29,7
75
703
,433
3
03,8
72
223
,794
3,
960,
874
Due
to o
ther
gov
ernm
ents
(716
,895
)
33,
952
7,23
2
1
88,6
89
(487
,022
)
A
ccru
ed e
xpen
ses
(36
,882
)
(45)
(9
,230
)
1
69,7
53
123,
596
U
near
ned
reve
nue
1
,407
,358
-
-
74,
709
1,48
2,06
7
A
ggre
gate
net
pen
sion
liab
ility
731
,214
-
10
,219
,347
6
48,0
37
11,5
98,5
98
Agg
rega
te to
tal O
PEB
liab
ility
456
,795
-
585
,533
4
75,3
25
1,51
7,65
3
C
ompe
nsat
ed a
bsen
ces
4,55
3
-
(18
,731
)
1
18,4
25
104,
247
A
ccru
ed d
amag
e, in
jury
and
em
ploy
ee c
laim
s
(
37,8
67)
-
1,3
15,9
70
175
,398
1,
453,
501
Tot
al a
djus
tmen
ts
7,4
88,7
54
23
,458
,856
41,0
89,6
56
67
,706
,288
1
39,7
43,5
54
Net
cas
h (u
sed
in) o
pera
ting
act
ivit
ies
2,03
1,98
1$
(6
2,01
0,02
0)$
(71,
262,
584)
$
(4
3,05
2,03
6)$
(174
,292
,659
)$
Non
cash
inve
stin
g, c
apit
al a
nd fi
nanc
ing
acti
viti
es:
Dur
ing
the
year
, SA
ND
AG
con
trib
uted
$10
6,59
2,11
3 in
cap
ital a
sset
s an
d in
vent
ory
part
s.D
urin
g th
e ye
ar, t
he fa
ir va
lue
of in
vest
men
ts in
crea
sed
by $
59,2
51.
90
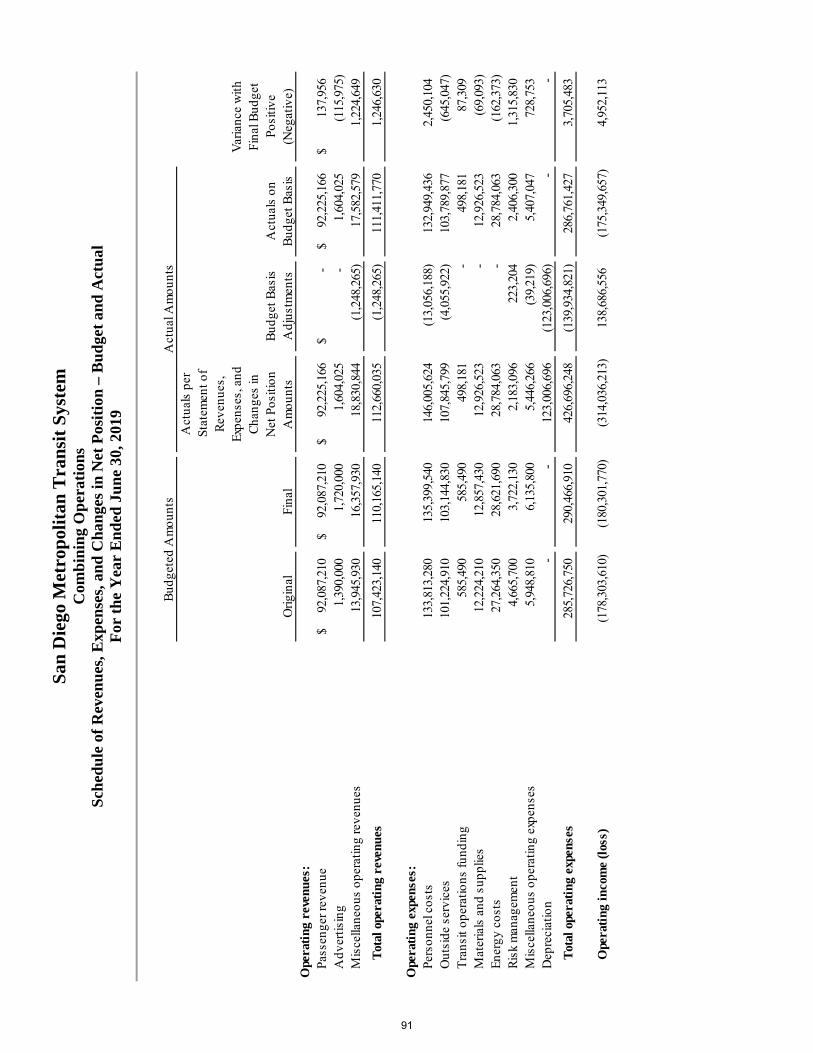
San
Die
go M
etro
pol
itan
Tra
nsi
t S
yste
m
Com
bin
ing
Op
erat
ion
s S
ched
ule
of
Rev
enu
es, E
xpen
ses,
an
d C
han
ges
in N
et P
osit
ion
– B
ud
get
and
Act
ual
F
or t
he
Yea
r E
nd
ed J
un
e 30
, 201
9
Act
uals
per
Stat
emen
t of
Rev
enue
s,Ex
pens
es, a
ndV
aria
nce
with
Cha
nges
inFi
nal B
udge
tN
et P
ositi
onB
udge
t Bas
isA
ctua
ls o
nPo
sitiv
eO
rigin
alFi
nal
Am
ount
sA
djus
tmen
tsB
udge
t Bas
is(N
egat
ive)
Ope
rati
ng r
even
ues:
Pass
enge
r rev
enue
92,0
87,2
10$
92,0
87,2
10$
92,2
25,1
66$
-
$
92
,225
,166
$
13
7,95
6$
Adv
ertis
ing
1,39
0,00
0
1,
720,
000
1,60
4,02
5
-
1,
604,
025
(115
,975
)
M
isce
llane
ous
oper
atin
g re
venu
es13
,945
,930
16
,357
,930
18
,830
,844
(1,2
48,2
65)
17
,582
,579
1,
224,
649
Tot
al o
pera
ting
rev
enue
s10
7,42
3,14
0
11
0,16
5,14
0
11
2,66
0,03
5
(1,2
48,2
65)
11
1,41
1,77
0
1,
246,
630
Ope
rati
ng e
xpen
ses:
Pers
onne
l cos
ts13
3,81
3,28
0
1
35,3
99,5
40
146,
005,
624
(1
3,05
6,18
8)13
2,94
9,43
6
2,
450,
104
Out
side
ser
vice
s10
1,22
4,91
0
1
03,1
44,8
30
107,
845,
799
(4,0
55,9
22)
103,
789,
877
(645
,047
)
T
rans
it op
erat
ions
fund
ing
585,
490
5
85,4
90
498,
181
-
498,
181
87
,309
M
ater
ials
and
sup
plie
s12
,224
,210
12,8
57,4
30
12,9
26,5
23
-
12,9
26,5
23
(69,
093)
En
ergy
cos
ts27
,264
,350
28,6
21,6
90
28,7
84,0
63
-
28,7
84,0
63
(162
,373
)
R
isk
man
agem
ent
4,66
5,70
0
3,7
22,1
30
2,18
3,09
6
2
23,2
04
2,40
6,30
0
1,
315,
830
Mis
cella
neou
s op
erat
ing
expe
nses
5,94
8,81
0
6,1
35,8
00
5,44
6,26
6
(
39,2
19)
5,40
7,04
7
72
8,75
3
Dep
reci
atio
n-
-
123,
006,
696
(12
3,00
6,69
6)-
-
Tot
al o
pera
ting
exp
ense
s28
5,72
6,75
0
29
0,46
6,91
0
42
6,69
6,24
8
(139
,934
,821
)
28
6,76
1,42
7
3,
705,
483
Ope
rati
ng in
com
e (l
oss)
(178
,303
,610
)
(1
80,3
01,7
70)
(314
,036
,213
)
138,
686,
556
(175
,349
,657
)
4,
952,
113
Bud
gete
d A
mou
nts
Act
ual A
mou
nts
91
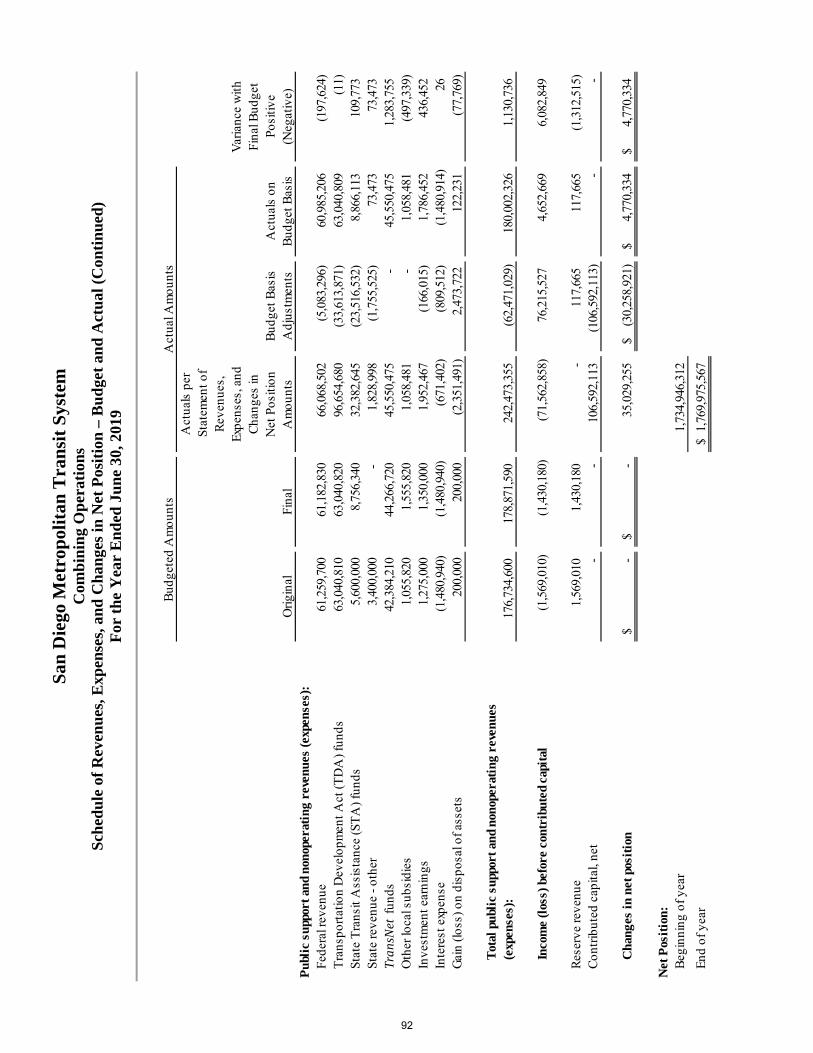
San
Die
go M
etro
pol
itan
Tra
nsi
t S
yste
m
Com
bin
ing
Op
erat
ion
s S
ched
ule
of
Rev
enu
es, E
xpen
ses,
an
d C
han
ges
in N
et P
osit
ion
– B
ud
get
and
Act
ual
(C
onti
nue
d)
For
th
e Y
ear
En
ded
Ju
ne
30, 2
019
Act
uals
per
Stat
emen
t of
Rev
enue
s,Ex
pens
es, a
ndV
aria
nce
with
Cha
nges
inFi
nal B
udge
tN
et P
ositi
onB
udge
t Bas
isA
ctua
ls o
nPo
sitiv
eO
rigin
alFi
nal
Am
ount
sA
djus
tmen
tsB
udge
t Bas
is(N
egat
ive)
Pub
lic
supp
ort a
nd n
onop
erat
ing
reve
nues
(exp
ense
s):
Fede
ral r
even
ue
61,2
59,7
00
61
,182
,830
66
,068
,502
(5
,083
,296
)60
,985
,206
(1
97,6
24)
Tra
nspo
rtat
ion
Dev
elop
men
t Act
(TD
A) f
unds
63
,040
,810
63,0
40,8
20
96,6
54,6
80
(3
3,61
3,87
1)63
,040
,809
(1
1)
Stat
e T
rans
it A
ssis
tanc
e (S
TA
) fun
ds
5,6
00,0
00
8
,756
,340
32
,382
,645
(23,
516,
532)
8,86
6,11
3
10
9,77
3
Stat
e re
venu
e - o
ther
3
,400
,000
-
1,82
8,99
8
(1,7
55,5
25)
73,4
73
73,4
73
Tran
sNet
fun
ds
42,3
84,2
10
44
,266
,720
45
,550
,475
- 45
,550
,475
1,
283,
755
Oth
er lo
cal s
ubsi
dies
1
,055
,820
1,5
55,8
20
1,05
8,48
1
-
1,05
8,48
1
(4
97,3
39)
Inve
stm
ent e
arni
ngs
1
,275
,000
1,3
50,0
00
1,95
2,46
7
(1
66,0
15)
1,78
6,45
2
43
6,45
2
Inte
rest
exp
ense
(1
,480
,940
)
(1,4
80,9
40)
(671
,402
)
(809
,512
)(1
,480
,914
)
26
G
ain
(loss
) on
disp
osal
of a
sset
s
2
00,0
00
200
,000
(2
,351
,491
)
2,4
73,7
22
122,
231
(7
7,76
9)
Tot
al p
ubli
c su
ppor
t and
non
oper
atin
g re
venu
es
(exp
ense
s):
176,
734,
600
178,
871,
590
242,
473,
355
(6
2,47
1,02
9)
180,
002,
326
1,13
0,73
6
Inco
me
(los
s) b
efor
e co
ntri
bute
d ca
pita
l(1
,569
,010
)
(1,4
30,1
80)
(7
1,56
2,85
8)
76,2
15,5
27
4,65
2,66
9
6,
082,
849
Res
erve
reve
nue
1,56
9,01
0
1,
430,
180
-
117,
665
11
7,66
5
(1,3
12,5
15)
C
ontr
ibut
ed c
apita
l, ne
t-
-
10
6,59
2,11
3
(106
,592
,113
)
-
-
Cha
nges
in n
et p
osit
ion
-$
-$
35,0
29,2
55
(3
0,25
8,92
1)$
4,77
0,33
4$
4,
770,
334
$
Net
Pos
itio
n:B
egin
ning
of y
ear
1,73
4,94
6,31
2
End
of y
ear
1,76
9,97
5,56
7$
Bud
gete
d A
mou
nts
Act
ual A
mou
nts
92

San
Die
go M
etro
pol
itan
Tra
nsi
t S
yste
m
Gen
eral
Ope
rati
ons
Sch
edu
le o
f R
even
ues
, Exp
ense
s, a
nd
Ch
ange
s in
Net
Pos
itio
n –
Bu
dge
t an
d A
ctu
al
For
th
e Y
ear
En
ded
Ju
ne
30, 2
019
Act
uals
per
Stat
emen
t of
Rev
enue
s,Ex
pens
es, a
ndV
aria
nce
with
Cha
nges
inFi
nal B
udge
tN
et P
ositi
onB
udge
t Bas
isA
ctua
ls o
nPo
sitiv
eO
rigin
alFi
nal
Am
ount
sA
djus
tmen
tsB
udge
t Bas
is(N
egat
ive)
Ope
rati
ng r
even
ues:
Adv
ertis
ing
1,39
0,00
0$
1,
720,
000
$
1,60
4,02
5$
-
$
1,
604,
025
$
(115
,975
)$
M
isce
llane
ous
oper
atin
g re
venu
es11
,900
,930
14
,424
,730
15
,905
,864
(248
,265
)
15
,657
,599
1,
232,
869
Tot
al o
pera
ting
rev
enue
s13
,290
,930
16
,144
,730
17
,509
,889
(248
,265
)
17
,261
,624
1,
116,
894
Ope
rati
ng e
xpen
ses:
Pers
onne
l cos
ts20
,088
,940
21,4
67,5
00
2
2,86
0,04
0
(1,3
67,9
85)
21,4
92,0
55
(24,
555)
O
utsi
de s
ervi
ces
16,0
96,7
50
16
,417
,380
17,
781,
980
(635
,174
)17
,146
,806
(7
29,4
26)
Tra
nsit
oper
atio
ns fu
ndin
g58
5,49
0
585
,490
117,
426,
981
(
116,
928,
800)
498,
181
87
,309
M
ater
ials
and
sup
plie
s6,
370
1
6,64
0
20
,718
-
20,7
18
(4,0
78)
Ener
gy c
osts
210,
070
2
38,4
00
2
28,5
26
- 22
8,52
6
9,87
4
R
isk
man
agem
ent
435,
100
3
73,5
80
2
60,0
35
(37
,867
)22
2,16
8
151,
412
M
isce
llane
ous
oper
atin
g ex
pens
es(2
1,37
5,36
0)
(20,
342,
830)
(2
0,90
6,95
6)
-
(20,
906,
956)
56
4,12
6
Dep
reci
atio
n-
-
3,0
83,3
43
(3
,083
,343
)-
-
Tot
al o
pera
ting
exp
ense
s16
,047
,360
18
,756
,160
14
0,75
4,66
7
(122
,053
,169
)
18
,701
,498
54
,662
Ope
rati
ng in
com
e (l
oss)
(2,7
56,4
30)
(2
,611
,430
)
(123
,244
,778
)
121,
804,
904
(1,4
39,8
74)
1,
171,
556
Bud
gete
d A
mou
nts
Act
ual A
mou
nts
93

San
Die
go M
etro
pol
itan
Tra
nsi
t S
yste
m
Gen
eral
Ope
rati
ons
Sch
edu
le o
f R
even
ues
, Exp
ense
s, a
nd
Ch
ange
s in
Net
Pos
itio
n –
Bu
dge
t an
d A
ctu
al (
Con
tin
ued
) F
or t
he
Yea
r E
nd
ed J
un
e 30
, 201
9
Act
uals
per
Stat
emen
t of
Rev
enue
s,Ex
pens
es, a
ndV
aria
nce
with
Cha
nges
inFi
nal B
udge
tN
et P
ositi
onB
udge
t Bas
isA
ctua
ls o
nPo
sitiv
eO
rigin
alFi
nal
Am
ount
sA
djus
tmen
tsB
udge
t Bas
is(N
egat
ive)
Pub
lic
supp
ort a
nd n
onop
erat
ing
reve
nues
(exp
ense
s):
Fede
ral r
even
ue
1
40,0
00
120
,000
66,
068,
502
(65,
917,
968)
150,
534
30
,534
T
rans
port
atio
n D
evel
opm
ent A
ct (T
DA
) fun
ds
5
85,4
90
585
,490
96,
654,
680
(91,
750,
231)
4,90
4,44
9
4,
318,
959
Stat
e T
rans
it A
ssis
tanc
e (S
TA
) fun
ds
-
-
32,
382,
645
(32,
382,
645)
-
-
Stat
e re
venu
e - o
ther
-
-
1,8
28,9
98
(1
,828
,998
)-
-
Tr
ansN
et fu
nds
-
-
5
1,05
0,47
5
(5
1,05
0,47
5)-
-
O
ther
loca
l sub
sidi
es
-
-
1
,058
,481
(1,0
58,4
81)
-
-
Inve
stm
ent e
arni
ngs
1
,275
,000
1,3
50,0
00
1,9
52,4
67
(166
,015
)1,
786,
452
436,
452
In
tere
st e
xpen
se
(7
44,0
60)
(744
,060
)
55
,979
(8
00,0
37)
(744
,058
)
2
Gai
n (lo
ss) o
n di
spos
al o
f ass
ets
200
,000
2
00,0
00
(4
4,60
2)
1
57,4
33
112,
831
(8
7,16
9)
Tot
al p
ubli
c su
ppor
t and
non
oper
atin
g re
venu
es
(exp
ense
s):
1,45
6,43
0
1,
511,
430
251,
007,
625
(2
44,7
97,4
17)
6,21
0,20
8
4,
698,
778
Inco
me
(los
s) b
efor
e tr
ansf
ers
and
cont
ribu
ted
capi
tal
(1,3
00,0
00)
(1
,100
,000
)
127,
762,
847
(1
22,9
92,5
13)
4,77
0,33
4
5,
870,
334
Tra
nsfe
rs-
-
(6
4,55
0,74
1)
64,5
50,7
41
-
-
Res
erve
reve
nue
1,30
0,00
0
1,
100,
000
991,
000
(9
91,0
00)
-
(1,1
00,0
00)
C
ontr
ibut
ed c
apita
l, ne
t-
-
(5
8,94
7,31
0)
58,9
47,3
10
-
-
Cha
nges
in n
et p
osit
ion
-$
-$
5,25
5,79
6
(4
85,4
62)
$
4,77
0,33
4$
4,
770,
334
$
Net
Pos
itio
n:B
egin
ning
of y
ear
194,
180,
568
End
of y
ear
199,
436,
364
$
Bud
gete
d A
mou
nts
Act
ual A
mou
nts
94
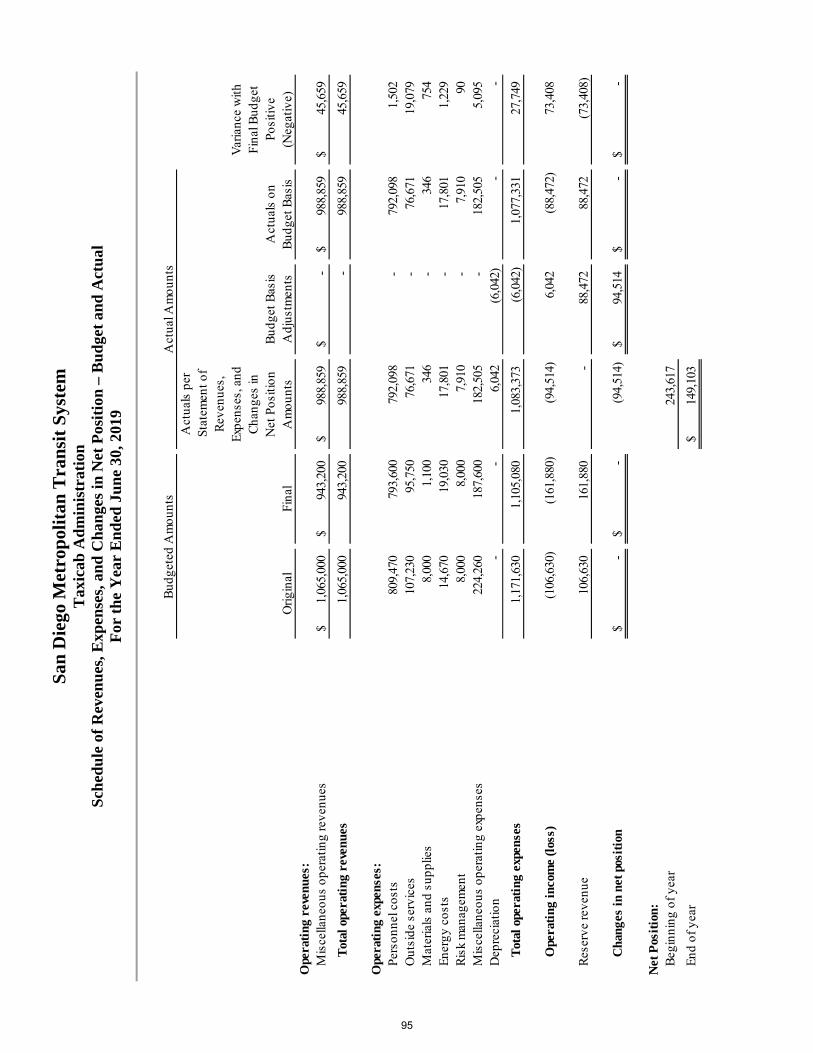
San
Die
go M
etro
pol
itan
Tra
nsi
t S
yste
m
Tax
icab
Ad
min
istr
atio
n
Sch
edu
le o
f R
even
ues
, Exp
ense
s, a
nd
Ch
ange
s in
Net
Pos
itio
n –
Bu
dge
t an
d A
ctu
al
For
th
e Y
ear
En
ded
Ju
ne
30, 2
019
Act
uals
per
Stat
emen
t of
Rev
enue
s,Ex
pens
es, a
ndV
aria
nce
with
Cha
nges
inFi
nal B
udge
tN
et P
ositi
onB
udge
t Bas
isA
ctua
ls o
nPo
sitiv
eO
rigin
alFi
nal
Am
ount
sA
djus
tmen
tsB
udge
t Bas
is(N
egat
ive)
Ope
rati
ng r
even
ues:
Mis
cella
neou
s op
erat
ing
reve
nues
1,06
5,00
0$
94
3,20
0$
988,
859
$
-
$
98
8,85
9$
45,6
59$
Tot
al o
pera
ting
rev
enue
s1,
065,
000
943,
200
98
8,85
9
-
988,
859
45
,659
Ope
rati
ng e
xpen
ses:
Pers
onne
l cos
ts80
9,47
0
793
,600
7
92,0
98
- 79
2,09
8
1,50
2
O
utsi
de s
ervi
ces
107,
230
95,
750
7
6,67
1
-
76,6
71
19,0
79
Mat
eria
ls a
nd s
uppl
ies
8,00
0
1,
100
34
6
-
346
75
4
Ener
gy c
osts
14,6
70
1
9,03
0
17,
801
- 17
,801
1,
229
Ris
k m
anag
emen
t8,
000
8,00
0
7,
910
- 7,
910
90
M
isce
llane
ous
oper
atin
g ex
pens
es22
4,26
0
187
,600
1
82,5
05
- 18
2,50
5
5,09
5
D
epre
ciat
ion
-
-
6,
042
(6
,042
)-
-
Tot
al o
pera
ting
exp
ense
s1,
171,
630
1,10
5,08
0
1,
083,
373
(6,0
42)
1,07
7,33
1
27
,749
Ope
rati
ng in
com
e (l
oss)
(106
,630
)
(1
61,8
80)
(94,
514)
6,
042
(88,
472)
73
,408
Res
erve
reve
nue
106,
630
16
1,88
0
-
88,4
72
88,4
72
(73,
408)
Cha
nges
in n
et p
osit
ion
-$
-$
(94,
514)
94
,514
$
-
$
-
$
Net
Pos
itio
n:B
egin
ning
of y
ear
243,
617
End
of y
ear
149,
103
$
Bud
gete
d A
mou
nts
Act
ual A
mou
nts
95

San
Die
go M
etro
pol
itan
Tra
nsi
t S
yste
m
San
Die
go a
nd
Ari
zon
a E
aste
rn R
ailw
ay
Sch
edu
le o
f R
even
ues
, Exp
ense
s, a
nd
Ch
ange
s in
Net
Pos
itio
n –
Bu
dge
t an
d A
ctu
al
For
th
e Y
ear
En
ded
Ju
ne
30, 2
019
Act
uals
per
Stat
emen
t of
Rev
enue
s,Ex
pens
es, a
ndV
aria
nce
with
Cha
nges
inFi
nal B
udge
tN
et P
ositi
onB
udge
t Bas
isA
ctua
ls o
nPo
sitiv
eO
rigin
alFi
nal
Am
ount
sA
djus
tmen
tsB
udge
t Bas
is(N
egat
ive)
Ope
rati
ng r
even
ues:
Mis
cella
neou
s op
erat
ing
reve
nues
245,
000
$
15
0,00
0$
1,13
9,17
6$
(1
,000
,000
)$
139,
176
$
(1
0,82
4)$
Tot
al o
pera
ting
rev
enue
s24
5,00
0
150,
000
1,
139,
176
(1,0
00,0
00)
13
9,17
6
(10,
824)
Ope
rati
ng e
xpen
ses:
Pers
onne
l cos
ts53
,000
31,
000
3
6,28
9
-
36,2
89
(5,2
89)
Out
side
ser
vice
s21
0,00
0
140
,000
48,
486
- 48
,486
91
,514
R
isk
man
agem
ent
120,
300
1
17,3
00
5
7,70
0
-
57,7
00
59,6
00
Mis
cella
neou
s op
erat
ing
expe
nses
24,0
80
3
0,00
0
25,
894
- 25
,894
4,
106
Dep
reci
atio
n-
-
1
7,08
8
(
17,0
88)
-
-
Tot
al o
pera
ting
exp
ense
s40
7,38
0
318,
300
18
5,45
7
(17,
088)
16
8,36
9
149,
931
Ope
rati
ng in
com
e (l
oss)
(162
,380
)
(1
68,3
00)
953,
719
(9
82,9
12)
(29,
193)
13
9,10
7
Res
erve
reve
nue
162,
380
16
8,30
0
(991
,000
)
1,
020,
193
29,1
93
(139
,107
)
C
ontr
ibut
ed c
apita
l, ne
t-
-
(1
,000
,000
)
1,00
0,00
0
-
-
Cha
nges
in n
et p
osit
ion
-$
-$
(1,0
37,2
81)
1,
037,
281
$
-$
-$
Net
Pos
itio
n:B
egin
ning
of y
ear
18,7
11,2
36
End
of y
ear
17,6
73,9
55$
Bud
gete
d A
mou
nts
Act
ual A
mou
nts
96

San
Die
go M
etro
pol
itan
Tra
nsi
t S
yste
m
Con
trac
ted
Ser
vice
s S
ched
ule
of
Rev
enu
es, E
xpen
ses,
an
d C
han
ges
in N
et P
osit
ion
– B
ud
get
and
Act
ual
F
or t
he
Yea
r E
nd
ed J
un
e 30
, 201
9
Act
uals
per
Stat
emen
t of
Rev
enue
s,Ex
pens
es, a
ndV
aria
nce
with
Cha
nges
inFi
nal B
udge
tN
et P
ositi
onB
udge
t Bas
isA
ctua
ls o
nPo
sitiv
eO
rigin
alFi
nal
Am
ount
sA
djus
tmen
tsB
udge
t Bas
is(N
egat
ive)
Ope
rati
ng r
even
ues:
Pass
enge
r rev
enue
30,3
23,7
00$
29,3
17,5
00$
28,1
78,2
85$
-$
28,1
78,2
85$
(1,1
39,2
15)
$
M
isce
llane
ous
oper
atin
g re
venu
es-
-
1,
365
-
1,36
5
1,
365
Tot
al o
pera
ting
rev
enue
s30
,323
,700
29
,317
,500
28
,179
,650
-
28
,179
,650
(1
,137
,850
)
Ope
rati
ng e
xpen
ses:
Pers
onne
l cos
ts42
0,00
0
605
,600
7
05,7
66
- 70
5,76
6
(100
,166
)
O
utsi
de s
ervi
ces
77,6
15,5
60
79
,356
,630
79,0
94,4
38
- 79
,094
,438
26
2,19
2
Mat
eria
ls a
nd s
uppl
ies
40,1
00
4
1,02
0
25,
635
- 25
,635
15
,385
En
ergy
cos
ts8,
341,
210
8
,338
,410
8,2
33,7
69
- 8,
233,
769
104,
641
R
isk
man
agem
ent
15,3
00
1
5,30
0
15,
300
- 15
,300
-
M
isce
llane
ous
oper
atin
g ex
pens
es2,
561,
920
2
,874
,260
2,8
67,4
83
- 2,
867,
483
6,77
7
D
epre
ciat
ion
-
-
22,7
06,1
35
(22,
706,
135)
-
-
Tot
al o
pera
ting
exp
ense
s88
,994
,090
91
,231
,220
11
3,64
8,52
6
(2
2,70
6,13
5)
90,9
42,3
91
288,
829
Ope
rati
ng in
com
e (l
oss)
(58,
670,
390)
(6
1,91
3,72
0)
(85,
468,
876)
22
,706
,135
(6
2,76
2,74
1)
(849
,021
)
Bud
gete
d A
mou
nts
Act
ual A
mou
nts
97
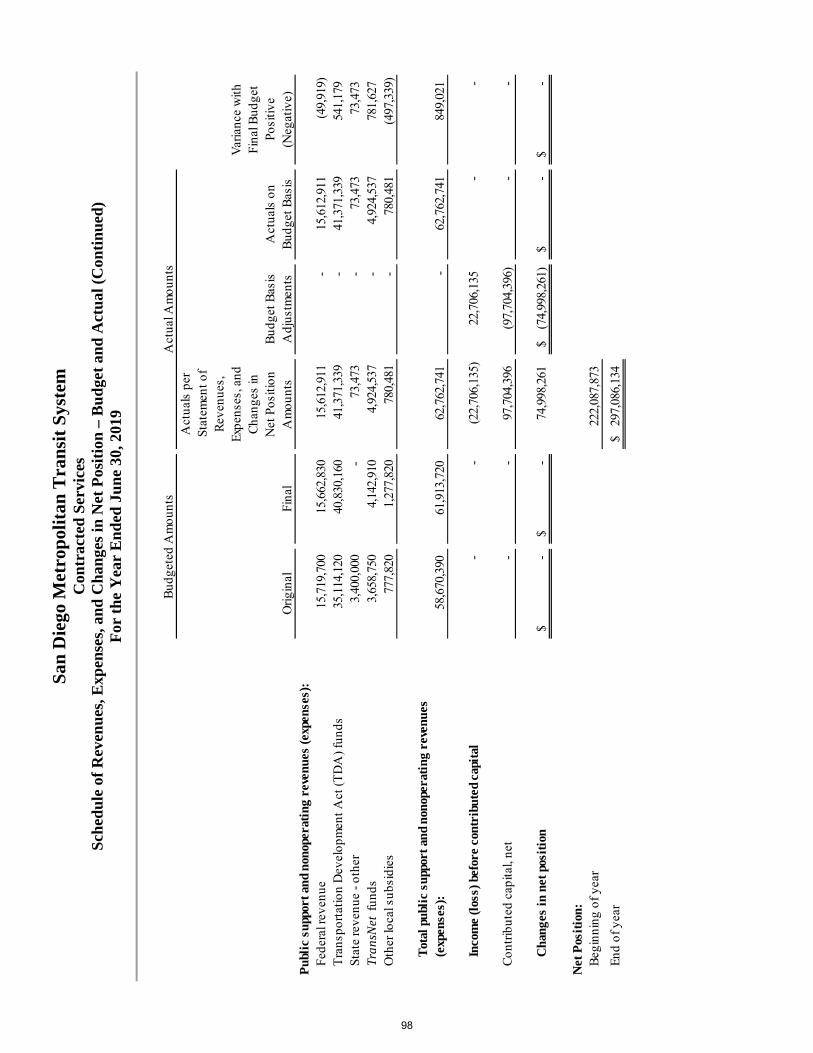
San
Die
go M
etro
pol
itan
Tra
nsi
t S
yste
m
Con
trac
ted
Ser
vice
s S
ched
ule
of
Rev
enu
es, E
xpen
ses,
an
d C
han
ges
in N
et P
osit
ion
– B
ud
get
and
Act
ual
(C
onti
nue
d)
For
th
e Y
ear
En
ded
Ju
ne
30, 2
019
Act
uals
per
Stat
emen
t of
Rev
enue
s,Ex
pens
es, a
ndV
aria
nce
with
Cha
nges
inFi
nal B
udge
tN
et P
ositi
onB
udge
t Bas
isA
ctua
ls o
nPo
sitiv
eO
rigin
alFi
nal
Am
ount
sA
djus
tmen
tsB
udge
t Bas
is(N
egat
ive)
Pub
lic
supp
ort a
nd n
onop
erat
ing
reve
nues
(exp
ense
s):
Fede
ral r
even
ue
15,7
19,7
00
15
,662
,830
15,6
12,9
11
- 15
,612
,911
(4
9,91
9)
Tra
nspo
rtat
ion
Dev
elop
men
t Act
(TD
A) f
unds
35
,114
,120
40,8
30,1
60
41
,371
,339
-
41,3
71,3
39
541,
179
St
ate
reve
nue
- oth
er
3,4
00,0
00
-
73,
473
- 73
,473
73
,473
Tr
ansN
et f
unds
3
,658
,750
4,1
42,9
10
4
,924
,537
-
4,92
4,53
7
78
1,62
7
Oth
er lo
cal s
ubsi
dies
777
,820
1,2
77,8
20
780
,481
-
780,
481
(4
97,3
39)
Tot
al p
ubli
c su
ppor
t and
non
oper
atin
g re
venu
es
(exp
ense
s):
58,6
70,3
90
61,9
13,7
20
62,7
62,7
41
-
62,7
62,7
41
849,
021
Inco
me
(los
s) b
efor
e co
ntri
bute
d ca
pita
l-
-
(2
2,70
6,13
5)
22,7
06,1
35
-
-
Con
trib
uted
cap
ital,
net
-
-
97,7
04,3
96
(97,
704,
396)
-
-
Cha
nges
in n
et p
osit
ion
-$
-$
74,9
98,2
61
(74,
998,
261)
$
-
$
-
$
Net
Pos
itio
n:B
egin
ning
of y
ear
222,
087,
873
End
of y
ear
297,
086,
134
$
Bud
gete
d A
mou
nts
Act
ual A
mou
nts
98

San
Die
go M
etro
pol
itan
Tra
nsi
t S
yste
m
San
Die
go T
ran
sit
Cor
por
atio
n S
ched
ule
of
Rev
enu
es, E
xpen
ses,
an
d C
han
ges
in N
et P
osit
ion
– B
ud
get
and
Act
ual
F
or t
he
Yea
r E
nd
ed J
un
e 30
, 201
9
Act
uals
per
Stat
emen
t of
Rev
enue
s,Ex
pens
es, a
ndV
aria
nce
with
Cha
nges
inFi
nal B
udge
tN
et P
ositi
onB
udge
t Bas
isA
ctua
ls o
nPo
sitiv
eO
rigin
alFi
nal
Am
ount
sA
djus
tmen
tsB
udge
t Bas
is(N
egat
ive)
Ope
rati
ng r
even
ues:
Pass
enge
r rev
enue
21,7
35,5
00$
22,0
16,4
00$
22,0
41,3
56$
-$
22,0
41,3
56$
24,9
56$
Mis
cella
neou
s op
erat
ing
reve
nues
15,0
00
15,0
00
6,12
7
-
6,
127
(8,8
73)
Tot
al o
pera
ting
rev
enue
s21
,750
,500
22
,031
,400
22
,047
,483
-
22
,047
,483
16
,083
Ope
rati
ng e
xpen
ses:
Pers
onne
l cos
ts74
,909
,470
74,4
84,3
30
82,1
52,2
84
(10,
393,
969)
71,7
58,3
15
2,72
6,01
5
O
utsi
de s
ervi
ces
2,01
7,82
0
1,8
93,9
60
2,07
5,74
9
(2
95,4
57)
1,78
0,29
2
11
3,66
8
Mat
eria
ls a
nd s
uppl
ies
5,69
3,04
0
5,9
38,3
10
6,40
9,35
4
-
6,40
9,35
4
(4
71,0
44)
Ener
gy c
osts
5,58
1,00
0
5,4
59,0
00
5,57
8,02
3
-
5,57
8,02
3
(1
19,0
23)
Ris
k m
anag
emen
t2,
167,
000
1
,560
,630
1,
122,
273
229
,127
1,
351,
400
209,
230
M
isce
llane
ous
oper
atin
g ex
pens
es8,
273,
380
7
,549
,310
7,
594,
611
- 7,
594,
611
(45,
301)
D
epre
ciat
ion
-
- 29
,467
,429
(2
9,46
7,42
9)-
-
Tot
al o
pera
ting
exp
ense
s98
,641
,710
96
,885
,540
13
4,39
9,72
3
(3
9,92
7,72
8)
94,4
71,9
95
2,41
3,54
5
Ope
rati
ng in
com
e (l
oss)
(76,
891,
210)
(7
4,85
4,14
0)
(112
,352
,240
)
39
,927
,728
(7
2,42
4,51
2)
2,42
9,62
8
Bud
gete
d A
mou
nts
Act
ual A
mou
nts
99

San
Die
go M
etro
pol
itan
Tra
nsi
t S
yste
m
San
Die
go T
ran
sit
Cor
por
atio
n S
ched
ule
of
Rev
enu
es, E
xpen
ses,
an
d C
han
ges
in N
et P
osit
ion
– B
ud
get
and
Act
ual
(C
onti
nue
d)
For
th
e Y
ear
En
ded
Ju
ne
30, 2
019
Act
uals
per
Stat
emen
t of
Rev
enue
s,Ex
pens
es, a
ndV
aria
nce
with
Cha
nges
inFi
nal B
udge
tN
et P
ositi
onB
udge
t Bas
isA
ctua
ls o
nPo
sitiv
eO
rigin
alFi
nal
Am
ount
sA
djus
tmen
tsB
udge
t Bas
is(N
egat
ive)
Pub
lic
supp
ort a
nd n
onop
erat
ing
reve
nues
(exp
ense
s):
Fede
ral r
even
ue
20,5
00,0
00
20
,500
,000
20
,500
,000
-
20,5
00,0
00
-
Tra
nspo
rtat
ion
Dev
elop
men
t Act
(TD
A) f
unds
12
,524
,630
5,9
32,8
70
2,92
5,26
7
(
36,6
00)
2,88
8,66
7
(3
,044
,203
)
Stat
e T
rans
it A
ssis
tanc
e (S
TA
) fun
ds
5,6
00,0
00
8
,756
,340
6,
866,
113
2
,000
,000
8,
866,
113
109,
773
St
ate
reve
nue
- oth
er
-
- 25
8,85
7
(258
,857
)-
-
Tr
ansN
et fu
nds
38
,725
,460
40,1
23,8
10
40,6
25,9
38
- 40
,625
,938
50
2,12
8
Oth
er lo
cal s
ubsi
dies
278
,000
2
78,0
00
278,
000
-
278,
000
-
In
tere
st e
xpen
se
(7
36,8
80)
(736
,880
)(7
27,3
81)
(9
,475
)(7
36,8
56)
24
G
ain
(loss
) on
disp
osal
of a
sset
s
-
- (9
,320
)
11,
970
2,65
0
2,
650
Tot
al p
ubli
c su
ppor
t and
non
oper
atin
g re
venu
es
(exp
ense
s):
76,8
91,2
10
74,8
54,1
40
70,7
17,4
74
1,70
7,03
8
72
,424
,512
(2
,429
,628
)
Inco
me
(los
s) b
efor
e co
ntri
bute
d ca
pita
l-
-
(4
1,63
4,76
6)
41,6
34,7
66
-
-
Con
trib
uted
cap
ital,
net
-
-
6,55
4,66
1
(6
,554
,661
)
-
-
Cha
nges
in n
et p
osit
ion
-$
-$
(35,
080,
105)
35
,080
,105
$
-
$
-
$
Net
Pos
itio
n:B
egin
ning
of y
ear
168,
211,
904
End
of y
ear
133,
131,
799
$
Bud
gete
d A
mou
nts
Act
ual A
mou
nts
100

San
Die
go M
etro
pol
itan
Tra
nsi
t S
yste
m
San
Die
go T
roll
ey I
nco
rpor
ated
S
ched
ule
of
Rev
enu
es, E
xpen
ses,
an
d C
han
ges
in N
et P
osit
ion
– B
ud
get
and
Act
ual
F
or t
he
Yea
r E
nd
ed J
un
e 30
, 201
9
Act
uals
per
Stat
emen
t of
Rev
enue
s,Ex
pens
es, a
ndV
aria
nce
with
Cha
nges
inFi
nal B
udge
tN
et P
ositi
onB
udge
t Bas
isA
ctua
ls o
nPo
sitiv
eO
rigin
alFi
nal
Am
ount
sA
djus
tmen
tsB
udge
t Bas
is(N
egat
ive)
Ope
rati
ng r
even
ues:
Pass
enge
r rev
enue
40,0
28,0
10$
40,7
53,3
10$
42,0
05,5
25$
-
$
42
,005
,525
$
1,
252,
215
$
Mis
cella
neou
s op
erat
ing
reve
nues
720,
000
82
5,00
0
789,
453
-
78
9,45
3
(35,
547)
Tot
al o
pera
ting
rev
enue
s40
,748
,010
41
,578
,310
42
,794
,978
-
42,7
94,9
78
1,21
6,66
8
Ope
rati
ng e
xpen
ses:
Pers
onne
l cos
ts37
,532
,400
38,0
17,5
10
39,4
59,1
47
(1,2
94,2
34)
38,1
64,9
13
(147
,403
)
O
utsi
de s
ervi
ces
5,17
7,55
0
5,2
41,1
10
8,76
8,47
5
(3,1
25,2
91)
5,64
3,18
4
(4
02,0
74)
Mat
eria
ls a
nd s
uppl
ies
6,47
6,70
0
6,8
60,3
60
6,47
0,47
0
-
6,47
0,47
0
38
9,89
0
Ener
gy c
osts
13,1
17,4
00
14
,566
,850
14
,725
,944
- 14
,725
,944
(1
59,0
94)
Ris
k m
anag
emen
t1,
920,
000
1
,647
,320
71
9,87
8
3
1,94
4 75
1,82
2
895,
498
M
isce
llane
ous
oper
atin
g ex
pens
es16
,240
,530
15,8
37,4
60
15,6
82,7
29
(
39,2
19)
15,6
43,5
10
193,
950
D
epre
ciat
ion
-
- 67
,726
,659
(67,
726,
659)
-
-
Tot
al o
pera
ting
exp
ense
s80
,464
,580
82
,170
,610
15
3,55
3,30
2
(72,
153,
459)
81
,399
,843
77
0,76
7
Ope
rati
ng in
com
e (l
oss)
(39,
716,
570)
(4
0,59
2,30
0)
(110
,758
,324
)
72,1
53,4
59
(38,
604,
865)
1,
987,
435
Bud
gete
d A
mou
nts
Act
ual A
mou
nts
101
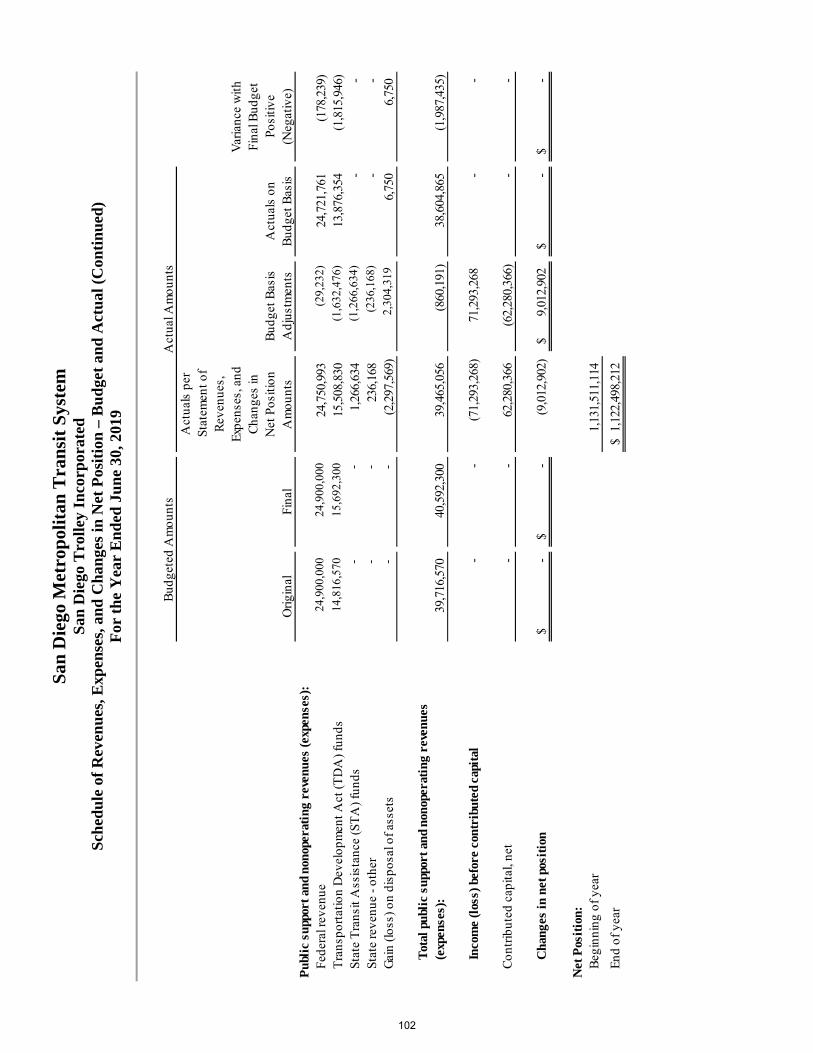
San
Die
go M
etro
pol
itan
Tra
nsi
t S
yste
m
San
Die
go T
roll
ey I
nco
rpor
ated
S
ched
ule
of
Rev
enu
es, E
xpen
ses,
an
d C
han
ges
in N
et P
osit
ion
– B
ud
get
and
Act
ual
(C
onti
nue
d)
For
th
e Y
ear
En
ded
Ju
ne
30, 2
019
Act
uals
per
Stat
emen
t of
Rev
enue
s,Ex
pens
es, a
ndV
aria
nce
with
Cha
nges
inFi
nal B
udge
tN
et P
ositi
onB
udge
t Bas
isA
ctua
ls o
nPo
sitiv
eO
rigin
alFi
nal
Am
ount
sA
djus
tmen
tsB
udge
t Bas
is(N
egat
ive)
Pub
lic
supp
ort a
nd n
onop
erat
ing
reve
nues
(exp
ense
s):
Fede
ral r
even
ue
24,9
00,0
00
24
,900
,000
24
,750
,993
(29
,232
)24
,721
,761
(1
78,2
39)
Tra
nspo
rtat
ion
Dev
elop
men
t Act
(TD
A) f
unds
14
,816
,570
15,6
92,3
00
15,5
08,8
30
(1,6
32,4
76)
13,8
76,3
54
(1,8
15,9
46)
St
ate
Tra
nsit
Ass
ista
nce
(ST
A) f
unds
-
-
1,26
6,63
4
(1,2
66,6
34)
-
-
Stat
e re
venu
e - o
ther
-
-
236,
168
(2
36,1
68)
-
-
Gai
n (lo
ss) o
n di
spos
al o
f ass
ets
-
-
(2,2
97,5
69)
2
,304
,319
6,
750
6,75
0
Tot
al p
ubli
c su
ppor
t and
non
oper
atin
g re
venu
es
(exp
ense
s):
39,7
16,5
70
40,5
92,3
00
39,4
65,0
56
(8
60,1
91)
38,6
04,8
65
(1,9
87,4
35)
Inco
me
(los
s) b
efor
e co
ntri
bute
d ca
pita
l-
-
(7
1,29
3,26
8)
71,2
93,2
68
-
-
Con
trib
uted
cap
ital,
net
-
-
62,2
80,3
66
(6
2,28
0,36
6)
-
-
Cha
nges
in n
et p
osit
ion
-$
-$
(9,0
12,9
02)
9,01
2,90
2$
-
$
-
$
Net
Pos
itio
n:B
egin
ning
of y
ear
1,13
1,51
1,11
4
End
of y
ear
1,12
2,49
8,21
2$
Bud
gete
d A
mou
nts
Act
ual A
mou
nts
102
STATISTICAL SECTION
(Unaudited) Included in this section of the Metropolitan Transit System comprehensive annual financial report is detailed information to assist in analysis and understanding of the information presented in the financial statements, notes and required supplementary information.
Contents
Financial Trends These schedules contain trend information to help the reader understand how MTS's financial position has changed over time. Revenue Capacity These schedules contain detailed information about the fare structures and revenue generated from transit operations provided by MTS. Debt Capacity This schedule presents information to help the reader assess the affordability of MTS's current levels of outstanding debt and MTS's ability to issue debt in the future. Demographic and Economic Information These schedules provide service and infrastructure data to help the reader understand how the information in MTS's financial report relates to the services MTS provides. Operating Information These schedules provide service and infrastructure data to help the reader understand how the information in MTS's financial report relates to the services MTS provides.
103

This page intentionally left blank.
104

FINANCIAL TRENDS
105

San
Die
go M
etro
pol
itan
Tra
nsi
t S
yste
m
Net
Pos
itio
n b
y C
omp
onen
t (i
n 0
00’s
) L
ast
Ten
Fis
cal Y
ears
2019
2018
2017
2016
2015
2014
2013
2012
2011
2010
Bu
sin
ess-
type
act
ivit
ies:
Net
inve
stm
ent
in c
apit
al a
sset
s $
1,8
22,9
22
$ 1
,785
,808
$
1,7
39,3
60
$ 1
,760
,427
$
1,6
99,2
22
$ 1
,395
,206
$
1,2
96,2
17
$ 1
,172
,816
$
1,0
73,5
62
$ 1
,078
,178
R
estr
icte
d
2
12
14
,447
4,4
40
8
,750
5,3
09
6
,742
7,2
55
78
,378
7,0
07
2
,548
U
nres
tric
ted
(53
,159
)
(
65,3
08)
(19
,615
)
(
31,6
68)
(31
,900
)
1
81,1
14
189
,837
1
57,6
09
173
,128
1
77,1
58
Tot
al b
usi
nes
s-ty
pe a
ctiv
itie
s n
et p
osit
ion
$ 1
,769
,975
$
1,7
34,9
47
$ 1
,724
,185
$
1,7
37,5
09
$ 1
,672
,631
$
1,5
83,0
62
$ 1
,493
,309
$
1,4
08,8
03
$ 1
,253
,697
$
1,2
57,8
84
Pri
mar
y go
vern
men
t:N
et in
vest
men
t in
cap
ital
ass
ets
$ 1
,822
,922
$
1,7
85,8
08
$ 1
,739
,360
$
1,7
60,4
27
$ 1
,699
,222
$
1,3
95,2
06
$ 1
,296
,217
$
1,1
72,8
16
$ 1
,073
,562
$
1,0
78,1
78
Res
tric
ted
212
14,4
47
4
,440
8,7
50
5
,309
6,7
42
7
,255
78,3
78
7
,007
2,5
48
Unr
estr
icte
d
(
53,1
59)
(65
,308
)
(
19,6
15)
(31
,668
)
(
31,9
00)
181
,114
1
89,8
37
157
,609
1
73,1
28
177
,158
Tot
al p
rim
ary
gove
rnm
ent
net
po
siti
on $
1,7
69,9
75
$ 1
,734
,947
$
1,7
24,1
85
$ 1
,737
,509
$
1,6
72,6
31
$ 1
,583
,062
$
1,4
93,3
09
$ 1
,408
,803
$
1,2
53,6
97
$ 1
,257
,884
Sour
ce: A
udite
d Fi
nanc
ial S
tate
men
ts.
106

San
Die
go M
etro
pol
itan
Tra
nsi
t S
yste
m
Ch
ange
s in
Net
Pos
itio
n (
in 0
00’s
) L
ast
Ten
Fis
cal Y
ears
2019
2018
2017
2016
2015
2014
2013
2012
2011
2010
Ope
rati
ng r
even
ues:
Pa
ssen
ger r
even
ue $
92,2
25
$
90
,236
$
93,2
79
$
97
,914
$
97,6
15
$
93
,995
$
90,6
52
$
88
,094
$
84,7
64
$
84
,167
Adv
ertis
ing
1
,604
1,1
31
1
,379
9
68
816
8
70
972
7
84
621
7
83
C
hart
er
-
-
-
-
6
3
0
1
186
1
29
128
Mis
cella
neou
s
18,8
31
17
,404
18,8
63
15
,781
9,3
49
9
,531
4,9
34
4
,445
4,6
88
4
,264
Tot
al o
pera
ting
rev
enue
s
1
12,6
60
108
,771
1
13,5
21
114
,663
1
07,7
86
104
,426
96,5
59
93
,509
90,2
02
89
,342
Ope
rati
ng e
xpen
ses:
Pe
rson
nel c
osts
146
,006
1
46,2
82
137
,021
1
21,9
21
114
,575
1
17,0
92
123
,720
1
12,5
37
104
,329
1
09,5
12
O
utsi
de s
ervi
ces
107
,846
1
01,5
74
97
,800
94,8
02
84
,302
73,8
59
67
,414
66,0
50
64
,037
63,5
74
T
rans
it op
erat
ions
fund
ing
498
4
88
463
4
91
2
,692
4,2
43
3
,571
3,7
21
4
,053
3,7
58
M
ater
ials
and
sup
plie
s
12,9
27
14
,918
13,0
65
9
,715
10,3
07
9
,276
8,4
69
7
,977
7,6
78
6
,680
Ener
gy c
osts
28
,784
26,4
14
25
,552
24,5
31
28
,003
26,0
44
22
,572
22,6
89
21
,932
22,8
92
R
isk
man
agem
ent
2
,183
6,6
75
4
,276
4,8
64
5
,849
3,6
10
2
,902
4,0
30
3
,924
4,8
59
M
isce
llane
ous
5
,446
5,8
54
5
,934
4,9
78
4
,975
6,2
44
6
,493
5,1
16
4
,899
3,5
71
D
epre
ciat
ion
123
,007
1
20,9
28
123
,880
1
19,5
20
108
,199
1
03,1
98
92
,788
84,8
11
81
,041
98,2
38
Tot
al o
pera
ting
exp
ense
s
4
26,6
97
423
,133
4
07,9
91
380
,822
3
58,9
02
343
,566
3
27,9
29
306
,931
2
91,8
93
313
,084
Ope
rati
ng (l
oss)
(
314,
037)
(
314,
362)
(
294,
470)
(
266,
159)
(
251,
116)
(
239,
140)
(
231,
370)
(
213,
422)
(
201,
691)
(
223,
742)
107

San
Die
go M
etro
pol
itan
Tra
nsi
t S
yste
m
Ch
ange
s in
Net
Pos
itio
n (
in 0
00’s
) (C
onti
nu
ed)
Las
t T
en F
isca
l Yea
rs
2019
2018
2017
2016
2015
2014
2013
2012
2011
2010
Pub
lic
supp
ort a
nd
nono
pera
ting
rev
enue
s (e
xpen
ses)
:
Gra
nts
and
cont
ribut
ions
243
,544
2
53,2
98
232
,775
2
35,7
63
235
,755
2
11,5
17
183
,945
3
25,6
58
170
,850
2
24,5
06
In
vest
men
t ear
ning
s
1,9
52
941
6
36
292
3,0
65
6
,087
6,2
67
7
,622
7,6
95
9
,708
Inte
rest
exp
ense
(671
)
(8
09)
(963
)
(1,0
71)
(6
,883
)
(6,9
82)
(7
,520
)
(8,0
14)
(8
,420
)
(1
2,70
2)
Gai
n (lo
ss) o
n di
spos
al o
f
(2,3
51)
(809
)
3
96
2
,433
67
(273
)
8
04
(620
)
7
12
(69
)
Oth
er e
xpen
ses
-
-
-
-
-
(
13)
(13
)
(5)
(139
)
(1,0
75)
Tot
al p
ubli
c su
ppor
t and
no
nope
rati
ng r
even
ues
(exp
ense
s)
2
42,4
74
252
,621
2
32,8
44
237
,417
2
32,0
04
210
,336
1
83,4
83
324
,641
1
70,6
98
220
,368
Inco
me
(los
s) b
efor
e co
ntri
bute
d ca
pita
l
(7
1,56
3)
(6
1,74
1)
(6
1,62
6)
(2
8,74
2)
(1
9,11
2)
(2
8,80
4)
(4
7,88
7)
1
11,2
19
(30,
993)
(3
,374
)
C
ontr
ibut
ed c
apita
l, ne
t
1
06,5
92
99
,551
48,3
01
93
,619
2
45,7
17
118
,768
1
32,1
82
44
,118
26,8
06
11
,110
Cha
nges
in n
et p
osit
ion
$
35
,029
$
37,8
10
$
(13,
325)
$
64
,877
$
2
26,6
05
$
89
,964
$
84,2
95
$
155
,337
$
(4,1
87)
$
7
,736
Sour
ce: A
udite
d Fi
nanc
ial S
tate
men
ts.
108

REVENUE CAPACITY
109

San Diego Metropolitan Transit System Operating Revenues by Source (000’s)
Last Ten Fiscal Years
Federal State LocalFiscal Year Passenger Operating Operating Operating
Ended Fares Funds Funds Funds Other
San Diego Transit Corporation2010 $ 26,708 $ 18,267 $ 16,249 $ 21,456 $ 182 2011 26,056 19,894 29,435 18,307 152 2012 27,498 20,709 20,497 17,549 196 2013 28,621 20,266 31,954 18,886 6 2014 27,781 19,336 16,489 20,897 34 2015 27,156 18,096 18,085 28,982 5 2016 26,169 18,000 15,993 35,558 2 2017 24,864 20,000 17,138 31,038 10 2018 23,034 20,225 16,467 38,889 187 2019 22,041 20,500 10,050 40,904 6
San Diego Trolley2010 $ 33,050 $ 16,449 $ 5,637 $ 5,000 $ 462 2011 34,673 14,912 5,497 5,000 528 2012 35,216 14,989 7,208 5,492 552 2013 35,554 22,426 3,379 5,000 574 2014 40,188 22,913 1,501 5,000 1,256 2015 41,140 21,151 5,047 5,000 628 2016 41,113 21,148 6,040 5,000 698 2017 38,968 23,149 13,609 5,000 704 2018 39,354 24,247 22,930 - 777 2019 42,006 24,751 17,012 - 789
MTS - Contracted Services2010 $ 24,410 $ 10,420 $ 21,524 $ 1,636 $ 47 2011 24,036 4,641 28,857 2,002 - 2012 25,380 7,155 26,635 1,984 - 2013 26,476 5,595 28,132 2,368 - 2014 26,025 10,362 26,906 2,665 - 2015 29,318 14,127 30,543 2,123 79 2016 30,631 13,827 33,796 2,258 (2)2017 29,447 13,838 36,162 2,296 2 2018 27,848 14,599 38,320 2,699 2 2019 28,178 15,613 41,445 5,705 1
Source: Audited Financial Statements.
110

San
Die
go M
etro
pol
itan
Tra
nsi
t S
yste
m
Far
e S
tru
ctu
re
Las
t T
en F
isca
l Yea
rs
2019
2018
2017
2016
2015
2014
2013
2012
2011
2010
Bus
Cas
h Fa
res
One
-way
fare
, loc
al ro
utes
2.2
5 2
.25
2.2
5
2
.25
2.2
5
2
.25
2.2
5
2
.25
2.2
5
2
.25
Seni
or/d
isab
led,
loca
l rou
tes
1.1
0 1
.10
1.1
0
1
.10
1.1
0
1
.10
1.1
0
1
.10
1.1
0
1
.10
Rap
id/E
xpre
ss 2
.50
2.5
0
2
.50
2.5
0
2
.50
2.5
0
2
.50
2.5
0
2
.50
2.5
0 Se
nior
/dis
able
d R
apid
/Exp
ress
1.2
5 1
.25
1.2
5
1
.25
1.2
5
1
.25
1.2
5
1
.25
1.2
5
1
.25
Rap
id E
xpre
ss/P
rem
ium
5
.00
5.0
0
5
.00
5.0
0
5
.00
5.0
0
5
.00
5.0
0
5
.00
5.0
0 Se
nior
/dis
able
d R
apid
Exp
ress
/Pre
miu
m 2
.50
2.5
0
2
.50
2.5
0
2
.50
2.5
0
2
.50
2.5
0
2
.50
2.5
0 R
ural
bus
5.00
-10.
005.
00-1
0.00
5.0
0-10
.00
5.0
0-10
.00
5.0
0-10
.00
5.0
0-10
.00
5.0
0-10
.00
5.0
0-10
.00
5.0
0-10
.00
5.0
0-10
.00
Seni
or/d
isab
led
Rur
al b
us2.
50-5
.00
2.50
-5.0
0 2
.50-
5.00
2
.50-
5.00
2
.50-
5.00
2
.50-
5.00
2
.50-
5.00
2
.50-
5.00
2
.50-
5.00
2
.50-
5.00
Tro
lley
Cas
h Fa
res
One
-way
fare
, all
stat
ions
2.5
0 2
.50
2.5
0
2
.50
2.5
0
2
.50
2.5
0
2
.50
2.5
0
2
.50
Seni
or/d
isab
led
one-
way
fare
all
stat
ions
1.2
5 1
.25
1.2
5
1
.25
1.2
5
1
.25
1.2
5
1
.25
1.2
5
1
.25
Bus
and
Tro
lley
Day
Pas
ses
Reg
iona
l day
pas
s 5
.00
5.0
0
5
.00
5.0
0
5
.00
5.0
0
5
.00
5.0
0
5
.00
5.0
0 R
egio
n pl
us d
ay p
ass
12.
00
12.
00
1
2.00
12.
00
1
2.00
12.
00
1
2.00
12.
00
1
4.00
14.
00
Bus
and
Tro
lley
Mon
thly
Pas
ses
Reg
iona
l mon
thly
pas
s
72.
00
7
2.00
72.
00
7
2.00
72.
00
7
2.00
72.
00
7
2.00
72.
00
7
2.00
Se
nior
/dis
able
d R
egio
nal
1
8.00
18.
00
1
8.00
18.
00
1
8.00
18.
00
1
8.00
18.
00
1
8.00
18.
00
You
th R
egio
nal
3
6.00
36.
00
3
6.00
36.
00
3
6.00
36.
00
3
6.00
36.
00
3
6.00
36.
00
14-D
ay/H
alf-
mon
th
43.
00
4
3.00
43.
00
4
3.00
43.
00
4
3.00
43.
00
4
3.00
43.
00
4
3.00
R
apid
Exp
ress
/Pre
miu
m m
onth
ly p
ass
10
0.00
100.
00
10
0.00
100.
00
10
0.00
100.
00
10
0.00
100.
00
10
0.00
100.
00
Seni
or/d
isab
led
Rap
id E
xpre
ss/P
rem
ium
2
5.00
25.
00
2
5.00
25.
00
2
5.00
25.
00
2
5.00
25.
00
2
5.00
25.
00
You
th R
apid
Exp
ress
/Pre
miu
m
50.
00
5
0.00
50.
00
5
0.00
50.
00
5
0.00
50.
00
5
0.00
50.
00
5
0.00
14
-Day
/Hal
f-m
onth
Rap
id
Expr
ess/
Prem
ium
60.0
0
60
.00
60.0
0
60
.00
60.0
0
60
.00
60.0
0
60
.00
60.0
0
60
.00
SOU
RC
E: S
AN
DA
G C
ompr
ehen
sive
Far
e O
rdin
ance
, am
endm
ents
eff
ectiv
e Ju
ly 2
014.
The
SA
ND
AG
Boa
rd o
f D
irec
tors
ap
pro
ved
a C
omp
rehe
nsiv
e F
are
Ord
inan
ce a
men
dmen
t in
Feb
ruar
y 2
019
wit
h ne
w t
rans
it f
ares
eff
ecti
ve S
epte
mbe
r 1,
201
9.
111

San Diego Metropolitan Transit System Farebox Recovery Percentage
Last Ten Fiscal Years
Fiscal Year San Diego San Diego MTS-ContractedEnded Transit Trolley Services
2010 28.46 54.26 42.06
2011 31.22 57.41 40.37
2012 30.50 55.63 41.50
2013 29.01 53.98 42.31
2014 30.34 56.52 39.46
2015 29.50 56.64 38.48
2016 27.39 54.76 38.05
2017 26.21 47.81 36.02
2018 23.12 44.89 33.36
2019 23.41 49.71 30.98
Source: Audited financial statements; calculated as passenger revenue divided by operating expenses (less depreciation, GASB 68 related pension expense and GASB 75 related OPEB expenses), and interest expense.
112

DEBT CAPACITY
113

San Diego Metropolitan Transit System Ratio of Outstanding Debt by Type
Last Ten Fiscal Years
Year ended June 30
Capital Lease -Tower
Capital Lease-Equipment
1995 LRV Lease/
Leaseback
Pension Obligation
Bonds Total
Percentage of Personal Income
Debt per Capita
2010 $ 6,647,108 $ 44,190 $ 119,948,726 $ 61,150,000 $ 187,790,024 0.13% $ 61
2011 5,317,686 - 118,501,460 47,265,000 171,084,146 0.11% 55
2012 4,766,867 - 116,942,900 40,510,000 162,219,767 0.10% 51
2013 4,189,818 - 115,264,486 25,880,000 145,334,304 0.09% 46
2014 3,614,149 - 113,457,002 23,965,000 141,036,151 0.08% 44
2015 3,006,729 - 18,108,323 21,960,000 43,075,052 0.02% 13
2016 2,393,787 - - 19,860,000 22,253,787 0.01% 7
2017 1,747,713 - - 17,655,000 19,402,713 0.01% 6
2018 1,071,269 - - 15,340,000 16,411,269 0.01% 5
2019 363,072 - - 12,910,000 13,273,072 0.01% 4
Details regarding MTS's outstanding debt can be found in the notes to the financial statements.
MTS retired the capital equipment lease and refunded the Tower capital lease in FY2011
MTS retired the 1995 LRV Lease/Leaseback obligation in FY2016
114

DEMOGRAPHIC AND ECONOMIC INFORMATION
115

San Diego Metropolitan Transit System Regional Population and Personal Income Statistics
Last Ten Fiscal Years
County of San Diego Population
(1)
County of San Diego Personal
Income (thousands) (1)
Per Capita Personal Income (1)
San Diego County Average
Unemployment Rate (2)
2010 3,102,852 136,600,000 49,924 10.50%
2011 3,135,522 145,700,000 51,339 10.40%
2012 3,173,442 152,700,000 52,103 9.30%
2013 3,207,852 157,800,000 52,674 7.40%
2014 3,247,475 167,600,000 54,554 6.10%
2015 3,274,141 177,600,000 56,796 5.00%
2016 3,295,816 183,000,000 57,086 5.10%
2017 3,320,108 192,600,000 58,014 4.30%
2018 3,347,292 201,200,000 58,513 3.70%
2019 3,372,910 210,100,000 59,325 3.30%
Source: (1) California Department of Transportation - Actuals 2010-2017, Forecast 2018-2019(2) California Employment Development Department, June 2019
116

San Diego Metropolitan Transit System Full-Time and Part-Time Employees by Function
Last Ten Fiscal Years
MTS San Diego Transit San Diego Trolley Total
2010 110 782 528 1,420
2011 116 758 543 1,417
2012 122 761 568 1,451
2013 136 786 599 1,521
2014 149 785 600 1,534
2015 154 852 595 1,601
2016 163 823 571 1,557
2017 165 825 578 1,568
2018 166 802 593 1,561
2019 166 841 612 1,619
Source: MTS Human Resources records
117
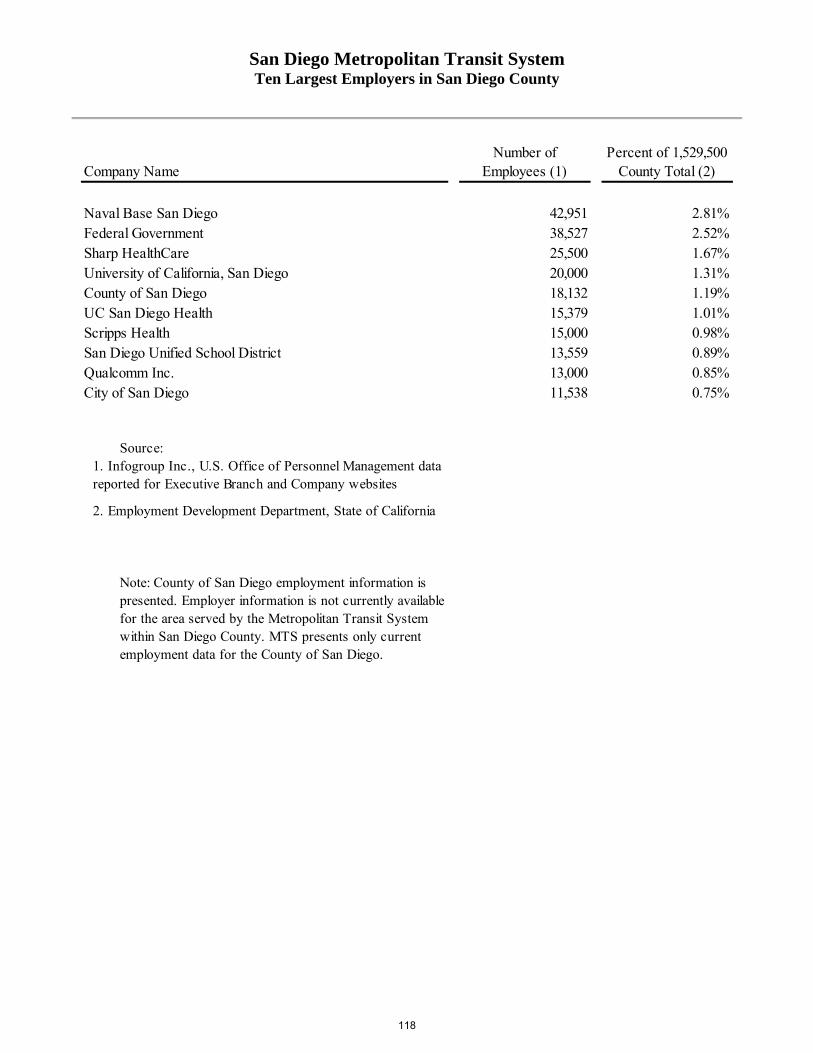
San Diego Metropolitan Transit System Ten Largest Employers in San Diego County
Number of Percent of 1,529,500Company Name Employees (1) County Total (2)
Naval Base San Diego 42,951 2.81%Federal Government 38,527 2.52%Sharp HealthCare 25,500 1.67%University of California, San Diego 20,000 1.31%County of San Diego 18,132 1.19%UC San Diego Health 15,379 1.01%Scripps Health 15,000 0.98%San Diego Unified School District 13,559 0.89%Qualcomm Inc. 13,000 0.85%City of San Diego 11,538 0.75%
Source:1. Infogroup Inc., U.S. Office of Personnel Management data reported for Executive Branch and Company websites
2. Employment Development Department, State of California
Note: County of San Diego employment information is presented. Employer information is not currently available for the area served by the Metropolitan Transit System within San Diego County. MTS presents only current employment data for the County of San Diego.
118

OPERATING INFORMATION
119
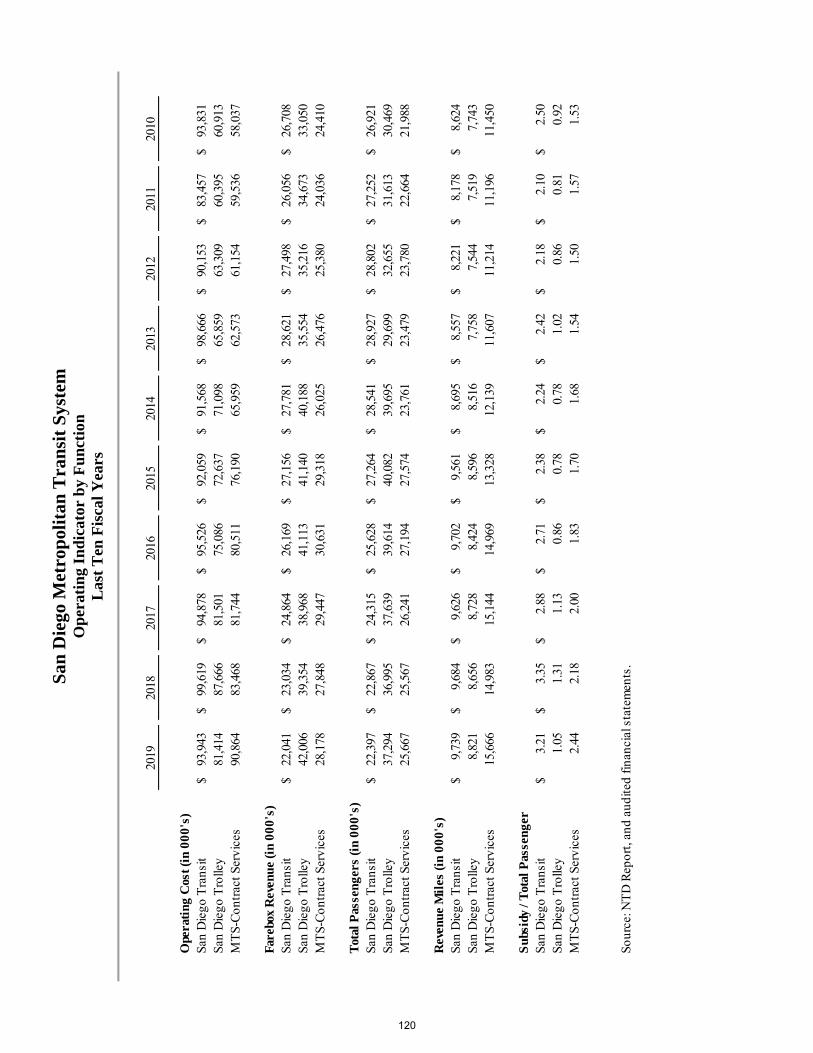
San
Die
go M
etro
pol
itan
Tra
nsi
t S
yste
m
Op
erat
ing
Ind
icat
or b
y F
un
ctio
n
Las
t T
en F
isca
l Yea
rs
2019
2018
2017
2016
2015
2014
2013
2012
2011
2010
Ope
rati
ng C
ost (
in 0
00's
) Sa
n D
iego
Tra
nsit
$
93,
943
$
99,
619
$
94,
878
$
95,
526
$
92,
059
$
91,
568
$
98,
666
$
90,
153
$
83,
457
$
93,
831
San
Die
go T
rolle
y
8
1,41
4
8
7,66
6
8
1,50
1
7
5,08
6
7
2,63
7
7
1,09
8
6
5,85
9
6
3,30
9
6
0,39
5
6
0,91
3 M
TS-
Con
trac
t Ser
vice
s
9
0,86
4
8
3,46
8
8
1,74
4
8
0,51
1
7
6,19
0
6
5,95
9
6
2,57
3
6
1,15
4
5
9,53
6
5
8,03
7
Fare
box
Rev
enue
(in
000'
s)Sa
n D
iego
Tra
nsit
$
22,
041
$
23,
034
$
24,
864
$
26,
169
$
27,
156
$
27,
781
$
28,
621
$
27,
498
$
26,
056
$
26,
708
San
Die
go T
rolle
y
4
2,00
6
3
9,35
4
3
8,96
8
4
1,11
3
4
1,14
0
4
0,18
8
3
5,55
4
3
5,21
6
3
4,67
3
3
3,05
0 M
TS-
Con
trac
t Ser
vice
s
2
8,17
8
2
7,84
8
2
9,44
7
3
0,63
1
2
9,31
8
2
6,02
5
2
6,47
6
2
5,38
0
2
4,03
6
2
4,41
0
Tot
al P
asse
nger
s (i
n 00
0's)
San
Die
go T
rans
it $
2
2,39
7 $
2
2,86
7 $
2
4,31
5 $
2
5,62
8 $
2
7,26
4 $
2
8,54
1 $
2
8,92
7 $
2
8,80
2 $
2
7,25
2 $
2
6,92
1 Sa
n D
iego
Tro
lley
37,
294
36,
995
37,
639
39,
614
40,
082
39,
695
29,
699
32,
655
31,
613
30,
469
MT
S-C
ontr
act S
ervi
ces
25,
667
25,
567
26,
241
27,
194
27,
574
23,
761
23,
479
23,
780
22,
664
21,
988
Rev
enue
Mil
es (i
n 00
0's)
San
Die
go T
rans
it $
9,73
9 $
9,68
4 $
9,62
6 $
9,70
2 $
9,56
1 $
8,69
5 $
8,55
7 $
8,22
1 $
8,17
8 $
8,62
4 Sa
n D
iego
Tro
lley
8,
821
8,
656
8,
728
8,
424
8,
596
8,
516
7,
758
7,
544
7,
519
7,
743
MT
S-C
ontr
act S
ervi
ces
15,
666
14,
983
15,
144
14,
969
13,
328
12,
139
11,
607
11,
214
11,
196
11,
450
Sub
sidy
/ T
otal
Pas
seng
erSa
n D
iego
Tra
nsit
$
3
.21
$
3
.35
$
2
.88
$
2
.71
$
2
.38
$
2
.24
$
2
.42
$
2
.18
$
2
.10
$
2
.50
San
Die
go T
rolle
y
1.0
5
1.3
1
1.1
3
0.8
6
0.7
8
0.7
8
1.0
2
0.8
6
0.8
1
0.9
2 M
TS-
Con
trac
t Ser
vice
s
2.4
4
2.1
8
2.0
0
1.8
3
1.7
0
1.6
8
1.5
4
1.5
0
1.5
7
1.5
3
Sour
ce: N
TD
Rep
ort,
and
audi
ted
finan
cial
sta
tem
ents
.
120

San
Die
go M
etro
pol
itan
Tra
nsi
t S
yste
m
Ser
vice
Per
form
ance
Dat
a L
ast
Ten
Fis
cal Y
ears
2019
2018
2017
2016
2015
2014
2013
2012
2011
2010
Serv
ice
Prov
ided
San
Die
go T
rans
it V
ehic
le R
even
ue M
iles
(in 0
00's
)
9,7
39
9
,684
9,6
26
9
,702
9,5
61
8
,695
8,5
57
8
,221
8,1
78
8
,624
V
ehic
le R
even
ue H
ours
(in
000'
s)
8
23
821
8
22
825
8
06
795
7
87
757
7
54
789
P
asse
nger
s (in
000
's)
22
,397
22,8
67
24
,315
25,6
28
27
,264
28,5
41
28
,927
28,8
02
27
,252
26,9
21
Pas
seng
er M
iles
(in 0
00's
)
98,8
96
104
,545
1
09,7
27
111
,639
1
17,5
85
110
,009
1
08,2
22
106
,804
1
00,5
00
98
,163
N
umbe
r of V
ehic
les
270
2
70
278
2
79
272
3
10
260
2
36
236
2
38
San
Die
go T
rolle
y V
ehic
le R
even
ue M
iles
(in 0
00's
)
8,8
21
8
,656
8,7
28
8
,424
8,5
96
8
,516
7,7
58
7
,544
7,5
19
7
,743
V
ehic
le R
even
ue H
ours
(in
000'
s)
4
87
478
4
90
493
4
96
504
4
72
428
4
23
442
P
asse
nger
Car
Hou
rs (i
n 00
0's)
500
4
86
504
5
07
509
5
12
476
4
33
429
4
48
Pas
seng
ers
(in 0
00's
)
37,2
94
36
,995
37,6
39
39
,614
40,0
82
39
,695
29,6
99
32
,655
31,6
13
30
,469
P
asse
nger
Mile
s (in
000
's)
219
,453
2
14,3
76
210
,971
2
23,1
85
224
,422
2
28,5
31
173
,151
1
94,8
22
193
,063
1
86,5
09
Num
ber o
f Veh
icle
s
141
1
30
179
1
79
179
1
79
178
1
51
128
1
34
MT
S-C
ontr
acte
d Se
rvic
es V
ehic
le R
even
ue M
iles
(in 0
00's
)
15,6
66
14
,983
15,1
44
14
,969
13,3
28
12
,139
11,6
07
11
,214
11,1
96
11
,450
V
ehic
le R
even
ue H
ours
(in
000'
s)
1,3
05
1
,256
1,2
69
1
,252
1,1
12
998
9
61
933
9
27
946
P
asse
nger
s (in
000
's)
25
,667
25,5
67
26
,241
27,1
94
27
,573
23,7
61
23
,479
23,7
80
22
,664
21,9
88
Pas
seng
er M
iles
(in 0
00's
)
97,0
45
94
,665
95,9
40
97
,479
94,5
04
85
,269
84,0
21
79
,789
82,1
25
79
,237
N
umbe
r of V
ehic
les
530
5
38
526
5
20
520
4
49
427
4
04
407
3
69
Tot
al P
asse
nger
s (in
000
's)
85
,358
85,4
29
88
,195
92,4
36
94
,919
91,9
97
82
,105
85,2
37
81
,529
79,3
78
Pas
seng
er M
iles
(in 0
00's
)
4
15,3
94
413
,586
4
16,6
38
432
,303
4
36,5
11
423
,809
3
65,3
94
381
,415
3
75,6
88
363
,909
Sour
ce: N
TD
Rep
ort a
nd M
TS
inte
rnal
cap
ital a
sset
sys
tem
121
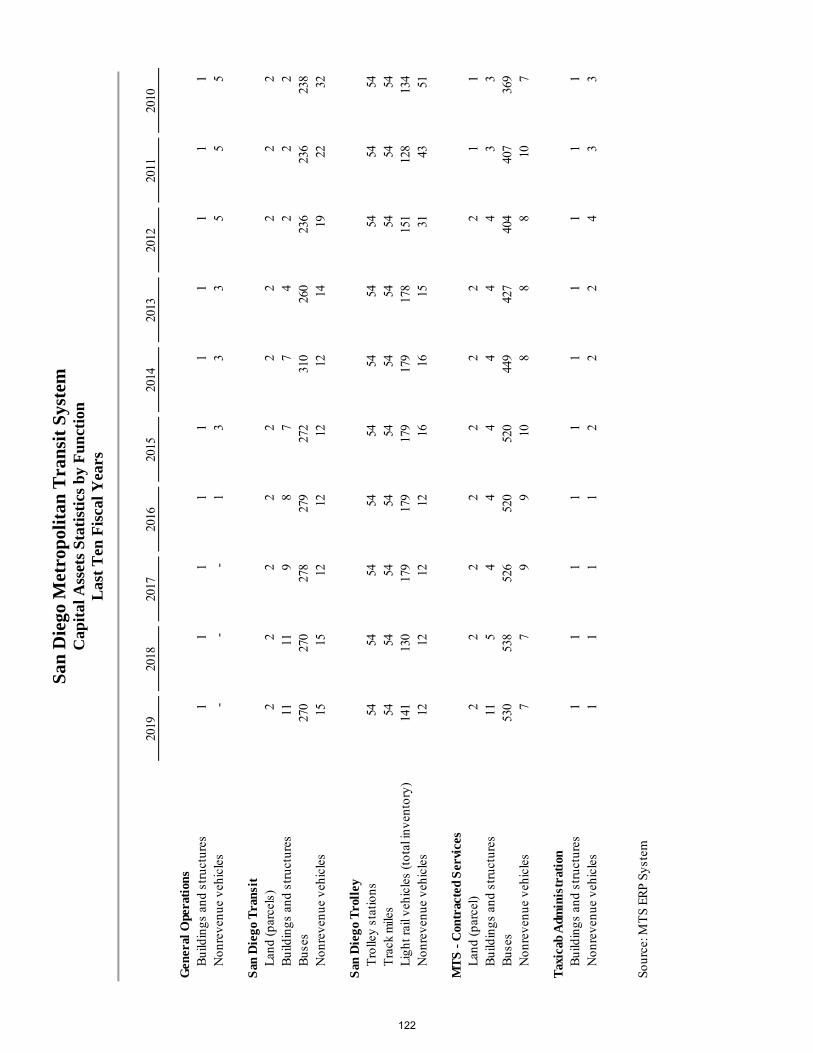
San
Die
go M
etro
pol
itan
Tra
nsi
t S
yste
m
Cap
ital
Ass
ets
Sta
tist
ics
by
Fu
nct
ion
L
ast
Ten
Fis
cal Y
ears
2019
2018
2017
2016
2015
2014
2013
2012
2011
2010
Gen
eral
Ope
rati
ons
B
uild
ings
and
str
uctu
res
1
1
1
1
1
1
1
1
1
1
N
onre
venu
e ve
hicl
es
-
-
-
1
3
3
3
5
5
5
San
Die
go T
rans
it
Lan
d (p
arce
ls)
2
2
2
2
2
2
2
2
2
2
B
uild
ings
and
str
uctu
res
11
11
9
8
7
7
4
2
2
2
B
uses
270
270
278
279
272
310
260
236
236
238
N
onre
venu
e ve
hicl
es
1
5
1
5
1
2
1
2
1
2
1
2
1
4
1
9
2
2
3
2
San
Die
go T
roll
ey
Tro
lley
stat
ions
54
54
54
54
54
54
54
54
54
54
T
rack
mile
s
5
4
5
4
5
4
5
4
5
4
5
4
5
4
5
4
5
4
5
4
Lig
ht ra
il ve
hicl
es (t
otal
inve
ntor
y)
14
1
13
0
17
9
17
9
17
9
17
9
17
8
15
1
12
8
13
4
Non
reve
nue
vehi
cles
12
12
12
12
16
16
15
31
43
51
MT
S -
Con
trac
ted
Ser
vice
s
Lan
d (p
arce
l)
2
2
2
2
2
2
2
2
1
1
Bui
ldin
gs a
nd s
truc
ture
s
1
1
5
4
4
4
4
4
4
3
3
B
uses
530
538
526
520
520
449
427
404
407
369
N
onre
venu
e ve
hicl
es
7
7
9
9
1
0
8
8
8
10
7
Tax
icab
Adm
inis
trat
ion
B
uild
ings
and
str
uctu
res
1
1
1
1
1
1
1
1
1
1
N
onre
venu
e ve
hicl
es
1
1
1
1
2
2
2
4
3
3
Sour
ce: M
TS
ERP
Syst
em
122
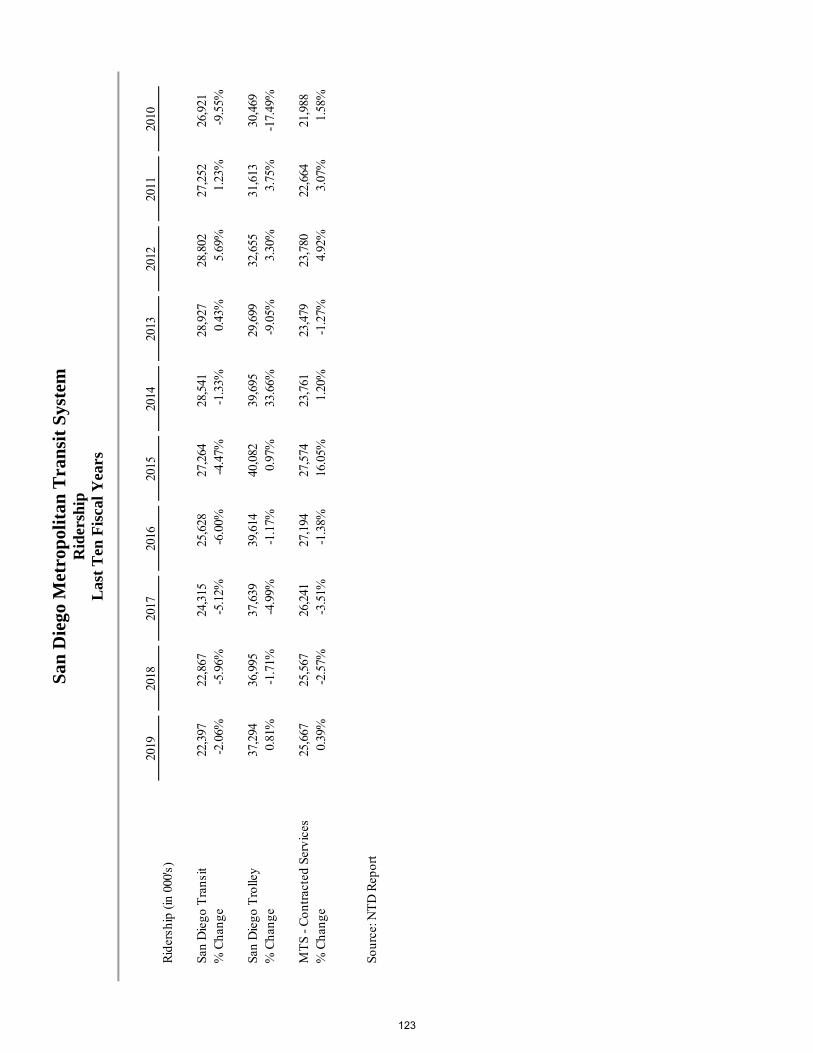
San
Die
go M
etro
pol
itan
Tra
nsi
t S
yste
m
Rid
ersh
ip
Las
t T
en F
isca
l Yea
rs
2019
2018
2017
2016
2015
2014
2013
2012
2011
2010
Rid
ersh
ip (i
n 00
0's)
San
Die
go T
rans
it
2
2,39
7
2
2,86
7
2
4,31
5
2
5,62
8
2
7,26
4
2
8,54
1
2
8,92
7
2
8,80
2
2
7,25
2
2
6,92
1 %
Cha
nge
-2.0
6%-5
.96%
-5.1
2%-6
.00%
-4.4
7%-1
.33%
0.43
%5.
69%
1.23
%-9
.55%
San
Die
go T
rolle
y
3
7,29
4
3
6,99
5
3
7,63
9
3
9,61
4
4
0,08
2
3
9,69
5
2
9,69
9
3
2,65
5
3
1,61
3
3
0,46
9 %
Cha
nge
0.81
%-1
.71%
-4.9
9%-1
.17%
0.97
%33
.66%
-9.0
5%3.
30%
3.75
%-1
7.49
%
MT
S - C
ontr
acte
d Se
rvic
es
2
5,66
7
2
5,56
7
2
6,24
1
2
7,19
4
2
7,57
4
2
3,76
1
2
3,47
9
2
3,78
0
2
2,66
4
2
1,98
8 %
Cha
nge
0.39
%-2
.57%
-3.5
1%-1
.38%
16.0
5%1.
20%
-1.2
7%4.
92%
3.07
%1.
58%
Sour
ce: N
TD
Rep
ort
123
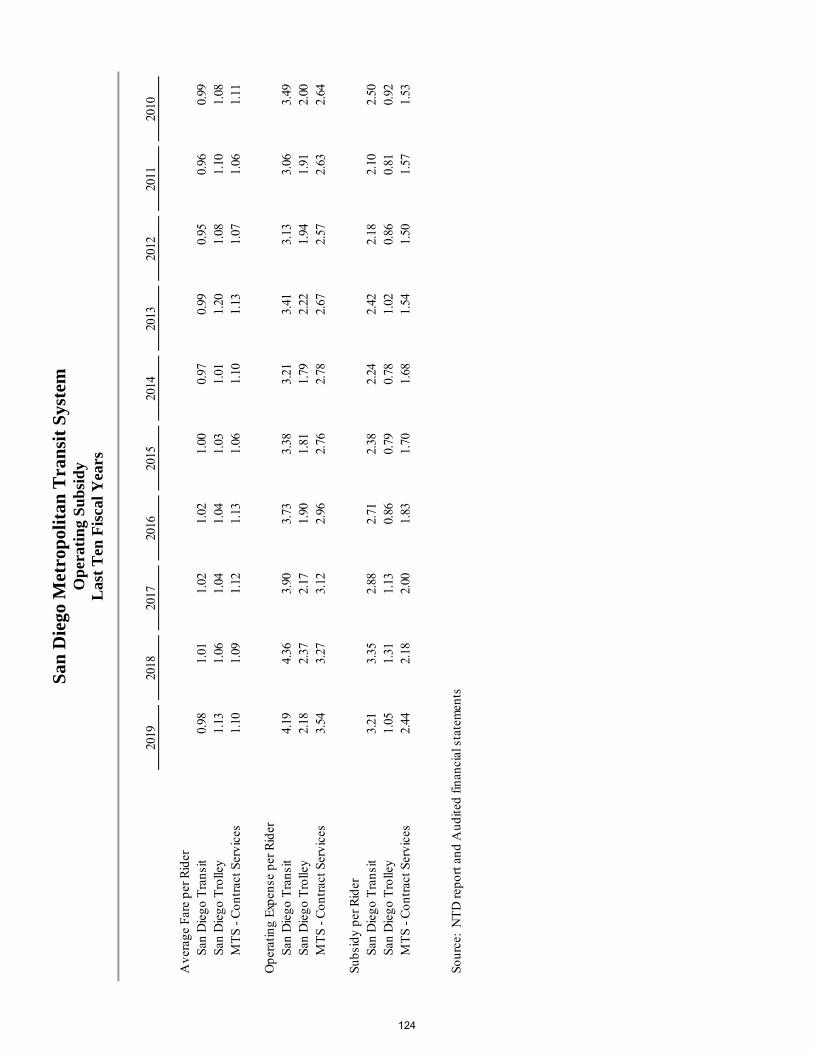
San
Die
go M
etro
pol
itan
Tra
nsi
t S
yste
m
Op
erat
ing
Su
bsi
dy
Las
t T
en F
isca
l Yea
rs
2019
2018
2017
2016
2015
2014
2013
2012
2011
2010
Ave
rage
Far
e pe
r Rid
erSa
n D
iego
Tra
nsit
0
.98
1
.01
1
.02
1
.02
1
.00
0
.97
0
.99
0
.95
0
.96
0
.99
San
Die
go T
rolle
y
1.1
3
1.0
6
1.0
4
1.0
4
1.0
3
1.0
1
1.2
0
1.0
8
1.1
0
1.0
8 M
TS
- Con
trac
t Ser
vice
s
1.1
0
1.0
9
1.1
2
1.1
3
1.0
6
1.1
0
1.1
3
1.0
7
1.0
6
1.1
1
Ope
ratin
g Ex
pens
e pe
r Rid
erSa
n D
iego
Tra
nsit
4
.19
4
.36
3
.90
3
.73
3
.38
3
.21
3
.41
3
.13
3
.06
3
.49
San
Die
go T
rolle
y
2.1
8
2.3
7
2.1
7
1.9
0
1.8
1
1.7
9
2.2
2
1.9
4
1.9
1
2.0
0 M
TS
- Con
trac
t Ser
vice
s
3.5
4
3.2
7
3.1
2
2.9
6
2.7
6
2.7
8
2.6
7
2.5
7
2.6
3
2.6
4
Subs
idy
per R
ider
San
Die
go T
rans
it
3.2
1
3.3
5
2.8
8
2.7
1
2.3
8
2.2
4
2.4
2
2.1
8
2.1
0
2.5
0 Sa
n D
iego
Tro
lley
1
.05
1
.31
1
.13
0
.86
0
.79
0
.78
1
.02
0
.86
0
.81
0
.92
MT
S - C
ontr
act S
ervi
ces
2
.44
2
.18
2
.00
1
.83
1
.70
1
.68
1
.54
1
.50
1
.57
1
.53
Sour
ce:
NT
D re
port
and
Aud
ited
finan
cial
sta
tem
ents
124

INDEPENDENT AUDITOR’S REPORT ON INTERNAL CONTROL OVER FINANCIAL REPORTING AND ON COMPLIANCE AND OTHER MATTERS BASED ON AN AUDIT OF FINANCIAL STATEMENTS
PERFORMED IN ACCORDANCE WITH GOVERNMENT AUDITING STANDARDS
To the Board of Directors
San Diego Metropolitan Transit System San Diego, California We have audited, in accordance with the auditing standards generally accepted in the United States of America and the standards applicable to financial audits contained in Government Auditing Standards issued by the Comptroller General of the United States, the financial statements of the San Diego Metropolitan Transit System (MTS), which comprise the statements of net position as of June 30, 2019 and 2018, and the related statements of revenues, expenses and changes in net position, and cash flows for the years then ended, and the related notes to the basic financial statements and have issued our report thereon dated October 29, 2019. Internal Control over Financial Reporting In planning and performing our audits of the financial statements, we considered MTS’s internal control over financial reporting (internal control) to determine the audit procedures that are appropriate in the circumstances for the purpose of expressing our opinions on the financial statements, but not for the purpose of expressing an opinion on the effectiveness of the MTS’s internal control. Accordingly, we do not express an opinion on the effectiveness of MTS’s internal control. A deficiency in internal control exists when the design or operation of a control does not allow management or employees, in the normal course of performing their assigned functions, to prevent, or detect and correct, misstatements on a timely basis. A material weakness is a deficiency, or a combination of deficiencies, in internal control, such that there is a reasonable possibility that a material misstatement of the entity’s financial statements will not be prevented, or detected and corrected, on a timely basis. A significant deficiency is a deficiency, or a combination of deficiencies, in internal control that is less severe than a material weakness, yet important enough to merit attention by those charged with governance. Our consideration of internal control was for the limited purpose described in the first paragraph of this section and was not designed to identify all deficiencies in internal control that might be material weaknesses or significant deficiencies. Given these limitations, during our audit we did not identify any deficiencies in internal control that we consider to be material weaknesses. However, material weaknesses may exist that have not been identified. Compliance and Other Matters As part of obtaining reasonable assurance about whether MTS’s financial statements are free from material misstatement, we performed tests of its compliance with certain provisions of laws, regulations, contracts, and grant agreements, noncompliance with which could have a direct and material effect on the determination of financial statement amounts. However, providing an opinion on compliance with those provisions was not an objective of our audit, and accordingly, we do not express such an opinion. The results of our tests disclosed no instances of noncompliance or other matters that are required to be reported under Government Auditing Standards.
4365 Executive Drive, Suite 710, San Diego, California 92121 Tel: 858-242-5100 • Fax: 858-242-5150
www.pungroup.com
3939352 Pun & McGeady_L_final.pdf 2 1/14/14 3:48 PM
125
To the Board of Directors San Diego Metropolitan Transit System
San Diego, California Page 2
Purpose of this Report The purpose of this report is solely to describe the scope of our testing of internal control and compliance and the results of that testing, and not to provide an opinion on the effectiveness of the entity’s internal control or on compliance. This report is an integral part of an audit performed in accordance with Government Auditing Standards in considering the entity’s internal control and compliance. Accordingly, this communication is not suitable for any other purpose.
San Diego, California October 29, 2019
126