SAMPLE REPORT - Amazon Web Services · 2017-06-08 · SAMPLE Insourced Contact Center Benchmark...
136
1 | Page ©MetricNet, LLC www.metricnet.com SAMPLE REPORT DATA IS NOT ACCURATE! Contact Center Benchmark In-house/Insourced Contact Centers Report Number: CC-SAMPLE-IN-0617 | Updated: June 2017 MetricNet Performance Benchmarking www.metricnet.com MetricNet’s instantly downloadable Contact Center benchmarks provide valuable industry data that your organization can use to begin improving performance right away!
Transcript of SAMPLE REPORT - Amazon Web Services · 2017-06-08 · SAMPLE Insourced Contact Center Benchmark...

SAMPLE Insourced Contact Center Benchmark (sample report only—data is not accurate!)
1 | P a g e © M e t r i c N e t , L L C w w w . m e t r i c n e t . c o m
h
SAMPLE REPORT DATA IS NOT ACCURATE!
Contact Center Benchmark In-house/Insourced Contact Centers Report Number: CC-SAMPLE-IN-0617 | Updated: June 2017
MetricNet Performance Benchmarking www.metricnet.com
MetricNet’s instantly downloadable Contact Center benchmarks provide valuable industry data that your organization can use to begin improving performance right away!
MetricNet Performance Benchmarking
www.metricnet.com

SAMPLE Insourced Contact Center Benchmark (sample report only—data is not accurate!)
1 | P a g e © M e t r i c N e t , L L C w w w . m e t r i c n e t . c o m
Contents
Benchmarking Overview......................................................................................5
The Basic Benchmarking Approach ............................................................................ 5
Achieving World-Class Performance .......................................................................... 7
Cost vs. Quality for Contact Centers .......................................................................... 9
How to Use this Benchmark Report .................................................................. 12
Step 1: Collect your Contact Center’s performance data. ....................................12
Step 2: Compare your performance to others. .......................................................13
Step 3: Develop strategies for improved performance. .......................................14
Step 4: Implement, and monitor results. ................................................................16
KPI Statistics: Summary and Quartiles ............................................................. 18
Benchmarking Performance Summary .....................................................................18
Quartile Rankings for Each KPI ................................................................................21
Benchmarking Scorecard and Rankings ............................................................ 26
The Contact Center Scorecard: An Overview ..........................................................26
Tracking Your Balanced Score ..................................................................................27
Benchmarking the Balanced Score ...........................................................................28
Detailed Benchmarking Data ........................................................................... 38
Inbound Channel Mix Metrics ...................................................................................38
Voice % of Total .......................................................................................................38
Chat % of Total .........................................................................................................40
IVR % of Total ...........................................................................................................42
Web Ticket/Email % of Total .................................................................................44
Other % of Total .......................................................................................................46
Cost Metrics ..................................................................................................................48
Average Cost per Voice Contact ............................................................................48
Average Cost per Chat Session ..............................................................................50

SAMPLE Insourced Contact Center Benchmark (sample report only—data is not accurate!)
2 | P a g e © M e t r i c N e t , L L C w w w . m e t r i c n e t . c o m
Average Cost per Web Ticket/Email Contact ......................................................52
Average Cost per Agent-Assisted Contact ...........................................................54
Average Cost per Contact (including IVR) ...........................................................56
Average Cost per Voice Minute .............................................................................58
Average Cost per Chat Minute ...............................................................................60
Average Cost per Web Ticket/Email Minute ........................................................62
Handle Time Metrics ...................................................................................................64
Voice Handle Time ...................................................................................................64
Chat Handle Time ....................................................................................................66
Web/Email Handle Time .........................................................................................68
Voice Quality Metrics .................................................................................................70
Voice Customer Satisfaction ..................................................................................70
Net First Contact Resolution Rate ........................................................................72
Call Quality ...............................................................................................................74
Voice Productivity Metrics .........................................................................................76
Voice Agent Utilization ...........................................................................................76
Inbound Voice Contacts per Agent per Month ....................................................79
Voice, Chat, and Email Agents as a % of Total Contact Center Headcount ..81
Voice SLA Metrics ........................................................................................................83
Average Speed of Answer (ASA) ............................................................................83
Call Abandonment Rate ..........................................................................................85
% Answered in 30 Seconds ....................................................................................87
Agent Metrics ...............................................................................................................89
Annual Agent Turnover ...........................................................................................89
Daily Agent Absenteeism ........................................................................................91
Agent Occupancy ......................................................................................................93
Agent Schedule Adherence ....................................................................................95
New Agent Training Hours .....................................................................................97
Annual Agent Training Hours ................................................................................99

SAMPLE Insourced Contact Center Benchmark (sample report only—data is not accurate!)
3 | P a g e © M e t r i c N e t , L L C w w w . m e t r i c n e t . c o m
Agent Tenure ......................................................................................................... 101
Agent Job Satisfaction.......................................................................................... 103
Chat Metrics .............................................................................................................. 105
% of Contacts Originating in Chat ..................................................................... 105
% of Contacts Resolved in Chat ......................................................................... 107
Chat First Contact Resolution Rate ................................................................... 109
% Failover Rate from Chat to Voice .................................................................. 111
Customer Satisfaction in the Chat Channel ..................................................... 113
Average Concurrent Chat Sessions .................................................................... 115
Max Concurrent Chat Sessions ........................................................................... 117
Number of Chat Sessions per Chat Agent per Month ..................................... 119
Important KPI Correlations ............................................................................ 121
Voice Handle Time (minutes) vs. Average Cost per Voice Contact .............. 121
Voice Agent Utilization vs. Average Cost per Voice Minute ......................... 122
Voice Agent Utilization vs. Average Speed of Answer (seconds) ................. 123
Voice Agent Utilization vs. Call Abandonment Rate ...................................... 124
Average Speed of Answer (seconds) vs. Call Abandonment Rate ................ 125
Net First Contact Resolution Rate vs. Voice Customer Satisfaction ........... 126
Chat First Contact Resolution Rate vs. Customer Satisfaction in Chat Channel ................................................................................................................... 127
Agent Job Satisfaction vs. Voice Customer Satisfaction ................................ 128
New Agent Training Hours vs. Agent Job Satisfaction ................................... 129
Annual Agent Training Hours vs. Agent Job Satisfaction .............................. 130
New Agent Training Hours vs. Net First Contact Resolution Rate .............. 131
Annual Agent Training Hours vs. Net First Contact Resolution Rate .......... 132
Agent Job Satisfaction vs. Daily Agent Absenteeism ..................................... 133
Agent Job Satisfaction vs. Annual Agent Turnover ......................................... 134
About MetricNet ............................................................................................ 135
Free Resources ...................................................................................................... 135

SAMPLE Insourced Contact Center Benchmark (sample report only—data is not accurate!)
4 | P a g e © M e t r i c N e t , L L C w w w . m e t r i c n e t . c o m
BENCHMARKING OVERVIEW

SAMPLE Insourced Contact Center Benchmark (sample report only—data is not accurate!)
5 | P a g e © M e t r i c N e t , L L C w w w . m e t r i c n e t . c o m
Benchmarking Overview
Benchmarking is a well-established tool for measuring and improving Contact Center performance. Effective benchmarking enables you to quantify your Contact Center ’s performance , compare your Contact Center to others in your industry, identify negative performance gaps, and define the actions necessary to close the gaps.
The power of benchmarking is that it enables your Contact Center to save enormous amounts of time and energy by building upon the know-how of peers, competitors, and world-class companies. Contact Centers that focus exclusively on their internal operations tend to make progress at an evolutionary pace. But benchmarking forces an organization to look externally—at the competition. By studying the competition, and selectively adopting practices from the best of the best, Contact Centers that successfully employ benchmarking can improve their performance at a revolutionary pace.
The Basic Benchmarking Approach
Although benchmarking is a rigorous, analytical process, it is fairly straightforward. The basic approach is illustrated below.
SAMPLE Insourced Contact Center Benchmark (sample report only—data is not accurate!)
6 | P a g e © M e t r i c N e t , L L C w w w . m e t r i c n e t . c o m
The first critical step in benchmarking is to measure your Contact Center ’s performance. We have divided the important metrics, or Key Performance Indicators (KPIs), for your Contact Center into eight categories:
1) Inbound Channel Mix metrics, such as Voice % of Total
2) Cost metrics, such as Cost per Contact
3) Handle Time metrics, such as Chat Handle Time
4) Voice Quality metrics, such as Customer Satisfaction
5) Voice Productivity metrics, such as Agent Utilization
6) Voice SLA metrics, such as Average Speed of Answer
7) Agent metrics, such as Agent Job Satisfaction
8) Chat metrics, such as % of Contacts Resolved in Chat
This benchmark report explains each KPI, how to measure it, and how it is connected with other KPIs.
But the true potential of KPIs can be unlocked only when they are used holistically, not just to measure your performance, but also to:
Track and trend your performance over time
Benchmark your performance vs. industry peers
Identify strengths and weaknesses in your Contact Center
Diagnose the underlying drivers of performance gaps
Prescribe actions to improve your performance
Establish performance goals for both individuals and your Contact Center
overall
In other words, once you’ve measured your performance, benchmarking involves comparing your performance to others and asking questions such as, “How did they achieve a higher level of customer satisfaction? How did they get to a lower cost per contact? How did they drive customer loyalty by virtue of the Contact Center?”
Once you’ve answered those questions, you can adopt selected industry best practices to remedy your performance gaps on the critical KPIs that will help

SAMPLE Insourced Contact Center Benchmark (sample report only—data is not accurate!)
7 | P a g e © M e t r i c N e t , L L C w w w . m e t r i c n e t . c o m
you to achieve superior performance. With this basic approach, your Contact Center can build a service-based competitive advantage through benchmarking!
Achieving World-Class Performance
To build a sustainable competitive advantage, your goal must be World -Class Performance. That’s where we can help you. MetricNet’s benchmarking database is global. We have completed more than 3,700 benchmarks. Through them, we have identified nearly 80 industry best practices and 30 Key Performance Indicators (KPIs) that organizations around the world are using to achieve World-Class Performance.
World-Class Contact Centers have a number of characteristics in common:
They consistently exceed customer expectations—regardless of
transaction type
• This produces high levels of Customer Satisfaction
• Their Call Quality is consistently high
They manage business value at or above average industry levels

SAMPLE Insourced Contact Center Benchmark (sample report only—data is not accurate!)
8 | P a g e © M e t r i c N e t , L L C w w w . m e t r i c n e t . c o m
• Their Cost per Contact is below average
• If applicable, they generate revenue above average industry levels
(telemarketing, telesales, debt collections)
They follow industry best practices
• Industry best practices are defined and documented
• They effectively apply those best practices
They add value with every transaction
• They produce a positive customer experience
• They improve customer loyalty
• They create positive brand awareness
There's another way that we can describe what it means to be a World-Class Contact Center. Graphically, it looks like the image below:
The Goal of Benchmarking: Lower Cost and Higher Quality
On this chart, we're showing two dimensions. The X-axis is cost per contact and the Y-axis is quality (as measured by customer satisfaction). We've taken
Cost per Contact
Qua
lity
HigherLower
Higher After Benchmarking
Starting Point: Before Benchmarking
World-Class Performance Curve
Below-Average Performance Curve

SAMPLE Insourced Contact Center Benchmark (sample report only—data is not accurate!)
9 | P a g e © M e t r i c N e t , L L C w w w . m e t r i c n e t . c o m
some representative data points from our database and placed them on this chart.
The first thing you'll notice is that there's a cause-and-effect relationship between cost and quality. Some Contact Centers are driven by the need to minimize their cost. When that's the case, your cost will drive your quality. Other Contact Centers are driven by quality. In that case, your quality will drive your cost.
The second thing you'll notice is that it's a non-linear relationship—as quality increases, your cost will increase disproportionately. At some point, it probably doesn't make sense to pursue any further quality , because quality is not free!
The point of this chart is to reinforce what it means to be World -Class. It means that you take the limited resources you have and deploy them in the most effective way. If you do that, you will land on the upper curve, the World-Class curve. If your Contact Center performs below average, you'll be on the lower curve.
Being World-Class is a relative concept. It's not about hitting a particular target on any one metric. It is about deploying your resources as effectively as you possibly can.
Cost vs. Quality for Contact Centers
Think about it this way. On the two-dimensional chart below, we again show cost per contact on the X-axis (except that low cost is now on the right, instead of the left) and customer satisfaction (quality) on the Y-axis. Where you want to be is on the upper-right World-Class Performance curve shown by the blue diamonds.
The blue diamonds represent those Contact Centers that have optimized their performance. As you can see in the chart , some of them have optimized at a very low cost and a slightly above-average customer-satisfaction level. Others have optimized at a slightly better-than-average cost and a very high customer-satisfaction level. The goal is to be in the upper -right-hand quadrant where you are both efficient (low cost) and effective (high quality).

SAMPLE Insourced Contact Center Benchmark (sample report only—data is not accurate!)
10 | P a g e © M e t r i c N e t , L L C w w w . m e t r i c n e t . c o m
The World-Class Performance Curve: Optimizing Efficiency and Effectiveness
World-ClassPerformance
BenchmarkingDatabase
Lower CostCost (Efficiency)
Higher Cost
Qua
lity
(Effe
ctiv
enes
s)
Lower Quality
Higher Quality
Top QuartileEfficient and Effective
Lower Quartile
Middle QuartilesEffective but not Efficient
Middle QuartilesEfficient but not Effective
SAMPLE Insourced Contact Center Benchmark (sample report only—data is not accurate!)
11 | P a g e © M e t r i c N e t , L L C w w w . m e t r i c n e t . c o m
HOW TO USE THIS BENCHMARK
REPORT

SAMPLE Insourced Contact Center Benchmark (sample report only—data is not accurate!)
12 | P a g e © M e t r i c N e t , L L C w w w . m e t r i c n e t . c o m
How to Use this Benchmark Report
Here is the four-step benchmarking process to improve your Contact Center ’s performance with this report:
Step 1: Collect your Contact Center’s performance data.
Thorough, accurate data collection is the cornerstone of successful benchmarking. This is also the most time-consuming step in benchmarking. But you need accurate data in order to identify the performance gaps in your own Contact Center.
Ideally, your Contact Center will have data that measures performance for each of the 41 KPIs that we include in this benchmarking report , those listed below:
Contact Center Benchmarking Metrics

SAMPLE Insourced Contact Center Benchmark (sample report only—data is not accurate!)
13 | P a g e © M e t r i c N e t , L L C w w w . m e t r i c n e t . c o m
Contact Center Benchmarking Metrics (continued)
If your Contact Center does not yet measure all 41 KPIs, you can still benefit from benchmarking the KPIs for which you do have data. At a minimum, you’ll want to benchmark six of the most important metrics, the ones we use in our Contact Center Scorecard (see page 26 below), or some similar substitutes . And for the KPIs that you haven’t begun measuring, you can still use this report to establish performance goals based on the benchmarking data from other Contact Centers (see Step 3).
We have defined each KPI in the Detailed Benchmarking Data section below (starting at page 38). You can refer to these definitions as you collect your data to ensure an apples-to-apples benchmarking comparison in Step 2.
You may also find it helpful to review your collected data with other key personnel who understand your Contact Center ’s operations . They can often provide context for the data and spot potential anomalies or inaccuracies.
Step 2: Compare your performance to others.
We provide several methods to compare your performance data with industry peers. The four primary methods are these:
1) A Benchmarking KPI Performance Summary (page 18), which lists the
industry peer group’s average , minimum, median, and maximum
performance levels for each KPI.

SAMPLE Insourced Contact Center Benchmark (sample report only—data is not accurate!)
14 | P a g e © M e t r i c N e t , L L C w w w . m e t r i c n e t . c o m
2) Quartile Rankings (page 21), so you can map which quartile your Contact
Center performs in for each KPI.
3) A Contact Center Scorecard (page 26), which provides a more holistic,
balanced measure of your Contact Center ’s overall performance
compared to the industry peer group.
4) Detailed Benchmarking Data (starting on page 38), which shows bar
charts of the performance level for each Contact Center in the peer
group, for each individual KPI.
Step 3: Develop strategies for improved performance.
Without an action plan to improve performance, benchmarking is a pointless exercise. Ironically, this is one of the simplest steps in the benchmarking process, but it adds the most value.
The true potential of measuring and benchmarking your KPIs can be unlocked only when you use them to diagnose and understand the underlying drivers of your Contact Center ’s performance. Then you can use that diagnosis to strategically adopt the specific industry best practices that will boost your Contact Center to World-Class Performance.
The key to using KPIs diagnostically is to understand their cause-and-effect relationships. You can think of these relationships as a linkage where all of the KPIs are interconnected. When one KPI moves up or down, other KPIs move with it. Understanding this linkage is enormously powerful because it shows you the levers you can pull to increase performance.
The diagram below illustrates some of the most important linkage between Contact Center KPIs. The detailed benchmarking data in this report (starting on page 38) also lists key correlations for each KPI.

SAMPLE Insourced Contact Center Benchmark (sample report only—data is not accurate!)
15 | P a g e © M e t r i c N e t , L L C w w w . m e t r i c n e t . c o m
Major KPI Cause-and-Effect Relationships
We call Cost per Contact and Customer Satisfaction the foundation metrics. Nearly everything a Contact Center does can be viewed through the lens of cost and quality. Will this new technology reduce my costs? Will this new process improve customer satisfaction? This insight is crucial because it greatly simplifies decision-making for your Contact Center. Any practice that does not have the long-term effect of improving customer satisfaction, reducing costs, or both, is simply not worth doing. (Sales effectiveness may also be foundational for a revenue-generating Contact Center, but this report does not benchmark sales metrics.)
The foundation metrics, however, cannot be directly controlled. Instead, they are controlled by other KPIs, the ones we call underlying drivers. As you can see from the diagram above, some top examples of underlying drivers are Agent Utilization, First Contact Resolution Rate, and Agent Job Satisfaction. These underlying drivers directly impact the foundation metrics—any improvement on the driver metrics will cause corresponding improvements in cost, quality, or both.
By understanding the underlying drivers for cost and quality, you can use your benchmarked KPIs diagnostically. If your Customer Satisfaction is low, for example, simply isolate the primary underlying drivers of Customer Satisfaction

SAMPLE Insourced Contact Center Benchmark (sample report only—data is not accurate!)
16 | P a g e © M e t r i c N e t , L L C w w w . m e t r i c n e t . c o m
on which your performance was low compared to the benchmark. Then map out an action plan to improve your performance for those crucial metrics.
To help choose the specific steps in your action plan, identify the industry best practices that will improve your performance for the crucial metrics that you isolated. MetricNet has identified nearly 80 industry best practices for Contact Centers.
You should also set specific performance targets, both for individual agents and for the Contact Center overall. To ensure that you are improving holistically, and not just fixating on some of your lowest metrics, emphasize performance targets for your Contact Center ’s balanced score (see page 26).
Step 4: Implement, and monitor results.
Once you’ve identified your strategies for improved performance, you are in a position to implement your action plan. This is where the payoff comes, so don’t neglect this step!
As you implement your action plan, regularly monitor your performance for changes. One of the easiest and best ways of monitoring is to update your Contact Center scorecard (see page 26) every month or every quarter, and trend the changes in your score over time.
If you have implemented your action plan but over time your performance does not improve as expected, return to Step 3. Reevaluate which strategies have worked, which have not, and whether you should attack different o r additional drivers of your performance gaps.
Do you want your Contact Center to achieve continuous improvement? Consider repeating this four-step benchmarking process periodically with the most up -to-date benchmarking data from industry peers, so you can build and maintain your competitive advantage.

SAMPLE Insourced Contact Center Benchmark (sample report only—data is not accurate!)
17 | P a g e © M e t r i c N e t , L L C w w w . m e t r i c n e t . c o m
KPI STATISTICS: SUMMARY AND
QUARTILES

SAMPLE Insourced Contact Center Benchmark (sample report only—data is not accurate!)
18 | P a g e © M e t r i c N e t , L L C w w w . m e t r i c n e t . c o m
KPI Statistics: Summary and Quartiles
Benchmarking Performance Summary
The table on the next two pages summarizes this report’s benchmarking data. It shows the benchmarking peer group’s average, minimum, median, and maximum performance levels for each Key Performance Indicator (KPI).
On the left of the table you see the eight categories of metrics, followed by 41 KPIs that you can use to benchmark your Contact Center. To compare your Contact Center ’s performance with that of this peer group, simply copy the table into a spreadsheet and add a column with your data for each KPI that you measure.
It’s important to look at this data holistically. No single metric comes even close to telling the whole story. For example , if your cost is high, that's not necessarily a bad thing—particularly if it comes with good quality and service levels. By contrast, if your cost is low, that may not be a good thing if it comes with low Customer Satisfaction, low First Contact Resolution Rate, and the like.

SAMPLE Insourced Contact Center Benchmark (sample report only—data is not accurate!)
19 | P a g e © M e t r i c N e t , L L C w w w . m e t r i c n e t . c o m
Average Min Median MaxVoice % of Total 64.4% 13.6% 68.5% 92.6%Chat % of Total 14.3% 0.0% 11.3% 51.2%IVR % of Total 16.4% 0.0% 15.9% 59.9%Web Ticket/Email % of Total 3.8% 0.0% 3.3% 9.5%Other % of Total 0.9% 0.0% 0.8% 2.6%Average Cost per Voice Contact $31.03 $6.82 $28.15 $86.63Average Cost per Chat Session $16.39 $1.73 $13.28 $55.41Average Cost per Web Ticket/Email Contact $29.88 $5.91 $28.21 $82.52Average Cost per Agent-Assisted Contact $27.84 $6.76 $25.03 $77.06Average Cost per Contact (incl. IVR) $21.93 $6.76 $20.73 $49.38Average Cost per Voice Minute $1.39 $0.54 $1.30 $2.62Average Cost per Chat Minute $0.95 $0.50 $0.85 $1.94Average Cost per Web Ticket/Email Minute $1.37 $0.56 $1.26 $2.65Voice Handle Time (minutes) 22.27 7.37 22.00 45.96Chat Handle Time (minutes) 17.13 1.95 15.68 42.86Web/Email Handle Time (minutes) 21.67 8.51 21.50 43.05Voice Customer Satisfaction 51.7% 13.3% 49.8% 95.4%Net First Contact Resolution Rate 36.6% 18.7% 34.7% 69.6%Call Quality 70.4% 23.2% 69.8% 97.2%Voice Agent Utilization 32.2% 15.3% 34.8% 48.2%Inbound Voice Contacts per Agent per Month 163 69 142 455Voice, Chat, and Email Agents as a % of Total Contact Center Headcount 60.7% 40.7% 60.4% 79.7%
Metric Type Key Performance Indicator (KPI)Peer Group Statistics
Inbound Channel Mix
Cost
Handle Time
Voice Quality
Voice Productivity
(continued on next page)

SAMPLE Insourced Contact Center Benchmark (sample report only—data is not accurate!)
20 | P a g e © M e t r i c N e t , L L C w w w . m e t r i c n e t . c o m
Average Speed of Answer (seconds) 150 69 146 290Call Abandonment Rate 11.2% 1.7% 10.2% 39.4%% Answered in 30 Seconds 33.9% 20.1% 33.1% 52.6%Annual Agent Turnover 68.1% 46.8% 67.5% 97.7%Daily Agent Absenteeism 14.7% 11.1% 14.7% 19.4%Agent Schedule Adherence 82.4% 73.7% 83.1% 91.3%Agent Occupancy 74.7% 49.0% 74.7% 95.8%New Agent Training Hours 160 62 163 279Annual Agent Training Hours 11 0 7 44Agent Tenure (months) 14.9 5.4 15.0 26.1Agent Job Satisfaction 71.0% 53.0% 71.7% 82.5%% of Contacts Originating in Chat 14.3% 0.0% 11.3% 51.2%% of Contacts Resolved in Chat 4.0% 0.0% 2.9% 17.2%Chat First Contact Resolution Rate 31.3% 8.3% 28.6% 58.8%% Failover Rate from Chat to Voice 68.6% 41.1% 71.3% 91.6%Customer Satisfaction in Chat Channel 56.7% 22.1% 54.6% 87.8%Average Concurrent Chat Sessions 0.83 0.47 0.77 1.25Max Concurrent Chat Sessions 2.9 1.0 3.0 4.0Number of Chat Sessions per Chat Agent per Month 371 109 270 1,922
Agent
Chat
Voice SLA

SAMPLE Insourced Contact Center Benchmark (sample report only—data is not accurate!)
21 | P a g e © M e t r i c N e t , L L C w w w . m e t r i c n e t . c o m
Quartile Rankings for Each KPI
Quartiles are another simple way to present the benchmarking data . For each metric, the best-performing Contact Centers fall into the first quartile; the worst performers fall into the fourth quartile.
For example, the Contact Centers who perform in the top 25% on the first cost metric have an Average Cost per Voice Contact that ranges between $6.82 (the best) and $20.15 (the 75th percentile). The bottom 25% of Contact Centers for that metric range between $38.75 and $86.63 per inbound contact.
1.7% 0.8% 0.0% 0.0%Other % of Total 2.6% 1.7% 0.8% 0.0%
6.3% 3.3% 1.4% 0.0%Web Ticket/Email % of Total 9.5% 6.3% 3.3% 1.4%
22.8% 15.9% 3.9% 0.0%IVR % of Total 59.9% 22.8% 15.9% 3.9%
48.9% 68.5% 80.8% 92.6%
Chat % of Total 51.2% 20.4% 11.3% 0.8%20.4% 11.3% 0.8% 0.0%
Voice % of Total 13.6% 48.9% 68.5% 80.8%
Channel Mix MetricQuartile
1(Top)
2 3 4(Bottom)

SAMPLE Insourced Contact Center Benchmark (sample report only—data is not accurate!)
22 | P a g e © M e t r i c N e t , L L C w w w . m e t r i c n e t . c o m
Average Cost per Web Ticket/Email Minute $0.56 $0.91 $1.26 $1.75$0.91 $1.26 $1.75 $2.65
Average Cost per Chat Minute $0.50 $0.69 $0.85 $1.16$0.69 $0.85 $1.16 $1.94
Average Cost per Voice Minute $0.54 $0.96 $1.30 $1.76$0.96 $1.30 $1.76 $2.62
Average Cost per Contact (incl. IVR) $6.76 $14.44 $20.73 $28.95$14.44 $20.73 $28.95 $49.38
Average Cost per Agent-Assisted Contact $6.76 $17.97 $25.03 $35.07$17.97 $25.03 $35.07 $77.06
Cost MetricQuartile
1(Top)
2 3 4(Bottom)
$20.15 $28.15 $38.75 $86.63Average Cost per Voice Contact $6.82 $20.15 $28.15 $38.75
$20.74$55.41
Average Cost per Chat Session $1.73 $8.13 $13.28
Average Cost per Web Ticket/Email Contact $5.91 $16.29 $28.21$8.13 $13.28 $20.74
$16.29 $28.21 $38.71 $82.52$38.71
14.38 21.50 25.30 43.05Web/Email Handle Time (minutes) 8.51 14.38 21.50 25.30
Handle Time MetricQuartile
1 (Top)
2 3 4 (Bottom)
Voice Handle Time (minutes) 7.37 16.06 22.00 25.3916.06 22.00 25.39 45.96
22.0942.86
Chat Handle Time (minutes) 1.95 10.59 15.6810.59 15.68 22.09
Voice Quality MetricQuartile
1 (Top)
2 3 4 (Bottom)
63.6% 49.8% 38.2% 13.3%Voice Customer Satisfaction 95.4% 63.6% 49.8% 38.2%
29.1%18.7%
Net First Contact Resolution Rate 69.6% 41.4% 34.7%
Call Quality 97.2% 83.2% 69.8%41.4% 34.7% 29.1%
83.2% 69.8% 61.0% 23.2%61.0%

SAMPLE Insourced Contact Center Benchmark (sample report only—data is not accurate!)
23 | P a g e © M e t r i c N e t , L L C w w w . m e t r i c n e t . c o m
Voice Agent Utilization 48.2% 39.2% 34.8% 22.7%
Voice Productivity MetricQuartile
1 (Top)
2 3 4 (Bottom)
Inbound Voice Contacts per Agent per Month
455 198 14239.2% 34.8% 22.7% 15.3%
198 142 111 69111
Voice, Chat, and Email Agents as a % of Total Contact Center Headcount
79.7% 71.4% 60.4%71.4% 60.4% 50.2% 40.7%
50.2%
Voice SLA MetricQuartile
1 (Top)
2 3 4 (Bottom)
106 146 183 290Average Speed of Answer (seconds) 69 106 146 183
28.3%20.1%
% Answered in 30 Seconds 52.6% 39.8% 33.1%
Call Abandonment Rate 1.7% 5.5% 10.2%39.8% 33.1% 28.3%
5.5% 10.2% 14.3% 39.4%14.3%
Agent MetricQuartile
1 (Top)
2 3 4 (Bottom)
Annual Agent Turnover 46.8% 58.9% 67.5% 75.5%58.9% 67.5% 75.5% 97.7%
12.8% 14.7% 16.2% 19.4%16.2%
Agent Occupancy 95.8% 82.6% 74.7%
Agent Schedule Adherence 91.3% 85.4% 83.1%
Daily Agent Absenteeism 11.1% 12.8% 14.7%
82.6% 74.7% 65.4% 49.0%
85.4% 83.1% 79.8% 73.7%79.8%
65.4%
193 163 119 62
16 7 0 00
119279 193 163
44 16
Agent Tenure (months) 26.1 17.6 15.0
Agent Job Satisfaction 82.5% 74.8% 71.7%
New Agent Training Hours
Annual Agent Training Hours 7
17.6 15.0 12.1 5.4
74.8% 71.7% 67.5% 53.0%67.5%
12.1

SAMPLE Insourced Contact Center Benchmark (sample report only—data is not accurate!)
24 | P a g e © M e t r i c N e t , L L C w w w . m e t r i c n e t . c o m
429 270 221 109Number of Chat Sessions per Chat Agent per
Month1,922 429 270 221
4.0 3.0 2.0 1.0Max Concurrent Chat Sessions 4.0 4.0 3.0 2.0
0.95 0.77 0.72 0.47Average Concurrent Chat Sessions 1.25 0.95 0.77 0.72
63.9% 54.6% 46.9% 22.1%Customer Satisfaction in Chat Channel 87.8% 63.9% 54.6% 46.9%
61.5% 71.3% 75.2% 91.6%% Failover Rate from Chat to Voice 41.1% 61.5% 71.3% 75.2%
Chat First Contact Resolution Rate 58.8% 38.4% 28.6% 24.7%6.6% 2.9% 0.2% 0.0%
38.4% 28.6% 24.7% 8.3%
% of Contacts Resolved in Chat 17.2% 6.6% 2.9% 0.2%
% of Contacts Originating in Chat 51.2% 20.4% 11.3% 0.8%
Chat MetricQuartile
1 (Top)
2 3 4 (Bottom)
20.4% 11.3% 0.8% 0.0%

SAMPLE Insourced Contact Center Benchmark (sample report only—data is not accurate!)
25 | P a g e © M e t r i c N e t , L L C w w w . m e t r i c n e t . c o m
BENCHMARKING SCORECARD AND
RANKINGS

SAMPLE Insourced Contact Center Benchmark (sample report only—data is not accurate!)
26 | P a g e © M e t r i c N e t , L L C w w w . m e t r i c n e t . c o m
Benchmarking Scorecard and Rankings
The Contact Center Scorecard: An Overview
The Contact Center scorecard produces a single, holistic measure of Contact Center performance. It combines six critical cost, quality, productivity, agent, and service-level KPIs into one overall performance indicator—the Balanced Score. Your score will range between zero and 100%. You can compare it directly with the Balanced Scores of other Contact Centers in the benchmark.
This is what the scorecard looks like, and how it is calculated:
*Benchmark averages have been used in the “Your Performance” column to illustrate how the scorecard is calculated.
Six critical performance metrics have been selected for the scorecard.
Step 1
Each metric has been weighted according to its relative importance.
Step 2
For each metric, the highest and lowest performance levels in the benchmark are recorded.
Step 3
Your actual performance for each metric is recorded in this column.
Step 4*
Your balanced score for each metric is calculated:
metric score × weighting
Step 6
Your score for each metric is calculated:
(worst case – your performance) ÷ (worst
case – best case) × 100
Step 5
Worst Case Best Case
Average Cost per Agent-Assisted Contact 25.0% $77.06 $6.76 $27.84 70.0% 17.5%
Voice Customer Satisfaction 25.0% 13.3% 95.4% 51.7% 46.8% 11.7%
Voice Agent Utilization 15.0% 15.3% 48.2% 32.2% 51.3% 7.7%
Net First Contact Resolution Rate 15.0% 18.7% 69.6% 36.6% 35.1% 5.3%
Agent Job Satisfaction 10.0% 53.0% 82.5% 71.0% 61.0% 6.1%
Average Speed of Answer (seconds) 10.0% 290 69 150 63.5% 6.4%
Total 100.0% n/a n/a n/a n/a 54.6%
Balanced Score
Key Performance Indicator (KPI)KPI
WeightingPerformance Range Your
PerformanceKPI Score

SAMPLE Insourced Contact Center Benchmark (sample report only—data is not accurate!)
27 | P a g e © M e t r i c N e t , L L C w w w . m e t r i c n e t . c o m
The six KPIs we selected for the scorecard are the metrics that are of highest importance for most Contact Centers:
Average Cost per Agent-Assisted Contact (one of the two foundation
metrics)
Voice Customer Satisfaction (the other foundation metric)
Voice Agent Utilization (the primary driver of Cost per Contact)
Net First Contact Resolution Rate (the primary driver of Voice Customer
Satisfaction)
Agent Job Satisfaction (a key secondary driver of both cost and quality)
Average Speed of Answer (the top service-level indicator)
The weighting percentage we assigned to each KPI is based on that KPI’s relative importance in the scorecard. For example, you can see that we gave the greatest weight to Cost per Contact and Customer Satisfaction (25% each), since those are the foundation metrics.
A Contact Center ’s Balanced Score will always range between 0% and 100%. If your performance is the worst on each of the six KPIs, compared to the industry peer group for this benchmark report, your score will be 0%. If your performance is the best on each KPI, your score will be 100%.
When we run this algorithm for literally hundreds of Contact Centers worldwide, the average Balanced Score is approximately 66%. If your score is above about 72%, you're in the top quartile; between about 67% and 72%, you're in the second quartile; between about 59% and 67%, in the third; and below 59%, in the bottom quartile.
Tracking Your Balanced Score
By calculating your overall score for every month or every quarter , you can track and trend its performance over time. Charting and tracking your Balanced Score is an ideal way to ensure continuous improvement in your Contact Center!
Consider this real data from a few years ago. One of MetricNet's clients simply updated their scorecard every month, as shown in the chart below. The blue

SAMPLE Insourced Contact Center Benchmark (sample report only—data is not accurate!)
28 | P a g e © M e t r i c N e t , L L C w w w . m e t r i c n e t . c o m
bars in the chart represent the monthly Balanced Scores , while the green background represents the 12-month trailing trend in scorecard performance. You can see that over the course of one year they managed to improve their performance substantially.
Balanced Score Trend
Benchmarking the Balanced Score
The Balanced Score is the single most useful performance indicator for comparing Contact Centers. The chart on the next page graphs the Balanced Scores for all Contact Centers included in this report’s benchmark data. The red line shows the average overall performance level.

SAMPLE Insourced Contact Center Benchmark (sample report only—data is not accurate!)
29 | P a g e © M e t r i c N e t , L L C w w w . m e t r i c n e t . c o m
Benchmarking the Balanced Score (continued)
0.0%
5.0%
10.0%
15.0%
20.0%
25.0%
30.0%
35.0%
40.0%
45.0%
50.0%
55.0%
60.0%
65.0%
70.0%
75.0%
Bala
nced
Sco
res
High 70.7%Average ----- 54.6%Median 55.0%Low 21.4%
Key Statistics
Balanced Score

SAMPLE Insourced Contact Center Benchmark (sample report only—data is not accurate!)
30 | P a g e © M e t r i c N e t , L L C w w w . m e t r i c n e t . c o m
Benchmarking the Balanced Score (continued)
The next two pages list the Balanced Score for each Contact Center in the benchmark. They also list each Contact Center ’s performance for each of the six KPIs used to calculate the Balanced Score. The data records are listed in rank order, from the best Balanced Score (record #43) to the worst (record #12). If you want to see what any other Contact Center ’s score looks like compared to yours, you can use this list .

SAMPLE Insourced Contact Center Benchmark (sample report only—data is not accurate!)
31 | P a g e © M e t r i c N e t , L L C w w w . m e t r i c n e t . c o m
Overall Ranking
Benchmark Data Record
Number
Average Cost per Agent-
Assisted Contact
Voice Customer
Satisfaction
Voice Agent Utilization
Net First Contact
Resolution Rate
Agent Job Satisfaction
Average Speed of Answer (seconds)
Total Balanced Score
1 43 $19.75 37.5% 48.2% 47.9% 81.6% 76 70.7%2 2 $35.73 95.4% 39.1% 40.1% 65.7% 138 68.1%3 5 $24.55 49.0% 39.2% 59.1% 81.6% 170 67.5%4 29 $24.63 69.5% 42.1% 38.6% 71.7% 157 66.2%5 34 $21.62 80.1% 37.4% 34.8% 69.6% 174 65.8%6 49 $7.38 55.6% 44.0% 26.2% 74.0% 175 65.3%7 6 $34.05 63.8% 42.8% 56.1% 75.9% 221 65.1%8 41 $11.59 59.3% 35.6% 27.7% 75.1% 108 64.9%9 11 $6.76 77.8% 34.6% 23.4% 69.0% 191 64.7%
10 18 $31.79 73.5% 38.7% 41.5% 76.8% 184 64.7%11 50 $16.57 59.1% 42.9% 29.0% 63.5% 113 62.7%12 39 $13.38 53.4% 42.4% 29.6% 73.6% 177 62.5%13 3 $32.30 75.9% 28.3% 41.6% 69.4% 121 60.9%14 13 $17.88 60.8% 26.8% 31.1% 72.1% 79 60.4%15 4 $14.49 87.1% 28.9% 18.7% 71.7% 242 59.5%16 28 $48.84 73.2% 32.1% 56.7% 74.8% 182 59.4%17 33 $13.11 55.4% 27.6% 26.0% 72.8% 84 59.4%18 44 $22.32 38.4% 43.3% 40.5% 78.2% 196 59.1%19 10 $12.06 28.4% 38.7% 31.3% 72.1% 69 58.6%20 48 $14.95 24.8% 47.1% 35.0% 66.3% 90 58.5%21 7 $24.40 42.9% 41.8% 35.2% 70.8% 134 57.8%22 14 $11.46 24.6% 44.2% 27.0% 69.1% 74 57.7%23 46 $21.67 51.6% 24.6% 36.3% 78.5% 117 57.3%24 22 $22.21 93.1% 15.3% 24.7% 62.9% 130 56.2%25 21 $6.78 35.4% 40.7% 25.6% 67.0% 181 55.0%26 8 $10.60 25.7% 40.2% 33.4% 70.2% 156 55.0%27 23 $27.96 54.0% 36.7% 33.6% 71.0% 186 54.8%
Rankings by Balanced Score

SAMPLE Insourced Contact Center Benchmark (sample report only—data is not accurate!)
32 | P a g e © M e t r i c N e t , L L C w w w . m e t r i c n e t . c o m
Overall Ranking
Benchmark Data Record
Number
Average Cost per Agent-
Assisted Contact
Voice Customer
Satisfaction
Voice Agent Utilization
Net First Contact
Resolution Rate
Agent Job Satisfaction
Average Speed of Answer (seconds)
Total Balanced Score
28 36 $38.44 65.6% 19.7% 42.7% 72.3% 83 54.7%29 31 $22.53 45.1% 34.0% 41.2% 64.6% 150 54.5%30 47 $49.87 47.8% 25.1% 54.6% 82.5% 89 54.3%31 19 $18.22 44.4% 35.7% 36.0% 73.8% 244 53.9%32 26 $25.15 65.8% 32.8% 32.5% 62.4% 206 53.5%33 17 $31.14 63.0% 19.1% 28.7% 74.8% 71 53.5%34 30 $66.83 56.7% 36.1% 69.6% 77.4% 213 53.1%35 1 $49.89 38.1% 38.0% 51.4% 73.8% 104 52.7%36 45 $42.35 49.9% 35.0% 44.6% 63.7% 101 52.3%37 40 $25.30 43.5% 25.7% 37.2% 69.5% 102 51.9%38 37 $42.64 92.7% 19.7% 24.1% 70.4% 163 51.7%39 16 $35.41 47.2% 37.0% 31.5% 70.9% 151 51.2%40 35 $29.79 41.5% 22.0% 35.4% 77.3% 114 49.6%41 9 $24.91 26.9% 38.5% 47.8% 67.0% 240 48.9%42 32 $25.96 46.3% 21.2% 29.2% 75.8% 142 48.5%43 42 $28.10 54.7% 18.2% 30.4% 68.3% 140 46.8%44 25 $20.39 25.9% 25.0% 26.6% 73.6% 160 43.6%45 20 $37.93 34.2% 20.7% 34.6% 72.4% 113 42.0%46 38 $30.87 15.6% 19.5% 32.5% 67.2% 106 36.3%47 27 $77.06 49.6% 22.0% 51.4% 76.7% 205 35.6%48 15 $33.91 49.3% 18.4% 28.4% 58.5% 243 34.6%49 24 $39.63 13.3% 21.7% 31.3% 58.6% 141 28.6%50 12 $47.09 24.7% 20.3% 35.8% 53.0% 290 21.4%
Average $27.84 51.7% 32.2% 36.6% 71.0% 150 54.6%Max $77.06 95.4% 48.2% 69.6% 82.5% 290 70.7%Min $6.76 13.3% 15.3% 18.7% 53.0% 69 21.4%
Median $25.03 49.8% 34.8% 34.7% 71.7% 146 55.0%
Key Statistics
Rankings by Balanced Score (continued)

SAMPLE Insourced Contact Center Benchmark (sample report only—data is not accurate!)
33 | P a g e © M e t r i c N e t , L L C w w w . m e t r i c n e t . c o m
Benchmarking the Balanced Score (continued)
The next two pages show the rankings for each KPI in the scorecard. The column for each KPI has the performance levels listed in rank order, from best (top row) to worst (bottom row). This is the same data you saw in the previous list. But in this list it is not tied together by individual Contact Center data records. Instead, each KPI is ranked on its own. This allows you to look at your performance for any given metric on the scorecard and see how you stack up against other in-house/insourced Contact Centers in your geographical region.

SAMPLE Insourced Contact Center Benchmark (sample report only—data is not accurate!)
34 | P a g e © M e t r i c N e t , L L C w w w . m e t r i c n e t . c o m
KPI RankingAverage Cost per Agent-Assisted
Contact
Voice Customer Satisfaction
Voice Agent Utilization
Net First Contact Resolution Rate
Agent Job Satisfaction
Average Speed of Answer (seconds)
Total Balanced Score
1 $6.76 95.4% 48.2% 69.6% 82.5% 69 70.7%2 $6.78 93.1% 47.1% 59.1% 81.6% 71 68.1%3 $7.38 92.7% 44.2% 56.7% 81.6% 74 67.5%4 $10.60 87.1% 44.0% 56.1% 78.5% 76 66.2%5 $11.46 80.1% 43.3% 54.6% 78.2% 79 65.8%6 $11.59 77.8% 42.9% 51.4% 77.4% 83 65.3%7 $12.06 75.9% 42.8% 51.4% 77.3% 84 65.1%8 $13.11 73.5% 42.4% 47.9% 76.8% 89 64.9%9 $13.38 73.2% 42.1% 47.8% 76.7% 90 64.7%
10 $14.49 69.5% 41.8% 44.6% 75.9% 101 64.7%11 $14.95 65.8% 40.7% 42.7% 75.8% 102 62.7%12 $16.57 65.6% 40.2% 41.6% 75.1% 104 62.5%13 $17.88 63.8% 39.2% 41.5% 74.8% 106 60.9%14 $18.22 63.0% 39.1% 41.2% 74.8% 108 60.4%15 $19.75 60.8% 38.7% 40.5% 74.0% 113 59.5%16 $20.39 59.3% 38.7% 40.1% 73.8% 113 59.4%17 $21.62 59.1% 38.5% 38.6% 73.8% 114 59.4%18 $21.67 56.7% 38.0% 37.2% 73.6% 117 59.1%19 $22.21 55.6% 37.4% 36.3% 73.6% 121 58.6%20 $22.32 55.4% 37.0% 36.0% 72.8% 130 58.5%21 $22.53 54.7% 36.7% 35.8% 72.4% 134 57.8%22 $24.40 54.0% 36.1% 35.4% 72.3% 138 57.7%23 $24.55 53.4% 35.7% 35.2% 72.1% 140 57.3%24 $24.63 51.6% 35.6% 35.0% 72.1% 141 56.2%25 $24.91 49.9% 35.0% 34.8% 71.7% 142 55.0%26 $25.15 49.6% 34.6% 34.6% 71.7% 150 55.0%27 $25.30 49.3% 34.0% 33.6% 71.0% 151 54.8%
Rankings of Each KPI

SAMPLE Insourced Contact Center Benchmark (sample report only—data is not accurate!)
35 | P a g e © M e t r i c N e t , L L C w w w . m e t r i c n e t . c o m
KPI RankingAverage Cost per Agent-Assisted
Contact
Voice Customer Satisfaction
Voice Agent Utilization
Net First Contact Resolution Rate
Agent Job Satisfaction
Average Speed of Answer (seconds)
Total Balanced Score
28 $25.96 49.0% 32.8% 33.4% 70.9% 156 54.7%29 $27.96 47.8% 32.1% 32.5% 70.8% 157 54.5%30 $28.10 47.2% 28.9% 32.5% 70.4% 160 54.3%31 $29.79 46.3% 28.3% 31.5% 70.2% 163 53.9%32 $30.87 45.1% 27.6% 31.3% 69.6% 170 53.5%33 $31.14 44.4% 26.8% 31.3% 69.5% 174 53.5%34 $31.79 43.5% 25.7% 31.1% 69.4% 175 53.1%35 $32.30 42.9% 25.1% 30.4% 69.1% 177 52.7%36 $33.91 41.5% 25.0% 29.6% 69.0% 181 52.3%37 $34.05 38.4% 24.6% 29.2% 68.3% 182 51.9%38 $35.41 38.1% 22.0% 29.0% 67.2% 184 51.7%39 $35.73 37.5% 22.0% 28.7% 67.0% 186 51.2%40 $37.93 35.4% 21.7% 28.4% 67.0% 191 49.6%41 $38.44 34.2% 21.2% 27.7% 66.3% 196 48.9%42 $39.63 28.4% 20.7% 27.0% 65.7% 205 48.5%43 $42.35 26.9% 20.3% 26.6% 64.6% 206 46.8%44 $42.64 25.9% 19.7% 26.2% 63.7% 213 43.6%45 $47.09 25.7% 19.7% 26.0% 63.5% 221 42.0%46 $48.84 24.8% 19.5% 25.6% 62.9% 240 36.3%47 $49.87 24.7% 19.1% 24.7% 62.4% 242 35.6%48 $49.89 24.6% 18.4% 24.1% 58.6% 243 34.6%49 $66.83 15.6% 18.2% 23.4% 58.5% 244 28.6%50 $77.06 13.3% 15.3% 18.7% 53.0% 290 21.4%
Average $27.84 51.7% 32.2% 36.6% 71.0% 150 54.6%Max $77.06 95.4% 48.2% 69.6% 82.5% 290 70.7%Min $6.76 13.3% 15.3% 18.7% 53.0% 69 21.4%
Median $25.03 49.8% 34.8% 34.7% 71.7% 146 55.0%
Rankings of Each KPI (continued)

SAMPLE Insourced Contact Center Benchmark (sample report only—data is not accurate!)
36 | P a g e © M e t r i c N e t , L L C w w w . m e t r i c n e t . c o m
Benchmarking the Balanced Score (continued)
For a graphical benchmark of each individual metric in the scorecard, see the following section of this report. It contains charts for all 41 KPIs, including the six scorecard KPIs. The red line in each chart represents the average performance within the benchmark peer group, for you to compare against your own Contact Center ’s performance. You can jump to the charts for the six scorecard KPIs using these links (each of those charts has links above it that you can use to return to this page or to jump to the next scorecard -KPI chart):
Average Cost per Agent-Assisted Contact
Voice Customer Satisfaction
Voice Agent Utilization
Net First Contact Resolution Rate
Agent Job Satisfaction
Average Speed of Answer
We always organize these charts from left to right so that good performance is on the left and bad performance is on the right. In some cases, such as cost, you'll notice an ascending distribution because lower numbers are better. In other cases, such as customer satisfaction, you will see a descending distribution because higher numbers are better.

SAMPLE Insourced Contact Center Benchmark (sample report only—data is not accurate!)
37 | P a g e © M e t r i c N e t , L L C w w w . m e t r i c n e t . c o m
DETAILED BENCHMARKING
DATA

SAMPLE Insourced Contact Center Benchmark (sample report only—data is not accurate!)
38 | P a g e © M e t r i c N e t , L L C w w w . m e t r i c n e t . c o m
Detailed Benchmarking Data
Inbound Channel Mix Metrics
Voice % of Total
Definition: Voice % of Total is the percentage of total contacts that originate in the voice channel.
Why it’s important: Voice % of Total is important because the Cost per Contact for voice-completed contacts is usually higher than for IVR, chat, and web contacts. By reducing the number of contacts originating in the voice channel, the overall average Cost per Contact can be reduced. Many Contact Centers, recognizing the potential to reduce their costs, constantly strive to reduce their Voice % of Total by deflecting calls into lower-cost channels.
Key correlations: Voice % of Total is strongly correlated with the following metrics:
Average Cost per Agent-Assisted Contact
Average Cost per Contact (all contact types)
𝑽𝒐𝒊𝒄𝒆 % 𝒐𝒇 𝑻𝒐𝒕𝒂𝒍 =𝑰𝒏𝒃𝒐𝒖𝒏𝒅 𝒗𝒐𝒊𝒄𝒆 𝒄𝒐𝒏𝒕𝒂𝒄𝒕 𝒗𝒐𝒍𝒖𝒎𝒆
𝑻𝒐𝒕𝒂𝒍 𝒊𝒏𝒃𝒐𝒖𝒏𝒅 𝒄𝒐𝒏𝒕𝒂𝒄𝒕 𝒗𝒐𝒍𝒖𝒎𝒆 (𝒂𝒍𝒍 𝒄𝒉𝒂𝒏𝒏𝒆𝒍𝒔)

SAMPLE Insourced Contact Center Benchmark (sample report only—data is not accurate!)
39 | P a g e © M e t r i c N e t , L L C w w w . m e t r i c n e t . c o m
Voice % of Total (continued)
0.0%
10.0%
20.0%
30.0%
40.0%
50.0%
60.0%
70.0%
80.0%
90.0%
100.0%
Voic
e %
of T
otal
High 92.6%Average ----- 64.4%Median 68.5%Low 13.6%
Key Statistics
Voice % of Total

SAMPLE Insourced Contact Center Benchmark (sample report only—data is not accurate!)
40 | P a g e © M e t r i c N e t , L L C w w w . m e t r i c n e t . c o m
Inbound Channel Mix Metrics (continued)
Chat % of Total
Definition: Chat % of Total is the percentage of total contacts that originate in the chat channel.
Why it’s important: Chat % of Total is important because the Average Cost per Chat Minute is lower than the Average Cost per Voice Minute. By increasing the number of contacts originating in the chat channel, an organization’s overall cost can be reduced. Many Contact Centers, recognizing the potential to reduce their costs, constantly strive to increase their Chat % of Total.
Key correlations: Chat % of Total is strongly correlated with the following metrics:
Average Cost per Agent-Assisted Contact
Average Cost per Contact (all contact types)
𝑪𝒉𝒂𝒕 % 𝒐𝒇 𝑻𝒐𝒕𝒂𝒍 =𝑰𝒏𝒃𝒐𝒖𝒏𝒅 𝒄𝒉𝒂𝒕 𝒗𝒐𝒍𝒖𝒎𝒆
𝑻𝒐𝒕𝒂𝒍 𝒊𝒏𝒃𝒐𝒖𝒏𝒅 𝒄𝒐𝒏𝒕𝒂𝒄𝒕 𝒗𝒐𝒍𝒖𝒎𝒆 (𝒂𝒍𝒍 𝒄𝒉𝒂𝒏𝒏𝒆𝒍𝒔)

SAMPLE Insourced Contact Center Benchmark (sample report only—data is not accurate!)
41 | P a g e © M e t r i c N e t , L L C w w w . m e t r i c n e t . c o m
Chat % of Total (continued)
0.0%
5.0%
10.0%
15.0%
20.0%
25.0%
30.0%
35.0%
40.0%
45.0%
50.0%
55.0%
Chat
% o
f Tot
al
High 51.2%Average ----- 14.3%Median 11.3%Low 0.0%
Key Statistics
Chat % of Total

SAMPLE Insourced Contact Center Benchmark (sample report only—data is not accurate!)
42 | P a g e © M e t r i c N e t , L L C w w w . m e t r i c n e t . c o m
Inbound Channel Mix Metrics (continued)
IVR % of Total
Definition: IVR % of Total is the percentage of contacts that are contained within the IVR, and resolved without the assistance of a live agent. A user who opts out of the IVR to connect with a live agent does not count as part of the IVR % of Total because the user did not resolve the issue before contacting a live agent.
Why it’s important: The Cost per Contact for IVR-contained calls is significantly lower than it is for agent-assisted contacts. By increasing the number of contacts resolved in the IVR, the Cost per Contact can be reduced significantly. Many Contact Centers, recognizing the potential to reduce their costs, constantly strive to increase their IVR usage and resolution rates.
Key correlations: IVR % of Total is strongly correlated with the following metrics:
Average Cost per Contact (all contact types)
𝑰𝑽𝑹 % 𝒐𝒇 𝑻𝒐𝒕𝒂𝒍 =𝑽𝒐𝒍𝒖𝒎𝒆 𝒐𝒇 𝑰𝑽𝑹-𝒄𝒐𝒏𝒕𝒂𝒊𝒏𝒆𝒅 𝒄𝒂𝒍𝒍𝒔
𝑻𝒐𝒕𝒂𝒍 𝒊𝒏𝒃𝒐𝒖𝒏𝒅 𝒄𝒐𝒏𝒕𝒂𝒄𝒕 𝒗𝒐𝒍𝒖𝒎𝒆 (𝒂𝒍𝒍 𝒄𝒉𝒂𝒏𝒏𝒆𝒍𝒔)

SAMPLE Insourced Contact Center Benchmark (sample report only—data is not accurate!)
43 | P a g e © M e t r i c N e t , L L C w w w . m e t r i c n e t . c o m
IVR % of Total (continued)
0.0%
5.0%
10.0%
15.0%
20.0%
25.0%
30.0%
35.0%
40.0%
45.0%
50.0%
55.0%
60.0%
65.0%
IVR
% o
f Tot
al
High 59.9%Average ----- 16.4%Median 15.9%Low 0.0%
Key Statistics
IVR % of Total

SAMPLE Insourced Contact Center Benchmark (sample report only—data is not accurate!)
44 | P a g e © M e t r i c N e t , L L C w w w . m e t r i c n e t . c o m
Inbound Channel Mix Metrics (continued)
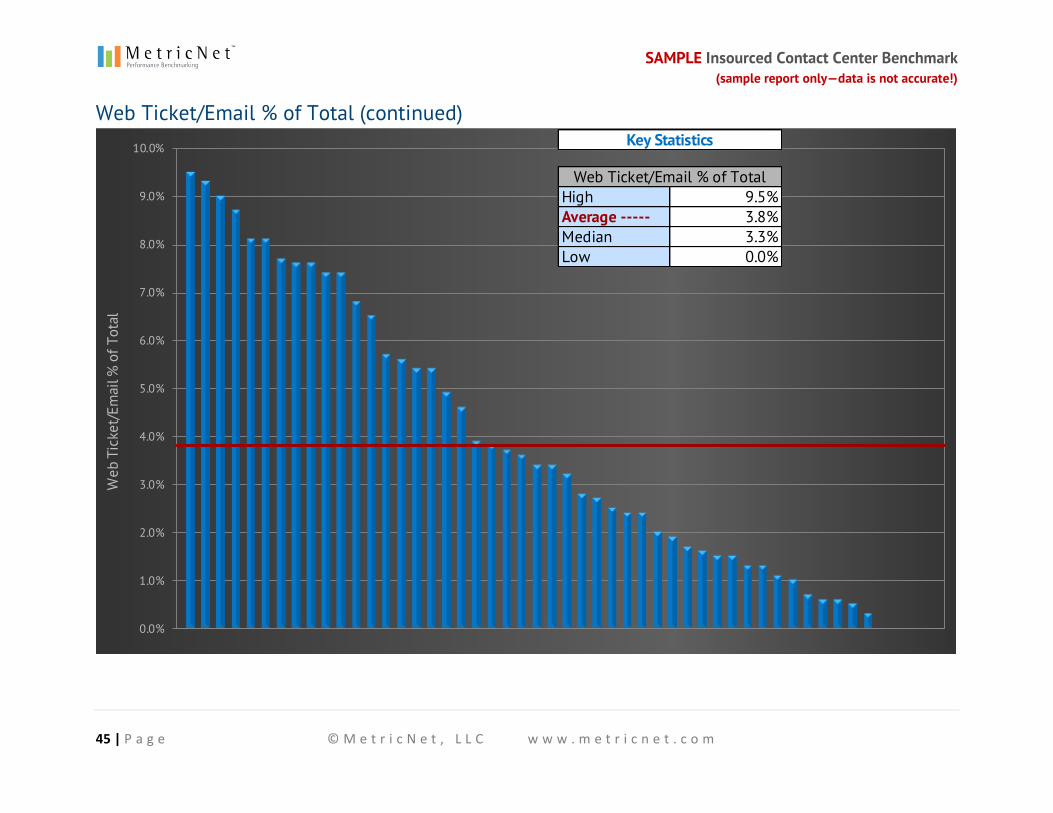
Web Ticket/Email % of Total
Definition: Web Ticket/Email % of Total is the percentage of total contacts that originate in the web ticket/email channel.
Why it’s important: Web Ticket/Email % of Total is important because web tickets/emails do not require an immediate response . By increasing the number of contacts originating in the web ticket/email channel, a Contact Center can dampen spikes in the voice and chat channels, and can respond to many of the web tickets/emails during slower periods. This leads to more productive agents and improved service levels in the voice and chat channels.
Key correlations: Web Ticket/Email % of Total is strongly correlated with the following metrics:
Average Cost per Agent-Assisted Contact
Average Cost per Contact (all contact types)
𝑾𝒆𝒃 𝑻𝒊𝒄𝒌𝒆𝒕/𝑬𝒎𝒂𝒊𝒍 % 𝒐𝒇 𝑻𝒐𝒕𝒂𝒍 =𝑰𝒏𝒃𝒐𝒖𝒏𝒅 𝒘𝒆𝒃 𝒕𝒊𝒄𝒌𝒆𝒕 𝒂𝒏𝒅 𝒆𝒎𝒂𝒊𝒍 𝒗𝒐𝒍𝒖𝒎𝒆
𝑻𝒐𝒕𝒂𝒍 𝒊𝒏𝒃𝒐𝒖𝒏𝒅 𝒄𝒐𝒏𝒕𝒂𝒄𝒕 𝒗𝒐𝒍𝒖𝒎𝒆 (𝒂𝒍𝒍 𝒄𝒉𝒂𝒏𝒏𝒆𝒍𝒔)
SAMPLE Insourced Contact Center Benchmark (sample report only—data is not accurate!)
45 | P a g e © M e t r i c N e t , L L C w w w . m e t r i c n e t . c o m
Web Ticket/Email % of Total (continued)
0.0%
1.0%
2.0%
3.0%
4.0%
5.0%
6.0%
7.0%
8.0%
9.0%
10.0%
Web
Tic
ket/
Emai
l % o
f Tot
al
High 9.5%Average ----- 3.8%Median 3.3%Low 0.0%
Key Statistics
Web Ticket/Email % of Total

SAMPLE Insourced Contact Center Benchmark (sample report only—data is not accurate!)
46 | P a g e © M e t r i c N e t , L L C w w w . m e t r i c n e t . c o m
Inbound Channel Mix Metrics (continued)
Other % of Total
Definition: Other % of Total is the percentage of total contacts that originate in other channels, outside of voice, chat, IVR, and web/email. These other channels may include walk-in and social support.
Why it’s important: The Cost per Contact for contacts resolved in other channels can be significantly less (in the case of social support) or significant ly more (in the case of walk-in support) than voice, chat, IVR, and web/email contacts. By increasing social support or decreasing walk -in support, the average Cost per Contact can be reduced accordingly. Many Contact Centers, recognizing the value of some additional support channels and the cost of others, consistently take steps to mature low-cost support channels and to reduce the volume in high-cost support channels. In addition, a broader channel choice tends to increase Customer Satisfaction.
Key correlations: Other % of Total is strongly correlated with the following metrics:
Average Cost per Contact (all contact types)
Customer Satisfaction
𝑶𝒕𝒉𝒆𝒓 % 𝒐𝒇 𝑻𝒐𝒕𝒂𝒍 =𝑰𝒏𝒃𝒐𝒖𝒏𝒅 𝒄𝒐𝒏𝒕𝒂𝒄𝒕 𝒗𝒐𝒍𝒖𝒎𝒆 𝒊𝒏 𝒐𝒕𝒉𝒆𝒓 𝒄𝒉𝒂𝒏𝒏𝒆𝒍𝒔
𝑻𝒐𝒕𝒂𝒍 𝒊𝒏𝒃𝒐𝒖𝒏𝒅 𝒄𝒐𝒏𝒕𝒂𝒄𝒕 𝒗𝒐𝒍𝒖𝒎𝒆 (𝒂𝒍𝒍 𝒄𝒉𝒂𝒏𝒏𝒆𝒍𝒔)

SAMPLE Insourced Contact Center Benchmark (sample report only—data is not accurate!)
47 | P a g e © M e t r i c N e t , L L C w w w . m e t r i c n e t . c o m
Other % of Total (continued)
0.0%
0.5%
1.0%
1.5%
2.0%
2.5%
3.0%
Oth
er %
of T
otal
High 2.6%Average ----- 0.9%Median 0.8%Low 0.0%
Key Statistics
Other % of Total

SAMPLE Insourced Contact Center Benchmark (sample report only—data is not accurate!)
48 | P a g e © M e t r i c N e t , L L C w w w . m e t r i c n e t . c o m
Cost Metrics
Average Cost per Voice Contact
Definition: Average Cost per Voice Contact is the total annual operating expense of the voice channel divided by the annual contact volume of the Contact Center originating in the voice channel. Operating expense includes all voice-related employee salaries, overtime pay, benefits, and incentive compensation, plus all contractor, facilities, telecom, desktop computing, software licensing, training, travel, office supplies, and miscellaneous expenses.
Why it’s important: Cost per Contact is one of the most important Contact Center metrics. It is a measure of how efficiently your Contact Center ’s voice channel is operating. A higher-than-average Cost per Voice Contact is not necessarily a bad thing, particularly if accompanied by higher -than-average quality levels. Conversely, a low Cost per Voice Contact is not necessarily good, particularly if the low cost is achieved by sacrificing Call Quality or service levels. Every Contact Center should track and trend Average Cost per Voice Contact on a monthly basis.
Key correlations: Average Cost per Voice Contact is strongly correlated with the following metrics:
Average Cost per Voice Minute
Voice Agent Utilization
Net First Contact Resolution Rate
Voice Handle Time
Average Speed of Answer
𝑨𝒗𝒆𝒓𝒂𝒈𝒆 𝑪𝒐𝒔𝒕 𝒑𝒆𝒓 𝑽𝒐𝒊𝒄𝒆 𝑪𝒐𝒏𝒕𝒂𝒄𝒕 =𝑨𝒏𝒏𝒖𝒂𝒍 𝒐𝒑𝒆𝒓𝒂𝒕𝒊𝒏𝒈 𝒆𝒙𝒑𝒆𝒏𝒔𝒆 𝒇𝒐𝒓 𝒗𝒐𝒊𝒄𝒆
𝑨𝒏𝒏𝒖𝒂𝒍 𝒊𝒏𝒃𝒐𝒖𝒏𝒅 𝒗𝒐𝒊𝒄𝒆 𝒄𝒐𝒏𝒕𝒂𝒄𝒕 𝒗𝒐𝒍𝒖𝒎𝒆

SAMPLE Insourced Contact Center Benchmark (sample report only—data is not accurate!)
49 | P a g e © M e t r i c N e t , L L C w w w . m e t r i c n e t . c o m
Average Cost per Voice Contact (continued)
$0.00
$10.00
$20.00
$30.00
$40.00
$50.00
$60.00
$70.00
$80.00
$90.00
$100.00
Aver
age
Cost
per
Voi
ce C
onta
ct
High $86.63Average ----- $31.03Median $28.15Low $6.82
Key Statistics
Average Cost per Voice Contact

SAMPLE Insourced Contact Center Benchmark (sample report only—data is not accurate!)
50 | P a g e © M e t r i c N e t , L L C w w w . m e t r i c n e t . c o m
Cost Metrics (continued)
Average Cost per Chat Session
Definition: Average Cost per Chat Session is the total annual operating expense of the chat channel divided by the annual number of chats handled. Operating expense includes all chat-related employee salaries, overtime pay, benefits, and incentive compensation, plus all contractor, facilities, telecom, desktop computing, software licensing, training, travel, office supplies, and miscellaneous expenses.
Why it’s important: Average Cost per Chat Session a measure of how efficiently your Contact Center conducts chat. A higher-than-average Cost per Chat Session is not necessarily a bad thing, particularly if accompanied by higher -than-average quality and resolution levels. Conversely, a low Average Cost per Chat Session is not necessarily good, particularly if the low cost is achieved by sacrificing quality or service levels. Every Contact Center that implements chat should track and trend Average Cost per Chat Session on a monthly basis.
Key correlations: Average Cost per Chat Session is strongly correlated with the following metrics:
Average Cost per Chat Minute
Chat First Contact Resolution Rate
Chat Handle Time
Max Concurrent Chat Sessions
𝑨𝒗𝒆𝒓𝒂𝒈𝒆 𝑪𝒐𝒔𝒕 𝒑𝒆𝒓 𝑪𝒉𝒂𝒕 𝑺𝒆𝒔𝒔𝒊𝒐𝒏 =𝑨𝒏𝒏𝒖𝒂𝒍 𝒐𝒑𝒆𝒓𝒂𝒕𝒊𝒏𝒈 𝒆𝒙𝒑𝒆𝒏𝒔𝒆 𝒇𝒐𝒓 𝒄𝒉𝒂𝒕
𝑨𝒏𝒏𝒖𝒂𝒍 𝒄𝒉𝒂𝒕 𝒗𝒐𝒍𝒖𝒎𝒆

SAMPLE Insourced Contact Center Benchmark (sample report only—data is not accurate!)
51 | P a g e © M e t r i c N e t , L L C w w w . m e t r i c n e t . c o m
Average Cost per Chat Session (continued)
$0.00
$10.00
$20.00
$30.00
$40.00
$50.00
$60.00
Aver
age
Cost
per
Cha
t Ses
sion
High $55.41Average ----- $16.39Median $13.28Low $1.73
Key Statistics
Average Cost per Chat Session
SAMPLE Insourced Contact Center Benchmark (sample report only—data is not accurate!)
52 | P a g e © M e t r i c N e t , L L C w w w . m e t r i c n e t . c o m
Cost Metrics (continued)
Average Cost per Web Ticket/Email Contact
Definition: Average Cost per Web Ticket/Email Contact is the total annual operating expense of the web ticket/email channel divided by the annual number of web ticket/email contacts handled. Operating expense includes all web ticket/email-related employee salaries, overtime pay, benefits, and incentive compensation, plus all contractor, facilities, telecom, desktop computing, software licensing, training, travel, office suppli es, and miscellaneous expenses.
Why it’s important: Average Cost per Web Ticket/Email Contact is a measure of how efficiently your Contact Center handles web tickets and/or email contacts . A higher-than-average Cost per Web Ticket/Email Contact is not necessarily a bad thing, particularly if accompanied by higher-than-average quality and resolution levels. Conversely, a low Average Cost per Web Ticket/Email Contact is not necessarily good, particularly if the low cost is achieved by sacrificing quality or service levels. Every Contact Center that implements web tickets/email should track and trend Average Cost per Web Ticket/Email Contact on a monthly basis.
Key correlations: Average Cost per Web Ticket/Email Contact is strongly correlated with the following metrics:
Average Cost per Web Ticket/Email Minute
Web/Email Handle Time
Average Web Ticket/Email Resolution Rate
𝑨𝒗𝒈. 𝑪𝒐𝒔𝒕 𝒑𝒆𝒓 𝑾𝒆𝒃/𝑬𝒎𝒂𝒊𝒍 𝑪𝒐𝒏𝒕𝒂𝒄𝒕 =𝑨𝒏𝒏𝒖𝒂𝒍 𝒐𝒑𝒆𝒓𝒂𝒕𝒊𝒏𝒈 𝒆𝒙𝒑𝒆𝒏𝒔𝒆 𝒇𝒐𝒓 𝒘𝒆𝒃/𝒆𝒎𝒂𝒊𝒍
𝑨𝒏𝒏𝒖𝒂𝒍 𝒘𝒆𝒃/𝒆𝒎𝒂𝒊𝒍 𝒗𝒐𝒍𝒖𝒎𝒆

SAMPLE Insourced Contact Center Benchmark (sample report only—data is not accurate!)
53 | P a g e © M e t r i c N e t , L L C w w w . m e t r i c n e t . c o m
Average Cost per Web Ticket/Email Contact (continued)
$0.00
$10.00
$20.00
$30.00
$40.00
$50.00
$60.00
$70.00
$80.00
$90.00
Aver
age
Cost
per
Web
Tic
ket/
Emai
l Con
tact
High $82.52Average ----- $29.88Median $28.21Low $5.91
Key Statistics
Average Cost per Web Ticket/Email Contact
SAMPLE Insourced Contact Center Benchmark (sample report only—data is not accurate!)
54 | P a g e © M e t r i c N e t , L L C w w w . m e t r i c n e t . c o m
Cost Metrics (continued)
Average Cost per Agent-Assisted Contact
Definition: Average Cost per Agent-Assisted Contact is the total annual operating expense of all agent-assisted contact channels, including voice, chat, and web/email, divided by the annual inbound agent-assisted contact volume of the Contact Center. Operating expense includes all employee salaries, overtime pay, benefits, and incentive compensation, plus all contractor, facilities, telecom, desktop computing, software licensing, training, travel, office supplies, and miscellaneous expenses.
Why it’s important: Average Cost per Agent-Assisted Contact is a measure of how efficiently your Contact Center agents are performing. A higher-than-average Cost per Agent-Assisted Contact is not necessarily a bad thing, particularly if accompanied by higher-than-average quality and resolution levels. Conversely, a low Average Cost per Agent-Assisted Contact is not necessarily good, particularly if the low cost is achieved by sacrificing quality or service levels. Every Contact Center should track and trend Average Cost per Agent-Assisted Contact on a monthly basis.
Key correlations: Average Cost per Agent-Assisted Contact is strongly correlated with the following metrics:
Agent Utilization
Net First Contact Resolution Rate
Contact Handle Time
Average Speed of Answer
𝑨𝒗𝒈. 𝑪𝒐𝒔𝒕 𝒑𝒆𝒓 𝑨𝒈𝒆𝒏𝒕-𝑨𝒔𝒔𝒊𝒔𝒕𝒆𝒅 𝑪𝒐𝒏𝒕𝒂𝒄𝒕 =𝑻𝒐𝒕𝒂𝒍 𝒂𝒏𝒏𝒖𝒂𝒍 𝒐𝒑𝒆𝒓𝒂𝒕𝒊𝒏𝒈 𝒆𝒙𝒑𝒆𝒏𝒔𝒆
𝑨𝒏𝒏𝒖𝒂𝒍 𝒊𝒏𝒃𝒐𝒖𝒏𝒅 𝒂𝒈𝒆𝒏𝒕-𝒂𝒔𝒔𝒊𝒔𝒕𝒆𝒅 𝒗𝒐𝒍𝒖𝒎𝒆

SAMPLE Insourced Contact Center Benchmark (sample report only—data is not accurate!)
55 | P a g e © M e t r i c N e t , L L C w w w . m e t r i c n e t . c o m
Average Cost per Agent-Assisted Contact (continued) return to page 36 | next scorecard KPI
$0.00
$10.00
$20.00
$30.00
$40.00
$50.00
$60.00
$70.00
$80.00
$90.00
Aver
age
Cost
per
Age
nt-A
ssis
ted
Cont
act
High $77.06Average ----- $27.84Median $25.03Low $6.76
Key Statistics
Average Cost per Agent-Assisted Contact

SAMPLE Insourced Contact Center Benchmark (sample report only—data is not accurate!)
56 | P a g e © M e t r i c N e t , L L C w w w . m e t r i c n e t . c o m
Cost Metrics (continued)
Average Cost per Contact (including IVR)
Definition: Average Cost per Contact is the total annual operating expense of the Contact Center, divided by the annual inbound contact volume of the Contact Center, including IVR-contained contacts. Operating expense includes all employee salaries, overtime pay, benefits, and incentive compensation, plus all contractor, facilities, telecom, desktop computing, software licensing, training, travel, office supplies, and miscellaneous expenses. Annual inbound contact volume includes contacts from all sources: live voice, voicemail, email, web, chat, fax, walk-in, IVR, etc.
Why it’s important: Cost per Contact is one of the most important Contact Center metrics. It is a measure of how eff iciently your Contact Center conducts its business. A higher-than-average Cost per Contact is not necessarily a bad thing, particularly if accompanied by higher-than-average quality levels. Conversely, a low Cost per Contact is not necessarily good, particularly if the low cost is achieved by sacrificing quality or service levels. Every Contact Center should track and trend Cost per Contact on a monthly basis.
Key correlations: Average Cost per Contact is strongly correlated with the following metrics:
Agent Utilization
Net First Contact Resolution Rate
Contact Handle Time
IVR % of Total
Average Speed of Answer
𝑨𝒗𝒆𝒓𝒂𝒈𝒆 𝑪𝒐𝒔𝒕 𝒑𝒆𝒓 𝑪𝒐𝒏𝒕𝒂𝒄𝒕 =𝑻𝒐𝒕𝒂𝒍 𝒂𝒏𝒏𝒖𝒂𝒍 𝒐𝒑𝒆𝒓𝒂𝒕𝒊𝒏𝒈 𝒆𝒙𝒑𝒆𝒏𝒔𝒆
𝑨𝒏𝒏𝒖𝒂𝒍 𝒊𝒏𝒃𝒐𝒖𝒏𝒅 𝒄𝒐𝒏𝒕𝒂𝒄𝒕 𝒗𝒐𝒍𝒖𝒎𝒆 (𝒊𝒏𝒄𝒍. 𝑰𝑽𝑹)

SAMPLE Insourced Contact Center Benchmark (sample report only—data is not accurate!)
57 | P a g e © M e t r i c N e t , L L C w w w . m e t r i c n e t . c o m
Average Cost per Contact (including IVR) (continued)
$0.00
$5.00
$10.00
$15.00
$20.00
$25.00
$30.00
$35.00
$40.00
$45.00
$50.00
$55.00
Aver
age
Cost
per
Con
tact
(inc
l. IV
R)
High $49.38Average ----- $21.93Median $20.73Low $6.76
Key Statistics
Average Cost per Contact (incl. IVR)

SAMPLE Insourced Contact Center Benchmark (sample report only—data is not accurate!)
58 | P a g e © M e t r i c N e t , L L C w w w . m e t r i c n e t . c o m
Cost Metrics (continued)
Average Cost per Voice Minute
Definition: Average Cost per Voice Minute is simply the Average Cost per Voice Contact divided by the average Voice Handle Time.
Why it’s important: Unlike Average Cost per Voice Contact, which does not take into account the average handle time or call complexity, Average Cost per Voice Minute measures the per-minute cost of providing customer support in the voice channel. It enables a more direct comparison of costs between Contact Centers because it is independent of the types of calls that come into the Contact Center and the complexity of those calls.
Key correlations: Average Cost per Voice Minute is strongly correlated with the following metrics:
Average Cost per Voice Contact
Voice Handle Time
Voice Agent Utilization
Net First Contact Resolution Rate
Average Speed of Answer
𝑨𝒗𝒆𝒓𝒂𝒈𝒆 𝑪𝒐𝒔𝒕 𝒑𝒆𝒓 𝑽𝒐𝒊𝒄𝒆 𝑴𝒊𝒏𝒖𝒕𝒆 =𝑨𝒗𝒆𝒓𝒂𝒈𝒆 𝑪𝒐𝒔𝒕 𝒑𝒆𝒓 𝑽𝒐𝒊𝒄𝒆 𝑪𝒐𝒏𝒕𝒂𝒄𝒕
𝑽𝒐𝒊𝒄𝒆 𝑯𝒂𝒏𝒅𝒍𝒆 𝑻𝒊𝒎𝒆

SAMPLE Insourced Contact Center Benchmark (sample report only—data is not accurate!)
59 | P a g e © M e t r i c N e t , L L C w w w . m e t r i c n e t . c o m
Average Cost per Voice Minute (continued)
$0.00
$0.50
$1.00
$1.50
$2.00
$2.50
$3.00
Aver
age
Cost
per
Voi
ce M
inut
e
High $2.62Average ----- $1.39Median $1.30Low $0.54
Key Statistics
Average Cost per Voice Minute

SAMPLE Insourced Contact Center Benchmark (sample report only—data is not accurate!)
60 | P a g e © M e t r i c N e t , L L C w w w . m e t r i c n e t . c o m
Cost Metrics (continued)
Average Cost per Chat Minute
Definition : Average Cost per Chat Minute is simply the Average Cost per Chat Contact divided by the average Chat Handle Time.
Why it’s important: Unlike Average Cost per Chat Session, which does not take into account the average handle time or issue complexity, Average Cost per Chat Minute measures the per-minute cost of providing customer support in the chat channel. It enables a more direct comparison of costs between Contact Centers because it is independent of the types of chats that come into the Contact Center and the complexity of those chats.
Key correlations: Average Cost per Chat Minute is strongly correlated with the following metrics:
Average Cost per Chat Session
Chat Handle Time
Agent Utilization
Chat First Contact Resolution Rate
Max Concurrent Chat Sessions
𝑨𝒗𝒆𝒓𝒂𝒈𝒆 𝑪𝒐𝒔𝒕 𝒑𝒆𝒓 𝑪𝒉𝒂𝒕 𝑴𝒊𝒏𝒖𝒕𝒆 =𝑨𝒗𝒆𝒓𝒂𝒈𝒆 𝑪𝒐𝒔𝒕 𝒑𝒆𝒓 𝑪𝒉𝒂𝒕 𝑺𝒆𝒔𝒔𝒊𝒐𝒏
𝑪𝒉𝒂𝒕 𝑯𝒂𝒏𝒅𝒍𝒆 𝑻𝒊𝒎𝒆

SAMPLE Insourced Contact Center Benchmark (sample report only—data is not accurate!)
61 | P a g e © M e t r i c N e t , L L C w w w . m e t r i c n e t . c o m
Average Cost per Chat Minute (continued)
$0.00
$0.25
$0.50
$0.75
$1.00
$1.25
$1.50
$1.75
$2.00
$2.25
Aver
age
Cost
per
Cha
t Min
ute
High $1.94Average ----- $0.95Median $0.85Low $0.50
Key Statistics
Average Cost per Chat Minute

SAMPLE Insourced Contact Center Benchmark (sample report only—data is not accurate!)
62 | P a g e © M e t r i c N e t , L L C w w w . m e t r i c n e t . c o m
Cost Metrics (continued)
Average Cost per Web Ticket/Email Minute
Definition: Average Cost per Web Ticket/Email Minute is simply the Average Cost per Web Ticket/Email Contact divided by the average Web/Email Handle Time.
Why it’s important: Unlike Average Cost per Web Ticket/Email Contact, which does not take into account the average handle time or issue complexity, Average Cost per Web Ticket/Email Minute measures the per-minute cost of providing customer support in the web ticket/email channel. It enables a more direct comparison of costs between Contact Centers because it is independent of the types of web ticket/email contacts that come into the Contact Center and the complexity of those contacts.
Key correlations: Average Cost per Web Ticket/Email Minute is strongly correlated with the following metrics:
Average Cost per Web Ticket/Email Contact
Web/Email Handle Time
Agent Utilization
Net First Contact Resolution Rate
𝑨𝒗𝒈. 𝑪𝒐𝒔𝒕 𝒑𝒆𝒓 𝑾𝒆𝒃 𝑻𝒊𝒄𝒌𝒆𝒕/𝑬𝒎𝒂𝒊𝒍 𝑴𝒊𝒏𝒖𝒕𝒆 =𝑨𝒗𝒈. 𝑪𝒐𝒔𝒕 𝒑𝒆𝒓 𝑾𝒆𝒃 𝑻𝒊𝒄𝒌𝒆𝒕/𝑬𝒎𝒂𝒊𝒍
𝑾𝒆𝒃/𝑬𝒎𝒂𝒊𝒍 𝑯𝒂𝒏𝒅𝒍𝒆 𝑻𝒊𝒎𝒆

SAMPLE Insourced Contact Center Benchmark (sample report only—data is not accurate!)
63 | P a g e © M e t r i c N e t , L L C w w w . m e t r i c n e t . c o m
Average Cost per Web Ticket/Email Minute (continued)
$0.00
$0.50
$1.00
$1.50
$2.00
$2.50
$3.00
Aver
age
Cost
per
Web
Tic
ket/
Emai
l Min
ute
High $2.65Average ----- $1.37Median $1.26Low $0.56
Key Statistics
Average Cost per Web Ticket/Email Minute

SAMPLE Insourced Contact Center Benchmark (sample report only—data is not accurate!)
64 | P a g e © M e t r i c N e t , L L C w w w . m e t r i c n e t . c o m
Handle Time Metrics
Voice Handle Time
Definition: Voice Handle Time is the average time (in minutes) that an agent spends on each call, including talk time, wrap time, and after-call work time.
Why it’s important: A contact is the basic unit of work in a Contact Center. Voice Handle Time, therefore, represents the amount of labor required to complete one unit of inbound work in the voice channel.
Key correlations: Voice Handle Time is strongly correlated with the following metrics:
Average Cost per Voice Contact
Inbound Voice Contacts per Agent per Month
Net First Contact Resolution Rate
𝑽𝒐𝒊𝒄𝒆 𝑯𝒂𝒏𝒅𝒍𝒆 𝑻𝒊𝒎𝒆 =𝑻𝒐𝒕𝒂𝒍 𝒎𝒊𝒏𝒖𝒕𝒆𝒔 𝒔𝒑𝒆𝒏𝒕 𝒐𝒏 𝒊𝒏𝒃𝒐𝒖𝒏𝒅 𝒗𝒐𝒊𝒄𝒆 𝒄𝒐𝒏𝒕𝒂𝒄𝒕𝒔
𝑻𝒐𝒕𝒂𝒍 𝒊𝒏𝒃𝒐𝒖𝒏𝒅 𝒗𝒐𝒊𝒄𝒆 𝒄𝒐𝒏𝒕𝒂𝒄𝒕𝒔

SAMPLE Insourced Contact Center Benchmark (sample report only—data is not accurate!)
65 | P a g e © M e t r i c N e t , L L C w w w . m e t r i c n e t . c o m
Voice Handle Time (continued)
0.00
5.00
10.00
15.00
20.00
25.00
30.00
35.00
40.00
45.00
50.00
Voic
e H
andl
e Ti
me
(min
utes
)
High 45.96Average ----- 22.27Median 22.00Low 7.37
Key Statistics
Voice Handle Time (minutes)

SAMPLE Insourced Contact Center Benchmark (sample report only—data is not accurate!)
66 | P a g e © M e t r i c N e t , L L C w w w . m e t r i c n e t . c o m
Handle Time Metrics (continued)
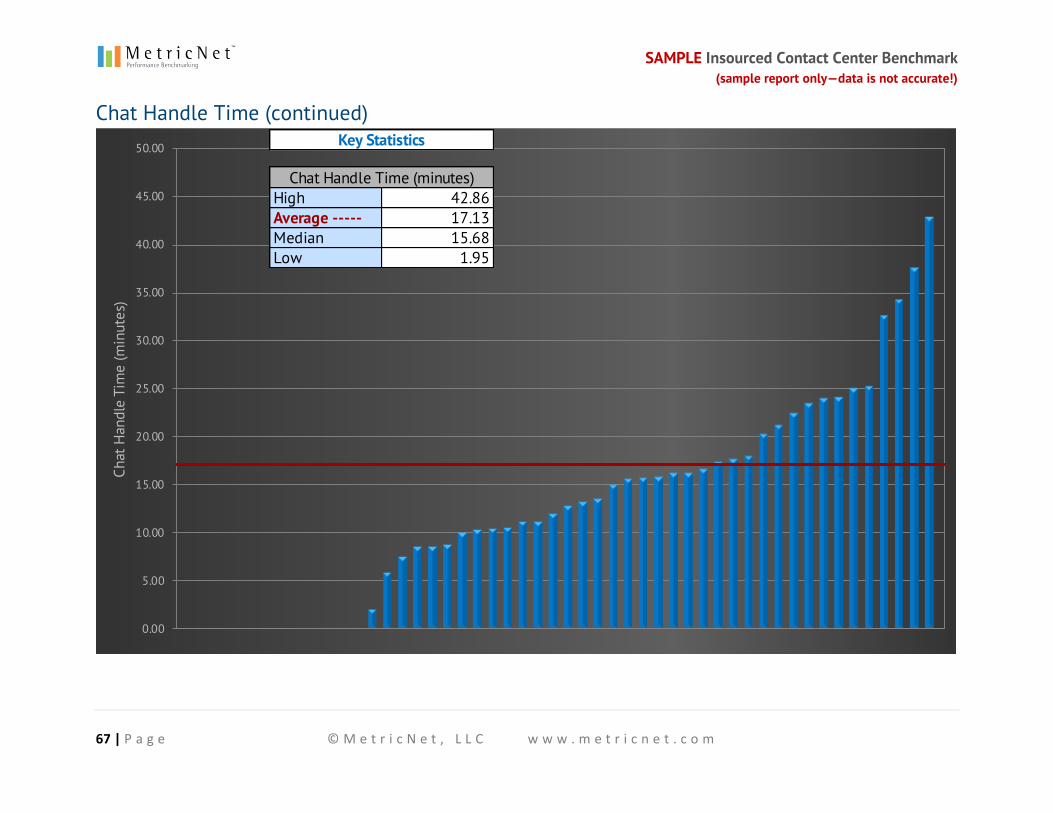
Chat Handle Time
Definition: Chat Handle Time is the average time (in minutes) that an agent spends on each chat, including chat time, wrap time, and after-chat work time.
Why it’s important: A contact is the basic unit of work in a Contact Center. Chat Handle Time, therefore, represents the amount of labor required to complete one unit of work in the chat channel.
Key correlations: Chat Handle Time is strongly correlated with the following metrics:
Average Cost per Chat Session
Number of Chat Sessions per Chat Agent per Month
Chat First Contact Resolution Rate
𝑪𝒉𝒂𝒕 𝑯𝒂𝒏𝒅𝒍𝒆 𝑻𝒊𝒎𝒆 =𝑻𝒐𝒕𝒂𝒍 𝒎𝒊𝒏𝒖𝒕𝒆𝒔 𝒔𝒑𝒆𝒏𝒕 𝒐𝒏 𝒄𝒉𝒂𝒕 𝒔𝒆𝒔𝒔𝒊𝒐𝒏𝒔
𝑻𝒐𝒕𝒂𝒍 𝒏𝒖𝒎𝒃𝒆𝒓 𝒐𝒇 𝒄𝒉𝒂𝒕 𝒔𝒆𝒔𝒔𝒊𝒐𝒏𝒔
SAMPLE Insourced Contact Center Benchmark (sample report only—data is not accurate!)
67 | P a g e © M e t r i c N e t , L L C w w w . m e t r i c n e t . c o m
Chat Handle Time (continued)
0.00
5.00
10.00
15.00
20.00
25.00
30.00
35.00
40.00
45.00
50.00
Chat
Han
dle
Tim
e (m
inut
es)
High 42.86Average ----- 17.13Median 15.68Low 1.95
Key Statistics
Chat Handle Time (minutes)

SAMPLE Insourced Contact Center Benchmark (sample report only—data is not accurate!)
68 | P a g e © M e t r i c N e t , L L C w w w . m e t r i c n e t . c o m
Handle Time Metrics (continued)
Web/Email Handle Time
Definition: Web/Email Handle Time is the average time that an agent spends resolving each web ticket/email contact .
Why it’s important: A contact is the basic unit of work in a Contact Center. Web/Email Handle Time, therefore, represents the amount of labor required to complete one unit of work in the web ticket/email channel.
Key correlations: Web/Email Handle Time is strongly correlated with the following metrics:
Average Cost per Web Ticket/Email Contact
𝑾𝒆𝒃/𝑬𝒎𝒂𝒊𝒍 𝑯𝒂𝒏𝒅𝒍𝒆 𝑻𝒊𝒎𝒆 =𝑻𝒐𝒕𝒂𝒍 𝒎𝒊𝒏𝒖𝒕𝒆𝒔 𝒔𝒑𝒆𝒏𝒕 𝒐𝒏 𝒘𝒆𝒃 𝒕𝒊𝒄𝒌𝒆𝒕𝒔 𝒂𝒏𝒅 𝒆𝒎𝒂𝒊𝒍𝒔
𝑻𝒐𝒕𝒂𝒍 𝒏𝒖𝒎𝒃𝒆𝒓 𝒐𝒇 𝒘𝒆𝒃 𝒕𝒊𝒄𝒌𝒆𝒕𝒔 𝒂𝒏𝒅 𝒆𝒎𝒂𝒊𝒍𝒔

SAMPLE Insourced Contact Center Benchmark (sample report only—data is not accurate!)
69 | P a g e © M e t r i c N e t , L L C w w w . m e t r i c n e t . c o m
Web/Email Handle Time (continued)
0.00
5.00
10.00
15.00
20.00
25.00
30.00
35.00
40.00
45.00
50.00
Web
/Em
ail H
andl
e Ti
me
(min
utes
)
High 43.05Average ----- 21.67Median 21.50Low 8.51
Key Statistics
Web/Email Handle Time (minutes)

SAMPLE Insourced Contact Center Benchmark (sample report only—data is not accurate!)
70 | P a g e © M e t r i c N e t , L L C w w w . m e t r i c n e t . c o m
Voice Quality Metrics
Voice Customer Satisfaction
Definition: Voice Customer Satisfaction is the percentage of customers who are either satisfied or very satisfied with their Contact Center experience in the voice channel. This metric can be captured in a number of ways, including automatic after-call IVR surveys, follow-up outbound (live-agent) calls, email surveys, postal surveys, etc.
Why it’s important: Voice Customer Satisfaction is the single most important measure of voice-channel quality. Any successful voice channel will have consistently high Voice Customer Satisfaction ratings. Some Contact Center managers are under the impression that a low Average Cost per Voice Contact may justify a lower level of Voice Customer Satisfaction. But this is not true. MetricNet’s research shows that even Contact Centers with a very low Average Cost per Voice Contact can achieve consistently high Voice Customer Satisfaction ratings.
Key correlations: Voice Customer Satisfaction is strongly correlated with the following metrics:
Net First Contact Resolution Rate
Call Quality
New Agent Training Hours
Annual Agent Training Hours
𝑽𝒐𝒊𝒄𝒆 𝑪𝒖𝒔𝒕𝒐𝒎𝒆𝒓 𝑺𝒂𝒕𝒊𝒔𝒇𝒂𝒄𝒕𝒊𝒐𝒏 =𝑵𝒖𝒎𝒃𝒆𝒓 𝒐𝒇 𝒔𝒂𝒕𝒊𝒔𝒇𝒊𝒆𝒅 𝒗𝒐𝒊𝒄𝒆 𝒄𝒖𝒔𝒕𝒐𝒎𝒆𝒓𝒔
𝑵𝒖𝒎𝒃𝒆𝒓 𝒐𝒇 𝒗𝒐𝒊𝒄𝒆 𝒄𝒖𝒔𝒕𝒐𝒎𝒆𝒓𝒔 𝒔𝒖𝒓𝒗𝒆𝒚𝒆𝒅

SAMPLE Insourced Contact Center Benchmark (sample report only—data is not accurate!)
71 | P a g e © M e t r i c N e t , L L C w w w . m e t r i c n e t . c o m
Voice Customer Satisfaction (continued) return to page 36 | next scorecard KPI
0.0%
10.0%
20.0%
30.0%
40.0%
50.0%
60.0%
70.0%
80.0%
90.0%
100.0%
Voic
e Cu
stom
er S
atis
fact
ion
High 95.4%Average ----- 51.7%Median 49.8%Low 13.3%
Key Statistics
Voice Customer Satisfaction

SAMPLE Insourced Contact Center Benchmark (sample report only—data is not accurate!)
72 | P a g e © M e t r i c N e t , L L C w w w . m e t r i c n e t . c o m
Voice Quality Metrics (continued)
Net First Contact Resolution Rate
Definition: Net First Contact Resolution (FCR) applies only to live (voice) contacts. It is a percentage, equal to the number of inbound calls that are resolved on the first interaction with the customer, divided by all calls that are potentially resolvable on first contact. Calls that involve a customer callback, or are otherwise unresolved on the first contact for any reason, do not qualify for Net First Contact Resolution. Calls that cannot be resolved on first contact, such as a product break/fix, are not included in the denominator of Net First Contact Resolution Rate. (Some Contact Centers also measure FCR for email by considering an email resolved on first contact if the customer receives a resolution within one hour of submitting the email. )
Why it’s important: Net First Contact Resolution is the single biggest driver of Voice Customer Satisfaction. A high Net FCR Rate is almost always associated with high levels of Voice Customer Satisfaction. Contact Centers that emphasize training (that is, high training hours for new and veteran agents) and have good technology tools, such as knowledge-management systems, generally enjoy a higher-than-average Net FCR Rate.
Key correlations: Net First Contact Resolution Rate is strongly correlated with the following metrics:
Customer Satisfaction
New Agent Training Hours
Annual Agent Training Hours
Voice Handle Time
𝑵𝒆𝒕 𝑭𝒊𝒓𝒔𝒕 𝑪𝒐𝒏𝒕𝒂𝒄𝒕 𝑹𝒆𝒔𝒐𝒍𝒖𝒕𝒊𝒐𝒏 𝑹𝒂𝒕𝒆 =𝑪𝒂𝒍𝒍𝒔 𝒂𝒄𝒕𝒖𝒂𝒍𝒍𝒚 𝐫𝐞𝐬𝐨𝐥𝐯𝐞𝐝 𝒐𝒏 𝒇𝒊𝒓𝒔𝒕 𝒄𝒐𝒏𝒕𝒂𝒄𝒕
𝑪𝒂𝒍𝒍𝒔 𝐫𝐞𝐬𝐨𝐥𝐯𝐚𝐛𝐥𝐞 𝒐𝒏 𝒇𝒊𝒓𝒔𝒕 𝒄𝒐𝒏𝒕𝒂𝒄𝒕

SAMPLE Insourced Contact Center Benchmark (sample report only—data is not accurate!)
73 | P a g e © M e t r i c N e t , L L C w w w . m e t r i c n e t . c o m
Net First Contact Resolution Rate (continued) return to page 36 | next scorecard KPI
0.0%
10.0%
20.0%
30.0%
40.0%
50.0%
60.0%
70.0%
80.0%
Net
Firs
t Con
tact
Res
olut
ion
Rate
High 69.6%Average ----- 36.6%Median 34.7%Low 18.7%
Key Statistics
Net First Contact Resolution Rate

SAMPLE Insourced Contact Center Benchmark (sample report only—data is not accurate!)
74 | P a g e © M e t r i c N e t , L L C w w w . m e t r i c n e t . c o m
Quality Metrics (continued)
Call Quality
Definition: Although there is no consistent methodology for measuring Call Quality in the Contact Center industry, most Contact Centers have developed their own scoring system for grading the quality of a call. Most will meas ure call quality on a scale of zero to 100%, and evaluate such things as agent courtesy, professionalism, empathy, timeliness of resolution, quality of resolution, adherence to the script, etc.
Why it’s important: Call Quality is the foundation of Voice Customer Satisfaction. Good Call Quality takes into account agent knowledge and expertise, call efficiency (that is , Voice Handle Time), and agent courtesy and professionalism. Unless Call Quality is consistently high, it is difficult to achieve consistently high levels of Voice Customer Satisfaction. When measured properly, Call Quality and Voice Customer Satisfaction should track fairly closely.
Key correlations: Call Quality is strongly correlated with the following metrics:
Voice Customer Satisfaction
Net First Contact Resolution Rate
New Agent Training Hours
Annual Agent Training Hours
𝑪𝒂𝒍𝒍 𝑸𝒖𝒂𝒍𝒊𝒕𝒚 = 𝑨 𝒔𝒄𝒐𝒓𝒆 𝒃𝒂𝒔𝒆𝒅 𝒐𝒏 𝒕𝒉𝒆 𝒂𝒈𝒆𝒏𝒕′𝒔 𝒉𝒆𝒍𝒑𝒇𝒖𝒍𝒏𝒆𝒔𝒔, 𝒆𝒇𝒇𝒊𝒄𝒊𝒆𝒏𝒄𝒚, 𝒄𝒐𝒖𝒓𝒕𝒆𝒔𝒚, 𝒆𝒕𝒄.
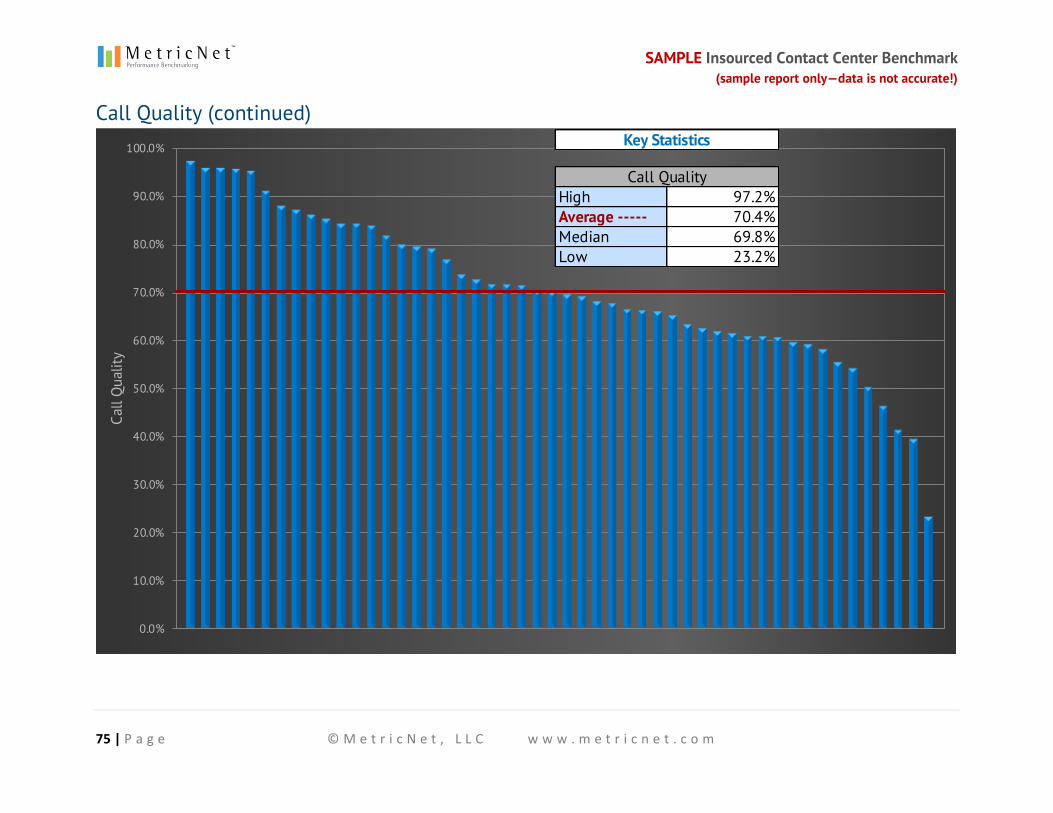
SAMPLE Insourced Contact Center Benchmark (sample report only—data is not accurate!)
75 | P a g e © M e t r i c N e t , L L C w w w . m e t r i c n e t . c o m
Call Quality (continued)
0.0%
10.0%
20.0%
30.0%
40.0%
50.0%
60.0%
70.0%
80.0%
90.0%
100.0%
Call
Qua
lity
High 97.2%Average ----- 70.4%Median 69.8%Low 23.2%
Key Statistics
Call Quality

SAMPLE Insourced Contact Center Benchmark (sample report only—data is not accurate!)
76 | P a g e © M e t r i c N e t , L L C w w w . m e t r i c n e t . c o m
Voice Productivity Metrics
Voice Agent Utilization
Definition: Voice Agent Utilization is the average time that a voice agent spends handling both inbound and outbound calls per month, divided by the number of work hours in a given month. (See the more thorough definition on page 78.)
Why it’s important: Voice Agent Utilization is the single most important indicator of voice-agent productivity. It measures the percentage of time that the average voice agent is in “work mode,” and is independent of handle time or call complexity.
Key correlations: Voice Agent Utilization is strongly correlated with the following metrics:
Inbound Voice Contacts per Agent per Month
Average Cost per Voice Contact
Average Cost per Voice Minute
Agent Occupancy
Average Speed of Answer
𝑽𝒐𝒊𝒄𝒆 𝑨𝒈𝒆𝒏𝒕 𝑼𝒕𝒊𝒍𝒊𝒛𝒂𝒕𝒊𝒐𝒏 =𝑻𝒐𝒕𝒂𝒍 𝒄𝒂𝒍𝒍 𝒉𝒂𝒏𝒅𝒍𝒊𝒏𝒈 𝒕𝒊𝒎𝒆 𝒑𝒆𝒓 𝒎𝒐𝒏𝒕𝒉
𝑵𝒖𝒎𝒃𝒆𝒓 𝒐𝒇 𝒘𝒐𝒓𝒌 𝒉𝒐𝒖𝒓𝒔 𝒑𝒆𝒓 𝒎𝒐𝒏𝒕𝒉

SAMPLE Insourced Contact Center Benchmark (sample report only—data is not accurate!)
77 | P a g e © M e t r i c N e t , L L C w w w . m e t r i c n e t . c o m
Voice Agent Utilization (continued) return to page 36 | next scorecard KPI
0.0%
5.0%
10.0%
15.0%
20.0%
25.0%
30.0%
35.0%
40.0%
45.0%
50.0%
55.0%
Voic
e Ag
ent U
tiliz
atio
n
High 48.2%Average ----- 32.2%Median 34.8%Low 15.3%
Key Statistics
Voice Agent Utilization

SAMPLE Insourced Contact Center Benchmark (sample report only—data is not accurate!)
78 | P a g e © M e t r i c N e t , L L C w w w . m e t r i c n e t . c o m
Voice Agent Utilization Defined
Voice Agent Utilization is a measure of the actual time that voice agents
spend providing direct customer service in the voice channel in a month,
divided by the agents’ total time at work during the month.
It takes into account both inbound and outbound voice contacts handled
by the agents.
But the calculation for Agent Utilization does not make adjustments for
sick days, holidays, training time, project time, or idle time.
By calculating Agent Utilization in this way, all Contact Centers
worldwide are measured in exactly the same way, and can therefore be
directly compared for benchmarking purposes.
Example: Contact Center Agent Utilization
Inbound Contacts per Agent per Month = 375
Outbound Contacts per Agent per Month = 225
Average Inbound Contact Handle Time = 10 minutes
Average Outbound Contact Handle Time = 5 minutes
SAMPLE Insourced Contact Center Benchmark (sample report only—data is not accurate!)
79 | P a g e © M e t r i c N e t , L L C w w w . m e t r i c n e t . c o m
Voice Productivity Metrics (continued)
Inbound Voice Contacts per Agent per Month
Definition: Inbound Voice Contacts per Agent per Month is the average monthly inbound call volume divided by the average full-time equivalent (FTE) voice agent headcount. Voice agent headcount is the average FTE number of employees and contractors handling voice contacts.
Why it’s important: Inbound Voice Contacts per Agent per Month is an important indicator of voice agent productivity. A low number could indicate low Voice Agent Utilization, poor scheduling efficiency or schedule adherence, or a higher-than-average Voice Handle Time. Conversely, a high number of inbound contacts per agent may indicate high Voice Agent Utilization, good scheduling efficiency and schedule adherence, or a lower-than-average Voice Handle Time. Every Contact Center should track and trend this metric on a monthly basis.
Key correlations: Inbound Voice Contacts per Agent per Month is strongly correlated with the following metrics:
Voice Agent Utilization
Voice Handle Time
Average Cost per Voice Contact
Average Cost per Voice Minute
Agent Occupancy
Average Speed of Answer
𝑰𝒏𝒃𝒐𝒖𝒏𝒅 𝑽𝒐𝒊𝒄𝒆 𝑪𝒐𝒏𝒕𝒂𝒄𝒕𝒔 𝒑𝒆𝒓 𝑨𝒈𝒆𝒏𝒕 𝒑𝒆𝒓 𝑴𝒐𝒏𝒕𝒉 =𝑨𝒗𝒈. 𝒊𝒏𝒃𝒐𝒖𝒏𝒅 𝒄𝒂𝒍𝒍 𝒗𝒐𝒍𝒖𝒎𝒆
𝑨𝒗𝒈. 𝑭𝑻𝑬 𝒗𝒐𝒊𝒄𝒆 𝒂𝒈𝒆𝒏𝒕 𝒉𝒆𝒂𝒅𝒄𝒐𝒖𝒏𝒕

SAMPLE Insourced Contact Center Benchmark (sample report only—data is not accurate!)
80 | P a g e © M e t r i c N e t , L L C w w w . m e t r i c n e t . c o m
Inbound Voice Contacts per Agent per Month (continued)
0
50
100
150
200
250
300
350
400
450
500
Inbo
und
Voic
e Co
ntac
ts p
er A
gent
per
Mon
th
High 455Average ----- 163Median 142Low 69
Key Statistics
Inbound Voice Contacts per Agent per Month

SAMPLE Insourced Contact Center Benchmark (sample report only—data is not accurate!)
81 | P a g e © M e t r i c N e t , L L C w w w . m e t r i c n e t . c o m
Voice Productivity Metrics (continued)
Voice, Chat, and Email Agents as a % of Total Contact Center Headcount
Definition: This metric is the average Full Time Equivalent (FTE) voice, chat, and email agent headcount divided by the average total Contact Center headcount. It is expressed as a percentage, and represents the percentage of total Contact Center personnel who are engaged in direct customer-service activities. Headcount includes both employees and contractors.
Why it’s important: The agent headcount as a percentage of total Contact Center headcount is an important measure of management and overhead efficiency. Since non-agents include both management and non-management personnel (such as supervisors and team leads, QA/QC, trainers, etc.), this metric is not a pure measure of management span of control. But it is a more useful metric than management span of control because the denominator of this ratio takes into account all personnel that are not directly engaged in customer-service activities.
Key correlations: Agents as a % of Total Contact Center Headcount is strongly correlated with the following metrics:
Average Cost per Agent-Assisted Contact
𝑨𝒈𝒆𝒏𝒕𝒔 𝒂𝒔 𝒂 % 𝒐𝒇 𝑻𝒐𝒕𝒂𝒍 𝑯𝒆𝒂𝒅𝒄𝒐𝒖𝒏𝒕 =𝑨𝒗𝒈. 𝑭𝑻𝑬 𝒂𝒈𝒆𝒏𝒕 𝒉𝒆𝒂𝒅𝒄𝒐𝒖𝒏𝒕
𝑨𝒗𝒈. 𝒕𝒐𝒕𝒂𝒍 𝑪𝒐𝒏𝒕𝒂𝒄𝒕 𝑪𝒆𝒏𝒕𝒆𝒓 𝒉𝒆𝒂𝒅𝒄𝒐𝒖𝒏𝒕
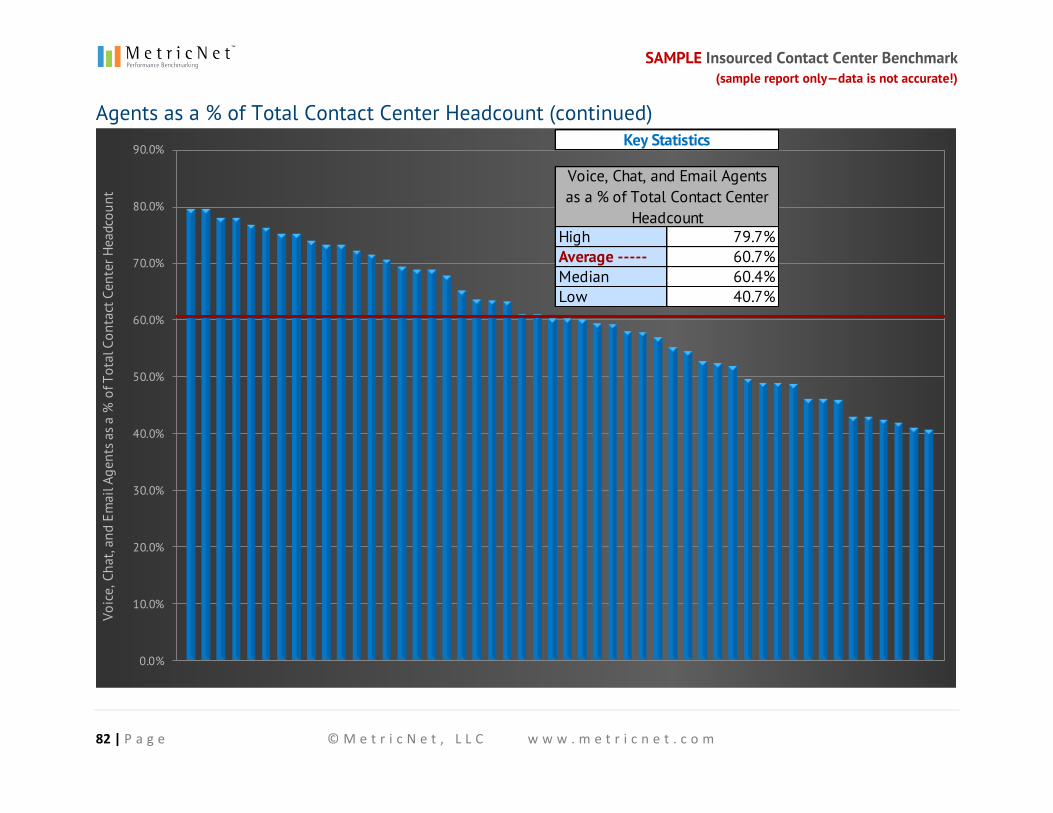
SAMPLE Insourced Contact Center Benchmark (sample report only—data is not accurate!)
82 | P a g e © M e t r i c N e t , L L C w w w . m e t r i c n e t . c o m
Agents as a % of Total Contact Center Headcount (continued)
0.0%
10.0%
20.0%
30.0%
40.0%
50.0%
60.0%
70.0%
80.0%
90.0%
Voic
e, C
hat,
and
Emai
l Age
nts a
s a %
of T
otal
Con
tact
Cen
ter H
eadc
ount
High 79.7%Average ----- 60.7%Median 60.4%Low 40.7%
Key Statistics
Voice, Chat, and Email Agents as a % of Total Contact Center
Headcount

SAMPLE Insourced Contact Center Benchmark (sample report only—data is not accurate!)
83 | P a g e © M e t r i c N e t , L L C w w w . m e t r i c n e t . c o m
Voice SLA Metrics
Average Speed of Answer (ASA)
Definition: Average Speed of Answer (ASA) is the total wait time that callers are in queue, divided by the number of calls handled. This includes calls handled by an Interactive Voice Response (IVR) system, as well as calls handled by live agents. Most Automatic Call Distributor (ACD) systems measure this number.
Why it’s important: ASA is a common service-level metric in the Contact Center industry. It indicates how responsive a Contact Center is to incoming calls. Since most Contact Centers have an ASA service-level target, the ASA is tracked to ensure service-level compliance.
Key correlations: Average Speed of Answer is strongly correlated with the following metrics:
Call Abandonment Rate
% Answered in 30 Seconds
Voice Agent Utilization
𝑨𝒗𝒆𝒓𝒂𝒈𝒆 𝑺𝒑𝒆𝒆𝒅 𝒐𝒇 𝑨𝒏𝒔𝒘𝒆𝒓 =𝑻𝒐𝒕𝒂𝒍 𝒊𝒏𝒊𝒕𝒊𝒂𝒍 𝒘𝒂𝒊𝒕 𝒕𝒊𝒎𝒆 𝒐𝒇 𝒂𝒍𝒍 𝒄𝒂𝒍𝒍𝒆𝒓𝒔
𝑵𝒖𝒎𝒃𝒆𝒓 𝒐𝒇 𝒊𝒏𝒃𝒐𝒖𝒏𝒅 𝒄𝒂𝒍𝒍𝒔 𝒉𝒂𝒏𝒅𝒍𝒆𝒅

SAMPLE Insourced Contact Center Benchmark (sample report only—data is not accurate!)
84 | P a g e © M e t r i c N e t , L L C w w w . m e t r i c n e t . c o m
Average Speed of Answer (ASA) (continued) return to page 36 (list of scorecard KPIs)
0
50
100
150
200
250
300
350
Aver
age
Spee
d of
Ans
wer
(sec
onds
)
High 290Average ----- 150Median 146Low 69
Key Statistics
Average Speed of Answer (seconds)
SAMPLE Insourced Contact Center Benchmark (sample report only—data is not accurate!)
85 | P a g e © M e t r i c N e t , L L C w w w . m e t r i c n e t . c o m
Voice SLA Metrics (continued)
Call Abandonment Rate
Definition: Call Abandonment Rate is the percentage of calls that were connected to the ACD, but were disconnected by the caller before reaching an agent or before completing a process within the IVR.
Why it’s important: Call Abandonment Rate is a common service-level metric in the Contact Center industry. An abandoned call indicates that a caller gave up and hung up the phone before receiving service from a live agent or from the IVR. Since most Contact Centers have an abandonment-rate service-level target, the Call Abandonment Rate is tracked to ensure service-level compliance.
Key correlations: Call Abandonment Rate is strongly correlated with the following metrics:
Average Speed of Answer
% Answered in 30 Seconds
Voice Agent Utilization
𝑪𝒂𝒍𝒍 𝑨𝒃𝒂𝒏𝒅𝒐𝒏𝒎𝒆𝒏𝒕 𝑹𝒂𝒕𝒆 =𝑪𝒂𝒍𝒍𝒔 𝒂𝒃𝒂𝒏𝒅𝒐𝒏𝒆𝒅 𝒃𝒚 𝒄𝒂𝒍𝒍𝒆𝒓
𝑻𝒐𝒕𝒂𝒍 𝒊𝒏𝒃𝒐𝒖𝒏𝒅 𝒄𝒂𝒍𝒍𝒔

SAMPLE Insourced Contact Center Benchmark (sample report only—data is not accurate!)
86 | P a g e © M e t r i c N e t , L L C w w w . m e t r i c n e t . c o m
Call Abandonment Rate (continued)
0.0%
5.0%
10.0%
15.0%
20.0%
25.0%
30.0%
35.0%
40.0%
45.0%
Call
Aban
donm
ent R
ate
High 39.4%Average ----- 11.2%Median 10.2%Low 1.7%
Key Statistics
Call Abandonment Rate

SAMPLE Insourced Contact Center Benchmark (sample report only—data is not accurate!)
87 | P a g e © M e t r i c N e t , L L C w w w . m e t r i c n e t . c o m
Voice SLA Metrics (continued)
% Answered in 30 Seconds
Definition: This metric is fairly self-explanatory. It is the percentage of all inbound calls that are answered by a live agent within 30 seconds. For those who don’t track this exact metric , but track a similar metric such as % Answered in 60 Seconds, MetricNet uses a conversion formula to calculate the equivalent percentage of calls answered within 30 seconds.
Why it’s important: % Answered in 30 Seconds is a common service-level metric in the Contact Center industry. It indicates how responsive a Contact Center is to incoming calls. Many Contact Centers have a service-level target for % Answered in 30 Seconds, so the metric is tracked to ensure service-level compliance.
Key correlations: % Answered in 30 Seconds is strongly correlated with the following metrics:
Average Speed of Answer
Call Abandonment Rate
Voice Agent Utilization
% 𝑨𝒏𝒔𝒘𝒆𝒓𝒆𝒅 𝒊𝒏 𝟑𝟎 𝑺𝒆𝒄𝒐𝒏𝒅𝒔 =𝑰𝒏𝒃𝒐𝒖𝒏𝒅 𝒄𝒂𝒍𝒍𝒔 𝒂𝒏𝒔𝒘𝒆𝒓𝒆𝒅 𝒊𝒏 𝟑𝟎 𝒔𝒆𝒄𝒐𝒏𝒅𝒔
𝑻𝒐𝒕𝒂𝒍 𝒊𝒏𝒃𝒐𝒖𝒏𝒅 𝒄𝒂𝒍𝒍𝒔
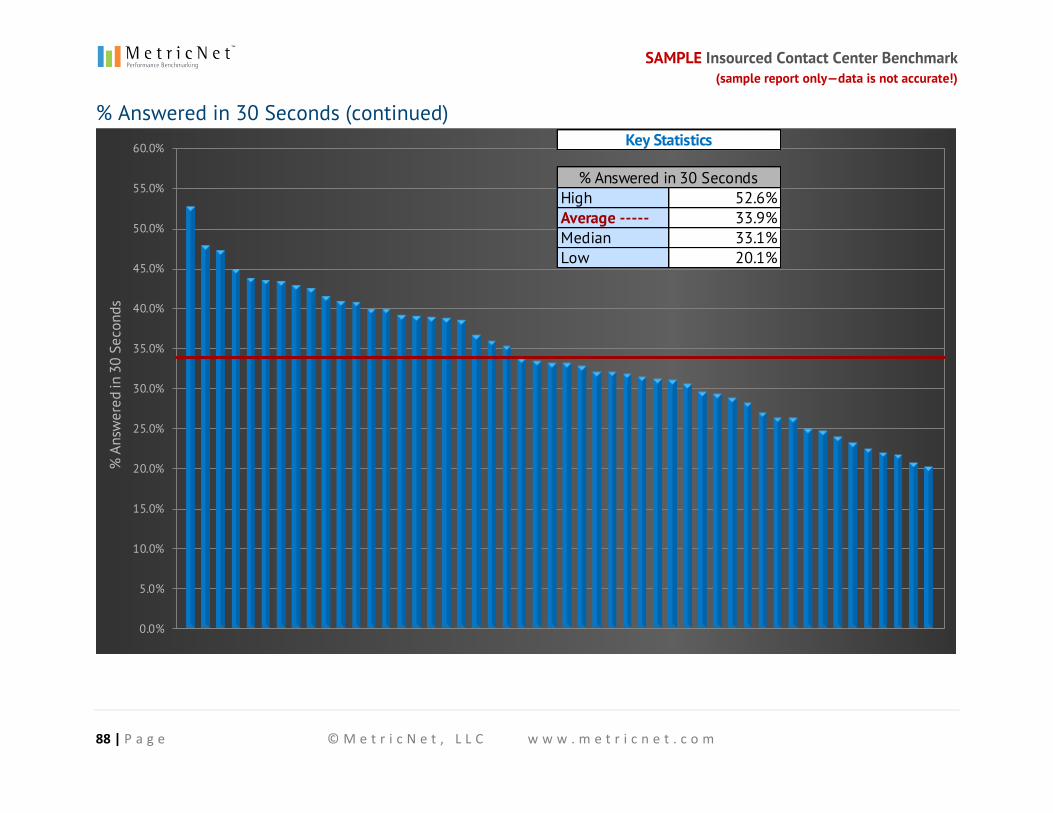
SAMPLE Insourced Contact Center Benchmark (sample report only—data is not accurate!)
88 | P a g e © M e t r i c N e t , L L C w w w . m e t r i c n e t . c o m
% Answered in 30 Seconds (continued)
0.0%
5.0%
10.0%
15.0%
20.0%
25.0%
30.0%
35.0%
40.0%
45.0%
50.0%
55.0%
60.0%
% A
nsw
ered
in 3
0 Se
cond
s
High 52.6%Average ----- 33.9%Median 33.1%Low 20.1%
Key Statistics
% Answered in 30 Seconds

SAMPLE Insourced Contact Center Benchmark (sample report only—data is not accurate!)
89 | P a g e © M e t r i c N e t , L L C w w w . m e t r i c n e t . c o m
Agent Metrics
Annual Agent Turnover
Definition: Annual Agent Turnover is the average percentage of agents that leave the Contact Center, for any reason (voluntarily or involuntarily), in a year.
Why it’s important: Agent turnover is costly. Each time an agent leaves the Contact Center, a new agent needs to be hired to replace the outgoing agent. This results in costly recruiting, hiring, and training expenses. Additionally, it is typically several weeks or even months before an agent is fully productive, so there is lost productivity associated with agent turnover as well. High agent turnover is generally associated with low agent morale in a Contact Center.
Key correlations: Annual Agent Turnover is strongly correlated with the following metrics:
Daily Agent Absenteeism
Annual Agent Training Hours
Customer Satisfaction
Net First Contact Resolution Rate
Average Cost per Agent-Assisted Contact
Agent Job Satisfaction
𝑨𝒏𝒏𝒖𝒂𝒍 𝑨𝒈𝒆𝒏𝒕 𝑻𝒖𝒓𝒏𝒐𝒗𝒆𝒓 =𝑨𝒗𝒈. 𝒏𝒖𝒎𝒃𝒆𝒓 𝒐𝒇 𝒂𝒈𝒆𝒏𝒕𝒔 𝒕𝒉𝒂𝒕 𝒍𝒆𝒂𝒗𝒆 𝒑𝒆𝒓 𝒚𝒆𝒂𝒓
𝑨𝒗𝒈. 𝒕𝒐𝒕𝒂𝒍 𝒂𝒈𝒆𝒏𝒕 𝒉𝒆𝒂𝒅𝒄𝒐𝒖𝒏𝒕

SAMPLE Insourced Contact Center Benchmark (sample report only—data is not accurate!)
90 | P a g e © M e t r i c N e t , L L C w w w . m e t r i c n e t . c o m
Annual Agent Turnover (continued)
0.0%
10.0%
20.0%
30.0%
40.0%
50.0%
60.0%
70.0%
80.0%
90.0%
100.0%
110.0%
Annu
al A
gent
Tur
nove
r
High 97.7%Average ----- 68.1%Median 67.5%Low 46.8%
Key Statistics
Annual Agent Turnover

SAMPLE Insourced Contact Center Benchmark (sample report only—data is not accurate!)
91 | P a g e © M e t r i c N e t , L L C w w w . m e t r i c n e t . c o m
Agent Metrics (continued)
Daily Agent Absenteeism
Definition: Daily Agent Absenteeism is the average percentage o f agents with an unexcused absence on any given day. It is calculated by dividing the average number of unexcused absent agents per day by the average total number of agents per day that are scheduled to be at work.
Why it’s important: High Agent Absenteeism is problematic because it makes it difficult for a Contact Center to schedule resources efficiently. High absenteeism can severely harm a Contact Center ’s operating performance and increase the likelihood that service-level targets will be missed. A Contact Center ’s Average Speed of Answer and Call Abandonment Rate typically suffer when absenteeism is high. Also, chronically high absenteeism is often a sign of low agent morale.
Key correlations: Daily Agent Absenteeism is strongly correlated with the following metrics:
Annual Agent Turnover
Agent Job Satisfaction
Agent Utilization
Average Cost per Agent-Assisted Contact
Contacts per Agent per Month
𝑫𝒂𝒊𝒍𝒚 𝑨𝒈𝒆𝒏𝒕 𝑨𝒃𝒔𝒆𝒏𝒕𝒆𝒆𝒊𝒔𝒎 =𝑨𝒗𝒈. 𝒏𝒖𝒎𝒃𝒆𝒓 𝒐𝒇 𝒖𝒏𝒆𝒙𝒄𝒖𝒔𝒆𝒅 𝒂𝒃𝒔𝒆𝒏𝒕 𝒂𝒈𝒆𝒏𝒕𝒔 𝒑𝒆𝒓 𝒅𝒂𝒚
𝑨𝒗𝒈. 𝒏𝒖𝒎𝒃𝒆𝒓 𝒐𝒇 𝒂𝒈𝒆𝒏𝒕𝒔 𝒔𝒄𝒉𝒆𝒅𝒖𝒍𝒆𝒅 𝒕𝒐 𝒘𝒐𝒓𝒌 𝒑𝒆𝒓 𝒅𝒂𝒚

SAMPLE Insourced Contact Center Benchmark (sample report only—data is not accurate!)
92 | P a g e © M e t r i c N e t , L L C w w w . m e t r i c n e t . c o m
Daily Agent Absenteeism (continued)
0.0%
2.0%
4.0%
6.0%
8.0%
10.0%
12.0%
14.0%
16.0%
18.0%
20.0%
22.0%
Dai
ly A
gent
Abs
ente
eism
High 19.4%Average ----- 14.7%Median 14.7%Low 11.1%
Key Statistics
Daily Agent Absenteeism

SAMPLE Insourced Contact Center Benchmark (sample report only—data is not accurate!)
93 | P a g e © M e t r i c N e t , L L C w w w . m e t r i c n e t . c o m
Agent Metrics (continued)
Agent Occupancy
Definition: Agent Occupancy is a percentage, equal to the amount of time that an agent is in his or her seat and connected to the ACD and either engaged in a call or ready to answer a call, divided by the agent’s total number of hours at work (excluding break time and lunch time).
Why it’s important: Agent Occupancy is an indirect measure of agent productivity and Agent Schedule Adherence. High levels of Agent Occupancy indicate an orderly, disciplined work environment. Conversely, low levels of Agent Occupancy are often accompanied by a chaotic, undisciplined work environment. Agent Occupancy and Voice Agent Utilization are sometimes confused. Although Agent Occupancy and Voice Agent Utilization are correlated, they are very different metrics. It is possible to have a high occupancy (when agents are logged into the ACD a large percentage of the time) but a low Voice Agent Utilization (when few calls are coming in).
Key correlations: Agent Occupancy is strongly correlated with the following metrics:
Voice Agent Utilization
Agent Schedule Adherence
Inbound Voice Contacts per Agent per Month
Average Cost per Voice Contact
𝑨𝒈𝒆𝒏𝒕 𝑶𝒄𝒄𝒖𝒑𝒂𝒏𝒄𝒚 =𝑯𝒐𝒖𝒓𝒔 𝒕𝒉𝒂𝒕 𝒂𝒈𝒆𝒏𝒕𝒔 𝒂𝒓𝒆 𝒓𝒆𝒂𝒅𝒚 𝒕𝒐 𝒂𝒏𝒔𝒘𝒆𝒓 𝒐𝒓 𝒂𝒄𝒕𝒖𝒂𝒍𝒍𝒚 𝒐𝒏 𝒄𝒂𝒍𝒍𝒔
𝑻𝒐𝒕𝒂𝒍 𝒂𝒈𝒆𝒏𝒕 𝒘𝒐𝒓𝒌 𝒉𝒐𝒖𝒓𝒔

SAMPLE Insourced Contact Center Benchmark (sample report only—data is not accurate!)
94 | P a g e © M e t r i c N e t , L L C w w w . m e t r i c n e t . c o m
Agent Occupancy (continued)
40.0%
45.0%
50.0%
55.0%
60.0%
65.0%
70.0%
75.0%
80.0%
85.0%
90.0%
95.0%
100.0%
Agen
t Occ
upan
cy
High 95.8%Average ----- 74.7%Median 74.7%Low 49.0%
Key Statistics
Agent Occupancy

SAMPLE Insourced Contact Center Benchmark (sample report only—data is not accurate!)
95 | P a g e © M e t r i c N e t , L L C w w w . m e t r i c n e t . c o m
Agent Metrics (continued)
Agent Schedule Adherence
Definition: Agent Schedule Adherence measures whether agents are in their seats ready to accept calls as scheduled. That is, it measures how well a Contact Center ’s agents are “adhering” to the schedule. Agent Schedule Adherence is equal to the actual time that an agent is logged in to the system ready to accept calls, divided by the total time the agent is scheduled to be available to accept calls.
Why it’s important: Effective agent scheduling is critical to achieving a Contact Center ’s service-level goals and maximizing Agent Utilization. But a work schedule, no matter how well constructed, is only as good as the adherence to the schedule. It is therefore important for agents to adhere to the schedule as closely as possible to ensure that these productivity and servi ce-level goals are met.
Key correlations: Agent Schedule Adherence is strongly correlated with the following metrics:
Agent Utilization
Contacts per Agent per Month
Agent Occupancy
Average Speed of Answer
𝑨𝒈𝒆𝒏𝒕 𝑺𝒄𝒉𝒆𝒅𝒖𝒍𝒆 𝑨𝒅𝒉𝒆𝒓𝒆𝒏𝒄𝒆 =𝑯𝒐𝒖𝒓𝒔 𝒕𝒉𝒂𝒕 𝒂𝒈𝒆𝒏𝒕𝒔 𝒂𝒓𝒆 𝒂𝒗𝒂𝒊𝒍𝒂𝒃𝒍𝒆 𝒇𝒐𝒓 𝒐𝒓 𝒐𝒏 𝒄𝒂𝒍𝒍𝒔
𝑯𝒐𝒖𝒓𝒔 𝒕𝒉𝒂𝒕 𝒂𝒈𝒆𝒏𝒕𝒔 𝒂𝒓𝒆 𝒔𝒄𝒉𝒆𝒅𝒖𝒍𝒆𝒅 𝒕𝒐 𝒃𝒆 𝒂𝒗𝒂𝒊𝒍𝒂𝒃𝒍𝒆
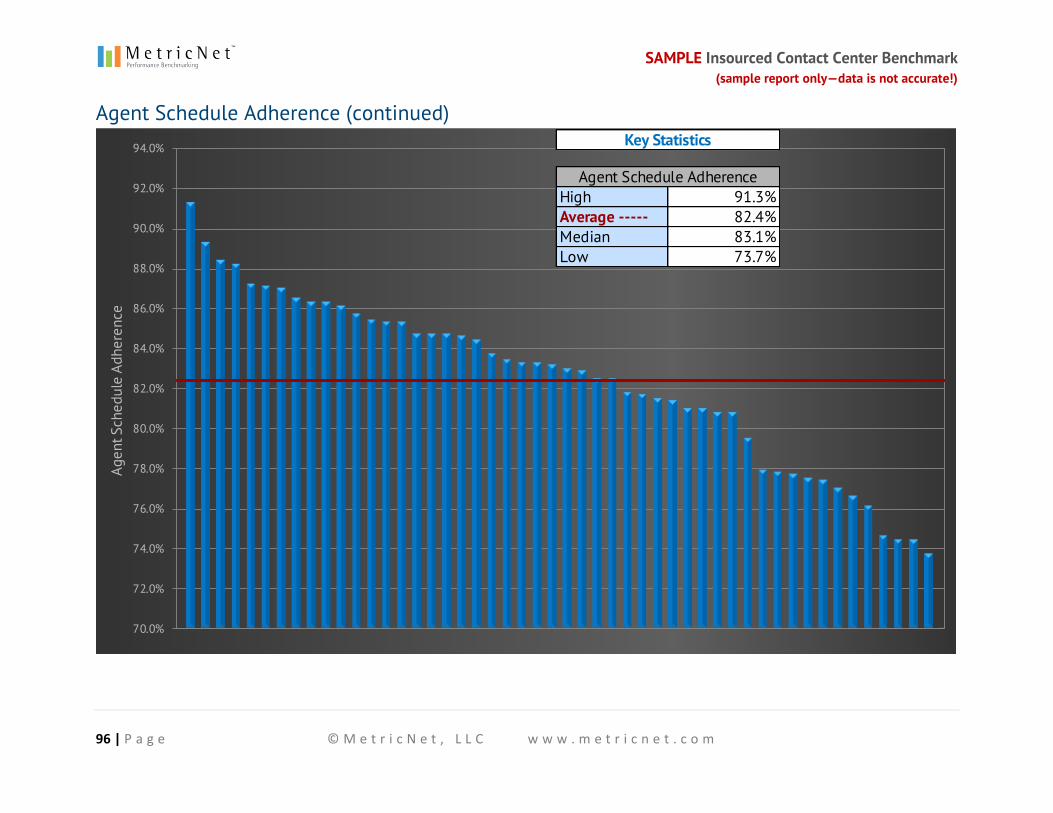
SAMPLE Insourced Contact Center Benchmark (sample report only—data is not accurate!)
96 | P a g e © M e t r i c N e t , L L C w w w . m e t r i c n e t . c o m
Agent Schedule Adherence (continued)
70.0%
72.0%
74.0%
76.0%
78.0%
80.0%
82.0%
84.0%
86.0%
88.0%
90.0%
92.0%
94.0%
Agen
t Sch
edul
e Ad
here
nce
High 91.3%Average ----- 82.4%Median 83.1%Low 73.7%
Key Statistics
Agent Schedule Adherence

SAMPLE Insourced Contact Center Benchmark (sample report only—data is not accurate!)
97 | P a g e © M e t r i c N e t , L L C w w w . m e t r i c n e t . c o m
Agent Metrics (continued)
New Agent Training Hours
Definition: The name of this metric is somewhat self-explanatory. New Agent Training Hours is the number of training hours (including classroom, computer-based training, self-study, shadowing, being coached, and on-the-job training) that a new agent receives before he or she is allowed to handle customer contacts independently.
Why it’s important: New Agent Training Hours are strongly correlated with Call Quality and Net First Contact Resolution Rate , especially during an agent’s first few months on the job. The more training that new agents receive, the higher that Call Quality and Net FCR will typically be. This, in turn, has a positive effect on many other performance metrics including Customer Satisfaction. Perhaps most importantly, training levels strongly impact agent morale—agents who receive more training typically have higher levels of job satisfaction.
Key correlations: New Agent Training Hours are strongly correlated with the following metrics:
Call Quality
Net First Contact Resolution Rate
Customer Satisfaction
Contact Handle Time
Agent Job Satisfaction
𝑵𝒆𝒘 𝑨𝒈𝒆𝒏𝒕 𝑻𝒓𝒂𝒊𝒏𝒊𝒏𝒈 𝑯𝒐𝒖𝒓𝒔 = 𝑵𝒖𝒎𝒃𝒆𝒓 𝒐𝒇 𝒕𝒓𝒂𝒊𝒏𝒊𝒏𝒈 𝒉𝒐𝒖𝒓𝒔 𝐫𝐞𝐪𝐮𝐢𝐫𝐞𝐝 𝒃𝒆𝒇𝒐𝒓𝒆
𝒂 𝒏𝒆𝒘 𝒂𝒈𝒆𝒏𝒕 𝒎𝒂𝒚 𝒉𝒂𝒏𝒅𝒍𝒆 𝒄𝒐𝒏𝒕𝒂𝒄𝒕𝒔 𝒊𝒏𝒅𝒆𝒑𝒆𝒏𝒅𝒆𝒏𝒕𝒍𝒚

SAMPLE Insourced Contact Center Benchmark (sample report only—data is not accurate!)
98 | P a g e © M e t r i c N e t , L L C w w w . m e t r i c n e t . c o m
New Agent Training Hours (continued)
0
25
50
75
100
125
150
175
200
225
250
275
300
New
Age
nt T
rain
ing
Hou
rs
High 279Average ----- 160Median 163Low 62
Key Statistics
New Agent Training Hours

SAMPLE Insourced Contact Center Benchmark (sample report only—data is not accurate!)
99 | P a g e © M e t r i c N e t , L L C w w w . m e t r i c n e t . c o m
Agent Metrics (continued)
Annual Agent Training Hours
Definition: Annual Agent Training Hours is the average number of training hours (including classroom, computer-based training, self-study, shadowing, etc.) that an agent receives on an annual basis. This number includes any training hours that an agent receives that are not part of the agent’s initial (new-agent) training. But it does not include routine team meetings, shift handoffs, or other activities that do not involve formal training.
Why it’s important: Annual Agent Training Hours are strongly correlated with Call Quality, Net First Contact Resolution Rate, and Customer Satisfaction. Perhaps most importantly, training levels strongly impact agent morale—agents who receive more training typically have higher levels of job satisfaction.
Key correlations: Annual Agent Training Hours are strongly correlated with the following metrics:
Call Quality
Net First Contact Resolution Rate
Customer Satisfaction
Contact Handle Time
Agent Job Satisfaction
𝑨𝒏𝒏𝒖𝒂𝒍 𝑨𝒈𝒆𝒏𝒕 𝑻𝒓𝒂𝒊𝒏𝒊𝒏𝒈 𝑯𝒐𝒖𝒓𝒔 = 𝑨𝒗𝒆𝒓𝒂𝒈𝒆 𝒏𝒖𝒎𝒃𝒆𝒓
𝒐𝒇 𝒇𝒐𝒓𝒎𝒂𝒍 𝒕𝒓𝒂𝒊𝒏𝒊𝒏𝒈 𝒉𝒐𝒖𝒓𝒔 𝒑𝒆𝒓 𝒂𝒈𝒆𝒏𝒕 𝒑𝒆𝒓 𝒚𝒆𝒂𝒓

SAMPLE Insourced Contact Center Benchmark (sample report only—data is not accurate!)
100 | P a g e © M e t r i c N e t , L L C w w w . m e t r i c n e t . c o m
Annual Agent Training Hours (continued)
0
5
10
15
20
25
30
35
40
45
50
Annu
al A
gent
Tra
inin
g H
ours
High 44Average ----- 11Median 7Low 0
Key Statistics
Annual Agent Training Hours

SAMPLE Insourced Contact Center Benchmark (sample report only—data is not accurate!)
101 | P a g e © M e t r i c N e t , L L C w w w . m e t r i c n e t . c o m
Agent Metrics (continued)
Agent Tenure
Definition: Agent Tenure is the average number of months that each agent has worked in a particular Contact Center.
Why it’s important: Agent Tenure is a measure of agent experience. Almost every metric related to Contact Center cost and quality is impacted by the level of experience the agents have.
Key correlations: Agent Tenure is strongly correlated with the following metrics:
Average Cost per Agent-Assisted Contact
Call Quality
Customer Satisfaction
Annual Agent Turnover
Agent Training Hours
Agent Coaching Hours
Contact Handle Time
Net First Contact Resolution Rate
Agent Job Satisfaction
𝑨𝒈𝒆𝒏𝒕 𝑻𝒆𝒏𝒖𝒓𝒆 = 𝑨𝒗𝒆𝒓𝒂𝒈𝒆 𝒏𝒖𝒎𝒃𝒆𝒓 𝒐𝒇 𝒎𝒐𝒏𝒕𝒉𝒔 𝒕𝒉𝒂𝒕 𝒆𝒂𝒄𝒉
𝒂𝒈𝒆𝒏𝒕 𝒉𝒂𝒔 𝒘𝒐𝒓𝒌𝒆𝒅 𝒊𝒏 𝒚𝒐𝒖𝒓 𝑪𝒐𝒏𝒕𝒂𝒄𝒕 𝑪𝒆𝒏𝒕𝒆𝒓

SAMPLE Insourced Contact Center Benchmark (sample report only—data is not accurate!)
102 | P a g e © M e t r i c N e t , L L C w w w . m e t r i c n e t . c o m
Agent Tenure (continued)
0
2
4
6
8
10
12
14
16
18
20
22
24
26
28
Agen
t Ten
ure
(mon
ths)
High 26.1Average ----- 14.9Median 15.0Low 5.4
Key Statistics
Agent Tenure (months)
SAMPLE Insourced Contact Center Benchmark (sample report only—data is not accurate!)
103 | P a g e © M e t r i c N e t , L L C w w w . m e t r i c n e t . c o m
Agent Metrics (continued)
Agent Job Satisfaction
Definition: Agent Job Satisfaction is the percentage of agents in a Contact Center who are either satisfied or very satisfied with their jobs.
Why it’s important: Agent Job Satisfaction is a proxy for agent morale. And morale, while difficult to measure, affects performance on almost every metric in the Contact Center. High-performance Contact Centers almost always have high levels of Agent Job Satisfaction. A Contact Center can control and improve its performance on this metric through training, coaching, and career pathing.
Key correlations: Agent Job Satisfaction is strongly correlated with the following metrics:
Annual Agent Turnover
Daily Agent Absenteeism
Agent Training Hours
Agent Coaching Hours
Customer Satisfaction
Net First Contact Resolution Rate
Contact Handle Time
Average Cost per Agent-Assisted Contact
𝑨𝒈𝒆𝒏𝒕 𝑱𝒐𝒃 𝑺𝒂𝒕𝒊𝒔𝒇𝒂𝒄𝒕𝒊𝒐𝒏 =𝑵𝒖𝒎𝒃𝒆𝒓 𝒐𝒇 𝒔𝒂𝒕𝒊𝒔𝒇𝒊𝒆𝒅 𝒂𝒈𝒆𝒏𝒕𝒔
𝑻𝒐𝒕𝒂𝒍 𝒏𝒖𝒎𝒃𝒆𝒓 𝒐𝒇 𝒂𝒈𝒆𝒏𝒕𝒔

SAMPLE Insourced Contact Center Benchmark (sample report only—data is not accurate!)
104 | P a g e © M e t r i c N e t , L L C w w w . m e t r i c n e t . c o m
Agent Job Satisfaction (continued) return to page 36 | next scorecard KPI
50.0%
55.0%
60.0%
65.0%
70.0%
75.0%
80.0%
85.0%
Agen
t Job
Sat
isfa
ctio
n
High 82.5%Average ----- 71.0%Median 71.7%Low 53.0%
Key Statistics
Agent Job Satisfaction

SAMPLE Insourced Contact Center Benchmark (sample report only—data is not accurate!)
105 | P a g e © M e t r i c N e t , L L C w w w . m e t r i c n e t . c o m
Chat Metrics
% of Contacts Originating in Chat
Definition: As the name suggests, % of Contacts Originating in Chat is the percentage of all contacts coming into the Contact Center that originate in the chat channel. As a chat channel matures, this metric normally increases.
Why it’s important: % of Contacts Originating in Chat is a direct reflection of Contact Center chat-channel maturity. Ideally, the chat channel should enrich the user experience by providing channel choice and high-quality interactions. A low percentage could indicate that your customers do not know chat is offered or that they simply do not want or need that channel choice.
Key correlations: % of Contacts Originating in Chat is strongly correlated with the following metrics:
Number of Chat Sessions per Chat Agent per Month
% of Contacts Resolved in Chat
Chat First Contact Resolution Rate
% Failover Rate from Chat to Voice
% 𝒐𝒇 𝑪𝒐𝒏𝒕𝒂𝒄𝒕𝒔 𝑶𝒓𝒊𝒈𝒊𝒏𝒂𝒕𝒊𝒏𝒈 𝒊𝒏 𝑪𝒉𝒂𝒕 =𝑽𝒐𝒍𝒖𝒎𝒆 𝒐𝒇 𝒄𝒐𝒏𝒕𝒂𝒄𝒕𝒔 𝒐𝒓𝒊𝒈𝒊𝒏𝒂𝒕𝒊𝒏𝒈 𝒊𝒏 𝒄𝒉𝒂𝒕
𝑻𝒐𝒕𝒂𝒍 𝒄𝒐𝒏𝒕𝒂𝒄𝒕 𝒗𝒐𝒍𝒖𝒎𝒆 𝒇𝒓𝒐𝒎 𝒂𝒍𝒍 𝒄𝒉𝒂𝒏𝒏𝒆𝒍𝒔

SAMPLE Insourced Contact Center Benchmark (sample report only—data is not accurate!)
106 | P a g e © M e t r i c N e t , L L C w w w . m e t r i c n e t . c o m
% of Contacts Originating in Chat (continued)
0.0%
5.0%
10.0%
15.0%
20.0%
25.0%
30.0%
35.0%
40.0%
45.0%
50.0%
55.0%
% o
f Con
tact
s Orig
inat
ing
in C
hat
High 51.2%Average ----- 14.3%Median 11.3%Low 0.0%
Key Statistics
% of Contacts Originating in Chat

SAMPLE Insourced Contact Center Benchmark (sample report only—data is not accurate!)
107 | P a g e © M e t r i c N e t , L L C w w w . m e t r i c n e t . c o m
Chat Metrics (continued)
% of Contacts Resolved in Chat
Definition: % of Contacts Resolved in Chat is the percentage of all contacts coming into the Contact Center that originate and are resolved in the chat channel. This number will be less than or equal to the % of Contacts Originating in Chat. Once again, as the chat channel matures, this metric normally increases.
Why it’s important: % of Contacts Resolved in Chat is a measure of the overall competency of the chat channel, and is a proxy for Total Cost o f Ownership (TCO). A high % of Contacts Resolved in Chat helps to minimize TCO because each contact that is initiated and resolved in the chat channel avoids failover to a higher-cost voice contact. Contact Centers can improve their % of Contacts Resolved in Chat through training, and through investments in key technologies such as proactive chat pops.
Key correlations: % of Contacts Resolved in Chat is strongly correlated with the following metrics:
Chat First Contact Resolution Rate
New Agent Training Hours
Annual Agent Training Hours
Average Cost per Chat Session
Total Cost of Ownership
% Failover Rate from Chat to Voice
% 𝒐𝒇 𝑪𝒐𝒏𝒕𝒂𝒄𝒕𝒔 𝑹𝒆𝒔𝒐𝒍𝒗𝒆𝒅 𝒊𝒏 𝑪𝒉𝒂𝒕 =𝑽𝒐𝒍𝒖𝒎𝒆 𝒐𝒇 𝒄𝒐𝒏𝒕𝒂𝒄𝒕𝒔 𝒓𝒆𝒔𝒐𝒍𝒗𝒆𝒅 𝒊𝒏 𝒄𝒉𝒂𝒕
𝑻𝒐𝒕𝒂𝒍 𝒄𝒐𝒏𝒕𝒂𝒄𝒕 𝒗𝒐𝒍𝒖𝒎𝒆 𝒇𝒓𝒐𝒎 𝒂𝒍𝒍 𝒄𝒉𝒂𝒏𝒏𝒆𝒍𝒔

SAMPLE Insourced Contact Center Benchmark (sample report only—data is not accurate!)
108 | P a g e © M e t r i c N e t , L L C w w w . m e t r i c n e t . c o m
% of Contacts Resolved in Chat (continued)
0.0%
2.0%
4.0%
6.0%
8.0%
10.0%
12.0%
14.0%
16.0%
18.0%
20.0%
% o
f Con
tact
s Res
olve
d in
Cha
t
High 17.2%Average ----- 4.0%Median 2.9%Low 0.0%
Key Statistics
% of Contacts Resolved in Chat

SAMPLE Insourced Contact Center Benchmark (sample report only—data is not accurate!)
109 | P a g e © M e t r i c N e t , L L C w w w . m e t r i c n e t . c o m
Chat Metrics (continued)
Chat First Contact Resolution Rate
Definition: Chat First Contact Resolution applies only to live (chat) contacts. It is the percentage of chat sessions that are resolved on the first interaction with the customer, divided by all chat sessions that are potentially resolvable on first contact. Chat sessions that cannot be resolved on first contact, such as a product break/fix, are not included in the denominator of Chat First Contact Resolution Rate. Chat sessions unresolved on the first contact for any reason do not qualify for Chat FCR.
Why it’s important: Chat First Contact Resolution is the single biggest driver of Customer Satisfaction in the chat channel. A high Chat First Contact Resolution Rate is almost always associated with high levels of Customer Satisfaction. Contact Centers that emphasize training (that is , high training hours for new and veteran agents) and have good technology tools, such as knowledge-management systems, generally enjoy a higher than average Chat First Contact Resolution Rate.
Key correlations: Chat First Contact Resolution Rate is strongly correlated with the following metrics:
Customer Satisfaction in the Chat Channel
% of Contacts Resolved in Chat
New Agent Training Hours
Annual Agent Training Hours
Chat Handle Time
𝑪𝒉𝒂𝒕 𝑭𝒊𝒓𝒔𝒕 𝑪𝒐𝒏𝒕𝒂𝒄𝒕 𝑹𝒆𝒔𝒐𝒍𝒖𝒕𝒊𝒐𝒏 𝑹𝒂𝒕𝒆 =𝑵𝒖𝒎𝒃𝒆𝒓 𝒐𝒇 𝒄𝒐𝒏𝒕𝒂𝒄𝒕𝒔 𝐫𝐞𝐬𝐨𝐥𝐯𝐞𝐝 𝒊𝒏 𝒇𝒊𝒓𝒔𝒕 𝒄𝒉𝒂𝒕
𝑵𝒖𝒎𝒃𝒆𝒓 𝒐𝒇 𝒄𝒐𝒏𝒕𝒂𝒄𝒕𝒔 𝐫𝐞𝐬𝐨𝐥𝐯𝐚𝐛𝐥𝐞 𝒊𝒏 𝒄𝒉𝒂𝒕

SAMPLE Insourced Contact Center Benchmark (sample report only—data is not accurate!)
110 | P a g e © M e t r i c N e t , L L C w w w . m e t r i c n e t . c o m
Chat First Contact Resolution Rate (continued)
0.0%
5.0%
10.0%
15.0%
20.0%
25.0%
30.0%
35.0%
40.0%
45.0%
50.0%
55.0%
60.0%
65.0%
Chat
Firs
t Con
tact
Res
olut
ion
Rate
High 58.8%Average ----- 31.3%Median 28.6%Low 8.3%
Key Statistics
Chat First Contact Resolution Rate

SAMPLE Insourced Contact Center Benchmark (sample report only—data is not accurate!)
111 | P a g e © M e t r i c N e t , L L C w w w . m e t r i c n e t . c o m
Chat Metrics (continued)
% Failover Rate from Chat to Voice
Definition: % Failover Rate from Chat to Voice measures the percentage of chats that “failover” to a live-agent voice contact. This happens when the agent or the caller feels that voice communication is needed, and they revert from the chat channel to the voice channel to complete a transaction.
Why it’s important: % Failover from Chat to Voice is another measure of the overall competency of the chat channel and a proxy for both TCO and Customer Satisfaction. A low % Failover from Chat to Voice helps to maximize Customer Satisfaction and minimize TCO because the chat session is initiated and resolved on first contact. Contact Centers can improve their % Failover from Chat to Voice through training, and investments in certain technologies such as knowledge-management systems.
Key correlations: % Failover Rate from Chat to Voice is strongly correlated with the following metrics:
Chat First Contact Resolution Rate
New Agent Training Hours
Annual Agent Training Hours
Average Cost per Chat Session
Total Cost of Ownership
% 𝑭𝒂𝒊𝒍𝒐𝒗𝒆𝒓 𝑹𝒂𝒕𝒆 𝒇𝒓𝒐𝒎 𝑪𝒉𝒂𝒕 𝒕𝒐 𝑽𝒐𝒊𝒄𝒆 =𝑵𝒖𝒎𝒃𝒆𝒓 𝒐𝒇 𝒄𝒉𝒂𝒕𝒔 𝒕𝒉𝒂𝒕 𝒇𝒂𝒊𝒍𝒐𝒗𝒆𝒓 𝒕𝒐 𝒗𝒐𝒊𝒄𝒆
𝑻𝒐𝒕𝒂𝒍 𝒏𝒖𝒎𝒃𝒆𝒓 𝒐𝒇 𝒄𝒉𝒂𝒕 𝒔𝒆𝒔𝒔𝒊𝒐𝒏𝒔

SAMPLE Insourced Contact Center Benchmark (sample report only—data is not accurate!)
112 | P a g e © M e t r i c N e t , L L C w w w . m e t r i c n e t . c o m
% Failover Rate from Chat to Voice (continued)
0.0%
10.0%
20.0%
30.0%
40.0%
50.0%
60.0%
70.0%
80.0%
90.0%
100.0%
% F
ailo
ver R
ate
from
Cha
t to
Voic
e
High 91.6%Average ----- 68.6%Median 71.3%Low 41.1%
Key Statistics
% Failover Rate from Chat to Voice

SAMPLE Insourced Contact Center Benchmark (sample report only—data is not accurate!)
113 | P a g e © M e t r i c N e t , L L C w w w . m e t r i c n e t . c o m
Chat Metrics (continued)
Customer Satisfaction in the Chat Channel
Definition: Customer Satisfaction in the Chat Channel is the percentage of customers who are either satisfied or very satisfied with their Contact Center experience in the chat channel. This metric can be captured in a number of ways, including automatic after-chat pop-up surveys, follow-up outbound (live-agent) calls, email surveys, postal surveys, etc.
Why it’s important: Customer Satisfaction in the Chat Channel is the single most important measure of chat-channel quality. Any successful chat channel will have consistently high Customer Satisfaction ratings. Some Contact Center managers are under the impression that a low Average Cost per Chat Session may justify a lower level of Customer Satisfaction in the Chat Channel. But this is not true. MetricNet’s research shows that even Contact Centers with a very low Average Cost per Chat Session can achieve consistently high customer satisfaction ratings in the chat channel.
Key correlations: Customer Satisfaction in the Chat Channel is strongly correlated with the following metrics:
New Agent Training Hours
Annual Agent Training Hours
Chat First Contact Resolution
𝑪𝒖𝒔𝒕𝒐𝒎𝒆𝒓 𝑺𝒂𝒕𝒊𝒔𝒇𝒂𝒄𝒕𝒊𝒐𝒏 𝒊𝒏 𝑪𝒉𝒂𝒕 𝑪𝒉𝒂𝒏𝒏𝒆𝒍 =𝑵𝒖𝒎𝒃𝒆𝒓 𝒐𝒇 𝒔𝒂𝒕𝒊𝒔𝒇𝒊𝒆𝒅 𝒄𝒉𝒂𝒕 𝒄𝒖𝒔𝒕𝒐𝒎𝒆𝒓𝒔
𝑵𝒖𝒎𝒃𝒆𝒓 𝒐𝒇 𝒄𝒉𝒂𝒕 𝒄𝒖𝒔𝒕𝒐𝒎𝒆𝒓𝒔 𝒔𝒖𝒓𝒗𝒆𝒚𝒆𝒅

SAMPLE Insourced Contact Center Benchmark (sample report only—data is not accurate!)
114 | P a g e © M e t r i c N e t , L L C w w w . m e t r i c n e t . c o m
Customer Satisfaction in Chat Channel (continued)
0.0%
10.0%
20.0%
30.0%
40.0%
50.0%
60.0%
70.0%
80.0%
90.0%
100.0%
Cust
omer
Sat
isfa
ctio
n in
Cha
t Cha
nnel
High 87.8%Average ----- 56.7%Median 54.6%Low 22.1%
Key Statistics
Customer Satisfaction in Chat Channel

SAMPLE Insourced Contact Center Benchmark (sample report only—data is not accurate!)
115 | P a g e © M e t r i c N e t , L L C w w w . m e t r i c n e t . c o m
Chat Metrics (continued)
Average Concurrent Chat Sessions
Definition: Average Concurrent Chat Sessions is the average number of chat sessions that a chat agent has open at any given time.
Why it’s important: The ability to handle concurrent chat sessions is the primary economic advantage of the chat channel.
Key correlations: Average Concurrent Chat Sessions is strongly correlated with the following metrics:
Chat First Contact Resolution Rate
% Failover Rate from Chat to Voice
Average Cost per Chat Minute
𝑨𝒗𝒆𝒓𝒂𝒈𝒆 𝑪𝒐𝒏𝒄𝒖𝒓𝒓𝒆𝒏𝒕 𝑪𝒉𝒂𝒕 𝑺𝒆𝒔𝒔𝒊𝒐𝒏𝒔 = 𝑨𝒗𝒆𝒓𝒂𝒈𝒆 𝒏𝒖𝒎𝒃𝒆𝒓 𝒐𝒇 𝒐𝒑𝒆𝒏 𝒄𝒉𝒂𝒕𝒔 𝒑𝒆𝒓 𝒂𝒈𝒆𝒏𝒕

SAMPLE Insourced Contact Center Benchmark (sample report only—data is not accurate!)
116 | P a g e © M e t r i c N e t , L L C w w w . m e t r i c n e t . c o m
Average Concurrent Chat Sessions (continued)
0.00
0.20
0.40
0.60
0.80
1.00
1.20
1.40
Aver
age
Conc
urre
nt C
hat S
essi
ons
High 1.25Average ----- 0.83Median 0.77Low 0.47
Key Statistics
Average Concurrent Chat Sessions
SAMPLE Insourced Contact Center Benchmark (sample report only—data is not accurate!)
117 | P a g e © M e t r i c N e t , L L C w w w . m e t r i c n e t . c o m
Chat Metrics (continued)
Max Concurrent Chat Sessions
Definition: Most organizations will limit the number of concurrent sessions an agent is allowed to handle. Newer agents might be limited to a single chat session at a time, while more experienced agents might be allowed to handle as many as four concurrent chat sessions.
Why it’s important: While the ability to handle concurrent chat sessions is the primary economic advantage of the chat channel, agents attempting to handle too many concurrent sessions will likely see a significant drop in Customer Satisfaction and Chat First Contact Resolution Rate, and a significant increase in % Failover Rate from Chat to Voice. It is also important to note that the agent skill set required for chat is somewhat different than that required of a voice agent. One should not automatically assume that a successful voice agent will be a successful chat agent, and vice versa.
Key correlations: Max Concurrent Chat Sessions is strongly correlated with the following metrics:
Chat First Contact Resolution Rate
% Failover Rate from Chat to Voice
Customer Satisfaction in the Chat Channel
𝑴𝒂𝒙 𝑪𝒐𝒏𝒄𝒖𝒓𝒓𝒆𝒏𝒕 𝑪𝒉𝒂𝒕 𝑺𝒆𝒔𝒔𝒊𝒐𝒏𝒔 = 𝑻𝒉𝒆 𝒎𝒂𝒙𝒊𝒎𝒖𝒎 𝒏𝒖𝒎𝒃𝒆𝒓 𝒐𝒇 𝒄𝒉𝒂𝒕
𝒔𝒆𝒔𝒔𝒊𝒐𝒏𝒔 𝒕𝒉𝒂𝒕 𝒂𝒏 𝒂𝒈𝒆𝒏𝒕 𝒊𝒔 𝒂𝒍𝒍𝒐𝒘𝒆𝒅 𝒕𝒐 𝒉𝒂𝒏𝒅𝒍𝒆 𝒄𝒐𝒏𝒄𝒖𝒓𝒓𝒆𝒏𝒕𝒍𝒚

SAMPLE Insourced Contact Center Benchmark (sample report only—data is not accurate!)
118 | P a g e © M e t r i c N e t , L L C w w w . m e t r i c n e t . c o m
Max Concurrent Chat Sessions (continued)
0.0
0.5
1.0
1.5
2.0
2.5
3.0
3.5
4.0
4.5
Max
Con
curr
ent C
hat S
essi
ons
High 4.0Average ----- 2.9Median 3.0Low 1.0
Key Statistics
Max Concurrent Chat Sessions

SAMPLE Insourced Contact Center Benchmark (sample report only—data is not accurate!)
119 | P a g e © M e t r i c N e t , L L C w w w . m e t r i c n e t . c o m
Chat Metrics (continued)
Number of Chat Sessions per Chat Agent per Month
Definition: Number of Chat Sessions per Chat Agent per Month is the average monthly chat volume divided by the average full -time equivalent (FTE) chat agent headcount. Chat agent headcount is the average FTE number of employees and contractors handling chats.
Why it’s important: Number of Chat Sessions per Chat Agent per Month is an important indicator of chat agent productivity. A low number could indicate low Agent Occupancy, poor scheduling efficiency or schedule adherence, or a higher-than-average Chat Handle Time. Conversely, a high number of chat sessions per agent may indicate high Agent Occupancy, good scheduling efficiency and schedule adherence, or a lower-than-average Chat Handle Time. Every Contact Center with a chat channel should track and trend this metric on a monthly basis.
Key correlations: Number of Chat Sessions per Chat Agent per Month is strongly correlated with the following metrics:
Chat Handle Time
Average Cost per Chat Session
Average Cost per Chat Minute
Agent Occupancy
𝑺𝒆𝒔𝒔𝒊𝒐𝒏𝒔 𝒑𝒆𝒓 𝑪𝒉𝒂𝒕 𝑨𝒈𝒆𝒏𝒕 𝒑𝒆𝒓 𝑴𝒐𝒏𝒕𝒉 =𝑻𝒐𝒕𝒂𝒍 𝒎𝒐𝒏𝒕𝒉𝒍𝒚 𝒗𝒐𝒍𝒖𝒎𝒆 𝒐𝒇 𝒄𝒉𝒂𝒕 𝒔𝒆𝒔𝒔𝒊𝒐𝒏𝒔
𝑵𝒖𝒎𝒃𝒆𝒓 𝒐𝒇 𝑭𝑻𝑬 𝒂𝒈𝒆𝒏𝒕𝒔 𝒉𝒂𝒏𝒅𝒍𝒊𝒏𝒈 𝒄𝒉𝒂𝒕𝒔

SAMPLE Insourced Contact Center Benchmark (sample report only—data is not accurate!)
120 | P a g e © M e t r i c N e t , L L C w w w . m e t r i c n e t . c o m
Number of Chat Sessions per Chat Agent per Month (continued)
0
250
500
750
1,000
1,250
1,500
1,750
2,000
2,250
Num
ber o
f Cha
t Ses
sion
s per
Cha
t Age
nt p
er M
onth
High 1,922Average ----- 371Median 270Low 109
Key Statistics
Number of Chat Sessions per Chat Agent per Month

SAMPLE Insourced Contact Center Benchmark (sample report only—data is not accurate!)
121 | P a g e © M e t r i c N e t , L L C w w w . m e t r i c n e t . c o m
Important KPI Correlations
Voice Handle Time (minutes) vs. Average Cost per Voice Contact
$0.00
$10.00
$20.00
$30.00
$40.00
$50.00
$60.00
$70.00
$80.00
$90.00
$100.00
0.00 5.00 10.00 15.00 20.00 25.00 30.00 35.00 40.00 45.00 50.00
Aver
age
Cost
per
Voi
ce C
onta
ct
Voice Handle Time (minutes)
As average handle time increases, cost per contact will increase. This is because a Contact Center is a labor-intensive function, so agent compensation represents the largest category of costs. The longer that the agents spend handling each contact, the higher the average cost per contact will be.

SAMPLE Insourced Contact Center Benchmark (sample report only—data is not accurate!)
122 | P a g e © M e t r i c N e t , L L C w w w . m e t r i c n e t . c o m
Voice Agent Utilization vs. Average Cost per Voice Minute
$0.00
$0.50
$1.00
$1.50
$2.00
$2.50
$3.00
0.0% 10.0% 20.0% 30.0% 40.0% 50.0% 60.0%
Aver
age
Cost
per
Voi
ce M
inut
e
Voice Agent Utilization
As agent utilization increases, the average cost per minute tends to decrease. Utilization is a measure of productivity. It measures how much of an agent’s time on the job is spent actually handling contacts. With higher productivity, each agent can handle a larger number of contacts , which lowers the average cost for each of those contacts.

SAMPLE Insourced Contact Center Benchmark (sample report only—data is not accurate!)
123 | P a g e © M e t r i c N e t , L L C w w w . m e t r i c n e t . c o m
Voice Agent Utilization vs. Average Speed of Answer (seconds)
0
50
100
150
200
250
300
350
0.0% 10.0% 20.0% 30.0% 40.0% 50.0% 60.0%
Aver
age
Spee
d of
Ans
wer
(sec
onds
)
Voice Agent Utilization
As Voice Agent Utilization increases, the Average Speed of Answer tends to get longer. With higher utilization, the agents are busier and are less available to answer calls quickly.

SAMPLE Insourced Contact Center Benchmark (sample report only—data is not accurate!)
124 | P a g e © M e t r i c N e t , L L C w w w . m e t r i c n e t . c o m
Voice Agent Utilization vs. Call Abandonment Rate
0.0%
5.0%
10.0%
15.0%
20.0%
25.0%
30.0%
35.0%
40.0%
45.0%
0.0% 10.0% 20.0% 30.0% 40.0% 50.0% 60.0%
Call
Aban
donm
ent R
ate
Voice Agent Utilization
As Voice Agent Utilization increases, the Call Abandonment R ate tends to increase. With higher utilization, the agents are busier and are less available to answer calls quickly, so more customers abandon their calls.

SAMPLE Insourced Contact Center Benchmark (sample report only—data is not accurate!)
125 | P a g e © M e t r i c N e t , L L C w w w . m e t r i c n e t . c o m
Average Speed of Answer (seconds) vs. Call Abandonment Rate
0.0%
5.0%
10.0%
15.0%
20.0%
25.0%
30.0%
35.0%
40.0%
45.0%
0 50 100 150 200 250 300 350
Call
Aban
donm
ent R
ate
Average Speed of Answer (seconds)
As one would expect, when the Average Speed of Answer increases, the Call Abandonment Rate tends to also increase.

SAMPLE Insourced Contact Center Benchmark (sample report only—data is not accurate!)
126 | P a g e © M e t r i c N e t , L L C w w w . m e t r i c n e t . c o m
Net First Contact Resolution Rate vs. Voice Customer Satisfaction
0.0%
10.0%
20.0%
30.0%
40.0%
50.0%
60.0%
70.0%
80.0%
90.0%
100.0%
0.0% 10.0% 20.0% 30.0% 40.0% 50.0% 60.0% 70.0% 80.0% 90.0% 100.0%
Voic
e Cu
stom
er S
atis
fact
ion
Net First Contact Resolution Rate
Net First Contact Resolution Rate is the primary driver of Customer Satisfaction. As Net FCR increases, Customer Satisfaction increases as well.

SAMPLE Insourced Contact Center Benchmark (sample report only—data is not accurate!)
127 | P a g e © M e t r i c N e t , L L C w w w . m e t r i c n e t . c o m
Chat First Contact Resolution Rate vs. Customer Satisfaction in Chat Channel
0.0%
10.0%
20.0%
30.0%
40.0%
50.0%
60.0%
70.0%
80.0%
90.0%
100.0%
0.0% 10.0% 20.0% 30.0% 40.0% 50.0% 60.0% 70.0%
Cust
omer
Sat
isfa
ctio
n in
Cha
t Cha
nnel
Chat First Contact Resolution Rate
Just as the previous chart illustrated for the voice channel, Chat First Contact Resolution Rate is correlated with Customer Satisfaction in the Chat Channel.
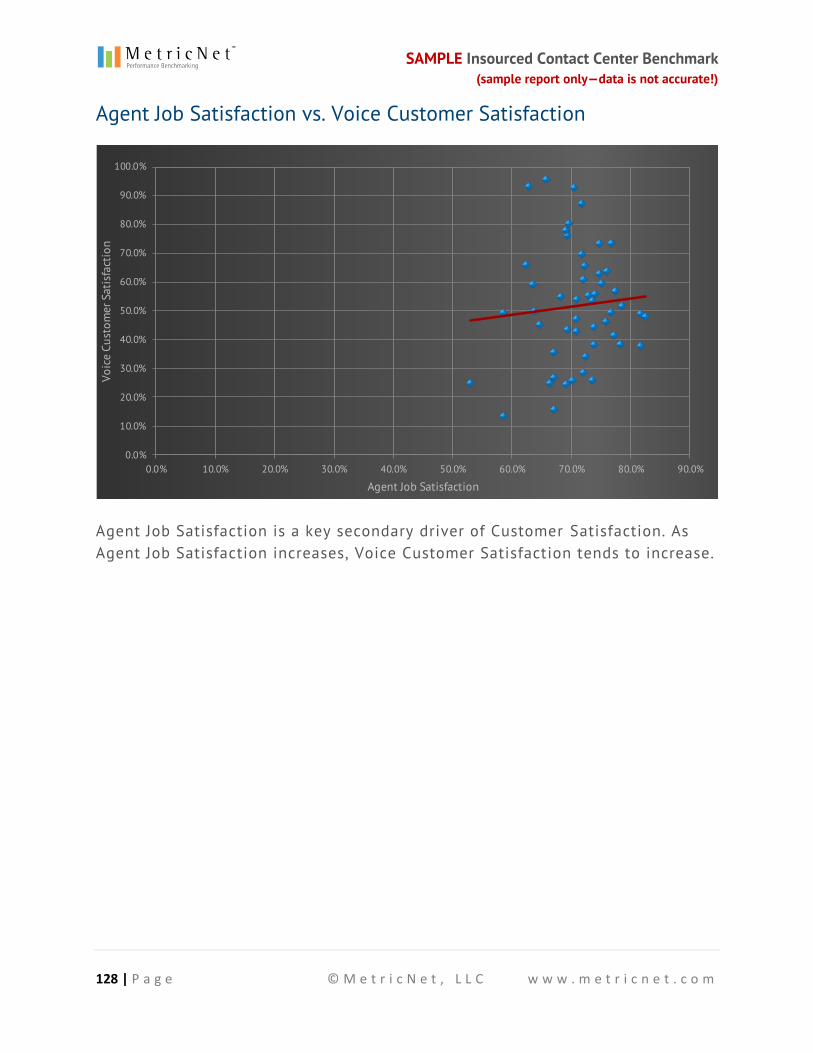
SAMPLE Insourced Contact Center Benchmark (sample report only—data is not accurate!)
128 | P a g e © M e t r i c N e t , L L C w w w . m e t r i c n e t . c o m
Agent Job Satisfaction vs. Voice Customer Satisfaction
0.0%
10.0%
20.0%
30.0%
40.0%
50.0%
60.0%
70.0%
80.0%
90.0%
100.0%
0.0% 10.0% 20.0% 30.0% 40.0% 50.0% 60.0% 70.0% 80.0% 90.0%
Voic
e Cu
stom
er S
atis
fact
ion
Agent Job Satisfaction
Agent Job Satisfaction is a key secondary driver of Customer Satisfaction. As Agent Job Satisfaction increases, Voice Customer Satisfaction tends to increase.

SAMPLE Insourced Contact Center Benchmark (sample report only—data is not accurate!)
129 | P a g e © M e t r i c N e t , L L C w w w . m e t r i c n e t . c o m
New Agent Training Hours vs. Agent Job Satisfaction
50.0%
55.0%
60.0%
65.0%
70.0%
75.0%
80.0%
85.0%
0 50 100 150 200 250 300
Agen
t Job
Sat
isfa
ctio
n
New Agent Training Hours
New Agent Training Hours are an important driver of Agent Job Satisfaction. Higher levels of initial training are correlated with higher levels of job satisfaction.

SAMPLE Insourced Contact Center Benchmark (sample report only—data is not accurate!)
130 | P a g e © M e t r i c N e t , L L C w w w . m e t r i c n e t . c o m
Annual Agent Training Hours vs. Agent Job Satisfaction
50.0%
55.0%
60.0%
65.0%
70.0%
75.0%
80.0%
85.0%
0 5 10 15 20 25 30 35 40 45 50
Agen
t Job
Sat
isfa
ctio
n
Annual Agent Training Hours
Annual Agent Training Hours also drive Agent Job Satisfaction. Higher levels of ongoing training are correlated with higher levels of job satisfaction.

SAMPLE Insourced Contact Center Benchmark (sample report only—data is not accurate!)
131 | P a g e © M e t r i c N e t , L L C w w w . m e t r i c n e t . c o m
New Agent Training Hours vs. Net First Contact Resolution Rate
0.0%
10.0%
20.0%
30.0%
40.0%
50.0%
60.0%
70.0%
80.0%
0 50 100 150 200 250 300
Net F
irst C
onta
ct R
esol
utio
n Ra
te
New Agent Training Hours
As New Agent Training Hours increase, agents are better prepared to resolve contacts, so the Net First Contact Resolution Rate also increases.

SAMPLE Insourced Contact Center Benchmark (sample report only—data is not accurate!)
132 | P a g e © M e t r i c N e t , L L C w w w . m e t r i c n e t . c o m
Annual Agent Training Hours vs. Net First Contact Resolution Rate
0.0%
10.0%
20.0%
30.0%
40.0%
50.0%
60.0%
70.0%
80.0%
0 5 10 15 20 25 30 35 40 45 50
Net F
irst C
onta
ct R
esol
utio
n Ra
te
Annual Agent Training Hours
As Annual Agent Training Hours increase, agents are better prepared to resolve contacts, so the Net First Contact Resolution Rate also increases.
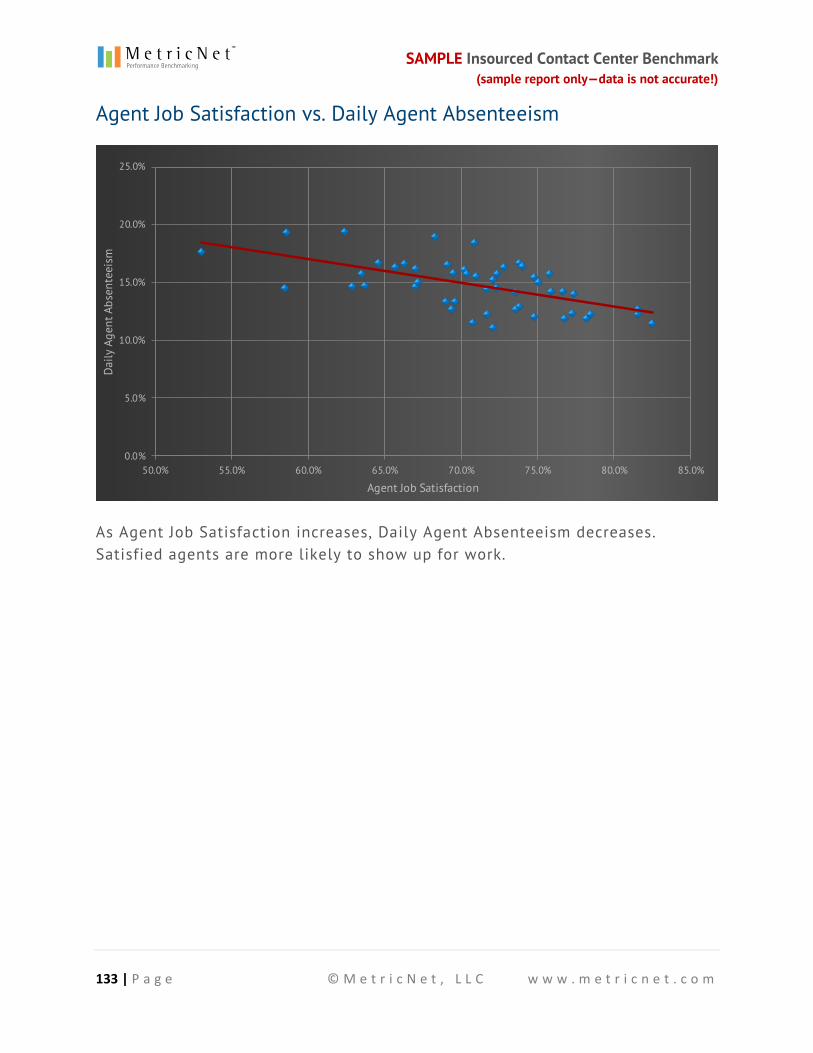
SAMPLE Insourced Contact Center Benchmark (sample report only—data is not accurate!)
133 | P a g e © M e t r i c N e t , L L C w w w . m e t r i c n e t . c o m
Agent Job Satisfaction vs. Daily Agent Absenteeism
0.0%
5.0%
10.0%
15.0%
20.0%
25.0%
50.0% 55.0% 60.0% 65.0% 70.0% 75.0% 80.0% 85.0%
Daily
Age
nt A
bsen
teei
sm
Agent Job Satisfaction
As Agent Job Satisfaction increases, Daily Agent Absenteeism decreases. Satisfied agents are more likely to show up for work.

SAMPLE Insourced Contact Center Benchmark (sample report only—data is not accurate!)
134 | P a g e © M e t r i c N e t , L L C w w w . m e t r i c n e t . c o m
Agent Job Satisfaction vs. Annual Agent Turnover
0.0%
20.0%
40.0%
60.0%
80.0%
100.0%
120.0%
50.0% 55.0% 60.0% 65.0% 70.0% 75.0% 80.0% 85.0%
Annu
al A
gent
Tur
nove
r
Agent Job Satisfaction
As Agent Job Satisfaction increases, Annual Agent Turnover decreases. Satisfied agents tend to stay in the Contact Center longer.

SAMPLE Insourced Contact Center Benchmark (sample report only—data is not accurate!)
135 | P a g e © M e t r i c N e t , L L C w w w . m e t r i c n e t . c o m
About MetricNet
MetricNet, LLC is the leading source of benchmarks, scorecards, and performance metrics for Information Technology and Contact Center Professionals worldwide. Our mission is to provide you with the benchmarks you need to run your business more effectively.
MetricNet has pioneered a number of innovative techniques to ensure that you receive fast, accurate benchmarks, with a minimum of time and effort.
In addition to our industry benchmarks , such as this report, MetricNet also offers:
The One Year Path to World-Class Performance , a continuous Contact Center
improvement program.
Benchmarking data files for those who wish to conduct their own
benchmarking analysis.
Comprehensive peer group benchmarks that compare your performance to
others in your vertical market.
Free Resources
Every month, MetricNet presents a live train ing webcast. Thousands of professionals attend each year and many of our clients have their entire teams attend. These events are a great way to boost Annual Agent Training Hours! Topics include Service Desk Best Practices and KPIs, Desktop Support Best Practices and KPIs, Contact Center Best Practices and KPIs , and more. Sign up for our Free Webcasts .
We also have developed an extensive resource library filled with free training materials for Information Technology and Contact Center professionals. Each resource is available to download in PDF format. Browse our resource library .