@salesforce State of IT 2016
39
Digital transformation insights from over 2,200 IT leaders and CIOs research State of IT 2016
-
Upload
cxo-community -
Category
Business
-
view
31 -
download
0
Transcript of @salesforce State of IT 2016

Digital transformation insights from over 2,200 IT leaders and CIOs
research
State of IT2016
2State of IT
751
250
752
502
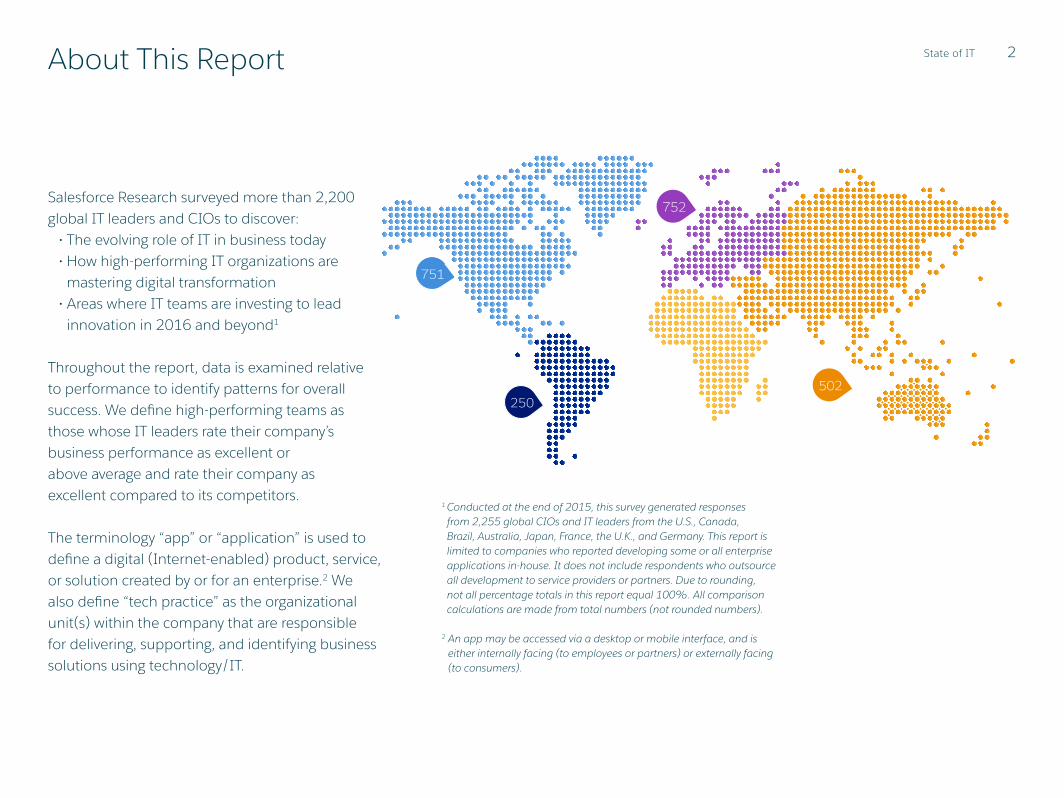
Salesforce Research surveyed more than 2,200 global IT leaders and CIOs to discover:
• The evolving role of IT in business today• How high-performing IT organizations are
mastering digital transformation • Areas where IT teams are investing to lead
innovation in 2016 and beyond1
Throughout the report, data is examined relative to performance to identify patterns for overall success. We define high-performing teams as those whose IT leaders rate their company’s business performance as excellent or above average and rate their company as excellent compared to its competitors.
The terminology “app” or “application” is used to define a digital (Internet-enabled) product, service, or solution created by or for an enterprise.2 We also define “tech practice” as the organizational unit(s) within the company that are responsible for delivering, supporting, and identifying business solutions using technology/IT.
About This Report
1 Conducted at the end of 2015, this survey generated responses from 2,255 global CIOs and IT leaders from the U.S., Canada, Brazil, Australia, Japan, France, the U.K., and Germany. This report is limited to companies who reported developing some or all enterprise applications in-house. It does not include respondents who outsource all development to service providers or partners. Due to rounding, not all percentage totals in this report equal 100%. All comparison calculations are made from total numbers (not rounded numbers).
2 An app may be accessed via a desktop or mobile interface, and is either internally facing (to employees or partners) or externally facing (to consumers).

3State of IT
Executive Summary . . . . . . . . . . . . . . . . . . . . . . . . . . . . . . . . . . . . . . . . . . . . . . . . . . . . . . . . . . . . . . . . . . 4
Introduction . . . . . . . . . . . . . . . . . . . . . . . . . . . . . . . . . . . . . . . . . . . . . . . . . . . . . . . . . . . . . . . . . . . . . . . . 5
Strategy Under Siege: Digital Shakes Up Traditional IT . . . . . . . . . . . . . . . . . . . . . . . . . . . . . . . . . . . . 8
The Skills Gap Widens: IT Leaders Bank on Training and Tools . . . . . . . . . . . . . . . . . . . . . . . . . . . . 11
Technology Shifts: The Cloud and Emerging Tech Lead the Way . . . . . . . . . . . . . . . . . . . . . . . . . . 15
Last Look: Innovation without Boundaries . . . . . . . . . . . . . . . . . . . . . . . . . . . . . . . . . . . . . . . . . . . . . 20
Appendices . . . . . . . . . . . . . . . . . . . . . . . . . . . . . . . . . . . . . . . . . . . . . . . . . . . . . . . . . . . . . . . . . . . . . . . . 21
Table of Contents
Salesforce Research provides data-driven insights to help businesses transform how they drive customer success. Browse all reports at salesforce.com/research.

4State of IT 4
IT has come a long way since the days
of operating solely as a support arm
for the business. Today’s IT teams are
leaping to the forefront of company
strategy by leading innovation to stay
ahead of the digital era and evolving
customer expectations.
With new expectations comes a
fundamental change in the way
leadership views, structures, and
runs IT organizations. In this report,
we examine these shifts across three
key areas — business strategy, people,
and technology.
Strategy Under Siege: Digital Shakes Up Traditional IT(see page 8)
IT leaders are reshaping how they operate. Successful IT teams must now
be proactive, aligned with customer needs, and on top of digital trends like
mobile. This shift is most visible in the rise of the chief digital officer, a position
that has emerged to address the need for a digitally driven, innovative, and
customer-focused leadership role in IT. Sixty percent of companies currently
employ a chief digital officer.
01
The Skills Gap Widens: IT Leaders Bank on Training and Tools(see page 11)
As customer and employee expectations change, so do the necessary skills and
talents needed to exceed them. There is a widening skills gap between demand
and talent, compounded by changing budget needs. Four out of the top 10 pain
points that IT leaders face are related to the skills gap. Successful companies
are using training and better tools to bridge the divide.
02
Technology Shifts: The Cloud and Emerging Tech Lead the Way(see page 15)
Training and tools are a part of the approach to closing the skills gap — the other
part is the technology itself. IT leaders are leveraging new tech solutions to manage
the back end while freeing up their teams to focus on innovation and delivering
business results. IT leaders across all performance levels list cloud migration
as their top priority.
03
Executive Summary State of IT

5State of IT
The way people interact with the companies around them has dramatically changed. Customers and employees alike have grown to expect companies to deliver easy, personalized, and on-demand experiences that evolve along with their needs.
As businesses rush to keep up with the changing market, IT’s scope of responsibility is rapidly expanding. Beyond managing technical operations, IT teams are becoming increasingly central to every facet of the business.
of IT teams are currently developing apps for
customers, partners, and employees.
App Development Scope Expands for IT TeamsApp development is central to IT strategy. Here is the breakdown of apps currently being developed, by type.
25%
42%
34%
Customer/commercial apps Partner-productivity apps
Employee-productivity apps
IntroductionToday’s IT: The Business of Innovation
79%

6State of IT
While IT’s impact has grown well beyond “keeping the lights on,” teams still need to maintain core operations. IT leaders are expected to deliver on cutting-edge, customer-driven applications on top of everyday functions. Key business needs such as worker productivity, data visibility, and automating business processes still top the charts as the building blocks for growth.
Core IT Stays in FocusIT leaders are expected to innovate on customer-facing apps while still delivering on typical internal needs. Here we see the top outcomes that IT teams strive to achieve; centered around solving core needs such as worker productivity, data visibility, and process automation.
“At the end of the day, Brown-Forman sells and markets spirits and wine. That’s what we do. If we can use our IT dollars to assist that work in any
way possible, rather than just keeping the lights on, we should continue to do so.” — Toby Lester, VP of Technology Architecture & Innovation
55%increase worker
productivity
47%increase data visibility
across the business
42%automate business
processes
IntroductionToday’s IT: The Business of Innovation
IT LEADER perspective

7State of IT
Digital Trends Redefine IT InvestmentsIT leaders are becoming more focused on innovative, digitally driven tech and the security that goes along with it. The top three areas for increased spending are mobile apps, cloud migration, and cybersecurity/incident response.
Despite IT’s shift to a strategic business driver, budgets have not kept pace with the demand. Across teams at all performance levels, budget is consistently cited as the number one pain point.
Sixty-eight percent of IT teams report spending more on mobile apps, cloud migration, and cybersecurity/incident response over the next two years. At the same time, 63% plan to increase spending in customer-facing apps. Here are the top five investment areas.*
IntroductionToday’s IT: The Business of Innovation
Mobile applications68%
Cybersecurity, incident response68%
Cloud migration (storage, compute)68%
Customer-facing apps63%
Productivity applications62%
Percentage Increasing Spending over the Next 2 Years
* This chart shows only the top five. For the complete list, see page 24.

8State of IT
High performers Moderate performers Underperformers
Top IT Teams Embrace Digital and Tech TrendsHigh performers are 3.7x more likely than underperformers to say they are excellent or above average at staying ahead of technology trends. They are also 4.2x more likely to say the same about implementing digital transformation across their company.
The radical shift in the way IT operates within a company — acting as innovation leaders and digital experts — has forced leadership to rethink their IT strategies. The most successful IT teams are pushing the envelope and planning for customer-facing app development as consumers grow to expect modern and mobile technology.
Top teams in the digital age are not afraid to take risks — they are actively testing, adopting, and mastering new technologies as they emerge.
Ability to stay ahead of technology trends
95%
26%70%
Ability to implement digital transformation across their company
91%
22%75%
Ability to digitally engage at scale
91%
19%73%
High Performers vs. Underperformers
Percentage Rating Their Ability as Excellent or above Average
3.7xmore likely to excel at staying ahead of tech
trends
4.2xmore likely to excel at implementing digital
transformation
4.8xmore likely to excel at digitally engaging at
scale
Strategy Under Siege:Digital Shakes Up Traditional IT01

9State of IT
Moderate performers
Underperformers
High performersHigh performers
Underperformers
Moderate performers
10%
40%60%
70%30%
20%
50%
10%
40%60%
70%30%
20%
50%
Top Teams Double Down on Customer and Mobile App SpendingCustomer needs and mobile access are becoming central to IT apps. Seventy-six percent of high-performing IT teams report increasing spending in customer-facing and mobile apps.
The movement toward a more customer-centric mindset in IT is reflected in spending, particularly among high performers. Top companies are accelerating their plans to meet the demands of mobile and connected customers.
Nearly 90% of new apps launching in the next 12–18 months will be created with a mobile-first mindset.
Customer-Facing Applications Mobile Applications
High Performers vs. Underperformers High Performers vs. Underperformers
42%
76%
66%54%
76%
71%
1.8x more likely to be increasing spending in customer-facing apps 1.4x more likely to be increasing
spending in mobile apps
Strategy Under Siege:Digital Shakes Up Traditional IT01
Percentage of IT Leaders Planning to Increase Spend over the Next 2 Years

10State of IT
The Age of the Chief Digital OfficerSixty percent of companies surveyed already employ a chief digital officer — a leadership role that was scarcely heard of a decade ago.
A new emphasis on the customer and digital trends brings the need for new perspectives and skill sets. CIOs now need to be visionaries for not just their departments, but the company as a whole. A recent role, the chief digital officer (CDO), has become a must-have in many organizations. CDOs usually have a marketing background, consumer knowledge, and a hyperfocus on digital trends. The role has become more prominent as employees and customers alike expect consumer-friendly tech. In fact, 60% of companies currently employ a chief digital officer.
“Any company that doesn’t use technology to redefine themselves and keep up with the times is bound to go obsolete. One sign of that is the
growing blurring of the distinction between the CMO and the CIO. Any IT leader today has to be able to straddle that divide and be able to talk the
business language, and vice versa.” — Sineesh Keshav, VP of IT Application Development
60%of companies currently
employ a chief digital officer
Strategy Under Siege:Digital Shakes Up Traditional IT01
IT LEADER perspective
11State of IT
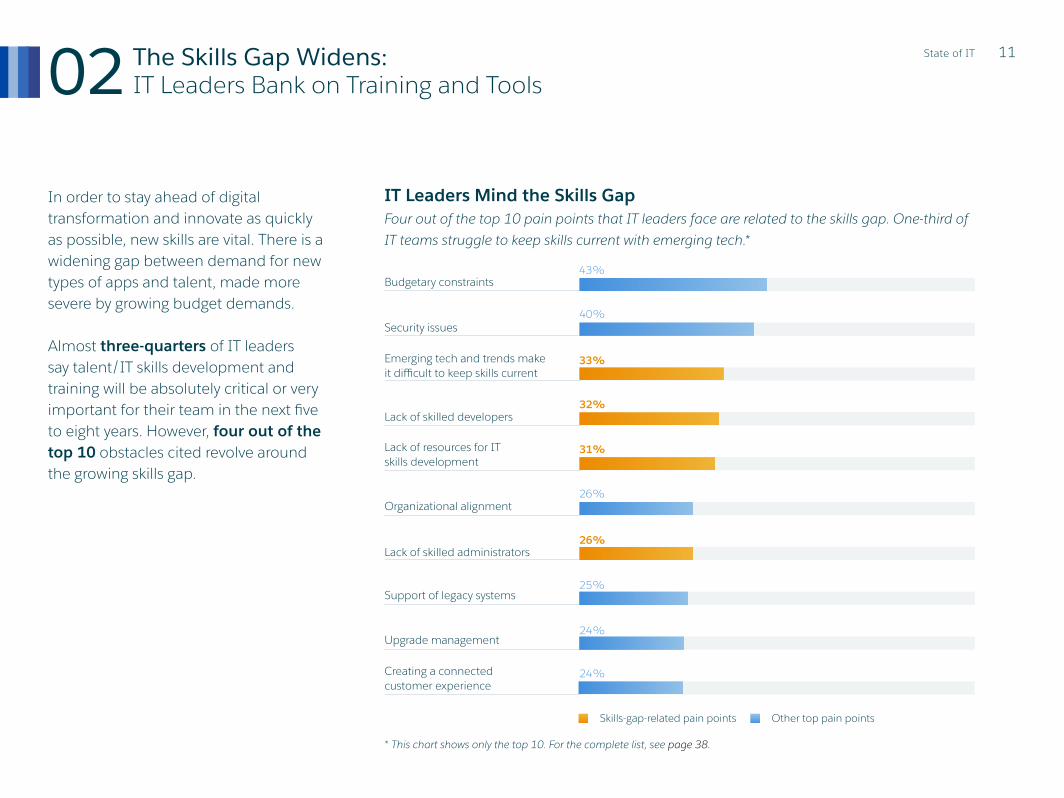
In order to stay ahead of digital transformation and innovate as quickly as possible, new skills are vital. There is a widening gap between demand for new types of apps and talent, made more severe by growing budget demands.
Almost three-quarters of IT leaders say talent/IT skills development and training will be absolutely critical or very important for their team in the next five to eight years. However, four out of the top 10 obstacles cited revolve around the growing skills gap.
The Skills Gap Widens:IT Leaders Bank on Training and Tools02
Budgetary constraints
Organizational alignment
Emerging tech and trends make it difficult to keep skills current
Support of legacy systems
Security issues
Lack of skilled administrators
Lack of skilled developers
Upgrade management
Lack of resources for IT skills development
Creating a connected customer experience
IT Leaders Mind the Skills Gap Four out of the top 10 pain points that IT leaders face are related to the skills gap. One-third of IT teams struggle to keep skills current with emerging tech.*
43%
26%
33%
25%
40%
26%
32%
24%
31%
24%
* This chart shows only the top 10. For the complete list, see page 38.
Skills-gap-related pain points Other top pain points

12State of IT
The Race to Create Causes the Skills Gap to WidenThe top three areas where companies report a needed-skills gap are data engineering, IT security, and app development.
As companies race to keep up with app demand and innovate on advancing technologies, the need for talent increases. More than half of IT leaders are experiencing a skills gap in data engineering, IT security, and application development.
Application development
IT security
Data engineering56%
51%
52%
“As we continue to grow fast, we need to drive efficiency, scalability, and sustainability. But as the saying goes, ‘The cobbler’s children have no shoes.’
Like many technology companies, however fast we recruit engineers, there is an endless backlog of customer- and production-facing projects that take
priority over developing new internal business applications. ... So after suffering this resourcing challenge for many years, we finally accepted that it would
never change — we needed an alternative approach.” — Paul Clarke, Director of Technology
The Skills Gap Widens:IT Leaders Bank on Training and Tools02
Percentage Citing a Needed-Skills Gap
IT LEADER perspective

13State of IT
Top Performers Are Prioritizing Training and Development Training and development have become a main focus as IT leaders work to close the skills gap. Ninety-six percent of high performers invest in training for technical staff.
IT leaders understand the importance of ramping up training and development as they work to close the skills gap. Eighty percent of IT leaders say their company’s leadership cares about training and development for technical staff — and many are demonstrating that with increased investments.
Top performers are raising the stakes by ramping up their training budgets. Meanwhile, only 55% of underperformers are investing in training and development.
of underperforming teams say they aren’t
currently addressing the IT skills gap at all.
96%
90%
The Skills Gap Widens:IT Leaders Bank on Training and Tools02
55%
High performers
Moderate performers
Underperformers
Percentage Investing in Training for Technical Staff
19%

14State of IT
“When we first launched our cloud
strategy, we had a buzzword that said
‘SaaS first, cloud first,’ and I think
that actually scared a lot of people.
So we took a step back and tried a
little different approach to educate
people and show them how many of
their skills are very transportable to
a cloud environment. There’s a lot of
new cool stuff they can learn. We’ve
had lunch and learns, breakfast
workshops, and actually launched
some training called Cloud 101 to
teach what cloud was and what
cloud wasn’t. Today, NetApp IT as
an organization has truly embraced
the cloud.”
— Cynthia Stoddard, CIO & SVP
Top Performers Feel Valued by Leadership
High performers are 4.3x more likely than underperformers to strongly agree that leadership places a
high value on the tech practice.
It’s important that leadership champions training and development for IT efforts to be successful. Sixty-six percent of high performers strongly agree they feel valued by their leadership, while only 15% of underperformers feel the same.
14State of ITSpotlightLeadership Support Inspires Success
High Performers vs.Underperformers
4.3xmore likely to strongly
agree leadership highly values the tech practice
40%60%
30%
20%
50%
10%High performers
Moderate performers
Underperformers
66%
43%
15%
IT LEADER perspective

15State of ITTechnology Shifts: The Cloud and Emerging Tech Lead the Way03
Speed Wins the Race: Top Performers Develop Apps Faster Seventy-two percent of high-performing companies can develop an app in three months or less, while only 46% of underperformers can do the same. Here we see the difference in app development time as divided by performance level.
IT teams need to move faster than ever to propel their business into the digital era. Training and development are only part of the skills-gap story.
Embracing new technologies is an equally important aspect of accelerating innovation. The strengthening of the cloud and emergence of rapid app development platforms, for example, are enabling successful IT teams to free up talent for business transformation.
Underperformers
Moderate performers
High performers
72%
65%
46%
17%
21%
30%
12%
14%
24%
3 months or less 4–6 months 7+ months

16State of IT
Complexity Grows as Integrations Multiply Two-thirds of IT leaders say they are integrating with 11 or more systems. As the complexity of integrations increase, cloud migration becomes a priority for tech practices.
While IT teams strive to increase their pace, the proliferation of apps and integrations can be a bump in the road. Nearly one-third of IT leaders say their tech practice supports between 11 and 50 apps. Beyond that, two-thirds of teams are integrating with 11 or more systems.
As app development becomes more rigorous and integrations become more complex, companies are using the cloud to support fast-paced development. Nearly two-thirds (63%) of companies who operate in the cloud can develop an app in three months or less.
of those developing in the cloud say they are
working primarily on projects that will transform their business.
Technology Shifts: The Cloud and Emerging Tech Lead the Way03
26%1–10 integrations
36%11–25 integrations
37% More than
25 integrations
80%

17State of IT
Cloud Migration Is the Top Priority for IT LeadersIT leaders list cloud migration as their top priority. Seventy percent rated cloud migration as absolutely critical or very important over the next five to eight years.
Since deploying in the cloud can relieve large staffing needs — allowing for faster innovation — companies are making cloud migration a priority. Nearly two-thirds of companies that operate in the cloud rate their ability to digitally scale as above average. Cloud services allow companies to off-load data management, operating system development, and even design, so they can produce higher-quality apps as fast as consumers expect them.
of cloud-enabled companies say their
executive team is leading the business in a digital transformation.
Rated Absolutely Critical/Very Important over the Next 5–8 Years
67%44%
Big data/data warehousing
64%37%Data localization, archival,
and retention
72%46%Talent/IT skills development
and training
70%47%
Cloud migration
69%44%
Disaster recovery/high availability
60%34%
Predictive analytics
58%35%
Internet of Things (IoT)
69%45%
Cloud access security brokers/tech
63%39%
Software as a service (SaaS)
66%43%
Mobile device management
Top-Ranked Priorities over the Next 2 Years*
* This chart shows only the top 10. For the complete list, see page 35.
Technology Shifts: The Cloud and Emerging Tech Lead the Way03
73%

18State of IT
High Performers vs.Underperformers
1.9xmore likely to trust
storing core infrastructure data on a public cloud
40%60%
30%
20%
50%
10%
Top Teams Rely on the CloudTop-performing IT leaders trust cloud services to bolster security while their teams focus on innovating with engaging apps. Seventy-two percent of high performers trust storing core infrastructure data on a public cloud, which is 1.9x more than underperformers.
Security is a key part of infrastructure that IT teams once had to develop and manage in-house. It’s difficult to evolve security with the ever-changing technology climate, especially as the number of systems that need to be integrated multiply.
As a result, IT leaders are looking for solutions to innovate as quickly and securely as possible. With the growth of cloud services, IT teams can now build on top of platforms or infrastructure with established, secure foundations, and plan for evolution as technology changes.
Technology Shifts: The Cloud and Emerging Tech Lead the Way03
37%
61%
72%
Percentage Who Trust Storing Core Infrastructure Data in the Cloud
Underperformers
High performers
Moderate performers
70%

19State of IT
Use an Agile development methodology
Use packaged commercial software
Use a component-driven framework to quickly build apps
79%
96%Use custom software with a microservices architecture
85%
Emerging Tech Fuels Digital Innovation StrategyMicroservices (96%), component-driven framework (93%), and future-proof backward-compatible dev methodology (91%) are the top three areas of IT growth across architectural and development strategy.
Beyond the cloud, microservice architecture and component-driven frameworks are two top areas where IT teams are investing to develop faster and more securely. These emerging technologies provide a foundation for IT developers to build upon, removing the burden of building from scratch and freeing up their development time.
87%
93%
Apply future-proof backward-compatible dev methodology
91%
Use continuous delivery/continuous integration practice
Architectural Strategy
Development Strategy
Technology Shifts: The Cloud and Emerging Tech Lead the Way03
Percentage of Anticipated Growth in Strategy Areas

20State of IT
IT is evolving to meet the demands of the digital era by creating customer-facing and employee apps that are easy to use, efficient, and mobile. Growing responsibilities and needs have caused a widening skills gap. Successful companies are overcoming this gap with the cloud and emerging tech, allowing them to innovate faster and without boundaries. Here’s how IT teams today can start shifting in order to succeed tomorrow.
01 | Rethink Traditional Organizations
IT today is all about the business and the people
who drive it. This means new skills, new roles, and
new mindsets for your teams.
03 | Invest in Training and Development
The best way to beat the widening skills gap is with
education. Once your employees are empowered to
use cloud and emerging tech, innovation can follow.
05 | Embrace Emerging Tech
Technology is always in motion. Today, mobile and
cloud are impacting the business — tomorrow may
be something else. Successful IT teams stay ahead
of trends by being early tech adopters.
02 | Think Customer- and Mobile-First
The shift to a people-first mindset means mobile-
first. Your customers are expecting intuitive apps
that work on their most convenient devices.
04 | Migrate to the Cloud
Consumer demands are growing faster than
even most experts can track. Relieve infrastructure
development and management with trusted cloud
services so your team can focus on innovation.
20State of ITLast LookInnovation without Boundaries

21State of ITAppendix A: App Deployment
35%
65%
of tech practices use one app deployment model.
of tech practices use a hybrid approach that includes any combination of on-premises, private cloud, and public cloud services.
19%On-premises
9%Private cloud
6%Public cloud
One-quarter of tech practices use more than two app deployment models. Here we see the percentage of tech practices using various deployment models.
Nearly two-thirds of all respondents (65%) use a hybrid approach. Here we see the percentage of companies using each app deployment model (hybrid includes any combination of on-premises, private cloud, or public cloud) by performance level.
Cloud native (public or private) On-premises
High performers 72%
Moderate performers 68%
Underperformers 52%
Hybrid
12%
17%
18%
17%
16%
29%

22State of ITAppendix A: App Deployment
High performers are 1.9x more likely than underperformers to deploy major releases at least once a month. Here we see the frequency at which tech practices deploy major releases by performance level.
At least once a week
At least twice a year
Once or twice a month
At least once a year
At least every 2–3 months
Less than once a year
At least 4 times a year
Don’t know/unsure
High performers
39%
29%
18%
7%
29%
32%
18%
9%8%
9%
26%
18%
10%
12%
8%7%10%
Moderate performers Underperformers
Companies using a hybrid approach to app deployment spend less time developing a new app than those who use on-premises-only. Here we see the length of time it takes to develop an app by deployment model.
1–4 weeks 1–3 months 4+ months
Hybrid
Cloud native (public or private)
On-premises
32% 36%
31% 43%
32% 43%
26%
26%
32%

23State of ITAppendix B: IT Spend
Three-quarters of IT leaders plan to increase overall IT spending. Here we see how IT leaders plan to allocate budget over the next two years.
Increase Stay the same Decrease
Total IT budget 75% 21% 4%
Security budget 73% 24% 3%
Total digital budget 72% 25% 4%
IT headcount 60% 35% 6%

24State of IT
Appendix B: IT Spend
IT leaders plan to increase their spending the most for mobile applications, cloud migration, and cybersecurity/incident response. Here we see how IT leaders will allocate budget over the next two years across all technologies and practices.
Increase Stay the same Decrease
Mobile applications 68% 28% 3%
Cloud migration 68% 28% 4%
Cybersecurity/incident response 68% 29% 3%
Customer-facing digital apps 63% 33% 4%
Productivity applications 62% 34% 4%
Software as a service (SaaS) 61% 36% 4%
Analytics platform/capabilities 57% 39% 4%
Agile app development and tools 56% 41% 3%
Disaster recovery/business continuity planning 56% 40% 5%
Core infrastructure design (IaaS) 55% 41% 4%
Upgrade/decommission legacy systems 55% 38% 7%
Platform as a service (PaaS) 54% 42% 5%
Compliance 53% 41% 5%
Mobile backend as a service (MBaaS) 53% 42% 5%
On-premises infrastructure 53% 39% 9%
Ecosystem integration/interoperability 50% 45% 5%
App rationalization/footprint reduction 49% 45% 6%

25State of ITAppendix B: IT Spend
Moderate performers Underperformers
Cloud migration 78%
Mobile applications
Customer-facing digital apps
Cybersecurity, incident response
Productivity applications
Software as a service (SaaS)
Analytics platform/capabilities
Disaster recovery/biz continuity planning
Core infrastructure design (IaaS)
Agile app development and tools
On-premises infrastructure
Mobile backend as a service (MBaaS)
Upgrade/decommission legacy systems
Ecosystem integration/interoperability
Platform as a service (PaaS)
App rationalization/footprint reduction
Compliance
High performers are 2.1x more likely than underperformers to increase their spending on platform as a service (PaaS) and mobile backend as a service (MBaaS). Here we see how IT leaders plan to increase their spending over the next two years across technologies and practices.
70% 53%
76% 71% 54%
76% 66% 42%
76% 70% 54%
75% 66% 41%
74% 63% 41%
73% 59% 36%
72% 57% 37%
71% 58% 32%
70% 59% 35%
69% 58% 26%
68% 55% 33%
68% 57% 36%
67% 52% 25%
67% 56% 33%
66% 50% 28%
65% 55% 39%
High performers
1.5x
1.4x
1.8x
1.4x
1.9x
1.8x
2.0x
2.0x
2.2x
2.0x
2.7x
2.1x
1.9x
2.7x
2.1x
2.4x
1.7x
High performers vs. underperformers
Percentage of IT Leaders Planning to Increase Their Spending over the Next 2 Years

26State of ITAppendix C: Tech Leadership’s View of IT
High performers say senior leadership is committed to the tech practice. Here we see those who strongly agree or agree with various statements about the role of senior leadership.
High performers
Moderate performers
Underperformers
Places a high value on the tech practice
Cares about training and development for technical staff
Is leading the business in digital transformation
Encourages innovative ideas and feedback from team members
Views the tech practice as a strategic partner
Communicates a shared sense of purpose
Uses monitoring tools/analytics to make strategic business decisions
Does a good job of tying strategic business objectives to dev work
Has a deep understanding of the tech practice’s business value
Actively engages business stakeholders to stay close to the business
Cares about the team’s work-life balance
Aligns tech metrics with organizational goals
Supports experimentation and failure to improve the tech practice
Has a talent development/pipeline strategy
Is reinventing the business for next-gen digital
Percentage Who Strongly Agree or Agree with the Following Statements about Their Leadership
75%
91%
88%
96%92%
61%94%
85%57%
90%81%
47%
81%56%
91%81%
55%
80%57%
89%79%
52%90%
80%48%
89%79%
51%87%
77%50%
88%76%
52%86%
77%45%
86%
49%87%
75%41%
87%74%
41%
89%74%
43%Are recognized as experts in the tech practice

27State of IT
86%49%
82%56%
82%71%
82%60%
77%46%
77%53%
79%49%
81%55%
80%51%
72%36%
80%58%
77%50%
74%56%
75%42%
71%44%
77%52%
75%50%
72%41%
Appendix C: Tech Leadership’s View of IT
High performers are 2.4x more likely than underperformers to drive process improvements by limiting work in process. Here we see the percentage who strongly agree or agree with the following statements about the tech practice by performance level.
High performers
Moderate performers
Underperformers
Manages smaller, more frequent deployments
Primarily works on projects that will transform the business94%
Helps the business better connect with customers92%
Primarily works on projects that will sustain the business91%
Understands how work ties into company’s business strategy91%
Allocates budget/resources toward connected products91%
Leverages reusable components/building blocks to create efficiency90%
Automates deployment steps, where possible90%
Aligns projects with company business strategy90%
Continuously integrates/finds ways to improve tech practice90%
Drives process improvement by limiting work in process (WIP)88%
Implements version control in production environment88%
Regularly reviews metrics and takes action to improve87%
86%
Creates common build mechanisms across all environments86%
Uses automated code testing85%
Uses a standard code configuration management tool85%
Uses visual displays to monitor quality, productivity, work status85%
Uses automated testing across all environments (dev, test, prod)84%
Percentage Who Strongly Agree or Agree with the Following Statements

28State of IT
Make innovation a business differentiator
Increase data visibility across the business
Automate business processes
Appendix D: Tech Practice’s View of IT
Tech practices are looking to increase worker productivity and data visibility across the business. Here we see which outcomes are top of mind for the tech practice.
High performers Moderate performers Underperformers
Increase worker productivity 55% 52% 56% 58%
Increase data visibility across the business 47% 50% 49% 40%
Automate business processes 42% 42% 43% 42%
Innovation as a business differentiator 40% 45% 42% 31%
Drive mobile adoption and productivity 39% 44% 40% 32%
Leverage emerging technologies 36% 41% 37% 28%
Provide a single view of customer data 36% 38% 36% 32%
Innovation as an industry disruptor 26% 36% 27% 15%
1 2
High performersIncrease data visibility
across the business
Moderate performersIncrease data visibility
across the business
UnderperformersAutomate business
processes
Increase worker productivity
Increase worker productivity
Increase worker productivity
Increasing worker productivity is a top business outcome across all performance levels. Here we see the top three outcomes by performance level.
3

29State of ITAppendix D: Tech Practice’s View of IT
IT leaders are investing in emerging tech to support rapid app development and innovation. Here are the top areas of IT growth across architectural strategy, development strategy, and development tools.
High performers Moderate performers Underperformers
Use custom software with a microservices architecture57%
44%24%
Use continuous delivery/continuous integration practice63%
49%34%
Check code changes into a source control trunk every day61%
50%31%
Use a component-driven framework to quickly build apps56%
49%28%
Use packaged commercial software57%
49%35%
Test most code without a complex, integrated environment57%
49%31%
Apply future-proof backward-compatible dev methodology60%
48%29%
Deploy apps independent of apps/services it relies on61%
48%28%
Use an Agile development methodology59%
46%31%
Use a browser-based IDE for development55%
43%28%
Architectural Strategy
Development Strategy
Development Tools
Percentage of Anticipated Growth
30State of ITAppendix D: Tech Practice’s View of IT
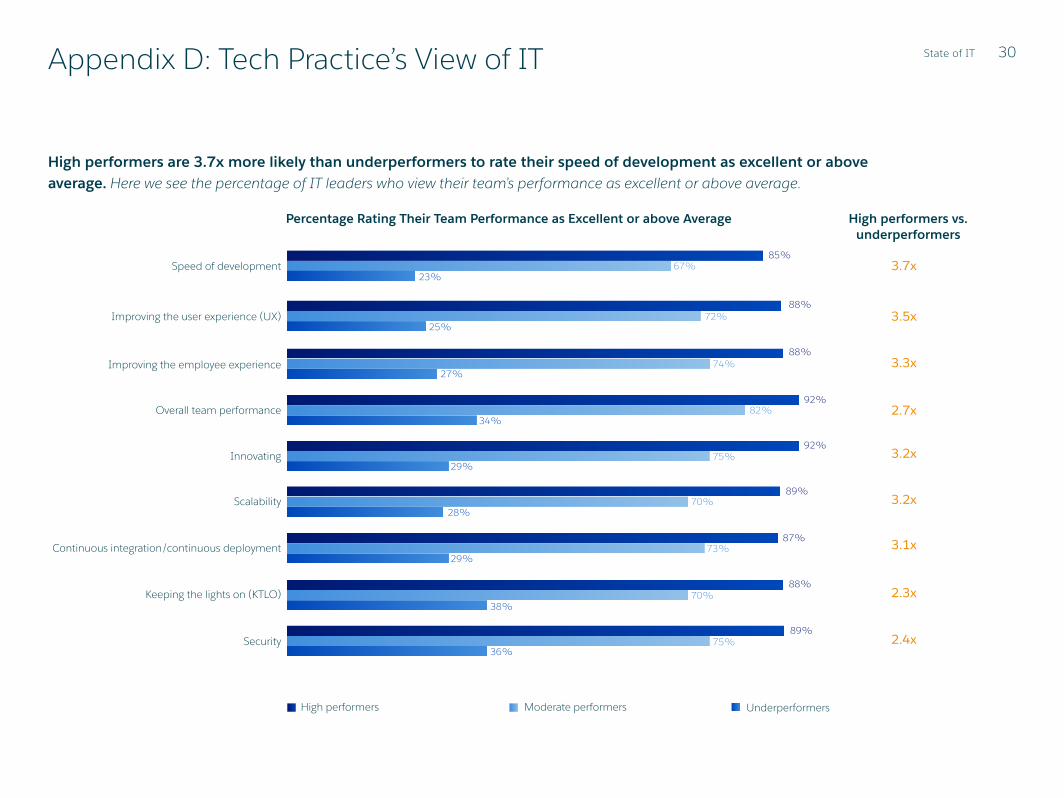
High performers are 3.7x more likely than underperformers to rate their speed of development as excellent or above average. Here we see the percentage of IT leaders who view their team’s performance as excellent or above average.
Speed of development85%
67%23%
3.7x
High performers vs. underperformers
Improving the user experience (UX)88%
72%25%
3.5x
Improving the employee experience88%
74%27%
3.3x
Overall team performance92%
82%34%
2.7x
29%Innovating
92%75% 3.2x
Scalability89%
70%28%
3.2x
Continuous integration/continuous deployment87%
73%29%
3.1x
Keeping the lights on (KTLO)88%
70%38%
2.3x
Security89%
75%36%
2.4x
High performers Moderate performers Underperformers
Percentage Rating Their Team Performance as Excellent or above Average

31State of ITAppendix D: Tech Practice’s View of IT
Tech practices using a cloud native or hybrid deployment model are more likely to rate team performance higher than those using on-premises-only solutions. Here we see the percentage of IT leaders who view their team’s performance as excellent or above average by app deployment model.
Hybrid Cloud native (public or private) On-premises
Speed of development66%
51%50%
Security74%
63%58%
Improving the user experience (UX)71%
57%49%
Improving the employee experience72%
59%51%
Overall team performance78%
66%61%
Innovating74%
60%54%
Scalability71%
54%50%
Continuous integration/continuous deployment72%
56%49%
Keeping the lights on (KTLO)72%
57%56%
Percentage Rating Their Team Performance as Excellent or above Average

32State of IT
Forty-six percent of IT leaders rank closing the gap in skills development and training as a top priority. Here we see the top three areas where companies are experiencing a critical IT skills gap.
Nineteen percent of underperformers are not currently addressing the IT skills gap. Here we see ways IT leaders are addressing the IT skills gap by performance level.
Appendix E: IT Skills Gap and Training
Training existing IT staff in areas where skills are lacking
Training business users on apps
Hiring new IT staff with desired skills
Bringing in contractors that possess required skills
Outsourcing projects to third-party development vendors
High performers
Moderate performers
Underperformers
72%
67%50%
53%52%
27%
45%42%
32%
40%36%
31%
37%
35%27%
IT security Release engineering Legacy support
Data engineering Application development Dev/software engineering
IT security Application development System engineering
High performers
Moderate performers
Underperformers
1 2 3
Percentage of IT Leaders Addressing the Skills Gap in Various Ways
33State of IT
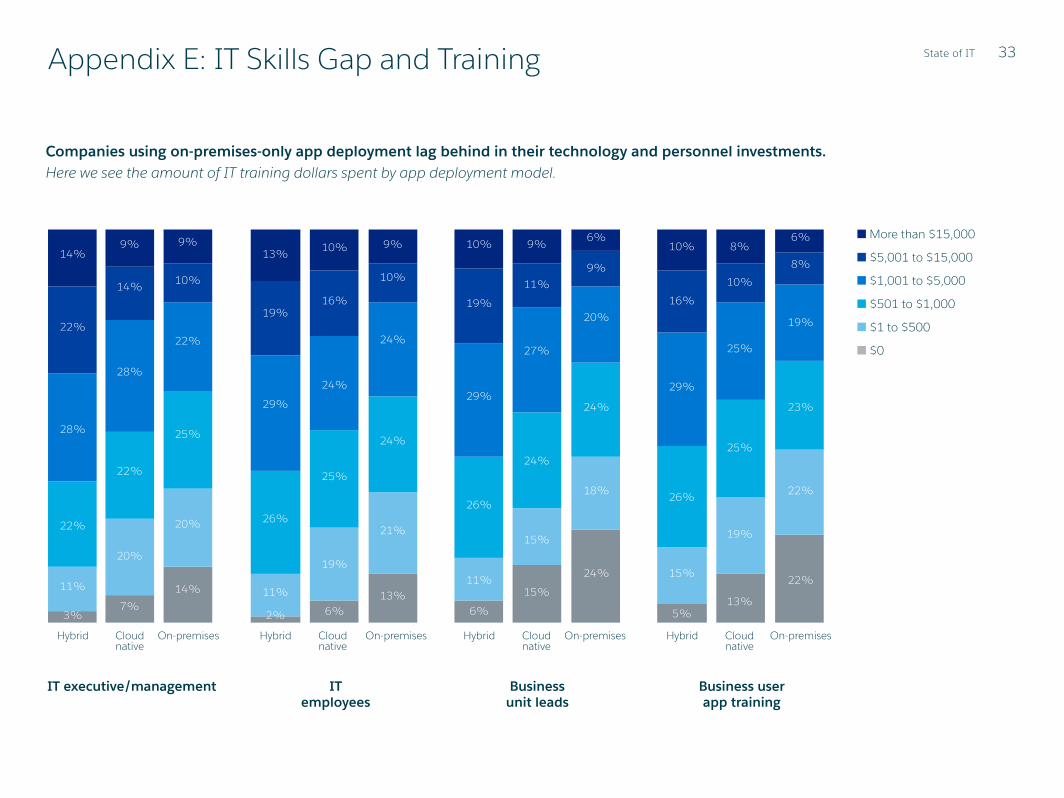
Companies using on-premises-only app deployment lag behind in their technology and personnel investments. Here we see the amount of IT training dollars spent by app deployment model.
Appendix E: IT Skills Gap and Training
IT executive/management
On-premisesCloud native
Hybrid
3%
11%
22%
28%
22%
14%
7%
20%
22%
28%
14%
9%
14%
20%
25%
22%
10%
9%
IT employees
On-premisesCloud native
Hybrid
2%
11%
26%
29%
19%
13%
6%
19%
25%
24%
16%
10%
13%
21%
24%
24%
10%
9%
On-premises
Business unit leads
Cloud native
Hybrid
6%
11%
26%
29%
19%
10%
15%
15%
24%
27%
11%
9%
24%
18%
24%
20%
9%
6%
Business user app training
On-premisesCloud native
Hybrid
5%
15%
26%
29%
16%
10%
13%
19%
25%
25%
10%
8%
22%
22%
23%
19%
8%
6%
$5,001 to $15,000
$1 to $500
$0
More than $15,000
$501 to $1,000
$1,001 to $5,000

34State of IT
Eighty percent of IT leaders believe their company’s leadership cares about training and development of their technical staff. Here we see the percentage who strongly agree or agree that their tech practice receives training and opportunities.
Invests in ongoing training and dev for tech staff 82%
Invests in the right resources, tools, and tech to support next-gen app dev 78%
Empowers business users to solve problems using tech tools 77%
Provides employees time to pursue dev opportunities 75%
Has a dedicated training budget 75%
Has budget allocated to special projects or new app dev 74%
Meets regularly to share best practices 74%
Has the right tools and tech to build next-gen apps 72%
Has the right skill set to keep in front of emerging trends 72%
Attends industry conferences/workshops and shares learnings 71%
Has a formal process in place to proactively identify IT skills gaps 71%
Uses independent forums and search engines to find help 70%
Sends speakers to conferences as subject-matter experts 63%
Hosts/attends hackathons to work on new ideas and innovate 62%
Appendix E: IT Skills Gap and Training
Percentage Who Strongly Agree or Agree with the Following Statements about Their Tech Practice

35State of IT
High performers are nearly 3x more likely than underperformers to send speakers to conferences as subject-matter experts. Here we see the percentage who strongly agree or agree that their tech practice receives tech training and opportunities by performance level.
Appendix E: IT Skills Gap and Training
96%90%
55%93%
83%53%
90%77%
45%
93%81%
51%
91%79%
52%91%
80%50%
90%79%
48%89%
79%48%
88%78%
44%
86%67%
30%
88%76%
45%89%
76%43%
86%73%
46%
83%65%
33%
Invests in ongoing training and dev for tech staff
Invests in the right resources, tools, and tech to support next-gen app dev
Empowers business users to solve problems using tech tools
Provides employees time to pursue dev opportunities
Has a dedicated training budget
Has budget allocated to special projects or new app dev
Meets regularly to share best practices
Has the right tools and tech to build next-gen apps
Has the right skill set to keep in front of emerging trends
Attends industry conferences/workshops and shares learnings
Has a formal process in place to proactively identify IT skills gaps
Uses independent forums and search engines to find help
Sends speakers to conferences as subject-matter experts
Hosts/attends hackathons to work on new ideas and innovate
1.7x
High performers vs. underperformers
1.8x
1.8x
1.8x
1.8x
1.9x
1.8x
2.0x
2.0x
1.9x
2.0x
1.9x
2.9x
2.5x
High performers Moderate performers Underperformers
Percentage Who Strongly Agree or Agree with the Following Statements about Their Tech Practice
36State of IT
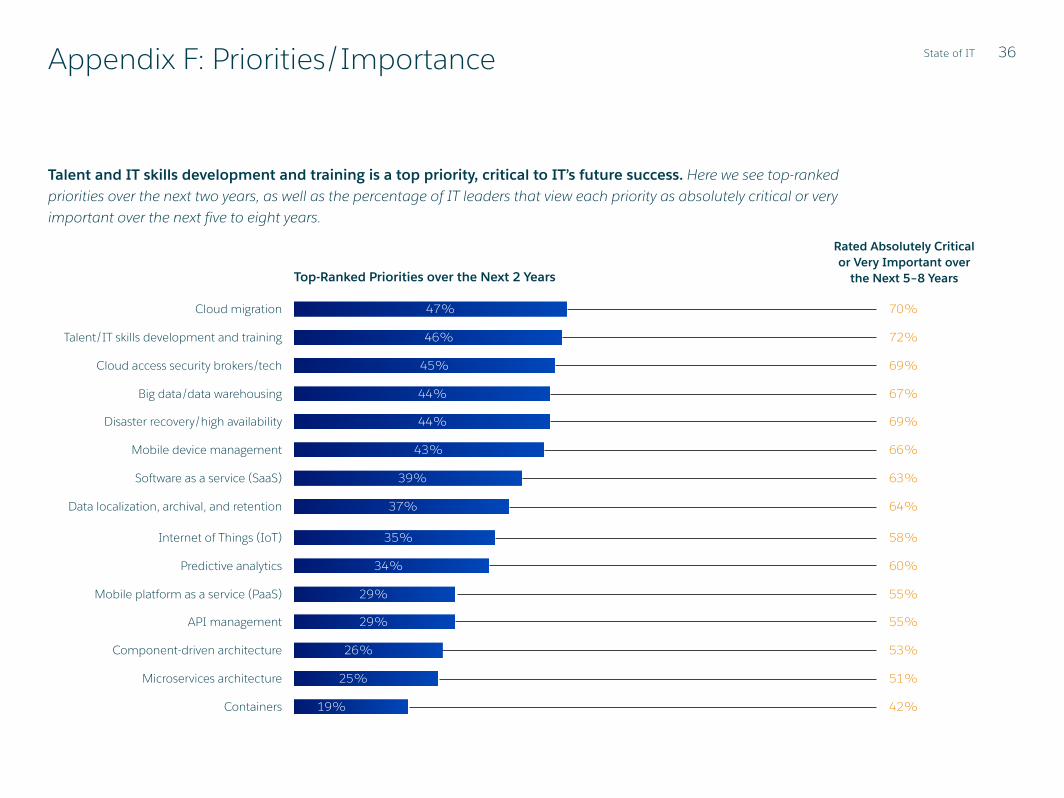
Talent and IT skills development and training is a top priority, critical to IT’s future success. Here we see top-ranked priorities over the next two years, as well as the percentage of IT leaders that view each priority as absolutely critical or very important over the next five to eight years.
Appendix F: Priorities/Importance
Cloud migration 47% 70%
Talent/IT skills development and training 46% 72%
Cloud access security brokers/tech 45% 69%
Big data/data warehousing 44% 67%
Disaster recovery/high availability 44% 69%
Mobile device management 43% 66%
Software as a service (SaaS) 39% 63%
Data localization, archival, and retention 37% 64%
Internet of Things (IoT) 35% 58%
Predictive analytics 34% 60%
Mobile platform as a service (PaaS) 29% 55%
API management 29% 55%
Component-driven architecture 26% 53%
Microservices architecture 25% 51%
Containers 19% 42%
Rated Absolutely Critical or Very Important over
the Next 5–8 YearsTop-Ranked Priorities over the Next 2 Years
37State of IT
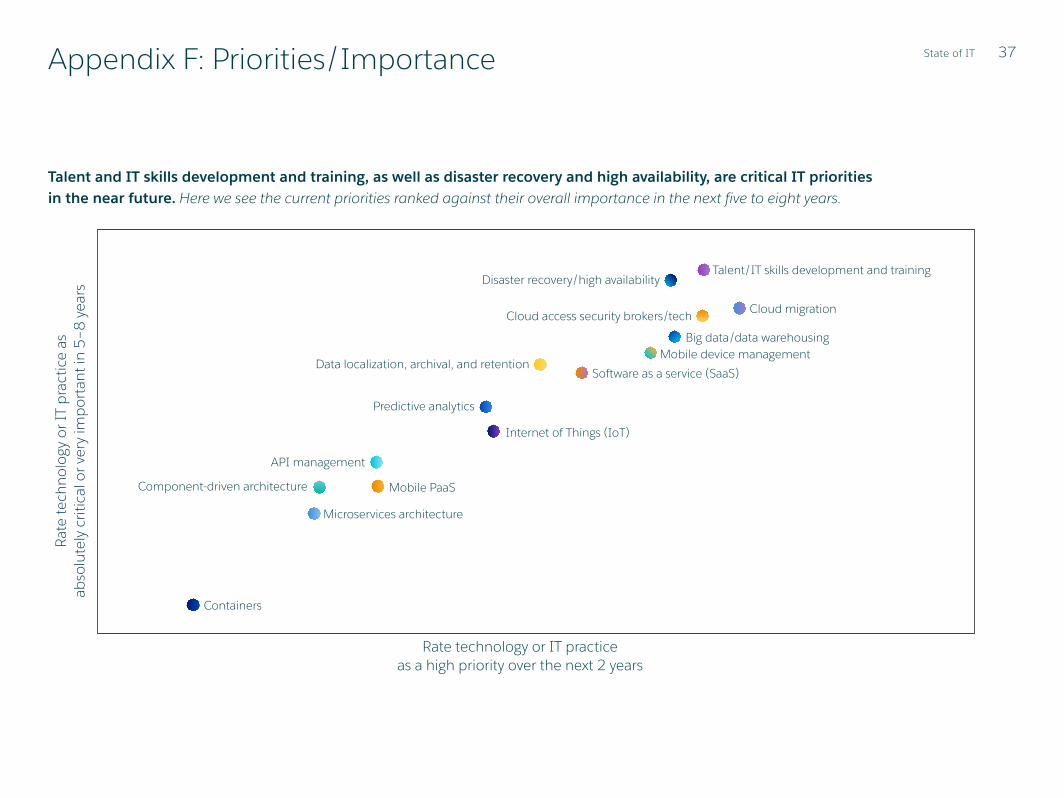
Talent and IT skills development and training, as well as disaster recovery and high availability, are critical IT priorities in the near future. Here we see the current priorities ranked against their overall importance in the next five to eight years.
Appendix F: Priorities/ImportanceRa
te te
chno
logy
or I
T pr
actic
e as
ab
solu
tely
crit
ical
or v
ery
impo
rtan
t in
5–8
year
s
Cloud migration
Talent/IT skills development and training
Cloud access security brokers/tech
Big data/data warehousing
Disaster recovery/high availability
Mobile device management
Software as a service (SaaS)Data localization, archival, and retention
Internet of Things (IoT)
Predictive analytics
Mobile PaaS
API management
Component-driven architecture
Microservices architecture
Containers
Rate technology or IT practice as a high priority over the next 2 years

38State of IT
Budgetary constraints and security issues are obstacles across all tech practices regardless of performance level. Here we see the most pressing pain points ranked for the tech practice.
Appendix G: Pain Points
Budgetary constraints
Security issues
Emerging tech and trends make it hard to keep skills current
Lack of skilled developers
Lack of resources for IT skills dev
Organizational alignment
Lack of skilled administrators
Support of legacy systems
Upgrade management
Creating a connected customer experience
Compliance issues
Too much time maintaining infrastructure
Scalability of apps
Too many platforms to support
Analyzing app data in real time
Lack IT infrastructure to support needs
Influx of new streams and types of data
Enterprise back-end database integration
No formal app strategy
Inefficient deployments due to process overhead
43%
40%
33%
32%
31%
26%
26%
25%
24%
24%
23%
23%
21%
20%
20%
20%
19%
16%
16%
15%
Most Pressing Pain Points for the Tech Practice