
Salesforce Performance hacks - Client Side
43
Salesforce Performance hacks Client side © Jean-Luc Antoine - @ApexAPI – January 2016
-
Upload
paris-salesforce-developer-group -
Category
Internet
-
view
1.264 -
download
0
Transcript of Salesforce Performance hacks - Client Side

Salesforce Performance hacks
Client side
© Jean-Luc Antoine - @ApexAPI – January 2016

Agenda
• Understanding client side performance
• Designing for performance
• Analyzing
• Benefits of Service Workers
• A Performance Framework
“80-90% of the end-user response time is spent on the frontend. Start there.”
Steve Souders – (Yahoo/Google)

Foreword
• Performance impacts
Productivity
Revenue loss
Employee satisfaction
Customer satisfaction
Brand reputation
Poor performance
Signup
Self care
Application
renewal
Waiting time
Operations/hour
Response time
Project rework
Performance fix
Project cost increase
Man days
Cost of analysis Scalability Infrastructure
costs
Compensate

Introduction to client side perf
Browser configuration
• Use a recent version
• Enable browser caching
• Configure cache size (>50 Mb but not too big)
• Cache behavior to check automatically for new version
• Allow saving encrypted pages on disk
• You can do some cleaning by clearing cache and cookies – Cookies are increasing bandwidth required per page

Page optimization
• Reduce viewstate
• Reduce hits
• Leverage CDN
• Keep it light (amount of data, DOM)
• Async (scripts, computation, loading…)
• Minimize
• Low RAM

JS/CSS delivery
• Minified
• Combine into 1 file – Reducing hits
• Avoid inline style to reduce the size of the page – Using style from the css will get the Cache benefits
• Avoid frameworks if not required – Ex : loading jQuery just to hide a DOM element
• Use static resource – Leveraging the CDN
Images optimization hacks
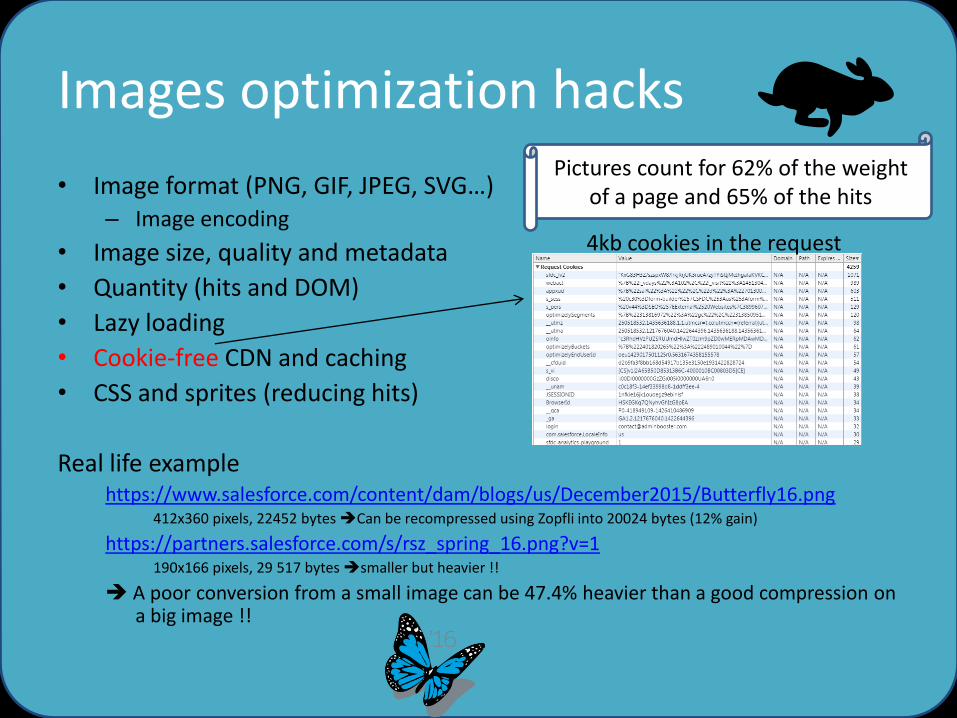
• Image format (PNG, GIF, JPEG, SVG…) – Image encoding
• Image size, quality and metadata
• Quantity (hits and DOM)
• Lazy loading
• Cookie-free CDN and caching
• CSS and sprites (reducing hits)
Real life example https://www.salesforce.com/content/dam/blogs/us/December2015/Butterfly16.png
412x360 pixels, 22452 bytes Can be recompressed using Zopfli into 20024 bytes (12% gain)
https://partners.salesforce.com/s/rsz_spring_16.png?v=1 190x166 pixels, 29 517 bytes smaller but heavier !!
A poor conversion from a small image can be 47.4% heavier than a good compression on a big image !!
4kb cookies in the request
Pictures count for 62% of the weight of a page and 65% of the hits

Performance analysis in the browser
• Browser Developer Tools
• The Cache Effect – same page – 68 requests, 349 kb, 12 secs 59 requests, 30 kb, 2 seconds

Focusing on the essential On the platform
Size and complexity (downloading) Network
Content of page has loaded (parsing finished)
Page resource finished loading Issue

Removing noise • <apex:page showHeader="false" standardStylesheets="false">
Still injecting 1 script No conventional way to remove it
<html><head><script src="/static/111213/js/perf/stub.js" type="text/javascript"></script></head><body>
Blocking and synchroneous
Sometimes side effects

Findings
• Injected javascript in the header is blocking and can add 0.3 seconds response time
• A simple picture that is not found can generate 0.8 seconds response time increase

Introducing Service Workers
• HTTPS • Same domain
– Page, js file, scope
• Scope /apex/ • Dedicated .js file
– Using Promises (async)
• Running in background, event driven
• Commonly used for offline purpose (managing cache) as a replacement for AppCache
• We will use it as a local proxy
XMLHttp Window.fetch() Src= PAGE SW Resource
HIT

Using Service Workers in VF VisualForce
<apex…> Your Content … <script> •Register Service Worker </script> </apex>
Javascript file (Rendered through VisualForce to be on the same domain) Service Worker •Registered •Installed (oninstall) •Activated (onactivate)
Loading VF Page
Registering SW
Installing
Activating
VisualForce
Any included resource (hit)
(re)Loading Controlling (proxy/fetch)
Response

Improvements with SW 1/3
• Removing unwanted platform scripts
– Returning empty script without fetching the real script • This will avoid any network hit
• This will still trigger SW code
– Removing the script from the source code • No hit, no SW trigger
Good choice but not the best
Best strategy
Improvements with SW 2/3
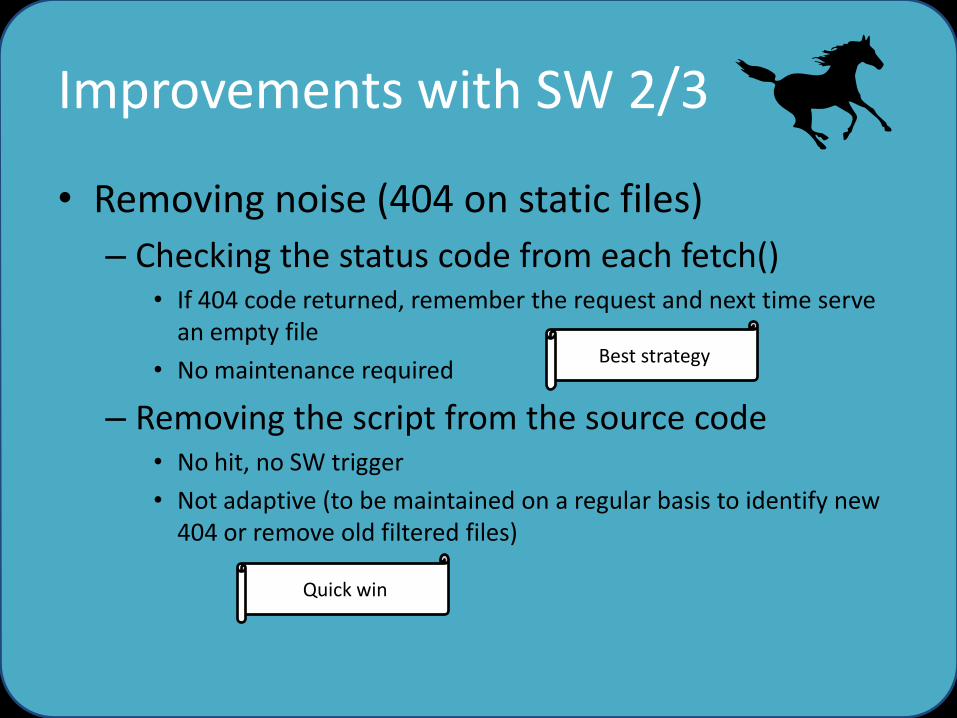
• Removing noise (404 on static files)
– Checking the status code from each fetch() • If 404 code returned, remember the request and next time serve
an empty file
• No maintenance required
– Removing the script from the source code • No hit, no SW trigger
• Not adaptive (to be maintained on a regular basis to identify new 404 or remove old filtered files)
Best strategy
Quick win
Improvements with SW 3/3
• Removing unwanted headers
– Ex : cookies when querying pictures, css or js files
• Forcing some content into the cache

Code : Activating the SW
• No need to put the code on all VF pages
– Once it is activated, it will work for any page in the scope.
– Example : the page can be added in a VF page on the home
Scope is Visualforce
Visualforce page name that is hosting the SW javascript
Improvement only if SW enabled
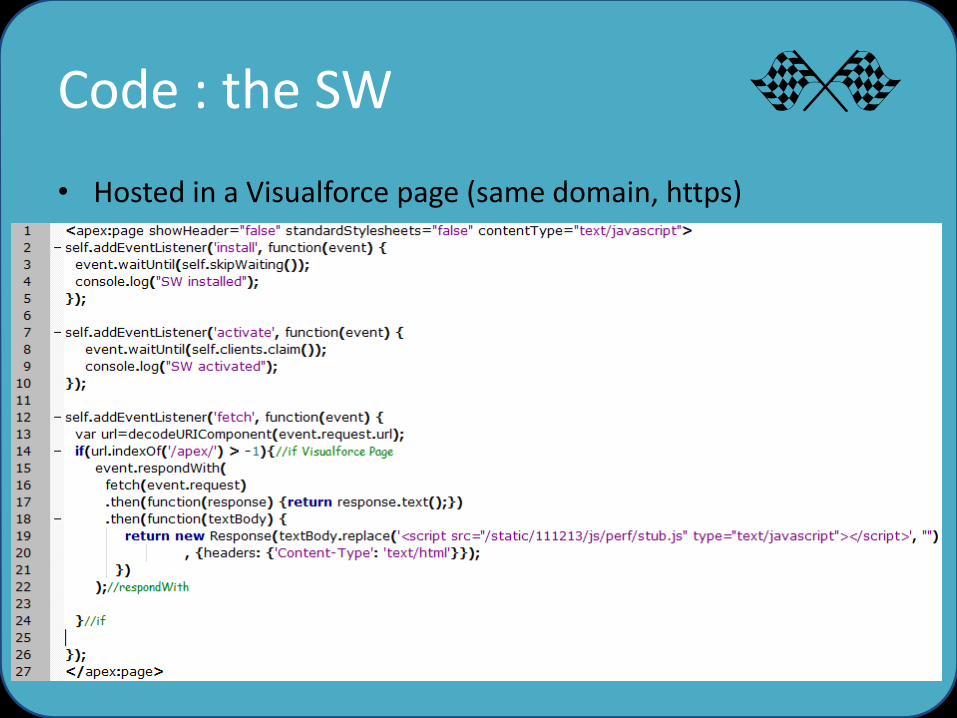
Code : the SW
• Hosted in a Visualforce page (same domain, https)

Not supported by Salesforce
• We have worked on the Visualforce scope only.
• You should not inject script on Standard pages even if you can do it. The risk to break the user interface is too high.
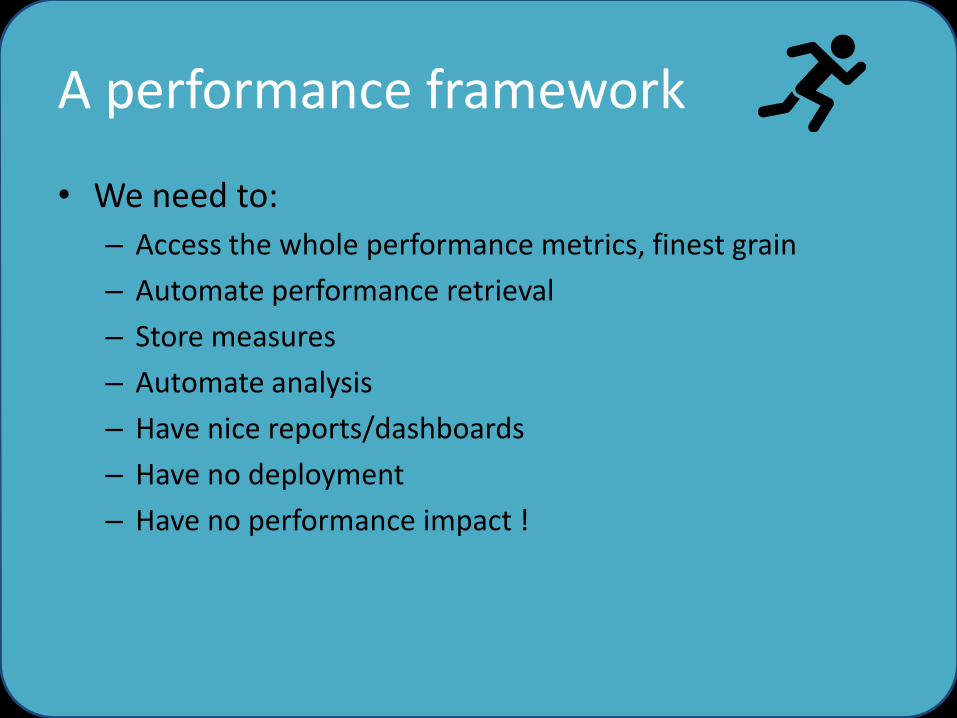
A performance framework
• We need to:
– Access the whole performance metrics, finest grain
– Automate performance retrieval
– Store measures
– Automate analysis
– Have nice reports/dashboards
– Have no deployment
– Have no performance impact !
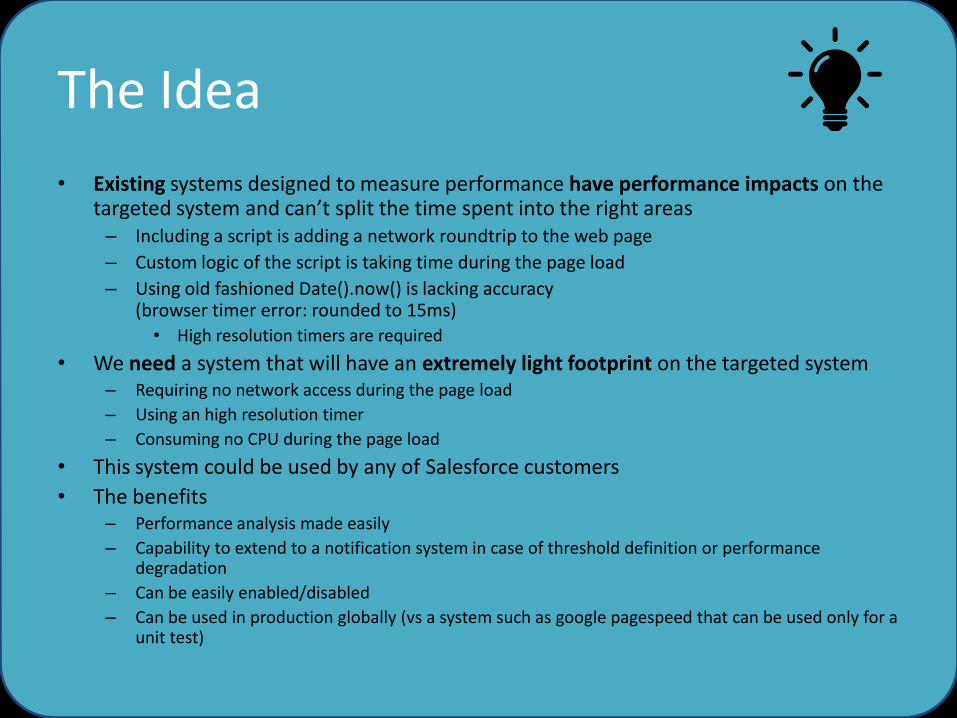
The Idea
• Existing systems designed to measure performance have performance impacts on the targeted system and can’t split the time spent into the right areas – Including a script is adding a network roundtrip to the web page
– Custom logic of the script is taking time during the page load
– Using old fashioned Date().now() is lacking accuracy (browser timer error: rounded to 15ms) • High resolution timers are required
• We need a system that will have an extremely light footprint on the targeted system – Requiring no network access during the page load
– Using an high resolution timer
– Consuming no CPU during the page load
• This system could be used by any of Salesforce customers
• The benefits – Performance analysis made easily
– Capability to extend to a notification system in case of threshold definition or performance degradation
– Can be easily enabled/disabled
– Can be used in production globally (vs a system such as google pagespeed that can be used only for a unit test)

Architecture overview
End user workstation
Centralized Data storage
Transmit data
Data analysis
3 parts -Collecting performance metrics -Storing data -Data visualization
1
2
3
For demo purpose External storage to demonstrate Salesforce Connect (it would be easier to store directly in Salesforce)

The Agent
• The Agent will run locally in the browser of any end-user – Leveraging HTML5 performance API – Providing extremely fine duration (ms) – Splitting time spent into all areas (network, dns…) – With an option to have measures locally consolidated or pushed centrally
• Must have no performance impact – Very low bandwidth, CPU, RAM, Dom impact
• extremely light script that can be included in any custom webpage
– Transparent, not noticeable by end-user – Will do everything “after” “onload”
• As duration of “onload” will be computed
– Must be easy to deploy
• Will do in 2 steps
– Collect information • Need to keep info of previous pages as long as there is user activity
– Transmit information • Later, when there is no user activity such as navigating from page to page
1

The Agent – performance API 1
• We will use it and combine information to get
– Min/max/average and day-time values + per page info + per user
– Complementary information declined from these values
• Network latency (): responseEnd-fetchStart
• The time taken for page load once the page is received from the server: loadEventEnd-responseEnd
• The whole process of navigation and page load: loadEventEnd-navigationStart.
Compatibility : http://caniuse.com/#feat=nav-timing

Performance API - example JSON.stringify(window.performance.timing); Référence à un objet de chronométrage des performances.
{
prompt for unload :
"navigationStart":1442679841366, Time after the previous document begins unload. new Date(1442679841366).toLocaleString() => "19/9/2015 18:24:01"
Redirect :
"redirectStart":0, Time of fetch that initiated a redirect.
unload :
"unloadEventStart":0, Time just before the unload event is fired.
"unloadEventEnd":0, Time after the previous document is unloaded.
"redirectEnd":0, Time after last redirect response ends.
App cache
"fetchStart":1442679841863, Time when the resource starts being fetched.
DNS
"domainLookupStart":1442679841866, Time just before domain name lookup.
"domainLookupEnd":1442679841866, Time after domain name lookup.
TCP
"connectStart":1442679841866, Time just before server connection begins.
"secureConnectionStart":1442679841973, //Non supporté par IE
"connectEnd":1442679842195, Time when server connection is finished.
Request
"requestStart":1442679842195, Time just before a server request.
Response
"responseStart":1442679846204, Time just before the start of a response.
"domLoading":1442679846206, Time just before readiness set to loading.
"responseEnd":1442679846342, Time after the end of a response or connection.
Processing
"domInteractive":1442679846349, Time just before readiness set to interactive.
"domContentLoadedEventStart":1442679846349, Time just before DOMContentLoaded starts. - $(document).ready()
"domContentLoadedEventEnd":1442679846349, Time after DOMContentLoaded event completes.
"domComplete":1442679847992, Time just before document readiness completes.
Onload
"loadEventStart":1442679847992, Time just before the load event is fired. (window onLoad)
"loadEventEnd":1442679848105 Time when the load event is complete.
}
1
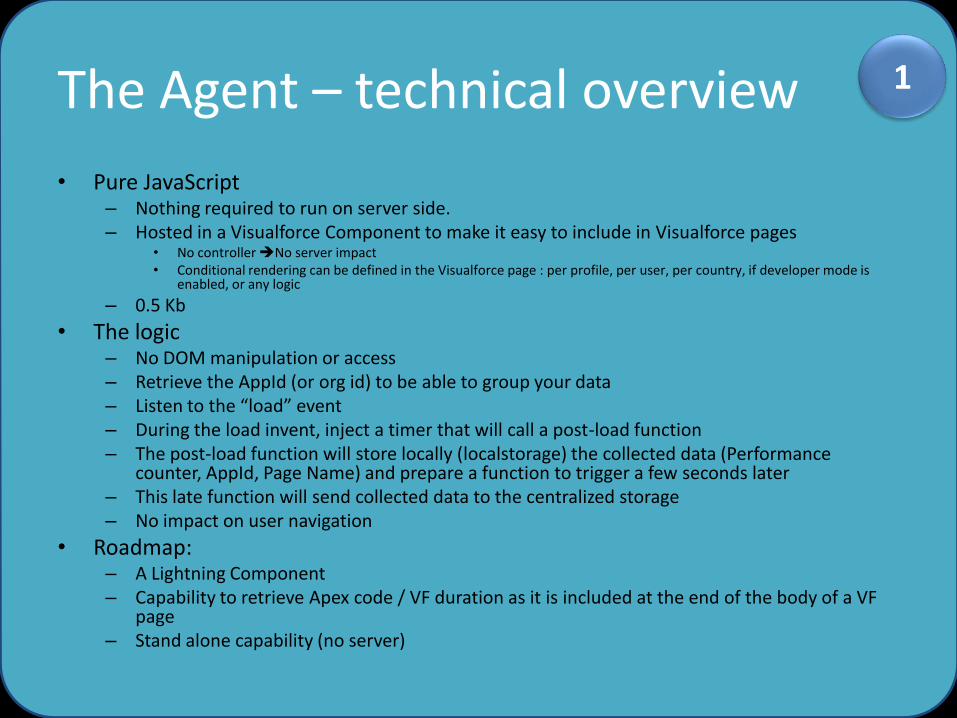
The Agent – technical overview
• Pure JavaScript – Nothing required to run on server side. – Hosted in a Visualforce Component to make it easy to include in Visualforce pages
• No controller No server impact • Conditional rendering can be defined in the Visualforce page : per profile, per user, per country, if developer mode is
enabled, or any logic
– 0.5 Kb
• The logic – No DOM manipulation or access – Retrieve the AppId (or org id) to be able to group your data – Listen to the “load” event – During the load invent, inject a timer that will call a post-load function – The post-load function will store locally (localstorage) the collected data (Performance
counter, AppId, Page Name) and prepare a function to trigger a few seconds later – This late function will send collected data to the centralized storage – No impact on user navigation
• Roadmap: – A Lightning Component – Capability to retrieve Apex code / VF duration as it is included at the end of the body of a VF
page – Stand alone capability (no server)
1

The Agent – code 1
Perf component inserted into the Visualforce Page
The Storage
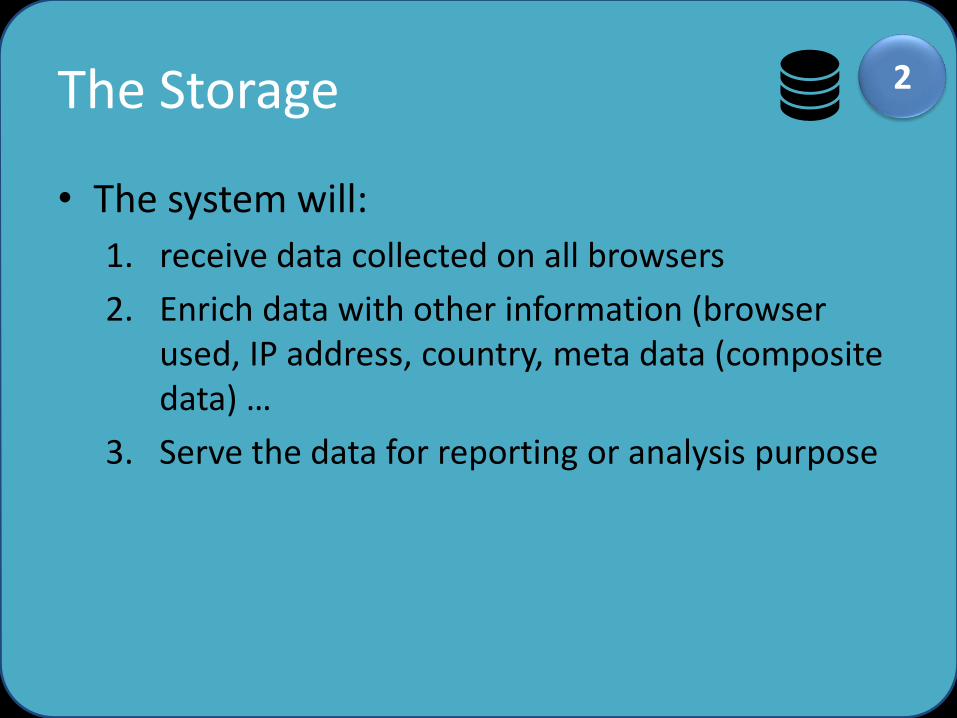
• The system will:
1. receive data collected on all browsers
2. Enrich data with other information (browser used, IP address, country, meta data (composite data) …
3. Serve the data for reporting or analysis purpose
2
The Storage – technical overview
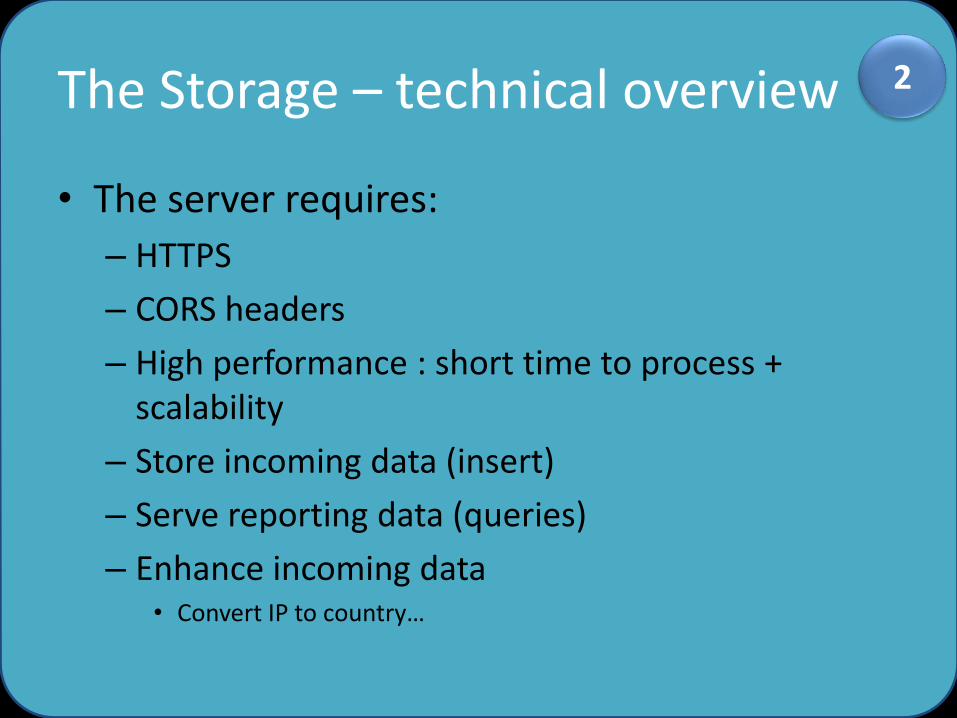
• The server requires:
– HTTPS
– CORS headers
– High performance : short time to process + scalability
– Store incoming data (insert)
– Serve reporting data (queries)
– Enhance incoming data • Convert IP to country…
2

The rendering
• The system will:
– Retrieve the data
– Compute some logic to reveal information • With dashboards allowing you to identify the evolution along the
day
• Provide reporting and analysis in Salesforce
• Leverage Salesforce Connect (lightning connect)
– The Data Source is the Storage
3

The rendering, technical overview
• 1 page will serve the dashboards – Dashboard values can be served using a lightning connect
custom adapter, or through a direct service call
– We will use Google chart api • https://developers.google.com/chart/interactive/docs/gallery
• Dashboards can present – comparison between pages,
– detailed user info,
– brute dump,
– any analysis axis…
• We will use a Visualforce page
3

Lightning Connect Configuration 1/5
• Create a new class “PerfDataSourceConnection” extending DataSource.Provider
PerfDataSourceConnection.cls
External Data Source
configuration
PerfDataSourceProvider.cls
Impact the configuration layout and options
Use for Data connection
•sync the external system’s metadata schema • handle queries and searches of the external data
Perf data repository
https://developer.salesforce.com/docs/atlas.en-us.apexcode.meta/apexcode/apex_connector_start_connection_class.htm
•sync() •query() •search() •upsertRows() •deleteRows()
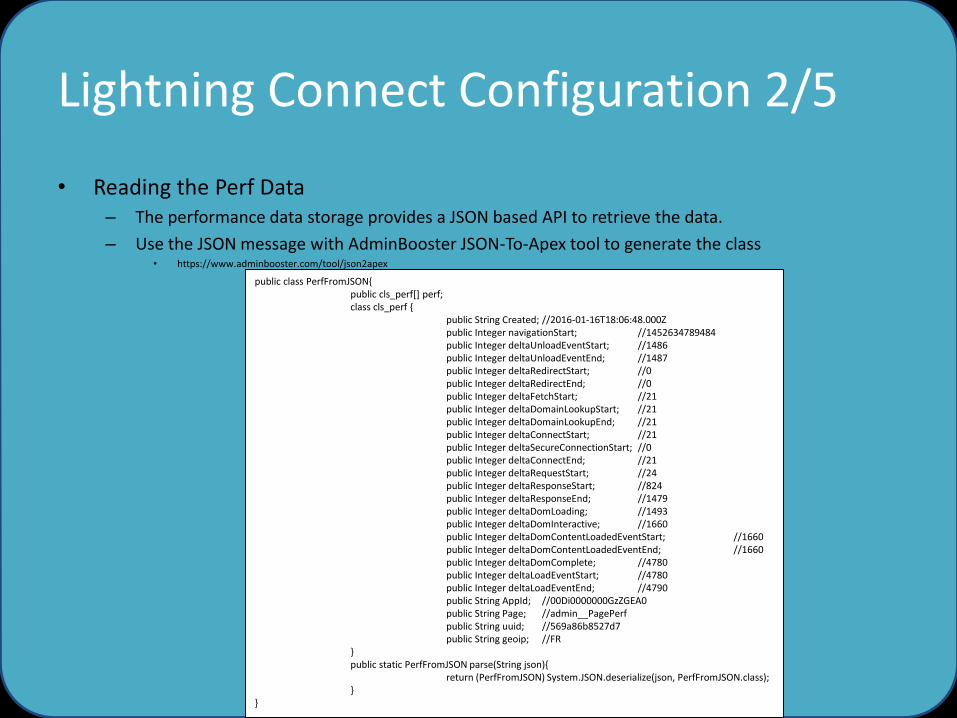
Lightning Connect Configuration 2/5
• Reading the Perf Data – The performance data storage provides a JSON based API to retrieve the data.
– Use the JSON message with AdminBooster JSON-To-Apex tool to generate the class • https://www.adminbooster.com/tool/json2apex
public class PerfFromJSON{ public cls_perf[] perf; class cls_perf { public String Created; //2016-01-16T18:06:48.000Z public Integer navigationStart; //1452634789484 public Integer deltaUnloadEventStart; //1486 public Integer deltaUnloadEventEnd; //1487 public Integer deltaRedirectStart; //0 public Integer deltaRedirectEnd; //0 public Integer deltaFetchStart; //21 public Integer deltaDomainLookupStart; //21 public Integer deltaDomainLookupEnd; //21 public Integer deltaConnectStart; //21 public Integer deltaSecureConnectionStart; //0 public Integer deltaConnectEnd; //21 public Integer deltaRequestStart; //24 public Integer deltaResponseStart; //824 public Integer deltaResponseEnd; //1479 public Integer deltaDomLoading; //1493 public Integer deltaDomInteractive; //1660 public Integer deltaDomContentLoadedEventStart; //1660 public Integer deltaDomContentLoadedEventEnd; //1660 public Integer deltaDomComplete; //4780 public Integer deltaLoadEventStart; //4780 public Integer deltaLoadEventEnd; //4790 public String AppId; //00Di0000000GzZGEA0 public String Page; //admin__PagePerf public String uuid; //569a86b8527d7 public String geoip; //FR } public static PerfFromJSON parse(String json){ return (PerfFromJSON) System.JSON.deserialize(json, PerfFromJSON.class); } }

Lightning Connect Configuration 3/5 • Create a new class extending DataSource.Provider and using
PerfDataSourceConnection class

Lightning Connect Configuration 4/5
• Create an external Data source
– Setup | Develop | External Data Sources | New • Define the type as lightning connect
Custom, related to your Apex class
– Validate and sync

Lightning Connect Configuration 5/5
2 standard fields
Tip: Create a Tab to see your data

Remote site setting
• Don’t forget to configure it, or you get the following error:

Data set displayed in Salesforce
• Result :
• Limitations: – No reporting – Cannot add new formula fields to compute macro values
(download time, etc…) • Workaround : must implement everything in the DataSource Connection class
– Strange behavior of counted rows (total displayed != total counted)
– 15 fields limitation in views views cannot replace reports

Reporting
…

Various approaches Solution Benefits Concerns
Stored in the browser No impact on current data storage limit No server/infrastructure
No consolidated view
Stored externally with Salesforce access
No impact on current data storage limit Dedicated server required Cost of Salesforce connect Cost of custom Apex development No standard reporting
Stored externally with browser access
Javascript development only Dedicated server required
Stored in Salesforce objects
Standard reporting Configuration capabilities Very low development Capability to pre-compute with Roll-up Summary fields Capability to configure notifications (wkf)
Price of high volume storage Risk on high volume
Stored in Salesforce Big Objects
Capability to manage high volume Long term history/data trend analysis Wave integration (data sets using data pipeline)
Additional fees Read-only (can add field but cannot change/remove fields). BO cannot be deleted No Apex access : all complementary data must be computed in the javascript code No Numeric field Limited SOQL

Other resources
• Server side : – A Guide to Application Performance Profiling in Force.com
• https://developer.salesforce.com/page/A_Guide_to_Application_Performance_Profiling_in_Force.com
– Performance Testing Your Force.com Application • https://developer.salesforce.com/blogs/engineering/2013/09/performance-testing-force-com-
application.html
– Performance Tuning for Visualforce and Apex • https://www.youtube.com/watch?v=aYMY2VES2bY
– Network Best Practices for Salesforce Architects • https://developer.salesforce.com/page/Network_Best_Practices_for_Salesforce_Architects
• Client Side – Visualforce Best Practices
• http://resources.docs.salesforce.com/latest/latest/en-us/sfdc/pdf/salesforce_visualforce_best_practices.pdf

Annex – Page generation time
• How to identify server side duration for standard pages and VisualForce?
– Take a look at the end of the generated HTML
59"