SALES and Operations Planning Research Synthesis 1-s2.0-S0925527311004907-Main
13
Review Sales and operations planning: A research synthesis Antˆ onio Ma ´ rcio Tavares Thome ´ a , Luiz Felipe Scavarda b,n , Nicole Suclla Fernandez c , Annibal Jose ´ Scavarda d a Industrial Engineering Department, Pontifı ´cia Universidade Cato ´lica do Rio de Janeiro, Brazil b Center of Excellence in Optimization Solutions (NExO), Industrial Engineering Department, Pontifı ´cia Universidade Cato ´lica do Rio de Janeiro, Rua Marquˆ es de S ~ ao Vicente, 225 sala: 950L 22453-900, Ga ´vea, Rio de Janeiro (RJ), Brazil c Electrical Engineering Department, Pontifı ´cia Universidade Cato ´lica do Rio de Janeiro, Brazil d School of Business and Management, American University of Sharjah, Sharjah and Universidade do Vale do Rio dos Sinos, Brazil article info Article history: Received 19 May 2011 Accepted 23 November 2011 Available online 2 December 2011 Keywords: Supply chain management Cross-functional alignment Metrics Collaboration Integrated planning Systematic review abstract Despite the growing body of literature on sales and operation planning (S&OP), efforts to synthesise the overall state of the art of research in this area are limited. Within this context, this paper provides a systematic review of the literature on S&OP. The purpose of this systematic review is twofold: (i) to integrate the highly dispersed work on S&OP in order to identify and analyse S&OP as a business process and (ii) to assemble quantitative evidence of its impact on the performance of the firm. A literature search framework is proposed, with 271 papers reviewed and classified. The framework embraces S&OP context information, inputs and goals, structure and processes, outcomes, and results. The major expected outcome in most papers was a cross-functional integration of plans, although few studies report on the integration of finance plans into S&OP. Despite the existence of common process descriptors and definitions of S&OP, there is a lack of unifying frameworks for maturity models, measurement of S&OP, and constructs related to the firm’s performance. The need for additional scientifically sound survey or case study research on S&OP is emphasised. This paper contributes to a better understanding of S&OP’s role as a determinant of firm’s performance in the supply chain. & 2012 Published by Elsevier B.V. Contents 1. Introduction ........................................................................................................ 1 2. Methodology ....................................................................................................... 2 3. Results and discussions ............................................................................................... 3 3.1. Study identification ............................................................................................ 3 3.2. A literature search synthesis framework............................................................................ 4 3.3. Study descriptors .............................................................................................. 5 3.3.1. Context ............................................................................................... 5 3.3.2. Inputs ................................................................................................ 9 3.3.3. Structure and processes ................................................................................. 10 3.3.4. Outcomes ............................................................................................ 10 4. Conclusions ....................................................................................................... 11 Acknowledgement .................................................................................................. 11 References ........................................................................................................ 11 1. Introduction Sales and operations planning (S&OP) is a tool that unites different business plans into one integrated set of plans. Its main purpose is twofold: (1) to balance supply and demand and (2) to build bridges between the business or strategic plan and the operational plans of the firm. S&OP addresses the key issue of alignment—a central theme Contents lists available at SciVerse ScienceDirect journal homepage: www.elsevier.com/locate/ijpe Int. J. Production Economics 0925-5273/$ - see front matter & 2012 Published by Elsevier B.V. doi:10.1016/j.ijpe.2011.11.027 n Corresponding author. Tel.: þ55 21 55 21 3527 1285/1286; fax: þ55 2155 21 3527 1288. E-mail addresses: [email protected] (A.M. Tavares Thome ´), [email protected] (L.F. Scavarda), [email protected] (N.S. Fernandez), [email protected] (A.J. Scavarda). Int. J. Production Economics 138 (2012) 1–13
Transcript of SALES and Operations Planning Research Synthesis 1-s2.0-S0925527311004907-Main

Int. J. Production Economics 138 (2012) 1–13
Contents lists available at SciVerse ScienceDirect
Int. J. Production Economics
0925-52
doi:10.1
n Corr
fax: þ5
E-m
lf.scavar
annibal
journal homepage: www.elsevier.com/locate/ijpe
Review
Sales and operations planning: A research synthesis
Antonio Marcio Tavares Thome a, Luiz Felipe Scavarda b,n, Nicole Suclla Fernandez c,Annibal Jose Scavarda d
a Industrial Engineering Department, Pontifıcia Universidade Catolica do Rio de Janeiro, Brazilb Center of Excellence in Optimization Solutions (NExO), Industrial Engineering Department, Pontifıcia Universidade Catolica do Rio de Janeiro,
Rua Marques de S~ao Vicente, 225 sala: 950L 22453-900, Gavea, Rio de Janeiro (RJ), Brazilc Electrical Engineering Department, Pontifıcia Universidade Catolica do Rio de Janeiro, Brazild School of Business and Management, American University of Sharjah, Sharjah and Universidade do Vale do Rio dos Sinos, Brazil
a r t i c l e i n f o
Article history:
Received 19 May 2011
Accepted 23 November 2011Available online 2 December 2011
Keywords:
Supply chain management
Cross-functional alignment
Metrics
Collaboration
Integrated planning
Systematic review
73/$ - see front matter & 2012 Published by
016/j.ijpe.2011.11.027
esponding author. Tel.: þ55 21 55 21 3527 1
5 2155 21 3527 1288.
ail addresses: [email protected] (A.M.
[email protected] (L.F. Scavarda), nicolesf@aluno
@esp.puc-rio.br (A.J. Scavarda).
a b s t r a c t
Despite the growing body of literature on sales and operation planning (S&OP), efforts to synthesise the
overall state of the art of research in this area are limited. Within this context, this paper provides a
systematic review of the literature on S&OP. The purpose of this systematic review is twofold: (i) to
integrate the highly dispersed work on S&OP in order to identify and analyse S&OP as a business
process and (ii) to assemble quantitative evidence of its impact on the performance of the firm. A
literature search framework is proposed, with 271 papers reviewed and classified. The framework
embraces S&OP context information, inputs and goals, structure and processes, outcomes, and results.
The major expected outcome in most papers was a cross-functional integration of plans, although few
studies report on the integration of finance plans into S&OP. Despite the existence of common process
descriptors and definitions of S&OP, there is a lack of unifying frameworks for maturity models,
measurement of S&OP, and constructs related to the firm’s performance. The need for additional
scientifically sound survey or case study research on S&OP is emphasised. This paper contributes to a
better understanding of S&OP’s role as a determinant of firm’s performance in the supply chain.
& 2012 Published by Elsevier B.V.
Contents
1. Introduction . . . . . . . . . . . . . . . . . . . . . . . . . . . . . . . . . . . . . . . . . . . . . . . . . . . . . . . . . . . . . . . . . . . . . . . . . . . . . . . . . . . . . . . . . . . . . . . . . . . . . . . . 1
2. Methodology . . . . . . . . . . . . . . . . . . . . . . . . . . . . . . . . . . . . . . . . . . . . . . . . . . . . . . . . . . . . . . . . . . . . . . . . . . . . . . . . . . . . . . . . . . . . . . . . . . . . . . . 2
3. Results and discussions . . . . . . . . . . . . . . . . . . . . . . . . . . . . . . . . . . . . . . . . . . . . . . . . . . . . . . . . . . . . . . . . . . . . . . . . . . . . . . . . . . . . . . . . . . . . . . . 3
3.1. Study identification . . . . . . . . . . . . . . . . . . . . . . . . . . . . . . . . . . . . . . . . . . . . . . . . . . . . . . . . . . . . . . . . . . . . . . . . . . . . . . . . . . . . . . . . . . . . 3
3.2. A literature search synthesis framework. . . . . . . . . . . . . . . . . . . . . . . . . . . . . . . . . . . . . . . . . . . . . . . . . . . . . . . . . . . . . . . . . . . . . . . . . . . . 4
3.3. Study descriptors . . . . . . . . . . . . . . . . . . . . . . . . . . . . . . . . . . . . . . . . . . . . . . . . . . . . . . . . . . . . . . . . . . . . . . . . . . . . . . . . . . . . . . . . . . . . . . 5
3.3.1. Context . . . . . . . . . . . . . . . . . . . . . . . . . . . . . . . . . . . . . . . . . . . . . . . . . . . . . . . . . . . . . . . . . . . . . . . . . . . . . . . . . . . . . . . . . . . . . . . 5
3.3.2. Inputs . . . . . . . . . . . . . . . . . . . . . . . . . . . . . . . . . . . . . . . . . . . . . . . . . . . . . . . . . . . . . . . . . . . . . . . . . . . . . . . . . . . . . . . . . . . . . . . . 9
3.3.3. Structure and processes . . . . . . . . . . . . . . . . . . . . . . . . . . . . . . . . . . . . . . . . . . . . . . . . . . . . . . . . . . . . . . . . . . . . . . . . . . . . . . . . . 10
3.3.4. Outcomes . . . . . . . . . . . . . . . . . . . . . . . . . . . . . . . . . . . . . . . . . . . . . . . . . . . . . . . . . . . . . . . . . . . . . . . . . . . . . . . . . . . . . . . . . . . . 10
4. Conclusions . . . . . . . . . . . . . . . . . . . . . . . . . . . . . . . . . . . . . . . . . . . . . . . . . . . . . . . . . . . . . . . . . . . . . . . . . . . . . . . . . . . . . . . . . . . . . . . . . . . . . . . 11
Acknowledgement . . . . . . . . . . . . . . . . . . . . . . . . . . . . . . . . . . . . . . . . . . . . . . . . . . . . . . . . . . . . . . . . . . . . . . . . . . . . . . . . . . . . . . . . . . . . . . . . . . 11
References . . . . . . . . . . . . . . . . . . . . . . . . . . . . . . . . . . . . . . . . . . . . . . . . . . . . . . . . . . . . . . . . . . . . . . . . . . . . . . . . . . . . . . . . . . . . . . . . . . . . . . . . 11
Elsevier B.V.
285/1286;
Tavares Thome),
.puc-rio.br (N.S. Fernandez),
1. Introduction
Sales and operations planning (S&OP) is a tool that unites differentbusiness plans into one integrated set of plans. Its main purpose istwofold: (1) to balance supply and demand and (2) to build bridgesbetween the business or strategic plan and the operational plans ofthe firm. S&OP addresses the key issue of alignment—a central theme
A.M. Tavares Thome et al. / Int. J. Production Economics 138 (2012) 1–132
in the field of strategic management—from the perspective of bothvertical and horizontal alignment. Vertical alignment ‘‘refers to theconfiguration of strategies, objectives, actions plans, and decisionsthroughout the various levels of the organisation’’, while horizontalalignment ‘‘can be defined in terms of cross-functional and intra-functional integration’’ (Kathuria et al., 2007).
Different definitions place S&OP at different levels in thehierarchy of business plans. Some authors associate it with thehighest hierarchical planning level of manufacturing planning andcontrol (MPC) systems. S&OP is visualised as a long-term planningtool not only for production but also for sales, demand forecast-ing, and resource capacity planning (Olhager et al., 2001; Olhagerand Rudberg, 2002; Olhager and Selldin, 2007). In this view, therole of S&OP is to maintain a proper balance between supply anddemand and to provide early warning signs when they becomeimbalanced (Vollmann et al., 2005). Others position S&OP at thetactical level as noted by Feng et al. (2008). The APICS dictionarydefines S&OP as the following:
‘‘y a process to develop tactical plans that provide manage-ment the ability to strategically direct its businesses to achievecompetitive advantage on a continuous basis by integratingcustomer-focused marketing plans for new and existing pro-ducts with the management of the supply chain. The processbrings together all the plans for the business (sales, marketing,development, manufacturing, sourcing, and financial) into oneintegrated set of plans. It is performed at least once a monthand is reviewed by management at an aggregate (productfamily) level. The process must reconcile all supply, demand,and new product plans at both the detail and aggregate levelsand tie to the business plan. It is the definitive statement of thecompany’s plans for the near to intermediate term covering ahorizon sufficient to plan for resources and support the annualbusiness planning process. Executed properly, the sales andoperation planning process link the strategic plans for thebusiness with its execution and reviews performance measuresfor continuous improvement.’’ (Cox and Blackstone, 2002).
The main features of S&OP are as follows: (i) it is a cross-functional and integrated tactical planning process within thefirm; (ii) it integrates all of the plans of the business in an unifiedplan; (iii) it has a planning horizon from less than three monthsto over 18 months; (iv) it bridges strategy and operations(Feng et al., 2008); and (v) it creates value and is linked with theperformance of the firm (Grimson and Pyke, 2007; Nakano, 2009).
Despite the growing body of literature on S&OP, efforts tosynthesise the overall state of the art of research in this area arelimited. As an attempt to fill this gap, this paper aims to go beyondthe highly dispersed work on S&OP by providing a systematicreview of the literature and key findings on the topic. The purposeof this review is twofold: (i) to gather and integrate findings onS&OP as a business process and (ii) to assemble quantitativeevidence of its impact on the performance of the firm.
This paper is organised into multiple parts. First, the methodfor the research synthesis is described. Next, main findings andresults are analysed and discussed organised in three broadcategories: study identification, literature search synthesis frame-work, and study descriptors. Finally, the main conclusions andsuggestions for future research are presented.
2. Methodology
A five-step process was adopted to select and retrieve papers:(i) computerised database selection, (ii) identification of keywordsfor search, (iii) criteria for exclusion of studies, (iv) manual review ofselected abstracts by at least three authors, and (v) full-text review
of selected papers. Two data-entry screens were prepared; one forthe study identification and one for the study descriptors. They werepopulated during the retrieval process.
Three databases were selected for the search; these threedatabases consist of papers published in the large majority ofscientific journals of interest to operations, organisational man-agement, and social sciences research: EMERALD, EBSCO (includ-ing Academic Search Complete, Business Source Premier, CINAHLwith Full Text, Information Science & Technology Abstracts [ISTA],Library, Information Science & Technology Abstracts with FullText, Regional Business News, SocINDEX with Full Text andAcademic Search Premier), and SCIENCEDIRECT. In accordancewith recommendations for initial research synthesis (Cooper,2010), the keywords selected were sufficiently broad to avoidartificially limiting results and still provided limitations to avoidundesirable results. In pseudo code, the following phrase wasadapted to the search engines in each database: ‘‘Sales andOperations Planning’’ OR ‘‘S&OP’’ NOT ‘‘S OP’’. The last term wasadded to preclude articles in the field of chemistry from appear-ing in the results of the search.
Grey literature review was included in the search databases,and manual searches as reflected in the choice of bibliographicdatabases. Gray, grey or fugitive literature is synonymous(Rothstein and Hopewell, 2009). It was defined on the ThirdInternational Conference on Grey Literature in Luxembourg in1997 as ‘‘that which is produced in all levels of government,academics, business and industry, in electronic and print formatsnot controlled by commercial publishers’’ (Auger, 1998). Analternate definition was proposed by McKimmie and Szurmak(2002) as including all material not identifiable through tradi-tional index or bibliographic database and that are, therefore,hard to retrieve. Following Rothstein and Hopewell (2009), weadopt the more general definition by Weintraub (2000): ‘‘scien-tific grey literature comprises newsletters, reports, workingpapers, theses, government documents, bulletins, fact sheets,conference proceedings and other publications distributed freely,available by subscription or for sale’’. This definition allows theinclusion of bibliographic sources that goes beyond peer-reviewed academic journals, and that are likely to do not beselected otherwise.
Several classification schemes were proposed in the literatureto judge the quality of primary research included in researchsynthesis. Threats to validity of research synthesis reported rangefrom eleven (Cooper, 1984) to 21 (Matt and Cook, 1994) to 29(Shadish et al., 2002); and yet to a list of 28 (Matt and Cook,2009). Following Cooper (2010), we regrouped threats to validityin broad categories and used the categories as criteria for theexclusion of papers. The criteria were as follows: (i) lack ofrelevance of the construct of S&OP or poorly defined constructsof S&OP; (ii) poorly defined methodology, resulting in differentstrength of the evidence of S&OP effects. In judging primary studymethodological quality, a classification scheme ranking papers bythe strength of empirical evidence described was adapted fromLipsey and Wilson (2001) in six subgroups: (1) author’s opiniononly; (2) direction of effects; (3) per cent change; (4) per centchange and sample size (N); (5) means, standard deviation, and N;(6) regressions/correlations; (7) do not apply (see Valentine, 2009for a full discussion about primary research quality in researchsynthesis). Papers based on author’s opinion only were excludedfrom further analysis; (iii) an interactive process was adopted toensure high levels of inter-coders reliability; (iv) causal relation-ship was only accepted based on clearly defined empiricalevidences based on explicit mathematical modelling or casestudies; (v) no cumulative results were extrapolated to a wholeindustry or set of countries, in order to avoid undue general-isation of firm-based findings.

Table 1Papers selected by number of citations and by source.
Author Year Number of
citations (GS)
Source
Gianesi 1998 16 IJOPM
Olhager et al. 2001 63 IJPE
Basu 2001 45 MBE
Lapide 2002 57 JBF
Malhotra and Sharma 2002 22 JOM
Olhager and Rudberg 2002 19 IJPR
Menzter and Moon 2004 19 SCMR
Lapide 2004a 9 JBF
Lapide 2004b 5 JBF
Lapide 2005 4 JBF
Bower 2005 3 JBF
Reyman 2005 1 JBF
McCormack and Locakmy 2005 1 GBCE
Collin and Lorenzin 2006 17 IJPDLM
Whisenant 2006 4 JBF
Sehgal et al. 2006 3 IJPPM
Muzumdar and Fontanella 2006 3 SCMR
Harwell 2006 1 JBF
Lapide 2006 6 JBF
Wallace 2006 2 JBF
Olhager and Selldin 2007 105 IJPR
Singhal J. and Singhal 2007 15 JOM
Slone et al. 2007 12 HBR
Hadaya and Cassivi 2007 12 IMDS
Grimson and Pyke 2007 10 IJLM
Lapide 2007 2 JBF
Burrows 2007 0 JBF
Chou et al. 2007 14 IJPE
Feng et al. 2008 9 IJPE
A.M. Tavares Thome et al. / Int. J. Production Economics 138 (2012) 1–13 3
The search returned 271 papers, and all abstracts were read byat least three authors. The full bibliography list is available uponrequest from the lead author. After reading the abstracts, dupli-cate papers and those not corresponding to the above criteriawere excluded, resulting in 89 papers selected for full-textreview. After a full-text reading, an additional 34 papers wereexcluded. Thus, 55 papers were included in the study identifica-tion and study descriptors. Those papers were reviewed andcross-examined by at least two authors.
The review process was interactive and resulted in high levelsof agreement. First, three authors independently searched data-bases with different keywords. In a second round, a unifiedpseudo code for systematic search was agreed-upon. In the thirdround, criteria for exclusion was debated and summarised in thebasic five-item list described above. In the fourth round, the fulllist of 271 abstracts were distributed to three authors anddebated in four consecutive meetings. A high level of agreementamong the authors was obtained from this screening process.Inter-ratters reliability after the third consecutive meeting, asmeasured by Cohen’s kappa for three judges on abstract reviews,was 0.47 with a standard deviation of 0.12, which was signifi-cantly different from agreement by chance alone (Fleiss, 1971).The main reason for disagreement was the inclusion in theabstract’s review of many articles from industry magazines thatprovided few explanation of the strength of the evidence uponwhich conclusions were based. Cohen’s kappa nearly doubled(0.83) during the fourth review meeting, after consensus wasreached about the exclusion of articles from industry magazinesand trade journals.
Affonso et al. 2008 6 PPC
Milliken 2008 0 JBF
Piechule 2008 0 JBF
Tohamy 2008 0 SCMR
Wallace and Stahl 2008 0 JBF
Lapide 2009a 0 SCMR
Lapide 2009b 0 SCMR
Chae 2009 4 SCMIJ
Nakano 2009 2 IJPDLM
Boyer 2009 0 JBF
Muzumdar and Viswanathan 2009 0 SCMR
Ivert and Jonsson 2010 1 IMDS
Godsell et al. 2010 0 SCMIJ
Chen Ritzo et al. 2010a 0 EJOR
Chen-Ritzo et al. 2010b 0 EJOR
Mellen et al. 2010 0 SCMR
Nielsen et al. 2010 0 CI
Oliva and Watson 2010 2 JOM
Goodwin et al. 2010 1 EJOR
Paiva 2010 1 IJPE
Olhager 2010 1 CI
Singh 2010 0 SCMR
Smith et al. 2010 0 JBF
Baumann 2010 0 JBF
Keal and Hebert 2010 0 Tr
3. Results and discussions
The results are presented in three broad categories: studyidentification, research synthesis framework and descriptors.
3.1. Study identification
Fig. 1 presents the number of papers retrieved for thesystematic review analysis, totalling 55 papers. Interest in thesubject is growing, as evidenced by the number of papers recentlypublished on different aspects of S&OP. As depicted in Fig. 1, thegrowing number of publications on S&OP peaks in 2010.
The 55 articles included in the summary of results are listed inTable 1. Google Scholar (GS) was used for the citation quotes inTable 1. GS was chosen for four main reasons: (i) it is freelyavailable on the Internet; (ii) it is reputedly fast; (iii) it includesscientific grey literature; and (iv) it compares favourably with fee-based citation databases such as Thomson ISI Web of Knowledge
Fig. 1. Number of publications on S&OP by year (N¼55).
Baumann and Andraski 2010 0 IE
EJOR—European Journal of Operations Research; GBCE—Global Conference on
Business and Economics; HBR—Harvard Business review; IJLM—International
Journal of Logistics Management; IJOPM—International Journal of Operations
and Production Management; CI—Computer in Industry; IJPDLM—International
Journal of Physical Distribution and Logistics Management; IJPE—International
Journal of Production Economics; TR—Transfusion; IE—Industry Engineer; IJPP-
M—International Journal of Productivity and Performance Management; IJPR—In-
ternational Journal of Production Research; IMDS—Industrial Management & Data
Systems; JBF—The Journal of Business Forecasting; JOM—Journal of Operations
Management; MBE—Measuring Business Excellence; PPC—Production Planning
and Control; SCMIJ—Supply Chain Management—An International Journal;
SCMR—Supply Chain Management Review.
and Scopus. GS is used in scientific reviews in several disciplines(Harzing and van der Wal, 2008; Bornmann et al., 2009). Therequired cleaning was performed in GS to avoid duplicate entries(Rosenstreich and Wooliscroft, 2009). The number of citations
A.M. Tavares Thome et al. / Int. J. Production Economics 138 (2012) 1–134
was concentrated in a few lead authors coming from both peer-reviewed journals and scientific grey literature. In particular,Olhager and Lapide represented together 271 of the total of 497citations. These authors had also published the largest number ofpapers on the subject.
3.2. A literature search synthesis framework
Conceptually, S&OP evolved from aggregate production plan-ning (APP) in the early 1950s (Singhal J. and Singhal, 2007) tomanufacturing resources planning (MRP II) in the mid-1980s.Most case studies and reports on MRP II trace the origins of S&OPback to practitioners’ work (Wallace and Stahl, 2006; Doughertyand Gray, 2006). S&OP evolved into a business process that alignssales and production within the firm and in the supply chain(Lapide, 2004a, 2005; Grimson and Pyke, 2007; Feng et al., 2008;Ivert and Jonsson, 2010).
Attempts to systematise survey research and case studies thatdefine S&OP as a business process encompass the adoption ofmaturity models inspired by the Capability Maturity Model (CMM),which was proposed by the Software Engineering Institute atCarnegie Mellon University (Paulk et al., 1993). Early maturitymodels in S&OP referred to specific aspects of the process, such asinformation technology (Wing and Perry, 2001) and demandplanning (Mentzer and Moon, 2004). Maturity models with abroader view were proposed more recently. Lapide (2005) con-sidered three dimensions: people, processes, and technology.Ventana Research (2006) proposed a maturity model wherethe classification was made according to the firm position along
Table 2Overview of S&OP stages in maturity models.
Reference Number of stages Brief description of th
Wing and Perry (2001) Three The stages are (i) inte
hub solutions. These
Lapide (2005) Four The stages are (i) mar
meetings, decoupled
gradually moves to an
with customers and s
systems.
Ventana Research (2006) Four The stages are (i) tact
focuses on balancing s
are instituted. S&OP a
planning with corpor
when performance m
Grimson and Pyke (2007) Five The five stages are (i)
These stages range fr
meetings are event-dr
and suppliers. At this
and rewarded accord
structure is empower
intermediate stages. T
gradually integrated i
Feng et al. (2008) Three The stages are (i) deco
supply chain. In the fi
the second stage sales
decoupled. In the thir
Viswanathan (2009) Three The Aberdeen maturi
(iii) laggards (bottom
average cash convers
Cacere et al. (2009) Four The AMR Research m
(iv) orchestrate. At th
S&OP is measured by
match supply and de
planning of factory ca
during which sales an
composed of demand
equal weights in wha
customer services, ca
the dimensions of people, process, technology, and performancemanagement. Aberdeen Group proposed a model with a somehowsimilar classification: process, organisation, knowledge, technol-ogy, and performance (Viswanathan, 2009). Grimson and Pyke(2007) S&OP maturity model was built on the ones proposed bythe Aberdeen Group and Lapide (2005). Their classification wasmade according to the firm position in five dimensions: meetingsand collaboration (which evaluates the effectiveness of the humancomponent in S&OP), organisation (which focuses on the corporateS&OP structure), measurements (which applies to both companyperformance as well as the effectiveness of the S&OP process),information technology (which focuses on an information processrather than a business process), and S&OP plan integration (whichmeasures how effectively a company builds an integrated plan andhow well the plan interfaces with the other four dimensions). Fenget al. (2008) position their S&OP maturity stages in three levelsaccording to the integration of procurement, production, anddistribution plans, ranging from decoupled to fully integrated setof plans. The AMR Research maturity model classifies organisationsin four dimensions: balancing sales and operations, goals of theprocess, plan ownership, and metrics (Cacere et al., 2009).
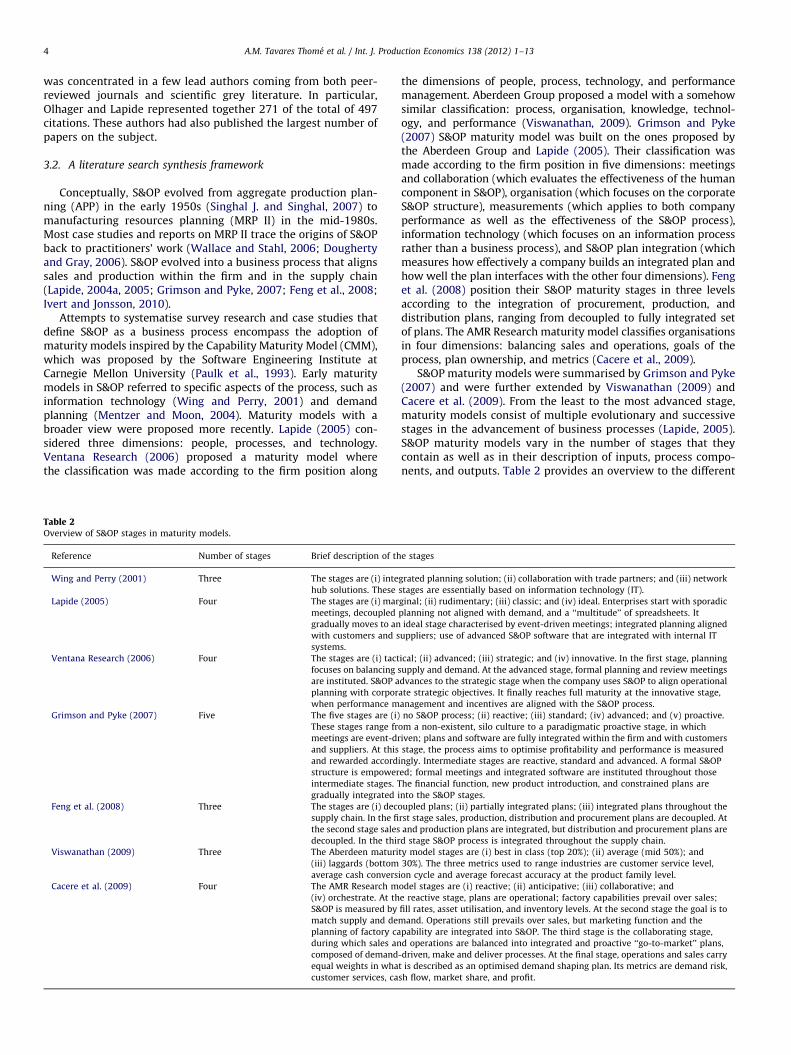
S&OP maturity models were summarised by Grimson and Pyke(2007) and were further extended by Viswanathan (2009) andCacere et al. (2009). From the least to the most advanced stage,maturity models consist of multiple evolutionary and successivestages in the advancement of business processes (Lapide, 2005).S&OP maturity models vary in the number of stages that theycontain as well as in their description of inputs, process compo-nents, and outputs. Table 2 provides an overview to the different
e stages
grated planning solution; (ii) collaboration with trade partners; and (iii) network
stages are essentially based on information technology (IT).
ginal; (ii) rudimentary; (iii) classic; and (iv) ideal. Enterprises start with sporadic
planning not aligned with demand, and a ‘‘multitude’’ of spreadsheets. It
ideal stage characterised by event-driven meetings; integrated planning aligned
uppliers; use of advanced S&OP software that are integrated with internal IT
ical; (ii) advanced; (iii) strategic; and (iv) innovative. In the first stage, planning
upply and demand. At the advanced stage, formal planning and review meetings
dvances to the strategic stage when the company uses S&OP to align operational
ate strategic objectives. It finally reaches full maturity at the innovative stage,
anagement and incentives are aligned with the S&OP process.
no S&OP process; (ii) reactive; (iii) standard; (iv) advanced; and (v) proactive.
om a non-existent, silo culture to a paradigmatic proactive stage, in which
iven; plans and software are fully integrated within the firm and with customers
stage, the process aims to optimise profitability and performance is measured
ingly. Intermediate stages are reactive, standard and advanced. A formal S&OP
ed; formal meetings and integrated software are instituted throughout those
he financial function, new product introduction, and constrained plans are
nto the S&OP stages.
upled plans; (ii) partially integrated plans; (iii) integrated plans throughout the
rst stage sales, production, distribution and procurement plans are decoupled. At
and production plans are integrated, but distribution and procurement plans are
d stage S&OP process is integrated throughout the supply chain.
ty model stages are (i) best in class (top 20%); (ii) average (mid 50%); and
30%). The three metrics used to range industries are customer service level,
ion cycle and average forecast accuracy at the product family level.
odel stages are (i) reactive; (ii) anticipative; (iii) collaborative; and
e reactive stage, plans are operational; factory capabilities prevail over sales;
fill rates, asset utilisation, and inventory levels. At the second stage the goal is to
mand. Operations still prevails over sales, but marketing function and the
pability are integrated into S&OP. The third stage is the collaborating stage,
d operations are balanced into integrated and proactive ‘‘go-to-market’’ plans,
-driven, make and deliver processes. At the final stage, operations and sales carry
t is described as an optimised demand shaping plan. Its metrics are demand risk,
sh flow, market share, and profit.

A.M. Tavares Thome et al. / Int. J. Production Economics 138 (2012) 1–13 5
S&OP maturity models offering their respective number of stepswith a brief description of each one.
The fact that different authors adopt several variants of maturitystages and dimensions suggests that it is difficult to summariseresults and to acquire cumulative, evidence-based results in S&OPpractice. To assist in summarising the empirical results, a researchsynthesis framework is proposed in Fig. 2 as a structuring tool toassemble S&OP descriptors from the extant literature. Study descrip-tors are summaries of moderator or intervening effects occurringbetween S&OP and its results; they include the study of artefactsand the completeness of reporting on procedures, measures, treat-ments, or results (Lipsey, 2009).
This framework depicts contextual information that definesthe characteristics of the environment where the S&OP is devel-oped. Contextual information includes region/country, industry,manufacturing strategy, product-process matrix (Hayes andWheelwright, 1979), level of product aggregation (product familyand/or SKUs), hierarchical planning (strategic versus tactical), andplanning horizon (short, medium, or long term). Inputs to theS&OP process regroup functional plans, sales and demand fore-casts, inventory, budgets, and operational constraints.
Structure and processes are described through the four basicdimensions of Grimson and Pyke (2007). Meeting and collabora-tion regroup participants and promote trust, commitment, andmeeting regularity. Organisational aspects include empowermentand the degree of formalisation in the S&OP process (teams,number of steps, and agenda). Information technology is subdi-vided into systems, software, models, and simulations. Measure-ments are regrouped under S&OP metrics. From the perspective ofvertical alignment, structures and processes are situated belowbusiness plans and corporate strategic planning but above opera-tions. Outcomes regroup the fifth dimension of Grimson and Pyke’sframework (2007) and consist of plan integration between opera-tions, marketing, sales, and finances. The result of the system issummarised as profit optimisation.
Fig. 2. Literature search s
The study descriptors of this synthesis framework are used toguide the analysis of the literature findings on S&OP offered in thenext sub-section.
3.3. Study descriptors
In the sub-sections that follow, a review of research and keyfindings in each of the four framework categories is presented(context, inputs, structure and processes, and outcomes).
Categories used for analysis were derived from the basic defini-tion of S&OP as an integrated set of plans (Cox and Blackstone, 2002)and from the research synthesis framework. The approach ofsummarizing findings according to the definition of S&OP wascorroborated with specific findings from the framework and fromthe literature review. The resulting analytic categories are describedin Tables 3–5. Context data was analysed in-light of the researchsynthesis framework. Inputs to the S&OP process were analysed inthe broad areas of demand, source, production, delivery and finance,cross-classified by the analytical categories of plans, constraints, andothers. Structure and processes and outcomes were scrutinisedthrough the analysis of S&OP drivers (goals of the process) andmetrics.
3.3.1. Context
Most of the papers retrieved from step v of the literaturesearch were descriptive and normative, i.e., they explain howthings should be with a focus on improving performance (Olhagerand Rudberg, 2002; Lapide, 2002). As such, they contribute to theconcepts and conceptual frameworks in the field of operationsmanagement and related areas. However, few case studies andsurveys with clear descriptors of methodology, datasets, analysis,and results exist in the S&OP field. This result is consistent withobservations that the bulk of S&OP development has taken placein industry (Wallace and Stahl, 2006; Dougherty and Gray, 2006;
ynthesis framework.

Table 3Classification of inputs to the S&OP process.
Type of inputs Input levels
Plans Constraints Other
DemandDemand and functional
plans (marketing and
sales)
Ivert and Jonsson (2010), Gianesi (1998), Nakano (2009), Godsell et al.
(2010), Collin and Lorenzin (2006), Hadaya and Cassivi (2007), Sehgal
et al. (2006), Affonso et al. (2008), Bower (2005), Boyer (2009), Burrows
(2007), Chen-Ritzo et al. (2010a), Feng et al. (2008), Grimson and Pyke
(2007), Harwell (2006), Lapide (2002, 2004a, 2004b, 2005, 2006),
Mentzer and Moon, (2004), Milliken (2008), Olhager and Rudberg
(2002), Olhager et al. (2001), Olhager and Selldin (2007), Piechule
(2008), Reyman (2005), Singhal J. and Singhal (2007), Slone et al. (2007),
Wallace (2006), Wallace and Stahl (2008), Whisenant (2006), Malhotra
and Sharma (2002), Nielsen et al. (2010), Oliva and Watson (in press),
Chou et al. (2007), Paiva (2010), Olhager (2010), Singh (2010), Smith
et al. (2010), Baumann( 2010), Baumann and Andraski (2010)
Sales/demand forecasts Feng et al. (2008), Mellen et al. (2010), Mentzer and Moon, (2004),
Lapide (2009a), Muzumdar and Fontanella (2006), Muzumdar and
Viswanathan (2009), Tohamy (2008), Chen-Ritzo et al. (2010b), Oliva
and Watson (in press), Goodwin et al. (2010), Paiva (2010), Singh (2010),
Smith et al. (2010), Baumann (2010), Baumann and Andraski (2010)
Demand impacts (e.g.,
competitors’ actions)
Grimson and Pyke (2007), Lapide (2002)
Marketing and sales
actions
Chen-Ritzo et al. (2010a), Grimson and Pyke (2007),
Lapide (2004a, 2009b), Mentzer and Moon, (2004), Keal
and Hebert (2010)
Information on customers Hadaya and Cassivi (2007), Burrows (2007), Lapide
(2004a, 2004b), Grimson and Pyke (2007)
Information on sales Oliva and Watson (in press) Burrows (2007), Mentzer and Moon, (2004), Piechule
(2008)
SourceProcurement/supply plan Ivert and Jonsson (2010), Affonso et al. (2008), Chen-Ritzo et al. (2010a),
Lapide (2002, 154), Lapide (2006), Whisenant (2006), Smith et al. (2010)
Lead time Affonso et al. (2008), Chen-Ritzo et al. (2010b),
Olhager (2010)
Supply capacity Lapide (2004a), Olhager (2010)
Supplier constraints Chen-Ritzo et al. (2010a), Olhager (2010)
Purchasing data Olhager (2010) Nakano (2009)
Information on supplier Hadaya and Cassivi (2007), Burrows (2007), Grimson
and Pyke (2007), Lapide (2004a)
Raw material forecast Piechule (2008)
ProductionProduction/capacity plan Ivert and Jonsson (2010), Sehgal et al. (2006), Affonso et al. (2008),
Bower (2005), Chen-Ritzo et al. (2010a), Feng et al. (2008), Harwell
(2006), Lapide (2004b, 2006), Mentzer and Moon, (2004), Milliken
(2008), Muzumdar and Viswanathan (2009), Olhager et al. (2001), Slone
et al. (2007), Whisenant (2006), Nielsen et al. (2010), Oliva and Watson
(in press), Chou et al. (2007), Singh (2010), Baumann (2010), Keal and
Hebert (2010)
Inventory Ivert and Jonsson (2010), Gianesi (1998), Nakano (2009), Godsell et al.
(2010), Collin and Lorenzin (2006), Hadaya and Cassivi (2007), Sehgal
et al. (2006), Affonso et al. (2008), Bower (2005), Boyer (2009), Burrows
(2007), Feng et al. (2008), Grimson and Pyke (2007), Lapide (2002,
2004a, 2004b, 2006, 2009a), Mellen et al. (2010), Mentzer and Moon,
(2004), Milliken (2008), Muzumdar and Fontanella (2006), Muzumdar
A.M
.T
av
ares
Th
om
eet
al.
/In
t.J.
Pro
du
ction
Eco
no
mics
13
8(2
01
2)
1–
13
6

and Viswanathan (2009), Olhager and Rudberg (2002), Olhager et al.
(2001), Olhager and Selldin (2007), Piechule (2008), Reyman (2005),
Singhal J. and Singhal (2007), Slone et al. (2007), Tohamy (2008),
Wallace (2006), Wallace and Stahl (2008), Whisenant (2006), Malhotra
and Sharma (2002), Goodwin et al. (2010), Smith et al. (2010), Baumann
(2010), Baumann and Andraski (2010)
Production capacity Ivert and Jonsson (2010), Gianesi (1998), Nakano
(2009), Godsell et al. (2010), Collin and Lorenzin
(2006), Hadaya and Cassivi (2007), Sehgal et al.
(2006), Affonso et al. (2008), Boyer (2009), Burrows
(2007), Feng et al. (2008), Grimson and Pyke (2007),
Lapide (2002, 2004a, 2004b, 2006), Mellen et al.
(2010), Mentzer and Moon, (2004), Milliken (2008),
Muzumdar and Fontanella (2006), Muzumdar and
Viswanathan (2009), Olhager and Rudberg (2002),
Olhager et al. (2001), Piechule (2008), Reyman
(2005), Singhal J. and Singhal (2007), Slone et al.
(2007), Tohamy (2008), Wallace (2006), Wallace
and Stahl (2008), Whisenant (2006), Malhotra and
Sharma (2002), Nielsen et al. (2010), Chou et al.
(2007)
Work-force level Feng et al. (2008), Olhager et al. (2001),
Singhal and Singhal (2007)
Operational resources Nakano (2009), Nielsen et al. (2010), Keal and
Hebert (2010)
Other operational
constraints
Nakano (2009), Milliken (2008), Oliva and Watson
(in press)
Lead time Affonso et al. (2008)
Production time Ivert and Jonsson (2010)
Flexibility Affonso et al. (2008)
Contingencies (e.g. strikes) Lapide (2002)
DeliveryDistribution plan Milliken (2008), Whisenant (2006), Olhager (2010), Baumann (2010)
Delivery capacity Hadaya and Cassivi (2007), Lapide (2004b)
Lead time Ivert and Jonsson (2010), Affonso et al. (2008),
Mellen et al. (2010), Chou et al. (2007), Baumann
(2010)
Other constraints Harwell (2006)
Transportation status Slone et al. (2007)
Service capacity Collin and Lorenzin (2006)
Service level targets Mellen et al. (2010), Smith et al. (2010), Baumann
(2010)
FinanceFinancial plans Harwell (2006), Whisenant (2006), Oliva and Watson (in press),
Chou et al. (2007), Singh (2010), Smith et al. (2010)
Budgets Gianesi (1998), Bower (2005), Grimson and Pyke
(2007), Harwell (2006), Lapide (2002, 2004a, 2006),
Mentzer and Moon, (2004), Tohamy (2008), Wallace
(2006), Wallace and Stahl (2008), Whisenant
(2006), Baumann (2010)
Financial goals Mentzer and Moon, (2004), Tohamy (2008), Singh
(2010), Smith et al. (2010), Baumann (2010)
A.M
.T
av
ares
Th
om
eet
al.
/In
t.J.
Pro
du
ction
Eco
no
mics
13
8(2
01
2)
1–
13
7
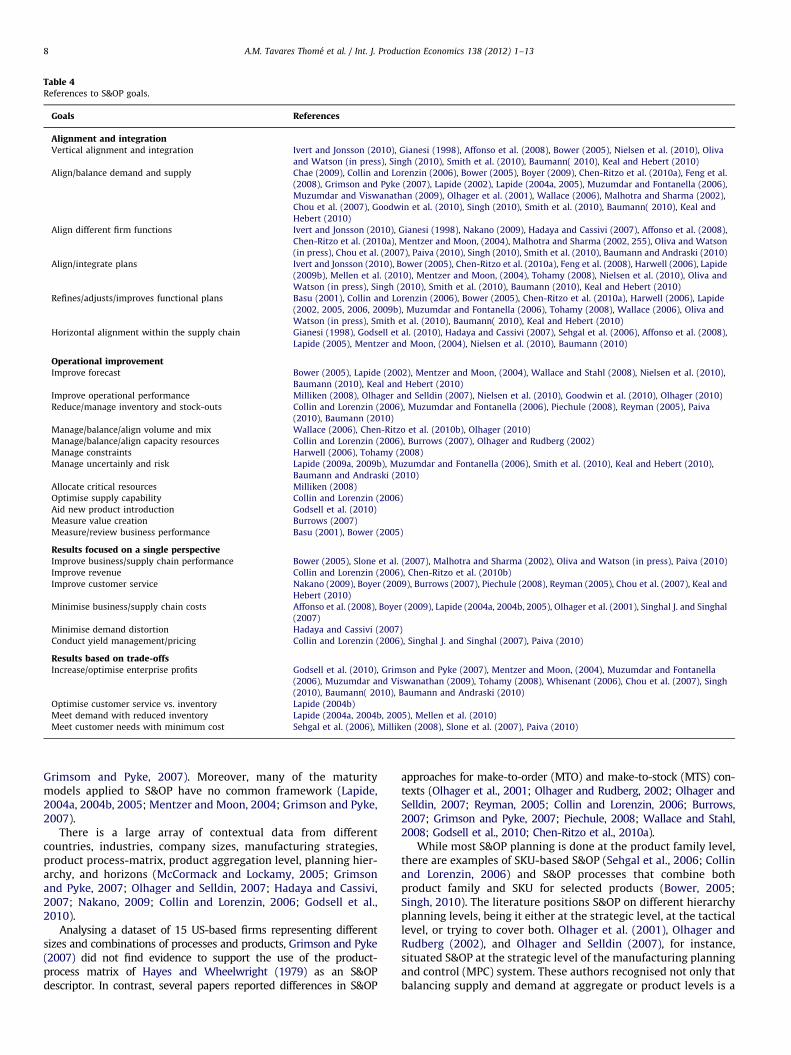
Table 4References to S&OP goals.
Goals References
Alignment and integrationVertical alignment and integration Ivert and Jonsson (2010), Gianesi (1998), Affonso et al. (2008), Bower (2005), Nielsen et al. (2010), Oliva
and Watson (in press), Singh (2010), Smith et al. (2010), Baumann( 2010), Keal and Hebert (2010)
Align/balance demand and supply Chae (2009), Collin and Lorenzin (2006), Bower (2005), Boyer (2009), Chen-Ritzo et al. (2010a), Feng et al.
(2008), Grimson and Pyke (2007), Lapide (2002), Lapide (2004a, 2005), Muzumdar and Fontanella (2006),
Muzumdar and Viswanathan (2009), Olhager et al. (2001), Wallace (2006), Malhotra and Sharma (2002),
Chou et al. (2007), Goodwin et al. (2010), Singh (2010), Smith et al. (2010), Baumann( 2010), Keal and
Hebert (2010)
Align different firm functions Ivert and Jonsson (2010), Gianesi (1998), Nakano (2009), Hadaya and Cassivi (2007), Affonso et al. (2008),
Chen-Ritzo et al. (2010a), Mentzer and Moon, (2004), Malhotra and Sharma (2002, 255), Oliva and Watson
(in press), Chou et al. (2007), Paiva (2010), Singh (2010), Smith et al. (2010), Baumann and Andraski (2010)
Align/integrate plans Ivert and Jonsson (2010), Bower (2005), Chen-Ritzo et al. (2010a), Feng et al. (2008), Harwell (2006), Lapide
(2009b), Mellen et al. (2010), Mentzer and Moon, (2004), Tohamy (2008), Nielsen et al. (2010), Oliva and
Watson (in press), Singh (2010), Smith et al. (2010), Baumann (2010), Keal and Hebert (2010)
Refines/adjusts/improves functional plans Basu (2001), Collin and Lorenzin (2006), Bower (2005), Chen-Ritzo et al. (2010a), Harwell (2006), Lapide
(2002, 2005, 2006, 2009b), Muzumdar and Fontanella (2006), Tohamy (2008), Wallace (2006), Oliva and
Watson (in press), Smith et al. (2010), Baumann( 2010), Keal and Hebert (2010)
Horizontal alignment within the supply chain Gianesi (1998), Godsell et al. (2010), Hadaya and Cassivi (2007), Sehgal et al. (2006), Affonso et al. (2008),
Lapide (2005), Mentzer and Moon, (2004), Nielsen et al. (2010), Baumann (2010)
Operational improvementImprove forecast Bower (2005), Lapide (2002), Mentzer and Moon, (2004), Wallace and Stahl (2008), Nielsen et al. (2010),
Baumann (2010), Keal and Hebert (2010)
Improve operational performance Milliken (2008), Olhager and Selldin (2007), Nielsen et al. (2010), Goodwin et al. (2010), Olhager (2010)
Reduce/manage inventory and stock-outs Collin and Lorenzin (2006), Muzumdar and Fontanella (2006), Piechule (2008), Reyman (2005), Paiva
(2010), Baumann (2010)
Manage/balance/align volume and mix Wallace (2006), Chen-Ritzo et al. (2010b), Olhager (2010)
Manage/balance/align capacity resources Collin and Lorenzin (2006), Burrows (2007), Olhager and Rudberg (2002)
Manage constraints Harwell (2006), Tohamy (2008)
Manage uncertainly and risk Lapide (2009a, 2009b), Muzumdar and Fontanella (2006), Smith et al. (2010), Keal and Hebert (2010),
Baumann and Andraski (2010)
Allocate critical resources Milliken (2008)
Optimise supply capability Collin and Lorenzin (2006)
Aid new product introduction Godsell et al. (2010)
Measure value creation Burrows (2007)
Measure/review business performance Basu (2001), Bower (2005)
Results focused on a single perspectiveImprove business/supply chain performance Bower (2005), Slone et al. (2007), Malhotra and Sharma (2002), Oliva and Watson (in press), Paiva (2010)
Improve revenue Collin and Lorenzin (2006), Chen-Ritzo et al. (2010b)
Improve customer service Nakano (2009), Boyer (2009), Burrows (2007), Piechule (2008), Reyman (2005), Chou et al. (2007), Keal and
Hebert (2010)
Minimise business/supply chain costs Affonso et al. (2008), Boyer (2009), Lapide (2004a, 2004b, 2005), Olhager et al. (2001), Singhal J. and Singhal
(2007)
Minimise demand distortion Hadaya and Cassivi (2007)
Conduct yield management/pricing Collin and Lorenzin (2006), Singhal J. and Singhal (2007), Paiva (2010)
Results based on trade-offsIncrease/optimise enterprise profits Godsell et al. (2010), Grimson and Pyke (2007), Mentzer and Moon, (2004), Muzumdar and Fontanella
(2006), Muzumdar and Viswanathan (2009), Tohamy (2008), Whisenant (2006), Chou et al. (2007), Singh
(2010), Baumann( 2010), Baumann and Andraski (2010)
Optimise customer service vs. inventory Lapide (2004b)
Meet demand with reduced inventory Lapide (2004a, 2004b, 2005), Mellen et al. (2010)
Meet customer needs with minimum cost Sehgal et al. (2006), Milliken (2008), Slone et al. (2007), Paiva (2010)
A.M. Tavares Thome et al. / Int. J. Production Economics 138 (2012) 1–138
Grimsom and Pyke, 2007). Moreover, many of the maturitymodels applied to S&OP have no common framework (Lapide,2004a, 2004b, 2005; Mentzer and Moon, 2004; Grimson and Pyke,2007).
There is a large array of contextual data from differentcountries, industries, company sizes, manufacturing strategies,product process-matrix, product aggregation level, planning hier-archy, and horizons (McCormack and Lockamy, 2005; Grimsonand Pyke, 2007; Olhager and Selldin, 2007; Hadaya and Cassivi,2007; Nakano, 2009; Collin and Lorenzin, 2006; Godsell et al.,2010).
Analysing a dataset of 15 US-based firms representing differentsizes and combinations of processes and products, Grimson and Pyke(2007) did not find evidence to support the use of the product-process matrix of Hayes and Wheelwright (1979) as an S&OPdescriptor. In contrast, several papers reported differences in S&OP
approaches for make-to-order (MTO) and make-to-stock (MTS) con-texts (Olhager et al., 2001; Olhager and Rudberg, 2002; Olhager andSelldin, 2007; Reyman, 2005; Collin and Lorenzin, 2006; Burrows,2007; Grimson and Pyke, 2007; Piechule, 2008; Wallace and Stahl,2008; Godsell et al., 2010; Chen-Ritzo et al., 2010a).
While most S&OP planning is done at the product family level,there are examples of SKU-based S&OP (Sehgal et al., 2006; Collinand Lorenzin, 2006) and S&OP processes that combine bothproduct family and SKU for selected products (Bower, 2005;Singh, 2010). The literature positions S&OP on different hierarchyplanning levels, being it either at the strategic level, at the tacticallevel, or trying to cover both. Olhager et al. (2001), Olhager andRudberg (2002), and Olhager and Selldin (2007), for instance,situated S&OP at the strategic level of the manufacturing planningand control (MPC) system. These authors recognised not only thatbalancing supply and demand at aggregate or product levels is a
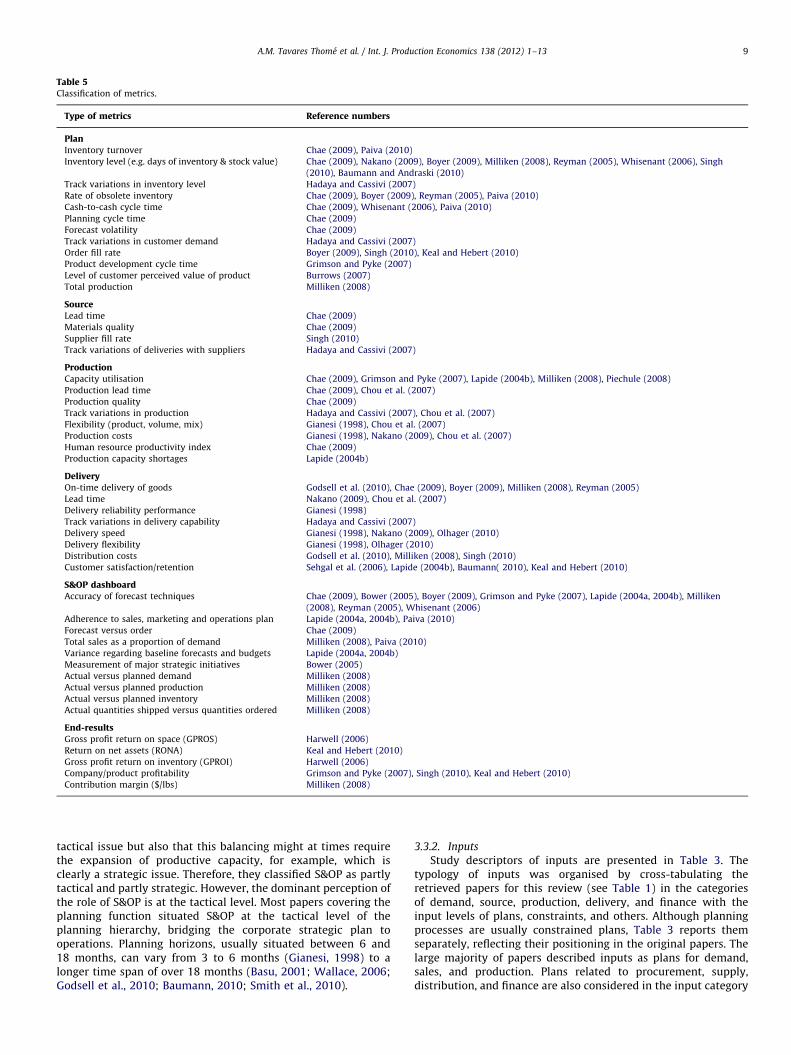
Table 5Classification of metrics.
Type of metrics Reference numbers
PlanInventory turnover Chae (2009), Paiva (2010)
Inventory level (e.g. days of inventory & stock value) Chae (2009), Nakano (2009), Boyer (2009), Milliken (2008), Reyman (2005), Whisenant (2006), Singh
(2010), Baumann and Andraski (2010)
Track variations in inventory level Hadaya and Cassivi (2007)
Rate of obsolete inventory Chae (2009), Boyer (2009), Reyman (2005), Paiva (2010)
Cash-to-cash cycle time Chae (2009), Whisenant (2006), Paiva (2010)
Planning cycle time Chae (2009)
Forecast volatility Chae (2009)
Track variations in customer demand Hadaya and Cassivi (2007)
Order fill rate Boyer (2009), Singh (2010), Keal and Hebert (2010)
Product development cycle time Grimson and Pyke (2007)
Level of customer perceived value of product Burrows (2007)
Total production Milliken (2008)
SourceLead time Chae (2009)
Materials quality Chae (2009)
Supplier fill rate Singh (2010)
Track variations of deliveries with suppliers Hadaya and Cassivi (2007)
ProductionCapacity utilisation Chae (2009), Grimson and Pyke (2007), Lapide (2004b), Milliken (2008), Piechule (2008)
Production lead time Chae (2009), Chou et al. (2007)
Production quality Chae (2009)
Track variations in production Hadaya and Cassivi (2007), Chou et al. (2007)
Flexibility (product, volume, mix) Gianesi (1998), Chou et al. (2007)
Production costs Gianesi (1998), Nakano (2009), Chou et al. (2007)
Human resource productivity index Chae (2009)
Production capacity shortages Lapide (2004b)
DeliveryOn-time delivery of goods Godsell et al. (2010), Chae (2009), Boyer (2009), Milliken (2008), Reyman (2005)
Lead time Nakano (2009), Chou et al. (2007)
Delivery reliability performance Gianesi (1998)
Track variations in delivery capability Hadaya and Cassivi (2007)
Delivery speed Gianesi (1998), Nakano (2009), Olhager (2010)
Delivery flexibility Gianesi (1998), Olhager (2010)
Distribution costs Godsell et al. (2010), Milliken (2008), Singh (2010)
Customer satisfaction/retention Sehgal et al. (2006), Lapide (2004b), Baumann( 2010), Keal and Hebert (2010)
S&OP dashboardAccuracy of forecast techniques Chae (2009), Bower (2005), Boyer (2009), Grimson and Pyke (2007), Lapide (2004a, 2004b), Milliken
(2008), Reyman (2005), Whisenant (2006)
Adherence to sales, marketing and operations plan Lapide (2004a, 2004b), Paiva (2010)
Forecast versus order Chae (2009)
Total sales as a proportion of demand Milliken (2008), Paiva (2010)
Variance regarding baseline forecasts and budgets Lapide (2004a, 2004b)
Measurement of major strategic initiatives Bower (2005)
Actual versus planned demand Milliken (2008)
Actual versus planned production Milliken (2008)
Actual versus planned inventory Milliken (2008)
Actual quantities shipped versus quantities ordered Milliken (2008)
End-resultsGross profit return on space (GPROS) Harwell (2006)
Return on net assets (RONA) Keal and Hebert (2010)
Gross profit return on inventory (GPROI) Harwell (2006)
Company/product profitability Grimson and Pyke (2007), Singh (2010), Keal and Hebert (2010)
Contribution margin ($/lbs) Milliken (2008)
A.M. Tavares Thome et al. / Int. J. Production Economics 138 (2012) 1–13 9
tactical issue but also that this balancing might at times requirethe expansion of productive capacity, for example, which isclearly a strategic issue. Therefore, they classified S&OP as partlytactical and partly strategic. However, the dominant perception ofthe role of S&OP is at the tactical level. Most papers covering theplanning function situated S&OP at the tactical level of theplanning hierarchy, bridging the corporate strategic plan tooperations. Planning horizons, usually situated between 6 and18 months, can vary from 3 to 6 months (Gianesi, 1998) to alonger time span of over 18 months (Basu, 2001; Wallace, 2006;Godsell et al., 2010; Baumann, 2010; Smith et al., 2010).
3.3.2. Inputs
Study descriptors of inputs are presented in Table 3. Thetypology of inputs was organised by cross-tabulating theretrieved papers for this review (see Table 1) in the categoriesof demand, source, production, delivery, and finance with theinput levels of plans, constraints, and others. Although planningprocesses are usually constrained plans, Table 3 reports themseparately, reflecting their positioning in the original papers. Thelarge majority of papers described inputs as plans for demand,sales, and production. Plans related to procurement, supply,distribution, and finance are also considered in the input category
A.M. Tavares Thome et al. / Int. J. Production Economics 138 (2012) 1–1310
of descriptors, but to a lesser extent. Production capacity is one ofthe most relevant operations restrictions to the S&OP process.Finance constraints are introduced mainly as budgetary restric-tions and as financial goals (product margins and profitability).
Table 4 shows descriptors of S&OP goals. Balance of supply anddemand, vertical and cross-functional alignment, integration ofplans, their refinement and improvement, and horizontal align-ment within the supply chain with customers and suppliers areimportant drivers to the S&OP process. Several studies focused onoperational improvements in specific areas, such as forecast,inventory, management and balance of the mix and the volumeof products, and capacity resources. They also focused on theoperational aspects of managing risks and constraints, allocatingresources, assisting in new product development, and improvingmeasurement of value creation and business performance. End-result focused goals appeared as improvements of the perfor-mance of the business and of the supply chain, increasedrevenues, enhanced customer services, and minimisation ofdemand distortion. Descriptors were also presented as trade-offs,maximising profits or customer level at minimum inventory andsupply chain costs. The integration of marketing practices of yieldmanagement and dynamic pricing appeared in few studies,reflecting the noted absence or low levels of integration offinancial goals and financial plans into S&OP practice (Grimsonand Pyke, 2007; Muzumdar and Viswanathan, 2009).
3.3.3. Structure and processes
Regarding the descriptors of S&OP structure and processes, theissue of who should participate in S&OP meetings was discussedmainly in the context of the firm: cross-functionality was soughtthrough joint participation in meetings and communicationchannels by marketing, sales, production, logistics, sourcing, andto a lesser extent, finance. Some authors expanded participationto the supply chain, including both suppliers and customers(Gianesi, 1998; Basu, 2001; Collin and Lorenzin, 2006; Wallace,2006; Hadaya and Cassivi, 2007; Singhal J. and Singhal, 2007;Slone et al., 2007; Grimson and Pyke, 2007; Nakano, 2009; Ivertand Jonsson, 2010), while others called this extension ‘collabora-tive planning, forecasting and replenishment’ (CPFR) (Smith et al.,2010; Baumann and Andraski, 2010). Most papers describing theS&OP process emphasised the need for regular meetings and formechanisms to foster trust and confidence among the team.Meeting regularity varied from monthly to weekly; some authorssuggested that frequent meetings are disruptive while othersadvocated an evolution from regular to event-driven, ad hoc
meetings (Grimson and Pyke, 2007). Wallace and Stahl (2008)described a five-step monthly S&OP process used at most com-panies. The agenda for the first meeting is to gather and reviewdata on actual supply and demand, inventory, backlog, andstatistical forecasts. During the second meeting, the demand planis reviewed, followed by a revision of supply plans in the thirdmeeting. The fourth meeting is preparatory to the executive S&OPmeeting. Decisions, recommendations, scenarios, and the agendafor the executive meeting are reviewed. The executive S&OPmeeting closes the monthly process.
The existence of a formal S&OP structure and the empower-ment of the S&OP team and of the individuals participating in theteam are described as essential ingredients to the process (Lapide,2002; Lapide, 2004a, 2005, 2006; Whisenant, 2006; Piechule,2008; Singh, 2010). As a process descriptor, information systemsare perceived as enabling technologies (Lapide, 2005), althoughsome authors cautioned that at the initial stages, simple spreadsheets can be used as S&OP scoreboards with the bulk of effortfocused on strengthening the S&OP process and on empowering aformal team rather than heavily investing in complex and
sophisticated information systems (Grimson and Pyke, 2007;Wallace and Stahl, 2008). The use of simulation techniques andmathematical models to optimise the integration of the supplyand demand side of business as well as the role of advancedplanning and scheduling systems (APS) in S&OP were discussed byFeng et al. (2008), Affonso et al. (2008), Ivert and Jonsson (2010), andChen-Ritzo et al. (2010a), among others.
Metrics described in the S&OP literature are classified inTable 5. The five meta-processes of the SCOR framework(Supply-Chain Council, 2001) were adapted for the S&OP classi-fication in Table 5, complemented by frameworks proposed byGunasekaran et al. (2001), Gunasekaran et al. (2004), and Chae(2009). At the plan level, most measures related to production,inventory levels, demand and order forecast, cash to cash, andproduct development cycle time. Lead time, quality, and informa-tion are the essential metrics for sourcing. Capacity and resourceutilisation, human resources productivity and production leadtime, quality, costs, flexibility, variability, and shortages wereregrouped under production. Delivery comprised timeliness, leadtimes, reliability, variability, speed, flexibility, costs, backlogs, anduser satisfaction.
S&OP dashboards are instrumental in facilitating regular meet-ings and keeping up with a set agenda. Dashboards reviewfunctional plans and ensure adherence to the plans as measuredby the comparison between planned and effected demand,production and inventory, a follow-up of forecast accuracy, andcomparison of quantities shipped versus quantities ordered. Endresults are measured by profit rates and product margins.Although metrics were highlighted in many papers as being veryimportant, none of the papers worked directly with metrics aimedat measuring the S&OP process itself.
3.3.4. Outcomes
The main outcome posited in the search synthesis frameworkwas the integration of plans. It appears as an input in Table 3 inforty-four papers (as integrated demand and functional plans),fifteen papers quote integrated sales and demand forecasts, eightquotes procurement and supply planning, twenty-one refers tointegrated production/capacity plan, and yet forty-one papersinclude plans for inventory as inputs to the S&OP process. Thosepapers reported partial or comprehensive integration amongmarketing, sales, and operations. The inclusion of finance plansin this integration was considered by a smaller number of papers,with only six papers clearly quoting finance planning as a keyinput into the S&OP process.
Among the 55 papers reviewed, just six papers analysed theimpact of S&OP on the performance of the firm. Feng et al. (2008)applied a mixed integer-based programming model, concludingthat a fully integrated S&OP model results in higher financialreturns than partially integrated or decoupled planning. Olhagerand Selldin (2007) found that S&OP and master planning play amediating role between market uncertainty and the firm’s results.Nakano (2009) found a positive relationship between internal andexternal alignments and their effects on performance. Hadaya andCassivi (2007) found positive effects of collaboration and infor-mation systems on performance. McCormack and Lockamy (2005)found significant positive correlations between informal organi-sation, formal groups, integrating roles, and network building andperformance. Oliva and Watson (in press) found, in a case study,that the existence of an effective S&OP process in itself enhancesperformance even when the landscape of incentives and rewardsare contradictory and not prone to increase inter-functionalintegration within the firm and in the supply chain. In all cases,the performance of the firm was measured differently, makingcomparisons and cumulative meta-analysis difficult.
A.M. Tavares Thome et al. / Int. J. Production Economics 138 (2012) 1–13 11
4. Conclusions
Despite the growing interest in S&OP as evidenced by thenumber of papers recently published, efforts to synthesise thestate-of-the-art in S&OP have so far been rather limited. To fillthis gap, this paper provides a systematic review of the extantliterature. The review was based on a research synthesis frame-work gathering S&OP descriptors in the broad areas of contextinformation, inputs, structure and processes, outcomes, andresults. Two hundred seventy-one abstracts and 89 full-textpapers were retrieved and 55 were analysed for the final review.
The theme of S&OP is treated predominantly in a prescriptivemanner in the operations and organisational management litera-ture. S&OP originated in industry, and several publications arestill found in trade and industry magazines. Academic research inS&OP has been developed in past years, with a holistic approachto S&OP as a business process. S&OP processes vary according toindustrial contexts and manufacturing strategies. Most papersfocused on the aggregate level of a family of products, and processcycles ranged from 3 to 18 months. The dominating perception ofthe role of S&OP is that it is predominantly a tactical planningtool, deployed once business and strategic plans are set, bridgingthese plans to operations. Although S&OP has mainly focused onan intra-company perspective, it has been gradually extended tothe supply chain. The latter is also referred in the literatureas CPFR.
Inputs to the S&OP process were plans from different func-tional areas and constraints mainly related to finance (budgets)and operations (production capacity). There are also a largevariety of S&OP drivers or goals, such as reducing inventories,improving forecasts, balancing supply and demand, integratingplans intra- and inter-firms, and improving results by optimisingrevenues and profits.
Discussions on organisational aspects of S&OP emphasise whoshould participate in meetings and regularity of these meetings.There is no single rule, but authors agree on the need to defineformal S&OP teams; to empower participants; and to ensure theparticipation of top management, key customers, and suppliersfrom the beginning of the process. Trust and confidence amongteam members are also emphasised. Information systems areviewed as essential to align strategies and operations. However, itseems that there is no agreement on the level of investment ininformation systems, particularly at the initial stages of theprocess. While some authors recommended simple spread sheets,others demonstrated the positive effects of advanced planningsystems in S&OP.
Few papers presented descriptors that include financial plans,goals, and participants from financial departments. The need tofurther integrate the financial function and its owners into theS&OP process was highlighted by some authors and warrantsfurther research.
As for the description of the process, measurement issues werehighly dispersed and metrics varied widely among authors.Future research on this topic is also suggested.
Facing such a diversified array of S&OP process descriptors, itis difficult to quantify findings within the boundaries of a well-established and accepted framework. The framework proposed inthis paper, which was based on S&OP maturity models, wasvaluable to summarise findings, but it did not lead to quantitativecomparisons and measurements. Clearly, descriptors were iden-tified and reviewed in accordance with the first purpose of thepaper, but this process did not lead to a statistical analysis ofeffect sizes. It seems that the literature in S&OP research is not yetripe for meta-analysis.
Few survey papers on the effect of S&OP presented studydescriptors in a detailed manner leading to a clear understanding
of the strengths and limitations of the evidence presented. TheS&OP effect on the results of the firm is mediated by differentdescriptors such as planning and control mechanisms, collabora-tive forecasting and planning, interorganisational informationsystems, and horizontal collaboration within the firm. It seemsthat there is at least partial evidence that the process in itselfmight make a difference for the performance of the firm, evenwhen incentives and contracts are contradictory and do notencourage collaboration (Oliva and Watson, in press). The partialevidence identified so far leaves room for additional empiricalinvestigation, through case studies and survey research work, ofthe S&OP process and its determinants and consequences for theperformance of the firm and of the supply chain.
The diversity of the maturity models underlying the empiricalresearch and differences in operational definitions of the perfor-mance of the firm precluded a statistical analysis of S&OP resultsbased on the literature search. Some aspects of the S&OP processcorrespond to more traditional areas of research in operationsmanagement and might be further explored through researchsynthesis and meta-analyses; in particular, the sub-processes ofvertical and horizontal alignment and their effects on newproduct development, the performance of the firm, and thesupply chain.
The results presented in this paper are relevant for bothpractitioners and researchers.
Practitioners will be able to review a synthesis of differentaspects of the S&OP process and have a better understanding of itsrole as a mediator of firm performance. There is at least partialevidence that cross-functional planning processes can mitigate thenegative effect of misaligned organisational structures and contra-dictory incentives schemes on firm’s performance. Formal andinformal communications between functions, networking andinternal integrating roles can boost performance. Furthermore,internal alignment seems to facilitate supply chain integrationwith both suppliers and customers, particularly when inter-orga-nisational information systems favour supply chain integration.
Researchers may contribute further to the research on S&OP asa business process and for a better understanding of its effects onfirm performance. There is still a lack of well documented casestudies describing S&OP process in different cultures and indus-tries. Demonstrating how the findings obtained for specificindustries and cultures can be generalised has yet to be achieved.Empirical data obtainable through surveys and in-depth inter-views with managers and stakeholders in the supply chain arestill lacking. Additional case studies and survey research arenecessary to corroborate findings and to reveal new venues forresearch questions and hypothesis tests regarding the role of salesand operation planning in the supply chain.
Acknowledgement
The Authors gratefully acknowledge MCT/CNPq (research pro-jects: 309455/2008-1 and 307996/2011-5), CAPES/DFG (BRAGE-CRIM research project: 010/09) and PRONEM/FAPERJ. The authorsare also very grateful to the two anonymous referees for theirconstructive suggestions.
References
Affonso, R., Marcotte, F., Grabot, B., 2008. Sales and operations planning: thesupply chain pillar. Production Planning & Control 19 (2), 132–141.
Auger, C.P., 1998. Information sources in grey literature. Guide to InformationSources, Fourth ed. Bowker Saur, London.
Basu, R., 2001. New criteria of performance management: a transition fromenterprise to collaborative supply chain. Measuring Business Excellence 5(4), 7–12.

A.M. Tavares Thome et al. / Int. J. Production Economics 138 (2012) 1–1312
Baumann, F., 2010. The shelf-connected supply chain: strategically linking CPFRwith S&OP at the executive level. Journal of Business Forecasting 29 (4),21–27.
Baumann, F., Andraski, J., 2010. Collaborate, externally and internally. IndustrialEngineer: IE 42 (6), 37–40.
Bornmann, L., Marx, W., Schier, H., Rahm, E., Thor, A., Daniel, H., 2009. Convergentvalidity of bibliometric google scholar data in the field of chemistry—Citationcounts for papers that were accepted by Angewandte Chemie InternationalEdition or rejected but published elsewhere, using google scholar, sciencecitation index, scopus, and chemical abstracts. Journal of Informetrics 3 (1),27–35.
Bower, P., 2005. 12 most common threats to sales and operations planningprocess. Journal of Business Forecasting 24 (3), 4–14.
Boyer Jr, J.E., 2009. 10 proven steps to successful S&OP. Journal of BusinessForecasting 28 (1), 4–10.
Burrows III, R.P., 2007. Demand driven S&OP: a sharp departure from thetraditional ERP approach. Journal of Business Forecasting 26 (3), 4–13.
Cacere, L., Barret, J., Mooraj, H., 2009. Sales and Operations Planning: Transforma-tion from Tradition. Industry Value Chain Strategies. AMR Research, Boston,MA, USA.
Chae, B., 2009. Developing key performance indicators for supply chain: anindustry perspective. Supply Chain Management: An International Journal14 (6), 422–428.
Chen-Ritzo, C.-H., Ervolina, T., Harrison, T.P., Gupta, B., 2010a. Sales and operationsplanning in systems with order configuration uncertainty. European Journal ofOperational Research 205 (3), 604–614.
Chen-Ritzo, C.-H., Ervolina, T., Harrison, T.P., Gupta, B., 2010b. Componentrationing for available-to-promise scheduling in configure-to-order systems.European Journal of Operational Research Available from: /http://www.sciencedirect.com/science?_oby/sdarticle.pdfS (accessed 20.12.10).
Chou, Y.-C., Cheng, C.-T., Yang, F.-C., Liang, Y.Y., 2007. Evaluating alternativecapacity strategies in semiconductor manufacturing under uncertain demandand price scenarios. International Journal of Production Economics 105 (2),591–606.
Collin, J., Lorenzin, D., 2006. Plan for supply chain agility at Nokia: lessons from themobile infrastructure industry. International Journal of Physical Distribution &Logistics Management 36 (6), 418–430.
Cooper, H., 1984. The integrative research review: A systematic approach.Sage Publications, Newburry Park, CA.
Cooper, H., 2010. Fourth ed.Research synthesis and meta-analysis: A step-by-stepapproach. Applied Social Research Methods Series, 2. Sage Publications,Thousand Oaks, CA, USA.
Cox, J.F., Blackstone, J.H., 2002. APICS Dictionary, Tenth ed. APICS, Alexandria, VA, USA.Dougherty, J., Gray, C., 2006. Sales & Operations Planning—Best Practices. Partners
for Excellence, Belmont, NH. Trafford Publishing.Feng, Y., Sophie D’Amours, S., Beauregard, R., 2008. The value of sales and
operations planning in oriented strand board industry with make-to-ordermanufacturing system: cross functional integration under deterministicdemand and spot market recourse. International Journal of ProductionEconomics 115 (1), 189–209.
Fleiss, J.L., 1971. Measuring nominal scale agreement among many raters.Psychological Bulletin 76 (5), 378–382.
Gianesi, I.G.N., 1998. Implementing manufacturing strategy through strategicproduction planning. International Journal of Operations & Production Man-agement 18 (3), 286–299.
Grimson, J.A., Pyke, D.F., 2007. Sales and operations planning: an exploratory studyand framework. International Journal of Logistics Management 18 (3),322–346.
Godsell, J., Birtwistle, A., van Hoek, R., 2010. Building the supply chain to enablebusiness alignment: lessons from British American Tobacco (BAT). SupplyChain Management: An International Journal 15 (1), 10–15.
Goodwin, P., Onkal, D., Thomson, M., 2010. Do forecasts expressed as predictionintervals improve production planning decisions? European Journal of Opera-tional Research 205 (1), 195–201.
Gunasekaran, A., Patel, C., McGaughey, R.E., 2004. A framework for supply chainperformance measurement. International Journal of Production Economics87 (3), 333–347.
Gunasekaran, A., Patel, C., Tirtiroglu, E., 2001. Performance measures and metricsin a supply chain environment. International Journal of Operations andProduction Management 21 (1–2), 71–87.
Hadaya, P., Cassivi, L., 2007. The role of joint collaboration planning actions in ademand-driven supply chain. Industrial Management & Data Systems 107 (7),954–978.
Harwell, J., 2006. Sales & operations planning in the retail industry. Journal ofBusiness Forecasting 25 (3), 4–10.
Harzing, A.W.K., van der Wal, R., 2008. Google scholar as a new source for citationanalysis. Ethics in Science and Environmental Politics 8 (1), 61–73.
Hayes, R.H., Wheelwright, S.C., 1979. Link manufacturing process and product lifecycles. Harvard Business Review 57 (1), 133–140.
Ivert, L.K., Jonsson, P., 2010. The potential benefits of APS systems in sales-and-operations planning. Industrial Management & Data Systems 110 (5),659–681.
Kathuria, R., Joshi, M.P., Porth, S.J., 2007. Organizational alignment and perfor-mance: past, present and future. Management Decision 45 (3), 503–517.
Keal, D.A., Hebert, P., 2010. Benefits to blood banks of a sales and operationsplanning process. Transfusion 50 (12), 2785–2787.
Lapide, L., 2002. New developments in business forecasting. Journal of BusinessForecasting 21 (2), 12–14.
Lapide, L., 2004a. Sales & operations planning part I: the process. Journal ofBusiness Forecasting 23 (3), 17–19.
Lapide, L., 2004b. Sales & operations planning part II: enabling technology. Journalof Business Forecasting 23 (4), 18–20.
Lapide, L., 2005. Sales & operations planning part III: a diagnostic model. Journal ofBusiness Forecasting 24 (1), 13–16.
Lapide, L., 2006. Top-down & bottom-up forecasting in S&OP. Journal of BusinessForecasting 25 (2), 14–16.
Lapide, L., 2009a. Risk and the planning process. Supply Chain ManagementReview 13 (7), 4–5.
Lapide, L., 2009b. The S&OP Rudder. Supply Chain Management Review 13 (2),4–6.
Lipsey, M.W., Wilson, D.B., 2001. Practical meta-analysis. Sage, Thousand Oaks,CA.
Lipsey, W.L., 2009. Identifying interesting variables and analysis opportunities. In:Cooper, H.C., Hedges, L.V., Valentine, J.C. (Eds.), The Handbook of ResearchSynthesis and Meta-Analysis, Second edition , Russel Sage Foundation, NY, USA.
Malhotra, M.K., Sharma, S., 2002. Spanning the continuum between marketing andoperations. Journal of Operations Management 20 (3), 209–219.
Matt, G.E., Cook, T.D., 1994. Threats to the validity of research syntheses. In:Cooper, H., Hedges, L.V. (Eds.), The handbook of research synthesis. , RusselSage Foundation, NY, USA.
Matt, G.E., Cook, T.D., 2009. Threats to the validity of generalized inferences fromresearch synthesis. In: Cooper, H., Hedges, L.V., Valentine, J.C. (Eds.), TheHandbook of Research Synthesis and Meta-Analysis. , Russel Sage Foundation,NY, USA.
McCormack, K. Lockamy, A., 2005. The impact of horizontal mechanisms withinsales and operations planning processes on supply chain integration andperformance: a statistical study. In: Proceedings of the th Global Conferenceon Business & Economics, Oxford, UK. Available from: /http://www.drkresearch.org/Contact_Us/McCormackandLockamy4thGlobalConferncePaper_FinalVersion.pdfS (accessed 4.08.10).
McKimmie, T., Szurmak, S., 2002. Beyond grey literature: how grey questions candrive research. Journal of Agricultural and Food Information 4 (2), 71–79.
Mellen, C., Allen, B., Prokopets, L., 2010. Putting S&OP on the fast track. SupplyChain Management Review 14 (1), 40–45.
Mentzer, J.T., Moon, M.A., 2004. Understanding demand. Supply Chain Manage-ment Review 8 (4), 38–45.
Milliken, A.L., 2008. Sales & operations planning: building the foundation. Journalof Business Forecasting 27 (3), 4–12.
Muzumdar, M., Fontanella, J., 2006. The secrets to S&OP success. Supply ChainManagement Review 10 (3), 34–41.
Muzumdar, M., Viswanathan, N., 2009. Integrated business planning: kickingS&OP up a notch. Supply Chain Management Review 13 (7), 34–41.
Nakano, M., 2009. Collaborative forecasting and planning in supply chains:The impact on performance in Japanese manufacturers. International Journalof Physical Distribution & Logistics Management 39 (2), 84–105.
Nielsen, P., Nielsen, I., Steger-Jensen, K., 2010. Analyzing and evaluating productdemand interdependencies. Computers in Industry 61 (9), 869–876.
Olhager, J., Rudberg, M., 2002. Linking manufacturing strategy decisions onprocess choice with manufacturing planning and control systems. Interna-tional Journal of Production Research 40 (10), 2335–2351.
Olhager, J., Rudberg, M., Wikner, J., 2001. Long-term capacity management: linkingthe perspectives from manufacturing strategy and sales and operationsplanning. International Journal of Production Economics 69 (2), 215–225.
Olhager, J., Selldin, E., 2007. Manufacturing planning and control approaches:market alignment and performance. International Journal of ProductionResearch 45 (6), 1469–1484.
Olhager, J., 2010. The role of the customer order decoupling point in productionand supply chain management. Computers in Industry 61 (9), 863–868.
Oliva, R., Watson, N., Cross-functional alignment in supply chain planning: a casestudy of sales and operations planning, Journal of Operations Management, inpress, doi:10.1016/j.jom.2010.11.012. Available from: /http://www.sciencedirect.com/science?_ob=y/sdarticle.pdfS (accessed 17.12.10).
Paiva, E.L., 2010. Manufacturing and marketing integration from a cumulativecapabilities perspective. International Journal of Production Economics 126(2), 379–386.
Paulk, M.C., Weber, C.V., Chrissis, M.B., 1993. The Capability Maturity Model forSoftware, Version 1.1. edition [S.l.]: Software. Engineering Institute, CarnegieMellon University, Pittsburgh, PA, USA.
Piechule, J., 2008. Implementing a sales and operations planning process atsartomer company: a grass-roots approach. Journal of Business Forecasting27 (3), 13–18.
Reyman, G., 2005. How Johnsondiversey implemented S&OP in Europe. Journal ofBusiness Forecasting 24 (3), 20–28.
Rothstein, H.R., Hopewell, S., 2009. Grey Literature. In: Cooper, H., Hedges, L.V.,Valentine, J.C. (Eds.), The Handbook of Research Synthesis and Meta-Analysis,Second ed. , Russel Sage Foundation, NY, USA, pp. 103–125.
Rosenstreich, D., Wooliscroft, B., 2009. Measuring the impact of accountingjournals using Google Scholar and the g-index. The British Accounting Review41 (4), 227–239.
Sehgal, S., Sahay, B.S., Goyal, S.K., 2006. Reengineering the supply chain in a paintcompany. International Journal of Productivity and Performance Management55 (8), 655–670.

A.M. Tavares Thome et al. / Int. J. Production Economics 138 (2012) 1–13 13
Shadish, W.R., Cook, T.D., Campbell, D.T., 2002. Experimental and Quasi-experi-mental Designs for Generalized Causal Inference. Houghton Mifflin, Boston,MA, USA.
Singh, M.K., 2010. What makes a winning S&OP program. Supply Chain Manage-ment Review 14 (3), 22–27.
Singhal, J., Singhal, K., 2007. Holt, Modigliani, Muth, and Simon’s work and its rolein the renaissance and evolution of operations management. Journal ofOperations Management 25 (2), 300–309.
Slone, R.E., Mentzer, J.T., Paul Dittmann, J., 2007. Are you the weakest link in yourcompany’s supply chain? Harvard Business Review 85 (9), 116–127.
Smith, L., Andraski, J.C., Fawcett, S.E., 2010. Integrated business planning:a roadmap to linking S&OP and CPFR. Journal of Business Forecasting 29 (4), 4–9.
Supply-Chain Council, 2001. Supply-ChainOperations Reference-model Overviewof SCOR Version 5.0. Supply-Chain Council, Pittsburg.
Tohamy, N., 2008. The evolution of S&OP. Supply Chain Management Review12 (5), 10–11.
Valentine, J.C., 2009. Judging the quality of primary research. In: Cooper, H.,Hedges, L.V., Valentine, J.C. (Eds.), The Handbook of Research Synthesis andMeta-Analysis. , Russel Sage Foundation, NY, USA.
Ventana Research, 2006. Sales and operations Planning: Measuring Maturity andOpportunity for Operational Performance Management. Ventana Research, SanMateo, CA, USA.
Viswanathan, N., 2009. Sales and operations Planning: Integrate with Finance andImprove Revenue. Aberdeen Group, Boston, MA, USA.
Vollmann, T.E., Berry, W.L., Whybark, D.C., Jacobs, F.R., 2005. ManufacturingPlanning and Control Systems for Supply Chain. McGraw-Hill, Irwin, NY, USA.
Wallace, T., 2006. Forecasting and sales & operations planning: synergy in action.Journal of Business Forecasting 25 (1), 16–36.
Wallace, T.F., Stahl, R.A., 2006. Sales & Operations Planning. The Executive Guide.T.F. Wallace & Company.
Wallace, T.F., Stahl, R.A., 2008. The demand planning process in executive planningS&OP. Journal of Business Forecasting 27, 19–24.
Weintraub, I., 2000. The impact of alternative presses on scientific communication.The International Journal on Grey Literature 1 (2), 54–59.
Whisenant, C., 2006. The politics of forecasting in sales and operations planning.Journal of Business Forecasting 25 (2), 17–19.
Wing, L., Perry, G., 2001. Toward twenty-first-century pharmaceutical sales andoperations planning. Pharmaceutical Technology, 20–26.