
SAFETY FACTORS FOR CFRP STRENGTHENING IN BENDING OF ...
34
* corresponding author: [email protected], +34 934016513 SAFETY FACTORS FOR CFRP STRENGTHENING IN BENDING OF REINFORCED CONCRETE BRIDGES Caterina Trentin, Joan R. Casas * Construction Engineering Department.Technical University of Catalonia- BARCELONATECH C/ Jordi Girona 1-3, Campus Nord, Mòdul C1 08034- Barcelona, SPAIN ABSTRACT Concerning the strengthening in bending of reinforced concrete bridge decks, the use of fiber reinforced polymers (FRP) has increased due to its easy application and excellent mechanical and chemical properties. However, due to the lack of codes and standards and the lack of experience in the long term behavior, uncertainties exist in the calculation bases along the dimensioning of this reinforcement and more precisely in the partial coefficients of safety to be adopted for the material properties. As a consequence, bridge engineers are reluctant to use composite materials in the strengthening of damaged reinforced concrete bridge decks. To try to overcome this problem, this paper describes the methodology for a reliability-based calibration of the partial safety factors to be used for the CFRP material in the design of strengthening to bending. The method requires the definition of a response model jointly with the statistical definition of the model error. This is discussed in the first part of the paper. The reliability-based procedure is developed based on the design equation and the corresponding model. A simple set of partial safety factors is finally proposed for a representative population of RC bridges. The conclusions highlight the importance of incorporating the model error in the calibration. In addition, the paper shows how in some cases it is not feasible to design a flexural strengthening by using CFRP. Keywords: safety factor, carbon fiber composites, bridge deck, strengthening, model error, bending 1. Introduction Over the last 20 years, the use of fiber-reinforced polymers (FRP) for the strengthening, repair and seismic retrofit of existing structures has widely increased. This has been possible thanks to the huge research activity conducted, focused mainly on the FRPs mechanical characteristics and capacity on collaborating with other materials largely used in civil engineering, such as reinforced concrete, wood
Transcript of SAFETY FACTORS FOR CFRP STRENGTHENING IN BENDING OF ...
*corresponding author: [email protected], +34 934016513
SAFETY FACTORS FOR CFRP STRENGTHENING IN BENDING OF
REINFORCED CONCRETE BRIDGES
Caterina Trentin, Joan R. Casas*
Construction Engineering Department.Technical University of Catalonia- BARCELONATECH
C/ Jordi Girona 1-3, Campus Nord, Mòdul C1
08034- Barcelona, SPAIN
ABSTRACT
Concerning the strengthening in bending of reinforced concrete bridge decks, the use of fiber
reinforced polymers (FRP) has increased due to its easy application and excellent mechanical and
chemical properties. However, due to the lack of codes and standards and the lack of experience in the
long term behavior, uncertainties exist in the calculation bases along the dimensioning of this
reinforcement and more precisely in the partial coefficients of safety to be adopted for the material
properties. As a consequence, bridge engineers are reluctant to use composite materials in the
strengthening of damaged reinforced concrete bridge decks. To try to overcome this problem, this
paper describes the methodology for a reliability-based calibration of the partial safety factors to be
used for the CFRP material in the design of strengthening to bending. The method requires the
definition of a response model jointly with the statistical definition of the model error. This is
discussed in the first part of the paper. The reliability-based procedure is developed based on the
design equation and the corresponding model. A simple set of partial safety factors is finally proposed
for a representative population of RC bridges. The conclusions highlight the importance of
incorporating the model error in the calibration. In addition, the paper shows how in some cases it is
not feasible to design a flexural strengthening by using CFRP.
Keywords: safety factor, carbon fiber composites, bridge deck, strengthening, model error, bending
1. Introduction
Over the last 20 years, the use of fiber-reinforced polymers (FRP) for the strengthening, repair and
seismic retrofit of existing structures has widely increased. This has been possible thanks to the huge
research activity conducted, focused mainly on the FRPs mechanical characteristics and capacity on
collaborating with other materials largely used in civil engineering, such as reinforced concrete, wood

2
and masonry. The strengthening with FRPs results very attractive since the composites present high
mechanical characteristics, high properties as thermic and electric insulators, immunity to corrosion
and efficiency of application. The use of FRPs is moreover not invasive, since the composites are
bonded externally on existing structures in form of laminates, without altering heavily the facility
configuration, size and weight. The use of externally bonded plates to strengthen RC beams in flexure
has been well researched [1].
The design process of a new concrete structure or the strengthening of an existing one should verify:
�� ≥ �� (1)
Being Rd and Sd the design values of the resistance and actions respectively. When using a semi-
probabilistic approach, the design values for a structural concrete element are calculated as:
�� = � ���� ; �� �(2)
�� = ������
���= ����(��)
�
���(3)
where:
Ski = characteristic value of the action “i”, due to load Qki
γfi = partial safety factor of action “i”
fck = characteristic strength of concrete.
γc = partial safety factor of concrete strength
fyk =characteristic strength of reinforcing/prestressing steel
γs = partial safety factor of steel strength.
If the partial safety factors have been appropriately calibrated, then a required level of safety (defined
during the calibration process) is assured by verification of equation (1). The Codes and Standards
dealing with the design of new concrete structures provide appropriate values of the partial safety
factors for concrete and steel. However, when dealing with the retrofit of an existing reinforced
concrete element, to be strengthened in bending through the bonding of FRP in the tensile zone, the
question arises about the safety factor to be used regarding the composite material.

3
It is not easy to establish a value for the safety factors in the design or assessment of structural
members, whatever the resisting mechanism they work through. Indeed, safety factor values are often
based on the experience of competent designers or on deterministic approaches and are rarely
supported by statistical studies. Even though this is not a major problem for easy predictable resisting
models, imprecise safety factor estimates may lead to significant consequences in the case of more
complicated resisting models, which are affected by high levels of uncertainty.
This is the case of the intermediate crack-induced (IC) debonding models, developed to predict one of
the most problematic failure-modes related to the flexural strengthening of reinforced-concrete
members with FRPs. The IC debonding initiates in the vicinity of intermediate flexural or mixed
flexural-shear cracks that propagate in the superficial concrete layer to which the composite plates are
bonded. Once the cracks arrive at the nearest plate-end, the FRP is detached from the substrate and the
composite action is lost.
The debonding generally occurs before the ultimate tensile stress in the FRP or in the concrete and
steel is reached. Therefore, it has often to be considered as the critical failure mode when designing the
strengthening. Over the last years, this phenomenon has been studied closely, and more and more
models predicting the FRP IC debonding have been developed [2,3,4]. However, the uncertainty
underpinning the issue is hardly impossible to remove. This is why both a correct estimate of the safety
factors and a better knowledge of the accuracy of the models are extremely important. The calculation
of the safety factors should be made through a reliability-based approach, to consider as best as
possible all the uncertainties connected to the adopted materials, the acting loads and the applied
analytical model.
Codes and recommendations define safety factors for the design of FRP-strengthened concrete
elements. However, detailed probabilistic information to support the selected resistance factors is
lacking and the safety factor is mainly fixed based on the experience and engineering judgment. The
aim of the present study is to propose objective and appropriate reliability-based design equations with
properly calibrated safety factors that can be used during the design of a strengthening using carbon
fiber reinforced polymer (CFRP) to enhance the flexural capacity of decks of existing bridges.
The reliability of reinforced concrete elements, externally bonded with FRPs was analyzed for the first
time by Triantafillou and Plevris in 1992 [5], and then faced again in Plevris et al. in 1995 [6]. In the
latter study, a Monte Carlo simulation was conducted in order to determine the strength reduction
factor for a typical cross-section of a RC beam, strengthened in bending with CFRP laminates. Various
design cases were considered, modifying conveniently the acting parameters. Only the failure modes

4
for CFRP rupture and concrete crushing were analyzed, considering that uncertainties in debonding
failure could be substantially limited by a high level of control when applying the CFRP plate to the
soffit of the beam.
Okeil et al. [7] conducted a similar study in 2002, this time for girder bridges. The reliability of three
simply-supported reinforced concrete bridges, with different levels of steel corrosion, was investigated
in order to determine a resistance model for strengthened RC beams and estimate a strength reduction
design factor. A Monte Carlo simulation led to the calculation of the resisting moment, while a first-
order reliability method was used to obtain the reliability index. Again the CFRP rupture failure mode
was modeled, without considering any other type of failure, such as shear or debonding.
Atadero et al. [8] obtained the reliability indices of FRP strengthened bridge decks. The ultimate
moment capacity of the slab was determined assuming a linear strain distribution across the slab cross-
section with failure assumed to occur at first yield of the steel reinforcement set at 0.2 % rather than
modes of concrete crushing or debonding of the bonded FRP.
A more detailed procedure for calibrating safety factors when designing with FRP was proposed by
Monti and Santini [9]. Their aim was to give an easy and general framework, that could be followed
regardless of the different types of applications and strengthening used (flexure, shear, …). Unlikely,
their method is difficult to solve, mainly because thought for different limit states together with many
multiple load and capacity scenarios, so that a simultaneous calibration should be done, implying a
remarkable computational effort.
Two are the main drawbacks of these studies:
- they consider only the strengthening with prefabricated systems, neglecting the variability that can
affect the problem when a wet-lay up system is applied
- they do not take into account the real critical failure mode, i.e., the debonding.
These problems were known by Atadero and Karbhari [10], who proposed a methodology for the
calibration of the preliminary resistance factors for externally-bonded wet-lay up CFRP, by following
the load and factor design (LRFD) as given by the AASHTO Code. The flexural strengthening of 20
reinforced-concrete T-beams bridge girders was designed hypothesizing different types of
applications, accounting for the environmental exposure and aiming to three different target reliability
levels, � = 2,5, 3,0 and 3,5. The collapse mode investigated was the debonding failure. The authors
proposed different values of the composite safety factor for given values of the general resistance
factors, pooling the analyzed bridges in different design groups, depending on the percent of steel loss.
As observed by Ceci et al. [4], the main drawback of the procedure followed by Atadero and Karbhari
is that only the randomness of the input parameters is considered and there is not a specific accounting
for the modeling uncertainties (or epistemic uncertainties). The variability related to the application of

5
the CFRP was considered only in terms of the coefficient of variation (COV) of the most critical
composite property, from which the composite partial safety factor depends. Moreover, they stressed
out the necessity to consider the high degree of variability related to the use of wet-lay up systems. To
account for the under-prediction of debonding strain using a simplified approach, they applied an
empirical factor of 1.5 to the predicted debonding strain. This could be considered as a bias factor.
However, they do not consider the uncertainty in the prediction model and therefore, no coefficient of
variation was considered. Pham and Al-Mahaidi [11] calculated the reduction factors for the strength
of retrofitted members based on the method outlined in Annex C of Eurocode [12]. In this simplified
analysis, without accounting for the load variation and other uncertainties, they assumed a sensitivity
factor for resistance equal to 0.8 and a target reliability index of 3.25. For those values they obtained a
capacity reduction factor of 0.6 for full composite strength (no debond) and intermediate span debond.
A factor of 0.5 was obtained for end debonding.
The final objective of the present study is to propose appropriate reliability-based design equations
with properly calibrated safety factors for flexural strengthened reinforced-concrete members at the
Ultimate Limit State, attempting to address all the issues discussed. The strengthening will be designed
both for prefabricated and wet-lay up systems and the so-called “model error” modelled by a random
variable will be introduced in the reliability-based calibration procedure [13]. In a recent study, Casas
and Chambi [14] calibrated a set of partial safety factors for CFRP wrapped bridge piers subject to
axial-bending actions by introducing the model error. The importance of taking into account the model
error in the strengthening to bending will be further discussed in chapter 5. The statistical analysis of
selected existing crack-induced debonding models will provide the necessary input to calibrate
appropriate safety factors that should be applied in conjunction with the selected models. In this way,
future design codes could provide to design engineers the tools necessary to use CFRP strengthening
schemes that would lead to uniform, consistent and economical safety levels.
2. Model assessment
To perform a proper reliability-based calibration, first of all, it is necessary to define accurately the
resisting mechanism analyzed. Indeed, it is extremely important that both the design equations and the
limit state function (LSF) developed represent as best as possible the behavior of the strengthened
member when subject to bending. For an appropriate calibration, the first step is to derive the most
accurate design equations for the debonding mechanism in CFRP strengthened members, based on the
available theoretical models, jointly with the statistical characterization of the random variable “model

6
error”. This random variable is defined as the ratio of the actual debonding failure load to the load
predicted by the model (� !"./�"$ �.) (see figure 1). The model error should be statistically
characterized by defining the type of random variable and its mean value (or bias ratio) and standard
deviation (or coefficient of variation).
Figure 1. Example of bending test made through the application of two concentrated external forces
(two-point bending).
Various models have been proposed to represent the IC debonding. Said and Wu [15] investigated the
performance and accuracy of five models available in code provisions and other literature. Test results
of 200 flexural specimens with IC debonding failures collected from the existing literature were used
in the comparison. Finally, based on the statistical analysis a simple model is proposed which provides
the best accuracy, with a model error with a bias ratio equal to 1.0 and a COV of 9.2 %.
In the study presented in [4], a statistical analysis of several proposed models for end debonding as
well as intermediate crack-induced debonding modes of failure are studied for beams in flexure. Two
different databases were assembled. The first database contains the results of four point bending tests
performed to study the behavior of the FRP-concrete bond at the end of the FRP sheet. The second
database which includes four point bending tests, three point bending tests and one point loading tests,
was created to examine intermediate crack-induced debonding. The design models which gave the
lowest COV while showing consistent results for end debonding for both prepeg and wet lay-up
installations were the Teng and Yao [16] and the Casas and Pascual model [17]. One clear advantage
of the Casas and Pascual model is that it can be used for end debonding and also for intermediate
crack-induced debonding. Additionally, Casas and Pascual model takes into consideration the
interaction between FRP, the resin and the concrete and therefore takes into account the properties of
the resin in the debonding mechanism. Generally, debonding models are checked in specimens of
small size, which may not represent properly the real structures where FRP strengthening is applied.
7
Available tests show that the maximum strain in the FRP at debonding is related to the dimensions of
the specimens [17]. The model proposed by Casas and Pascual also accounts for the dimensions of the
strengthened element in terms of cross-section depth and therefore is more suitable for the cases
analyzed here, i.e., bridge girders with large cross-section depths. As shown in [4], the statistical
analysis of this model provides a model error with a bias ratio equal to 1.8 and COV of 23 %.
The calibration procedure will be carried out for 2 models: Said and Wu [15] and Casas and Pascual
[17]. This will give the possibility to compare the sensitivity of the final results with the adopted
model, taking into account that one is calibrated over the mean value and the other with the
characteristic value (95 % fractile) of the experimental results. This could help to better understand the
results obtained, given that there are no previous cases of calibration of safety factors for IC debonding
where the model error variable is considered and to realize how the model error is a variable of
paramount importance in the reliability-based calibration.
The failure mode considered in the analysis (debonding) also makes a constraint on the response
model in bending to be used in the analyzed bridge sections. In most cases, and particularly in the case
of T-shape reinforced-concrete elements, it is known that debonding occurs before the ultimate
compressive strength of the concrete is reached. Moreover, usually concrete strains in the compression
zone are so low that the simplified rectangular stress-block cannot be used and it is necessary to refer
to another stress-strain relation. Therefore, it was decided to develop a simplified linear concrete
stress-strain relation. This allows to simplify the design equations and the limit state function, reducing
significantly the computational effort otherwise required.

8
3. Calibration
To start with the process of calibration and once the selection of the theoretical model and
corresponding uncertainty are done, the next step is to define the range of possible
structures/elements where the obtained safety factors will be of application. Therefore, the bridge
population is presented next.
3.1 Bridge population
In order to consider an appropriate range of geometries to calibrate the safety factors, seven
different reinforced concrete bridges are studied. They cover an important number of short and
medium span reinforced concrete bridges present in actual highways and railways. Therefore, a
large amount of the concrete bridge population is taken into account.
In order to simplify the references to the bridges, the following notation will be used (see Table 1
and Table 2). The first letter of the abbreviation indicates the shape of its cross-section:
- “B”, which means “beam”, for girder bridges;
- “S”, which means “slab”, for slab bridges.
The first symbol is followed by numbers, which represent the span lengths in meters. There will be
two digits for simply supported bridges and four digits for continuous bridges. Eventually, the last
two letters “RC” state the material of the bridge, which is reinforced concrete.
The concrete has a characteristic compressive strength equal to �� = 20%�&, while the
characteristic yielding strength of the steel is �� = 216%�&. These values are low because they
correspond to materials used in the 1940´s and 1950´ (Table 3). It should be pointed out that those
old bridges are clear candidates to be strengthened due to lack of resistance for actual traffic
conditions.
Bridge Deck width (m)
Number of girders
Girder spacing (m)
Web width (mm)
Girder depth (mm)
Slab depth (mm)
B10RC 9.35 6 1.50 350 1000 200 B12RC 9.35 6 1.50 350 1200 200 B16RC 9.35 6 1.50 350 1600 200 B20RC 9.35 6 1.50 350 2000 200
Table 1. Definition of the girder bridges.

9
Bridge Deck width (m)
Deck depth (mm)
box width (m)
flange width (m)
S10RC 12 1000 8.8 1.3 S1015RC 12 1300 8.4 1.3 S1520RC 11 1600 5.7 2.3
Table 2. Geometric definition of the slab bridges.
Table 3. Concrete and steel properties.
3.1.1 Girder bridges
The analyzed bridges are simply supported and have the same cross-section width, which counts six
principal beams. There are three transverse beams, two at the ends and one at the mid-span. As an
example, Figure 2 represents the cross-section of bridge B10RC. The bridges differ in span length
and principal and transverse beams depth as shown in Table 1.
As first step, it is checked if the bridges can withstand the actual traffic loads as required by the
Eurocode [18]. The results are summarized in table 4 for the mid-span section of a single beam. The
analysis shows that the design values of the bending moment due to the permanent loads and live-
load (Msd) are much higher than the design values of the resisting moment (Mrdold) calculated with
the actual reinforcement (Asold). Therefore, it is necessary to increment the reinforcing steel up to a
new value (Asnew) to get an adequate resisting moment (Mrdnew). This increment has an average
value of 32%. In the calculation, the relevant safety factors as given in the Eurocode were used.
Concrete
Characteristic compressive strength [MPa] 20 Specific weight [KN/m^3] 25
Steel
Characteristic yielding strength [MPa] 216

10
Figure 2. B10RC cross-section (dimensions in m).
Table 4. Old and new resisting moments of the girder bridges.
3.1.2 Slab bridges
The slab bridges analyzed are shown in figure 3. One is simply supported with a single span of 10
m, while the others are 3-span continuous over supports with main span of 15 and 20 m. The last
one has voided cross-section to decrease the self-weight. Again, in table 5 is shown the actual
disposed reinforcement calculated with the existing standards at the time of construction, and the
necessary reinforcement according to the Eurocode [18]. The mid-span sections subject to positive
moment are considered for strengthening
Bridge )*+
(KNm)
),+-.+
(KNm)
/*-.+
(012)
),+345
(KNm)
/*345
(012)
Tensile
steel
increment (%)
B10RC 5572 4396 255 6060 370 45.10
B12RC 7647 6390 295 7722 386 30.85
B16RC 13016 10836 386 13296 489 26.68
B20RC 20296 17208 488 21150 611 25.20

11
Figure 3. Slab bridges: spans and cross-sections (dimensions in m).

12
Table 5. Old and new resisting moments of the slab bridges.
3.2 IC debonding models
As mentioned before, the calibration procedure will be carried out for 2 models: Said and Wu [15]
and Casas and Pascual [17]. Before proceeding with the design and calibration procedure, it is
necessary to recall briefly their main characteristics.
3.2.1 Casas and Pascual (2007)
Casas and Pascual’s model can be used both as IC and plate-end debonding model. It differs from
other existing models mainly because it considers the properties of the bond layer and accounts for
the dimensions of the strengthened element, in terms of cross-section depth. Since the analyzed RC
members are bridge girders, i.e. elements with a large cross-section depth, it is possible to refer to
the simplified single-crack model proposed by Casas and Pascual. Indeed, in these members, the
distance between bending cracks (s) is larger than the effective bond length of the FRP (6 ); hence,
the condition at one crack is independent of the situation at the closer cracks.
The maximum shear stress before IC debonding occurs (789!) is given by:
:; = 789!6 (4)
where 789!=η<��, with ��=compressive strength of concrete, and = = 0,996, coefficient
experimentally determined.
If the stiffness of the strengthened concrete element is higher than the FRP stiffness, the effective
bond-length 6 is given by:
Bridge
)*+
(KNm) ),+-.+
(KNm) /*-.+
(012) ),+345
(KNm) /*>?@
(012)
S10RC 8698 6519 388 9179 570
S1015RC 9625 6899 303 9878 446
S1520RC 12289 9479 335 13599 493

13
6 = ABCD (5)
where
- E� = F�G� is the stiffness of the FRP for unit length;
- HI = CJCKCJLCK is the shear joint stiffness of concrete plus adhesive resin;
- H� = MKNKO , shear stiffness of the concrete;
- H$ = MJNJ , shear stiffness of the resin.
P$ and P� are the shear modulus of the resin and the concrete. Poisson’s coefficients for both
materials are taken respectively as 0.38 and 0.5; G$ is the resin thickness and G� is the concrete
thickness, calculated as suggested in [19]:
G� = Q� + 50.8 ≤ U2 VmmX (6)
where Q� is the width of the FRP and ℎ is the cross-section depth. The constant 50.8 mm
represents the concrete cover thickness (2 in.). This value is an approximate average value of
covers used in common bridges. Poisson’s coefficient for concrete has a high value, due to the
fact that the concrete is considered to be in the plastic range.
If H� ≫ H$, the shear deformation of the concrete can be neglected and HI = H$, so that:
6 = �[ = A\BNB
CJ (7)
The higher the FRP and adhesive stiffness the lower the debonding resistance: the parameter α
is a good estimator of the stiffness of the system and influence of cracking in the element.
Casas and Pascual’s model is calibrated over characteristic values (95% fractile).
3.2.2 Said and Wu (2008)
The FRP strain at IC debonding ]� I is expressed in a general form by the following equation:
]� I = ^�(�K)_`(\BNB)_a (8)
where C1, C2 and C3 are constants determined from experimental data.

14
The compressive strength of the concrete is considered not to have a significant effect on the IC
debonding, so that the high level of data dispersion, that characterizes the majority of the other
proposed models, is reduced. By referring to over 200 testing data, the constants that appear in
equation (8) are determined:
]� I = b.2c��K�d.`�\BNB�d.ae (9)
where �� is the characteristic concrete compressive resistance. Said and Wu’s model is calibrated
over mean values.
3.3 Design equation
In order to perform the calibration of the safety factors, it is necessary, first, to set the design
equations, in which the unknown safety factor γ multiplies the whole resisting moment of the
strengthened cross-section. Those design equations will also serve to derive the limit state function.
The assumptions made are:
a- A plane section before loading remains plane after loading;
b- There is no relative slip between external FRP reinforcement and the concrete;
c- The shear deformation within the adhesive layer is neglected because of its thin and non-
uniform thickness;
d- The maximum compressive strain at failure in the concrete is 0.0035;
e- The tensile strength of concrete is neglected;
f- The FRP reinforcement has a linear elastic stress-strain relationship to failure.
The flexural strengthening is obtained by bonding a FRP plate to the soffit of the beam, through
prefabricated or wet-lay up systems (Table 6). The strengthening for the studied bridges is designed
for both systems (Table 7). For the girder bridges, the CFRP strip is deployed underneath each
girder covering the full width (one strip per girder).
Due to the T-shape of the analyzed sections, the failure of the beams will always occur by FRP
debonding, after yielding of the steel. This means that the maximum IC debonding strain is the
leading parameter in the design of the strengthening.

15
System Properties
Elastic
modulus
(MPa)
Ultimate
strength
(MPa)
Ultimate
strain
Precured Of the
composite
160,000 2560 0.016
Wet-lay up Of the
fiber
230,000 3680 0.016
Table 6. CFRP properties.
Table 7. Characteristics of strengthening.
The general design equation (1) is expressed in the case of ULS of bending as:
%$� = % � (10)
Msd = bending moment due to actions. It is obtained multiplying the permanent loads and live load
due to traffic by the corresponding safety factor as described in the Eurocode.
Mrd = resisting moment. For the strengthened member it will take the form:
%$� = fg ��(h − jk) + g 2� (jk − h2) + glmlh�n (11)
Bridge Number of
strips
Strip width
(mm)
B10RC 6 350
B12RC 6 350
B16RC 6 350
B20RC 6 350
S10RC 20 200
S1015RC 18 200
S1520RC 12 200

16
where is the safety factor that needs to be calibrated; g and g 2 are the tensile and compressive
steel area, respectively (the compressive steel area is defined only for girder bridges);gl is the area
of the composite; �� is the characteristic steel yielding resistance; � is the characteristic tension in
the compressed steel; ml is the stress in the composite when debonding occurs, calculated according
to the chosen debonding model; h is the effective depth of the steel in tension; k is the neutral axis
depth; j is a coefficient which indicates the position of the force resulting from concrete
compression compared to the neutral axis; h2 is the distance between the barycenter of the
compressed steel and the upper section edge; h�is the distance between the barycenter of the
composite layer and the resultant of concrete in compression.
Concerning the design equation in bending (equation 11), it is well-known that 2 main formats are
used. In the European codes and standards, the partial safety factors are defined for each material,
whereas in the North-American approach, a global safety response factor affects the whole
response. In the present case, the way the model error is determined (see section 2 and figure 1)
suggests that the corresponding variable should be considered affecting the whole concrete-steel-
composite resisting mechanism in the corresponding Limit State Function (LSF) and design
equation. Therefore, the safety factor is placed to multiply the whole resisting moment of the
strengthened cross-section as described in equation 11.
As the behavior of the FRP is brittle, the ultimate strain of concrete may not have been reached
when the FRP ruptures or delamination occurs. Actually this is what happens in the analyzed
sections, because the debonding failure occurs before the concrete reaches the ultimate strain
]�; = 0,0035. Moreover, strains in the concrete at failure result very low for girder bridges, in the
order of 0.3‰ to 0.7‰. This means that the use of the simplified rectangular stress-block for the
concrete is no longer valid. Another type of stress-strain relationship must be considered, such as
the parabola-rectangle or the bilinear ones. In order to facilitate calculations a linear relation is
taken, assumption legitimized by the small strain values. In fact, the simplification consists in
taking a Young modulus of the concrete equal to F� = 22750%�&. This value, if the parabolic
branch of the parabola-rectangle diagram is considered, corresponds to the secant modulus at the
strain 0.00075, which is the maximum concrete strain reached in the analyzed sections. The
considered parabola-rectangle relation is that suggested by NTC2008 [20]:

17
m� = 2 �KpqK` r]� − qK`
2qK`s 0 T ]� T ]�2 (12)
where ]�2is equal to 0.2 % .
It can be seen in figure 4, as the difference between taking the parabolic relation or the linear one is
minimum. This choice is done in order to simplify the design equations, but also all the iterative
procedure that involves the Monte Carlo simulation for the calculation of the probability of failure,
since a parabolic relation would have been much more laborious in computational terms. The error
in the simplified model is around 3 % when compared with the complete model.
Figure 4. Linear approximation of the parabola stress-strain relation of the NTC08 for fcd=28
MPa.
3.4 Monte Carlo simulation
The calculation of the reliability of the strengthened elements can be made through the definition of
the LSF governing the problem and the implementation of a Monte Carlo simulation [21].
The limit state function is written as:
P = %$ −%�t −%tt (13)

18
where %$ is the resisting moment of the structural member, %�t is the acting moment due to
permanent loads, and %tt is the acting moment due to live loads. All of them are random variables.
More specifically, the resisting moment is given by:
%$ = u(g � (h − jk) + g 2� 2(jk − h2) + glmlh�) = u(g � (h − jk) + g 2] 2F (jk − h2) + gl]lFlh�) (14)
where u is the model error variable, Es and EF are the elasticity modulus of steel and composite; the
other terms have already been explained. The modelling random variable (Φ), is also considered
which takes into account the model error when estimating the flexural strength of the strengthened
element via a particular model, and depends on the debonding model adopted in the design. In this
case, the adopted models are the one from Said and Wu, and Casas and Pascual. In both cases, the
corresponding random variable is taken as Normally distributed with bias ratio equal to 1.0 and
COV= 9.2 % in the first case, and a bias ratio 1.8 and COV = 23 % in the second. The bias and
COV are higher for Casas and Pascual’s model. The high value of the bias is due to the fact that
Casas and Pascual was calibrated on characteristic values (95% fractile), whereas Said and Wu was
calibrated on mean values. This should be taken into account when interpreting the values of the
partial safety factors derived in each case.
All the statistical properties of the rest of random variables participating in the limit state function
(equation 13) are listed in Table 7. The concrete compressive strength appears in the limit state
function through the variable neutral axis depth (x). The nominal value for the dead load is
calculated based on the dimensions of the elements and the density of reinforced concrete. The bias
and COV are those normally assumed for concrete elements “cast in situ” [22]. The nominal value
for the traffic actions are the characteristic values of these actions according to Eurocode 1 [18],
defined as the percentile of 5 % for a time period of 50 years. The coefficient of variation for traffic
action is taken as 20 % according to [23]. The geometrical dimensions are considered as
deterministic due to their low variability.

19
Table 7.- Definition of random variables
3.4.1 Safety of the original bridges
The reliability index �of the existing bridges, just before any composite strengthening can be seen
in Table 8. The initial reliability indexes are still quite high, even though the percent of steel lack is
considerable in respect to the Eurocode requirements. This reflects the higher values of the target
reliability index (in the order of 3.8) for which the Eurocode values were calibrated.
Bridge w
value
B10RC 2,680
B12RC 2,880
B16RC 3,209
B20RC 3,482
S10RC 2,514
S1015RC 2,420
S1520RC 2,756
Table 8. Reliability index of the actual bridges.
Variable Statistical
distribution
Bias COV Reference
Concrete compressive
strength
Lognormal 1.40 0.15 [11,22]
Concrete elasticity
modulus
Lognormal Depends on compressive strength
(simplified model)
0.10 [10]
CFRP elasticity
modulus
Lognormal Precured: 1.05
Wet-lay up: 1.05
0.09
0.15
[2,10]
[8,24]
Steel yield strength Lognormal 1.20 0.08 [7,22]
Dead load Normal 1.05 0.10 [22,25]
Live load Gumbel 0.73 0.20 [7]

20
3.4.2 Target reliability
According to Table 9, the target reliability index is chosen. The table refers to a one year reference
period, whereas in this work a 50 years reference period is considered. It means that the target
values of � are lower than those proposed in Table 9. As suggested in [27], the transition from a 1
year reference period to a 50 years reference period implies a decrease of the reliability factor
approximately of 0.7. Therefore, placing the studied bridges in a class that can be the Moderate or
Large Consequences of Failure Class and assuming a small to normal Relative Cost of Safety
Measure, the target � can be set between 3.5 and 4. The calibration will be conducted for both the
extreme values of this interval.
Relative cost of
safety measure
Consequences of failure
Minor Moderate Large
Large (A) � = 3,1(xl≈ 10zc)
� = 3,3(xl≈ 10z{)
� = 3,7(xl≈ 10z{)
Normal (B) � = 3,7(xl≈ 10z{)
� = 4,2(xl≈ 10z})
� = 4,4(xl≈ 10z~)
Small (C) � = 4,2(xl≈ 10z})
� = 4,4(xl≈ 10z})
� = 4,7(xl≈ 10z~)
Table 9. Tentative target reliability indices � (and associated target failure rates) related to one
year reference period and Ultimate Limit State [26].
4. Results
To obtain a set of calibrated safety factors, different strengthening designs (different values of
CFRP thickness) according to assumed values of γ are obtained and the corresponding reliability
indexes are calculated. The proposed value of γ will be that resulting in a reliability index closer to
the target value. Two target values are considered: β0= 3.5 and 4.0.
Results found for Said and Wu’s model are shown in Table 10. It can be seen that the composite
thicknesses necessary to get the wanted reliability index are small for both reliability targets, and
this is due to the fact that Said and Wu is not a very conservative model as it has been calibrated
with mean values of the tests. It should be mentioned that G� in the case of wet-lay up systems refers

21
to the fiber thickness alone and, therefore, an equivalent composite thickness should be calculated
to know the real thickness of the applied system.
β=3.5
Bridge
Precured Wet-lay up
γ G�$"(mm) G�(mm)
B10RC 0.839 0.700 0.838 0.490
B12RC 0.861 0.640 0.855 0.470
B16RC 0.893 0.560 0.887 0.400
B20RC 0.910 0.500 0.908 0.360
S10RC 0.899 0.510 0.893 0.370
S1015RC 0.904 0.460 0.904 0.320
S1520RC 0.882 0.750 0.880 0.530
β=4.0
Bridge
Precured Wet-lay up
γ G�$"(mm) G�(mm)
B10RC 0.744 1.370 0.743 0.960
B12RC 0.766 1.360 0.764 0.960
B16RC 0.799 1.320 0.802 0.920
B20RC 0.828 1.350 0.825 0.960
S10RC 0.812 0.900 0.808 0.640
S1015RC 0.820 0.780 0.815 0.560
S1520RC 0.790 1.460 0.790 1.010
Table 10. Results for Said and Wu, β=3.5 and β=4.0.
The final values for the global safety factor should be determined by taking into account the highest
number of different design cases, in order to find a value that could be suitable to each situation.
The problem in determining a value for the safety factor is that each is found here by referring to
a particular design case, which differs from the others for shape of the section, type of bridge,
composite system and level of initial tensile steel lack. Therefore, it is difficult to choose an
appropriate range of designs for the calibration of the safety factor. Anyway, the COV for precured
and wet-lay up systems are very close (0.09 and 0.15 respectively), so that it is decided to propose

22
the same safety factor for both systems. In this way, the number of the variable properties affecting
the problem is reduced. As proposed even by Atadero et al. [10], the baseline for the design is
defined as the amount of steel lack compared to the steel quantity needed according to the Eurocode
requirements. For slab bridges the choice of this baseline comes almost natural, since they present
the same percent of steel loss (32%). Instead, girder bridges present a different percent of steel lack
(going from B10RC to B20RC, 45.10%, 30.85%, 26.68%, 25.20%, respectively). Hence, they
should be divided in different groups. Looking at the results obtained, it was decided to place
B10RC and B12RC in two different pools (50%<steel lack<40%, 40%<steel lack<30%), while
B16RC and B20RC were placed in the same group (30%<steel lack<20%).The final values were
taken by rounding-down the found values of Table 10, when necessary. The chosen safety factors
are listed in Table 11 for each design group and target reliability index.
Table 11. Proposed safety factor for Said and Wu model.
Looking at Table 11, a more simplified proposal for the safety factors to be considered is a value of
0.85 to get a reliability index of 3.5 for almost all the bridges. A value of 0.75 is proposed to get a
reliability index equal to 4. Hence, the strength reduction factor of 0.75, suggested by Said and Wu
themselves [15], assures a target β=4.0 even for high percent of tensile steel loss. Therefore, the
recommended value, although not based on a reliability analysis, already assured a high level of
safety. The safety factor proposed by Said and Wu was based just on engineering judgment and
available experimental results, without any reliability background. The results obtained in the
present thesis confirm that the proposed safety factor derives on a too high level of safety, which is
clearly uneconomical because of the high cost of the strengthening material. So the value of 0.85,
corresponding to a reliability level of 3.5, is considered more reasonable to be applied in real cases.
Design group Proposed γ
β=3,5 β=4,0
B10RC (50% < steel lack < 40%) 0.835 0.740
B12RC (40% < steel lack< 30%) 0.850 0.750
B16RC, B20RC (30%< steel lack < 20%) 0.885 0.795
S10RC, S1015RC, S1520RC (35%<steel lack<30%) 0.880 0.790
23
We should note that this value is much higher than the 0.6 proposed in [11] for a target reliability
index of 3.25, showing the limitation of the simplified model used there, deriving on a too
conservative design.
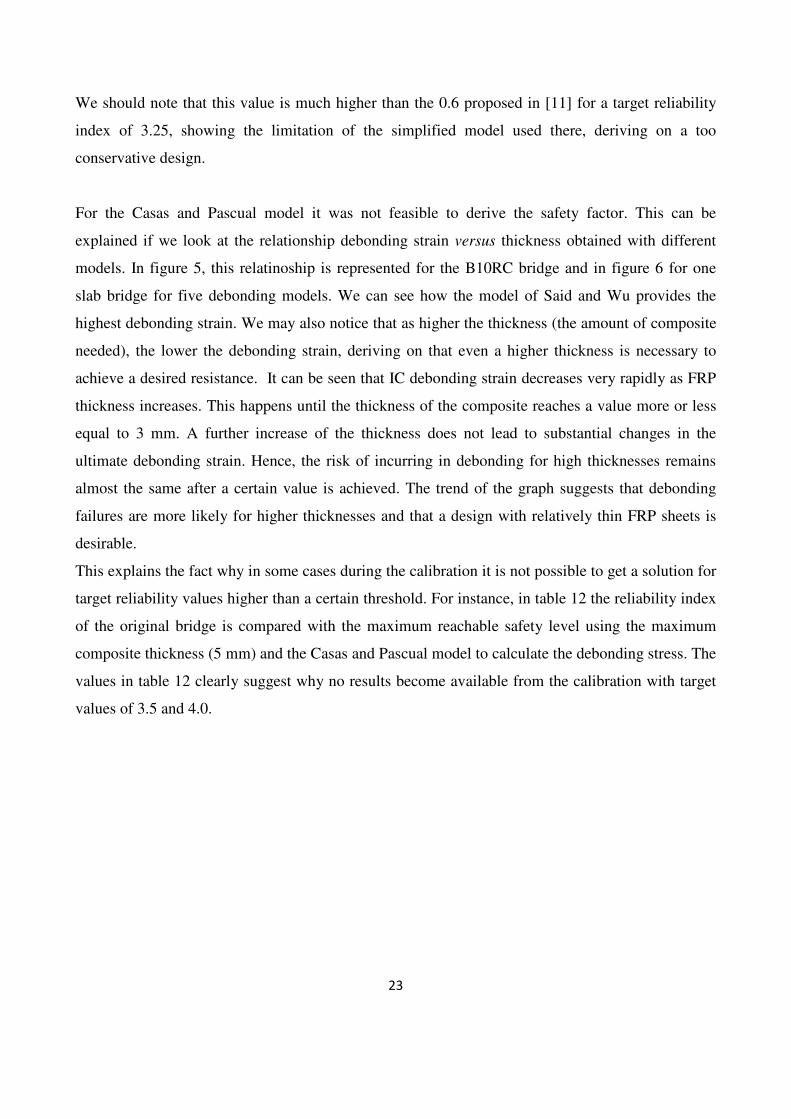
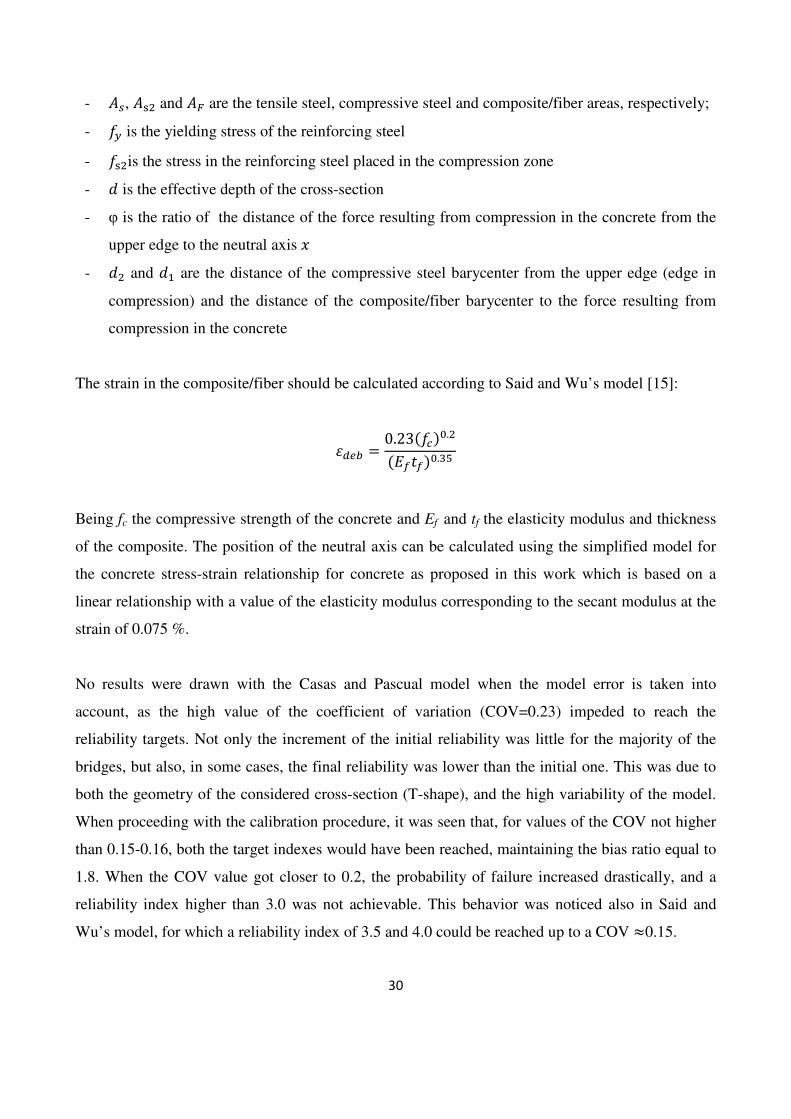
For the Casas and Pascual model it was not feasible to derive the safety factor. This can be
explained if we look at the relationship debonding strain versus thickness obtained with different
models. In figure 5, this relatinoship is represented for the B10RC bridge and in figure 6 for one
slab bridge for five debonding models. We can see how the model of Said and Wu provides the
highest debonding strain. We may also notice that as higher the thickness (the amount of composite
needed), the lower the debonding strain, deriving on that even a higher thickness is necessary to
achieve a desired resistance. It can be seen that IC debonding strain decreases very rapidly as FRP
thickness increases. This happens until the thickness of the composite reaches a value more or less
equal to 3 mm. A further increase of the thickness does not lead to substantial changes in the
ultimate debonding strain. Hence, the risk of incurring in debonding for high thicknesses remains
almost the same after a certain value is achieved. The trend of the graph suggests that debonding
failures are more likely for higher thicknesses and that a design with relatively thin FRP sheets is
desirable.
This explains the fact why in some cases during the calibration it is not possible to get a solution for
target reliability values higher than a certain threshold. For instance, in table 12 the reliability index
of the original bridge is compared with the maximum reachable safety level using the maximum
composite thickness (5 mm) and the Casas and Pascual model to calculate the debonding stress. The
values in table 12 clearly suggest why no results become available from the calibration with target
values of 3.5 and 4.0.

24
Figure 5. Debonding strain vs. composite thickness for B10RC (precured system).
Figure 6. Debonding strain vs. composite thickness S1015RC (precured system).

25
Bridge Initial
β
Maximum
achievable β
B10RC 2,680 3,076
B12RC 2,880 3,038
B16RC 3,209 2,951
B20RC 3,482 2,958
S10RC 2,514 3,087
S1015RC 2,420 3,187
S1520RC 2,756 3,119
Table 12. Maximum achievable β for G�$"=5 mm (Casas and Pascual model. Precured system).
Another remarkable issue in table 12 is the fact that in 2 cases, the reliability index of the
strengthened bridge is lower than the original one, what leads to the paradox that it is safer to not
strengthen the bridge. How may this be possible ? As seen, this happens for the girder bridges with
the highest cross-section depth. In the original bridge at failure, the reinforcing steel is working at
the yield stress with a high strain (normally limited to 1 %). The tension force in the steel is
equilibrated by a small compression block at the top of the section with the concrete working at the
compressive strength. However, in the strengthened bridge, the limitation of the debonding strain
(around 0.2-0.3 % for large thickness) in the composite also derives in a low strain in the
reinforcing steel in the same order of magnitude. Despite this low strain, the reinforcing steel still
reaches the yielding stress. Therefore, to compensate the tensile force in the reinforcing steel and
the composite, it is necessary a larger compression block, with the concrete working at a stress
lower than the maximum compressive strength. As a consequence, the level of the neutral axis
comes down and the corresponding resisting moment decreases. The increase in the tension force
due to the composite does not compensate the decrease in the level arm of the resisting moment.
Therefore, this phenomenon occurs because the application of the CFRP changes the failure criteria.
In the original bridge the failure is reached when the concrete in compression crushes; in the
strengthened beam, when the CFRP debonds. The effect is more critical as the cross-section depth
is larger and the shape of the cross-section is of the T-beam type. In fact, for this section shape, due
to the small web width, it is necessary to use a thick layer of composite to reach the required

26
increase of resistance. In conclusion, strengthening in flexure with CFRP is not suitable in all cases
and this effect should be investigated before a strengthening solution by CFRP bonding is proposed,
mainly in T-shape elements with large cross-section depth as is the case of slab on girder bridges.
The coefficient of variation (COV) of the debonding model also plays an important role in this
behaviour. For this reason, the Said and Wu model does not present this paradox due to its lower
COV compared to Casas and Pascual model. However, the trend can be observed even for Said and
Wu’s model, although less evidently, since the COV value is lower. In particular, it is visible when
comparing the obtained composite thicknesses in case of β=3.5 and β=4.0 (Table 10). Indeed, when
the target β is fixed equal to 4.0, the values of the composite thicknesses become almost equal for
all girder bridges; results are more different for β=3.5. The needed G�$" for B20RC results even
higher than that found for B16RC: to increase the reliability index is equivalent to set lower
constraints to the admissible strains in the CFRP, and these constraints are inevitably more
restrictive for cross-sections with a high depth.
5. Importance of model error
In the previous chapter it is shown how the model error may highly influence the design of the
strengthening, provoking in specific cases the unsuitability of a CFRP application. To see the
sensitivity of the partial safety factors to the model error, the results of the calibration with the
model of Said and Wu and the model of Casas and Pascual assuming that they are 100 % exact in
the prediction of the debonding strain were obtained. If no model error is considered and only the
uncertainties related to the materials are taken into account, then the governing equations are:
• Design equation (Design value of the resisting moment):
%$� = $fg ��(h − jk) + g 2� (jk − h2) + glmlh�n (15)
As before, the equilibrium equation is calculated around the point of application of the concrete
compressive force.
• Limit state function (Resisting moment):
%$ = g � (h − jk) + g�2��2(jk − h2) + glmlh� (16)

27
The results obtained for a target value � = 4.0 are presented in tables 13 and 14. A comparison of
the two models is not straightforward for a β= 3.5 because in this case, the safety requirement can
be satisfied with a smaller thickness of CFRP, which is less sensitive to the debonding problem.
This is particularly true in the case of the Said and Wu model, where for all cases except one, the
small thickness of the composite necessary to accomplish the ULS of bending imposing the
debonding failure mode, results in the premature failure of the composite/fiber before reaching the
debonding. The terms “rupture of the composite” and “rupture of the fiber” mean that the failure
occurs because the ultimate limit strength of the composite/fiber is reached. Therefore, it becomes
meaningless going on with the calibration to debonding, since there are no more safety factors that
need to be calibrated and the probability of failure (reliability index) is that of the rupture of the
composite/fiber. This happens for Said and Wu’s model more than for the other, since, it is the less
conservative as it has been calibrated with mean values of the tests (see figures 5 and 6). Also,
because Said and Wu model is less conservative, for similar values of the partial safety factor, the
required thickness of the CFRP is much lower.
It can be seen again that the safety factors for precured systems are a little bit higher than those for
wet-lay up systems. This is because wet-lay up systems have an elastic modulus with a higher
coefficient of variation (COV=0.15), due to the larger number of uncertainties related to their
application in situ. However, again as in the case where model error is considered, in practice the
same safety factor may be used in both systems. A roughly value of 0.9 and 0.85 can be taken
respectively for Said and Wu and Casas and Pascual models. This is somewhat unexpected, as Said
and Wu model, being less conservative should, in theory, result on higher safety factors. This
unlogical result is due, in fact, to not consider the model error. According to the prediction of the
models (see figures 5 and 6), as the model becomes more conservative, more composite thickness is
required for a certain level of strengthening as seen in tables 13 and 14. When Said and Wu is
applied, the calibration gives lower thicknesses for the same bridge and target β than those given by
the Casas model, since the contribution attributed to the composite is higher. A higher amount of
composite means a higher contribution to the resistance in comparison to the contribution of the
yielding steel. As the composite as material present a higher variability, the final result is a lower
safety factor. This does not happen if the model error is taken into account. In fact, the comparison
of the values in tables 10 and 13 for the Said and Wu model and and � = 4.0 come to the
conclusion about the importance of considering the model error in a reliability-based analysis. In

28
the case of not considering the model error a safety factor of roughly 0.9 could be considered,
which is much higher than the value of 0.75 obtained when model error is taken into account. Also,
the thickness of composite required when model error is considered is almost twice the amount
obtained when model error is neglected (see values of table 10 for a reliability index equal to 4.0
and values in table 13). Therefore, to introduce the model error variable together with the other
uncertainties commonly adopted in a reliability analysis is indispensable to properly evaluate the
reliability of the model applied and to calibrate accurately the corresponding safety factors.
β=4.0
Bridge
Precured Wet-lay up
$ G�$"(mm) $ G�(mm)
B10RC 0.823 0.790 0.817 0.580
B12RC 0.847 0.720 0.847 0.500
B16RC 0.899 0.570 0.893 0.380
B20RC RUPTURE OF THE
COMPOSITE
RUPTURE OF
THE FIBER
S10RC 0.919 0.440 0.918 0.310
S1015RC 0.928 0.390 0.927 0.290
S1520RC 0.900 0.750 0.878 0.540
Table 13. Model of Said and Wu. Results when the model error variable is not considered.
β=4.0
Bridge
Precured Wet-lay up
$ G�$"(mm) $ G�(mm)
B10RC 0.806 4.530 0.803 3.300
B12RC 0.822 4.230 0.822 3.000
B16RC 0.877 3.020 0.873 2.230
B20RC 0.913 2.130 0.912 1.500
S10RC 0.899 2.120 0.898 1.490
S1015RC 0.905 1.600 0.904 1.120
S1520RC 0.868 4.060 0.867 2.880
Table 14. Model of Casas and Pascual. Results when the model error variable is not considered.

29
6. Conclusions
A reliability-based analysis was performed to calibrate the partial safety factors for two
intermediate crack-induced debonding models. The models were applied to design the flexural
strengthening of seven existing reinforced concrete bridges representative of a large concrete bridge
population and that present different levels of reinforcing tensile steel lack.
The performed reliability-based analysis considered for the first time the model error in the
debonding model as one of the main variables participating in the Limit State Function and,
therefore, in the safety of the strengthened element. The way the introduction of this variable affects
the results was also discussed. The model error was placed to multiply the whole resisting moment
and not just the debonding strain in the composite. For the sake of coherence, the safety factor was
also placed affecting the whole resisting moment in the design formula.
Results were found for Said and Wu’s model, for two target reliability indexes, β=3.5 and β=4.0.
The design values for the safety factors were determined by grouping the bridges on the base of
their percent of steel lack. The proposed values show that a safety factor equal to 0.75, as already
suggested by Said and Wu [15], assures a reliability index close to 4.0 for bridges with a steel lack
ranging from 50% to 30%. Note that this value is excessive for bridges that present a lower percent
of steel lack. This is why, a lower value of the target reliability index in the range of 3.5 or even
lower is proposed as a result of the present work, which consists on a global safety factor equal to
0.85 for both prefabricated and wet-lay up systems. This value is much higher than the 0.6 proposed
in [11] for a target reliability index of 3.25, showing the limitation of the simplified model used
there in performing the reliability analysis which derives in over-conservative strengthening
solutions.
Therefore, the proposed design equation for the resisting moment when strengthening with CFRP in
bending for both prefabricated and wet-lay up systems when the failure is due to IC debonding of
the laminate, is the following:
%$� = 0.85�g ���h − jk� + g�2��2�jk − h2� + glmlh��
where
30
- g , g�2 and gl are the tensile steel, compressive steel and composite/fiber areas, respectively;
- �� is the yielding stress of the reinforcing steel
- ��2is the stress in the reinforcing steel placed in the compression zone
- h is the effective depth of the cross-section
- φ is the ratio of the distance of the force resulting from compression in the concrete from the
upper edge to the neutral axis k
- h2 and h� are the distance of the compressive steel barycenter from the upper edge (edge in
compression) and the distance of the composite/fiber barycenter to the force resulting from
compression in the concrete
The strain in the composite/fiber should be calculated according to Said and Wu’s model [15]:
]� I = 0.23����b.2�F�G��b.c}
Being fc the compressive strength of the concrete and Ef and tf the elasticity modulus and thickness
of the composite. The position of the neutral axis can be calculated using the simplified model for
the concrete stress-strain relationship for concrete as proposed in this work which is based on a
linear relationship with a value of the elasticity modulus corresponding to the secant modulus at the
strain of 0.075 %.
No results were drawn with the Casas and Pascual model when the model error is taken into
account, as the high value of the coefficient of variation (COV=0.23) impeded to reach the
reliability targets. Not only the increment of the initial reliability was little for the majority of the
bridges, but also, in some cases, the final reliability was lower than the initial one. This was due to
both the geometry of the considered cross-section (T-shape), and the high variability of the model.
When proceeding with the calibration procedure, it was seen that, for values of the COV not higher
than 0.15-0.16, both the target indexes would have been reached, maintaining the bias ratio equal to
1.8. When the COV value got closer to 0.2, the probability of failure increased drastically, and a
reliability index higher than 3.0 was not achievable. This behavior was noticed also in Said and
Wu’s model, for which a reliability index of 3.5 and 4.0 could be reached up to a COV ≈0.15.

31
In the light of all these considerations, what emerges from the study is that:
1) A design safety factor equal to 0.85, corresponding to a target safety level with a reliability
index of 3.5 may be used when designing a flexural strengthening of reinforced concrete
structural elements with Said and Wu’s model for IC debonding failure
2) It is not always worth to strengthen in bending existing structures with FRPs. Indeed, if the
failure mode is IC debonding and the variability of the debonding model used in the design is
too high, the probability of failure of the strengthened bridge can exceed that of the original
bridge. Partially this is mainly due to the fact that ultimate debonding strains are generally
very low and easy to achieve. When the bridge is strengthened with the composite, the failure
mode of the section is altered (from concrete crushing or steel rupture in the case of a standard
reinforced concrete element to FRP debonding) and the leading design parameter becomes the
FRP debonding strain, which presents very low values, easily reached in the case of T-shape
cross-sections and/or large cross-section depths. In these cases, the low strain in the tensile
reinforcement (both existing steel and additional CFRP) produces also a low strain in the
compressed concrete and the lowering of the neutral axis and, therefore, a lower resisting
moment than in the case without CFRP strengthening.
Moreover, if the applied IC debonding model is too conservative and the model error too high,
then the maximum allowable debonding strain is even lower and more uncertain and it
becomes really difficult to reach the wanted reliability target, even with thick composite
layers.
3) The value of the safety factor is strictly related to the adopted debonding model. It varies
mainly depending on if the model is calibrated over mean values or characteristic values.
4) It is indifferent to use a debonding model fitted to the mean or characteristic values of tests, as
far as the model error (bias ratio and coefficient of variation) is taken into account in the
calibration process.
5) A reliability-based analysis should be performed for each of the debonding models used in the
available codes and guidelines, as to correctly evaluate the corresponding design safety
factors. To this end, the model error variable should be statistically defined first for the
different debonding models used in those codes.

32
Acknowledgements
The authors want to thank the Spanish Ministry of Economy for the financial support provided
through Research Project BIA2010-16332.
References
[1] Hollaway LC. A review of the present and future utilization of FRP composites in the civil
infrastructure with reference to their important in-service properties. Construction and
Building Materials 2010; 24: 2419-2445.
[2] Holloway LC, Teng JG. Strengthening and rehabilitation of civil infrastructure using fiber-
reinforced polymer (FRP) composites. 1st ed., Woodhead Publishing Limited, 2008.
[3] Ceci A. Development of design specifications for strengthening deteriorated concrete
bridge elements using externally applied FRP sheets. Master Thesis. Technical University
of Catalunya. Barcelona, 2009
[4] Ceci A., Casas JR, Ghosn M. Statistical analysis of existing models for flexural
strengthening of concrete bridge beams using FRP sheets. Construction and Building
Materials 2012; 27(1): 490-520.
[5] Triantafillou TC, Plevris N. Strengthening of RC beams with epoxy-bonded fibre-
composite materials. Materials and Structures 1992; 25(4): 201-211.
[6] Plevris N, Triantafillou TC, Veneziano D. Reliability of RC Members Strengthened with
CFRP Laminates. Journal of Structural Engineering (ASCE) 1995; 121(7): 1037–1044.
[7] Okeil AM, El-Tawil S, Shahawy M. Flexural reliability of reinforced concrete bridge
girders strengthened with carbon fiber-reinforced polymer laminates. Journal of Bridge
Engineering (ASCE) 2002; 7(5): 290–299.
[8] Atadero R, Lee L, Karbhari VM . Consideration of material variability in reliability
analysis of FRP strengthened bridge decks. Composite Structures 2005; 70: 430-443
[9] Monti G, Santini S. Reliability based calibration of partial safety coefficients for fiber-
reinforced plastic. Journal of Composites for Construction 2002; 6(3): 162–167.
[10] Atadero RA, Karbhari VM. Calibration of resistance factors for reliability based design of
externally-bonded FRP composites. Composites: Part B 2008; 39: 665-679.
33
[11] Pahm HB, Al-Mahaidi R. (2008). Reliability analysis of bridge beams retrofitted with fibre
reinforced polymers. Composite Structures 2008; 82: 177-184
[12] EN1990:2002. Eurocode 0: Basis of structural design. European Committee for
Standardization (CEN), Brussels, Belgium, 2002
[13] Trentin C. Reliability-based calibration of partial safety factors for CFRP strengthening in
bending of RC bridges. Master Thesis. Faculty of Civil Engineering, Padova (Italy), 2013.
[14] Casas JR, Chambi JL. Partial safety factors for CFRP-wrapped bridge piers: model
assessment and calibration. Composite Structures 2014; 118: 267-283
[15] Said H, Wu Z. Evaluating and Proposing Models of Predicting IC Debonding Failure.
Journal of Composites for Construction 2008; 12(3): 284-299.
[16] Teng JG, Yao J. Plate end debonding in FRP-plated RC beams II: strength model.
Engineering Structures 2007; 29:2472-86
[17] Casas JR, Pascual J. Debonding of FRP in bending: Simplified model and experimental
validation. Construction and Building Materials 2007; 21: 1940-1949.
[18] EN1991-2:2003. Eurocode 1: Action on structures – Traffic loads on bridges. European
Committee for Standardization (CEN), Brussels, Belgium, 2003
[19] Harmon TG, Kim YJ, Kardos J, Johnson T, Stark A. Bond of surface-mounted fiber-
reinforced polymer reinforcement for concrete structures. ACI Structural Journal
2003;100(5):557–64.
[20] NTC2008. Norme tecniche per le costruzioni, chapters 4 and 12. Rome, Italy, 2008
[21] Melchers RE. Structural reliability analysis and Prediction. 2nd ed., Wiley, 1999
[22] Nowak AS, Collins KR. Reliability of structures. McGraw-Hill, 2000
[23] Casas JR, Gomez JD. Load rating of highway bridges by proof-loading. Journal of Civil
Engineering (KSCE) 2013; 17(3): 556-567.
[24] Atadero RA, Karbhari VM. Sources of uncertainty and design values for field-
manufactured FRP. Composite Structures 2009; 89: 83-93.
[25] Schneider J. Introduction to Safety and Reliability of Structures. 2nd ed., International
Association for Bridge and Structural Engineering (IABSE), Zurich, 2006
[26] Diamantidis D. Probabilistic Assessment of Existing Structures – A publication of the Joint
Committee on Structural Safety (JCSS). 1st ed., RILEM Publications, 2001
[27] Ellingwood BR, Galambos TV, MacGregor JG, and Cornell CA . Development of a
probability based load criterion for American National Standard A58. NBS Special

34
Publication 577, National Bureau of Standards, U.S. Department of Commerce,
Washington, D.C., 1980
[28] CNR-DT 200/R1/2013. Guide for design and construction of externally bonded FRP
systems for strengthening concrete structures. Rome: National Research Council, 2013


