Safe harbor and non-GAAP measuress2.q4cdn.com/056532643/files/doc_financials/2018/q4/Q4FY18... ·...
30
Transcript of Safe harbor and non-GAAP measuress2.q4cdn.com/056532643/files/doc_financials/2018/q4/Q4FY18... ·...

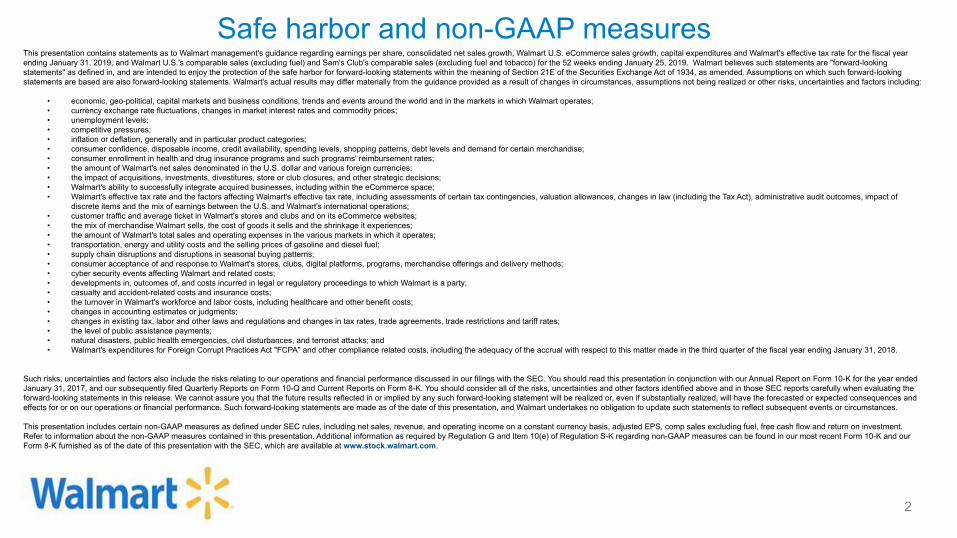
Safe harbor and non-GAAP measuresThis presentation contains statements as to Walmart management's guidance regarding earnings per share, consolidated net sales growth, Walmart U.S. eCommerce sales growth, capital expenditures and Walmart's effective tax rate for the fiscal yearending January 31, 2019, and Walmart U.S.'s comparable sales (excluding fuel) and Sam's Club's comparable sales (excluding fuel and tobacco) for the 52 weeks ending January 25, 2019. Walmart believes such statements are "forward-lookingstatements" as defined in, and are intended to enjoy the protection of the safe harbor for forward-looking statements within the meaning of Section 21E of the Securities Exchange Act of 1934, as amended. Assumptions on which such forward-lookingstatements are based are also forward-looking statements. Walmart's actual results may differ materially from the guidance provided as a result of changes in circumstances, assumptions not being realized or other risks, uncertainties and factors including:
• economic, geo-political, capital markets and business conditions, trends and events around the world and in the markets in which Walmart operates;• currency exchange rate fluctuations, changes in market interest rates and commodity prices;• unemployment levels;• competitive pressures;• inflation or deflation, generally and in particular product categories;• consumer confidence, disposable income, credit availability, spending levels, shopping patterns, debt levels and demand for certain merchandise;• consumer enrollment in health and drug insurance programs and such programs' reimbursement rates;• the amount of Walmart's net sales denominated in the U.S. dollar and various foreign currencies;• the impact of acquisitions, investments, divestitures, store or club closures, and other strategic decisions;• Walmart's ability to successfully integrate acquired businesses, including within the eCommerce space;• Walmart's effective tax rate and the factors affecting Walmart's effective tax rate, including assessments of certain tax contingencies, valuation allowances, changes in law (including the Tax Act), administrative audit outcomes, impact of
discrete items and the mix of earnings between the U.S. and Walmart's international operations;• customer traffic and average ticket in Walmart's stores and clubs and on its eCommerce websites;• the mix of merchandise Walmart sells, the cost of goods it sells and the shrinkage it experiences;• the amount of Walmart's total sales and operating expenses in the various markets in which it operates;• transportation, energy and utility costs and the selling prices of gasoline and diesel fuel;• supply chain disruptions and disruptions in seasonal buying patterns;• consumer acceptance of and response to Walmart's stores, clubs, digital platforms, programs, merchandise offerings and delivery methods;• cyber security events affecting Walmart and related costs;• developments in, outcomes of, and costs incurred in legal or regulatory proceedings to which Walmart is a party;• casualty and accident-related costs and insurance costs;• the turnover in Walmart's workforce and labor costs, including healthcare and other benefit costs;• changes in accounting estimates or judgments;• changes in existing tax, labor and other laws and regulations and changes in tax rates, trade agreements, trade restrictions and tariff rates;• the level of public assistance payments;• natural disasters, public health emergencies, civil disturbances, and terrorist attacks; and• Walmart's expenditures for Foreign Corrupt Practices Act "FCPA" and other compliance related costs, including the adequacy of the accrual with respect to this matter made in the third quarter of the fiscal year ending January 31, 2018.
Such risks, uncertainties and factors also include the risks relating to our operations and financial performance discussed in our filings with the SEC. You should read this presentation in conjunction with our Annual Report on Form 10-K for the year endedJanuary 31, 2017, and our subsequently filed Quarterly Reports on Form 10-Q and Current Reports on Form 8-K. You should consider all of the risks, uncertainties and other factors identified above and in those SEC reports carefully when evaluating theforward-looking statements in this release. We cannot assure you that the future results reflected in or implied by any such forward-looking statement will be realized or, even if substantially realized, will have the forecasted or expected consequences andeffects for or on our operations or financial performance. Such forward-looking statements are made as of the date of this presentation, and Walmart undertakes no obligation to update such statements to reflect subsequent events or circumstances.
This presentation includes certain non-GAAP measures as defined under SEC rules, including net sales, revenue, and operating income on a constant currency basis, adjusted EPS, comp sales excluding fuel, free cash flow and return on investment.Refer to information about the non-GAAP measures contained in this presentation. Additional information as required by Regulation G and Item 10(e) of Regulation S-K regarding non-GAAP measures can be found in our most recent Form 10-K and ourForm 8-K furnished as of the date of this presentation with the SEC, which are available at www.stock.walmart.com.
2
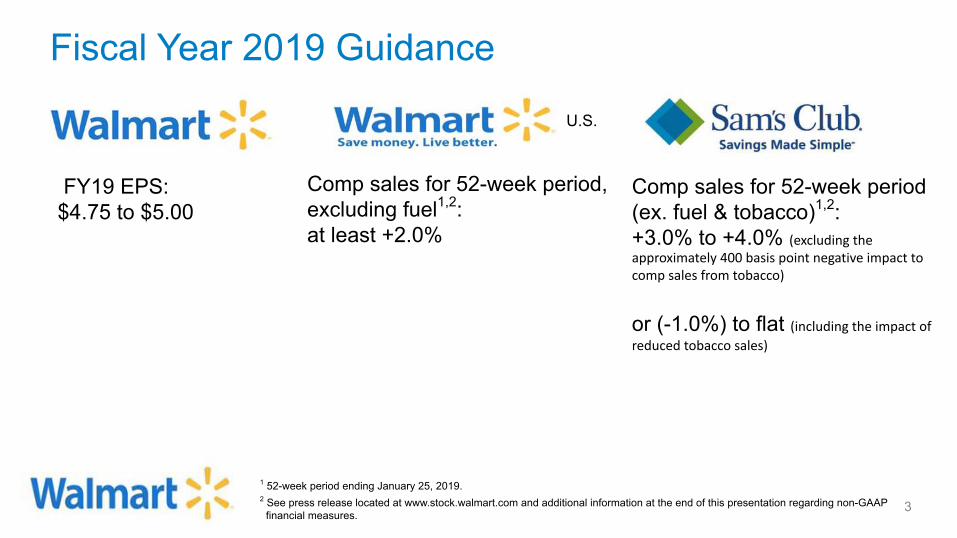
FY19 EPS:$4.75 to $5.00
Comp sales for 52-week period,excluding fuel1,2:at least +2.0%
Comp sales for 52-week period(ex. fuel & tobacco)1,2:+3.0% to +4.0% (excluding theapproximately 400 basis point negative impact tocomp sales from tobacco)
or (-1.0%) to flat (including the impact ofreduced tobacco sales)
1 52-week period ending January 25, 2019. 2 See press release located at www.stock.walmart.com and additional information at the end of this presentation regarding non-GAAP
financial measures.
Fiscal Year 2019 Guidance
3
U.S.
Additional Fiscal Year 2019 Guidance
4
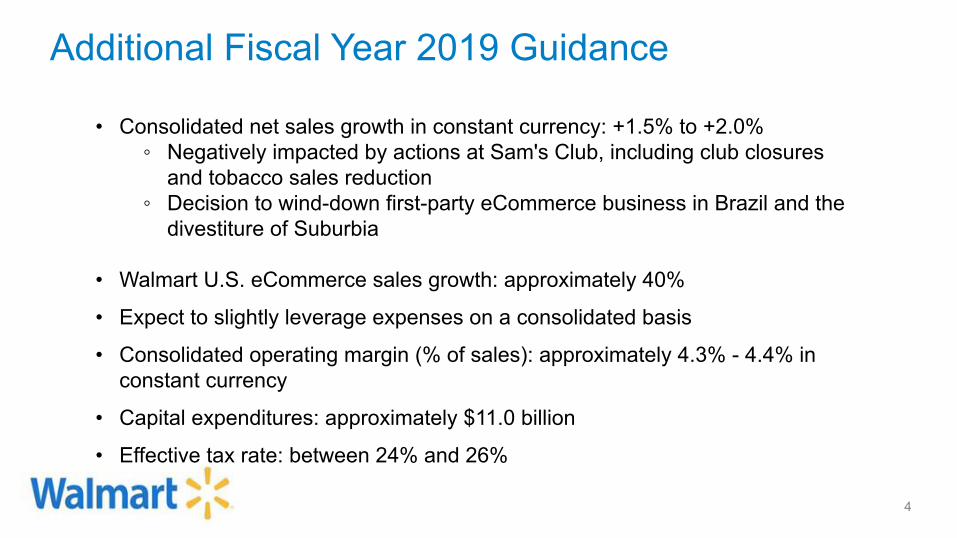
• Consolidated net sales growth in constant currency: +1.5% to +2.0%◦ Negatively impacted by actions at Sam's Club, including club closures
and tobacco sales reduction◦ Decision to wind-down first-party eCommerce business in Brazil and the
divestiture of Suburbia
• Walmart U.S. eCommerce sales growth: approximately 40%
• Expect to slightly leverage expenses on a consolidated basis
• Consolidated operating margin (% of sales): approximately 4.3% - 4.4% inconstant currency
• Capital expenditures: approximately $11.0 billion
• Effective tax rate: between 24% and 26%
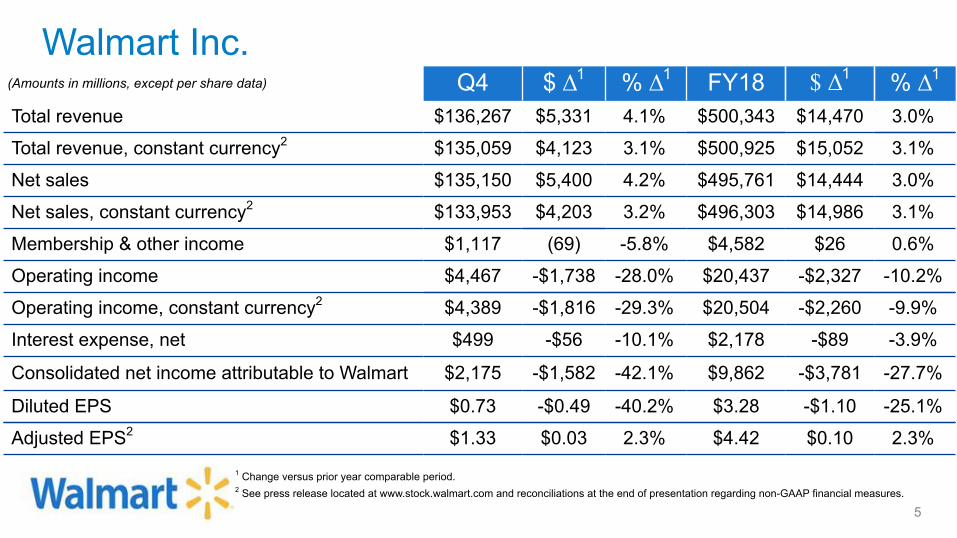
Walmart Inc.(Amounts in millions, except per share data) Q4 $ Δ1 % Δ1 FY18 $ Δ1 % Δ1
Total revenue $136,267 $5,331 4.1% $500,343 $14,470 3.0%
Total revenue, constant currency2 $135,059 $4,123 3.1% $500,925 $15,052 3.1%
Net sales $135,150 $5,400 4.2% $495,761 $14,444 3.0%
Net sales, constant currency2 $133,953 $4,203 3.2% $496,303 $14,986 3.1%
Membership & other income $1,117 (69) -5.8% $4,582 $26 0.6%
Operating income $4,467 -$1,738 -28.0% $20,437 -$2,327 -10.2%
Operating income, constant currency2 $4,389 -$1,816 -29.3% $20,504 -$2,260 -9.9%
Interest expense, net $499 -$56 -10.1% $2,178 -$89 -3.9%
Consolidated net income attributable to Walmart $2,175 -$1,582 -42.1% $9,862 -$3,781 -27.7%
Diluted EPS $0.73 -$0.49 -40.2% $3.28 -$1.10 -25.1%
Adjusted EPS2 $1.33 $0.03 2.3% $4.42 $0.10 2.3%1 Change versus prior year comparable period.2 See press release located at www.stock.walmart.com and reconciliations at the end of presentation regarding non-GAAP financial measures.
5

Walmart Inc.Q4 bps Δ1 FY18 bps Δ1
Gross profit rate 24.1% -61 bps 24.7% -26 bps
Operating expenses as a percentage of netsales 21.6% 78 bps 21.5% 32 bps
Effective tax rate2 20.3% -917 bps 30.4% 15 bps
Debt to total capitalization3 NP NP 37.4% -90 bps
Return on investment4 NP NP 14.2% -100 bps
1 Basis points change versus prior year comparable period.2 The decrease in the effective tax rate for the quarter was primarily due to the tax reform benefit recorded in the quarter.3 Debt to total capitalization is calculated as of January 31, 2018. Debt includes short-term borrowings, long-term debt due within one
year, capital lease and financing obligations due within one year, long-term debt, and long-term capital lease and financing obligations.Total capitalization includes debt and total Walmart shareholders' equity.
4 ROI is calculated for the trailing 12 months ended January 31, 2018. See press release located at www.stock.walmart.com andreconciliations at the end of presentation regarding non-GAAP financial measures.
NP - Not provided
6
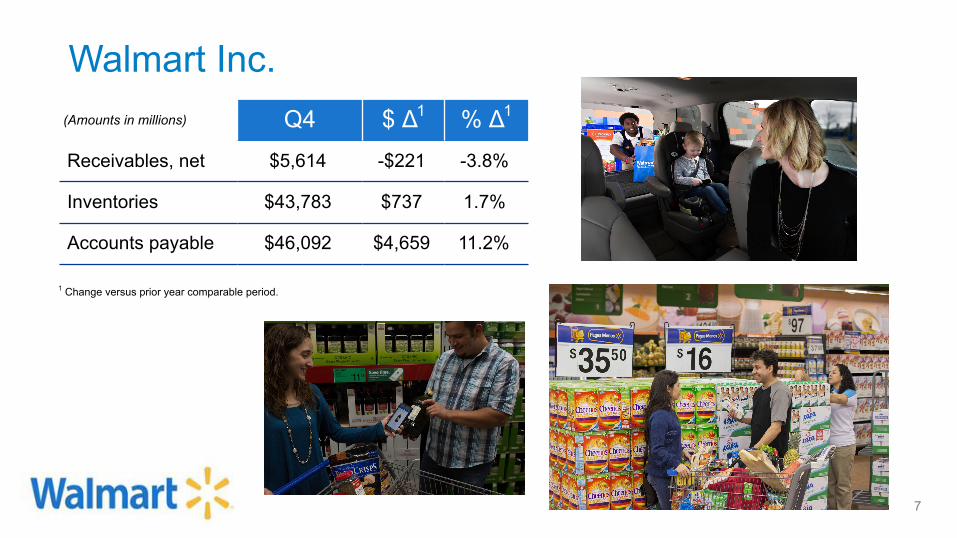
(Amounts in millions) Q4 $ Δ1 % Δ1
Receivables, net $5,614 -$221 -3.8%
Inventories $43,783 $737 1.7%
Accounts payable $46,092 $4,659 11.2%
Walmart Inc.
1 Change versus prior year comparable period.
7
Walmart Inc.
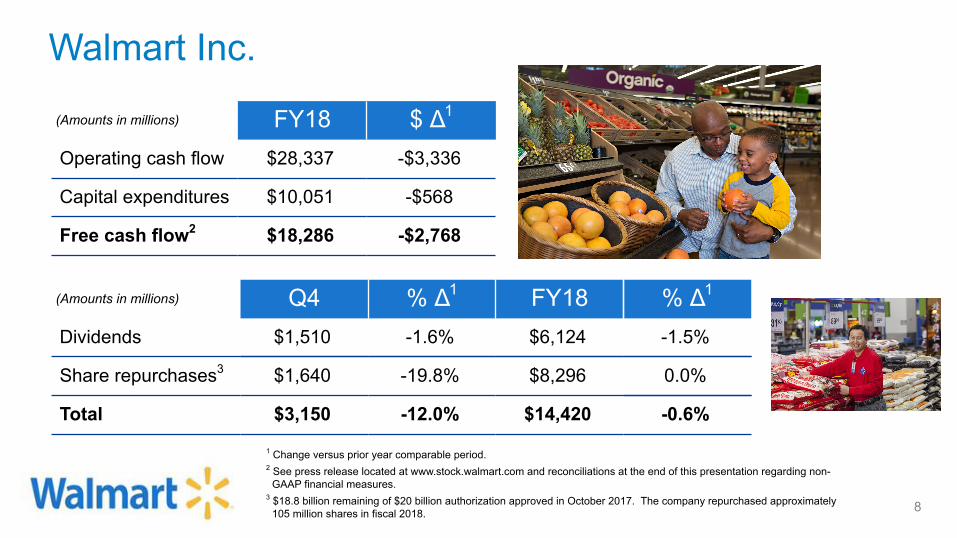
(Amounts in millions) FY18 $ Δ1
Operating cash flow $28,337 -$3,336
Capital expenditures $10,051 -$568
Free cash flow2 $18,286 -$2,768
(Amounts in millions) Q4 % Δ1 FY18 % Δ1
Dividends $1,510 -1.6% $6,124 -1.5%
Share repurchases3 $1,640 -19.8% $8,296 0.0%
Total $3,150 -12.0% $14,420 -0.6%
1 Change versus prior year comparable period.2 See press release located at www.stock.walmart.com and reconciliations at the end of this presentation regarding non-
GAAP financial measures.3 $18.8 billion remaining of $20 billion authorization approved in October 2017. The company repurchased approximately
105 million shares in fiscal 2018. 8
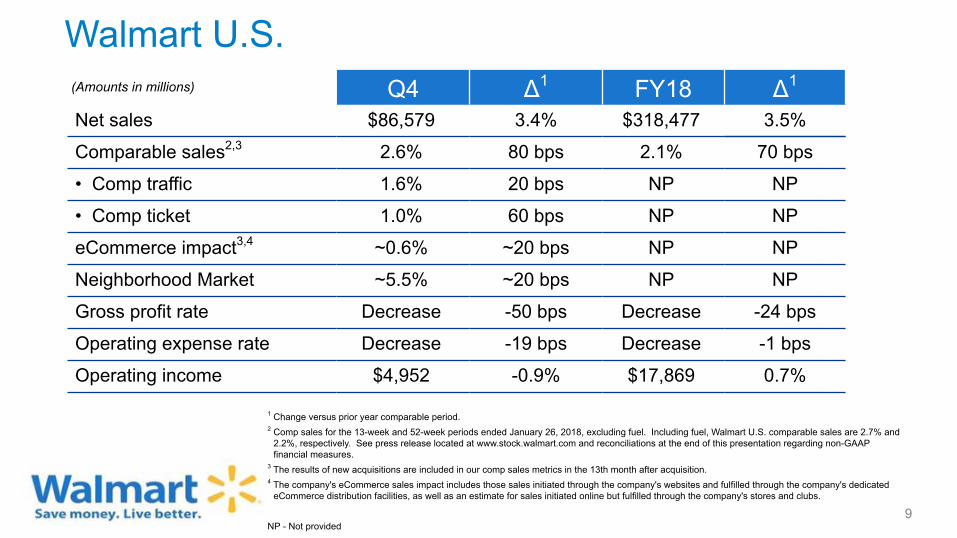
Walmart U.S.(Amounts in millions) Q4 Δ1 FY18 Δ1
Net sales $86,579 3.4% $318,477 3.5%
Comparable sales2,3 2.6% 80 bps 2.1% 70 bps
• Comp traffic 1.6% 20 bps NP NP
• Comp ticket 1.0% 60 bps NP NP
eCommerce impact3,4 ~0.6% ~20 bps NP NP
Neighborhood Market ~5.5% ~20 bps NP NP
Gross profit rate Decrease -50 bps Decrease -24 bps
Operating expense rate Decrease -19 bps Decrease -1 bps
Operating income $4,952 -0.9% $17,869 0.7%
1 Change versus prior year comparable period.2 Comp sales for the 13-week and 52-week periods ended January 26, 2018, excluding fuel. Including fuel, Walmart U.S. comparable sales are 2.7% and
2.2%, respectively. See press release located at www.stock.walmart.com and reconciliations at the end of this presentation regarding non-GAAPfinancial measures.
3 The results of new acquisitions are included in our comp sales metrics in the 13th month after acquisition.4 The company's eCommerce sales impact includes those sales initiated through the company's websites and fulfilled through the company's dedicated
eCommerce distribution facilities, as well as an estimate for sales initiated online but fulfilled through the company's stores and clubs.
NP - Not provided9

Walmart U.S. - quarterly financial highlights
10
Sales• Comp sales1 increased 2.6% led by strong comp traffic of 1.6%. eCommerce contributed approximately 60 basis points to segment comp sales
growth. On a 2-year stack basis, comp sales and traffic were up 4.4% and 3.0%, respectively.• Strong performance in food categories continued with comp sales, traffic and unit growth across categories.• Strong growth in multi-channel sales continued, including online grocery and general merchandise pickup in store.
Gross Margin• Gross margin rate declined 50 basis points due primarily to price investments, higher transportation expense as a result of higher volumes and fuel
costs, and mix effects from our growing eCommerce business. For the full year, the gross margin rate declined 24 basis points.
Expenses• Segment operating expenses leveraged 19 basis points. Physical stores leveraged expenses for the 4th consecutive quarter and were partially
offset by investments in eCommerce and technology.• This year’s Q4 results included a $244 million discrete charge related to discontinued real estate projects, which was partially offset by a $137
million legal settlement recovery. Last year’s Q4 results included a $249M discrete charge related to discontinued real estate projects. Excludingthese adjustments, expenses would have leveraged slightly.
Inventory• Total inventory increased 0.1% versus last year and comp store inventory declined approximately 0.2%, while in-stock levels remained high.
Format growth• We had net openings of 9 Supercenters and no Neighborhood Markets. We also remodeled 53 stores in the quarter and 496 for the full year.• As of the end of Q4, online grocery was offered in over 1,100 locations, which represents more than 500 additional locations since last year.
1 Comp sales for the 13-week period ended January 26, 2018, excluding fuel. Including fuel, Walmart U.S. comparable sales grew 2.7%. See press release located at www.stock.walmart.com and reconciliations at the end of this presentation regarding non-GAAP financialmeasures.
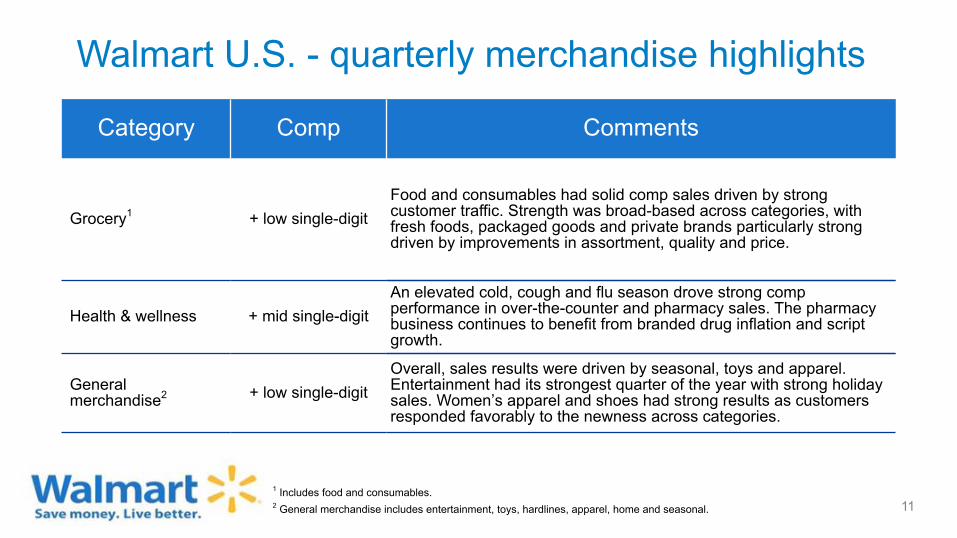
Walmart U.S. - quarterly merchandise highlights
Category Comp Comments
Grocery1 + low single-digitFood and consumables had solid comp sales driven by strongcustomer traffic. Strength was broad-based across categories, withfresh foods, packaged goods and private brands particularly strongdriven by improvements in assortment, quality and price.
Health & wellness + mid single-digitAn elevated cold, cough and flu season drove strong compperformance in over-the-counter and pharmacy sales. The pharmacybusiness continues to benefit from branded drug inflation and scriptgrowth.
Generalmerchandise2 + low single-digit
Overall, sales results were driven by seasonal, toys and apparel.Entertainment had its strongest quarter of the year with strong holidaysales. Women’s apparel and shoes had strong results as customersresponded favorably to the newness across categories.
1 Includes food and consumables.2 General merchandise includes entertainment, toys, hardlines, apparel, home and seasonal. 11
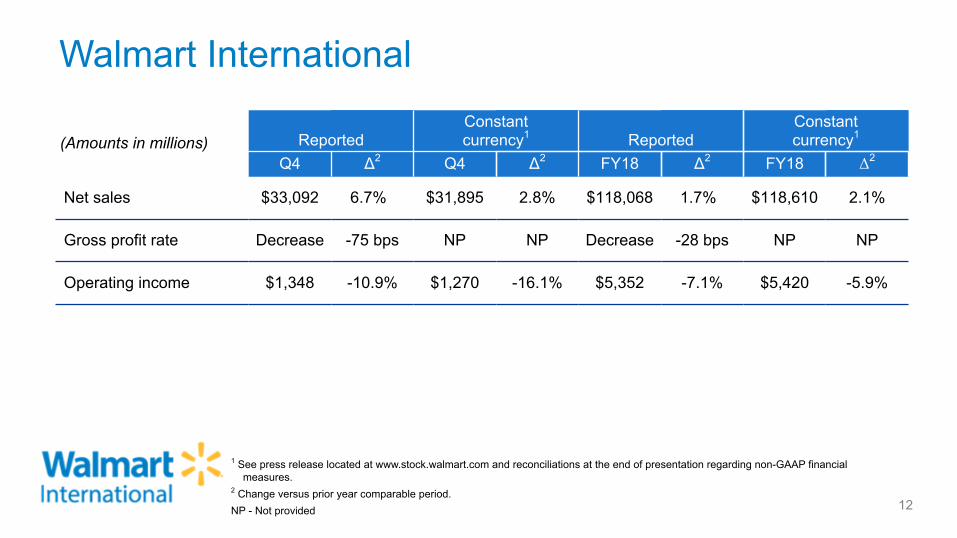
Walmart International
1(Amounts in millions) Reported
Constantcurrency1 Reported
Constantcurrency1
Q4 Δ2 Q4 Δ2 FY18 Δ2 FY18 Δ2
Net sales $33,092 6.7% $31,895 2.8% $118,068 1.7% $118,610 2.1%
Gross profit rate Decrease -75 bps NP NP Decrease -28 bps NP NP
Operating income $1,348 -10.9% $1,270 -16.1% $5,352 -7.1% $5,420 -5.9%
1 See press release located at www.stock.walmart.com and reconciliations at the end of presentation regarding non-GAAP financialmeasures.
2 Change versus prior year comparable period.NP - Not provided 12
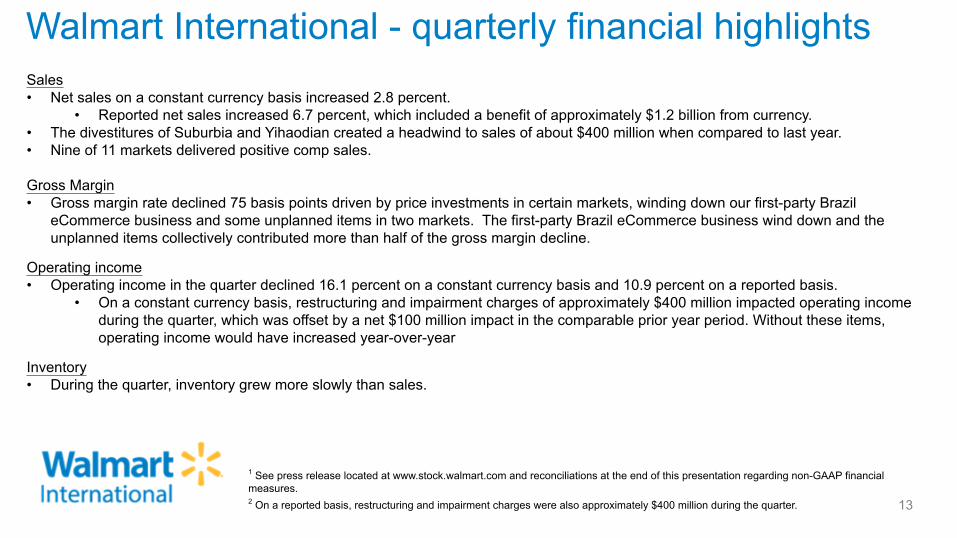
Walmart International - quarterly financial highlights
13
Sales• Net sales on a constant currency basis increased 2.8 percent.
• Reported net sales increased 6.7 percent, which included a benefit of approximately $1.2 billion from currency.• The divestitures of Suburbia and Yihaodian created a headwind to sales of about $400 million when compared to last year.• Nine of 11 markets delivered positive comp sales.
Gross Margin• Gross margin rate declined 75 basis points driven by price investments in certain markets, winding down our first-party Brazil
eCommerce business and some unplanned items in two markets. The first-party Brazil eCommerce business wind down and theunplanned items collectively contributed more than half of the gross margin decline.
Operating income• Operating income in the quarter declined 16.1 percent on a constant currency basis and 10.9 percent on a reported basis.
• On a constant currency basis, restructuring and impairment charges of approximately $400 million impacted operating incomeduring the quarter, which was offset by a net $100 million impact in the comparable prior year period. Without these items,operating income would have increased year-over-year
Inventory• During the quarter, inventory grew more slowly than sales.
1 See press release located at www.stock.walmart.com and reconciliations at the end of this presentation regarding non-GAAP financialmeasures.2 On a reported basis, restructuring and impairment charges were also approximately $400 million during the quarter.

Walmart International - key markets quarterly results
1 Results are presented on a constant currency basis here and for all key market highlights. Net sales and comp sales arepresented on a nominal, calendar basis.
2 eCommerce results are included for each of the markets listed in the table.3 Change versus prior year comparable period.4 Comp sales for the United Kingdom are presented excluding fuel. 5 Walmex includes the consolidated results of Mexico and Central America. Excluding Suburbia net sales of $270 million in
the comparable prior year period would result in an increase in Walmex net sales of 7.9% for the quarter. ExcludingSuburbia operating income of approximately $50 million in the comparable prior year period, operating income would haveincreased.
Country1,2Comp3
Netsales3
Grossprofitrate3
Operatingincome3
Sales Traffic Ticket
United Kingdom4 0.5% -1.6% 2.1% 2.0% Decrease Decrease
Walmex5 6.1% 0.9% 5.2% 4.3% Decrease Decrease
Canada 2.9% 1.4% 1.5% 3.4% Decrease Increase
China 2.3% 0.8% 1.5% 4.1% Increase Decrease
14
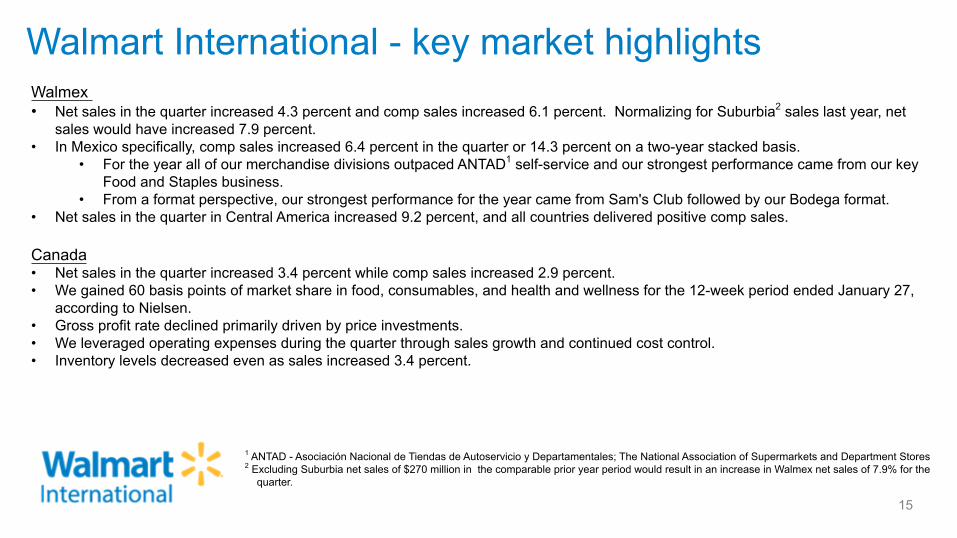
Walmart International - key market highlights
15
Walmex • Net sales in the quarter increased 4.3 percent and comp sales increased 6.1 percent. Normalizing for Suburbia2 sales last year, net
sales would have increased 7.9 percent.• In Mexico specifically, comp sales increased 6.4 percent in the quarter or 14.3 percent on a two-year stacked basis.
• For the year all of our merchandise divisions outpaced ANTAD1 self-service and our strongest performance came from our keyFood and Staples business.
• From a format perspective, our strongest performance for the year came from Sam's Club followed by our Bodega format.• Net sales in the quarter in Central America increased 9.2 percent, and all countries delivered positive comp sales.
Canada• Net sales in the quarter increased 3.4 percent while comp sales increased 2.9 percent.• We gained 60 basis points of market share in food, consumables, and health and wellness for the 12-week period ended January 27,
according to Nielsen.• Gross profit rate declined primarily driven by price investments.• We leveraged operating expenses during the quarter through sales growth and continued cost control.• Inventory levels decreased even as sales increased 3.4 percent.
1 ANTAD - Asociación Nacional de Tiendas de Autoservicio y Departamentales; The National Association of Supermarkets and Department Stores2 Excluding Suburbia net sales of $270 million in the comparable prior year period would result in an increase in Walmex net sales of 7.9% for the
quarter.
Walmart International - key market highlights
16
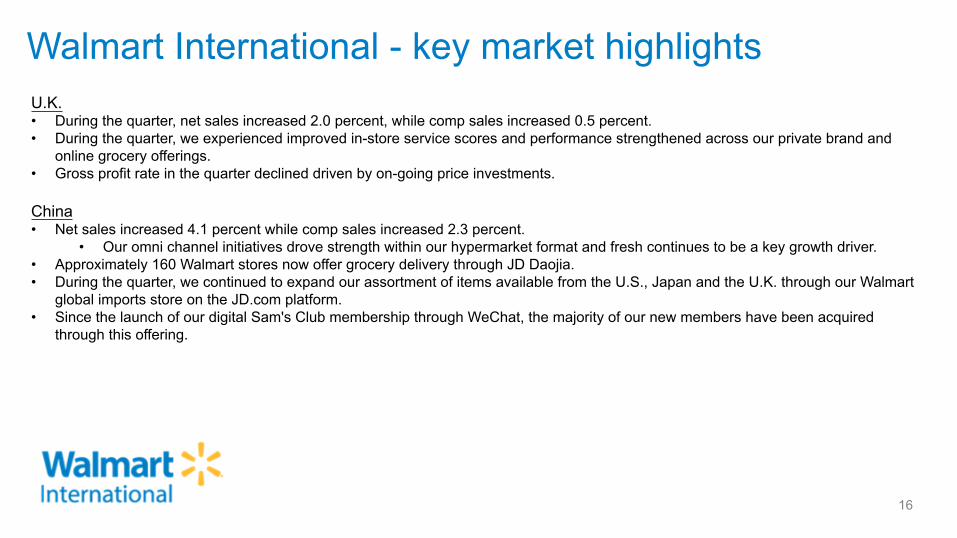
U.K.• During the quarter, net sales increased 2.0 percent, while comp sales increased 0.5 percent.• During the quarter, we experienced improved in-store service scores and performance strengthened across our private brand and
online grocery offerings.• Gross profit rate in the quarter declined driven by on-going price investments. China• Net sales increased 4.1 percent while comp sales increased 2.3 percent.
• Our omni channel initiatives drove strength within our hypermarket format and fresh continues to be a key growth driver.• Approximately 160 Walmart stores now offer grocery delivery through JD Daojia.• During the quarter, we continued to expand our assortment of items available from the U.S., Japan and the U.K. through our Walmart
global imports store on the JD.com platform.• Since the launch of our digital Sam's Club membership through WeChat, the majority of our new members have been acquired
through this offering.

Sam's Club(Amounts in millions)
With fuel Without fuel1 With fuel Without fuel1
Q4 Δ2 Q4 Δ2 FY18 Δ2 FY18 Δ2
Net sales $15,479 3.3% $14,238 2.1% $59,216 3.2% $54,456 2.2%
Comparable sales3 3.6% 50 bps 2.4% — bps 3.0% 280 bps 2.0% 90 bps
• Comp traffic NP NP 4.3% 310 bps NP NP NP NP
• Comp ticket NP NP -1.9% -310 bps NP NP NP NP
eCommerce impact4 NP NP ~0.8% ~0 bps NP NP NP NP
Gross profit rate Decrease -93 bps Decrease -89 bps Decrease -44 bps Decrease -44 bps
Membership income NP NP NP 1.9% NP NP NP 1.3%
Operating income -$283 -172.6% -$307 -181.6% $982 -41.2% $864 -46.6%
1 See press release located at www.stock.walmart.com and reconciliations at the end of this presentation regarding non-GAAP financialmeasures.
2 Change versus prior year comparable period.3 Comp sales for the 13-week and 52-week periods ended January 26, 2018.4 The company's eCommerce sales impact includes those sales initiated through the company's websites and fulfilled through the
company's dedicated eCommerce distribution facilities, as well as an estimate for sales initiated online but fulfilled through the company'sstores and clubs.
NP - Not provided17
Sam's Club - quarterly financial highlights
18
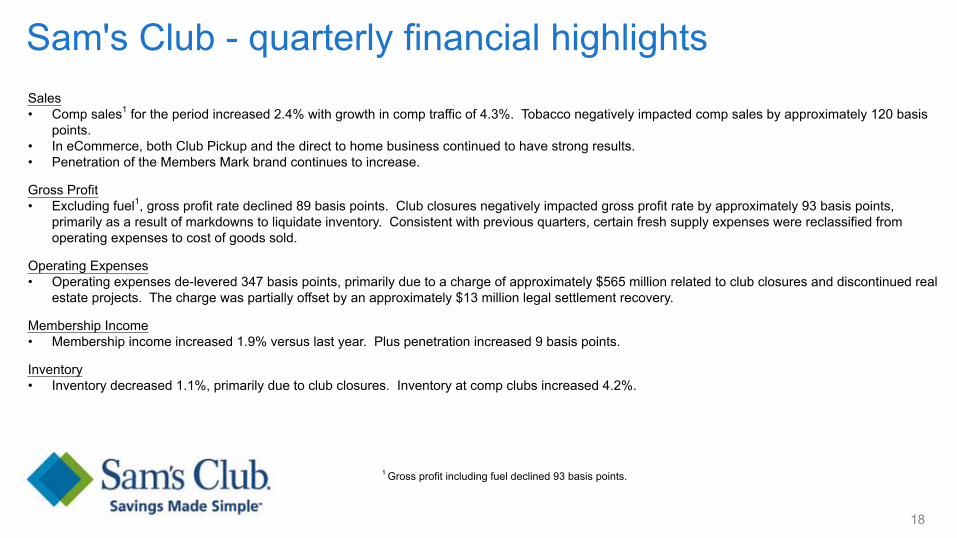
Sales• Comp sales1 for the period increased 2.4% with growth in comp traffic of 4.3%. Tobacco negatively impacted comp sales by approximately 120 basis
points.• In eCommerce, both Club Pickup and the direct to home business continued to have strong results.• Penetration of the Members Mark brand continues to increase.
Gross Profit• Excluding fuel1, gross profit rate declined 89 basis points. Club closures negatively impacted gross profit rate by approximately 93 basis points,
primarily as a result of markdowns to liquidate inventory. Consistent with previous quarters, certain fresh supply expenses were reclassified fromoperating expenses to cost of goods sold.
Operating Expenses• Operating expenses de-levered 347 basis points, primarily due to a charge of approximately $565 million related to club closures and discontinued real
estate projects. The charge was partially offset by an approximately $13 million legal settlement recovery.
Membership Income• Membership income increased 1.9% versus last year. Plus penetration increased 9 basis points.
Inventory• Inventory decreased 1.1%, primarily due to club closures. Inventory at comp clubs increased 4.2%.
1 Gross profit including fuel declined 93 basis points.
Sam's Club - quarterly category highlights
19
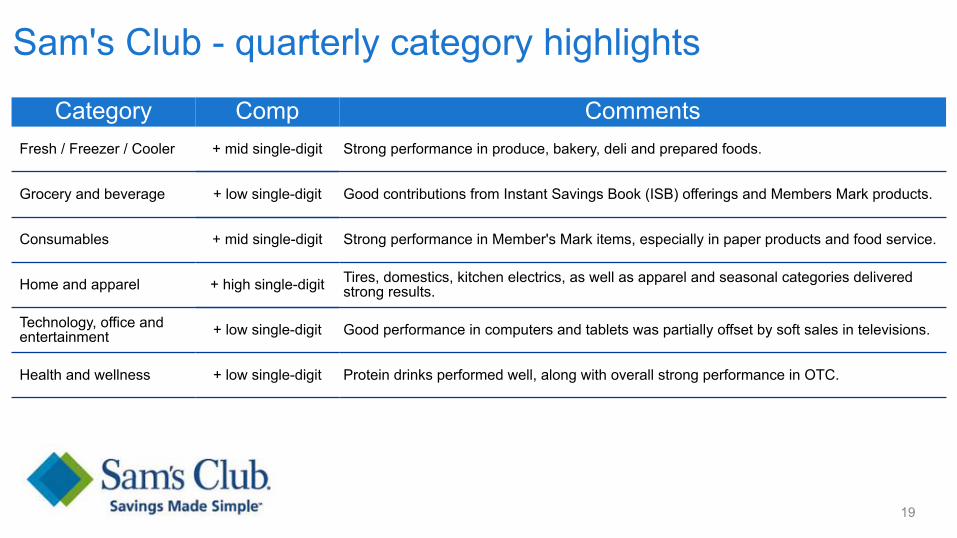
Category Comp CommentsFresh / Freezer / Cooler + mid single-digit Strong performance in produce, bakery, deli and prepared foods.
Grocery and beverage + low single-digit Good contributions from Instant Savings Book (ISB) offerings and Members Mark products.
Consumables + mid single-digit Strong performance in Member's Mark items, especially in paper products and food service.
Home and apparel + high single-digit Tires, domestics, kitchen electrics, as well as apparel and seasonal categories deliveredstrong results.
Technology, office andentertainment + low single-digit Good performance in computers and tablets was partially offset by soft sales in televisions.
Health and wellness + low single-digit Protein drinks performed well, along with overall strong performance in OTC.
Third-party FCPA- and compliance-relatedexpenses
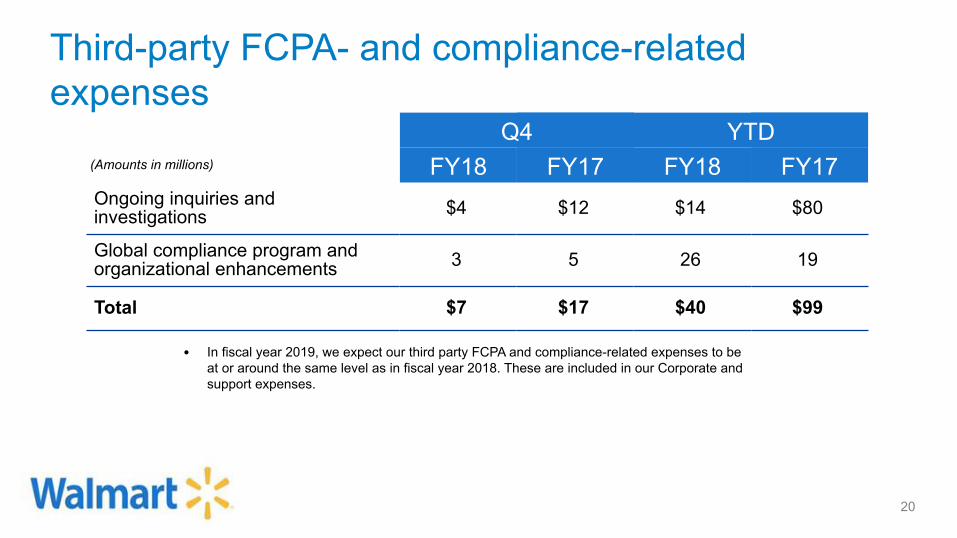
Q4 YTD(Amounts in millions) FY18 FY17 FY18 FY17Ongoing inquiries andinvestigations $4 $12 $14 $80
Global compliance program andorganizational enhancements 3 5 26 19
Total $7 $17 $40 $99
• In fiscal year 2019, we expect our third party FCPA and compliance-related expenses to beat or around the same level as in fiscal year 2018. These are included in our Corporate andsupport expenses.
20

Non-GAAP measures - ROIWe include Return on Assets ("ROA"), which is calculated in accordance with generally accepted accounting principles in the U.S. ("GAAP") as well as Return onInvestment ("ROI") as measures to assess returns on assets. Management believes ROI is a meaningful measure to share with investors because it helpsinvestors assess how effectively Walmart is deploying its assets. Trends in ROI can fluctuate over time as management balances long-term potential strategicinitiatives with possible short-term impacts. We consider ROA to be the financial measure computed in accordance with GAAP that is the most directlycomparable financial measure to our calculation of ROI.
ROA was 5.2 percent and 7.2 percent for the trailing twelve months ended January 31, 2018 and 2017, respectively. ROI was 14.2 percent and 15.2 percent forthe trailing twelve months ended January 31, 2018 and 2017, respectively. The decline in ROA was primarily due to the losses on extinguishment of debt and thedecrease in operating income. The decline in ROI was primarily due to the decrease in operating income.
We define ROI as adjusted operating income (operating income plus interest income, depreciation and amortization, and rent expense) for the trailing 12 monthsdivided by average invested capital during that period. We consider average invested capital to be the average of our beginning and ending total assets, plusaverage accumulated depreciation and average amortization, less average accounts payable and average accrued liabilities for that period, plus a rent factorequal to the rent for the fiscal year or trailing 12 months multiplied by a factor of 8. When we have discontinued operations, we exclude the impact of thediscontinued operations.
Our calculation of ROI is considered a non-GAAP financial measure because we calculate ROI using financial measures that exclude and include amounts thatare included and excluded in the most directly comparable GAAP financial measure. For example, we exclude the impact of depreciation and amortization fromour reported operating income in calculating the numerator of our calculation of ROI. In addition, we include a factor of 8 for rent expense that estimates thehypothetical capitalization of our operating leases. As mentioned above, we consider return on assets to be the financial measure computed in accordance withgenerally accepted accounting principles most directly comparable to our calculation of ROI. ROI differs from ROA (which is consolidated net income for theperiod divided by average total assets for the period) because ROI: adjusts operating income to exclude certain expense items and adds interest income; adjuststotal assets for the impact of accumulated depreciation and amortization, accounts payable and accrued liabilities; and incorporates a factor of rent to arrive attotal invested capital. Because of the adjustments mentioned above, we believe ROI more accurately measures how we are deploying our key assets and is moremeaningful to investors than ROA.
Although ROI is a standard financial measure, numerous methods exist for calculating a company's ROI. As a result, the method used by management tocalculate our ROI may differ from the methods used by other companies to calculate their ROI.
21

Non-GAAP measures - ROI cont.The calculation of ROA and ROI, along with a reconciliation of ROI to the calculation of ROA, the most comparable GAAPfinancial measure, is as follows:
Walmart Inc.Return on Assets and Return on Investment
Trailing Twelve MonthsEnded
Trailing Twelve MonthsEnded
January 31, January 31,(Dollars in millions) 2018 2017 (Dollars in millions) 2018 2017
CALCULATION OF RETURN ON ASSETS CALCULATION OF RETURN ON INVESTMENTNumerator NumeratorConsolidated net income $ 10,523 $ 14,293 Operating income $ 20,437 $ 22,764Denominator + Interest income 152 100Average total assets1 $ 201,674 $ 199,203 + Depreciation and amortization 10,529 10,080Return on assets (ROA) 5.2% 7.2% + Rent 2,932 2,612
Adjusted operating income $ 34,050 $ 35,556
As of January 31, DenominatorCertain Balance Sheet Data 2018 2017 2016 Average total assets1 $ 201,674 $ 199,203
Total assets $ 204,522 $ 198,825 $ 199,581+ Average accumulated depreciationand amortization1 79,995 74,245
Accumulated depreciation and amortization 83,039 76,951 71,538 - Average accounts payable1 43,763 39,960Accounts payable 46,092 41,433 38,487 - Average accrued liabilities1 21,388 20,131Accrued liabilities 22,122 20,654 19,607 + Rent x 8 23,456 20,896
Average invested capital $ 239,974 $ 234,253Return on investment (ROI) 14.2% 15.2%
1 The average is based on the addition of the account balance at the end of the current period to the account balance at the end of theprior period and dividing by 2. 22
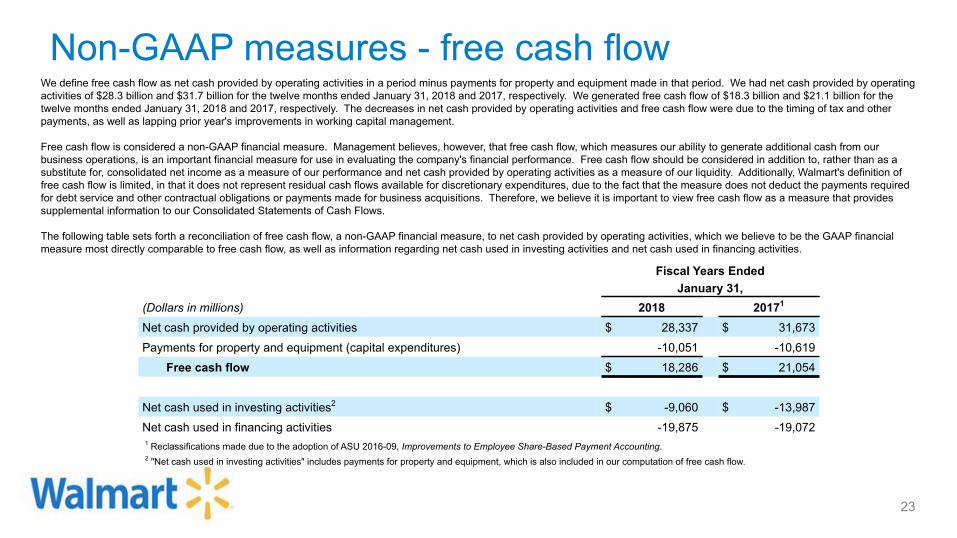
Non-GAAP measures - free cash flowWe define free cash flow as net cash provided by operating activities in a period minus payments for property and equipment made in that period. We had net cash provided by operatingactivities of $28.3 billion and $31.7 billion for the twelve months ended January 31, 2018 and 2017, respectively. We generated free cash flow of $18.3 billion and $21.1 billion for thetwelve months ended January 31, 2018 and 2017, respectively. The decreases in net cash provided by operating activities and free cash flow were due to the timing of tax and otherpayments, as well as lapping prior year's improvements in working capital management.
Free cash flow is considered a non-GAAP financial measure. Management believes, however, that free cash flow, which measures our ability to generate additional cash from ourbusiness operations, is an important financial measure for use in evaluating the company's financial performance. Free cash flow should be considered in addition to, rather than as asubstitute for, consolidated net income as a measure of our performance and net cash provided by operating activities as a measure of our liquidity. Additionally, Walmart's definition offree cash flow is limited, in that it does not represent residual cash flows available for discretionary expenditures, due to the fact that the measure does not deduct the payments requiredfor debt service and other contractual obligations or payments made for business acquisitions. Therefore, we believe it is important to view free cash flow as a measure that providessupplemental information to our Consolidated Statements of Cash Flows.
The following table sets forth a reconciliation of free cash flow, a non-GAAP financial measure, to net cash provided by operating activities, which we believe to be the GAAP financialmeasure most directly comparable to free cash flow, as well as information regarding net cash used in investing activities and net cash used in financing activities.
Fiscal Years EndedJanuary 31,
(Dollars in millions) 2018 20171
Net cash provided by operating activities $ 28,337 $ 31,673
Payments for property and equipment (capital expenditures) -10,051 -10,619
Free cash flow $ 18,286 $ 21,054
Net cash used in investing activities2 $ -9,060 $ -13,987
Net cash used in financing activities -19,875 -19,0721 Reclassifications made due to the adoption of ASU 2016-09, Improvements to Employee Share-Based Payment Accounting.2 "Net cash used in investing activities" includes payments for property and equipment, which is also included in our computation of free cash flow.
23

1 Change versus prior year comparable period.
Non-GAAP measures - constant currency
24
In discussing our operating results, the term currency exchange rates refers to the currency exchange rates we use to convert the operating results for all countries where thefunctional currency is not the U.S. dollar into U.S. dollars. We calculate the effect of changes in currency exchange rates as the difference between current period activity translatedusing the current period's currency exchange rates, and the comparable prior year period's currency exchange rates. Throughout our discussion, we refer to the results of thiscalculation as the impact of currency exchange rate fluctuations. When we refer to constant currency operating results, this means operating results without the impact of thecurrency exchange rate fluctuations. The disclosure of constant currency amounts or results permits investors to better understand Walmart's underlying performance without theeffects of currency exchange rate fluctuations.
The table below reflects the calculation of constant currency for total revenues, net sales and operating income for the three and twelve months ended January 31, 2018.
Three Months Ended January 31, Twelve Months Ended January 31,Walmart International Consolidated Walmart International Consolidated
(Dollars in millions) 2018PercentChange1 2018
PercentChange1 2018
PercentChange1 2018
PercentChange1
Total revenues:As reported $ 33,455 6.1% $ 136,267 4.1% $ 119,763 1.4% $ 500,343 3.0%Currency exchange rate fluctuations -1,208 N/A -1,208 N/A 582 N/A 582 N/AConstant currency total revenues $ 32,247 2.3% $ 135,059 3.1% $ 120,345 1.9% $ 500,925 3.1%
Net sales:As reported $ 33,092 6.7% $ 135,150 4.2% $ 118,068 1.7% $ 495,761 3.0%Currency exchange rate fluctuations -1,197 N/A -1,197 N/A 542 N/A 542 N/AConstant currency net sales $ 31,895 2.8% $ 133,953 3.2% $ 118,610 2.1% $ 496,303 3.1%
Operating income:As reported $ 1,348 -10.9% $ 4,467 -28.0% $ 5,352 -7.1% $ 20,437 -10.2%Currency exchange rate fluctuations -78 N/A -78 N/A 68 N/A 67 N/AConstant currency operating income $ 1,270 -16.1% $ 4,389 -29.3% $ 5,420 -5.9% $ 20,504 -9.9%

Non-GAAP measures - comparable sales measuresThe comparable sales of the company's Walmart U.S. and Sam's Club operating segments for the 13-week and 52-weekperiods ended January 26, 2018 and January 27, 2017, and our guidance for comparable sales for the 52-week period endingJanuary 25, 2019, in each case calculated or forecasted by excluding fuel or fuel and tobacco sales for such periods(collectively the "Non-GAAP Comparable Sales Measures"), are non-GAAP financial measures as defined by the SEC's rules.We believe the most directly comparable financial measures computed in accordance with GAAP are the comparable salescalculated by including fuel and tobacco sales for the corresponding periods.
We believe that the presentation of the Non-GAAP Comparable Sales Measures provides useful information to investorsregarding the company's financial condition and results of operations because that information permits investors to understandthe impact of fuel or fuel and tobacco sales, which are affected by the volatility of fuel prices and Sam's Club's decision toremove tobacco from certain locations, on Walmart U.S. and Sam's Club's comparable sales for the periods presented.
25
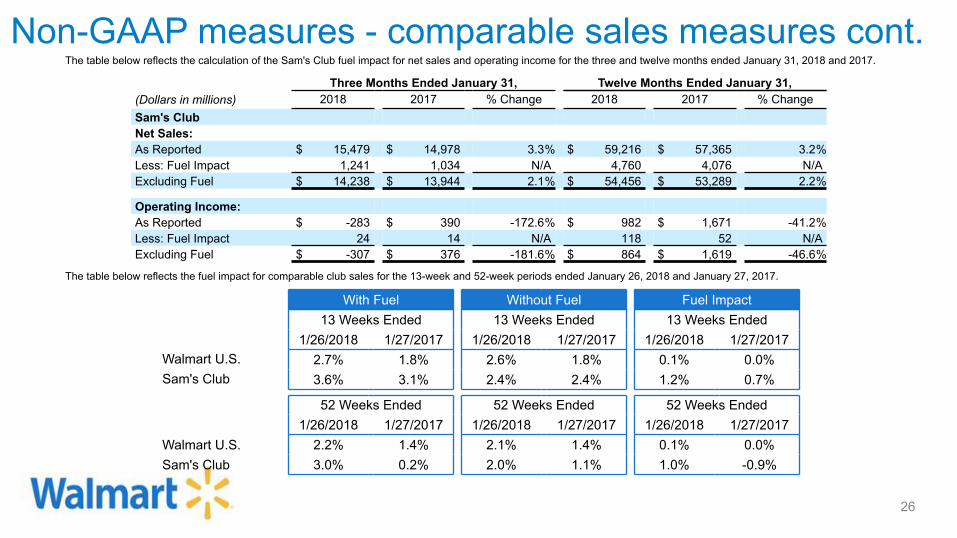
Non-GAAP measures - comparable sales measures cont.The table below reflects the calculation of the Sam's Club fuel impact for net sales and operating income for the three and twelve months ended January 31, 2018 and 2017.
Three Months Ended January 31, Twelve Months Ended January 31,(Dollars in millions) 2018 2017 % Change 2018 2017 % ChangeSam's ClubNet Sales:As Reported $ 15,479 $ 14,978 3.3% $ 59,216 $ 57,365 3.2%Less: Fuel Impact 1,241 1,034 N/A 4,760 4,076 N/AExcluding Fuel $ 14,238 $ 13,944 2.1% $ 54,456 $ 53,289 2.2%
Operating Income:As Reported $ -283 $ 390 -172.6% $ 982 $ 1,671 -41.2%Less: Fuel Impact 24 14 N/A 118 52 N/AExcluding Fuel $ -307 $ 376 -181.6% $ 864 $ 1,619 -46.6%
The table below reflects the fuel impact for comparable club sales for the 13-week and 52-week periods ended January 26, 2018 and January 27, 2017.
With Fuel Without Fuel Fuel Impact13 Weeks Ended 13 Weeks Ended 13 Weeks Ended
1/26/2018 1/27/2017 1/26/2018 1/27/2017 1/26/2018 1/27/2017Walmart U.S. 2.7% 1.8% 2.6% 1.8% 0.1% 0.0%Sam's Club 3.6% 3.1% 2.4% 2.4% 1.2% 0.7%
52 Weeks Ended 52 Weeks Ended 52 Weeks Ended1/26/2018 1/27/2017 1/26/2018 1/27/2017 1/26/2018 1/27/2017
Walmart U.S. 2.2% 1.4% 2.1% 1.4% 0.1% 0.0%Sam's Club 3.0% 0.2% 2.0% 1.1% 1.0% -0.9%
26

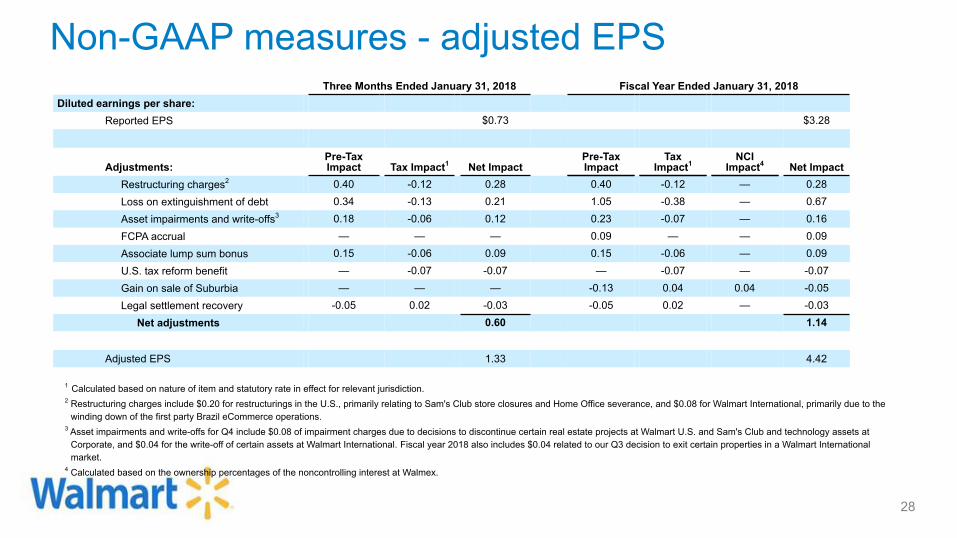
Adjusted diluted earnings per share from continuing operations attributable to Walmart (Adjusted EPS) for each of the three months and fiscalyears ended January 31, 2018 and 2017 is considered a non-GAAP financial measure under the SEC's rules because the Adjusted EPS foreach such period excludes certain amounts not excluded in the diluted earnings per share from continuing operations attributable to Walmartcalculated in accordance with GAAP (EPS) for such periods. Management believes that the Adjusted EPS for each of the three months andfiscal years ended January 31, 2018 and 2017 is a meaningful measure to share with investors because each measure, which adjusts EPS forsuch periods for certain items recorded in such periods, is the measure that best allows comparison of the performance for the comparableperiod. In addition, Adjusted EPS affords investors a view of what management considers Walmart's core earnings performance for each of thethree months and fiscal years ended January 31, 2018 and 2017 and also affords investors the ability to make a more informed assessment ofsuch core earnings performance for the comparable periods. We have calculated Adjusted EPS for the three months and fiscal year ended January 31, 2018 by adjusting EPS for the following: (1) restructuring charges, (2) losses on the early extinguishment of certain debt, (3) asset impairments and write-offs, (4) U.S. associate lumpsum bonuses, (5) the impact of U.S. tax reform, (6) a legal settlement recovery and, for the fiscal year ended January 31, 2018 only, the (7) theFCPA accrual based on discussions with government agencies regarding the possible resolution of the FCPA matter and (8) the gain on sale ofSuburbia.
Adjusted EPS for the three months ended January 31, 2018 is a non-GAAP financial measure. The most directly comparable financial measurecalculated in accordance with GAAP is EPS for the three months ended January 31, 2018.
Non-GAAP measures - adjusted EPS
27
Non-GAAP measures - adjusted EPS
28
Three Months Ended January 31, 2018 Fiscal Year Ended January 31, 2018Diluted earnings per share:
Reported EPS $0.73 $3.28
Adjustments:Pre-TaxImpact Tax Impact1 Net Impact
Pre-TaxImpact
TaxImpact1
NCIImpact4 Net Impact
Restructuring charges2 0.40 -0.12 0.28 0.40 -0.12 — 0.28Loss on extinguishment of debt 0.34 -0.13 0.21 1.05 -0.38 — 0.67Asset impairments and write-offs3 0.18 -0.06 0.12 0.23 -0.07 — 0.16FCPA accrual — — — 0.09 — — 0.09Associate lump sum bonus 0.15 -0.06 0.09 0.15 -0.06 — 0.09U.S. tax reform benefit — -0.07 -0.07 — -0.07 — -0.07Gain on sale of Suburbia — — — -0.13 0.04 0.04 -0.05Legal settlement recovery -0.05 0.02 -0.03 -0.05 0.02 — -0.03
Net adjustments 0.60 1.14
Adjusted EPS 1.33 4.42
1 Calculated based on nature of item and statutory rate in effect for relevant jurisdiction.2 Restructuring charges include $0.20 for restructurings in the U.S., primarily relating to Sam's Club store closures and Home Office severance, and $0.08 for Walmart International, primarily due to the
winding down of the first party Brazil eCommerce operations. 3 Asset impairments and write-offs for Q4 include $0.08 of impairment charges due to decisions to discontinue certain real estate projects at Walmart U.S. and Sam's Club and technology assets at
Corporate, and $0.04 for the write-off of certain assets at Walmart International. Fiscal year 2018 also includes $0.04 related to our Q3 decision to exit certain properties in a Walmart Internationalmarket.
4 Calculated based on the ownership percentages of the noncontrolling interest at Walmex.
Non-GAAP measures - adjusted EPS
29
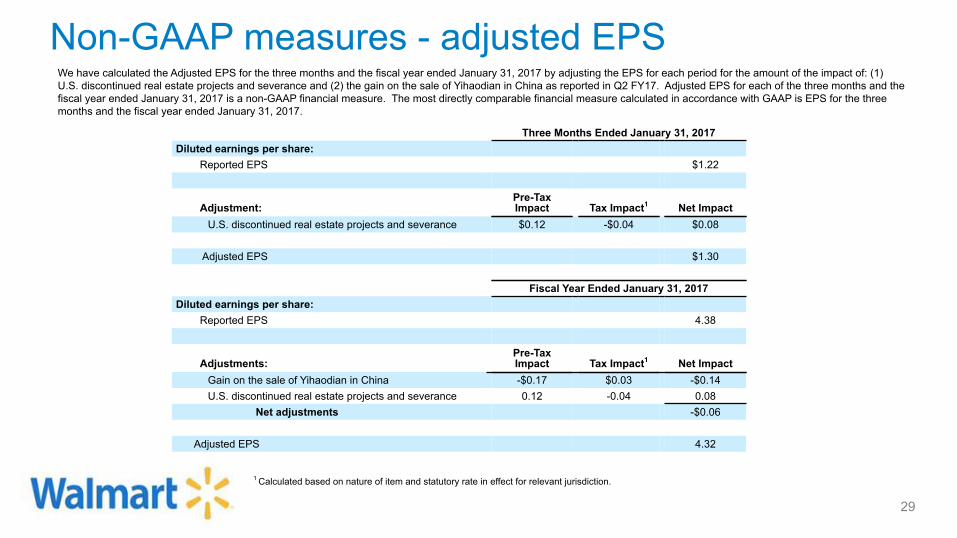
Three Months Ended January 31, 2017Diluted earnings per share:
Reported EPS $1.22
Adjustment:Pre-TaxImpact Tax Impact1 Net Impact
U.S. discontinued real estate projects and severance $0.12 -$0.04 $0.08
Adjusted EPS $1.30
Fiscal Year Ended January 31, 2017Diluted earnings per share:
Reported EPS 4.38
Adjustments:Pre-TaxImpact Tax Impact1 Net Impact
Gain on the sale of Yihaodian in China -$0.17 $0.03 -$0.14U.S. discontinued real estate projects and severance 0.12 -0.04 0.08
Net adjustments -$0.06
Adjusted EPS 4.32
We have calculated the Adjusted EPS for the three months and the fiscal year ended January 31, 2017 by adjusting the EPS for each period for the amount of the impact of: (1)U.S. discontinued real estate projects and severance and (2) the gain on the sale of Yihaodian in China as reported in Q2 FY17. Adjusted EPS for each of the three months and thefiscal year ended January 31, 2017 is a non-GAAP financial measure. The most directly comparable financial measure calculated in accordance with GAAP is EPS for the threemonths and the fiscal year ended January 31, 2017.
1 Calculated based on nature of item and statutory rate in effect for relevant jurisdiction.
• Unit counts & square footage• Comparable store sales• Terminology• Fiscal year 2019 earnings dates
Additional resources at stock.walmart.com
30