S: O: C: S - Canyon Crest Academy Library Media...
89
Remember your SOCS! • S : • O : • C : • S :
Transcript of S: O: C: S - Canyon Crest Academy Library Media...
Remember your SOCS!
• S:
• O:
• C:
• S:

1.1: Displaying Distributions with Graphs
Dotplot: Age of your fathers • Low scale: 45 • High scale: 75 • Doesn’t have to start at zero, just cover the
range of the data • Label the axis

Stemplot: Age of your father • Steps:

Stemplot details • Since each stem is a class in the histogram, it looks like
a ________________________________________. • Benefit: • Variations: Round the data so that the final digit is
suitable as a leaf. (Ex: 3.468 3.5, 2.567 2.6)
• You can _____________ to double the number of stems when all the leaves would otherwise fall on just a few stems. (Leaves 0-4 go on upper stem, leaves 5-9 go on the lower stem)
• Ex: Data Set: 110 111 111 113 114 114 114 116 119

Literacy in Islamic Countries
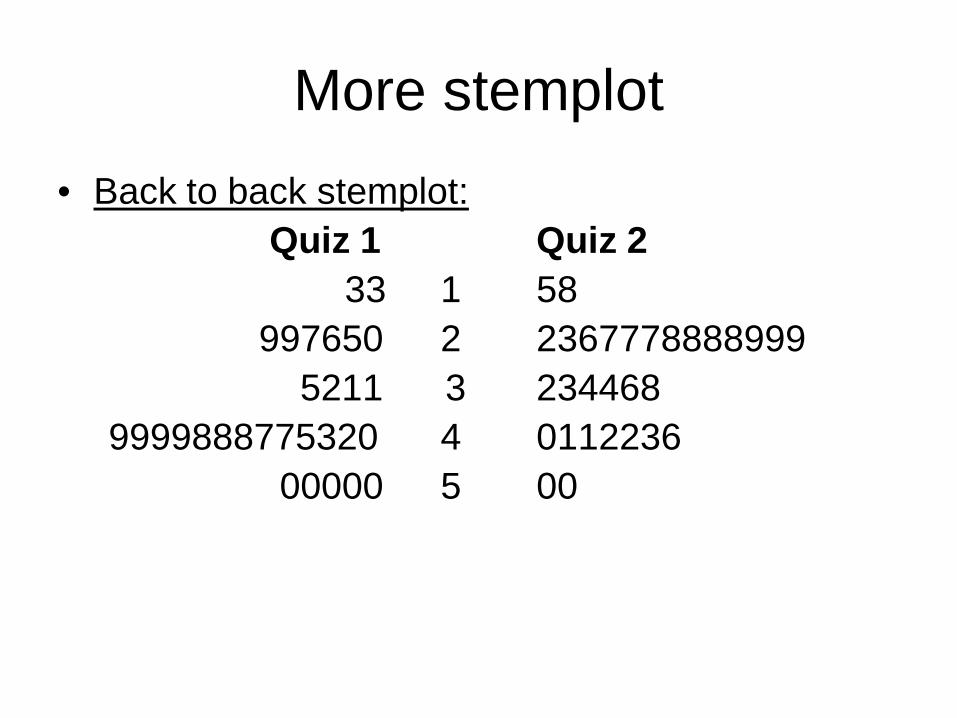
More stemplot • Back to back stemplot: Quiz 1 Quiz 2 33 1 58 997650 2 2367778888999 5211 3 234468 9999888775320 4 0112236 00000 5 00

Pie Chart/Bar Graph of Radio Stations by Format
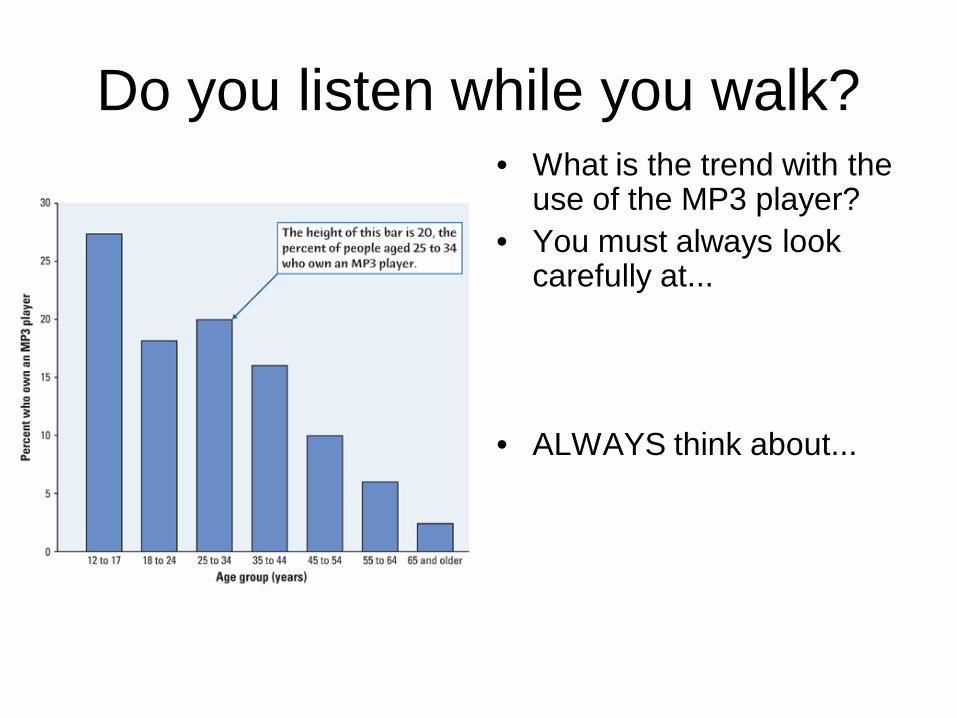
Do you listen while you walk? • What is the trend with the
use of the MP3 player? • You must always look
carefully at...
• ALWAYS think about...
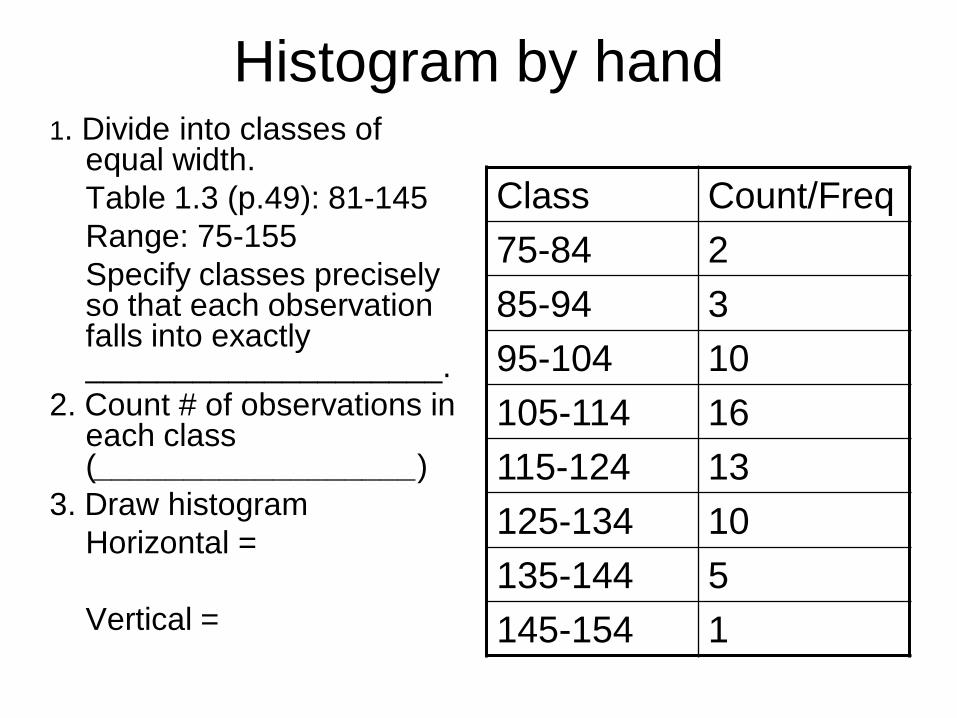
Histogram by hand 1. Divide into classes of
equal width. Table 1.3 (p.49): 81-145 Range: 75-155 Specify classes precisely
so that each observation falls into exactly ____________________.
2. Count # of observations in each class (__________________)
3. Draw histogram Horizontal = Vertical =
Class Count/Freq 75-84 2 85-94 3 95-104 10 105-114 16 115-124 13 125-134 10 135-144 5 145-154 1

Histograms by TI83/84 (p.59)
• Calculator steps:

No right choice…
• There are several ways of constructing classes in a histogram.
• ______________________ will not give a good idea of the shape of the distribution.
• Use your judgment! Make sure the classes ________________________.
Dealing with Outliers
Don’t just ________________! You should search for an explanation for an outlier if you find one.
Can you get rid of the outlier as “bad
data” or can you live with the statistical consequences of including it?

Examples of things that are symmetric?
SYMMETRIC:
RIGHT-TAILED SKEWED:

Ogives (relative cumulative frequency graph) p.60
Steps:
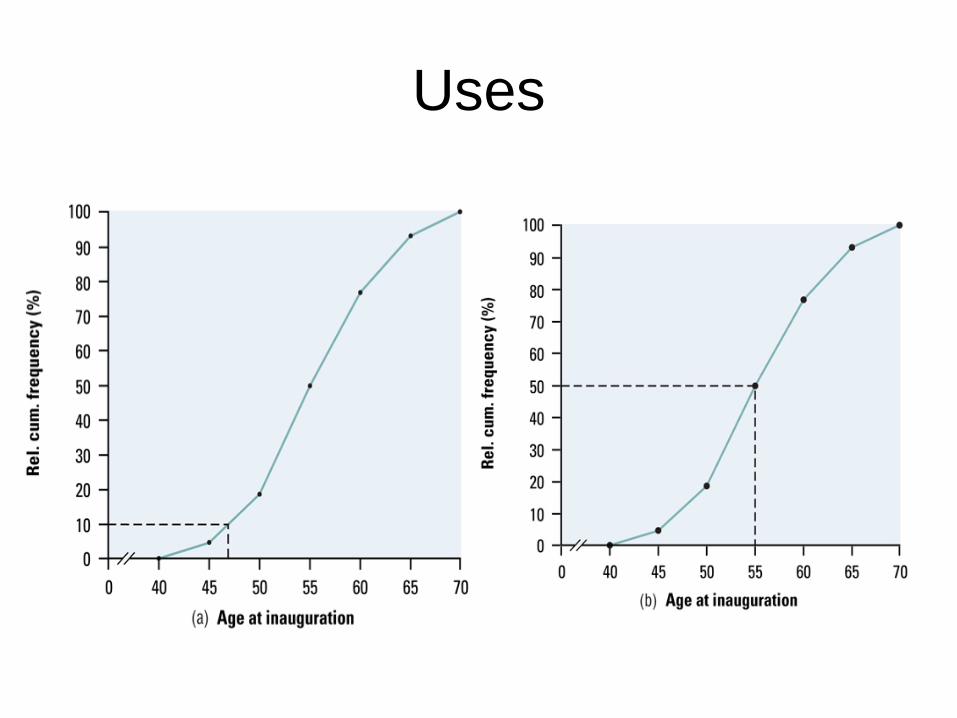
Uses
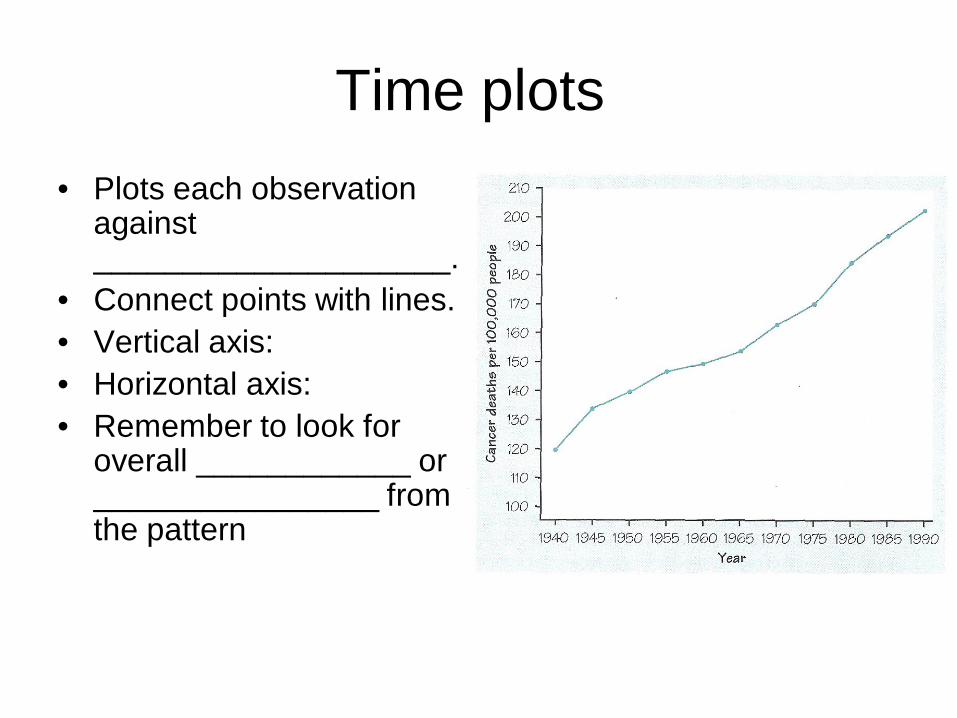
Time plots • Plots each observation
against ____________________.
• Connect points with lines. • Vertical axis: • Horizontal axis: • Remember to look for
overall ____________ or ________________ from the pattern
Words that need BACK-UP in AP Stats • Outlier • Skewed
• Normal
• Lurking variables
• Confounding
• Range
• Bias ...You can always clarify these words!
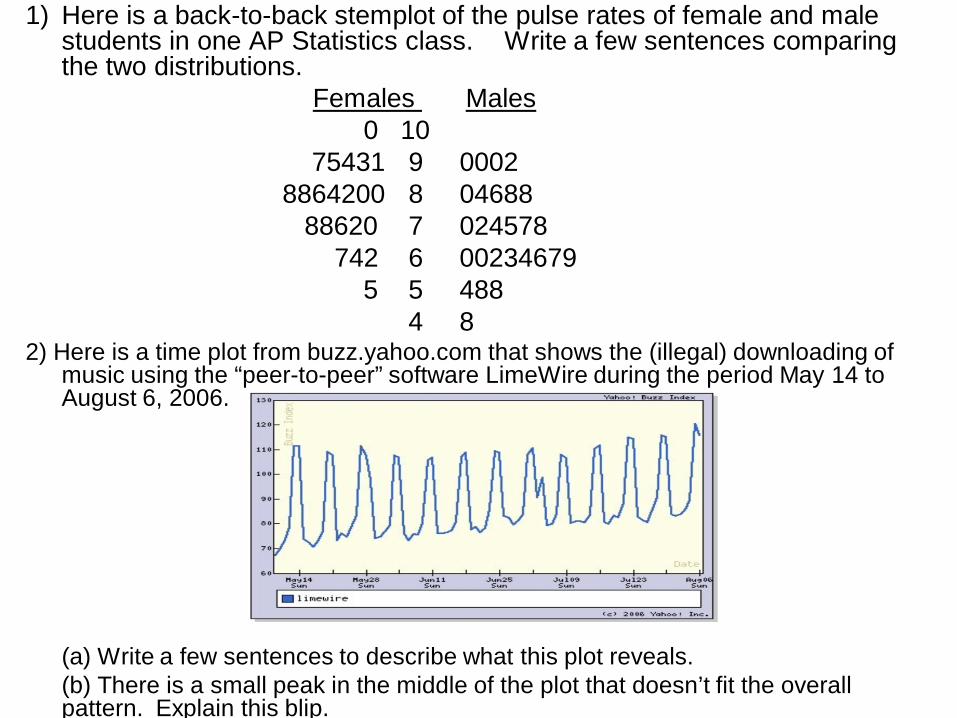
1) Here is a back-to-back stemplot of the pulse rates of female and male students in one AP Statistics class. Write a few sentences comparing the two distributions.
Females Males 0 10 75431 9 0002 8864200 8 04688 88620 7 024578 742 6 00234679 5 5 488 4 8 2) Here is a time plot from buzz.yahoo.com that shows the (illegal) downloading of
music using the “peer-to-peer” software LimeWire during the period May 14 to August 6, 2006.
(a) Write a few sentences to describe what this plot reveals. (b) There is a small peak in the middle of the plot that doesn’t fit the overall
pattern. Explain this blip.


1.2 Describing Distributions with Numbers
How much is a house worth? Manhattan, Kansas, is sometimes called “the little
apple” to distinguish it from the other Manhattan. A few years ago, a house there appeared in the county appraiser’s records at $200, 059,000 (true value: $59,500). Before the error was discovered, the county, city, and school board had based their budgets on the total appraised value of real estate, which the one outlier jacked up by 6.5%.
Mean & Median
• Mean:
• Median:

Mean/Mean…(Centers) • Both measure center in different ways, but both
are useful. • Use median if you want: • Mean = • Mean/Median of a symmetric distribution are
_______________. If a distribution is exactly symmetric, ______________________.
• In a skewed distribution, ____________________________________.
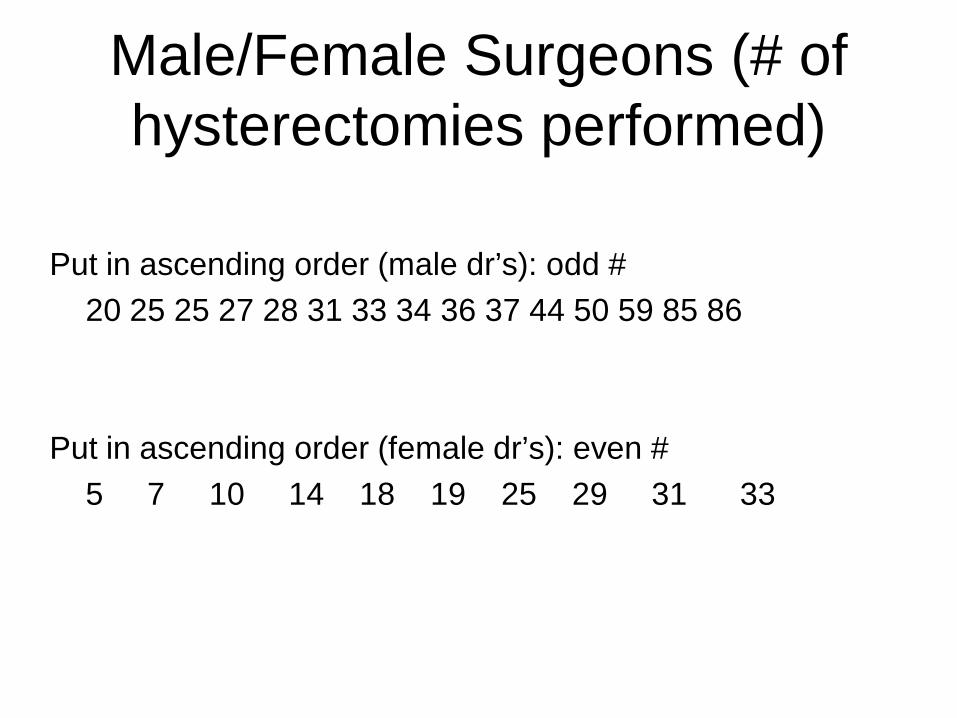
Male/Female Surgeons (# of hysterectomies performed)
Put in ascending order (male dr’s): odd # 20 25 25 27 28 31 33 34 36 37 44 50 59 85 86 Put in ascending order (female dr’s): even # 5 7 10 14 18 19 25 29 31 33

Measures of Spread
• Range =
• Better measure of spread:
• Range • Quartiles • Percentiles • 5 # Summary • Variance • Standard Deviation

Quartiles and 5 # Summary
• Steps to calculate quartiles:
• 5 # Summary:

A modified boxplot:

Boxplots • You can see that female dr’s perform less
hysterectomies than male doctors. • Also, there is less variation among female doctors.

Notes on boxplots
• Best used for ___________________of more than 1 distribution.
• ____________than histograms or stem plots.
• Always include:
Interquartile Range (IQR)
• IQR =
• Measures the spread of the middle ½ of the data.
• The Rule for Outliers: An observation is an outlier if: Less than _________________ or Greater than ______________________
Looking at the spread….
IQR shows spread of _________________ Spacing of the quartiles and extremes about the
median give an indication of the ______________________of the distribution.
Symmetric distributions: 1st/3rd quartiles equally distant from the median.
In right-skewed distributions: 3rd quartile will be farther above the median than the 1st quartile is below it.

Travel Times to Work #1
How long does it take you to get from home to school? Here are the travel times from home to work in minutes for 15 workers in North Carolina, chosen at random by the Census Bureau:
30 20 10 40 25 20 10 60 15 40 5 30 12 10 10

The distribution…
• Describe: • Is the longest travel time (60 minutes) an outlier? • How many of the travel times are larger than the
mean? • If you leave out the longest time, how does that
change the mean? • The mean in this example is ____________
because it is sensitive to the influence of extreme observations.

You do: Travel Times to Work #2
Travel times to work in New York State are (on the average) longer than in North Carolina. Here are the travel times in minutes of 20 randomly chosen New York workers:
10 30 5 25 40 20 10 15 30 20 15 20 85 15 65 15 60 60 40 45

Got friends? Is there a difference between the number of programmed telephone
numbers in girls’ cell phones and the number of programmed numbers in boys’ cell phones? Do you think there is a difference? If so, in what direction?
1) Count the number of programmed telephone numbers in your cell phone and write the total and M/F on your post-it and pass it up.
2) Make a back-to-back stemplot of this information, then draw boxplots. When you test for outliers, how many do you find for males and how many do you find for females using the 1.5 X IQR test?
3) Find the 5# Summary for each group. Compare the two distributions (SOCS!).
4) It is important in any study that you have “data integrity” (the data is reported accurately and truthfully). Do you think this is the case here? Do you see any suspicious observations? Can you think of any reason someone may make up a response or stretch the truth? If you DO see a difference between the two groups, can you suggest a possible reason for this difference?
5) Do you think a study of cell phone programmed numbers for a sophomore algebra class would yield similar results? Why or why not?
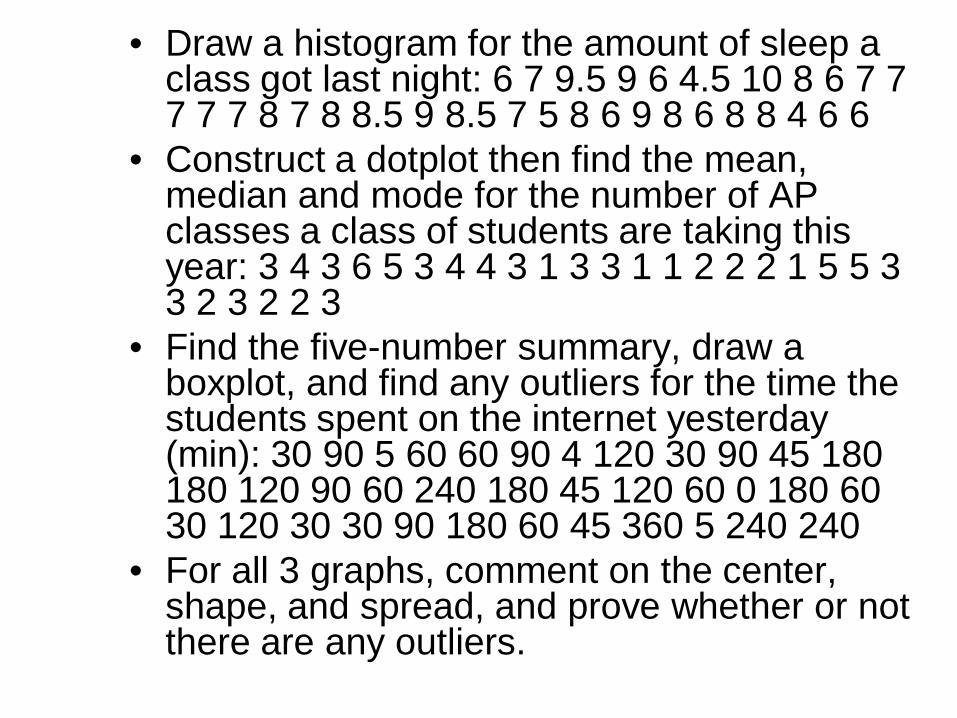
• Draw a histogram for the amount of sleep a class got last night: 6 7 9.5 9 6 4.5 10 8 6 7 7 7 7 7 8 7 8 8.5 9 8.5 7 5 8 6 9 8 6 8 8 4 6 6
• Construct a dotplot then find the mean, median and mode for the number of AP classes a class of students are taking this year: 3 4 3 6 5 3 4 4 3 1 3 3 1 1 2 2 2 1 5 5 3 3 2 3 2 2 3
• Find the five-number summary, draw a boxplot, and find any outliers for the time the students spent on the internet yesterday (min): 30 90 5 60 60 90 4 120 30 90 45 180 180 120 90 60 240 180 45 120 60 0 180 60 30 120 30 30 90 180 60 45 360 5 240 240
• For all 3 graphs, comment on the center, shape, and spread, and prove whether or not there are any outliers.

Standard Deviation: • Standard deviation looks at
__________________________________. • It’s the natural measure of
______________for the Normal distribution • We like ____ instead of _____(variance)
since the units of measurement are easier to work with (original scale)
• ______ is the average of the squares of the deviations of the observations from their mean.
Section 1.2 Part II...

Etc…
• “s”, like the mean, _______________________________. A few outliers can make “s” very large.
• Skewed distributions with a few observations in the single long tail = _________. (“S” is therefore not very helpful in this case)
• As the observations become more spread about the mean, __________________.

Mean vs. Median Standard Deviation vs. 5# Summary
• The mean (x-bar) and standard deviation (s) are _____________________ than the five number summary (min, Q1, med, Q3, max) as a measure of center and spread.
• No single # describes the spread well. • Remember: A graph gives the best overall picture of
a distribution. ALWAYS ____________________! • The choice of mean/median depends upon
__________________________________. When dealing with a skewed distribution,
__________________________________________. When dealing with reasonably symmetric
distributions, ________________________________.

S and S^2 • S =
• S^2 =
• The variance and standard deviation are… LARGE if _____________________________ SMALL if _____________________________

Degrees of Freedom (n-1) • Definition:
• Calculated from the ________________.
They are a measure of the amount of information from the sample data that has been used up. Every time a statistic is calculated from a sample, one degree of freedom is used up.
• If the mean of 4 numbers is 250, we have degrees of freedom (4-1) = 3. Why?
____ ____ ____ ____ mean = 250

Properties of Standard Deviation
1.
2.
3. Choosing a Summary:

• A person’s metabolic rate is the rate at which the body consumes energy. Metabolic rate is important in studies of weight gain, dieting, and exercise. Here are the metabolic rates of 7 men who took part in a study of dieting:
1792 1666 1362 1614 1460 1867 1439 • Find the mean • List 1: Observations (x) • List 2: Deviations (L1-mean) • List 3: Squared deviations (L2)^2 • (Sum L3) / (n-1) Calc:

You do! (Long Way Round) • Let X = What is the variance and standard
deviation?
{ }3,7,15,23

You do! (using 1 Var Stats) During the years 1929-1939 of the Great
Depression, the weekly average hours worked in manufacturing jobs were 45, 43, 41, 39, 39, 35, 37, 40, 39, 36, and 37. What is the variance and standard deviation?

Linear Transformations • A linear transformation changes:
• Effect of a linear transformation...

Miami Heat Salaries
1) Suppose that each member receives a $100,000 bonus. How will this
effect the center, shape, and spread?
2) Suppose that each player is offered 10%
increase in base salary. What happened to
the centers and spread?
Player Salary Shaq 27.7 Eddie Jones 13.46 Wade 2.83
Jones 2.5 Doleac 2.4 Butler 1.2 Wright 1.15 Woods 1.13 Laettner 1.10 Smith 1.10 Anderson .87 Dooling .75 Wang .75 Haslem
.62
Mourning .33

Where do I stand? • A student gets a test back with a score of 78
marked clearly at the top. • A middle-aged man goes to his doctor to have
his cholesterol checked. His total cholesterol reading is 210 mg/dl.
• An employee in a large company earns an annual salary of $42,000.
• A 10th grader scores 46 on the PSAT Writing test.

Big Idea!
• You can describe where an individual score falls within a distribution by describing that score’s location relative to the mean or median.
• _____________ measure location relative to the median.
• We use ___________ to measure location relative to the mean.
• A standardized z-score =
• A z-score is _______________. The absolute value of z tells you how many ____________________the score is from the _____________.
• The sign (positive or negative) of z tells you
_________________________________________. • Z scores give you the ability to ______________
values across distributions with different means and standard deviations.
2.1: Measures of Relative Standing and Density Curves

Jenny scored an 86 on her first stats test. How did she perform among her classmates?
1) Look at distribution Outliers? Shape?
2) Summary Stats
79 81 80 77 73
83 74 93 78 80
75 67 73 77 83
86 90 79 85 83
89 84 82 77 72

1) Jenny scored above average. But by how much?
2) Katie scored the highest, 93. What is her z-score? What does it mean?
3) Norman got a 72. what is his z-score? What does it mean?
Percentiles
• Norman got a 72 on his exam. Only one person did worse than he did out of a total of 25 people. What is his percentile?
• Katie got the highest score out of the class (she was the 93). What is her percentile?
• On an index card, write your height in inches, then write your height on the board.
• Hold up your index card and put yourselves in order around the room (shortest to tallest).
• Count the number of people who are shorter than you (include yourself).
• Calculate the mean, standard deviation, 5 # summary.
• Calculate your percentile, then find how many standard deviations you are above or below the mean (find your z-score). Write your percentile and z-score on the back of your index card, and hold it up when Ms. S. tells you to. Look around the room. Does this make sense?
Chebyshev’s Inequality: You can use this inequality for
______________________ (normal or skewed). Describes the _______________ of observations
in any distribution that fall within a specified number of standard deviations of the mean.

Strategy for exploring data on a single quantitative variable:
1. Graph it 2. Overall pattern? Striking deviations? 3. Numerical summary to describe
center/spread? 4. Describe pattern w/smooth curve if it’s
regular =
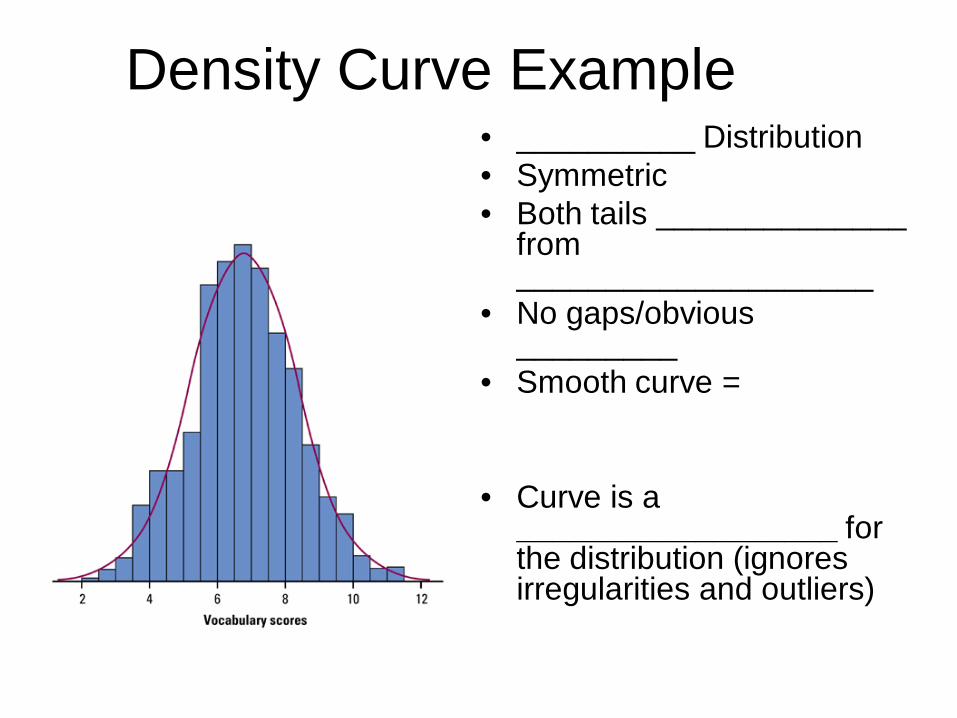
Density Curve Example • __________ Distribution • Symmetric • Both tails ______________
from ____________________
• No gaps/obvious _________
• Smooth curve = • Curve is a
__________________ for the distribution (ignores irregularities and outliers)

From histogram to density curve
Why a smooth curve? • Histogram depends on our choice of classes, but
when we use a curve, it doesn’t depend on any choices we make (easier to work with)
• Use a smooth curve to describe what ____________ of the observations fall in each range of values, not the __________of the observations.
• Our eyes respond to the areas of the bars in a histogram. Same is true of a smooth curve:
• We adjust the scale of the graph so the total area
under the curve = ____ .

A density curve is a curve that: - -
Important Points…. 1. The curve doesn’t _________________! 2. It is an _____________ description of the data
– an “approximation” – but is accurate enough for practical use (no real set of data is exactly described by a density curve)
3. Foundation for _______________!

Example 2.5: Reading d.c.’s • Skewed slightly _____ • Shaded area: 7-8 • Area under the curve = • Therefore, ____% of all
_____________ from this distribution have values between 7 and 8.
* The real power of d.c.’s with normal distributions = _________________based on curve => inference.

Density Curves have many shapes.
• Left: The median and mean of a symmetric density curve are _________.
• Right: The median and mean of a right-skewed density curve are ______________ (mean pulled towards tail).
Since areas under a density curve represent proportions of the total # of observations…
• Median of a density curve is the _________________, the point with ____% of the area under the curve to its left, and the remaining ____% of the area to the right.
• ____________ divide the area under the curve into quarters (25% of the area under the curve is to the left of Q1…)

• The mean is the point at which the curve would balance if it were made of solid material.
• The _____________!
• Look at figure 2.7 on page 127
Mean of a density curve

When does Mean = Median?
• The median and the mean are the same for a _______________________. They both lie at the __________ of the curve.
• The mean of a skewed curve is pulled away from the median in the direction of the _____________________.

Notation
• Mean and standard deviation for actual observations (samples):
• Mean and standard deviation for idealized distributions (populations):

Example: A density curve consists of a straight line drawn
from the origin (0,0); the slope is 1. a) Find the point of termination for this line (hint:
use the fact that this is a valid density curve). b) Find Q1, Q2, Q3 c) Relative to the median, where would you
expect the mean of the distribution to lie? d) What percentage of the data lies below .5?
What percentage of the data lies above 1.5?

2.2: Normal Distributions
Note on Uniform
Distributions

3 Reasons why we like Normal Distributions
• Good _____________ of real data (ex: SATs, psychological tests, characteristics of populations…)
• Good _______________ to results of many kinds of chance outcomes.
• Many _______________________work well for “roughly symmetrical” distributions.
• Many data sets tend to be _______________________ (characteristics of biological populations)
• TI83: student heights, L1, graph
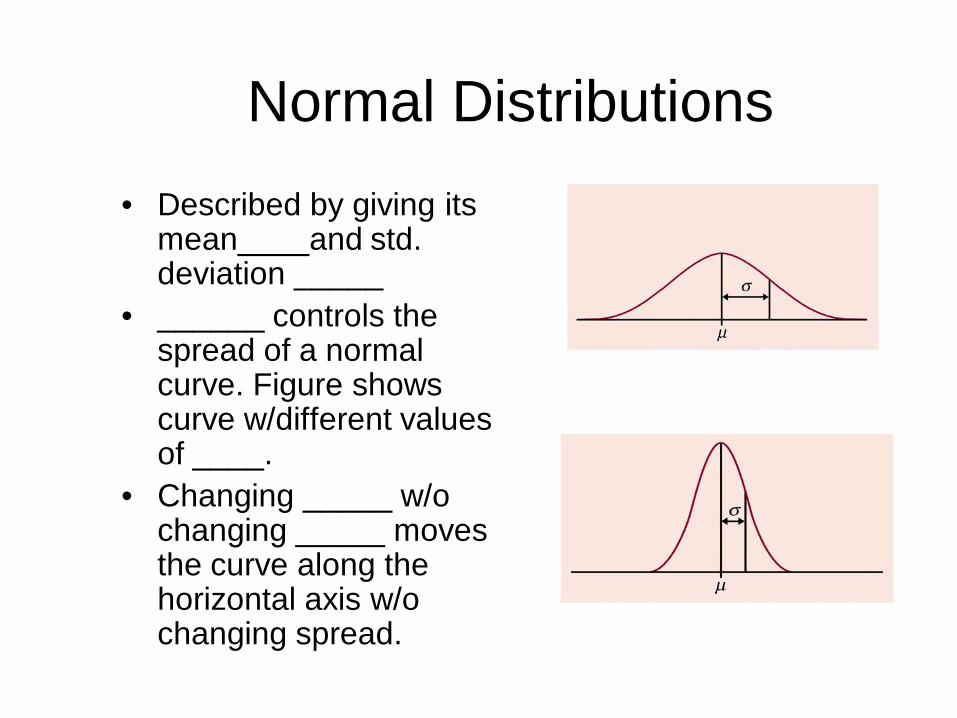
Normal Distributions • Described by giving its
mean____and std. deviation _____
• ______ controls the spread of a normal curve. Figure shows curve w/different values of ____.
• Changing _____ w/o changing _____ moves the curve along the horizontal axis w/o changing spread.

Locating the standard deviation by eyeballing the curve: “___________________”
As we move out in either direction from the center , the curve changes from falling ever more steeply
µ

σσ
µµ
The 68-95-99.7 Rule States:
Common Properties of Normal Curves: • They all have __________________(where change of
curvature takes place). • ____________________ only provides an approximate
value for the proportion of observations that fall within 1, 2, or 3 std. devs of the mean.

Example #1
• Suppose that taxicabs in NYC are driven an average of 75,000 miles per year with a standard deviation of 12,000 miles. What information does the empirical rule tell us?

2 Normal curves What do you notice
about their means? What do you notice
about their standard deviations?


Standard Normal Table - A
• Table A is a table of ____________(proportions/probabilities) under the standard Normal curve.
• The table entry for each value z is the ______ under the curve to the ______ of z.
Steps for solving problems with Normal Distributions:
1. 2. 3. 4.

Finding Areas to the Left
Find the proportion of observations from the standard normal distribution that are less than 2.22.
That is: Find the probability
that z is less than 2.22 or
P (z < 2.22) =

Finding Areas to the Right • Find the proportion
of observations from the standard normal distribution that are greater than -2.15.
• That is: find P (z > -2.15)

Table A Practice Use Table A to find the proportion of observations
from a standard Normal distribution that falls in each of the following regions. In each case, sketch a standard Normal curve and shade the area representing the region.
1) Z is less than or equal to -2.25 2) Z is greater than or equal to -2.25 3) Z > 1.77 4) -2.25 < z < 1.77

Example
• The mean of women is 64.5 inches, and the standard deviation is 2.5 inches. What proportion of all young women are less than 68 inches tall?

Example • The level of cholesterol in the blood is
important because high cholesterol levels may increase the risk of heart disease. The distribution of blood cholesterol levels in a large population of people of the same age and sex is roughly normal. For 14 year old boys, the mean is 170 mg/dl and the standard deviation is 30 mg/ . Levels above 240 mg/dl may require medical attention. What percent of 14-year-old boys have more than 240 mg/dl of cholesterol?
2dl


What percent of 14 year old boys have between 170 and 240 mg/dl?
Finding a value given a proportion
Use Table A backwards! 1) Find the given proportion in the _______
of the table 2) Read the corresponding ___________ 3) “Unstandardize” to get the observed (x)
value. Voila!
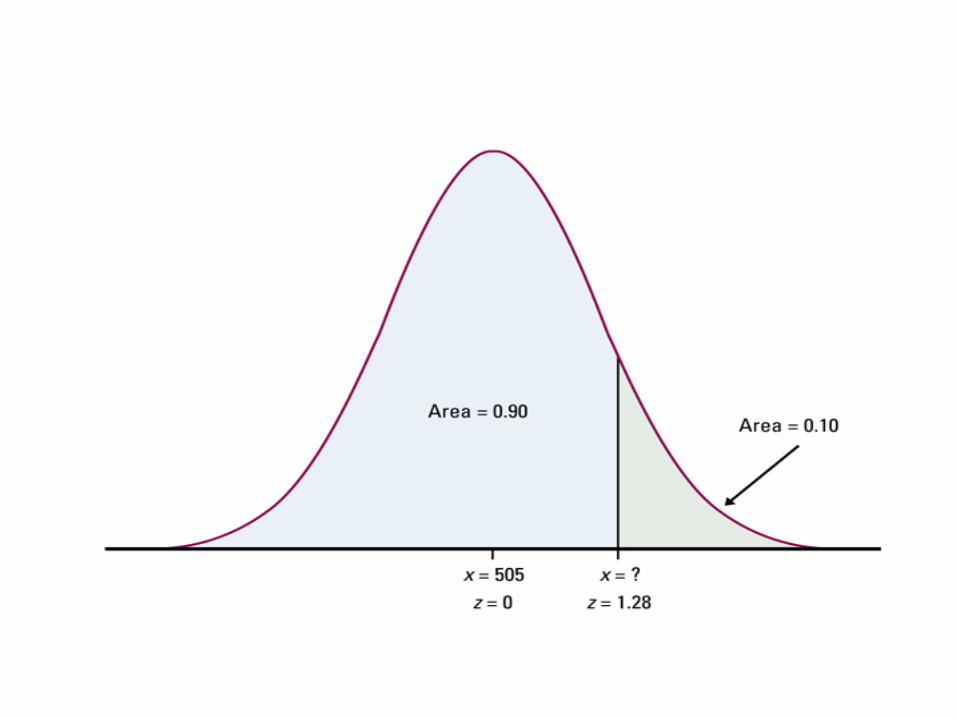
Example
• Scores on the SAT verbal test in recent years follow approximately the N(505,110) distribution. How high must a student score in order to place in the top 10% of all students taking the SAT?
Special Note….
• X is greater than ___________________ x is greater than or equal to because it is a ______________ curve.
• That is, there is __________________________ where x = 240. There may be a boy with an exact cholesterol level of 240, but _______________________________________.
• The normal distribution is therefore an __________________ – not a description of every detail in the exact data.

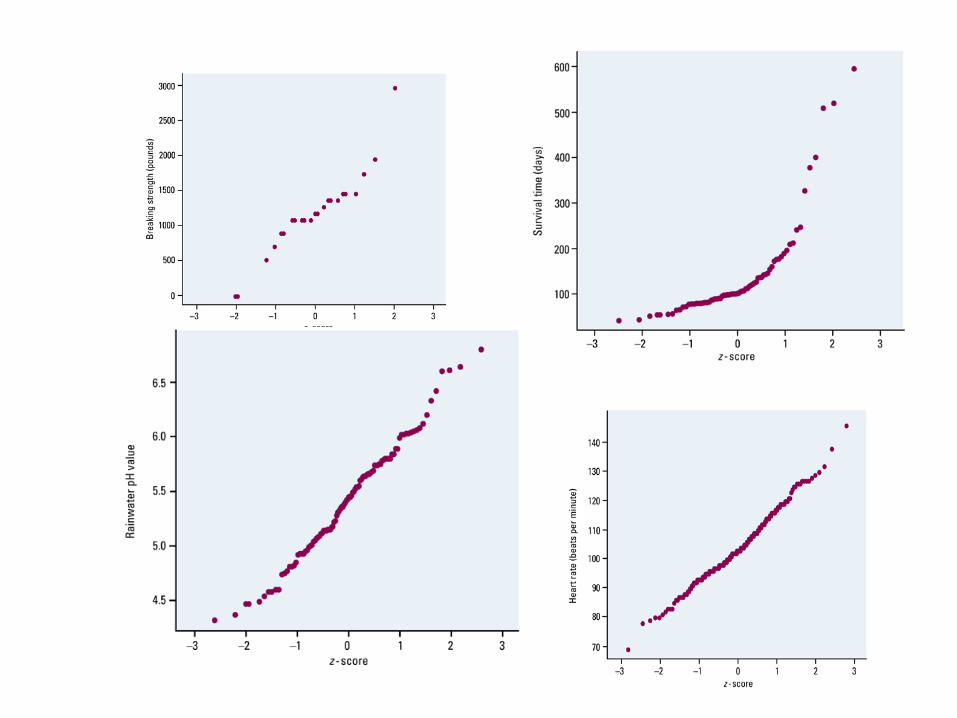
Normal Probability Plot
• If the points on a Normal Probability Plot make a ______________ than the data are _____________ .
• Use Calculator • Don’t overreact to minor wiggles in the
plot • Normality cannot be assumed if there
is skewness or outliers (don’t use Normal distribution if these things occur)!