
Rum River Watershed Fish based Lake IBI Stressor ... based Lake IBI Stressor Identification Report...
53
Rum River Watershed Fish based Lake IBI Stressor Identification Report A study of local stressors limiting the biotic communities in lakes in the Rum River Watershed. October 2016 wq-ws5-07010207a
-
Upload
truongkhue -
Category
Documents
-
view
219 -
download
0
Transcript of Rum River Watershed Fish based Lake IBI Stressor ... based Lake IBI Stressor Identification Report...
Rum River Watershed
Fish based Lake IBI Stressor
Identification Report A study of local stressors limiting the biotic communities in lakes in the Rum River Watershed.
October 2016
wq-ws5-07010207a

ii
Author Lucas Borgstrom (MNDNR)
Contributors/Acknowledgements Jacquelyn Bacigalupi (MNDNR)
Emily Bartusek (formerly MNDNR)
Kevin Mott (MNDNR)
Funding for this work is provided by the Clean Water, Land, & Legacy Amendment through the Clean Water Fund, and by the Sport Fish Restoration Program.
Cover Photos Clockwise from top left:
White water lily (Nymphaea odorata) close up taken by Lucas Borgstrom (MNDNR)
Cattails edging a lake with a farmstead in the background taken by Lucas Borgstrom (MNDNR)
Swamp milkweed (Asclepias incarnta) flower close up taken by Lucas Borgstrom (MNDNR)
Contents
Contents ............................................................................................................................................................... iii
List of Figures ........................................................................................................................................................ iv
List of Tables ......................................................................................................................................................... vi
Acronyms and abbreviations ............................................................................................................................... vii
Executive Summary - Fish-based Lake IBI Stressor Identification - Rum River Watershed ................................... viii
1. George Lake, 02-0091-00, Anoka County ....................................................................................................... 1
1.1 Impairment .................................................................................................................................................. 1
1.2 Biology .......................................................................................................................................................... 1
1.3 Potential stressors ........................................................................................................................................ 3
1.4 Conclusion .................................................................................................................................................... 9
2. Francis Lake, 30-0080-00, Isanti County ....................................................................................................... 10
2.1 Impairment ................................................................................................................................................ 10
2.2 Biology ........................................................................................................................................................ 10
2.3 Potential Stressors ..................................................................................................................................... 13
2.4 Conclusion .................................................................................................................................................. 18
3. Blue Lake, 30-0107-00, Isanti County ........................................................................................................... 19
3.1 Impairment ................................................................................................................................................ 19
3.2 Biology ........................................................................................................................................................ 19
3.3 Potential Stressors ..................................................................................................................................... 22
3.4 Conclusion .................................................................................................................................................. 29
4. Green Lake, 30-0136-00, Isanti County ........................................................................................................ 29
4.1 Impairment ................................................................................................................................................ 29
4.2 Biology ........................................................................................................................................................ 30
4.3 Potential Stressors ..................................................................................................................................... 31
4.4 Conclusion .................................................................................................................................................. 39
Glossary ............................................................................................................................................................... 41
Bibliography ........................................................................................................................................................ 43

iv
List of Figures Figure 1.2-1: Emergent Vegetation map of George Lake (DOW 02-0091-00) from 2013 data overlaid on an aerial image of the lake. ........................................................................................................................... 2 Figure 1.3-1: Aerial photograph (FSA 2013) of George Lake (DOW 02-0091-00) and the contributing watershed. .................................................................................................................................................... 3 Figure 1.3-2: Land use (NLCD 2011) in George Lake (DOW 02-0091-00) contributing watershed. Legend follows Figure E.S 1. ...................................................................................................................................... 4 Figure 1.3-3: George Lake (DOW 02-0091-00) contributing watershed land cover type for 2001, 2006, and 2011 (Top) and crop type from 2006 to 2015 (Bottom). Graphic utilized from MNDNR Watershed Health Assessment Framework (WHAF) interactive map (MNDNR, 2016). ................................................. 4 Figure 1.3-4: Impervious lands (NLCD 2011) in George Lake (DOW 02-0091-00) contributing watershed. Darker red indicates a higher percentage of imperviousness, black indicates zero percent impervious. ... 5 Figure 1.3-5: Change in land use (NLCD 2001 - 2006) in George Lake (DOW 02-0091-00) contributing watershed. Black indicates no change, colors follow Figure E.S 1. ............................................................... 6 Figure 1.3-6: Change in land use (NLCD 2006 - 2011) in George Lake (DOW 02-0091-00) contributing watershed. Black indicates no change, colors follow Figure E.S 1. ............................................................... 6 Figure 1.3-7: Aerial photo of the shoreline of George Lake (DOW 02-0091-00) and the contributing watershed (highlighted in blue). Note the location of the water level control structure in the southeast corner of this image but outside of the contributing watershed. ................................................................ 7 Figure 1.3-8: Land use within 1000 feet of the shoreline of George Lake (DOW 02-0091-00) and still within the contributing watershed (blue line). Colors follow Figure E.S 1. .................................................. 8 Figure 2.2-1: Emergent vegetation map of Francis Lake (DOW 30-0080-00) from 2013 data overlaid on an aerial image of the lake. .............................................................................................................................. 12 Figure 2.3-1: Aerial photograph (FSA 2013) of Francis Lake (DOW 30-0080-00) and the contributing watershed. .................................................................................................................................................. 13 Figure 2.3-2: Land use (NLCD 2011) in Francis Lake (DOW 30-0080-00) contributing watershed. Legend follows Figure E.S 1. .................................................................................................................................... 13 Figure 2.3-3: Francis Lake (DOW 30-0080-00) contributing watershed land cover type for 2001, 2006, and 2011 (Top) and crop type from 2006 to 2015 (Bottom). Graphic utilized from MNDNR Watershed Health Assessment Framework (WHAF) interactive map (MNDNR, 2016). ............................................... 14 Figure 2.3-4: Impervious lands (NLCD 2011) in Francis Lake (DOW 30-0080-00) contributing watershed. Darker red indicates a higher percentage of imperviousness, black indicates zero percent impervious. . 14 Figure 2.3-5: Change in land use (NLCD 2001 - 2006) in Francis Lake (DOW 30-0080-00) contributing watershed. Black indicates no change, colors follow Figure E.S 1. ............................................................. 15 Figure 2.3-6 Change in land use (NLCD 2006 - 2011) in Francis Lake (DOW 30-0080-00) contributing watershed. Black indicates no change, colors follow Figure E.S 1. ............................................................. 15 Figure 2.3-7: Aerial photo of the shoreline of Francis Lake (DOW 30-0080-00) and the contributing watershed (highlighted in blue). Note the location of the water level control structure. ......................... 16 Figure 2.3-8: Land use within 1000 feet of the shoreline of Francis Lake (DOW 30-0080-00) and still within the contributing watershed (blue line). Colors follow Figure E.S 1. ................................................ 17 Figure 3.2-1: Emergent vegetation map of Blue Lake (DOW 30-0107-00) from 2013 data overlaid on an aerial image of the lake. .............................................................................................................................. 21 Figure 3.3-1: Aerial photograph (FSA 2013) of Blue Lake (DOW 30-0107-00) and the contributing watershed. .................................................................................................................................................. 22 Figure 3.3-2: Land use (NLCD 2011) in Blue Lake (DOW 30-0107-00) contributing watershed. Legend follows Figure E.S 1. .................................................................................................................................... 23

v
Figure 3.3-3: Blue Lake (DOW 30-0107-00) contributing watershed land cover type for 2001, 2006, and 2011 (Top) and crop type from 2006 to 2015 (Bottom). Graphic utilized from MNDNR Watershed Health Assessment Framework (WHAF) interactive map (MNDNR, 2016). ........................................................... 23 Figure 3.3-4: Impervious lands (NLCD 2011) in Blue Lake (DOW 30-0107-00) contributing watershed. Darker red indicates a higher percentage of imperviousness, black indicates zero percent impervious. . 24 Figure 3.3-5: Change in land use (NLCD 2001 - 2006) in Blue Lake (DOW 30-0107-00) contributing watershed. Black indicates no change, colors follow Figure E.S 1. ............................................................. 24 Figure 3.3-6: Change in land use (NLCD 2006 - 2011) in Blue Lake (DOW 30-0107-00) contributing watershed. Black indicates no change, colors follow Figure E.S 1. ............................................................. 25 Figure 3.3-7: Aerial photo of the shoreline of Blue Lake (DOW 30-0107-00) and the contributing watershed (highlighted in blue). Note the water level control structure location on the north end of the lake. ............................................................................................................................................................. 26 Figure 3.3-8: Land use within 1000 feet of the shoreline of Blue Lake (DOW 30-0107-00) and still within the contributing watershed (blue line). Colors follow Figure E.S 1. ........................................................... 27 Figure 4.3-1: Aerial photograph (FSA 2013) of Green Lake (DOW 30-0136-00) and the contributing watershed. .................................................................................................................................................. 32 Figure 4.3-2: Land use (NLCD 2011) in Green Lake (DOW 30-0136-00) contributing watershed. Legend follows Figure E.S 1. .................................................................................................................................... 33 Figure 4.3-3: Green Lake (DOW 30-0136-00) contributing watershed land cover type for 2001, 2006, and 2011 (Top) and crop type from 2006 to 2015 (Bottom). Graphic utilized from MNDNR Watershed Health Assessment Framework (WHAF) interactive map (MNDNR, 2016). ........................................................... 34 Figure 4.3-4: Impervious lands (NLCD 2011) in Green Lake (DOW 30-0136-00) contributing watershed. Darker red indicates a higher percentage of imperviousness, black indicates zero percent impervious. . 34 Figure 4.3-5: Change in land use (NLCD 2001 - 2006) in Green Lake (DOW 30-0136-00) contributing watershed. Black indicates no change, colors follow Figure E.S 1. ............................................................. 35 Figure 4.3-6: Change in land use (NLCD 2006 - 2011) in Green Lake (DOW 30-0136-00) contributing watershed. Black indicates no change, colors follow Figure E.S 1. ............................................................. 35 Figure 4.3-7: Aerial photo of the shoreline of Green Lake (DOW 30-0136-00) and the contributing watershed (highlighted in blue). Note the water level control structure location on the southeast shore of the lake. .................................................................................................................................................. 37 Figure 4.3-8: Land use within 1000 feet of the shoreline of Green Lake (DOW 30-0136-00) and still within the contributing watershed (blue line). Colors follow Figure E.S 1. ........................................................... 38

vi
List of Tables Table 1.3-1: Breakdown of how each of the three zones (Shoreland, Shoreline, Aquatic) on George Lake scored utilizing the Score the Shore survey and a categorical interpretation (Excellent, good, fair, poor) of that score. ................................................................................................................................................. 8 Table 1.3-2: Score the Shore survey scores overall as well as for developed and undeveloped sites on George Lake and a categorical interpretation (Excellent, good, fair, poor) of that score. ........................... 8 Table 2.3-1: Breakdown of how each of the three zones (Shoreland, Shoreline, Aquatic) on Francis Lake scored utilizing the Score the Shore survey and a categorical interpretation (Excellent, good, fair, poor) of that score. ............................................................................................................................................... 17 Table 2.3-2: Score the Shore survey scores overall as well as for developed and undeveloped sites on Francis Lake and a categorical interpretation (Excellent, good, fair, poor) of that score. ......................... 18 Table 3.3-1: Breakdown of how each of the three zones (Shoreland, Shoreline, Aquatic) on Blue Lake scored utilizing the Score the Shore survey and a categorical interpretation (Excellent, good, fair, poor) of that score. ............................................................................................................................................... 28 Table 3.3-2: Score the Shore survey scores overall as well as for developed and undeveloped sites on Blue Lake and a categorical interpretation (Excellent, good, fair, poor) of that score............................... 28 Table 4.3-1: Breakdown of how each of the three zones (Shoreland, Shoreline, Aquatic) on Green Lake scored utilizing the Score the Shore survey and a categorical interpretation (Excellent, good, fair, poor) of that score. ............................................................................................................................................... 36 Table 4.3-2: Score the Shore survey scores overall as well as for developed and undeveloped sites on Green Lake and a categorical interpretation (Excellent, good, fair, poor) of that score. ........................... 37

vii
Acronyms and abbreviations DOW Division of Waters number
FNRU Formazin Nephelometric Ratio Unit
FQI Floristic Quality Index
FIBI Fish-based lake Index of Biological Integrity
IBI Index of Biological Integrity
mg/L milligrams per liter
MBWSR Minnesota Board of Water and Soil Resources
MCBS Minnesota County Biological Survey
MNDNR Minnesota Department of Natural Resources
MPCA Minnesota Pollution Control Agency
NCHF North Central Hardwood Forests
NLCD National Land Cover Database
NLF Northern Lakes and Forests
StS Score the Shore
TDS Total Dissolved Solids
TSI Carlson Trophic State Index
µg/L micrograms per liter
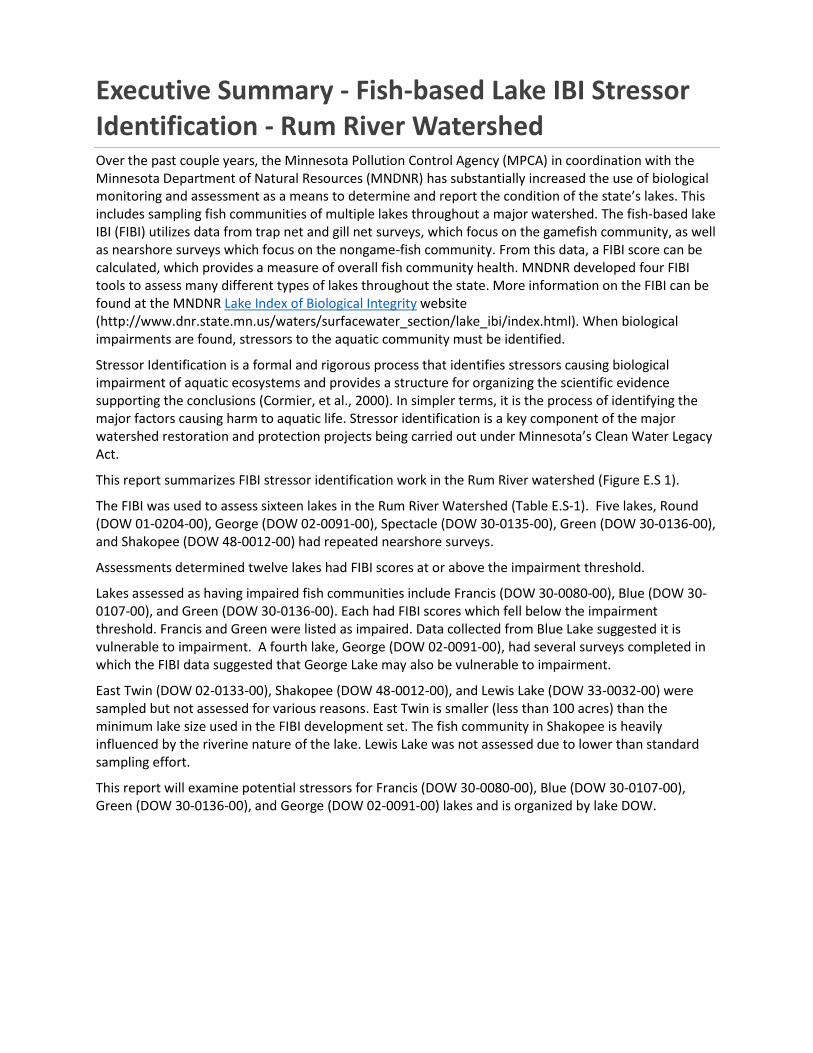
Executive Summary - Fish-based Lake IBI Stressor Identification - Rum River Watershed Over the past couple years, the Minnesota Pollution Control Agency (MPCA) in coordination with the Minnesota Department of Natural Resources (MNDNR) has substantially increased the use of biological monitoring and assessment as a means to determine and report the condition of the state’s lakes. This includes sampling fish communities of multiple lakes throughout a major watershed. The fish-based lake IBI (FIBI) utilizes data from trap net and gill net surveys, which focus on the gamefish community, as well as nearshore surveys which focus on the nongame-fish community. From this data, a FIBI score can be calculated, which provides a measure of overall fish community health. MNDNR developed four FIBI tools to assess many different types of lakes throughout the state. More information on the FIBI can be found at the MNDNR Lake Index of Biological Integrity website (http://www.dnr.state.mn.us/waters/surfacewater_section/lake_ibi/index.html). When biological impairments are found, stressors to the aquatic community must be identified.
Stressor Identification is a formal and rigorous process that identifies stressors causing biological impairment of aquatic ecosystems and provides a structure for organizing the scientific evidence supporting the conclusions (Cormier, et al., 2000). In simpler terms, it is the process of identifying the major factors causing harm to aquatic life. Stressor identification is a key component of the major watershed restoration and protection projects being carried out under Minnesota’s Clean Water Legacy Act.
This report summarizes FIBI stressor identification work in the Rum River watershed (Figure E.S 1).
The FIBI was used to assess sixteen lakes in the Rum River Watershed (Table E.S-1). Five lakes, Round (DOW 01-0204-00), George (DOW 02-0091-00), Spectacle (DOW 30-0135-00), Green (DOW 30-0136-00), and Shakopee (DOW 48-0012-00) had repeated nearshore surveys.
Assessments determined twelve lakes had FIBI scores at or above the impairment threshold.
Lakes assessed as having impaired fish communities include Francis (DOW 30-0080-00), Blue (DOW 30-0107-00), and Green (DOW 30-0136-00). Each had FIBI scores which fell below the impairment threshold. Francis and Green were listed as impaired. Data collected from Blue Lake suggested it is vulnerable to impairment. A fourth lake, George (DOW 02-0091-00), had several surveys completed in which the FIBI data suggested that George Lake may also be vulnerable to impairment.
East Twin (DOW 02-0133-00), Shakopee (DOW 48-0012-00), and Lewis Lake (DOW 33-0032-00) were sampled but not assessed for various reasons. East Twin is smaller (less than 100 acres) than the minimum lake size used in the FIBI development set. The fish community in Shakopee is heavily influenced by the riverine nature of the lake. Lewis Lake was not assessed due to lower than standard sampling effort.
This report will examine potential stressors for Francis (DOW 30-0080-00), Blue (DOW 30-0107-00), Green (DOW 30-0136-00), and George (DOW 02-0091-00) lakes and is organized by lake DOW.
ix
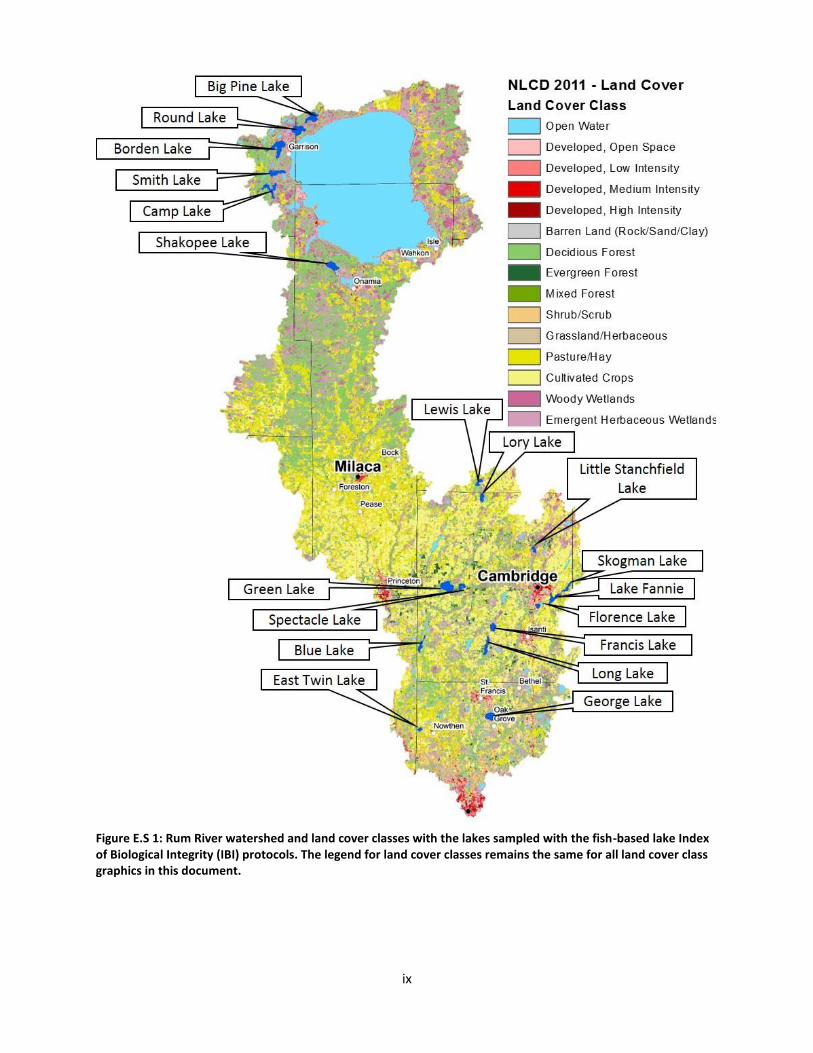
Figure E.S 1: Rum River watershed and land cover classes with the lakes sampled with the fish-based lake Index of Biological Integrity (IBI) protocols. The legend for land cover classes remains the same for all land cover class graphics in this document.

x
Table E.S-1: Summary of lakes in the Rum River watershed assessed with fish-based lake Index of Biological Integrity (IBI) protocols. The shaded rows are lakes discussed further in this document. The % littoral is the % of the MNDNR GIS Acres that is 15 feet in depth or less for that lake.
DOW Lake Name County
Nearshore Survey
Year Notes MNDNR
GIS Acres IBI
Tool % Littoral FIBI
Score
Below Impairment Threshold
Within 90% CI of Impairment
Threshold
01-0157-00 Big Pine Aitkin 2011 None 635 2 41 66 No No
01-0204-00 Round Aitkin 2008, 2013 Assessed on 2013 data 733 2 44 56, 58 No No
02-0091-00 George Anoka 2008,
2014, 2015 Assessed on 2015 data
(June, July) 488 4 80 39, 37 No, Yes Yes
18-0018-00 Camp Crow Wing 2014 None 520 2 40 51 No No
18-0020-00 Borden Crow Wing 2014 None 1012 2 30 58 No No
18-0028-00 Smith Crow Wing 2010 Low effort – 4 seine
hauls 481 2 38 66 No No
30-0022-00 Skogman Isanti 2013 None 223 5 61 38 No Yes
30-0035-00 Florence Isanti 2013 None 135 7 94 64 No No
30-0043-00 Fannie Isanti 2013 None 354 5 87 48 No No
30-0044-00 Little Stanchfield
Isanti 2013 None 146 7 100 48 No No
30-0072-00 Long Isanti 2013 None 382 7 100 42 No Yes
30-0080-00 Francis Isanti 2013 None 264 7 100 22 Yes Yes
30-0096-00 Lory Isanti 2013 None 214 7 92 55 No No
30-0107-00 Blue Isanti 2013 None 263 5 51 14 Yes Yes
30-0135-00 Spectacle Isanti 2007, 2013 Assessed on 2013 data 243 4 65 34, 38 No Yes
30-0136-00 Green Isanti 2007, 2012 Assessed on 2012 data 833 2 43 17, 22 Yes No

1
1. George Lake, 02-0091-00, Anoka County
1.1 Impairment George Lake was assessed as meeting standards for aquatic life use but vulnerable to further stresses based on data from multiple nearshore surveys (N = 4; 2008, 2014, 6/2015, 7/2015) and trap net and gill net data from a 2014 survey. Nearshore sampling data from the 2014 survey is excluded from assessment due to some concerns with fish identification. The MNDNR has classified Minnesota’s lakes into 43 different classes based on physical, chemical and other characteristics. Basin characteristics place George Lake in lake class 29, which is scored with the FIBI Tool for Group 4 lakes, which are characterized as generally roundish, with some deep water and in the NCHF and NLF ecoregions. The two 2015 nearshore surveys result in FIBI scores (39 using June data and 37 using July data) near the threshold (38) and within the 90% confidence interval (30 - 46).
1.2 Biology
1.2.1. Fish community During the 2008 fish survey three tolerant species were sampled (Black Bullhead, Common Carp, and Green Sunfish); but tolerant species did not dominate any of the gears. Common Carp and Black Bullhead were sampled in very low numbers. Intolerant species were sampled were Banded Killifish, Blackchin Shiner, Iowa Darter, and Least Darter. The predator fish community in George Lake is characterized by abundant Northern Pike and low numbers of Walleye (Walleye are stocked). Northern Pike dominated the gill net catch (85% of biomass). Nearshore fish sampling was dominated by Bluegill. The trap net metrics (biomass of insectivorous species, biomass of omnivorous species, and biomass of tolerant species) were below the average value for similar lakes in the FIBI development set. The trap net catch was dominated by Bluegill (53% of biomass) and secondly by Bowfin (31% of biomass); Bluegill and Bowfin are dependent upon aquatic vegetation. Other species sampled in the 2008 survey include: Black Crappie, Bluntnose Minnow, Brook Silverside, Central Mudminnow, Common Shiner, Hybrid Sunfish, Largemouth Bass, Pumpkinseed, Spotfin Shiner, Tadpole Madtom, Yellow Bullhead, and Yellow Perch.
From the more recent 2015 nearshore and 2014 gill net/trap net fish survey, three tolerant species were sampled (Black Bullhead, Common Carp, and Green Sunfish); but tolerant species did not dominate any of the gears. Common Carp and Black Bullhead were sampled in very low numbers. Five intolerant species were sampled (Banded Killifish, Blackchin Shiner, Blacknose Shiner, Iowa Darter, and Least Darter) in June and four were sampled in July (Banded Killifish, Blackchin Shiner, Blacknose Shiner, and Iowa Darter). The predator fish community in George Lake is characterized by abundant Northern Pike and low numbers of Walleye (Walleye are stocked). Northern Pike dominated the gill net catch (78% of biomass). Nearshore fish sampled were predominately Bluegill. The trap net catch was dominated by Bluegill (35% of biomass) and secondly by Bowfin (18% by biomass); Bluegill and Bowfin are dependent upon aquatic vegetation. Other species sampled in 2014/2015 include: Black Crappie, Bluntnose Minnow, Brook Silverside, Brown Bullhead, Golden Shiner, Hybrid Sunfish, Johnny Darter, Largemouth Bass, Pumpkinseed, Spotfin Shiner, Yellow Bullhead, and Yellow Perch. Two drivers of this score being near the threshold are the relatively high number of tolerant species captured (N=3) and the relatively high proportion of biomass as tolerant species in the trap net catch (5.4%).
MNDNR Fisheries Area Lake Files date back to the 1950’s (MNDNR-Fisheries, 2015). Fisheries management activities have consisted of operating a controlled northern pike spawning area from the
2
1950’s until the late 1970’s, removing Largemouth Bass fry for stocking into other lakes, rough fish removal, Walleye fingerling stocking in 2001 and 2003 (discontinued due to poor recruitment), and stocking of Walleye fry every other year starting in 2007. As recently as the early 1990’s, the lake was managed as a Largemouth Bass and Bluegill lake with Northern Pike and Black Crappie as secondary species for management. In the most recent lake management plan (2009), the lake is now being managed as a Walleye and Northern Pike fishery with Largemouth Bass and Bluegill as secondary species for management.
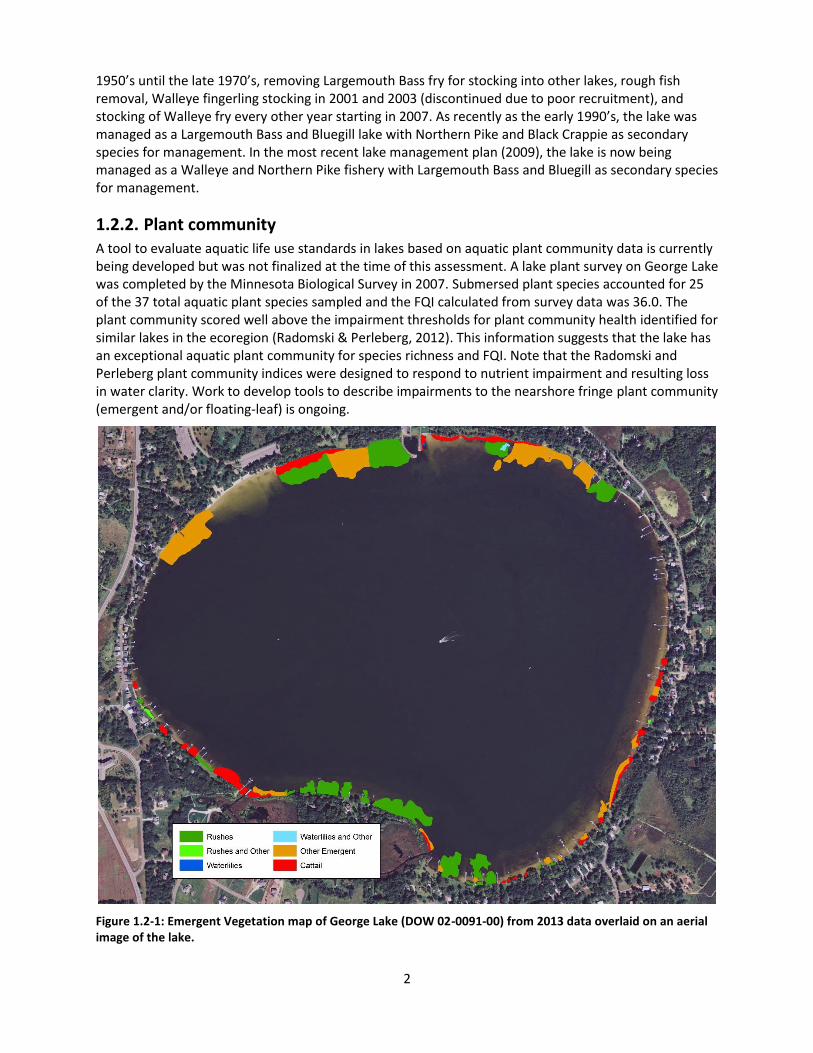
1.2.2. Plant community A tool to evaluate aquatic life use standards in lakes based on aquatic plant community data is currently being developed but was not finalized at the time of this assessment. A lake plant survey on George Lake was completed by the Minnesota Biological Survey in 2007. Submersed plant species accounted for 25 of the 37 total aquatic plant species sampled and the FQI calculated from survey data was 36.0. The plant community scored well above the impairment thresholds for plant community health identified for similar lakes in the ecoregion (Radomski & Perleberg, 2012). This information suggests that the lake has an exceptional aquatic plant community for species richness and FQI. Note that the Radomski and Perleberg plant community indices were designed to respond to nutrient impairment and resulting loss in water clarity. Work to develop tools to describe impairments to the nearshore fringe plant community (emergent and/or floating-leaf) is ongoing.
Figure 1.2-1: Emergent Vegetation map of George Lake (DOW 02-0091-00) from 2013 data overlaid on an aerial image of the lake.

3
The emergent and floating-leaf plants were mapped in 2013 (Figure 1.2-1). This effort mapped 26.75 acres of emergent or floating-leaved vegetation. Rushes (11.72 acres) and Other Emergent (10.44) were the dominant classifications of emergent vegetation. Other classifications present were Cattail (4.37 acres), Waterlilies and others (0.12 acres), Rushes and Others (0.09 acres), and Waterlilies (0.01 acres).
1.3 Potential stressors
1.3.1. Watershed disturbance George Lake has a relatively small contributing watershed (1,851 acres), with lake acres (488 acres) to contributing watershed acres ratio of about 1:4. It is situated in the North Central Hardwood Forests ecoregion in the Anoka Sand Plain, an outwash plain characterized by thin layers of sand and silt with numerous bogs and depressions (Figure 1.3-1). There are several wetland complexes within the contributing watershed ranging in size from 9 – 53 acres plus many smaller wetlands and those associated with flowing waters. An overall GIS quantification of land use types based on the National Land Cover Database 2011 (Homer, et al., 2015) showed 33% of contributing watershed area covered by un-natural land uses (15% cultivated and 18% developed; Figure 1.3-2 and Figure 1.3-3). Figure 1.3-4 depicts the intensity of development. A large portion of the contributing watershed is covered by water or wetlands (44%) and 20% of the land in the contributing watershed was forested in 2011 (Figure 1.3-2and Figure 1.3-3. Some change in land use has been noted from 2001 based on a review of the NLCD coverage (Figure 1.3-5 and Figure 1.3-6), primarily a fair amount of expansion in urbanization in the far northwestern portion of the contributing watershed occurred between 2001 and 2006 (Figure 1.3-5) over which time a golf course and associated housing were constructed.
Figure 1.3-1: Aerial photograph (FSA 2013) of George Lake (DOW 02-0091-00) and the contributing watershed.

4
Figure 1.3-2: Land use (NLCD 2011) in George Lake (DOW 02-0091-00) contributing watershed. Legend follows Figure E.S 1.
Figure 1.3-3: George Lake (DOW 02-0091-00) contributing watershed land cover type for 2001, 2006, and 2011 (Top) and crop type from 2006 to 2015 (Bottom). Graphic utilized from MNDNR Watershed Health Assessment Framework (WHAF) interactive map (MNDNR, 2016).

5
A fixed crest sheet-piling weir was constructed in 1967 and is located on County Ditch Number 19 about 0.5 miles downstream from the outlet of George Lake (Figure 1.3-7). The headwater-tailwater difference in elevation is approximately three feet. George Lake is situated as a headwaters lake that is drained by a first order stream based on Strahler stream order. This stream has been dredged in the past. It should also be mentioned that there is discussion to replace the water level control structure at the outlet; which may impact water levels in George Lake. There are two intermittent streams, as reported by MNDNR Fisheries, flowing into the lake. One drains the wetland complex to the north of the lake and the other connects George Lake to the controlled northern pike spawning area on the northeast; these both may have flow during high water years. There are currently no active water use permits on George Lake. There was one water permit issued in 1970 for major crop irrigation, but has since been terminated and inactive since at least 1988.
Figure 1.3-4: Impervious lands (NLCD 2011) in George Lake (DOW 02-0091-00) contributing watershed. Darker red indicates a higher percentage of imperviousness, black indicates zero percent impervious.

6
Figure 1.3-5: Change in land use (NLCD 2001 - 2006) in George Lake (DOW 02-0091-00) contributing watershed. Black indicates no change, colors follow Figure E.S 1.
Figure 1.3-6: Change in land use (NLCD 2006 - 2011) in George Lake (DOW 02-0091-00) contributing watershed. Black indicates no change, colors follow Figure E.S 1.

7
George Lake is about 5.7 river/stream miles from the Rum River. On this circuitous route from George Lake to the Rum River there are five wetland complexes, seven road crossings, and the lake outlet weir that could prevent fish from migrating upstream and into the lake.
1.3.2. Riparian disturbance George Lake is a mostly round basin which is 488 acres in size with 391 littoral acres, resulting in roughly 80% of the lake surface being littoral area and has a maximum depth of 32 feet. The contributing watershed is in very close proximity to the lake shore in some areas around the lake (Figure 1.3-7). There is a high amount of development within 1000 feet of the shoreline and still within the contributing watershed (23% developed, 7% cultivated, 31% forest, and 36% wetlands; Figure 1.3-8) according to the 2011 NLCD dataset. Of the developed land, the vast majority (91%) is open space, which is described as mostly vegetation in the form of lawn grasses. In 1993, MNDNR Fisheries classified the shoreline as approximately 50% residential, 20% municipal, 20% forested, and 10% marshland with 114 homes/cabins present (MNDNR-Fisheries, 2015). Currently, there are 135 residential lots adjacent to George Lake that are not a part of the regional park or other public land, of which 50 are served by two 201 community sewer systems. These community sewer systems are high capacity septic systems and associated drain fields. The remaining lots are served by individual sewage treatment systems, (i.e. septic systems). There are about 95 docks along the shoreline of George Lake or approximately 18 per km of shoreline (Beck, Vondracek, Hatch, & Vinje, 2013). The Regional Park encompasses about 0.75 miles of the north shore of the lake and provides riparian green space but features some highly disturbed shorelines and a large artificial swimming beach. A review of FSA aerial photos over the past decade suggests a potential loss of emergent vegetation in areas of the lake.
Figure 1.3-7: Aerial photo of the shoreline of George Lake (DOW 02-0091-00) and the contributing watershed (highlighted in blue). Note the location of the water level control structure in the southeast corner of this image but outside of the contributing watershed.

8
Figure 1.3-8: Land use within 1000 feet of the shoreline of George Lake (DOW 02-0091-00) and still within the contributing watershed (blue line). Colors follow Figure E.S 1.
An assessment of riparian development was conducted in June 2013 following Score the Shore (StS) survey protocols and resulted in a mean score of 50.3 (range is 0 to 100). The StS survey score is comprised of scores for three zones: shoreland, shoreline, and aquatic (Table 1.3-1). Almost 75% of the StS survey sites are classified as developed which contributed to the low score for George Lake as a whole (Table 1.3-2). During the StS survey, 22% of sites had visible woody habitat and 66% had at least some emergent vegetation in the aquatic zone. These results, along with observations during field surveys and review of aerial imagery, indicates the shoreline of the lake is substantially altered.
Table 1.3-1: Breakdown of how each of the three zones (Shoreland, Shoreline, Aquatic) on George Lake scored utilizing the Score the Shore survey and a categorical interpretation (Excellent, good, fair, poor) of that score.
Zone Sample Size Mean Zone Habitat
Score (0-33.3) Rating
Shoreland 27 13.5 Poor
Shoreline 27 13.2 Poor
Aquatic 27 23.6 Fair
Table 1.3-2: Score the Shore survey scores overall as well as for developed and undeveloped sites on George Lake and a categorical interpretation (Excellent, good, fair, poor) of that score.
Broad Land Use Classification
Sample Size
Mean Lakeshore Habitat Score (0-100)
Rating
All sites 27 50.3 Poor
Developed 20 35.6 Poor
Undeveloped 7 92.4 Excellent

9
1.3.3. In-lake habitat disturbance The most recent assessment of fish spawning conditions occurred in 1993 by MNDNR Fisheries staff. They determined there are excellent spawning conditions for Northern Pike, good conditions for Black Crappie, Bluegill, Largemouth Bass, and Pumpkinseed Sunfish, and fair conditions for Yellow Perch (MNDNR-Fisheries, 2015).
In 2003, MNDNR Fisheries staff indicated that freshwater sponges were found during the vegetation survey, the survey identified 29 plant species: 5 emergent species, 3 floating-leaved species, and 21 submersed species (MNDNR-Fisheries, 2015).
George Lake has historical and recent permitted aquatic plant management. In 2013, permits were issued for approximately 50 acres of control (47 acres for chemical control of curly-leaf pondweed and Eurasian water milfoil; 2 acres for chemical control of submersed species adjacent to riparian property shoreline). Area permitted for aquatic plant control remained about the same in 2014, 51 acres for invasive plant control and 2 acres for submersed species adjacent to riparian property shoreline.
1.3.4. Aquatic invasive species George Lake is a designated infested water due to the presence of aquatic invasive species. Eurasian water milfoil and curly-leaf pondweed have been identified in the lake and were found at 95% of the vegetation transects in 2003. Eurasian water milfoil was first identified in this lake in 1998.
1.3.5. Chemistry George Lake has been sampled for water quality by MPCA and other partners from 1974 – 2014. Average water quality parameters based on the last ten years of data (2004 – 2013) include: chlorophyll-a level of 8.68 µg/L, surface dissolved oxygen (depth of 0 – 2 meters) level of 9.06 mg/L, total phosphorus level of 0.027 mg/L, turbidity value of 4.5 FNRU, secchi disk reading of 7.2 feet (MPCA, 2013 data, P. Anderson; personal communication). All of this data results in a Carlson Trophic State Index (TSI) value of 51 for George Lake; this value classifies the lake as eutrophic. Modelling has been conducted on 2,765 Minnesota lakes to identify lakes of phosphorus sensitivity significance and George Lake was classified in the highest priority group, or greater than the 75th percentile of lakes assessed (MNDNR, MPCA, & MBWSR, 2015), and ranks in the top 200 classified as top priority lakes for phosphorus sensitivity significance. Transparency has been trending downward from the early 1980s to 2011, with a considerable turn downward occurring since around the year 2000. According to the East Metro MNDNR Fisheries office the lake had a secchi disk reading of 7 feet and a green color from algae on June 16, 2014 but has above average water quality for the Twin Cities metro area which makes it a popular recreation lake.
1.4 Conclusion Biological data indicate the fish community of George Lake is vulnerable to further stresses induced by human disturbance. Several potential stressors identified in this report appear to be responsible for the status of aquatic life use being vulnerable to further stresses.
The hydrology is altered because the lake level is maintained at a fixed level and may affect the fish community.
The riparian area has also been altered by human activities and the scale of this disturbance is likely significant enough to have effects on the fish community. Two estimators of shoreland disturbance, the number of docks per kilometer of shoreline and the percentage of impervious surface close to the lake, are at levels where MNDNR research indicates changes in the fish community occur. MNDNR Fisheries

10
has identified a noticeable change in fish community occurring at a dock density of 10 docks per kilometer or greater (MNDNR; Donna Dustin and Jacquelyn Bacigalupi; personal communication). The amount of in-lake habitat permitted to be chemically destroyed has increased over the last three years from approximately 9% to 13% of the lake area. George Lake scores “fair” for the aquatic zone of the Score the Shore survey, but “poor” for shoreland and shoreline zones indicating that improvements could be made in shoreland management practices. Local, county and state shoreland ordinances should be reviewed with a focus on improving water quality and nearshore habitat.
The water quality is meeting aquatic recreation standards, the contributing watershed is small and the majority (64%) of the land cover in the contributing watershed is natural. Modeling in Minnesota lakes suggests that total phosphorus concentrations increase significantly over natural concentrations when land use disturbances occur in greater than approximately 40% of the watershed area and this relationship tends to be stronger in shallow lakes (Cross & Jacobson, 2013). Additional phosphorus is associated with reductions in water clarity, oxygen levels, and submersed vegetation as well as increases in algae and abundance of tolerant fish species such as Common Carp and Black Bullhead (MNDNR-Fisheries, 2013).
The acceptable water quality and low disturbance within the watershed, when combined with the FIBI score which was near the impairment threshold, would indicate that a significant part of the reduced fish community is due to a lack of aquatic habitat brought forth by shoreline development practices. The FIBI score was low primarily due to the high number of omnivorous (N = 5) and tolerant species (N = 3) and the similarly high proportional biomass of these species in the trap nets (omnivorous species = 29%; tolerant species = 5.3%). This suggests a lack of quality nearshore habitat.
2. Francis Lake, 30-0080-00, Isanti County
2.1 Impairment Francis Lake was assessed as impaired for aquatic life use based on the FIBI using data from a 2013 fish survey. The MNDNR has classified Minnesota's lakes into 43 different classes based on physical, chemical and other characteristics. Basin characteristics place Francis Lake in lake class 42, which is scored with the FIBI Tool for Group 7 lakes. These lakes are characterized as shallow with over 80% littoral area primarily in the southern half of the state. The FIBI score of 22 is well below the impairment threshold (36) and the 90% confidence interval (27 - 45).
2.2 Biology
2.2.1. Fish community In 2013, Francis Lake had a relatively low-diversity fish community compared to similar lakes in the watershed with 4 insectivorous species and 2 vegetative-dwelling species sampled. Two tolerant species were sampled, this is lower than similar lakes in the FIBI development set. Black Bullhead comprised 13% of gill net biomass, 0.1% of trap net biomass, and 0.7% of nearshore individuals, and Common Carp comprised 20.1% of trap net biomass, and 3.3% of nearshore individuals. It is notable that Black Crappie was highly prevalent in all sampling gears. It was the dominant species in the gill net catch (35% by biomass), and also made up significant portions of the nearshore sampling (24% of nearshore individuals) and the trap net catch (15% by biomass). The predator fish community in Francis Lake is characterized by abundant Black Crappie and Northern Pike and low numbers of Walleye (Walleye are stocked). The number of small benthic dwelling species and insectivorous species, the proportion of

11
vegetative dwelling species in the nearshore catch, and the biomass of insectivorous species in the trap nets were below expectations for similar lakes. Other species sampled in 2013 include: Bluegill, Bowfin, Golden Shiner, Hybrid Sunfish, Largemouth Bass, Pumpkinseed, and Yellow Bullhead.
A natural reproduction inventory in 1993 found Common Shiners, Fathead Minnows, Golden Shiner, Yellow Bullhead, and Yellow Perch (MNDNR-Fisheries, 2015). Neither Common Shiners nor Fathead Minnows were collected during the FIBI sampling conducted 20 years later, although both species were collected in reduced numbers in 2003 (MNDNR-Fisheries, 2015).
Fisheries management activities have consisted of stocking Largemouth Bass, Sunfish, and Black Crappies from 1928-1939, stocking sunfish and Black Crappie adults in 1969, Walleye fry stocking in 2007, 2009 and 2010, Yellow Perch, Yellow Bullheads, and Common Carp removals at various times from 1938-1967, promiscuous fishing due to low dissolved oxygen in the winters of 1948, 1979, 1983, 1984, 1986, 1988, and 1989. As recently as 1987, the lake was managed as a Northern Pike and Walleye lake with Largemouth Bass, Black Crappie, Bluegill, and Yellow Perch as secondary species for management. In the most recent lake management plan amendment (2007), the lake is now being managed as a Northern Pike and Black Crappie fishery with Largemouth Bass, Bluegill, and Walleye as secondary species for management (MNDNR-Fisheries, 2015).
2.2.2. Plant community A tool to evaluate aquatic life use standards in lakes based on aquatic plant community data is currently being developed but was not finalized at the time of this assessment. Aquatic plant surveys were conducted in 2013 and 2003. A plant survey on Francis Lake was completed by Minnesota County Biological Survey (MCBS) in 2013. Submersed plant species accounted for 4 of the 20 total aquatic plant species sampled and shoreline plant species accounted for 13 more. In 2003, one species of submersed vegetation (sago pondweed) and five total aquatic plant species were sampled, and the floristic quality index (FQI) was 13.4. Using data from either the 2003 or the 2013 surveys result in the plant community scoring below the impairment thresholds for plant community health identified for similar lakes in the ecoregion (Radomski & Perleberg, 2012). Note that the Radomski and Perleberg plant community indices were designed to respond to nutrient impairment and resulting loss in water clarity. Work to develop tools to describe impairments to the nearshore fringe plant community (emergent and/or floating-leaf) is ongoing.
The emergent and floating-leaf plants were mapped in 2013 (Figure 2.2-1). This effort mapped 9.80 acres of emergent or floating-leaved vegetation. Waterlilies (7.32 acres) were the dominant classification. Other classifications present were Cattail (2.04 acres), Rushes (0.35 acres), and Other Emergent (0.09 acres).

12
Figure 2.2-1: Emergent vegetation map of Francis Lake (DOW 30-0080-00) from 2013 data overlaid on an aerial image of the lake.

13
2.3 Potential Stressors
2.3.1. Watershed disturbance Francis Lake has a relatively large contributing watershed (5,395 acres), with lake acres (264 acres) to contributing watershed acres ratio of about 1:20. It is situated in the North Central Hardwood Forests ecoregion in the Anoka Sand Plain, an outwash plain characterized by thin layers of sand and silt with numerous bogs and depressions. There are several wetland complexes within the contributing watershed ranging in size from 17 – 75 acres plus many smaller wetlands and those associated with flowing waters. An overall GIS quantification of land use types based on the National Land Cover Database 2011 (Homer, et al., 2015) showed 55% of contributing watershed area covered by un-natural land uses (49% cultivated and 6% developed: Figure 2.3-2 and Figure 2.3-3)). Figure 2.3-4 depicts the intensity of development A small portion of the contributing watershed is covered by water or wetlands (14%) and 21% of the land in the contributing watershed was forested in 2011 (Figure 2.3-2 and Figure 2.3-3). The land use has not substantially changed from the NLCD 2001 to the NLCD 2011(Figure 2.3-5 and Figure 2.3-6). A very small area has changed to low intensity development between 2006 and 2011 (Figure 2.3-6).
Figure 2.3-1: Aerial photograph (FSA 2013) of Francis Lake (DOW 30-0080-00) and the contributing watershed.
Figure 2.3-2: Land use (NLCD 2011) in Francis Lake (DOW 30-0080-00) contributing watershed. Legend follows Figure E.S 1.

14
Figure 2.3-3: Francis Lake (DOW 30-0080-00) contributing watershed land cover type for 2001, 2006, and 2011 (Top) and crop type from 2006 to 2015 (Bottom). Graphic utilized from MNDNR Watershed Health Assessment Framework (WHAF) interactive map (MNDNR, 2016).
Figure 2.3-4: Impervious lands (NLCD 2011) in Francis Lake (DOW 30-0080-00) contributing watershed. Darker red indicates a higher percentage of imperviousness, black indicates zero percent impervious.

15
Figure 2.3-5: Change in land use (NLCD 2001 - 2006) in Francis Lake (DOW 30-0080-00) contributing watershed. Black indicates no change, colors follow Figure E.S 1.
Figure 2.3-6 Change in land use (NLCD 2006 - 2011) in Francis Lake (DOW 30-0080-00) contributing watershed. Black indicates no change, colors follow Figure E.S 1.
Francis Lake has a second order stream that enters the lake in the northwest portion of the lake. No other lakes occur upstream along this stream. This stream has a known Northern Pike spawning run, starts in a marsh/drainage ditch, and is ditched for most of its route.
A fixed crest sheet-piling weir was constructed at the lake outlet in 1938 (Figure 2.3-7). Francis Lake is drained by a second order stream based on Strahler stream order. This outlet stream is an unnamed tributary to an unnamed tributary of the Rum River. The headwater-tailwater difference in elevation has varied from between zero and 1.5 feet over the years surveyed. The outlet stream has been ditched and

16
includes 5 road or other crossings and one wetland which could be barriers to fish movement on its 4.75 mile path to the Rum River.
2.3.2. Riparian disturbance Francis Lake is a moderately complex-shaped basin which is 264 acres in size, 100% littoral, and has a maximum depth of 7 feet. The contributing watershed is in very close proximity to the lake shore in some areas around the lake (Figure 2.3-7). There is a high amount of development within 1000 feet of the shoreline and within the contributing watershed (33% developed, 28% cultivated, 22% forest, and 12% wetlands; (Figure 2.3-8) according to the 2011 NLCD dataset. Of the developed land, the vast majority (91%) is open space, which is described as mostly vegetation in the form of lawn grasses and most commonly include large-lot single-family housing units. In 2003, MNDNR Fisheries determined there were 70 homes/cabins present and 49 docked boats. The shoreline development is focused on the eastern and western shores and the lots are fairly evenly spaced. Currently, there are 115 residential lots adjacent to Francis Lake which are not public land. All residencies on or near Francis Lake are served by individual sewage treatment systems, (i.e. septic systems). There are about 7 docks per km of shoreline.
Figure 2.3-7: Aerial photo of the shoreline of Francis Lake (DOW 30-0080-00) and the contributing watershed (highlighted in blue). Note the location of the water level control structure.

17
Figure 2.3-8: Land use within 1000 feet of the shoreline of Francis Lake (DOW 30-0080-00) and still within the contributing watershed (blue line). Colors follow Figure E.S 1.
An assessment of riparian development was conducted in September 2013 following Score the Shore (StS) survey protocols and resulted in a mean score of 71.8 (range is 0 to 100). The StS survey score is comprised of scores for three zones: shoreland, shoreline, and aquatic (Table 2.3-1). About 57% of the StS survey sites are classified as developed which contributed to the low score for Francis Lake as a whole (Table 2.3-2). During the StS survey, 21% of sites had visible woody habitat and 68% had at least some emergent vegetation. The northern shoreline is primarily an expansive emergent wetland, and the southern shore has a road running in very close proximity to it.
Table 2.3-1: Breakdown of how each of the three zones (Shoreland, Shoreline, Aquatic) on Francis Lake scored utilizing the Score the Shore survey and a categorical interpretation (Excellent, good, fair, poor) of that score.
Zone Sample Size Mean Zone Habitat
Score (0-33.3) Rating
Shoreland 28 18.9 Poor
Shoreline 28 26.2 Good
Aquatic 28 26.7 Good

18
Table 2.3-2: Score the Shore survey scores overall as well as for developed and undeveloped sites on Francis Lake and a categorical interpretation (Excellent, good, fair, poor) of that score.
Broad Land Use Classification
Sample Size
Mean Lakeshore Habitat Score (0-100)
Rating
All sites 28 71.8 Fair
Developed 16 56.9 Poor
Undeveloped 12 91.7 Excellent
2.3.3. In-lake habitat disturbance The most recent assessment of fish spawning conditions occurred in 2003 by MNDNR Fisheries staff. They determined there are good spawning conditions for Black Bullhead, Black Crappie, and Bluegill, fair conditions for Largemouth Bass, and poor conditions for Northern Pike and Yellow Perch (MNDNR-Fisheries, 2015). Francis Lake does not have any recent permitted aquatic plant management activity. Historical plant control occurred in 1989 for chemical control of planktonic algae.
2.3.4. Aquatic invasive species Purple loosestrife and curly-leaf pondweed have been surveyed from Francis Lake
2.3.5. Chemistry Francis Lake has been sampled for water quality by MPCA and other partners from 1979 – 2014. Average water quality parameters based on the last ten years of data (2004 – 2013) include: chlorophyll-a level of 109 µg/L, surface dissolved oxygen (depth of 0 – 2 meters) level of 9.47 mg/L with adequate oxygen throughout the water column, total phosphorus level of 106 µg/L, secchi disk reading of 0.9 feet (MPCA, 2013 data, P. Anderson; personal communication). Francis Lake has the lowest transparency trend of all 33 lakes in the Rum River watershed that have transparency data, although it appears to have increased slightly, if not significantly, in clarity in the last 10 years. All of this data results in a TSI value of 79 for Francis Lake; this value classifies the lake as hypereutrophic. The value of total dissolved solids (TDS) has been increasing from 162 parts per million (ppm) in 1983, to 178 ppm in 1993, to 192 ppm in 2003 (MNDNR-Fisheries, 2015). From an MPCA 2007 assessment, the lake is impaired for nutrients according to an assessment of aquatic recreation beneficial use.
2.4 Conclusion Biological data indicate the fish community of Francis Lake is impaired by human disturbance. This listing agrees with the aquatic recreation assessment of not supporting due to nutrient eutrophication. Several potential stressors identified in this report appear to be responsible for the impairment to aquatic life use.
The hydrology is altered because the lake level is maintained at a higher than natural level and likely affects the fish community.
The riparian area has also been altered by human activities and the scale of this disturbance is significant enough to have effects on the fish community. MNDNR Fisheries has identified a noticeable change in fish community occurring at a dock density of approximately 10 docks per kilometer or greater (MNDNR; Donna Dustin and Jacquelyn Bacigalupi; personal communication). The abundance of individual septic systems within 1000 feet of the shoreline may be influencing the nutrient loading into the lake but was not investigated in this report. Francis Lake scores “good” for the shoreline and aquatic zones of the Score the Shore survey, but “poor” for the shoreland zone and averaged a “poor” score for the

19
developed sites indicating that improvements could be made in shoreland management practices. Local, county and state shoreland ordinances should be reviewed with a focus on improving water quality and nearshore habitat.
The water quality is not meeting aquatic recreation standards, the contributing watershed is relatively large and only 45% of the land cover in the contributing watershed is natural. Modeling in Minnesota lakes suggests that total phosphorus concentrations increase significantly over natural concentrations when land use disturbances occur in greater than approximately 40% of the watershed area and this relationship tends to be stronger in shallow lakes (Cross & Jacobson, 2013). Additional phosphorus is associated with reductions in water clarity, oxygen levels, and submersed vegetation as well as increases in algae and abundance of tolerant fish species such as Common Carp and Black Bullhead (MNDNR-Fisheries, 2013). Common Carp are known to suspend bottom sediments and associated nutrients as they forage (Chumchal & Drenner, 2004; Matsuzaki, Usio, Takamura, & Washitani, 2007). The recent increasing trend in total dissolved solids could be driven by the feeding activity of Common Carp.
The poor water quality and high disturbance (greater than 40%) within the watershed, when combined with the FIBI score which was below the impairment threshold, would indicate that there is not one key cause of the reduced fish community, but rather a synergistic effect due to poor water quality, and lack of quality in-lake and nearshore habitat. Furthermore, the FIBI score was low primarily due to the low numbers of insectivorous species (N = 5), small benthic dwelling species (N = 0), and vegetative dwelling species (N = 2), low proportion of vegetative dwelling species (0%) in the nearshore catch, and low proportion of biomass of insectivorous species (3.3%) in the trap net catch. This suggests a lack of quality vegetative in-lake and nearshore habitat.
3. Blue Lake, 30-0107-00, Isanti County
3.1 Impairment An assessment conducted in 2013 determined Blue Lake was vulnerable to impairment for Aquatic Life use based on the FIBI. The FIBI Tool-5 was used to calculate a score using fish data collected in 2013. The FIBI score of 14 is below the impairment threshold (24) but within the 90% confidence interval (9 - 39). The MNDNR has classified Minnesota's lakes into 43 different classes based on physical, chemical and other characteristics. Basin characteristics place Blue Lake in lake class 34, which is scored with FIBI Tool 5. These lakes are characterized as shallow to moderate depths with a high littoral area, low species richness, high lake fertility, and dense aquatic vegetation in central and northern Minnesota.
3.2 Biology
3.2.1. Fish community The FIBI metrics for Blue Lake generally scored poorly for all metrics except for the number of intolerant species sampled. Three intolerant species were sampled in Blue Lake although in very low proportions: Banded Killifish (0.1% of nearshore individuals; N = 2), Blackchin Shiner (0.1% of nearshore individuals; N = 2) and Iowa Darter (0.3% of nearshore individuals; N = 7). Three tolerant species were captured: Black Bullhead, Green Sunfish, and Common Carp. These tolerant species, while present, were not the dominant species in any of the gears (Black Bullhead comprised 0.2% of gill net biomass and 1.3% of trap net biomass; Green Sunfish accounted for 1.8% of nearshore individuals; and Common Carp constituted 17.1% of trap net biomass). The two most abundant species, by biomass, in the trap nets were Yellow Bullhead (24%) and Common Carp (17%). Northern Pike (30%) and Walleye (32%) are top carnivores and

20
account for 62% of biomass from gill nets. The predator fish community on Blue Lake is characterized by abundant Northern Pike and Walleye (Walleye are stocked every year as fingerlings since 2009).Yellow Bullhead (14%) and White Sucker (11%) were the next most common species sampled in the gill nets. Nearshore sampling was dominated by Bluegill (45% of nearshore individuals), Largemouth Bass (13% of nearshore individuals), and Yellow Perch (13% of nearshore individuals). Other species sampled in 2013 include: Black Crappie, Bluntnose Minnow, Bowfin, Brown Bullhead, Golden Shiner, Hybrid Sunfish, Johnny Darter, Pumpkinseed, and Tadpole Madtom.
There are several historic surveys in which other species of fish were recorded, although no vouchers were taken, so it is not possible to confirm changes in species assemblage. A survey conducted in 1946 identified six generally under-sampled species: Common Shiner, Spottail Shiner, Spotfin Shiner, Bluntnose Minnow, Golden Shiner, and Johnny Darter. Of these six, only three were sampled in the 2013 survey. Common Shiner and Spotfin Shiner have not been recently identified from Blue Lake, but spottail shiners are collected sporadically in low numbers. A natural reproduction survey in 1994 found Banded Killifish, Black Crappie, Bluegill, Blacknose Shiner, Largemouth Bass, and Yellow Perch. Blacknose shiners were not collected during the FIBI sampling conducted nearly 20 years later (2013). A 1999 survey captured logperch which were not sampled in 2013 (MNDNR-Fisheries, 2015).
Fisheries management activities have consisted of stocking of Largemouth Bass, Sunfish, Black Crappies, and Walleye from 1928-1944. There has been no stocking of centrarchids since the early 1950’s. Since then, Northern Pike stocking ceased in 1992, and Walleye have been stocked 18 of the last 25 years and since 2009 have been stocked every year as fingerlings. MNDNR Fisheries staff attempted to remove carp utilizing winter seining, but those efforts proved unsuccessful and were discontinued in 1971. In the most recent lake management plan (1995), the lake is being managed as a Walleye and Largemouth Bass fishery with Northern Pike, Bluegill, and Black Crappie as secondary species for management (MNDNR-Fisheries, 2015).
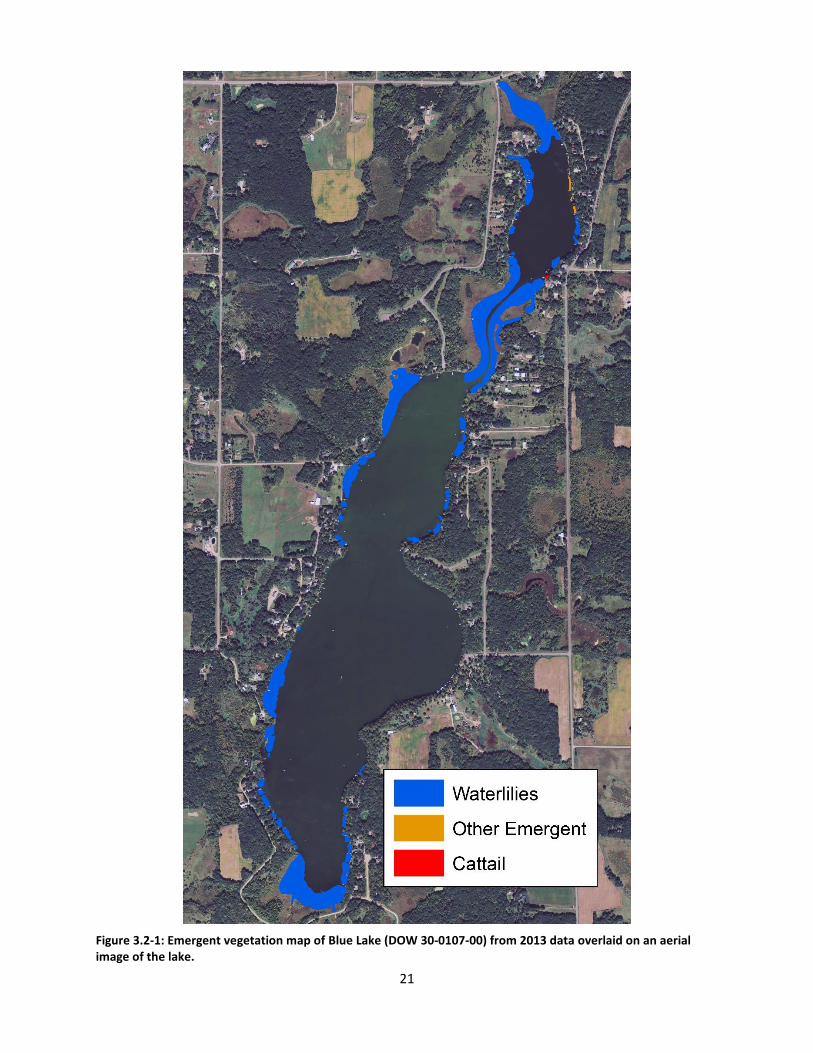
3.2.2. Plant community A tool to evaluate aquatic life use standards in lakes based on aquatic plant community data is currently being developed but was not finalized at the time of this assessment. Lake plant surveys were completed by MNDNR in 2004 and 2013. Submersed plants accounted for 9 of the 15 total aquatic plant species sampled in 2004, and the floristic quality index (FQI) was 20.9. In 2013, 22 aquatic plant species were identified; 10 were submersed aquatic plants, 5 were free-floating, 2 were floating-leaf, and 5 were emergent species. The plant community scores are above the impairment thresholds for plant community health identified for similar lakes in the ecoregion (Radomski & Perleberg, 2012). Note that the Radomski and Perleberg plant community indices were designed to respond to nutrient impairment and resulting loss in water clarity. Work to develop tools to describe impairments to the nearshore fringe plant community (emergent and/or floating-leaf) is ongoing. Bulrush was noted as present in the 1946 and 1973 surveys, but has not been noted in any surveys since 1973.
The emergent and floating-leaf plants were mapped in 2013 (Figure 3.3-1). This effort mapped 37.87 acres of emergent or floating-leaved vegetation. Waterlilies (37.76 acres) were the dominant classification of plant beds, while other classifications present included Cattail (2.04 acres) and Other Emergent beds (0.09 acres).
21
Figure 3.2-1: Emergent vegetation map of Blue Lake (DOW 30-0107-00) from 2013 data overlaid on an aerial image of the lake.
22
3.3 Potential Stressors
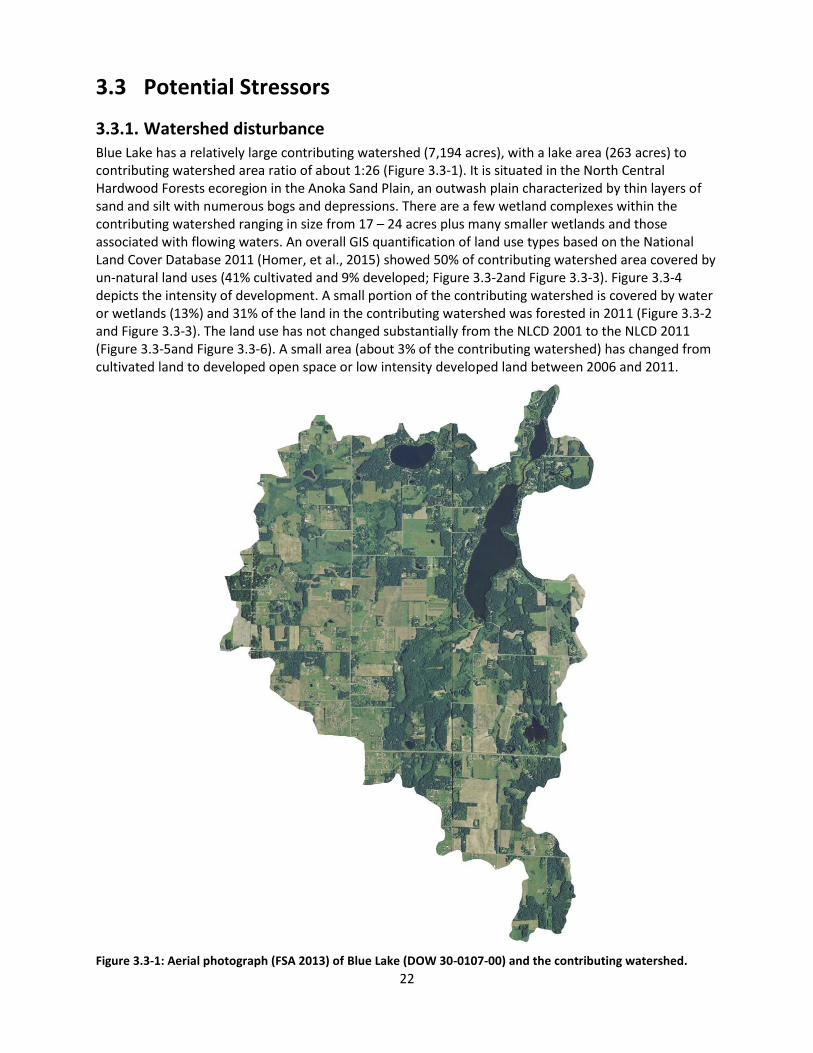
3.3.1. Watershed disturbance Blue Lake has a relatively large contributing watershed (7,194 acres), with a lake area (263 acres) to contributing watershed area ratio of about 1:26 (Figure 3.3-1). It is situated in the North Central Hardwood Forests ecoregion in the Anoka Sand Plain, an outwash plain characterized by thin layers of sand and silt with numerous bogs and depressions. There are a few wetland complexes within the contributing watershed ranging in size from 17 – 24 acres plus many smaller wetlands and those associated with flowing waters. An overall GIS quantification of land use types based on the National Land Cover Database 2011 (Homer, et al., 2015) showed 50% of contributing watershed area covered by un-natural land uses (41% cultivated and 9% developed; Figure 3.3-2and Figure 3.3-3). Figure 3.3-4 depicts the intensity of development. A small portion of the contributing watershed is covered by water or wetlands (13%) and 31% of the land in the contributing watershed was forested in 2011 (Figure 3.3-2 and Figure 3.3-3). The land use has not changed substantially from the NLCD 2001 to the NLCD 2011 (Figure 3.3-5and Figure 3.3-6). A small area (about 3% of the contributing watershed) has changed from cultivated land to developed open space or low intensity developed land between 2006 and 2011.
Figure 3.3-1: Aerial photograph (FSA 2013) of Blue Lake (DOW 30-0107-00) and the contributing watershed.

23
Figure 3.3-2: Land use (NLCD 2011) in Blue Lake (DOW 30-0107-00) contributing watershed. Legend follows Figure E.S 1.
Figure 3.3-3: Blue Lake (DOW 30-0107-00) contributing watershed land cover type for 2001, 2006, and 2011 (Top) and crop type from 2006 to 2015 (Bottom). Graphic utilized from MNDNR Watershed Health Assessment Framework (WHAF) interactive map (MNDNR, 2016).

24
Figure 3.3-4: Impervious lands (NLCD 2011) in Blue Lake (DOW 30-0107-00) contributing watershed. Darker red indicates a higher percentage of imperviousness, black indicates zero percent impervious.
Figure 3.3-5: Change in land use (NLCD 2001 - 2006) in Blue Lake (DOW 30-0107-00) contributing watershed. Black indicates no change, colors follow Figure E.S 1.

25
Figure 3.3-6: Change in land use (NLCD 2006 - 2011) in Blue Lake (DOW 30-0107-00) contributing watershed. Black indicates no change, colors follow Figure E.S 1.
Many first order streams flow into Blue Lake. No other lakes occur upstream on any of these streams. A fixed crest weir with a fish screen was constructed at the lake outlet in 1953 (Figure 3.3-7) and is located on an unnamed first order stream, Strahler stream order, which after flowing through a couple downstream lakes becomes Spencer Brook. The headwater-tailwater difference in elevation has varied from between zero and 0.7 feet over the years surveyed. The fish screen was removed in 1981 due to being ineffective at preventing fishes from entering the lake. This stream has 4 road crossings and two lakes which could be barriers to fish movement on its approximately 6.0 mile path to the Rum River.
3.3.2. Riparian disturbance Blue Lake consists of two main basins connected by a channel. The southern basin is larger and deeper whereas the north basin has a maximum depth of about 10 feet. The entire lake is 263 acres in size with 134 littoral acres, resulting in 51% of the lake surface being littoral area and has a maximum depth of 31 feet. The contributing watershed is in very close proximity to the lake shore in some areas around the lake (Figure 3.3-7). There is a high amount of development within 1000 feet of the shoreline and within the contributing watershed according to the shoreline cabin count, but many of these lots have tree cover canopy, which affects the developed land assessment utilizing the 2011 NLCD dataset (9% developed, 20% cultivated, 43% forest, and 11% wetlands; Figure 3.3-8). Of the developed land, the vast majority (98%) is open space, which is described as mostly vegetation in the form of lawn grasses and most commonly include large-lot single-family housing units. In 2004, MNDNR Fisheries determined there were 151 homes/cabins present on Blue Lake. Currently, there are 194 residential lots adjacent to Blue Lake which are not public land and one RV resort (MNDNR-Fisheries, 2015). All residences on or near Blue Lake are served by individual sewage treatment systems, (i.e. septic systems). There are an additional 185 unsewered lots around Sandy Lake (DOW 71-0040-00) which eventually drains into Blue Lake. There are about 17 docks per km of shoreline around Blue Lake.

26
Figure 3.3-7: Aerial photo of the shoreline of Blue Lake (DOW 30-0107-00) and the contributing watershed (highlighted in blue). Note the water level control structure location on the north end of the lake.

27
Figure 3.3-8: Land use within 1000 feet of the shoreline of Blue Lake (DOW 30-0107-00) and still within the contributing watershed (blue line). Colors follow Figure E.S 1.
An assessment of riparian development was conducted in June 2013 following Score the Shore (StS) survey protocols and resulted in a mean score of 60.5 (range is 0 to 100). The StS survey score is comprised of scores for three zones: shoreland, shoreline, and aquatic (Table 3.3-1). About 88% of the StS survey sites are classified as developed which contributed to the low score for Blue Lake as a whole (Table 3.3-2). During the StS survey, 42% of sites had visible woody habitat and 51% had at least some emergent vegetation. Most of the undeveloped shoreline is associated with expanses of emergent and floating leaved aquatic vegetation and other wetlands.

28
Table 3.3-1: Breakdown of how each of the three zones (Shoreland, Shoreline, Aquatic) on Blue Lake scored utilizing the Score the Shore survey and a categorical interpretation (Excellent, good, fair, poor) of that score.
Zone Sample Size Mean Zone Habitat
Score (0-33.3) Rating
Shoreland 43 16.4 Poor
Shoreline 43 18.9 Poor
Aquatic 43 25.1 Good
Table 3.3-2: Score the Shore survey scores overall as well as for developed and undeveloped sites on Blue Lake and a categorical interpretation (Excellent, good, fair, poor) of that score.
Broad Land Use Classification
Sample Size
Mean Lakeshore Habitat Score (0-100)
Rating
All sites 43 60.5 Poor
Developed 38 55.6 Poor
Undeveloped 5 97.3 Excellent
3.3.3. In-lake habitat disturbance The most recent assessment of fish spawning conditions occurred in 2004 by MNDNR Fisheries staff. They determined there are good spawning conditions for Black Crappie, Bluegill, and Largemouth Bass, fair conditions for Northern Pike, and poor conditions for Walleye (MNDNR-Fisheries, 2015).
Blue Lake has historical and recent permitted aquatic plant management activity. In 2014, permits were issued for approximately 19 acres of removal of aquatic vegetation (16 acres for chemical control of curly-leaf pondweed; 3 acres for chemical control of submersed species adjacent to riparian property shoreline; and about 0.25 acres for harvesting aquatic macrophytes).
3.3.4. Aquatic invasive species Blue Lake has purple loosestrife (first identified in 1987) and curly-leaf pondweed (first noted in 1973 survey).
3.3.5. Chemistry Blue Lake has been sampled for water quality by MPCA and other partners from 1981 – 2014. Average water quality parameters based on the last ten years of data (2004 – 2013) include: chlorophyll-a level of 27 µg/L, surface dissolved oxygen (depth of 0 – 2 meters) level of 9.04 mg/L and an oxycline typically sets on this lake such that there is minimal oxygen below a certain depth based on many factors, total phosphorus level of 21 µg/L, secchi disk reading of 5.51 feet (MPCA, 2013 data, P. Anderson; personal communication). All of this data results in a TSI value of 54 for Blue Lake; this value classifies the lake as eutrophic. Modelling has been conducted on 2,765 Minnesota lakes to identify lakes of phosphorus sensitivity significance and Blue Lake was classified in the higher priority group, or within the 50th - 75th percentile of lakes assessed (MNDNR, MPCA, & MBWSR, 2015). From MPCA assessments in 2009 and 2013, the lake was not assessed for aquatic recreation due to insufficient information.

29
3.4 Conclusion Biological data indicate the fish community of Blue Lake is vulnerable to further stresses induced by human disturbance. Several potential stressors identified in this report appear to be responsible for the status of the aquatic life use assessment as vulnerable to further stresses.
The hydrology is altered because the lake level is maintained at a higher than natural level and possibly affects the fish community.
The riparian area has also been altered by human activities and the scale of this disturbance is significant enough to have effects on the fish community. One of two estimators of shoreland disturbance, the number of docks per kilometer of shoreline is at a level where changes in the fish community occur. MNDNR Fisheries has identified a noticeable change in fish community occurring at a dock density of 10 docks per kilometer or greater (MNDNR; Donna Dustin and Jacquelyn Bacigalupi; personal communication). The abundance of individual septic systems within 1000 feet of the shoreline is possibly influencing the nutrient loading into the lake but was not examined in this report. Blue Lake scores “good” for the aquatic zone of the Score the Shore survey, but “poor” for shoreland and shoreline zones indicating that improvements could be made in shoreland management practices. Local, county and state shoreland ordinances should be reviewed with a focus on improving water quality and nearshore habitat.
The contributing watershed is relatively large and 50% of the land cover in the contributing watershed is natural. Modeling in Minnesota lakes suggests that total phosphorus concentrations increase significantly over natural concentrations when land use disturbances occur in greater than approximately 40% of the watershed area and this relationship tends to be stronger in shallow lakes (Cross & Jacobson, 2013). Additional phosphorus is associated with reductions in water clarity, oxygen levels, and submersed vegetation as well as increases in algae and abundance of tolerant fish species such as Common Carp and Black Bullhead (MNDNR-Fisheries, 2013). Common Carp are known to suspend bottom sediments and associated nutrients as they forage (Chumchal & Drenner, 2004; Matsuzaki, Usio, Takamura, & Washitani, 2007).
The poor water quality and high disturbance (greater than 40%) within the watershed, when combined with the FIBI score which was below the impairment threshold, would indicate that there is not one key cause of the reduced fish community, but rather a synergistic effect due to poor water quality, and lack of quality in-lake and nearshore habitat. Furthermore, the FIBI score was low due to the low scores of the trap net-, nearshore-, and gill net-specific metrics; high numbers of tolerant species (N = 3) and omnivorous species captured (N = 6), the low proportions of intolerant species (0.5%) in the nearshore catch, low proportion of biomass of insectivorous species (18%), omnivorous species (44%), and tolerant species (18%) in the trap net catch, and low proportion of biomass of top carnivores in the gill net catch (67%). This suggests a lack of quality vegetative in-lake and nearshore habitat, and depressed water quality.
4. Green Lake, 30-0136-00, Isanti County
4.1 Impairment Green Lake was assessed as impaired for not meeting fish community expectations based on data from a 2012 nearshore survey and trap net and gill net data also from a 2012 survey. The MNDNR has classified Minnesota's lakes into 43 different classes based on physical, chemical and other characteristics. Basin characteristics place Green Lake in lake class 27, which is scored with FIBI Tool 2. These lakes are characterized as deep lakes with complex shorelines with less than 80% littoral and high

30
species richness. The FIBI score of 22 is well below the impairment threshold (45) and the 90% confidence interval (36 - 54). A survey conducted in 2007 resulted in a FIBI score of 17.
4.2 Biology
4.2.1. Fish community In 2012, Green Lake had a moderate-diversity fish community compared to similar lakes in the watershed with 11 insectivorous species and 5 vegetative-dwelling species sampled. One intolerant species was sampled although in very low proportions: Iowa Darter (0.9% of nearshore individuals; N = 43). Four tolerant species were captured. Black Bullhead, Green Sunfish, and Fathead Minnow, while present, were sampled in low abundance (Black Bullhead comprised 1.1% of gill net biomass and less than 0.1% of nearshore individuals; Green Sunfish accounted for less than 0.1% of nearshore individuals; Fathead Minnows also constituted less than 0.1% of nearshore individuals); however, Common Carp were a significant portion of the trap net biomass (22.9%) but of rather insignificant abundance in the nearshore sampling (0.22%; N = 7). The dominant species, by biomass, in the trap nets was Bowfin (47%). Two top carnivores (Walleye, 38%; Northern Pike, 30%) account for 68% off the gill net biomass. Black Crappie (9%) was the next most common species sampled in the gill nets. The low proportion of centrarchids in the trap net catch (8% by biomass) likely reflects poor vegetated nearshore habitat. The nearshore sampling was dominated by sunfish species (64% of nearshore individuals), Yellow Perch (12% of nearshore individuals), and Bluegill (9% of nearshore individuals). The predator fish community on Green Lake is characterized by abundant Northern Pike and Walleye (Walleye are stocked every year as fingerlings since 2009). The trap nets in 2012 were comprised of almost 30% by biomass of omnivores, and 23% of trap net biomass is from tolerant omnivores. Other species sampled in 2012 include: Bluntnose Minnow, Brown Bullhead, Central Mudminnow, Common Shiner, Golden Shiner, Hybrid Sunfish, Johnny Darter, Largemouth Bass, Pumpkinseed, Spottail Shiner, Tadpole Madtom, White Sucker, and Yellow Bullhead. Green lake performs below average on 11 of the 15 FIBI metrics; metric scores are above average for the number of cyprinid species, number of small benthic dwelling species, and the proportion of top carnivores in the gill nets. The generally unbalanced fish community likely reflects poor water quality and a lack of complex nearshore habitat.
There are several historic surveys in which other species of fish were recorded. Only a portion of the species were vouchered, so it is not possible to confirm all of the changes in species assemblage. Past surveys completed by MNDNR fisheries personnel have sampled several species (Banded Killifish, Bigmouth Shiner, Blacknose Shiner, Hornyhead Chub, Redhorse, Spotfin Shiner in 1941; Spotfin Shiner, Creek Chub, and Rock Bass in 1949; Silver Redhorse, Creek Chub, Blacknose Shiner, Brassy Minnow, and Rock Bass in 1957; Greater Redhorse in 2007) which were not sampled during this 2012 assessment survey. Hornyhead Chub and Spotfin Shiner have voucher specimens from Green Lake. Banded Killifish and Blacknose Shiners are both vegetative dwelling species that are intolerant to increased levels of total phosphorus and increased Trophic State Index of the lake. Banded Killifish and Blacknose Shiner have a vouchered record (1941) although neither of these species has been identified from Green Lake in over 70 and 50 years, respectively. Rock bass is a top carnivore that is intolerant of increases in Trophic State Index as well and it also has not been identified from the lake in over 50 years but there are not any vouchered specimens. Summer fish kills have been noted from Green Lake (MNDNR-Fisheries, 2015).
Fisheries management activities have consisted of stocking Largemouth Bass, Crappies, Northern Pike, Sunfish, and Walleye from 1919 to present day. MNDNR Fisheries has been stocking Walleye fingerlings every other year since 1993. A wood panel rough fish removal trap was constructed sometime in the early 1950’s at the outlet and was modified to be a sheet pile trap in 1971. Rough fish removal has been occurring since at least 1947 and primarily focused on carp. The lake was managed primarily as a
31
Walleye – Northern Pike fishery with Black Crappie, Bluegill, and Largemouth Bass as secondary species (1985, 1993), but recently (2007) the Largemouth Bass has been elevated to a primary management species (MNDNR-Fisheries, 2015).
4.2.2. Plant community A tool to evaluate aquatic life use standards in lakes based on aquatic plant community data is currently being developed but was not finalized at the time of this assessment. Several biological surveys have been conducted on this lake indicating that the lake likely has low to moderate aquatic plant richness. The most recent survey (2012) had a species richness of 12 taxa (at threshold), and the floristic quality index (FQI; 17.61 – below threshold) indicated that the aquatic plant community was just below the impairment threshold identified for similar lakes in the ecoregion (percent difference from threshold was 0.09; Radomski and Perleberg, 2012). An earlier survey (2005) recorded a species richness of 13 (above threshold) and an FQI (18.58 – below threshold) again just below threshold (percent difference from threshold was 5.33). Note that the Radomski and Perleberg plant community indices were designed to respond to nutrient impairment and resulting loss in water clarity. Work to develop tools to describe impairments to the nearshore fringe plant community (emergent and/or floating-leaf) is ongoing.
MNDNR Fisheries personnel have recorded a decrease in the maximum depth of plant growth. In 1971 submersed plants were growing at a maximum depth of 15 feet. In 1982, the maximum depth of submersed plant growth had decreased to 13 feet. It decreased again to 10 feet in the 1992 lake survey report. Furthermore, the 1957 report noted the presence of bulrush, and subsequent reports have no mention of bulrush (MNDNR-Fisheries, 2015).
MNDNR Ecological and Water Resources found no stands of emergent vegetation within the shores of Green Lake in 2013. Fisheries personnel have conducted a number of lake surveys that have an aquatic vegetation component. The vegetation survey performed by fisheries personnel is not necessarily exhaustive. A 1957 lake survey report identified cattail, white water lily, bulrush, arrowhead, and yellow water lily as being present in the lake (MNDNR-Fisheries, 2015). The lake report from 1971 identified arrowhead as being present at the outlet and cane and common cattail as rare on the southwest shore and the point on the northeast shore (MNDNR-Fisheries, 2015). A lake survey completed in 1982 identified white water lily, cattail, arrowhead, and cane on the south and west side of the lake to a depth of four feet (MNDNR-Fisheries, 2015). The 1992 lake survey report identified sedge and smartweed as common although scattered along the undeveloped areas of shoreline (MNDNR-Fisheries, 2015). In the 2002 survey, sedges, reed canary grass, and cattail were identified as being rare in the lake (MNDNR-Fisheries, 2015).
4.3 Potential Stressors
4.3.1. Watershed disturbance Green Lake has a large contributing watershed (15,874 acres), with a lake acre (833 acres) to contributing watershed acres ratio of about 1:19 (this is near the median value for assessed lakes in the Rum River watershed; Figure 4.3-1). It is situated in the North Central Hardwood Forests ecoregion in the Anoka Sand Plain, an outwash plain characterized by thin layers of sand and silt with numerous bogs and depressions. There are numerous wetland complexes within the contributing watershed ranging in size from 10 – 45 acres plus many smaller wetlands and those associated with flowing waters. An overall GIS quantification of land use types based on the National Land Cover Database 2011 (Homer, et al., 2015) showed 59% of contributing watershed area covered by un-natural land uses (54% cultivated and 5% developed; Figure 4.3-2 and Figure 4.3-3). Figure 4.3-4 depicts the intensity of development. A small

32
portion of the contributing watershed is covered by water or wetlands (14%) and 24% of the land in the contributing watershed was forested in 2011 (Figure 4.3-2 and Figure 4.3-3). The land use has not changed substantially from the NLCD 2001 to the NLCD 2011 (Figure 4.3-5 and Figure 4.3-6). A small area (about 3% of the contributing watershed) has changed from cultivated land to developed land between 2006 and 2011.
Figure 4.3-1: Aerial photograph (FSA 2013) of Green Lake (DOW 30-0136-00) and the contributing watershed.

33
Figure 4.3-2: Land use (NLCD 2011) in Green Lake (DOW 30-0136-00) contributing watershed. Legend follows Figure E.S 1.

34
Figure 4.3-3: Green Lake (DOW 30-0136-00) contributing watershed land cover type for 2001, 2006, and 2011 (Top) and crop type from 2006 to 2015 (Bottom). Graphic utilized from MNDNR Watershed Health Assessment Framework (WHAF) interactive map (MNDNR, 2016).
Figure 4.3-4: Impervious lands (NLCD 2011) in Green Lake (DOW 30-0136-00) contributing watershed. Darker red indicates a higher percentage of imperviousness, black indicates zero percent impervious.
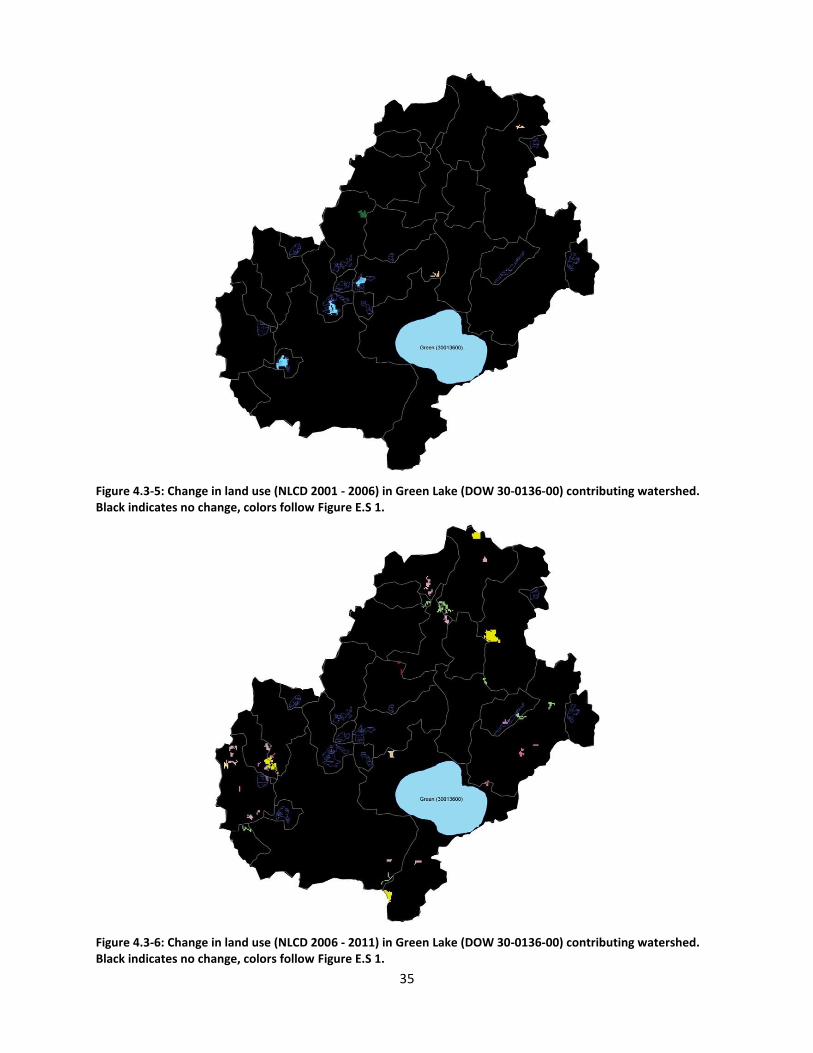
35
Figure 4.3-5: Change in land use (NLCD 2001 - 2006) in Green Lake (DOW 30-0136-00) contributing watershed. Black indicates no change, colors follow Figure E.S 1.
Figure 4.3-6: Change in land use (NLCD 2006 - 2011) in Green Lake (DOW 30-0136-00) contributing watershed. Black indicates no change, colors follow Figure E.S 1.

36
Green Lake has two second order streams flowing into it. No other lakes occur along these streams before they enter Green Lake. A type “C” water level control structure was constructed in 1934 at the lake outlet located on Green Lake Brook, a third order stream, Strahler stream order (Figure 4.3-7). The water level control structure was converted to a box culvert with a one foot lip set to the prior crest elevation in 2003. A number of MNDNR fisheries surveys have indicated that the Rum River has a dramatic influence on the lake, especially during years of heavy spring floods when the flow of Green Lake Brook is reversed to where it is flowing into Green Lake, indicating that this water level control structure /culvert is probably not limiting connectivity of Green Lake to the Rum River. To further this point, a water level control structure inspection in May of 2008 indicated the pool level to be about 1 foot above the crest of the culvert lip – thus, it was not acting as a barrier to fish movement. This stream has 3 road crossings which could be barriers to fish movement on its approximately 2.8 mile path to the Rum River.
4.3.2. Riparian disturbance Green Lake is 833 acres in size with 357 littoral acres, resulting in 43% of the lake surface being littoral area and has a maximum depth of 28 feet. The contributing watershed is in very close proximity to the lake shore in some areas around the lake (Figure 4.3-7). There is a high amount of development within 1000 feet of the shoreline and within the contributing watershed according to the shoreline cabin count, but many of these lots have tree cover canopy, which affects the developed land assessment utilizing the 2011 NLCD dataset (13% developed, 14% cultivated, 51% forest, and 11% wetlands; Figure 3.3-8) Of the developed land, the vast majority (94%) is open space, which is described as mostly vegetation in the form of lawn grasses and most commonly include large-lot single-family housing units. In 2002, MNDNR Fisheries classified the shoreline as approximately 10% forest or woodland, 5% grassland, 5% marshland, and 80% residential with many lots being wooded, with 162 homes/cabins present and 264 resident boats (MNDNR-Fisheries, 2015). The shoreline is 4.6 miles long and development is evident on all but one short 0.22 mile stretch along the point on the southern shore. Currently, there are 198 residential lots adjacent to Green Lake which are not public land and an additional 54 lots within 1000 feet of the shore and within the contributing watershed which have houses or cabins on them. All residencies on or near Green Lake are served by individual sewage treatment systems, (i.e. septic systems). The greatest concentration of residential development in the contributing watershed is on the shores of Green Lake. There are about 20 docks per km of shoreline (Beck, Vondracek, Hatch, & Vinje, 2013).
An assessment of riparian development was conducted in June 2013 following Score the Shore (StS) survey protocols and resulted in a mean score of 55.7 (range is 0 to 100). The StS survey score is comprised of scores for three zones: shoreland, shoreline, and aquatic (Table 4.3-1). About 89% of the StS survey sites are classified as developed which contributed to the low score for Green Lake as a whole (Table 4.3-2). During the StS survey, 32% of sites had woody habitat but there was not any emergent vegetation. Most of the undeveloped shoreline is associated with a single large parcel of land held by one owner.
Table 4.3-1: Breakdown of how each of the three zones (Shoreland, Shoreline, Aquatic) on Green Lake scored utilizing the Score the Shore survey and a categorical interpretation (Excellent, good, fair, poor) of that score.
Zone Sample Size Mean Zone Habitat
Score (0-33.3) Rating
Shoreland 37 16.2 Poor
Shoreline 37 14.4 Poor
Aquatic 37 25.1 Good
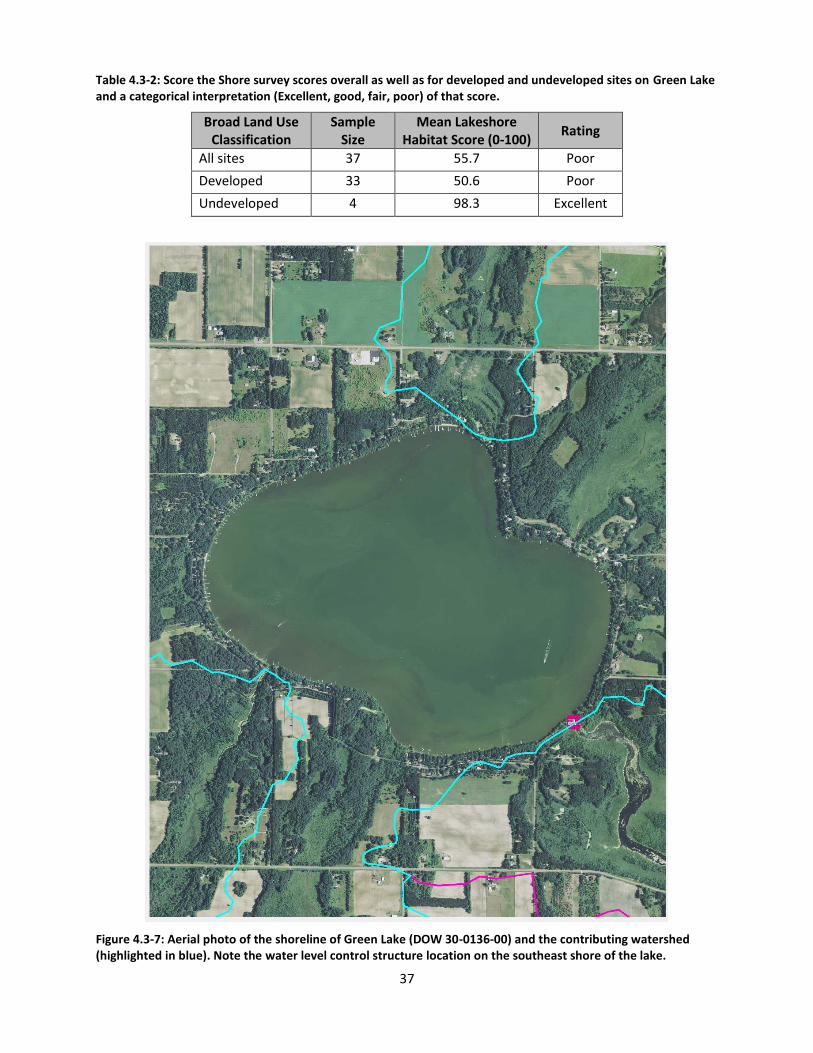
37
Table 4.3-2: Score the Shore survey scores overall as well as for developed and undeveloped sites on Green Lake and a categorical interpretation (Excellent, good, fair, poor) of that score.
Broad Land Use Classification
Sample Size
Mean Lakeshore Habitat Score (0-100)
Rating
All sites 37 55.7 Poor
Developed 33 50.6 Poor
Undeveloped 4 98.3 Excellent
Figure 4.3-7: Aerial photo of the shoreline of Green Lake (DOW 30-0136-00) and the contributing watershed (highlighted in blue). Note the water level control structure location on the southeast shore of the lake.

38
Figure 4.3-8: Land use within 1000 feet of the shoreline of Green Lake (DOW 30-0136-00) and still within the contributing watershed (blue line). Colors follow Figure E.S 1.

39
4.3.3. In-lake habitat disturbance The most recent assessment of fish spawning conditions occurred in 2002 by MNDNR Fisheries staff. They determined there are good spawning conditions for Largemouth Bass, Northern Pike, and panfish, and poor conditions for Walleye (MNDNR-Fisheries, 2015).
Green Lake has historical and recent permitted aquatic plant management activity. In 2014, permits were issued for approximately 51 acres of aquatic plant removal (49 acres for chemical control of curly-leaf pondweed; 2 acres for chemical control of submersed species adjacent to riparian property shorelines). The 1971 Lake Survey Report briefly discusses copper sulfate being “applied to the lake for weed control most years from 1960 through 1971”.
4.3.4. Aquatic invasive species Green Lake is a designated infested water. Eurasian watermilfoil was first confirmed in the lake in 2000. It also has curly-leaf pondweed (first noted in 1971 survey). Both of these plants have been sampled throughout the littoral area of the lake.
4.3.5. Chemistry Green Lake has been sampled for water quality by MPCA and other partners sporadically from 1973 – 2012. Average water quality parameters based on the last ten years of data (2004 – 2013) include: chlorophyll-a level of 30 µg/L, total phosphorus level of 52 µg/L, and a secchi disk reading of 5.5 feet (MPCA, 2013 data, P. Anderson; personal communication). All of this data results in a TSI value of 59 for Green Lake; this value classifies the lake as eutrophic. From an MPCA 2007 assessment, the lake was assessed as not meeting standards for aquatic recreation due to nutrient eutrophication and was described as a “Potential Sewage Related Lake Impairment” in a 2008 Minnesota Pollution Control Agency Small Community Wastewater needs in Minnesota report. From MNDNR Fisheries surveys, Green Lake is often referred to as a hard water lake with an average alkalinity of 122 mg/l (MNDNR-Fisheries, 2015).
4.4 Conclusion Biological data indicate the fish community of Green Lake is impaired by human disturbance. Several potential stressors identified in this report appear to be responsible for the impairment to aquatic life use.
The hydrology is altered because the lake level is maintained at a higher than natural level and likely affects the fish community through reduced/altered vegetation stands due to a lack of the natural range of lake elevations. The connectivity and likelihood of upstream migration of fishes with higher swimming potential from the Rum River to Green Lake seems high when the Rum River is flooded in the area, but information on smaller nongame fish swimming potential and barriers to their movement is limited.
The riparian area has also been altered by human activities and the scale of this disturbance is significant enough to have effects on the fish community. One of two estimators of shoreland disturbance, the number of docks per kilometer of shoreline is at a level where changes in the fish community occur. MNDNR Fisheries has identified a noticeable change in fish community occurring at a dock density of 10 docks per kilometer or greater (MNDNR; Donna Dustin and Jacquelyn Bacigalupi; personal communication). The abundance of individual septic systems within 1000 feet of the shoreline is likely to be influencing the nutrient loading into the lake. Green Lake scores “good” for the aquatic zone of the Score the Shore survey, but “poor” for shoreland and shoreline zones indicating that improvements could be made in shoreland management practices. Local, county and state shoreland ordinances should be reviewed with a focus on improving water quality and nearshore habitat.

40
The contributing watershed is relatively large and 59% of the land use in the contributing watershed is classified as disturbed. Modeling in Minnesota lakes suggests that total phosphorus concentrations increase significantly over natural concentrations when land use disturbances occur in greater than around 40% of the watershed area and this relationship tends to be stronger in shallow lakes (Cross & Jacobson, 2013). Additional phosphorus is associated with reductions in water clarity, oxygen levels, and submersed vegetation as well as increases in algae and abundance of tolerant fish species such as Common Carp and Black Bullhead (MNDNR-Fisheries, 2013). Common Carp are known to suspend bottom sediments and associated nutrients as they forage ( (Chumchal & Drenner, 2004; Matsuzaki, Usio, Takamura, & Washitani, 2007).
The poor water quality and high disturbance (greater than 40%) within the watershed, when combined with the FIBI score which was below the impairment threshold, would indicate that there is not one key cause of the reduced fish community, but rather a synergistic effect due to poor water quality, and lack of quality in-lake and nearshore habitat. Furthermore, the FIBI score was low due to the low scores of the trap net-, nearshore-, and gill net-specific metrics; low numbers of native species (N = 22), intolerant species (N = 1), insectivorous species (N = 11), and vegetative-dwelling species captured (N = 5), high numbers of tolerant species (N = 4) and omnivorous species captured (N = 7), the low proportions of intolerant (1%) and small benthic dwellers in the nearshore catch (3%), low proportion of biomass of insectivorous species in the trap net catch (5%), and high proportions of biomass of omnivorous species (32%), and tolerant species (23%) in the trap net catch. Several intolerant fish species were sampled historically in the lake, but not in the recent survey. In addition, historic vegetation surveys suggest declining vegetation habitat for fish. This suggests a lack of quality vegetative in-lake and nearshore habitat, and depressed water quality.

41
Glossary Term Definition
aquatic In relation to the Score the Shore survey; an area that is defined as 100 feet along the land-water interface and 50 feet lakeward.
Carlson Trophic State Index (TSI)
A numerical scale (0 – 100) where each major division (10, 20, 30, etc.) represents a doubling in algal biomass. This can be calculated from any of several parameters and is often given as an average of some of these.
contributing watershed In this report; the upstream catchments that drain or have the potential to drain to a lake.
Division of Waters number(DOW)
In this report; a unique identification number for water basins in Minnesota. They follow the format of XX-YYYY-ZZ where XX is a county code, YYYY is the basin number in that county, and ZZ is the sub-basin identifier.
emergent In this report; a plant that is rooted in lake substrate and has leaves and stems which extend out of the water. Floating bogs are considered emergent plant stands.
fish-based lake index of biological integrity (FIBI)
An MNDNR developed index that compares the types and numbers of fish observed in a lake to what is expected for a healthy lake (range from 0 – 100). More information can be found at the MNDNR Lake Index of Biological Integrity website.
Formazin Nephelometric Ratio Unit (FNRU)
A unit of measurement describing the degree to which light is scattered by particles suspended in a liquid. This method in particular measures scattered light at 90 degrees from the infrared light source.
floating-leaf In this report; a plant that is rooted in lake substrate and has its leaves and flowers floating on the water surface.
floristic quality index (FQI) An index used to determine the quality of a vegetative community based on its plant species composition and abundance.
headwater-tailwater difference
The depth of water being retained to a lake by a water level control structure.
impervious A surface that promotes overland flow of precipitation as opposed to allowing it to seep into the ground.
Index of Biological Integrity (IBI)
A tool utilized to measure a biological community’s response to human disturbance.
insectivorous species A species that predominantly eats insects.
intolerant species A species whose presence or abundance decreases as human disturbance increases.
littoral acres In this report; the acres of a lake that are 15 feet deep or less.
National Land Cover Database (NLCD)
A database that utilizes remote sensing at a 30 meter spatial resolution to classify land cover into one of 16 classes.
42
Term Definition
nearshore survey In this report; a fisheries survey conducted at evenly spaced, but random sites along the shoreline utilizing 1/8 inch mesh seines and backpack electrofishing to characterize primarily the nongame fish community of a lake.
omnivorous species A species that eats plant and animal matter to sustain itself.
oxycline Zone in the water column where oxygen concentration changes rapidly with depth.
predator fish A fish species that derives the majority of its energy and nutrients through the consumption of other vertebrate animals.
recruitment In this report; the number of fish surviving to a size sufficient to be effectively sampled.
riparian Situated on the bank of a watercourse or lake.
Score the Shore (StS) survey
A survey designed to be able to rapidly assess the quantity and integrity of lakeshore habitat so as to assess differences between lakes and detect changes over time.
shoreland In relation to the Score the Shore survey; an area that is defined as 100 feet along the top of bank landward for either 100 feet or until the base of a shoreland structure such as a cabin, whichever is less.
shoreline In relation to the Score the Shore survey; an area that is defined as 100 feet along the land-water interface and landward to the top of bank.
small benthic-dwelling species
A species that is small and predominantly lives in close proximity to the bottom.
species richness A count of species.
submersed In this report; a plant that has stems and leaves that grow entirely underwater, although some may have floating leaves or emergent flowers.
tolerant species A species whose presence or abundance does not decrease, or may even increase, as human disturbance increases.
vegetative – dwelling species
A species that has a life cycle dependent upon vegetated habitats.

43
Bibliography Beck, M. W., Vondracek, B., Hatch, L. K., & Vinje, J. (2013). Semi-automated analysis of high-resolution
aerial images to quantify docks in glacial lakes. ISPRS Journal of Photogrammetry and Remote Sensing, 81, 60-69.
Chumchal, M. M., & Drenner, R. W. (2004, October). Interrelationships between phosphorus loading and common carp in the regulation of phytoplankton biomass. Archiv fur Hydrobiologie, 161(2), 147-158.
Cormier, S., Braen Norton, S., Suter II, G., Reed-Judkins, D., Mitchell, J., Swietlik, W., . . . Stinson, J. (2000). Stressor Identification Guidance Document. Washington, DC: U.S. Environmental Protection Agency, EPA/822/B-00/025.
Cross, T. K., & Jacobson, P. C. (2013). Landscape factors influencing lake phosphorus concentrations across Minnesota. Lake and Reservoir Management, 29, 1-12.
Homer, C. G., Dewitz, J. A., Yang, L., Jin, S., Danielson, P., Xian, G., . . . Megown, K. (2015). Completion of the 2011 National Land Cover Database for the conterminous United States - Representing a decade of land cover change information. Photogrammetric Engineering and Remote Sensing, 81(5), 345-354.
Matsuzaki, S.-i. S., Usio, N., Takamura, N., & Washitani, I. (2007, January). Effects of common carp on nutrient dynamics and littoral community composition: roles of excretion and bioturbation. Fundamental and Applied Limnology/ / Archiv fur Hydrobiologie, 168(1), 27-38.
MNDNR. (2016, October 5). Watershed Health Assessment Framework. Retrieved October 5, 2016, from Minnesota Department of Natural Resources: http://www.dnr.state.mn.us/whaf/index.html
MNDNR, MPCA, & MBWSR. (2015). Lakes of Phosphorus Sensitivity Significance: A ranked priority lake list based on sensitivity to additional phosphorus loading and the significance of that sensitivity.
MNDNR-Fisheries. (2013). Fish Habitat Plan: A Strategic Guidance Document. 500 Lafayette Road, Saint Paul: Minnesota Department of Natural Resources, Section of Fisheries.
MNDNR-Fisheries. (2015). Historic Management plans and surveys of Blue Lake from MNDNR Fisheries Hinckley Office. 306 Power Avenue North, Hinckley, Minnesota, 55037, United States of America: Minnesota Department of Natural Resources, Section of Fisheries.
MNDNR-Fisheries. (2015). Historic Management plans and surveys of Francis Lake from MNDNR Fisheries Hinckley Office. 306 Power Avenue North, Hinckley, Minnesota, 55037, United States of America: Minnesota Department of Natural Resources, Section of Fisheries.
MNDNR-Fisheries. (2015). Historic Management plans and surveys of George Lake from MNDNR Fisheries East Metro Office. 1200 Warner Road, St. Paul, Minnesota, 55106, United States of America: Minnesota Department of Natural Resources, Section of Fisheries.
MNDNR-Fisheries. (2015). Historic Management plans and surveys of Green Lake from MNDNR Fisheries Hinckley Office. 306 Power Avenue North, Hinckley, Minnesota, 55037, United States of America: Minnesota Department of Natural Resources, Section of Fisheries.
Radomski, P., & Perleberg, D. (2012). Application of a versatile aquatic macrophyte integrity index for Minnesota lakes. Ecological Indicators, 20, 252-268.


