Round II of the National Study on Informal Workers
112
Round II of the National Study on Informal Workers
Transcript of Round II of the National Study on Informal Workers

3
Round II of the National Studyon Informal Workers

Round II of the National Study on Informal Workers

This work is licensed under a Creative Commons Attribution Non Commercial- ShareAlike 4.0 International License. Provided they acknowledge the source, users of this content are allowed to remix, tweak, build upon and share for non-commercial purposes under the same original license terms.
Some rights reserved
First Published February, 2021
Prepared by Dr Rahul Suresh Sapkal, Assistant Professor, Centre for Labour Studies, Tata Institute of Social Sciences
Divita Shandilya, Programme Manager, Policy and Research
Koustav Majumdar, Research Associate
Roshni Chakraborty, Intern
Anoushka Roy, Intern
K T Suresh, Senior National Lead, Urban and Labour (last five from ActionAid Association)
Edited bySusan Sreemala and Joseph Mathai
Cover Design byNabajit Malakar
Layout byM V Rajeevan
@actionaidindia @actionaid_india
@actionaidcomms
ActionAid Association, F-5, First Floor, Kailash Colony, New Delhi-110048.
+911-11-4064 0500
www.actionaidindia.org
@company/actionaidindia
Round II of the National Study on Informal Workers

Foreword v
Acknowledgements vii
List of Abbreviations ix
List of Tables and Figures xi
Glossary of Terms xv
Executive Summary xvii
Chapter 1: Introduction 1
Chapter 2: Revisiting Workers From Round One 7
Slow Recovery of Livelihoods 7
Low Wages and Delayed Payments 12
Depleting Savings and Rising Indebtedness 14
Chapter 3: Transitions in the World of Work 19
Unemployment and Underemployment 19
Women and Quality of Work and Wages 26
Chapter 4: Increasing Precarity of Informal Workers 33
Consumption and Expenditure 33
Savings Sufficiency and Debt 34
Chapter 5: Status of Social Security 39
Access to Work Under Mahatma Gandhi National 41 Rural Employment Guarantee Act
Pubiic Distribution System and Food Security 44
CONTENTS

iv
Coverage Under Integrated Child Development 46 Services and Mid-Day Meal
Access to Public Healthcare 47
Registration in Workers’ Welfare Boards 50
Relief Under State Level Schemes 51
Chapter 6: Impact of Natural Emergencies and Reduced Mobility 53
Natural Emergencies 53
Migration 58
Chapter 7: Conclusion and Recommendations 65
Extend Pradhan Mantri Gareeb Kalyan Ann Yojana and 66 Universalise Public Distribution System
Expand Mahatma Gandhi National Rural Employment Guarantee Act 66
Introduce an Urban Employment Scheme 67
Ensure Support to Micro, Small and Medium Enterprises 67
Implement and Enforce Minimum Wages 68
Facilitate Safe Migration 68
Ensure Women’s Access to Work 69
Appendix I: Research Team 71
Appendix II: Survey Questionnaire 77
Workers in the Time of COVID-19Round II of the National Study on Informal Workers

The outbreak of the COVID-19 pandemic in India was marked by a lockdown which brought the nation to a complete standstill. This was followed by a gradual phase-wise re-opening. The initial period of the lockdown was a time of collective hardship that exacerbated and exposed pre-existing crises of capital, care, caste, gender, and climate. Its impact on the lives and livelihoods of informal workers, especially migrant workers, was documented by Round One of this study. The report emerging from the first round has been much appreciated by academics, researchers, civil society, and policymakers and has been useful to both ActionAid Association and the many partners and networks we work with in our effort to support the most affected communities.
While the lockdown restrictions have been lifted, the deep distress in livelihoods and incomes of informal workers has scarcely abated. The effects of the massive shock to the system and the ongoing economic crisis have become clearer over the past few months, even as the damage to the socioeconomic gains of the past few decades in reducing absolute poverty, food insecurity, and numbers of out-of-school children is unfolding. As the crisis prolongs and takes newer forms, deepening fissures based on caste, religion, and gender, there is a pressing need for documentation of this unprecedented time. There is also an urgency for evidence from the ground to better inform policy.
The current second round of the survey was carried out from 23rd August 2020 to 8th September 2020, across 23 states and five Union Territories, cutting across the third and fourth phases of the re-opening of the economy. Interactions in this round covered a range of issues regarding the status of migration, livelihoods, and wages of informal workers, their savings and expenditure, and access to social security schemes and other entitlements. This report additionally documents the impact of natural disasters in this period on the most vulnerable populations, deepening our understanding of the multifaceted nature of distress and precarity faced by them.
The study attempts to document the nature and extent of transitions in the lives and livelihoods of informal workers during the pandemic, provide an insight into the precarity they experience and the coping mechanisms they adopt. In addition to the insights generated longitudinally, the report should prove helpful in capturing a snapshot of the informal sector at a particular time, across geographies and
FOREWORD

vi
contexts. The report is also able to document the differential impact of the pandemic on vulnerable groups.
We hope that this report of the second round of the national survey contributes further to our collective understanding of how the pandemic and the several crises it has precipitated are manifesting in the lives of informal workers. The findings of this report have informed and echo the needs we have been trying to address through our response to the crisis in a limited way. We also wish to see the recommendations included in the report, which draw upon and reiterate what many trade unions, workers collectives, and civil society networks have been saying, be put into action to protect and respond to the needs of informal workers. Our continuing hope is that the study generates lessons about the policy choices we need to make, the tools we should deploy in crises, and the institutions and mechanisms we must build and strengthen to make our societies resilient.
This study is the result of the collective effort of a dedicated team of researchers, colleagues from the Programme Implementation, Knowledge Training and Research Hubs at ActionAid Association, the surveyors and the communications team. However, the greatest debt is owed to the workers who took the time to provide the insights that constitute this study.
I look forward to all comments and suggestions as we share this and other reports emerging from this ongoing study. I seek the co-operation of all stakeholders to make popular any insights this study may have on how we can move towards a more responsive policy framework that centres the needs of the vast majority of our workers.
In solidarity,
Sandeep Chachra Executive Director ActionAid Association
Workers in the Time of COVID-19Round II of the National Study on Informal Workers

This study is the result of the commitment and vision of numerous surveyors, co-ordinators, and researchers. However, the true protagonists of the study are the more than sixteen thousand workers who contributed to the survey, taking the time and effort to provide insight through their ongoing hardships. This study is made possible and meaningful because of them.
Acknowledgements are due to the extensive survey teams from Rajasthan, Gujarat, Odisha, Delhi, Haryana, Punjab, Himachal Pradesh, Bihar, Jharkhand, Maharashtra, Goa, Uttar Pradesh, Uttarakhand, Madhya Pradesh, Karnataka, Tamil Nadu, Andhra Pradesh, Telangana, West Bengal, Assam, and Manipur. The members of these teams committed their time and efforts to undertake this mammoth task in addition to their daily responsibilities.
Gratitude is also due to the dedication and efforts of the co-ordination teams from ActionAid Association’s programme implementation, training and research hubs for organising the study. We are extremely grateful for their support and direction to this collective effort.
We received critical feedback from several friends and colleagues through the various phases of the study. Dr Amit Basole, Associate Professor of Economics, Azim Premji University, Dr Sumeet Mhaskar, Associate Professor and Associate Dean, Jindal School of Government and Public Policy, O.P. Jindal Global University, Dr Daksha Parmar, Associate Professor, Development Studies, Department of Humanities and Social Studies, Indian Institute of Technology, Guwahati, and Dheeraj, Programme Manager, Praxis provided invaluable insights during the development of the questionnaire. Sandeep Chachra, Executive Director, Smita Khanijow, Lead, Women and Work Synergy group, and Debabrat Patra, Associate Director from ActionAid Association too contributed to this process.
Dr Lakshmi Lingam, Dean and Professor, School of Media and Cultural Studies, Tata Institute of Social Sciences, Dr Sumeet Mhaskar, Namita Bhandare, senior independent journalist, and Fakira Charan Rout, District Coordinator, Nabarangpur, ActionAid Association participated in a webinar to launch the factsheet of this round. Their discussion and inputs shaped the report in many ways.
ACKNOWLEDGEMENTS
viii
The study and this report are also the product of the efforts of the dedicated team of researchers who wrote this report. This includes Dr Rahul Suresh Sapkal, Assistant Professor, Centre for Labour Studies, Tata Institute of Social Sciences, and from ActionAid Association Divita Shandilya, Programme Manager, Policy and Research, Koustav Majumdar, Research Associate, Roshni Chakraborty, Intern, Anoushka Roy, Intern, and K T Suresh, Senior National Lead, Urban and Labour. They were provided research support by Deepa Suman and Kashif Jamil, who interned with the policy unit of ActionAid Association.
Thanks also go to the translator, editor, design team and support from the communications team to bring this report to its final version. Please refer to Appendix I for a full list of the team who conducted the research and put together this report.
Workers in the Time of COVID-19Round II of the National Study on Informal Workers
AAY : Antyodaya Anna Yojana
ASHA : Auxiliary Social Health Activist
BOCW : Building and Construction Workers
CMIE : Centre for Monitoring Indian Economy
CSO : Civil Society Organisation
GDP : Gross Domestic Product
ICDS : Integrated Child Development Scheme
INR : Indian National Rupee
MDM : Mid-Day Meal
MGNREGA : Mahatma Gandhi National Rural Employment Guarantee Act
MSME : Micro, Small, Medium Enterprises
NGO : Non-Governmental Organisation
NHRC : National Human Rights Commission
NSSO : National Sample Survey Office
OPD : Out Patients’ Department
PDS : Public Distribution System
PMGKAY : Pradhan Mantri Garib Kalyan Ann Yojana
PMGKRY : Pradhan Mantri Garib Kalyan Rozgar Yojana
PMGKY : Pradhan Mantri Garib Kalyan Yojana
SC : Scheduled Caste
ST : Scheduled Tribe
LIST OF ABBREVIATIONS

Unemployment remains high, and underemployment is increasing.

LIST OF TABLES AND FIGURES
Figure 2.1 : Status of livelihoods among revisited workers (N = 4,818) 8
Figure 2.2 : Intensity of Work for revisited workers (N = 4,818) 10
Table 2.1 : Comparison between sector of work 11 pre-lockdown and in the unlock phase (N =4,818)
Table 2.2 : Comparison between type of employment 11 pre-lockdown and in the unlock phase (N = 4,818)
Figure 2.3 : Monthly income reported by revisited workers (N = 4,818) 12
Figure 2.4 : Wage arrears due to revisited workers (N = 4,818 13
Figure 2.5 : Revisited workers working under promise of 14 payment in the future (N = 4,818)
Figure 2.6 : Sufficiency and frequency of food for 15 revisited workers (N=4,818)
Figure 2.7 : Sufficiency of savings for revisited workers (N=4,818) 16
Table 2.3 : Amount of loan taken for revisited workers (N = 4,818) 18
Table 3.1 : Employment level during the unlock phase (N = 16,961) 20
Figure 3.1 : Sectors of work in unlock (N = 8,786) 23
Figure 3.2 : Type of employment (N = 8,786) 24
Figure 3.3 : Status and shift of livelihood options for 25 selected occupation categories (N = 10,566)
Figure 3.4 : Reasons for women family members being 26 unable to resume work (N = 2,360)
Figure 3.5 : Disparity in Quality of Work between 27 Casual and Regular Workers, based on Rights at Work for Unorganised Sector, as put forward by the Arjun Sengupta commission (NCEUS) in 2007. (N = 7,242)
Figure 3.6 Average monthly wages in the unlock phase (N = 16,961) 28

xii
Table 3.2 : Wage disparity between male and female workers 29 in certain occupations. (N = 6,223)
Figure 4.1 : Food sufficiency, meal frequency and water sufficiency 34 in unlock. (N = 16,961)
Figure 4.2 : Monthly expenditure in unlock (N = 16,961) 35
Figure 4.3 : Change in expenditure on selected non-food Items 35 relative to pre-COVID level (N=16,961)
Figure 4.4 : Savings sufficiency in the unlock phase (N = 16,961) 36
Figure 4.5 : Incidence of debt in unlock. (N = 16,961) 37
Figure 4.6 : Purpose of debt in unlock (N = 6,679) 38
Figure 4.7 : Source of debt in unlock (N = 6,679) 38
Figure 5.1 : Average days of work got and average daily wage received 43 under NREGS during lockdown. (N=3,082)
Figure 5.2 : Possession of ration cards (N = 16,961) 45
Figure 5.3 : Possession of AAY cards (N = 16,961) 45
Figure 5.4 : Access to food rations under PMGKAY (N = 16,961) 45
Figure 5.5 : Access to ICDS (N = 4,845) 46
Figure 5.6 : Access to mid-day meal scheme (N=6,152) 47
Figure 5.7 : State level variation in ICDS enrolment 47 and access (N = 11,641)
Figure 5.8. : State level variation in MDM enrolment 48 and access (N = 12,427)
Figure 5.9 : Access to public healthcare facilities (N = 5,141) 48
Figure 5.10 : Access to reproductive healthcare (N = 2,793) 49
Table 6.1 : Top six states affected by natural emergencies (N= 1,319) 54
Figure 6.1 : Impact of natural emergencies (N=1,621) 54
Figure 6.2 : Assistance Received after the Emergency (N=1,621) 55
Figure 6.3 : Sources of food assistance (Cooked food N=396, 56 Dry ration N=766)
Figure 6.4 : Sources of shelter and financial assistance (Shelter N=355, 57 Financial assistance N=160)
Workers in the Time of COVID-19Round II of the National Study on Informal Workers
xiii
Figure 6.5 : Do you want to stay in your source area? 58 (N= 16,961) If yes, why? (N=11,052)
Figure 6.6 : Do you want to change your destination area? 59 (N= 5, 935) If yes, why? (N=882)
Figure 6.7 : Migration before Lockdown and reverse 60 migration during lockdown
Figure 6.8 : Migration/employment status after lockdown 61 of returnee migrants
Figure 6.9 : Migration route for new migrants. 62
List of Tables and Figures

Monthly wages are extremely low across the board, and women are receiving lower wages.

Casual Worker: A worker who is casually engaged in another person’s farm or non-farm enterprise (both household and non-household) and, in return, receives a wage according to the terms of the daily or periodic work contract.
Destination Area: The village/district/city to which a migrant worker has migrated for work
Lockdown Phase: The period of the national lockdown from March 24, 2020 to May 31, 2020.
New Migrant: Respondents who have migrated for work during the unlock phase but were not migrating before the lockdown.
Non-Migrant: Respondents who reported that they do not migrate for work but are employed in their native place.
Own Account Work: Subset of self-employed workers who run their own home-based establishment or enterprise (with or without partners) without hiring any worker.
Part-time employment: A situation where a worker is working fewer hours in a day, usually less than eight hours, or getting work occasionally.
Regular Worker: A worker who is working in another person’s farm or non-farm enterprises (both household and non-household) and, in return, receives salary or wages on a regular basis (that is not on the basis of daily or periodic renewal of work contract).
Returnee Migrant: Respondents who reported migrating for work before the lockdown and returned to their native place during the lockdown.
Revisited Workers: Respondents from round one who were re-interviewed for round two of the study.
GLOSSARY OF TERMS

xvi
Source Area: The native village/district/city of a worker from where they have migrated to another place for work.
Sufficiency (Food/Water/Savings): A subjective estimate based on what each respondent reports to be sufficient for their consumption.
Underemployment: A situation where a worker is either in part-time employment or is engaged in work at a lower skill and income level than they are willing and able to work.
Unemployed: Respondents with no source of livelihood, either in paid employment or self-employment.
Unlock Phase: The period from June 1, 2020, when lockdown restrictions started being lifted gradually, to September 8, 2020, when the second round of the survey concluded.
Workers in the Time of COVID-19Round II of the National Study on Informal Workers

This report presents the findings of the second round of ActionAid Association’s longitudinal national survey of informal workers. The survey was conducted during the end of the third but majorly in the beginning of the fourth phase of the re-opening of the economy or Unlock-3 and Unlock-4 to assess the resultant transitions on the ground with respect to people’s livelihoods, wages, savings, consumption, and access to social security and basic services.
The extent of the damage caused by the pandemic and the subsequent national lockdown to the already strained economy have become clearer during the unlock process. The recovery in unemployment has been much slower than expected, especially in urban areas, and wages have plummeted both in the formal and informal sectors. In our survey, nearly half of the 16,961 respondents were unemployed, and one-fourth had zero wages. Around 42 per cent of those who said that they were rendered unemployed by the lockdown when we spoke to them during the first round in May, remained unemployed nearly four months later in September.
Out of those who were employed, a majority were either working fewer hours than they were before the lockdown or were finding work occasionally. Many have had to move to alternate sources of livelihood, most prominently from construction and manufacturing to agriculture. There was thus a worsening situation of underemployment.
Simultaneously, the quality of jobs was deteriorating. There has been a notable shift from regular work to casual work and casual workers have reported significantly lower protections at work. In our sample, 60 per cent of respondents were working as casual workers and 22.5 per cent as regular workers. While 71 per cent of the regular workers have eight hour work days with a half hour break, only 50 per cent of casual workers do, and around 34 per cent of regular workers got minimum wages as compared to 24 per cent of casual workers.
Overall, wages have remained worryingly low during the unlock phase. Almost half of the respondents were earning less than `5,000 per month. Only about eight per cent were earning more than `10,000 per month. Moreover, there was a huge
EXECUTIVE SUMMARY
xviii
gender disparity in wages. The average monthly wage earned by women was much lower than that by men across all major occupational categories in our sample, including agriculture labour, construction work, manufacturing work, sanitation work, street vending, hotel or restaurant work, and fish work.
Even in occupations like tailoring or in the garment industry, where women outnumber men, men earn far more than women. This was likely due to women being concentrated in lower paid tasks and being paid less than men for the same work. On the other hand, hardly any of the men we interviewed were engaged in low-income occupations like domestic work and salt pan work, where 60 per cent to 80 per cent of workers earn less than `5,000 per month.
With barely subsistence level wages, people have been forced to reduce consumption and expend their savings. They were also having to borrow to meet their essential needs, mainly food, followed by expenditure on healthcare, restarting livelihoods, and electricity. Around 39 per cent of respondents have reportedly borrowed money in the unlock phase. The incidence of debt was markedly higher for women, for workers in urban areas, and for non-migrant workers when compared to men, workers in rural areas, and returnee migrants.
People’s access to welfare schemes showed great variation across different states. In general, states in the southern and eastern parts of the country seem to be outperforming states in northern and central India. For instance, in Andhra Pradesh, Odisha, West Bengal, and Assam more than 87 per cent of the respondents could access free rations, but in Manipur, Rajasthan, Delhi, and Punjab less than 55 per cent respondents reported access. There was also considerable variation in access to these schemes based on migration status and location. Returnee migrants have consistently reported lower access to welfare schemes as compared to the non-migrant population in our sample. At the same time, rural areas have performed far better than urban areas in ensuring access to these schemes, which points to the utter neglect in building an inclusive and accessible social security infrastructure in cities.
In the absence of adequate State support and secure livelihoods, people were becoming extremely reliant on debt, turning to moneylenders once they have exhausted their network of family and friends. They were also being pushed into taking up more and more precarious forms of livelihoods, and there have been several reports indicating that incidence of child labour was rapidly increasing.
For families that rely on migration to supplement their household incomes, the reverse migration from cities triggered by the lockdown has been particularly devastating. The rate of recovery of livelihoods for returnee migrants has been much slower, with around 53 per cent unemployed in the unlock phase as
Workers in the Time of COVID-19Round II of the National Study on Informal Workers

xix
compared to 43 per cent of non-migrant workers. Their monthly wages were also lower on average. Notwithstanding their hardships, a majority of returnee migrants in our sample were unwilling to migrate for work again, which was hardly surprising given the continuing economic uncertainty. Moreover, migrants who were coming back to cities were presumably doing so for abysmal wages and poorer living and working conditions than what they had left behind during the lockdown.
The crisis has potentially set informal workers from marginalized and vulnerable communities back by decades and threatens to push generations into poverty and deprivation. The prospects for recovery and socio-economic mobility for this segment of the population is very limited due to their low levels of education and many other forms of structural barriers. Only about 5.7 per cent of workers between the ages of 18 and 30 years in our sample were graduates and 13.5 per cent have completed their higher secondary education. These percentages were even lower for workers in higher age groups. Nearly 93 per cent of the workers we interviewed have had no technical education or training.
In this context, policymakers need to provide immediate relief and protection to the most adversely affected informal workers and bolster their incomes through social assistance programmes and public employment schemes in both rural and urban areas. This report contains detailed recommendations based on our survey findings, and much more has been suggested by people who closely work with and study the informal sector.
It is imperative for the Government to address gaping inequalities in the labour market, which has largely locked marginalised groups into low-value, low-paid, and hazardous informal work with almost no social security. In addition to generating decent work opportunities, this would require promoting workers’ bargaining power through trade unions and collectives, improving safety requirements and working conditions at the workplace, and strengthening implementation mechanisms of labour laws. It would also entail taking steps towards a universal social security architecture, which is based on better Union-State coordination and resource sharing and is nimble and responsive in its approach. But ironically, the newly introduced labour codes dilute many existing legal provisions in this regard to the detriment of workers’ rights.
Despite the profound impacts of the pandemic and the economic crisis on the informal sector, there was not much data available. Our effort through the survey has been to address this gap and contribute to the evidence base for better informed interventions by policymakers and civil society. Through subsequent rounds of the survey, we will continue to strive to generate reliable quantitative and qualitive data to assess these impacts. We will also attempt to explore in greater detail hitherto less interrogated aspects of the crisis such as its differential and varied implications for children, women, and different caste groups.
Executive Summary

Many workers have taken loans during the unlock period, mostly to fund basic expenses, like food.

Having imposed one of the strictest and longest lockdowns in the world, Government of India started the process of gradually opening up the country in June 2020. By then the economy had taken a massive blow; GDP for the April to June quarter fell by a whopping 23.9 per cent,1 with unemployment rising above 27 per cent.2 More than one crore migrant workers had retraced their steps back home from the urban and industrial centres where they had come to eke out a living, many of them walking long distances in the absence of public transport and braving violent enforcement of lockdown restrictions.3, 4
In the months since, there has been a tepid recovery of sorts. The GDP for the July-September quarter showed marked improvement over the previous quarter, though it continued to contract. Meanwhile, concerns
Introduction
1. Udit Misra and Nushaiba Iqbal, “India GDP Growth Contracts 23.9%: What Is the Economics behind the Math?,” The Indian Express, September 6, 2020, https://indianexpress.com/article/explained/gdp-contraction-23-9-the-economics-behind-the-math-6578046/.
2. “Five million potential workers may have left the labour force entirely,” Business Standard, December 08, 2020,
https://www.business-standard.com/article/opinion/disheartened-job-seekers-120120701115_1.html
3. “Over 1 crore migrant labourers return to home states on foot during Mar-Jun: Govt,” The Hindu, September 23, 2020, https://www.thehindu.com/news/national/over-1-crore-migrant-labourers-return-to-home-states-on-foot-during-mar-jun-govt/article32674884.ece
4. The number is most likely an underestimation, considering that the Finance Minister, while announcing the Atma Nirbhar Bharat package in May 2020, had estimated that 8 crore migrants would benefit from provision of free ration to non-card holders. “Coronavirus crisis: Only 20 lakh out of 8 crore migrants got free food grains so far,” Business Today, June 8, 2020, https://www.businesstoday.in/current/economy-politics/coronavirus-only-20-lakh-migrant-workers-free-food-grains-atma-nirbhar-bharat-scheme/story/406278.html
1CHAPTER

2
remain rife about high levels of unemployment. The Centre for Monitoring Indian Economy (CMIE) reported a fall in the employment rate in rural India and continued low employment rate in urban India for two consecutive months in October and November based on data collected through its Consumer Pyramids Household survey.5 Informal workers, including casual wage workers, low-income self-employed workers, and migrant workers, have been the worst affected. Their livelihoods and wages were decimated overnight when the lockdown was announced and in the absence of social security and other protective measures, they were left struggling for food and shelter. With the extremely slow pace of recovery of livelihoods, especially in the informal sector, they were being pushed deeper into poverty and debt.
There have been numerous reports about informal migrant workers who have returned to their villages struggling to find work. Many of them were considering or have already started migrating to cities to search for jobs despite the higher spread of COVID-19 in urban areas and having to come back to the poor living conditions that they left behind. In urban areas too, the slow uptick in jobs has made recovery of livelihoods particularly difficult for informal workers. Sectors which employ a large number of migrant and other informal workers such as construction, micro, small, and medium enterprises, tourism, and hospitality have been unable to resume functioning to the pre-pandemic levels.
A survey of more than 4,800 households in 48 districts across eleven states carried out by the Aga Khan Rural Support Programme (India), Action for Social Advancement, et al. between 24th June and 8th July, 2020 revealed that more than a fourth of the returned migrant workers interviewed were still searching for work.6 Out of those who had found work, more
5. “Rural employment falls, employment rate in urban India stays low”,” The Economic Times, October 22, 2020, https://economictimes.indiatimes.com/news/economy/indicators/rural-employment-falls-employment-rate-in-urban-india-stays-low/articleshow/78815843.cms?utm_source=contentofinterest&utm_medium=text&utm_campaign=cppst
6. How is the hinterland unlocking? Findings from 2nd round of survey available at: https://villagesquare.in/webinar/wp-content/uploads/2020/08/VAF-CSO-Covid19-survey-round-2-3-8-20-webinar-slides_Kiran-Limaye.pdf
Workers in the Time of COVID-19Round II of the National Study on Informal Workers

3333
than 80 per cent were engaged in some form of low paid manual labour, either in agriculture or in MGNREGA. In the absence of sustained, skilled employment, 45 per cent of those interviewed expressed their intention of moving back to cities in search of work.
Another survey conducted by the Centre for Economic Performance at the London School of Economics attempted to understand the impact of the pandemic on young workers in urban areas in India. It was conducted between 14th May and 8th July, 2020 with 8,530 individuals aged 18 to 40 years. The report reveals that young workers, who were over-represented in the informal sector, were at high risk of job losses. Out of all the people interviewed, close to 22 per cent reported being unemployed or having zero hours of work during May-July, and employment losses were higher for younger workers (18 to 25 years old) than older workers (26 to 40 years old).7 Only 31 per cent of all respondents said that they had a guaranteed number of days of work.
The shock to the livelihoods of informal workers has had a deeply adverse impact on their incomes, savings, housing, and access to food, water, education, and healthcare. The first survey in this longitudinal series by ActionAid Association, which was carried out in the third week of May 2020, examined the impact of the lockdown on all these parameters. At the time, out of 11,537 respondents, over three-fourths reported that they had lost their livelihoods and close to half had not received wages. Around 53 per cent said that they had incurred additional debt. Only about a sixth of the respondents reported that their food consumption was sufficient, a huge drop from the 83 per cent who believed that their food consumption was sufficient before the lockdown. Nearly three-fourths of the respondents said that they could not access healthcare when they needed to during the lockdown.
ActionAid Association initiated the second round of our survey two months into the nationwide unlock phase to understand how people in the informal
7. Bhalotia, Shania, Dhingra, Swati and Kondirolli, Fjolla, “City of Dreams no More: The Impact of COVID-19 on Urban Workers in India, CEP COVID-19 Analysis, September 2020, https://cep.lse.ac.uk/pubs/download/cepcovid-19-008.pdf
Introduction

4444
economy were coping and whether there had been any improvement in their living and working conditions compared to the lockdown. We also wanted to get a sense of the level and nature of vulnerability which continues to shape their lives in the context of the fast-spreading disease and the economic contraction. The survey was conducted between August 23rd and September 8th, 2020 and covered 16,961 informal workers across 402 districts in 23 states and five union territories.
We revisited 4,818 workers who were interviewed in the first round to track their living and working conditions and thus draw out reliable comparisons and assessment of the ground reality. We were unable to track more people as many of them had been in transit when they were interviewed for the first round and did not provide their contact information, especially if they were travelling in groups. We also expanded the scope of the survey, both geographically and in terms of the types of occupations people were engaged in before and after the lockdown. A key lesson during the unlock phase has been that not all sectors were recovering in the same way and that the impact of the lockdown and the capacity and effectiveness of response has differed a lot in different states.
In adding new respondents for this round, we used a state-level stratified sampling method. This entailed using the Periodic Labour Force Survey and the NSSO to divide the population into substrata on the basis of demographic characteristics such as gender and location and then instructing our research hubs to select their interviewees proportionally. Out of all the people interviewed, 63 per cent were men, 37 per cent were women and less than 0.1 per cent identified as transgender or withheld their gender identity. Around 28 per cent of the respondents were located in urban areas and 72 per cent were in rural areas. Among social groups, Scheduled Castes constituted the largest group at 40 per cent of the sample, 26 per cent of the respondents were from other backward classes, 18 per cent from Scheduled Tribes, and 15 per cent from other categories. A little over 50 per cent of our sample used to migrate for employment prior to the lockdown, while the rest did not migrate.
The interviews were conducted mostly over the phone or through short on-site conversations while distributing food rations and other relief material,
Workers in the Time of COVID-19Round II of the National Study on Informal Workers

5
and all answers were logged through Kobo Toolbox. Our survey team of 291 volunteers were able to speak to thousands of workers through the workers’ collectives and networks that we have been working with over the past several years. Our outreach was magnified by the exemplary work that our partners, staff, fellows, and volunteers have been doing with district administrations such as supporting worker registration drives at migration facilitation centres and maintaining and monitoring quarantine facilities.
We believe that by capturing snapshots of the informal sector at particular times, geographies, and contexts through this multi-round survey, we were being able to piece together the bigger picture of the lives and livelihoods of informal workers in the ongoing pandemic and economic crisis. We were also able to highlight the ways in which different groups have been impacted differently. For marginalised and vulnerable communities, the pandemic has intensified several crises; an increase in domestic violence, withdrawal of women from the labour force, fall in access to immunisation and essential healthcare, increasing barriers to education, and heightened risk of child marriage and trafficking to name a few. The discrimination, violence, and deprivations they face have deepened while governance has failed them.
The findings and learnings from this comprehensive exercise have informed our interventions with informal workers in the past few months to mitigate these effects in limited ways. This includes directing relief efforts towards vulnerable groups who have been unable to access Government support, and supporting communities in livelihood reconstruction, led by women collectives. The findings also formed the basis of our report to the Committee of Experts on Impact of COVID-19 Pandemic on Human Rights and Future Response constituted by the (National Human Rights Commission (NHRC). The NHRC issued a detailed advisory to the Chief Secretaries of all State Governments and union territories on protecting the human rights of informal workers during the pandemic thereafter. They have also helped us engage substantively with State Governments on formulating social security legislations and measures for informal workers such as domestic workers and construction workers. The depth of information and understanding we gain from subsequent rounds will further bolster our efforts.
Introduction

6
In the following chapters, we begin by retracing workers from the first round and assess changes in their livelihoods and incomes in the intervening period between the two rounds of the survey. We then look at the overall trends and transitions in employment, wages, savings, and consumption for informal workers in the unlock phase. We also examine people’s access to entitlements under various public schemes, particularly the ones which were announced since the pandemic outbreak to support informal workers. We explore how factors such as impact of natural disasters and uncertainty around labour mobility increase the precarity of informal workers and make socio-economic recovery harder for them. We conclude with a set of broad recommendations that were informed by our findings to inform policy interventions going forward.
Workers in the Time of COVID-19Round II of the National Study on Informal Workers

Revisiting Workers From Round One
Tracking indicators longitudinally by revisiting informal workers over multiple rounds was an important aspect of the design of this study. The change in their material conditions across different periods of time gives us an insight into the challenges that they were facing, given existing structural issues and exogenous developments, and the direction that policies need to take.
We re-interviewed 4,818 workers for the second round, a little over 40 per cent of our round one sample. They were mostly located in Odisha, Bihar, Uttar Pradesh, Delhi, Rajasthan, Madhya Pradesh, and Maharashtra, states which constituted the bulk of our sample in the previous round.
Around 76 per cent of the ‘revisited’ respondents were men, 24 per cent were women, and two were transgender. More than 70 per cent of them used to migrate for employment before the pandemic broke out. This included 79 per cent of the men who were re-interviewed and 50 per cent of the women. Close to 70 per cent of all revisited workers were in rural areas and the other 30 per cent were in urban areas at the time of their interview for the second round. The following sections document the findings emerging from the longitudinal study.
Slow Recovery of LivelihoodsThe gradual lifting of the lockdown restrictions across the country has aided the process of recovery of livelihoods. But the unemployment level was still considerably high, while underemployment seems to be an ascendant phenomenon. Amongst the revisited workers, more than 80 per cent were unemployed during the lockdown. In the unlock phase, around 40 per cent remained unemployed, whereas 52 per cent were employed part-time,
2CHAPTER

that is they were either working fewer hours than the pre-lockdown level or getting work occaisionally (Figure 2.1)
The level of recovery of livelihoods for returnee migrants has been lower as compared to non-migrants. Amongst returnee migrants, 83 per cent were unemployed during the lockdown and 43 per cent were unable to resume work in the unlock period, whereas for non-migrant workers, the unemployment level was 73 per cent during the lockdown, which fell to around 36 per cent in unlock. Around 50 per cent of returnee migrants and 56 per cent of non-migrants reported that they were employed part-time.
There was also a notable difference if we look at recovery of livelihoods across genders. In case of women workers, the recovery has been seemingly greater when compared to male workers. Around 77 per cent of the women we spoke to were rendered unemployed during the lockdown as compared to 81 per cent of the men. In the unlock phase, 31 per cent women reported that they were unemployed as compared to 44 per cent
80.4
Figure 2.1: Status of livelihoods among revisited workers (N = 4,818)
Status of livelihoods (%)
Employed Part-time During Unlock
Unemployed During Unlock Unemployed During Lockdown
40.7 51
.88
80.6
942
.57 51
.22
79.8
737
.653
.34
77.3
4
61.5
231
.08
81.4
43.8
248
.81
83.2
542
.81 50.3
8
73.3
35.9
55.6
1
All India Rural Female ReturneeMigrant
Urban Male Non-Migrant
8
Workers in the Time of COVID-19Round II of the National Study on Informal Workers

9
of the men. This difference can be attributed to the fact that aside from agriculture, women were employed in greater numbers in the services sector, mainly domestic work, while men were mostly in the construction sector, and the recovery has been stronger in the service sector than in construction.
There has been a significant reduction in work intensity measured by the number of hours worked in a week. Though the intensity of work has gone up compared to what it was during the lockdown, it was still substantially lower than the pre-lockdown level. In Figure 2.2, we can see that more than 80 per cent of the respondents were working over 30 hours a week before the lockdown, with 42 per cent of them working for more than 50 hours in a week. During the lockdown, only about 13 per cent of the respondents worked above 30 hours a week, which increased to 25 per cent of the respondents working more than 30 hours a week in the unlock phase. The majority of respondents who have been able to resume work were working far fewer hours than they used to before the pandemic.
The reduction in intensity of work has adverse implications for informal workers’ incomes. Wages in the informal sector were extremely dependent on the number of hours worked, so even when work was available, there was likely a continued loss of wages because of the drastic drop in working hours.
Badrun Nisha lives with her husband, son, and teenage daughter in Lucknow, Uttar Pradesh. Her husband used to do furniture polishing but has been ill for many years and is unable to work. Her son has a large tumor like protuberance on his nose which hinders him from getting a stable job. So, Nisha supports the household with her earnings from domestic work. During the lockdown, she lost her livelihood entirely. Their neighbours provided them with some financial support so that they could survive. Since the unlock process started, her work has resumed but at a much smaller scale. Her deteriorating physical condition and advanced age (she is in her fifties), have made people hesitant to call her back to work.
Another significant trend in the process of recovery of livelihoods has been a shift in both the sector and type of employment. There has been
Revisiting Workers From Round One

10
a prominent shift towards agriculture as the major source of livelihood. Amongst the workers we revisited, more than 51 per cent were working in agriculture, either part time or full time, as compared to less than 15 per cent before the lockdown. Among those who used to work in construction before the lockdown, more than 33 per cent were working in the agriculture sector in the unlock phase (Table2.1). More than 22 per cent of workers who were engaged in manufacturing prior to the lockdown were now working in agriculture and a little over 15 per cent of those who were working in the services sector were working in the agriculture sector during unlock.
Both the reduction in work intensity and the shift to agriculture from other sectors of the economy signify rising underemployment. A significant number of returnee migrants who had been working in the construction and manufacturing sectors have returned to their villages and were resorting to
No Work 1–10 Hours
A Week
11–20 Hours
A Week
21–30 Hours
A Week
31–40 Hours
A Week
41–50 Hours
A Week
Above 50 Hours
A Week
Unlock Lockdown Pre-Lockdown
074
.740
.76
7.03 7.24
16.1
1
4.06
2.73 6.
33 8.54
2.67
12.1
4
14.6
53.
5211
.19
23.6
64.
948.
85
42.0
74.
943.
97
Figure 2:2 Intensity of Work for revisited workers (N = 4,818)
Intensity of Work (%)
Workers in the Time of COVID-19Round II of the National Study on Informal Workers

11
farming or agricultural labour for their livelihoods. However, the capacity of the agricultural sector to absorb these workers was extremely low and has further declined post the harvest season. This has also raised concerns about loss of livelihoods for non-migrant landless agricultural labour, especially women, who typically work in MGNREGA and as agricultural labour in rural areas.
Table 2.1: Comparison between sector of work pre-lockdown and in the unlock phase (N = 4,818)
Status/Sector of Work in Unlock
Unem-ployed
(%)
Agriculture (%)
Con-struction
(%)
Manufac-turing (%)
Services (%)
Sect
or
of
Work
bef
ore
Lock
dow
n
Agriculture 29.24 61.32 6.15 1.35 1.95
Construction 37.07 33.07 22.11 6.06 1.7
Manufacturing 52.65 22.61 7.43 13.39 3.92
Services 39.98 15.56 7.63 12.61 24.21
All Sectors 40.76 30.6 12.64 8.77 7.22
Table 2.2: Comparison between type of employment pre-lockdown and in the unlock phase (N = 4,818)
Employment/Work Category in Unlock
Unem-ployed (%)
Casual (%)
Regular (%)
Self Employed
(%)
Own Account Worker
(%)
Emplo
ymen
t/W
ork
C
ateg
ory
bef
ore
Lo
ckdow
n
Casual 40.18 43.3 7.74 6.55 2.23
Regular 40.32 37.65 14.77 4 3.26
Self Employed 41.15 6.29 1.77 42.73 8.06
Own Account Worker
43.04 7.12 1.29 8.41 40.13
All Categories 40.76 25.84 8.43 17.72 7.24
Revisiting Workers From Round One

12
There has also been a concomitant shift towards casual employment and own account work since the process of unlocking began. Before the lockdown, around 15 per cent and seven per cent of the revisited workers were in casual and own account work respectively. However, in the unlock phase, almost 44 per cent of those who have resumed employment either part time or full time were working as casual workers and around 12 per cent were working as own account workers.
Notably, more than 37 per cent of those who worked in regular employment prior to the lockdown were working in casual employment during the unlock phase (Table 2.2).
Low Wages and Delayed PaymentsThe monthly wages received by workers in the unlock phase have increased as compared to their earnings during lockdown but remain precariously low. More than 26 per cent of the revisited workers had no income during the unlock phase (Figure 2.3). The majority of workers, nearly 29 per cent, were earning between `2,000 to `5,000 per month.
0
41.6
0.34
0.15
No Income `1To `2,000
`2,001To `5,000
`5,001To `10,000
`10,001To `15,000
`15,001To `25,000
Above `25,000
2.67
62.5
226
.37
5.21
12.6
518
.23
17.5
914
.928
.89
6.38
18.4
9
24.1
82.
56 6.36 8.75
0.84 1.32
Figure 2.3: Monthly income reported by revisited workers (N = 4,818)
Monthly wages/income levels (%)
Unlock Lockdown Pre-Lockdown
Workers in the Time of COVID-19Round II of the National Study on Informal Workers

13
There has been a sharp drop in the percentage of workers who were earning between `5,000 to `10,000 per month and between `10,000 to `15,000 per month before the lockdown, from 42 per cent pre-lockdown to 18 per cent in unlock and from 24 per cent pre-lockdown to six per cent in unlock, respectively.
The abrupt announcement of the lockdown led to many workers not receiving their month-end salary or cumulative wages from their employers. Amongst the workers that we revisited, only 33 per cent had received full wages at the time of the lockdown (Figure 2.4). By the time the unlock process began, another nine per cent had received wages that had been due to them since the lockdown. However, 58 per cent of the respondents stated that they were still due to be paid wages for work they had done before the lockdown, with 13 per cent having received partial payment and 45 per cent having received no payment at all.
More than 16 per cent of the respondents in our revisit sample shared that they have started working with the promise of being paid in the future (Figure 2.5). Proportionately, women were almost twice more likely than men to work on the assurance of future payment at 23 per cent compared to 14 per cent of the latter. It was also more likely for returnee migrants, for
No Wages Received
Received Full Wages before Lockdown
Received Partial Wages by Unlock
Received Full Wages by Unlock
45%
33%
9%
13%
Figure 2.4: Wage arrears due to revisited workers (N = 4,818)
Wage arrears
Revisiting Workers From Round One

14
workers based in urban areas, and for people engaged in the manufacturing sector to work on the promise of future payment.
Significantly, more than two-thirds of those who have started working in unlock on assurance of being paid in the future already have outstanding wage arrears.
Depleting Savings and Rising IndebtednessThe low levels of employment and low and unpaid wages have greatly impacted the economic security of households, manifested in both dropping consumption levels and fast disappearing savings.
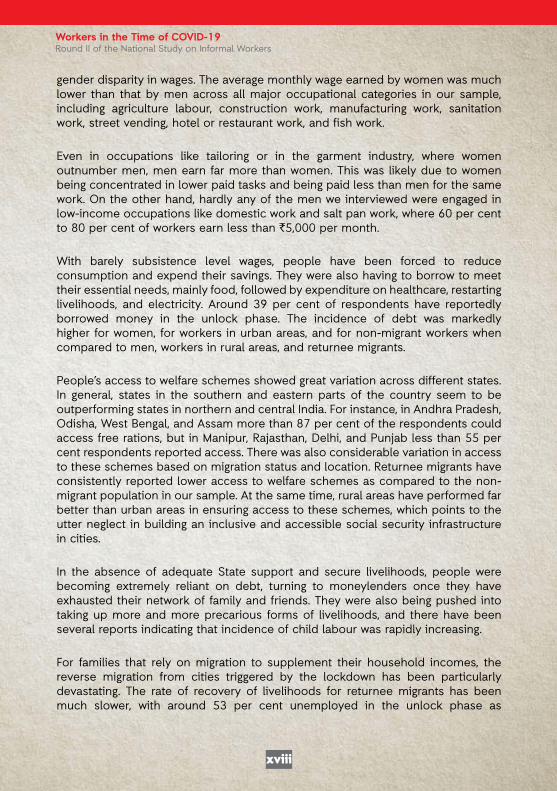
During the lockdown, food security rapidly fell due to people’s inability to access or buy food and food rations. Of the workers we revisited, only 18 per cent reported that their food consumption was sufficient during the lockdown, a massive decrease from before the lockdown when 86 per cent of them believed that their food consumption was sufficient (Figure 2.6). Here ‘sufficiency’ is a subjective estimate based on what each respondent reports to be sufficient for their consumption.
Figure 2.5: Revisited workers working under promise of payment in the future (N = 4,818)
Working under promise of payment (%)
Rura
l
Ove
rall
Mal
e
Retu
rnee
M
igra
nt
Non
-Mig
rant
Urb
an
Fem
ale
Agric
ultu
re
Con
stru
ctio
n
Man
ufac
turin
g
Serv
ices
Without Arears With Arears
16.1
3
14.1
5 20.1
1
22.9
5
13.5
2 17.2
8
13.5
4
13.5
12.8
7
29.2
2
17.1
3
Workers in the Time of COVID-19Round II of the National Study on Informal Workers
15
Food sufficiency has recovered since then but remains at a worryingly low level and much lower than the pre-lockdown level as only 33 per cent said that their food consumption was sufficient in the unlock phase.
But a little more reassuringly, the frequency of meals per day has almost returned to pre-lockdown levels. Around 89 per cent of the revisited workers reported that they were having two meals a day during unlock, which had fallen to 67 per cent during the lockdown from 94 per cent before the lockdown.
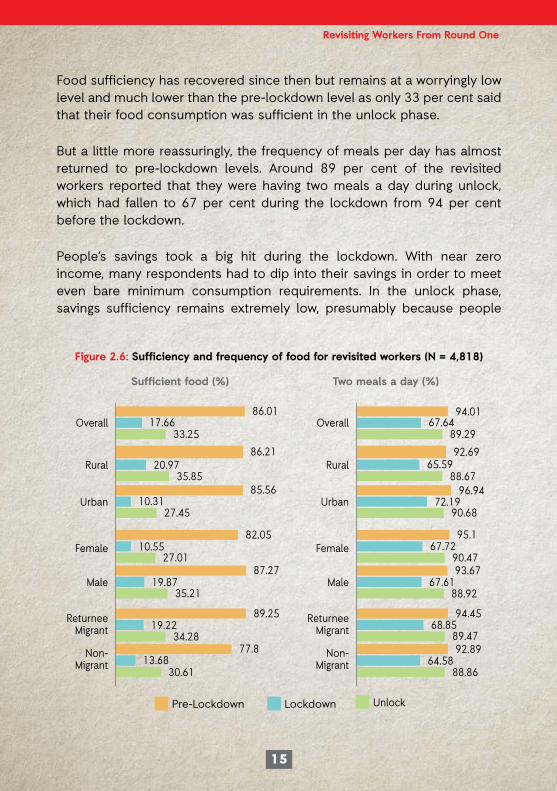
People’s savings took a big hit during the lockdown. With near zero income, many respondents had to dip into their savings in order to meet even bare minimum consumption requirements. In the unlock phase, savings sufficiency remains extremely low, presumably because people
Rural Rural
Female Female
Male Male
ReturneeMigrant
ReturneeMigrant
Non-Migrant
Non-Migrant
Urban Urban
Overall Overall94.0186.01
67.6417.6689.29
92.69
33.25
86.2120.97
35.8585.56
10.3127.45
82.05
87.27
10.5527.01
19.8735.21
89.2519.22
34.2877.8
13.6830.61
65.5988.67
96.9472.19
90.68
95.167.72
90.4793.67
67.6188.92
94.4568.85
89.4792.89
64.5888.86
Figure 2.6: Sufficiency and frequency of food for revisited workers (N = 4,818)
Sufficient food (%) Two meals a day (%)
Unlock Lockdown Pre-Lockdown
Revisiting Workers From Round One
16
have had to resume or increase expenditure on healthcare, transport, and sanitation, while their incomes have not recovered substantially. More than 46 per cent of the revisited respondents had sufficient savings prior to the lockdown, which fell to only four per cent during the lockdown and has increased marginally to six per cent in unlock (Figure 2.7). Savings sufficiency was reportedly lower among revisited workers in urban areas at four per cent compared to workers in rural areas at seven per cent. Women reported lower savings sufficiency at four per cent compared to men at 6.5 per cent in the unlock phase.
Mahesh Dhobi used to do marble fitting work in Bengaluru but lost his job due to the lockdown. Unable to return home for weeks because of the travel restrictions, Mahesh lost nearly all his savings on rent and other expenses. Once the trains started plying, he came back to his village in Karauli, Rajasthan. The financial condition of the family is dire. His father suffers from Tuberculosis and his treatment is costly. They do not own any land and Mahesh does not have any schooling or vocational training. Their only source of income currently is the intermittent MGNREGA work that his wife gets. His family is mainly
46.4
6
Figure 2.7: Sufficiency of savings for revisited workers (N = 4,818)
Sufficient savings (%)
4.02 6.
34
54.4
94.
84 7.36
28.6
62.
21 4.05
50.5
8
6.5
4.19
33.4
3.42 4.19
50.8
94.
22 6.22
35.1
83.
52 6.62
All India Rural Male ReturneeMigrant
Urban Female Non-Migrant
Unlock Lockdown Pre-Lockdown
Workers in the Time of COVID-19Round II of the National Study on Informal Workers

17
surviving on PDS and the take-home ration that his kids get at the local anganwadi centre.
With the persistently low wages and decline in savings, workers continue to heavily depend on loans. Almost 48 per cent of the revisited respondents had incurred debt during lockdown and around 42 per cent had incurred debt during unlock. Nearly 62 per cent of the respondents had incurred debt either during lockdown or during unlock or both.
As shown in Table 2.3, majority of the respondents who incurred debt had taken loans in the range of up to `5,000 and between `5,000 and `10,000. Among the reasons for taking loans, expenditure on food was the most prominent reason, followed by restarting livelihoods and expenditure on non-food consumption requirements such as transportation, healthcare, and electricity.
Revisiting Workers From Round One

Deb
t Ta
ken
Dur
ing
Unl
ock
Zer
o
(No D
ebt
take
n)
`1 t
o
`5,0
00
`5,0
01 t
o
`10,0
00
`10,0
01 t
o
`15,0
00
`15,0
01 t
o
`30,0
00
Abov
e `3
0,0
00
Ove
rall
Zero
(N
o D
ebt
Take
n)1,7
16
245
152
111
69
71
2,3
64
`1 to
`5,0
00
507
293
37
83
2850
`5,0
01 to
`10,0
00
241
131
224
55
19
6676
`10,0
01 to
`15,0
00
73
56
52
108
40
4333
`15,0
01 to
`30,0
00
46
28
35
18
64
23
214
Above
`30,0
00
20
13
39
940
94
Ove
rall
2603
766
503
309
204
146
4,5
31
Debt Taken during Lockdown
Table
2.3
: Am
oun
t of
loan
for
revi
site
d w
ork
ers
(N =
4,8
18)

Unemployment and UnderemploymentThe first few months of the unlock phase have been marked by low levels of employment and high levels of underemployment amongst informal workers.
In our sample of 16,961 workers, approximately 48 per cent of informal workers were unemployed and 42 per cent have resumed work part-time, working for fewer hours and receiving work occasionally. Only 10 per cent of workers reported working on a full-time basis.
In contrast to the findings of the first round of this survey which showed significantly higher unemployment in urban areas compared to rural areas during the lockdown, unemployment was higher in rural areas than in urban areas in the unlock phase. While 36 per cent of respondents in urban areas were unemployed, nearly 53 per cent of workers in rural areas were unemployed (Table3.1). Both part-time work and full-time work were more readily available to informal workers in urban areas than in rural areas. This was indicative of the dip in agricultural jobs post the farming season, lack of non-farm job opportunities, and inadequacy of job creation through MGNREGA in rural areas.
Amongst women workers in our sample, 46 per cent were unemployed, 41 per cent were working part-time, and a little over 12 per cent said that they were working full-time. For men, unemployment level was at 49 per cent, 42 per cent were working part-time, and only about nine per cent were working full-time. It is important to note that within the informal sector, recovery of livelihood was heavily contingent on the type of occupation that the worker was engaged in. For example, women were predominantly employed in domestic work, salt-pan work, and garment
Transitions in the World of Work3
CHAPTER

20
Table 3.1: Employment level during the unlock phase (N = 16,961)
Respondent Group
Number of Respon-dents
Unemployed (%)
Employed Part-Time/Occasionally
(%)
Employed Full Time
(%)
Overall 16,961 48.2 41.79 10.01
Location
Rural 12,240 52.78 38.59 8.64
Urban 4,721 36.33 50.12 13.56
Gender
Female 5,240 45.95 41.41 12.63
Male 9,084 48.66 42.49 8.85
Migration Status
Returnee Migrant 7,141 52.78 40.54 6.68
Non-Migrant 7,208 42.59 43.67 13.73
Social Groups
Scheduled Tribe 2,506 49 45.09 5.91
Scheduled Caste 5,800 48.31 40.91 10.78
Other Backward Classes
3,768 45.57 43.15 11.28
Others 2,166 48.61 39.43 11.96
Age
18 to 30 years old
5,245 53.1 36.85 10.05
30 to 45 years old
6,605 44.16 44.97 10.87
45 to 60 years old
2,903 43.96 46.82 9.22
Above 60 years 218 47.25 45.41 7.34
Workers in the Time of COVID-19Round II of the National Study on Informal Workers

21
work in our sample which have seen faster recovery than sectors like construction and factory-based manufacturing, where the majority of the men were engaged.
It was also apparent that migrant workers continue to bear the brunt of the sharp contraction and the slow recovery in livelihoods. As many as 53 per cent of returnee migrants stated that they were unemployed, with only about six per cent being able to work full-time. The situation was comparatively much better for non-migrant workers. Though 43 per cent of them were unemployed, 14 per cent of them said that they were working full-time. Also, around 44 per cent of non-migrants were working part-time compared to 40.5 per cent of returnee migrants.
Although there was not much difference in unemployment levels across social groups, workers from scheduled tribes seem to be the worst affected. Nearly half of the ST workers reported that they were unemployed, and their percentage in full-time work was the lowest at less than six per cent. They were also proportionately more likely to be in part-time work than the other social groups. Amongst scheduled castes, 48 per cent were unemployed, 41 per cent were working part-time, and around 11 per cent were working full-time; in case of other backward classes, 46 per cent were unemployed, 43 per cent were working part-time, and 11 per cent were working full-time; and for other groups, 49 per cent were unemployed, 39 per cent were working part-time, and 12 per cent were working full-time.
Respondent Group
Number of Respon-dents
Unemployed (%)
Employed Part-Time/Occasionally
(%)
Employed Full Time
(%)
Level of Education
Not Literate 4,372 51.84 41.69 6.46
Primary 4,697 42.17 47.72 10.11
Secondary 3,454 49.84 38.5 11.66
Higher Secondary 1,318 52.12 36.06 11.82
Graduate & above
508 53.32 22.55 24.13
Transitions in the World of Work

22
Ahsraf Khan Pathan’s family is dependent on seasonal agriculture on their small plot of land, approximately two-thirds of an acre. They also work as agricultural labour during harvest season but do not get much work for the rest of the year. Ashraf started migrating to Gujarat from his village in Kasganj, Uttar Pradesh to work in a brick kiln during off-season. When the lockdown was announced, he got stuck at the brick kiln for three months without any work and wages. He survived on his savings and on ration kits provided by a local NGO. Once the lockdown was lifted, he left for his village by train and then bus, spending over ` 4,000 to reach home. Ashraf looked for work in and around his village for many weeks but could not find anything. He then returned to Gujarat and got a job in a brick kiln on the outskirts of Ahmedabad through local contacts. Ashraf is not sure of how much he would be earning and how many days in a month he would be getting work as there is much less demand for bricks in the market due to the slowdown. He plans to move to Ahmedabad and look for daily wage work if his wages are not regular or sufficient at the brick kiln, but he does not see any point of returning to his village.
Significantly, unemployment level was the highest among young workers between the ages of 18 to 30 years at 53 per cent. Younger workers are increasingly entering the labour market in highly casualised informal jobs, and were therefore, more susceptible to be laid-off in response to economic shocks. At the same time, workers in this age group have reported relatively higher full-time employment at 10 per cent and the lowest level of part-time employment at 37 per cent. This could be due to a reluctance on their part to accept occasional or part-time work, especially at higher levels of education. Overall, incidence of part-time work was relatively much lower amongst graduate respondents at 22.5 per cent, despite the highest level of unemployment amongst them at more than 53 per cent compared to workers with lower levels of educational attainment. Only about six per cent of workers who were illiterate could engage in full-time work, which was notably lower than workers with higher levels of education.
Workers in the Time of COVID-19Round II of the National Study on Informal Workers
23
Differentiated levels of recovery
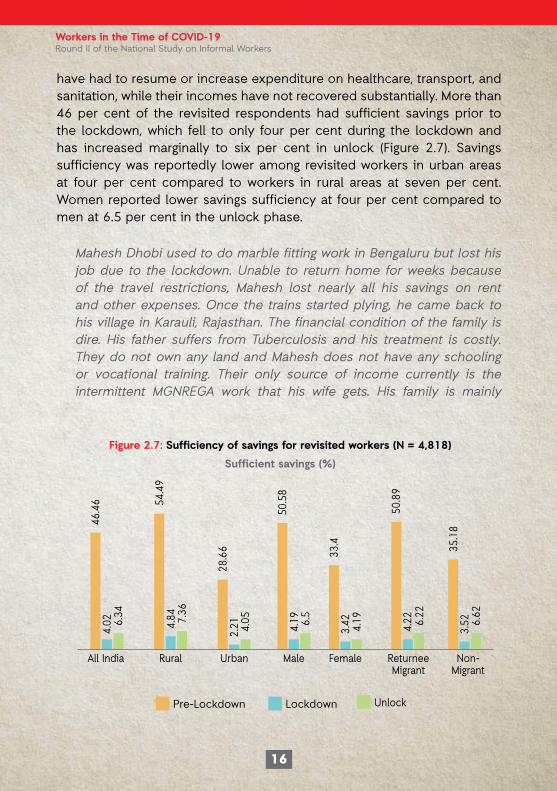
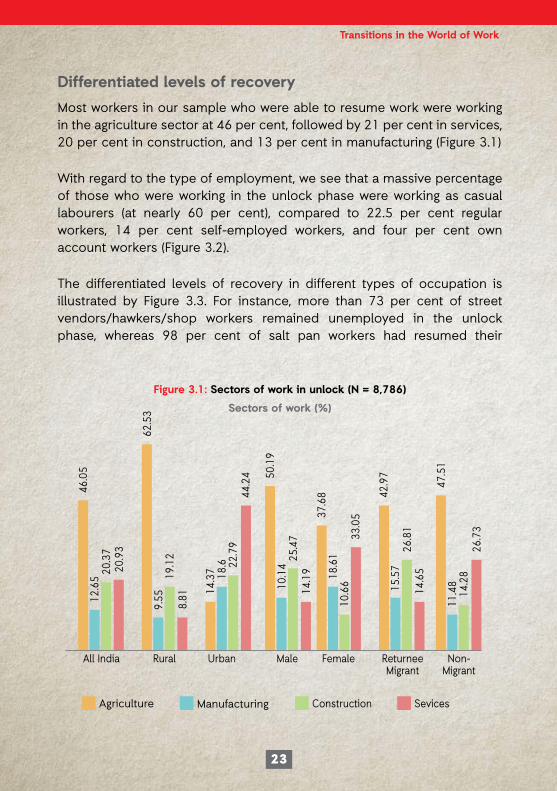
Most workers in our sample who were able to resume work were working in the agriculture sector at 46 per cent, followed by 21 per cent in services, 20 per cent in construction, and 13 per cent in manufacturing (Figure 3.1)
With regard to the type of employment, we see that a massive percentage of those who were working in the unlock phase were working as casual labourers (at nearly 60 per cent), compared to 22.5 per cent regular workers, 14 per cent self-employed workers, and four per cent own account workers (Figure 3.2).
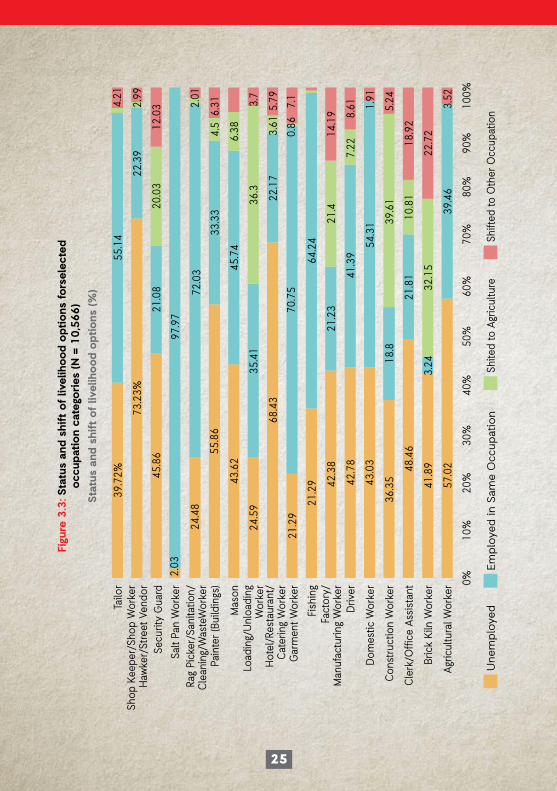
The differentiated levels of recovery in different types of occupation is illustrated by Figure 3.3. For instance, more than 73 per cent of street vendors/hawkers/shop workers remained unemployed in the unlock phase, whereas 98 per cent of salt pan workers had resumed their
46.0
5
Figure 3.1: Sectors of work in unlock (N = 8,786)
Sectors of work (%)
12.6
520
.37
62.5
39.
5519
.12
14.3
7 18.6 22
.79
50.1
9
25.4
710
.14
37.6
818
.61
10.6
6
42.9
715
.57
26.8
1
47.5
111
.48
14.2
826
.73
All India Rural Male ReturneeMigrant
Urban Female Non-Migrant
20.9
3
8.81
44.2
4
14.1
9
33.0
5
14.6
5
Construction Manufacturing Agriculture Sevices
Transitions in the World of Work

24
13.7
3Figure 3.2: Type of employment (N = 8,786)
Employment/work category (%)59
.86
22.5
7
16.0
459
.48
19.7
4
9.28
60.5
828
.01
13.9
2 19.0
662
.35
11.2
657
.66
28.5
7
13.0
264
.18
17.8
2
12.8
657
.59
26.6
32.
92
All India Rural Male ReturneeMigrant
Urban Female Non-Migrant
3.85 4.74
2.13 4.
67
2.51 4.
98
Regular Labour Casual Labour Self-Employed Own Account Workers
livelihood. One of the most essential but overlooked category of workers – those in sanitation, cleaning, and waste work - also has very low levels of unemployment of around 24 per cent.
Many workers shifted to an alternate source of livelihood considering their inability to resume the livelihood in which they were engaged prior to the lockdown. Among those who had to shift their source of livelihood, the more prominent categories of workers were of construction workers, manufacturing workers, loading/unloading workers, and brick kiln workers. And most of the workers who changed their livelihood shifted to agriculture.
Interestingly, we see a higher-than-average level of unemployment among those who worked as agricultural workers before the lockdown at 57 per cent. This can be attributed to returnee migrants and those who own agricultural land shifting to agricultural work in high numbers after the lockdown. Almost 25 per cent of returnee migrants have shifted to agriculture as a source of livelihood compared to less than 13 per cent non-migrants. Among those who own agricultural land, more than 29 per
Workers in the Time of COVID-19Round II of the National Study on Informal Workers
25
0%10
%20
%30
%40
%50
%60
%70
%80
%90
%10
0%
Figu
re 3
.3: S
tatu
s an
d s
hift
of
livel
ihood o
pti
ons
fors
elec
ted
occ
upat
ion
cate
gori
es (N
= 1
0,5
66)
Stat
us a
nd s
hift
of
livel
ihood o
pti
ons
(%
)
39.7
2%
73.2
3%22
.39
2.99
12.0
320
.03
21.0
845
.86
55.1
44.
21
2.03
97.9
7
24.4
8
43.6
245
.74
33.3
34.
56.
31
72.0
32.
01
6.38
3.7
36.3
35.4
124
.59
68.4
322
.17
3.61
5.79 7.1
0.86
70.7
521
.29
21.2
9 42.3
8
42.7
8 48.4
6
41.8
9
57.0
239
.46
3.52
3.24
32.1
522
.72
21.8
110
.81
18.9
2
18.8
39.6
15.
24
54.3
11.
91
41.3
97.
228.
61
21.2
321
.414
.19
64.2
4
Tailo
r
Secu
rity
Gua
rd
Load
ing/
Unl
oadi
ng
Wor
ker
Hot
el/R
esta
uran
t/C
ater
ing
Wor
ker
Salt
Pan
Wor
ker
Pain
ter
(Bui
ldin
gs)
Mas
on
Gar
men
t Wor
ker
Fish
ing
Fact
ory/
M
anuf
actu
ring
Wor
ker
Driv
er
Dom
estic
Wor
ker
Con
stru
ctio
n W
orke
r
Cle
rk/O
ffice
Ass
ista
nt
Bric
k Ki
ln W
orke
r
Agric
ultu
ral W
orke
r
Shop
Kee
per/
Shop
Wor
ker
Haw
ker/
Stre
et V
endo
r
Rag
Pick
er/S
anita
tion/
Cle
anin
g/W
aste
Wor
ker
Shi
ted
to A
gric
ultu
re E
mplo
yed in
Sam
e O
ccup
atio
n U
nem
plo
yed
Shi
fted
to O
ther
Occ
upat
ion
55.8
6
43.0
3
36.3
5

26
cent have shifted to agricultural work compared to 11 per cent of those who do not own agricultural land. These ‘new’ agricultural workers have in effect displaced both local landless agricultural workers and workers who used to migrate for agricultural jobs before the lockdown.
Women and Quality of Work and WagesIn order to take measure of the specific barriers to women’s unemployment during the pandemic, we asked all respondents whether any of their female family members who were working before the lockdown were unable to resume work during unlock. Nearly 28 per cent of respondents who had had earning female members in the family before lockdown, said that one or more of them had not been able to resume work since the process of unlock began. Most respondents shared more than one reason for this being the case, but the most prominent reason was unavailability of work, followed by poor health, lack of transport, not having been called back to work due to their employer’s fear of the disease, and increased burden of care work (Figure 3.4).
2.2
5
9.75
18.66
19.45
31.57
68.77
Other Reasons
Unable to KeepLong Hours of Work
Increased Burden of Care Work
Empolyer Didn’t Call Back Due to Fear of Disease
Lack of Transport
Poor Health (COVID-19-19)/Other
Unavailability of Work
Figure 3.4: Reasons for women family members being unable to resume work (N = 2,360)
Why women couldn’t resume paid work? (%)
Workers in the Time of COVID-19Round II of the National Study on Informal Workers

27
Several of those who have been able to resume working not only have to contend with infrequent availability of work or fewer hours of work, but also poor quality of jobs and low wages.
In our sample, only about eight per cent of workers had a written contract, including 16 per cent of regular workers and five per cent of casual workers (Figure 3.5). Furthermore, their access to rights and protections was extremely poor. Although this was the case across the board, the percentage of regular workers with basic rights at work was consistently higher than casual workers. For example, around 71 per cent of regular workers worked for eight hours a day with a 30-minute break as compared to only 50 per cent casual workers. More than 35 per cent of regular workers got one day of paid leave per week but only 19 per cent of casual workers did. About 34 per cent of regular workers reportedly got minimum wages as compared to 24 per cent of casual workers.
Rights at Work for Unorganised Sector (As Put Forward by NCEUS, 2007)
Figure 3.5: Disparity in quality of work between casual and regular workers, based on rights at work for unorganised sector, as put forward by the
Arjun Sengupta Commission (NCEUS) in 2007. (N = 7,242)
Disparity in quality of work between casual and regular workers
Wor
k C
ontr
act
8 H
ours
Wor
k an
d 30
Min
s.Re
st
One
Pai
d D
ay o
fRe
st E
very
Wee
k
Min
imum
Wag
es
Equa
l Wag
es fo
r Eq
ual W
ork
Pena
lty fo
r D
effe
red
Wag
es (E
mpl
oyed
)
Fine
for
Wag
esD
educ
tion
(Em
ploy
ed)
Righ
t to
Org
anis
e
No
Dis
crim
inat
ion
at W
ork
Plac
e
Safe
ty a
ndC
ompe
nsat
ion
Prot
ectio
n fro
m
Sexu
al H
arra
smen
t
Chi
ld C
are
Feci
litie
s
CO
VID
-19
Prec
autio
ns
100
20304050607080
% o
f Res
pond
ents
Hav
ing
Such
Rig
hts
Regular Casual
5.23
15.9
7
51.8
771
.5
18.9
6 35.4
1
24.8
5 34.2
3
18.9
619
.26
4.99 5.75
5.98
6.28
17.3
522
.8
19.1
6 29.8
3
10.4
5 25.7
2
15.8
1 27.4
8
6.16 11
.74
36.8
658
.72
Transitions in the World of Work

28
Around 43 per cent of all respondents had some sort of precaution against COVID-19 at their place of work, but their access to other safety measures including protection from sexual harassment was abysmally low.
Wages had remained concerningly low in the unlock phase. Around 24 per cent of respondents reported receiving zero wages, while 19 per cent were earning less than `2,000 per month, 30 per cent were earning between `2,000 and `5,000 per month, and another 19 per cent were earning between `5,000 and `10,000 per month (Figure 3.6). Only eightper cent of the respondents reported earning more than `10,000 per month.
On an average, wages in rural areas were lower than wages in urban areas. Around 29 per cent of respondents in rural areas were receiving wages between `2,000 to `5,000 and 18 per cent between `5,000 to `10,000 as compared to 30 per cent and 23 per cent workers in urban areas, respectively. Similarly, the wages received by returnee migrants were lower compared to those received by non-migrant workers.
Afroz lives with her two sons and a daughter in Ahmedabad, Gujarat. She migrated there from a village near Kanpur, Uttar Pradesh with her husband, who died shortly after due to Chikungunya. She was doing packaging work for a factory before the lockdown and was able to earn `280 per day. However, she lost her job during the lockdown and spent
Figure 3.6: Average monthly wages in the unlock phase (N = 16,961)
Monthly Wages/Income in unlock (%)
24.2
719
.36
29.5
4
23.9
522
.5 29.2
5
25.1
11.2
130
.31
30.1
4
26.0
622
17.7
916
.83
33.4
2
Overall Rural ReturneeMigrant
Urban Non-Migrant
19.3
8
17.9
2
23.1
5
14.7
23.8
9
`2,001 to 5,000 `1 to 2,000 Zero `5,000 to 10,000
Workers in the Time of COVID-19Round II of the National Study on Informal Workers

29
almost all her savings. She even had to sell her mobile phone. When the lockdown was lifted, Afroz struggled to find work which would pay her enough. She was offered work in a factory at `125 per day, out of which she would have to spend `50 on transport. So, she turned it down. She is now getting home-based work from a local dress factory for which she earns`50 to `70 per day. She and her children have also taken up finishing work on plastic ornaments which fetches them an additional `15 to `20 per day. The financial insecurity has taken a toll on Afroz, who is anxious and depressed about not being able to pay the house rent, electricity bill, and her children’s fees.
There was also a huge disparity between wages received by women and men in the same occupational category. Table 3.2 shows the gender-wise difference in monthly wages in the unlock phase in the most widely reported occupational categories. As was evident, across all occupations, men have reported receiving higher wages than women.
Occupation Category Gender
Proportion of Each Gender
Less than `2,000
`2,000 to `5,000
More than `5,000
Agricultural Worker
Female 28% 22% 50% 28%
Male 72% 17% 53% 30%
Clerk/Office Assistant
Female 34% 14% 17% 69%
Male 66% 4% 13% 82%
Construction Worker
Female 21% 16% 38% 46%
Male 79% 11% 34% 55%
Domestic Worker
Female 99% 22% 56% 22%
Male 1%
Table 3.2: Wage disparity between male and female workers in certain occupations. (N = 6,223)
Transitions in the World of Work

30
Occupation Category Gender
Proportion of Each Gender
Less than `2,000
`2,000 to `5,000
More than `5,000
DriverFemale 0%
Male 100% 15% 28% 57%
Manufacturing Worker
Female 31% 15% 34% 51%
Male 69% 10% 26% 64%
Fish WorkerFemale 2%
Male 98% 16% 20% 64%
Garment Worker
Female 72% 21% 45% 34%
Male 28% 11% 40% 49%
Hotel/Restaurant Worker
Female 59% 23% 26% 51%
Male 41% 21% 17% 62%
Loading/ Unloading Worker
Female 34% 18% 46% 36%
Male 66% 6% 19% 75%
Sanitation/ Cleaning Worker
Female 60% 18% 33% 49%
Male 40% 12% 17% 71%
Salt Pan WorkerFemale 100% 2% 61% 37%
Male 0%
Shopworker/Street Vendor/Hawker
Female 44% 39% 32% 29%
Male 56% 15% 34% 51%
TailorFemale 64% 24% 47% 29%
Male 36% 29% 21% 50%
Workers in the Time of COVID-19Round II of the National Study on Informal Workers

31
Loading and unloading workers have the highest level of wage disparity, with 75 per cent of men earning more than `5,000 per month compared to less than 36 per cent of their female counterparts. A similar trend was visible in construction work, in the hotel/restaurant business, and among shop workers/hawkers/street vendors. Even in occupations like tailoring, sanitation and cleaning work, or in the garment industry, where women outnumber men in our sample, men earn far more than women. Such disparity was caused by both women being concentrated in lower paid tasks as well as being paid less than men for doing the same work.
In low-income occupations like domestic work and salt pan work, where 60 per cent to 80 per cent of workers earn less than `5,000, male workers were hard to be found.
Transitions in the World of Work
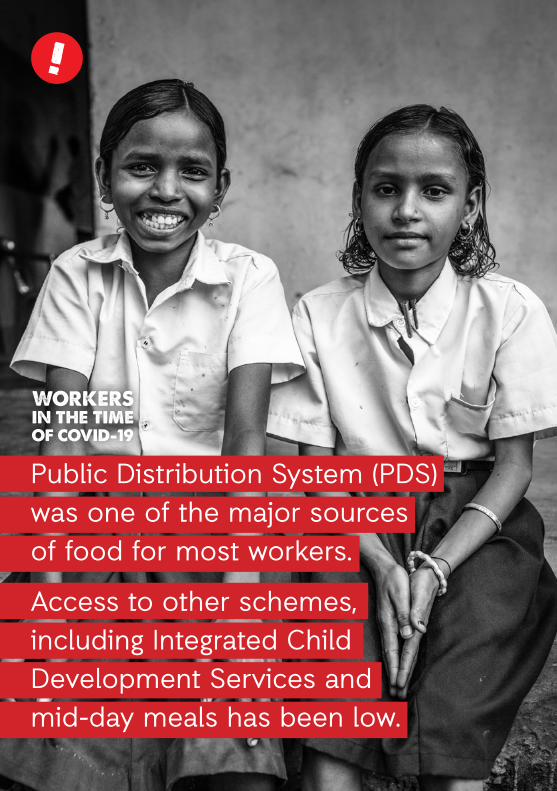
Public Distribution System (PDS) was one of the major sources of food for most workers.
Access to other schemes, including Integrated Child Development Services and mid-day meals has been low.
The slow recovery in livelihoods and wages was pushing workers into a vortex of precarity and deprivation. In order to survive the pandemic and the economic crisis, workers were resorting to dipping into their savings, borrowing, and reducing their consumption.
Consumption and Expenditure When it comes to basic consumption, only about 32 per cent of workers said that they had sufficient food, whereas 68 per cent said that they did not have sufficient food (Figure 4.1). Around 81 per cent of workers said that they were having two meals in a day. This means that an alarmingly high 19 per cent of workers were unable to manage even two meals in a day in the first few months of the unlock phase.
People also reported low levels of water sufficiency. Around 59 per cent of workers said that they had sufficient water, with 41 per cent of workers stating that they did not have sufficient water.
Overall, women workers reported noticeably lower levels of food and water sufficiency than men. Similarly, people in rural areas reported lower levels of food and water sufficiency than people in urban areas, although the difference was marginal.
Sathya lives in Madurai, Tamil Nadu. She started working in a garment factory after she lost her husband who has committed suicide. He had accumulated a lot of debt from moneylenders, which Sathya has been slowly paying off since his death. She used to work from 8.30 in the morning till about 5.30 in the evening, with only one break at lunchtime and got paid `6,000 per month. She and her co-workers were told to complete a target of 400 to 600 pieces per day, and if they failed to do
Increasing Precarity of Informal Workers4
CHAPTER

34
so, they were told to leave. When the lockdown was announced, the factory had to temporarily shut down. Sathya was paid only `3,000 as salary. Moreover, she was told that that amount would be deducted from her Diwali bonus. This has disrupted her planned loan repayments and she is being harassed by the people her husband owed money to. In the past few months, Sathya has had to compromise a lot on her daily consumption, often going without meals in order to feed her children and save some money.
Figure 4.2 shows people’s monthly expenditure on food and non-food items. Spending on food was comparatively higher, with more than 37 per cent of workers spending between `2,000 to `5,000 and 28 per cent spending between `1,000 to `2,000 on food. On the other hand, around 29 per cent of respondents were spending less than `1,000 and 32 per cent were spending between `1,000 to `2,000 on non-food items per month.
It is important to take note of the average monthly expenditure, with most workers spending at least `1,000 and up to `5,000 on either food or non-food items or both, where nearly 73 per cent of the workers in our sample reported earning less than `5,000 per month during the unlock. The high level of expenditure relative to people’s wages reinforces their dependence on savings and loans.
Figure 4.1: Food sufficiency, meal frequency and water sufficiency in unlock (N = 16,961)
Overall Overall Overall
Rural Rural Rural
Urban Urban UrbanReturnee
MigrantReturnee
MigrantReturnee
MigrantNon-Migrant Non-Migrant Non-Migrant
Female Female Female
Male Male Male
Two meals a day (%) Sufficient water (%)Sufficient food (%)
32.06
31.85
32.60
32.20
31.89
28.78
81.02 59.23
79.78 58.34
84.24 61.53
81 59.87
81.04 58.98
80 56.15
83.6 62.9133.30
Workers in the Time of COVID-19Round II of the National Study on Informal Workers

35
If we compare the change in people’s expenditure on non-food items during the unlock phase to before the pandemic, we find that people have had to substantially increase their spending on sanitation and other precautionary measures, health, electricity, and transportation. More than 50 per cent of workers said that their expenses on these items had increased (Figure 4.3). The expenditure on education and online education increased by 36 per cent and 40.5 per cent, respectively, although there might be some overlap in these categories. Around 43 per cent of workers reported an increase in spending on repaying their loans.
4.95 8.
57
17.7
529
.26
28.2
7 32.3
1 37.0
620
.01
10.4
77.
71
1.5 2.14
Zero `1 to 1,000
`1,001 to 2,000
`2,001 to 5,000
`5,001 to 10,000
Above `10,000
Non-Food Food
Figure 4.2: Monthly expenditure in unlock (N = 16,961)
Monthly expenditure levels in unlock (%)
35.02
55.4
37.38
7.22 13.71 10.87 5.97 19.1 6.54 7.73
50.07
36.21
48.62
40.51
38.66 27.6230.3
53.2863.16
55.37
48.89
43.38
Decreased No Change Increased
Figure 4.3: Change in expenditure on selected non-food items relative to Pre-COVID-19 level (N = 16,961)
Expenditure relative to Pre-COVID-19 level
HealthExpense
EducationExpense
OnlineEducationExpense
Electricity Bill
Transport Expense
SanitationPrecaution
Loan Interst
Payment
Increasing Precarity of Informal Workers

36
Savings Sufficiency and DebtWhen asked about their savings, only 12 per cent of workers said that their savings were sufficient for them (Figure 4.4). More than 46 per cent said that their savings were insufficient, and 41.5 per cent said that their savings were barely sufficient.
There was a notable difference in savings sufficiency in urban and rural areas. While 41 per cent of workers each in urban areas and in rural areas said that they had barely sufficient savings, more than half of the workers in urban areas said that their savings were insufficient as compared to 44 per cent of workers in rural areas. The percentage of workers in urban areas who said that their savings were sufficient was seven per cent, less than half of the percentage of workers in rural areas who stated that their savings were sufficient.
Given their low wages and rapidly diminishing savings, people were extremely dependent on loans. A little over 39 per cent of workers reported that they had borrowed money in the unlock phase (Figure 4.5). The incidence of borrowing was relatively much higher in urban areas than in rural areas at 47 per cent and 36 per cent, respectively, presumably because of the higher cost of living and lower levels of savings.
There was also a significant difference between incidence of borrowing amongst respondents based on their gender and their migration status.
Male Urban Rural OverallReturneeMigrant
Female Non-Migrant
42.9
243
.17
13.9
1
42.9
246
.57
11.4
3
39.5
746
.93
13.5
41.2
1
41.5
43.6
211
.12
51.4
57.
33
41.6
44.3
14.1
46.2
912
.22
Figure 4,4: Savings sufficiency in the unlock phase (N = 16,961)
Savings sufficiency in unlock (%)
Sufficient Insufficient Barely
Workers in the Time of COVID-19Round II of the National Study on Informal Workers

37
34.46
Urban Rural OverallReturneeMigrant
Male Female Non-Migrant
45.6141.44
35.6 36.439.38
47.11
Figure 4.5: Incidence of debt in unlock (N = 16,961)
Incidence of debt in unlock (%)
Over 45 per cent of women reported taking loans during unlock compared to 34 per cent of men, which could be due to greater responsibility for household expenditure falling on women. Around 41 per cent of non-migrant workers reported having taken loans, while 35 per cent of returnee migrants said so.
Many people have reported borrowing for more than one type of expenditure, and the major reasons for taking loans were related to meeting basic consumption needs including food, healthcare, and restarting their livelihoods after the lockdown got over. Over 75 per cent of respondents reported having taken loans to meet their food requirement, followed by 35 per cent for healthcare, 29 per cent for restarting livelihoods, 25 per cent for paying electricity bills, 16 per cent for transportation costs, and 14 per cent for educational fees (Figure 4.6).
People also reported borrowing from multiple sources. The most common source for loans were people’s friends, relatives, and neighbours, as more than 62 per cent of respondents said that they had borrowed from their immediate social circle (Figure 4.7). Other prominent sources of loans included traditional money lenders for about 31 per cent of workers and self-help groups for about 20 per cent of respondents. Around 11 per cent of workers said that they had borrowed money from non-banking financial institutions. Very few workers, around seven per cent turned to formal banking institutions for loans, which shows that many informal workers were still outside the purview of the formal banking system and were unable to get credit for the kinds of expenditure that they have to incur in the unlock phase.
Increasing Precarity of Informal Workers

38
Funerals
Marriage
Restoring DamagedProperties
0 10 20 30 40 50 60 70 80
1.71
3.7
4.87
6.03
9.61
9.85
11.26
11.66
14.43
15.66
25.45
29.11
35.02
75.07
Preventive andSanitary Measures
Online Learning Devices
Rent
Repay Loan/Interest
Agricultural Inputs
Education Fees
Transportation
Electricity Bills
Health Care
Food Consumption
Restaring Livelihoods
Figure 4.6: Purpose of debt in unlock (N = 6,679)
Purpose of Debt in Unlock
40 50 60 70
62.6
0 10 20 30
5.55
6.08
6.81
8.03
8.37
10.65
20.21
30.84
Landlords
Employers
Co-Workers
Contractor
Self-Help Groups
Banking Institutions
Non-Banking Financial Institutions
TraditionalMoney Lenders
Friends/Relatives/Neighbours
Figure 4.7: Source of debt in unlock (N = 6,679)
Source of Debt in Unlock
% of respondents stating said source
Workers in the Time of COVID-19Round II of the National Study on Informal Workers

For most informal workers, their capacity to earn is inextricably linked to their mobility, and hence the restrictions on movement imposed by the lockdown extracted a huge cost in the form of their livelihoods and incomes. Many were pushed to the brink of starvation and destitution but there was little public assistance forthcoming in this emergency.
The Finance Minister announced the Prime Minister Garib Kalyan Yojana (PMGKY), a Rs 1.7 lakh crore welfare package for low-income households and people living in poverty, on March 26th, 2020, a few days into the lockdown.1 Among other measures, the PMGKY provided for transfer of Rs 500 each to women Jan Dhan account holders for three months and for ex-gratia payment of Rs 1,000 to pension-receiving senior citizens, widows, and persons with disabilities.
The package also introduced the PM Garib Kalyan Ann Yojana (PMGKAY), under which 80 crore ration card holders were provided an additional five kilograms of wheat or rice and one kilogram of pulses for free for three months through the Public Distribution System (PDS).
Further, the Union Government directed State Governments to use the Building and Construction Workers (BOCW) Welfare Funds to provide financial relief to construction workers registered under these boards. The average daily wage rate for MGNREGA was also increased by Rs 20 from Rs 182 to Rs 202.
1. “Finance Minister announces Rs 1.70 Lakh Crore relief package under Pradhan Mantri Garib Kalyan Yojana for the poor to help them fight the battle against Corona Virus”, GOI Press Release, March 26, 2020. Available at: https://pib.gov.in/PressReleaseIframePage.aspx?PRID=1608345
Status of Social Security5
CHAPTER

40
However, the package left many sections of informal workers unsupported, especially migrant workers who were amongst the hardest hit. The quantum of cash transfers and increase in MGNREGA wages were also extremely inadequate considering the magnitude of wage losses reported. Moreover, the implementation of the schemes was beset with challenges of low enrolment and poor delivery, which often lead to the exclusion of the most vulnerable and marginalised from social protection schemes.
Amidst sustained criticism, the Union Government announced the Aatma Nirbhar Bharat Abhiyan on 12th May 2020, under which the free food grain scheme was extended to migrant workers without ration cards for two months.2 But State Governments ran into roadblocks in identifying and reaching out to eligible migrant workers, and the scheme remained underutilised.3 The Union Government then had to extend the scheme until August so that the food grains could be distributed to the beneficiaries.
When we conducted the first round of our survey between 14th May and 22nd May 2020, only 44 per cent of the migrant workers reported that they were able to access rations under PDS as compared to 60 per cent of non-migrant workers in the sample.
On 30th June, the Prime Minister announced the extension of the free food grains scheme under the PMGKAY till November 2020.4
The PDS and MGNREGA have thus far formed the backbone of protection for informal workers, ensuring a modicum of food security and employment security, respectively. Both the Union and State Governments have relied
2. Summary of announcements: Aatma Nirbhar Bharat Abhiyaan, PRS Legislative Research, Available at: https://www.prsindia.org/report-summaries/summary-announcements-aatma-nirbhar-bharat-abhiyaan
3. “Deadline for distribution of free food grains extended till August 31st”, The Hindu, July 09, 2020. https://www.thehindu.com/news/national/deadline-for-distribution-of-free-food-grains-extended-till-august-31/article32035840.ece
4. “PM Extends Free Ration Scheme till Nov: Experts Cite Food Surplus, Cloud Remains Over Migrants”, the Wire, June 30, 2020. https://thewire.in/government/modi-speech-china-free-ration-garib-kalyan-november
Workers in the Time of COVID-19Round II of the National Study on Informal Workers

41
on these schemes to mitigate the costs of the lockdown, despite the shortcomings mentioned above.
Therefore, we focused on these two schemes in our interviews. We also asked workers whether they were able to access work under the PM Garib Kalyan Rozgar Yojana (PMGKRY). But among the 5,295 respondents from the six eligible states, only 257 or around five per cent responded that they had sought work under the scheme, out of which 36 had received work. These low numbers may be due to an ignorance about the scheme on the ground or misattribution to another scheme such as MGNREGA.
Additionally, we asked workers about their access to food through the ICDS and mid-day meal schemes, which play an important role in ensuring food security for children and women. Though schools and anganwadi centres were shut down when the pandemic broke out, the Supreme Court on 19th March had directed states to come up with steps to ensure that access to nutritional food under the schemes was not disrupted.5
Although these schemes are national level schemes funded majorly by the Union Government, the task of implementation falls overwhelmingly to State Governments. We, therefore, see considerable variation in people’s access to the schemes in different states. In general, states in the southern and eastern parts of the country seem to outperform their northern and central counterparts. We also see rural areas performing better than urban areas, which highlights the neglect in building an effective social security infrastructure accessible to informal workers and migrant workers in cities. In our sample, returnee migrants have consistently had lower access to welfare schemes as compared to the non-migrant population, but the gap has notably dropped from what it was during the lockdown.
Access to Work Under MGNREGA Around 19 per cent of our sample or 3,325 respondents sought work under MGNREGA. In states like Himachal Pradesh, Punjab, and Manipur, the
5. “COVID-19: Ensure supply of midday meals amid closure, says SC”, The Economic Times, March 19, 2020. https://economictimes.indiatimes.com/news/politics-and-nation/ensure-supply-of-midday-meals-amid-closure-sc/articleshow/74699626.cms
Status of Social Security

42
demand for work was quite high, at 84 per cent, 65 per cent, and 53 per cent of respondents, respectively. In contrast, only about 10 per cent of respondents in West Bengal, Assam, Gujarat, and Karnataka sought work under MGNREGA.
There was a sizeable gap between the demand for work and the provision of work. Only 2,472 out of the 3,325 respondents who demanded work, that is less than 75 per cent, got at least one day of work. One of the worst performers among all states was Bihar, where 263 respondents sought work but only 14 people got work.
There was also a noteworthy gap between access to work under MGNREGA for returnee migrants and non-migrant workers. While similar numbers of returnee migrants and non-migrants demanded work at 17 per cent and 18 per cent, respectively, 29 per cent of non-migrants received work compared to 15 per cent of returnee migrants.
Figure 5.1 plots the average number of days of work that people got along with the average daily wage that they received. The horizontal axis shows the average number of days of work received, the vertical axis shows the average daily wage in INR, and the size of the bubble represents the number of respondents from each State who got work through MGNREGA.
The average number of days of work received for all respondents who sought work under the scheme was just above 21 days and the average daily wage was Rs 202, which was the national average daily wage. These two figures have been represented by the two blue lines in the graph above.
Figure 5.1 also illustrates the disparity between different states in terms of number of workdays generated and wages. We can see that in states like Andhra Pradesh and Telangana, the average number of workdays received by workers was high, but the average wage received was low. On the other hand, for states like Punjab and Haryana, the average days of work people got was low, but average wage was higher. Odisha and Karnataka have outperformed the other states on both parameters.
Workers in the Time of COVID-19Round II of the National Study on Informal Workers

Figu
re 5
.1: A
vera
ge d
ays
of
work
got
and a
vera
ge d
aily
wag
e re
ceiv
ed u
nder
MG
NREG
A d
urin
g lo
ckdow
n. (N
= 3
,082)
NREG
S av
erag
e day
s of
work
got
v/s
aver
age
dai
ly w
age
Biha
r
Mah
aras
htra
Punj
ab
Mad
hya
Prad
esh
Wes
t Ben
gal
Assa
mU
ttar
Pra
desh
Him
acha
l Pr
ades
hM
anip
urRa
jast
han
Har
yana
Jhar
khan
d
Guj
arat
Tam
il N
adu
Andh
ra P
rade
sh
Odi
sha
Karn
atak
a
Tela
ngan
a
0-1
010
2030
4050
6070
0010
0
120
140
160
180
200
220
240
260
280
300
Aver
age
Num
ber
of D
ays
of W
ork
Got
Average Daily Wage in `

44
It is also important to take note of the difference in average wage received across genders. The average wages received by women who got work under MGNREGA was Rs 189 compared to the average wage of Rs 204 received by men.
PDS and Food SecurityOver 85 per cent of our respondents said that PDS has been one of their major sources of food in the unlock phase, with nearly 12 per cent respondents stating that it was their only source of food.
Yashodha is an agricultural worker in Tiruppur, Tamil Nadu. She was a bonded labour in a private coconut farm when she was young. After her husband’s death, she has struggled to survive on her meagre wages. She has been taking loans from self-help groups, microfinance institutions, and private money lenders to pay off older debts, and is now indebted to the sum of `1,00,000. During the lockdown, she was without any source of livelihood for more than forty-five days. Since the lockdown was lifted, she has been unable to get regular work due to her advanced age. Her lower caste and gender further disadvantage her in job opportunities. She has had to depend almost entirely upon her neighbours and PDS for food. Her only sources of income have been irregular MGNREGA work and the monetary support which was provided by the State Government for two months.
Around 88 per cent of the respondents in our sample possessed a ration card and 16 per cent had an Antyodaya Anna Yojana Card (Figures 5.2 and 5.3).
More than 78 per cent of respondents could access the free food grains provided under the PMGKAY (Figure 5.4). There was significant difference in access based on location and migration status, however. Over 82 per cent respondents in rural areas could access ration under the scheme, compared to 69 per cent of those based in urban areas. Amongst non-migrants, over 81 per cent could access it compared to 77 per cent of returnee migrants.
Workers in the Time of COVID-19Round II of the National Study on Informal Workers

45
Figure 5.2: Possession of ration cards (N = 16,961)
Ration Card (%)
UrbanRuralOverall ReturneeMigrant
Non-Migrant
87.86
91.29
78.97
84.43
91.95
Figure 5.3: Possession of AAY cards (N = 16,961)
AAY Card (%)
UrbanRuralOverall ReturneeMigrant
Non-Migrant
15.78
17.79
10.89
18.72
12.86
There was also considerable disparity among states when it comes to the respondents’ access to free food grains through the PDS. While in Andhra Pradesh, Odisha, West Bengal, and Assam more than 87 per cent of the respondents could access rations, in Manipur, Rajasthan, Delhi, and Punjab less than 55 per cent respondents reported access.
Among workers who could not access PMGKAY, 41 per cent could not do so because they did not have ration cards, 12 per cent did not have ration cards for the location they were in during the unlock phase, and around 25 per cent said that they were unaware of the scheme.
Status of Social Security

46
Coverage under ICDS and Mid-Day Meal Enrolment in both ICDS and mid-day meal scheme was relatively low. Approximately 42 per cent of those workers who have children below six years of age have enrolled in ICDS, while a little over 49 per cent of those who have children between the ages of six and 14 years have enrolled them in public schools.
In terms of access, around 69 per cent of those enrolled under ICDS could access it since the unlock process started and 73 per cent could access mid-day meals (Figures 5.5 and 5.6). In case of both schemes, respondents in rural areas were more likely to be able to access them.
Again, one can see huge differences among states when it comes to both enrolment and access to ICDS and mid-day meal schemes. Respondents in Telangana, West Bengal, Haryana, and Odisha reported both high enrolment and access. In Uttar Pradesh, Bihar, Rajasthan, Punjab, Delhi, and Himachal Pradesh, access was low with varying levels of enrolment. Figures 5.7 and 5.8 provide a better understanding of the variation.
The major reason for non-access to ICDS and mid-day meals was the closure of ICDS/Anganwadi centres (for 84 per cent of respondents) or
UrbanRuralOverall ReturneeMigrant
Non-Migrant
81.7
76.91
69.29
82.66
78.94
Figure 5.4: Access to food rations under PMGKAY (N = 16,961)
Access to free food grains (%)
Workers in the Time of COVID-19Round II of the National Study on Informal Workers

47
Urban
Urban
Rural
Rural
Overall
Overall
ReturneeMigrant
ReturneeMigrant
Non-Migrant
Non-Migrant
68.98
73.13
69.85
64.9766.18
77.88
Figure 5,5: Access to ICDS (N = 4,845)
Access to ICDS (%)
Figure 5.6: Access to mid-day meal scheme (N=6,152)
Access to MDM (%)77.57
60
76.1868.07
public schools (for 32 per cent of respondents). Other reasons included migration of people from where they were enrolled in the schemes to their native places, lack of awareness that the schemes were running over the past few months, and denial by officials.
Access to Public HealthcareThe pandemic has put immense stress on the already weak healthcare system of the country, particularly on the public health infrastructure. With the low numbers of hospital beds and health workers per capita, the healthcare system has run the risk of being completely overwhelmed due to COVID-19-related admissions numerous times since the pandemic started, especially in densely populated urban areas. Meanwhile, care for chronic and other diseases and provision of public health services were being neglected.
Status of Social Security

48
Tamil Nadu
ManipurUttar PradeshDelhi
Punjab
Rajasthan
Andhra PradeshKarnataka
West BengalAssam
Telengana
Haryana
Gujarat
Madhya Pradesh
Bihar
Himachal Pradesh
0 10 20 30 40 50 60 70 8010
20
40
60
80
100
120
Enrolment in ICDS/Anganwadi Centres (in %)
Acc
ess
to IC
DS
(in
%)
Maharashtra
Odisha
Jharkhand
Figure 5.7: State level variation in ICDS enrolment and access (N = 11,641)
ICDS Enrolment and Access
Figure 5.8: State level variation in MDM enrolment and access (N = 12,427)
Mid-Day Meal: Enrolment and Access
0 0 20 30 40 50 60 70 80
Himachal Pradesh
ManipurDelhi
Punjab
KarnatakaMadhya PradeshTamil
NaduMaharashtra
BiharUttar Pradesh
Assam
Andhra Pradesh
Jharkhand
Telangana
Haryana
Odisha
Bengal
Gujarat
Rajasthan
20
30
40
50
60
70
80
90
100
110
120
Acc
ess
to D
aily
Mid
-day
Mea
l (in
%)
Enrolment in Public Schools (in %)
Workers in the Time of COVID-19Round II of the National Study on Informal Workers

49
During the unlock phase, approximately 30 per cent of our sample needed to access health services. Of these people, around 74 per cent said that they could access public healthcare facilities, with those in rural areas marginally better off (Figure 5.9).
Interestingly, people’s access to healthcare varied by the status of their employment. Over 90 per cent of those employed full time could access healthcare facilities compared to 75 per cent of those who were employed part-time and 68 per cent of those who were unemployed. A plausible explanation is that the burden of out-of-pocket expenses such as that of transport and medicines that have to be borne by people even while accessing free public healthcare facilities, discourages them from seeking treatment when their employment status is precarious.
We also asked women workers whether they were able to access reproductive services. Only about 27 per cent of them said that they could access these services when they needed to since the unlock process started (Figure 5.10). Again, there was notable variation based on employment status, with a much higher percentage of women who were employed full time able to access reproductive services than women who were employed part-time or unemployed.
In case of access to public healthcare, Andhra Pradesh, Telangana, Odisha, and Tamil Nadu performed way better than the national average, while Delhi, Bihar, Punjab, and Uttar Pradesh performed way below average.
Figure 5.9: Access to public healthcare facilities (N = 5,141)
Access to healthcare (%)
73.74 74.54 71.47 67.9275.26
90.26
UrbanRuralOverall Un Employed
EmployedPart-time
EmployedFull-time
Status of Social Security

50
Figure 5.10: Access to reproductive healthcare (N = 2,793)
Access to reproductive healthcare (%)
27.3229.52
19.7324.67 27.63
39.72
UrbanRuralOverall Un Employed
EmployedPart-time
EmployedFull-time
People reported that they could not access public healthcare facilities when they needed to because of non-availability of transport, distance to hospitals, OPD closure, mandatory COVID-19 test certificates, or their inability to pay.
The major reasons for not being able to access healthcare differed across states. For example, in Punjab, the major reason was that OPDs were closed, whereas in Bihar, several people reported that they were asked to show COVID-19 test certificates before they could get treatment. In Delhi, people said that they struggled to access healthcare because of restrictions on movement, unavailability of transport, and long distances to the hospital.
Registration in Workers’ Welfare BoardsRegistration in workers’ welfare boards was alarmingly low amongst the respondents in our sample at less than seven per cent of total workers. Most of the registered workers were construction workers, while the remaining were mainly domestic workers and fish workers.
At the State level, Tamil Nadu and Odisha had large proportion of workers who were registered with workers’ welfare boards.
Around 41 per cent of those enrolled in these boards stated that they have received financial help from their respective boards since the lockdown.
Workers in the Time of COVID-19Round II of the National Study on Informal Workers

51
Nearly 60 per cent of the construction workers who were enrolled with State Building and Construction Workers Welfare Boards were reported to have received assistance.
Relief Under State Level SchemesAround 21 per cent of the respondents said that they had received benefits under State level schemes. More than 30 per cent respondents from Gujarat, Odisha, and Tamil Nadu received some form of assistance from State Governments, while more than 50 per cent of respondents from Himachal Pradesh and Manipur received such support. The most common forms of support provided by State Governments were cash transfers to returnee migrants and food rations in addition to the scheme of the Union Government.
Status of Social Security
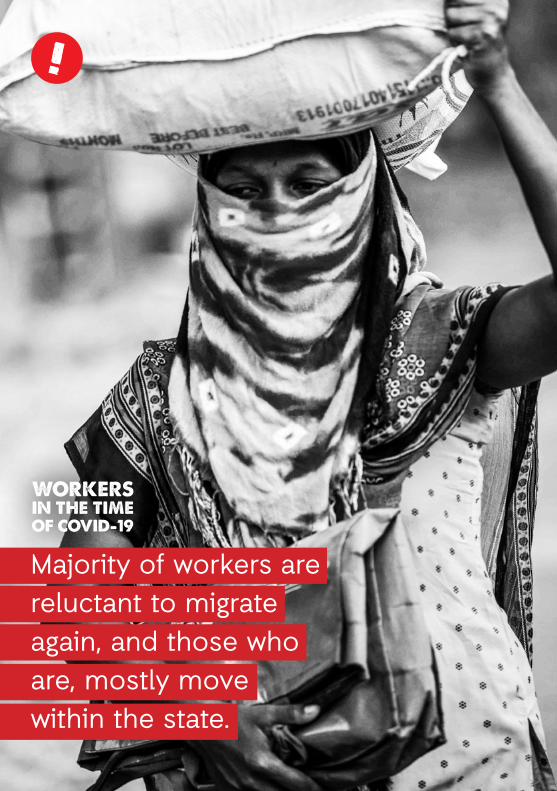
Majority of workers are reluctant to migrate again, and those who are, mostly move within the state.

Natural EmergenciesInformal workers have unarguably faced enormous adversities over the past few months. Their socio-economic distress has been compounded by climate related hazards such as cyclones, floods, and droughts, which affect marginalized and vulnerable populations disproportionately.
While the first round of the survey was being conducted, several districts of West Bengal and Odisha were hit by cyclone Amphan. Soon after, in the first week of June, Maharashtra was affected by cyclone Nisarga. The annual monsoon floods in Bihar and Assam took a hugely destructive turn in July and August, with 55 lakh people estimated to have been affected.1 The precipitous existence of low-income households was worsened by further losses to their homes, livelihoods, and lives.
In order to capture how natural emergencies have deepened their vulnerability, we asked our respondents about the impact of these emergencies and the forms of assistance they received.
A total of 1,621 respondents said that they had been affected by natural emergencies during the past six months, with more than 81 per cent of respondents belonging to just five states, namely West Bengal, Odisha, Bihar, Assam, and Maharashtra (Table 6.1). Of these, over 58 per cent were unemployed. Furthermore, 51.39 per cent of them had taken loans in order to meet their needs. This was significantly higher than the overall
1. “More than 55 lakh people affected in Assam, Bihar floods”, The Times of India, July 31, 2020. http://timesofindia.indiatimes.com/articleshow/77288442.cms?utm_source=contentofinterest&utm_medium=text&utm_campaign=cppsthttps://timesofindia.indiatimes.com/india/more-than-55-lakh-people-affected-in-assam-bihar-floods/articleshow/77288442.cms
Impact of Natural Emergencies and Reduced Mobility6
CHAPTER

54
indebtedness rate of 39 per cent for our sample, showing their increased financial distress.
The impacts of the natural emergencies were varied and severe. While the number of deaths were proportionally small, there was widespread damage to houses and loss of livelihoods. A vast majority of respondents, over 63 per cent, said that their houses had been damaged and close to 53 per cent respondents reported loss of their livelihoods (Figure 6.1). Food and water shortages were reported by 49 per cent and 28.5 per cent of the affected workers, respectively.
State Number of people affected by natural emergencies
West Bengal 533
Bihar 299
Assam 191
Odisha 148
Maharashtra 148
Table 6.1: Top five states affected by natural emergencies (N = 1,319)
Figure 6.1: Impact of natural emergencies (N = 1,621)
Effects of the natural emergency (%)
63.11House Damage
Livelihood Loss
Food Shortage
Water Shortage
Loss of Documents
Loss of Valuables
Death in Family
Loss of Household Items
52.99
49.17
28.56
13.82
6.11
4.75
0.99
Workers in the Time of COVID-19Round II of the National Study on Informal Workers
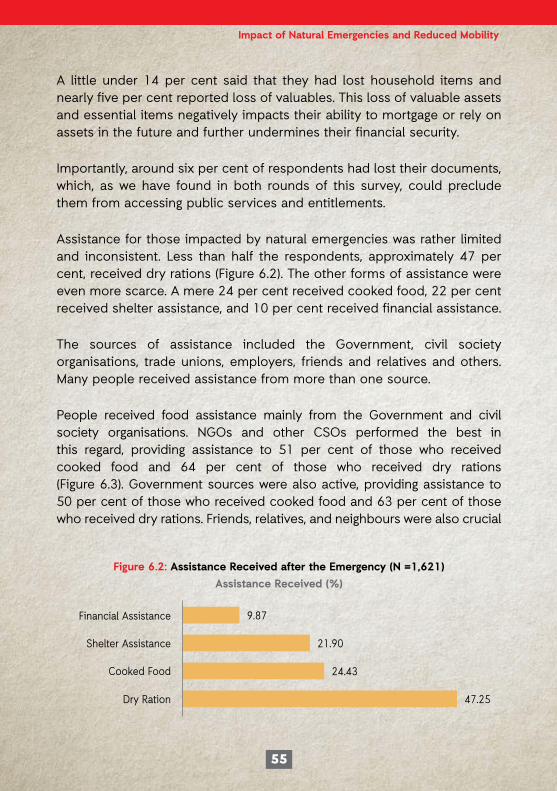
55
A little under 14 per cent said that they had lost household items and nearly five per cent reported loss of valuables. This loss of valuable assets and essential items negatively impacts their ability to mortgage or rely on assets in the future and further undermines their financial security.
Importantly, around six per cent of respondents had lost their documents, which, as we have found in both rounds of this survey, could preclude them from accessing public services and entitlements.
Assistance for those impacted by natural emergencies was rather limited and inconsistent. Less than half the respondents, approximately 47 per cent, received dry rations (Figure 6.2). The other forms of assistance were even more scarce. A mere 24 per cent received cooked food, 22 per cent received shelter assistance, and 10 per cent received financial assistance.
The sources of assistance included the Government, civil society organisations, trade unions, employers, friends and relatives and others. Many people received assistance from more than one source.
People received food assistance mainly from the Government and civil society organisations. NGOs and other CSOs performed the best in this regard, providing assistance to 51 per cent of those who received cooked food and 64 per cent of those who received dry rations (Figure 6.3). Government sources were also active, providing assistance to 50 per cent of those who received cooked food and 63 per cent of those who received dry rations. Friends, relatives, and neighbours were also crucial
Figure 6.2: Assistance Received after the Emergency (N =1,621)
Assistance Received (%)
9.87Financial Assistance
Shelter Assistance
Cooked Food
Dry Ration
21.90
24.43
47.25
Impact of Natural Emergencies and Reduced Mobility

56
sources of help, as 18 per cent of respondents received cooked food and 10 per cent received dry rations through these personal networks.
Although assistance in the form of shelter and cash transfers etc. was generally low, the Government was responsible for most of the assistance that was given. Around 66 per cent of those who received shelter assistance and 75 per cent of those who received financial assistance, received it from the Government (Figure 6.4). NGOs/CSOs and friends, relatives, and neighbours were also important sources of shelter and financial assistance.
Geeta Rai has been working as a domestic worker in Jaipur for the past twenty-five years since she migrated from Cooch Behar, West Bengal. She briefly worked in Bengaluru but moved back to Jaipur to get treatment for her illness. She had to borrow heavily for her medical expenses and took on extra work to repay her debt. During the lockdown, Geeta lost her job. She was shocked to see that none of the people who she has worked for many years provided any sort of support. Geeta was struggling to buy her medicines and pay her rent. She then went to a meeting organized by the domestic workers’ union in her area. The Union supported her with money to set up a snack stall. She and other members have partnered to run the stall and earn around `800 to `1,000 per day.
Others
Trade Union
NGO/CSO
Government
Friends/Relatives/Neighbours
Employer/Contractor
8.082.87
17.687.79
4.292.22
3.282.74
50.5163.84
49.7562.92
Figure 6.3: Sources of food assistance (Cooked food N=396, dry ration N = 766)
Food assistance received (%)
Dry Ration Cooked Food
Workers in the Time of COVID-19Round II of the National Study on Informal Workers

57
The generally low level of assistance provided by the Government was perhaps an indication of diminished capacities at the State level to effectively respond to natural emergencies in the face of dwindling budgets and overstretched administrators already committed to the pandemic. But given the increasing frequency and severity of natural emergencies, these capacities need to be urgently bolstered at the State and local levels.
In the absence of State support, people were increasingly forced to rely on their social networks, as we have seen. And in cases where their families and friends were similarly distressed, people usually turn to moneylenders or to dangerous or illegal sources of livelihoods, including child labour. There was an over-reliance on debt and precarious forms of livelihoods amongst a large part of the low-income segment of the population, which was rising, and threatens to push generations into poverty and deprivation.
One of the coping strategies people have adopted in face of severe socio-economic distress or upheaval, including in the aftermath of natural emergencies, was to migrate. For many informal workers from districts which are prone to droughts and floods, migration is a common and recurrent undertaking.
Others
Trade Union
NGO/CSO
Government
Friends/Relatives/Neighbours
Employer/Contractor
55.35
11.8820.56
52.82
4.383.1
22.539.15
7565.6
Shelter Finance Assistance
Figure 6.4: Sources of shelter and financial assistance (Shelter N = 355, Financial assistance N=160)
Impact of Natural Emergencies and Reduced Mobility

58
MigrationBut the ordeal that migrants faced during the lockdown and the uncertainty surrounding their livelihoods and the threat of infection, especially in urban areas, has made migration an unviable or undesirable option for many, at least in the near future.
In our sample, of those who had migrated for employment before the lockdown, 54 per cent want to remain in their source area and not return to the place where they were working (Figure 6.5).
The most common reasons for their unwillingness to migrate were fear of disease (61 per cent), lack of opportunity (20 per cent), and uncertainty in the destination area (19 per cent).
Also, 16 per cent out of those who used to migrate for employment before lockdown, want to change their destination (Figure 6.6). This is based on the amount of wages they were likely to get in the destination (51 per cent), availability of local networks (44 per cent), information shared by the
Figure 6.5: Do you want to stay in your source area? (N = 16,961) If yes, why? (N=11,052)
54% of those who migrated for employment before lockdown want to stay in their source area.
61% due to fear of disease in the
destination area.
20% due to lack of opportunity in the destination area.
19% due to fear of uncertainty in the
destination.
Workers in the Time of COVID-19Round II of the National Study on Informal Workers

59
Figure 6.6: Do you want to change your destination area? (N= 5, 935) If yes, why? (N = 882)
16% of those who migrated for employment before lockdown want to change their destination.
51% based on wage rate.
36% based on contractor’s information.
44% based on availability of
local networks.
13% based on proximity to source.
8% based on spread of disease.
contractor (36 per cent), proximity to their source area (13 per cent) and the spread of the disease (8 per cent).
It is interesting to note that while a majority of the respondents have said that they prefer to stay in their source area, the most compelling factors for those who were willing to migrate again, albeit to a different destination area, were not the proximity to their districts or low spread of infection, but the amount of wages and availability of social networks. This was indicative of the kind of distress migration that low-paid informal workers usually undertake where their need to supplement their household incomes forces them to compromise on considerations of safety and distance.
Impact of Natural Emergencies and Reduced Mobility

60
Mayur resides in the Kalandar Colony in Tonk, Rajasthan with his parents and siblings. When his father lost his livelihood as a travelling salesman of pastes and balms due to the lockdown, Mayur quit his studies to look for work. He, along with a few friends from his neighbourhood, found work in a paint factory in Bhiwadi for `12,000 per month. However, Mayur and his companions started developing rashes and other health issues because of exposure to the paint and dust and decided to go back home. They informed the contractor and asked to be paid for the days that they had worked. The contractor refused to pay them, and instead asked for `18,000 in rent and food costs. Mayur and his friends left without the payment. With no money and no means of transportation, they walked for 30-40 kilometres on foot until a truck driver helped them get home.
There was also a definitive shift towards intra-state migration amongst the respondents in our sample rather than inter-state migration. Out of the respondents who have started migrating in the unlock phase, more than 68 per cent were migrating within their native or source state. This includes both returnee migrants as well as people who have started migrating for work in the unlock phase but did not migrate prior to the lockdown. These trends in migration are made apparent by the figures below.
Figure 6.7 depicts the migration and reverse migration routes for 5,561 respondents in our sample by tracking their source regions and destination
Figure 6.7: Migration before lockdown (first panel on the left) and reverse migration during lockdown (second panel)
Workers in the Time of COVID-19Round II of the National Study on Informal Workers
Central India
EastIndia
NorthIndia
NortheastIndia
South India
West India
Central India
EastIndia
NorthIndia
NortheastIndia
South India
West India
Central India
EastIndia
NorthIndia
NortheastIndia
South India
West India
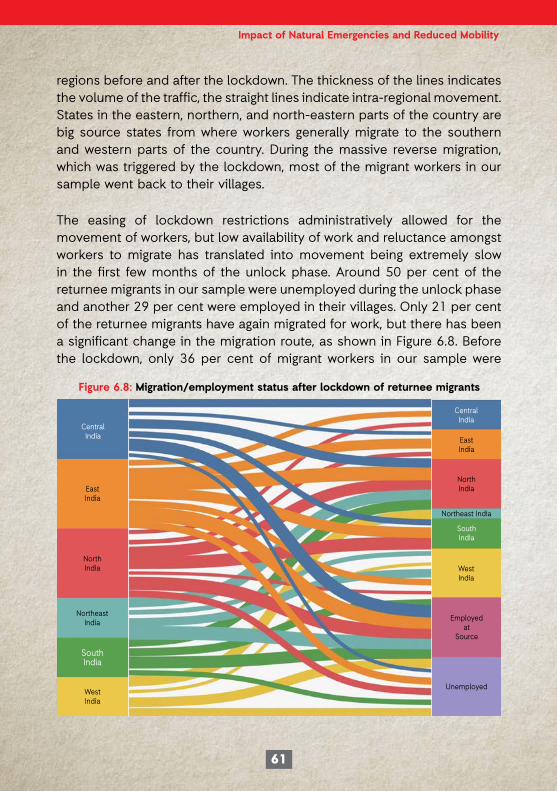
61
regions before and after the lockdown. The thickness of the lines indicates the volume of the traffic, the straight lines indicate intra-regional movement. States in the eastern, northern, and north-eastern parts of the country are big source states from where workers generally migrate to the southern and western parts of the country. During the massive reverse migration, which was triggered by the lockdown, most of the migrant workers in our sample went back to their villages.
The easing of lockdown restrictions administratively allowed for the movement of workers, but low availability of work and reluctance amongst workers to migrate has translated into movement being extremely slow in the first few months of the unlock phase. Around 50 per cent of the returnee migrants in our sample were unemployed during the unlock phase and another 29 per cent were employed in their villages. Only 21 per cent of the returnee migrants have again migrated for work, but there has been a significant change in the migration route, as shown in Figure 6.8. Before the lockdown, only 36 per cent of migrant workers in our sample were
Figure 6.8: Migration/employment status after lockdown of returnee migrants
Impact of Natural Emergencies and Reduced Mobility
CentralIndia
CentralIndia
EastIndia
EastIndia
NorthIndia
NorthIndia
NortheastIndia
Northeast India
South India
South India
West India
West India
Employedat
Source
Unemployed

62
intra-state migrants, but among those returnee migrants who migrated for work during unlock, around 49 per cent were intra-state migrants.
Intra-state migration was an even more prominent phenomenon for the 826 respondents in our sample for ‘new’ migrants, i.e. those workers who migrated for work during unlock but were not migrating before the lockdown. Figure 6.9 depicts the migration route for these new migrants among whom almost 95 per cent were intra-state migrants. Amongst the five per cent of workers who were migrating out of their states, the majority were from Assam, Bihar, Odisha, Uttar and Pradesh, and West Bengal, which are generally the predominant source states for inter-state migrant workers.
Workers in the Time of COVID-19Round II of the National Study on Informal Workers

63
Figu
re 6
.9: M
igra
tion
rout
e fo
r ne
w m
igra
nts
dur
ing
unlo
ck p
hase
Andh
ra P
rade
sh
Assa
m
Biha
r
Del
hi
Guj
arat
Har
yana
Him
acha
l Pra
desh
Karn
atak
a
Mad
hya
Prad
esh
Mah
aras
htra
Odi
sha
Punj
ab
Raja
stha
n
Tam
il N
adu
Tela
ngan
a
Utt
ar P
rade
sh
Wes
t Ben
gal
Andh
ra P
rade
sh
Assa
m
Biha
r
Guj
arat
Chh
attis
garh
Har
yana
Mad
hya
Prad
esh
Mah
aras
htra
Raja
stha
n
Tam
il N
adu
Tela
ngan
a
Utt
ar P
rade
sh
Wes
t Ben
gal
Jhar
khan
dH
imac
hal P
rade
sh
Jhar
khan
d
Karn
atak
a
Kera
la
Odi
sha
Punj
ab

Access to rural employment guarantee work (MGNREGA) differed greatly across different States.

The survey points to the extreme distress which continues to reverberate through the informal sector, a majority of which is constituted by the most marginalised and vulnerable groups in the country.
Livelihoods have not recovered several months into the crisis, wages were precipitously low and falling, and people were struggling to access food and meet their basic needs. Their savings and borrowings have become the primary source of survival, while they continue to grapple with quotidian challenges and the uncertainties that the pandemic and the economic crisis have created.
The initial shock of the lockdown is settling into a long-drawn, multidimensional crisis, widening existing inequalities and pushing people into poverty. Soon the generational impacts will start becoming more visible with millions of children unable to access education, access to nutritional food falling rapidly, people not being able to afford healthcare for critical illnesses, and more and more people being forced into casual and precarious work with abysmally low wages, particularly younger workers.
Urgent and comprehensive policy interventions are needed in response. Based on our survey and the numerous interactions we have had with affected communities we would suggest the need to strengthen food security by extending and universalising existing schemes, strengthening existing employment guarantee schemes and expanding them to urban areas, supporting micro small and medium enterprises, while ensuring strict enforcement of a living wage, ensure safe migration and recognize and encourage women’s access to work.
Conclusion and Recommendations7
CHAPTER

66
Extend Pradhan Mantri Gareeb Kalyan Ann Yojana and Universalise Public Distribution SystemGiven the prevailing food insecurity in the country, there is an urgent need to extend the PMGKAY scheme. There is massive dependence on PDS- in our survey, over 85 per cent of respondents said that PDS has been one of their major sources of food in the unlock phase. The extra free food grains being provided under the PMGKAY are thus vital, considering people’s purchasing capacity remains low. The Government should also diversify the PDS basket to include salt, oil, and millets to meet people’s nutritional requirements.
It was imperative to universalise PDS so that migrant workers and people from marginalised communities who have been left out of its ambit are able to access it, at least during the pandemic. The Government should not only urgently allow for portability of ration cards for migrant workers, but even in the absence of ration cards, subsidised food grains should be given at fair price shops to anyone who demands them.
Expand Mahatma Gandhi National Rural Employment Guarantee Act The massive reverse migration has put immense pressure on rural employment and incomes. An early and large surge in demand for work under the MGNREGA led to utilisation of almost half of the allocated funds to the scheme within the first four months of the pandemic. Since then the work generated under the scheme has considerably fallen and there have been numerous reports of delayed payments or non-payments.
The Government must urgently allocate fresh funds for the scheme. It should increase funding, double the days of guaranteed work from 100 to 200 days, ensure payment of unemployment allowance, and allow for issuance of separate job cards for all adult members in a family. It should also diversify the kinds of work provided under the programme to strengthen critical infrastructure in health, education, and agriculture including markets, storage spaces, and warehouses.
Workers in the Time of COVID-19Round II of the National Study on Informal Workers

67
Introduce an Urban Employment Scheme The widespread loss of work and wages in urban areas has led to many votaries of an urban employment programme, and State Governments in Odisha, Himachal Pradesh, Kerala, and Jharkhand have already introduced such programmes.
An urban employment programme would not only enhance the incomes and livelihoods of the urban poor, but also provide them with a safety net, address the infrastructure deficit in urban areas, improve the quality and availability of public services, and restore urban commons. It would create productive assets under the ownership and management of marginalised communities.
The scheme could cover public works such as building, maintenance and upgradation of roads, footpaths, cycling paths, bridges, public housing, monuments, laying of cables, and other construction work; green jobs including creation, restoration, and maintenance of parks and forested areas, rejuvenation of degraded or waste land, cleaning of water bodies (tanks, rivers, nullahs, lakes), management of non-hazardous waste; monitoring and surveying jobs; and care work such as child-minding services in creches, providing assisted care for the elderly, and support services for differently abled people.
It could also include COVID-19 related public works such as production and distribution of water, soaps, hand sanitizers, and masks in informal settlements, running community kitchens, and door-to-door delivery of food grains under PDS.
Ensure Support to Micro, Small and Medium Enterprises The Government must take stronger measures to support the MSME sector, which is a significant job generator, especially for informal workers in urban areas. It should expand access to credit under the Aatma Nirbhar Bharat package and adopt mechanisms to ensure that loans are reaching smaller units. More importantly, it should announce payroll support for MSMEs so
Conclusion and Recommendations

68
that they are able to retain workers. Such support may be provided in the form of direct cash transfers contingent upon workers not being laid off and not having to suffer wage cuts.
Implement and Enforce Minimum Wages Since the beginning of the pandemic, workers in many sectors have been reporting wage violations including delayed payments, non-payments, or wage cuts. In the unlock phase, there have been additional reports of people having to accept work at much lower wages than the wages they were earning before the lockdown, and mostly below minimum wages. The Government must announce a floor wage based on the demands of trade unions and workers’ collectives and strengthen its implementation and enforcement mechanisms.
It should also ensure inclusion of informal workers such as domestic workers, agricultural workers, gig and platform workers, and home-based workers in the Code on Wages and remove any ambiguities or gaps therein. For example, the Code has a provision which excludes employers employing less than five workers for domestic and agricultural purposes from maintaining registers of employees or issuing wage slips to workers, which are necessary conditions for effective implementation of the law.
Facilitate Safe Migration Though migration levels are currently much lower than what they were before the pandemic, they will eventually pick up, both in response to rural distress and creation of jobs in urban areas.
In order to ensure safe migration, for both intra-state and inter-state migrants, the Government should introduce a scheme for the setting up of Worker Facilitation Centres at the district level for:
1. registration of migrant workers,
2. disseminating information on Government welfare schemes,
3. enrolling workers in social security schemes,
4. providing access to legal services and grievance redressal mechanisms,
Workers in the Time of COVID-19Round II of the National Study on Informal Workers

69
5. conducting skill mapping and connecting workers to job opportunities, and
6. providing information, training, and equipment to workers on protecting themselves from COVID-19.
The data collected at these centres can also regularly feed into the migrant workers’ database being prepared by the Ministry of Labour and Employment.
The Government has approved the Affordable Rental Housing Scheme for migrant workers in response to the migrant crisis. But it needs to be complemented by workers’ hostels or dormitory housing. These would especially cater to the short duration circular migration of informal workers that is becoming more and more prominent. There is also an urgent need to extend the scheme for working women’s hostel to women in low- wage occupations.
Ensure Women’s Access to Safe and Decent Work Women’s participation in the labour force has declined untenably over the past decade. During the pandemic, several reports have shown that women have had to cut back on their work hours or leave the workforce entirely due to care work responsibilities which disproportionately fall on them. This necessitates greater investment into the care economy, which would both create formal jobs for women and enable women to join the labour force. This would entail providing access to public services, including affordable transport, creches, and elderly care homes, and expanding the network of frontline health workers and care providers such as ASHA workers and anganwadi workers.
The Government should urgently identify those sectors where women workers are most vulnerable due to the complete absence of any protections and recognition as workers, such as home-based petty manufacturing and domestic work. It should create mechanisms for their registration, social security, protection from sexual harassment and exploitation, and access to labour laws and grievance redressal mechanisms.
Conclusion and Recommendations

70
It is critical for the Government to formulate a comprehensive economic recovery plan focused on women's employment. It could start by reviewing the labour codes and gaps with respect to women workers. It should also conduct a survey of women's time-use and the factors which inhibit them from participating in formal workspaces, assessing workplace best practices in ensuring women's safety and decent working conditions, and mapping of women's skills and employment opportunities.
Workers in the Time of COVID-19Round II of the National Study on Informal Workers
Survey Team
Andhra Pradesh B. Ravi, D.Bhaskar, Indu Mathi, K.Ramanujam, Krishna Kumari, M.Somasekhar and Ramakrishna.
AssamAminul Islam, Anandi, Anitya Rabha, Ankita Deka, Babul Shariful Islam, Bharat Nayak, Bhupen Borah, Bindobaba Doley, Bipin Dutta, Dipika Deka, Dipranjan Chamuah, Dwijen Sutradhar, Gobinda Hazarika, Heman Rabha, Hemaprabha Devi, Himu Roy, Jagdish Hazarika, Jeema Rani Narzary, Kabita Baruah, Kanak Baruah, Khashma Sundar Kakati, Khusbub Alam Ahmed, Mitali Rabha, Monijyotsna Mahanta, Monoj Talukder, Monoranjan Hazarika, Mousumi Burhagohain, Nitul Doley, Pranay Das, Rajesh Kerketta, Rini Sarmah, Runumoni, Sangeet Kalita, Somar, Sumati, Tilak and Utpal Khakhalary.
BiharAjay, Anupama Kumari, Aquib Khan, Arbind Kumar, Arvind Kumar, Ashish Kumar, Bum bum Lal, Keshav Murari, Md Meraz Danish, Md Tafweej, Mohd Ekram, Nazish Ahmad, Nutan Mishra, Pankaj Shwetabh, Pranav Kumar, Pritam Mishra, Pushpa Dahanga, Rajesh, Rajkumar, Rakesh, Ram Kashi, Shambhu Das, Shatrughan and Shiv Shankar Pathak.
DelhiImtyaz, Kasim , Rais Ahmad, Sulekha, Suniti, Thaneshwer Dyal Adigaur and Vinit.
Research TeamIAPPENDIX

72
GoaAshish Nagvekar, Rupa Gad, Sarvesh Karbotkar, Snehal Salgaonkar and Venicia Fernendes.
Gujarat Abdul Ohab Ansari, Dipsing Chouhan, Kanchanlal Yadav , Kishore Mohanlal Chauhan, Mukesh Shiyal, Ranjan Ben and Sushil Anant.
Haryana Anil Kumar, Ashfaq Alam, Barkat Malik, Hukum Chand, Priyanka, Raj Kumar, Rekha, Shababul, Suresh Tank and Wasim.
Himachal PradeshBirbal, Nagesh, Sumitra and Vipan Kashyap.
Jharkhand Amit Kumar, Aniruddha Sarkar, Danish Ali, Dhamme Dhankar, Niraj Jha, Pijush Sengupta, Prabhash Chandra Sinha, Pramod Kumar Verma, Rakesh Roshan Kiro, Shahnawaz K. Siddiqui, Smriti Gupta, Umesh Kumar, Varsha Rani Tirkey and Vijay Shankar Dubey
Karnataka Afrin, Ambreesh, Amrutha, Anantha Laxmi, Ashok, Dr Gopal Dabade, Ebenezer, Esha, Fakir, Jansy, Jennifer, Jothi, Lalitha Srinivasan, Malarvizhi M, Miral Peres, Nagesh, Nagraj , Namdev, Namitha, Nandini K, Nayaz Khan, Neelaiah, Raghavendra B, Rajeshwari Joshi, Reshma, Sachu K, Saranya, Shailendra, Shaira Banu, Sharadha, Shivamma, Shivu, Shobha, Suvarna and Umesh Naik.
Madhya PradeshAakriti Patil, Afsar Jahan, Ameen Charles, Angira Mishra, Animesh Khimla , Anupam Sahu, Atar Singh, Jimmy Nirmal, Nabi Khan, Pramod Khare, Praveen Singh, Rajneesh Lenger, Rekha Gujre, Saurabh Chatterjee, Shabnam, Shiv Kumar, Surendra Dahiya and Umesh Vashisht.
Workers in the Time of COVID-19Round II of the National Study on Informal Workers

73
MaharashtraAbhijit Deshmukh, Amol Fuladi, Amol Kadam, Archana Vaishnav, Arjun Pawar, Asha Kapse, Ashok Bhikkad , Ashok Todkar, Babaji Ramji Kedare, Bhawana Hastak, Bhushan Deshmukh, Dipti Raut, Gabbarsing Bahure , Ganesh Wani, Haridas Dethe, Jagdish Kale, Jaishree Waghmare, Jyoti Bhore, Ketan Chittarka, Kiran Khandpasole, Kunal Sulabhewar, Laxmi Naik, Madan Rathod, Madhukant Pathariya, Mayur Gujar, Mithun Kamble, Nita Suraskar, Pornima Dilip Sonar, Pradip Kuthe, Rahul Lakhe, Rajim Sahay Gangakachur, Rajpalsingh Rana, Sachin Patil, Sandip Madame, Sandip Shinde, Santosh Mule , Savita Chalak, Shirish Jadhav , Shriniwas Rathod, Someshwar Deshmukh, Sunil Dhanvijay, Sunil Kamble, Sushil Dabhade, Sushma Bais, Swapnil Esal, Swapnil Kate, Tushar Bhadange, Umesh Wasu, Uttam Gaikwad, Uttam Ladke, Veerbhadra Potbhare, Vijay Bhise, Vijay Ghodaki and Vilas Madawi.
ManipurAjit Kumar , Bidhya , Bimol Singh , Elda, Gunamani , Japhet, Jugen , Kajol , Michael, Nandani , Naomi, Oinam Raju Singh , Pounga and Sanahal .
OdishaAnasuya Hota, Angoor Mishra, Debabrat Mahunta, Fakira Charan Rout, Fakira Rana, Gobinda Chandra Sethi, Jitendra Pattnaik, Kailash Dandpat , Kumuda Chandra Satapathy, Monika Dash, Murali Das, Pitabash Behera, Prabodh Kumar Nayak, Prasana Kumar Mishra, Priyabrata Satapathy, Rajalaxmi Behera, Rakesh Pradhan, Ratneswar Sahu, Sachidananda , Sadashiv Swain, Santosh Sukla and Swati Tanmaya Mishra.
PunjabGagandeep , Hardeep, Heera Singh, Jagsir, Ranjit Singh and Reena.
Rajasthan Bhairulal Banjara, Devendra Kumar, Dinesh Bairwa, Guljar , Jaheer Alam, Kiran, Mangilal Shekhar, Meva Bharti, Nirpendra Singh , Shashank Devra, Sugan Mehta, Tara Chand Varma, Vikas Singh and Vikram Singh.
Appendix I

74
Tamil NaduAasaimani, Akbar, Antony Samy, Baskar, E. Thiyagarajan, Ganesh, Honarin, Iniyavan, Jagatheespathi, Jamuna Rani, Jayapal, Jayasri, Jayavathi, Jeeva, Kamatchi, Kanchana, Kavitha, Kavitha, Kumanan, Lakshmi, M. Sumithra, Mahaboob Shafeena, Natarajan, Nithya, Nivi, Prakash, Priya, Rajendran, Rajeswari, Raji, Ramamoorthy, Ramya, Reena Anitha, Robin, Ruth Rajeshwari, Sangeetha, Saroja, Sathiyamoorthy, Shakthi Prema, Shanthini, Shyam Prasad, Sivasubramaniyan, Subhashini, Suganthi, Sumistha, Suresh, Thangamalar, Vasanth, Vijiliya and Vithya.
Telangana Aliya Parveen, Mahipal, Mamatha, Mangamma, Md Irfan, Naresh Guguloth, Ramu, Roja and S Anjali.
Uttarakhand Dharmendra, Harshit, Heera , Kanchan and Kheema.
Uttar PradeshAbdul Kadir , Amar Singh, Anuradha , Arpit, Arunima, Ashwani Kumar , Devendra Singh , Durga , Ganga Singh , Guru Prasad , Imran, Jitendra Kumar, Lokendra Singh, Mukul, Pramod Pandey, Rajendra , Rizwan, Shazida Bano, Shipra Aarya , Tariq Ahmad , Usha and Vandana.
West Bengal Alam Hossen, Ananyo Mukherjee, Ankita Barua, Bratin Biaswas, Jayati Roy Chowdhuri, Koustav Dasgupta, Monalisa Majumdar, Mrinal Bhattacharyya, Rafikul, Sandhya Chetri, Shankar Mitra, Shashanka Dev, Subrata Kar, Sudhir Shaw and Swapan Panda.
Coordination Team Navjyoti Ranawat, Sushila Prajapati, Chandramohan Majhi, Sion Kongari and other members of Rajasthan & Gujarat Programme Implementation & Research Hub.
Workers in the Time of COVID-19Round II of the National Study on Informal Workers

75
Maneesha Bhatia, Khalid Chaudhry and other members of Uttar Pradesh & Uttarakhand Programme Implementation & Research Hub.
Mashkoor Alam, Rakesh Thakur, Tanveer Kazi and other members of North India Programme Implementation & Research Hub.
Rudrani Dasgupta, Reshmi Ganguly, Surajit Neogi and other members of West Bengal Programme Implementation & Research Hub.
Lopamudra Behera , Ghasiram Panda, B N Durga, Priyabrata Satapathy, Suvendu Kumar Roy, Debabrat Patra and other members of Odisha Programme Implementation & Research Hub.
Edward Pratap Singh, Esther Mariaselvam and other members of Tamil Nadu Programme Implementation & Research Hub.
Karnataka Programme Implementation & Research Hub.
Ritesh Khare, Anamika Roy and other members of Madhya Pradesh Programme Implementation & Research Hub.
Sharad Kumari, Saurabh Kumar and other members of Bihar & Jharkhand Programme Implementation & Research Hub.
Anjaneyulu Madduluri and members of Andhra Pradesh & Telangana Programme Implementation & Research Hub.
Radha Sehgal and other members of Maharashtra Programme Implementation & Research Hub
Anjan Bordoloi, Rehana Rehman, Mrinal Gohain and other members of North East India Programme Implementation & Research Hub.
Appendix I

76
TranslationVarsha Rani Tirkey
Research Support Kashif Jamil and Deepa Suman
Research TeamDr Rahul Suresh Sapkal, Divita Shandilya, Koustav Majumdar, Roshni Chakraborty, Anoushka Roy, KT Suresh.
Workers in the Time of COVID-19Round II of the National Study on Informal Workers

WORKERS IN THE TIME OF COVID-19: FROM LOCKDOWN TO UNLOCK
Consent and Ethical ConsiderationDisclaimer: All of the information that you provide will be treated as confidential and will only be used for research purposes. Your comments will not be identified as belonging to you. Instead, they will be combined with those gathered from other survey participants and will be analysed as part of a group. We do not use any of the information you provide for other than the stated objectives of this study.
We invite you to participate in a research study titled, “Situation Analysis of Informal Workers in India: Shifting Livelihood Terrains in the COVID-19 Outbreak and Beyond”. This is a multi-round study aiming to assess the impact of COVID-19 and lockdowns on the lives and livelihoods of Informal Workers across Indian states. Your participation in this research project is completely voluntary. You may decline altogether, or leave blank any questions you don’t wish to answer. There are no known or anticipated risks to participation beyond those encountered in everyday life. Your responses will remain confidential and anonymous. Data from this research will be kept under lock and key and reported only as a collective combined total. No one other than the researchers will know your individual answers to this questionnaire. If you agree to participate in this project, please answer the questions on the questionnaire as best you can. It should take approximately 20 minutes to complete. If you have any questions about this project, feel free to contact the ActionAid Association COVID-19 Research Team at [email protected]. Thank you for your assistance in this important endeavour. Sincerely AAA COVID-19 Research Team.
Survey QuestionnaireIIAPPENDIX

78
Do you agree to participate in the survey? (1-Yes/2-No)
A.1. Respondent ID:
(Mobile Number)
A.2. Investigator State/Region A.3 Investigator Code:
A.4 State of the respondent (at time of interview):
A.5 District of respondent (at time of interview):
A.6 Sector (1-Rural/2-Urban): A.7 Whether Revisit? (1-Yes/2-No)
Block A: Identification of Sample Units
Block B. Individual and Household Level Characteristics (Go to Block C if it is revisit)
B.1. Gender (1-Female, 2-Male, 3-Transgender)
B.2. Age (in years):
B.3.1 Social Groups (Scheduled Tribe -1, Scheduled Caste -2, Other Backward Class -3, Others –9)
B.3.2 Religion: Hinduism -1, Islam -2, Christianity -3, Sikhism -4 Jainism -5, Buddhism -6, Zoroastrianism -7, Others-9.
B.4.1 What is your home/source native state?
B.4.2 What is your home/state/native district?
B.5. No of Persons in Household
B.5.1. Female
B.5.2. Male:
B.5.3. Transgender:
B.5.4 Children (Below 14):
B.5.5. Senior Citizens (More than 60 Years)
B.6. Are you members of any associations/unions/collectives?
Workers in the Time of COVID-19Round II of the National Study on Informal Workers

79
B.6.1 Which of the following are you members of?
• Labour/Trade Unions
• CSO/CBOs/SHGs
• Any Local collectives (Biradari/Caste/Bhavaki/ Sectarian)
B.7. Agriculture Land Ownership (1-Yes 2-No):
B.7.1. If Yes, what is the size of land (in acres):
B.7.2 If No, whose land do you work on? (1- Leased Land, 2- Batai System Land, 3- Collective Land, 4- Private Land Owner, 5- Other)
B.8. Do you have Aadhar Card? (1-Yes 2-No):
B.8.1 Is your Aadhar card linked to your bank account? (1-Yes 2-No)
B.9 Did you migrate for employment before lockdown?
B.9.1 Destination State (Before Lockdown)
B.9.2 Destination District (Before Lockdown)
B.9.3. Nature of Migration (Source-Destination) in your last employment before lockdown
Rural to Urban
Rural to Rural
Urban to Rural
Urban to Urban
B.9.4. Migration Pattern in your last employment before lockdown
Seasonal
Permanent
B.9.5. Period of Stay in Destination (in months) in your last employment before lockdown
Appendix II

80
B.9.6 Frequency of Migration
Multiple Time in a Year
Once in a Year
B.9.7. Destination (frequency) before lockdown
Same City/Town
Multiple Cities/Towns
B.9.8. Sectors you worked in your last migration period before lockdown
1. Same Sector/Industry 2. Multiple Sector/Industry 3. Depends on Availability of Work
B.9.9. Did you migrate with your family before lockdown? (1-Yes 2-No)
B.9.9.1. If Yes, then how many dependent members travelled with you:
----------------------------
Block C: Restoration of livelihoods
C.1.1 Level of Education:
1. Not literate 2. Primary 3. Secondary 4. Higher Secondary 5. Undergraduate 6. Graduate and above
C.1.2. Level of Technical Education:
1- No technical education 2-Technical Degree/License 3- Diploma or certificate (below graduate level) 4- Diploma or certificate 5- Training in Traditional Arts/Craft
Workers in the Time of COVID-19Round II of the National Study on Informal Workers

81
Age Group GenderBefore Lockdown
(1-Yes 2-No)
Unlock Phase (Since June 1, 2020)
(1-Yes 2-No)
Adults (18 to 60 years age)
Male
Female
Transgender
Adolescents (Below 18 years of age)
Male
Female
Transgender
Elder members (More than 60 years of age)
Male
Female
Transgender
C.2.1 Earner in a Household (Before lockdown and currently)
C.3. Current Status of livelihood (In Unlock Phase) 1-Unemployed 2-Employed Partial/Occasional 3-Employed full time
C.3.1 Location for current (in unlock phase) livelihood: 1-In Source Village/City/State, 2-In same Destination Village/City/town as pre-covid, 3- In different destination village/City/Town)
C.3.2 If migrating for work as per C.3.1, what type of housing are you living in? 1- Kuccha (Own House), 2- Semi-Pakka (Own-House), 3- Rented Room, 4- Community Housing 5- Provided by Employer
C.3.2.1. Is it the same house where you were staying before lockdown? Yes/No
C.3. If migrating for work, is your family living with you currently? (1-Yes/2-No)
C.3.4 If migrating for work, how many non-family members do you share your housing with?
C.3.5 If migrating for work, is drinking water available at your current housing?
Appendix II

82
C.3.6. If migrating for work, how many toilets are there?
C.3.7 If migrating for work, who paid the transportation cost for your recent move from your source area to your current place of work? 1- Self, 2- Employer, 3- Employer, but to be deducted from next wage, 4- Family, 5- Friends/Neighbours, 9- Others
C.4. Type of Current (in unlock phase/since June) Employment
1. Self-Employment (Non-Household Based Production)
2.Casual Employment
3. Regular Employment
4. Own Account Workers (Household Based Production)
C.4.1 Do you have a written contract at your current employment? (1- Yes, 2- No)
C.4.2.1. What was your occupation pre-lockdown: ______________
C.4.2.2. What is your current occupation: __________________
C.4.2.3. Is your current occupation your family occupation? (1-Yes 2- No)
C.4.2.4. If No, then what is your family occupation? ________
C.5.1. What has been the change in intensity of work- in number of hours per week
Intensity of Work (per week in hours)
During lockdown
Since June 1, 2020 (Unlock Phase)
Agriculture and allied sector
Manufacturing
Construction
Service
Workers in the Time of COVID-19Round II of the National Study on Informal Workers
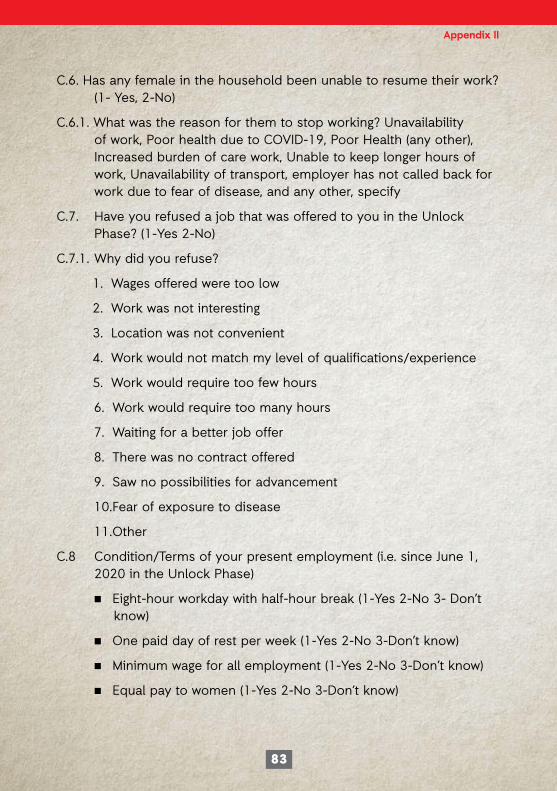
83
C.6. Has any female in the household been unable to resume their work? (1- Yes, 2-No)
C.6.1. What was the reason for them to stop working? Unavailability of work, Poor health due to COVID-19, Poor Health (any other), Increased burden of care work, Unable to keep longer hours of work, Unavailability of transport, employer has not called back for work due to fear of disease, and any other, specify
C.7. Have you refused a job that was offered to you in the Unlock Phase? (1-Yes 2-No)
C.7.1. Why did you refuse?
1. Wages offered were too low
2. Work was not interesting
3. Location was not convenient
4. Work would not match my level of qualifications/experience
5. Work would require too few hours
6. Work would require too many hours
7. Waiting for a better job offer
8. There was no contract offered
9. Saw no possibilities for advancement
10. Fear of exposure to disease
11. Other
C.8 Condition/Terms of your present employment (i.e. since June 1, 2020 in the Unlock Phase)
n Eight-hour workday with half-hour break (1-Yes 2-No 3- Don’t know)
n One paid day of rest per week (1-Yes 2-No 3-Don’t know)
n Minimum wage for all employment (1-Yes 2-No 3-Don’t know)
n Equal pay to women (1-Yes 2-No 3-Don’t know)
Appendix II

84
n Penalty for deferred wage payment (1-Yes 2-No 3-Don’t know)
n Fines for deduction in wages (1-Yes 2-No 3-Don’t know)
n Right to organise (1-Yes 2-No 3-Don’t know)
n Non-discrimination on basis of caste, religion, gender, ethnicity (1-Yes 2-No 3-Don’t know)
n Rules for Safety at workplace and compensation for accident (1-Yes 2-No 3-Don’t know)
n Protection from sexual harassment (1-Yes 2-No 3-Don’t know)
n Provision of childcare and basic amenities at workplace (1-Yes 2-No 3-Don’t know)
n Precautionary measures for protection from COVID 19 (1-Yes 2-No 3-Don’t know)
C.9.1. Did you seek a job in MGNREGA? (1-Yes 2-No)
C.9.2. If yes, how many days did you seek work for? (In Days)
C.9.3. How many days of work did you get? (In days)
C.9.4. How much do you get as daily wages in MNREGA?
C.9.5. How frequently were you paid wages? 1- Daily 2- Weekly 3-Once in fifteen days 4-Monthly 5-Other
C.10.1. Did you seek a job in PM GKRY? (1-Yes 2-No)
C.10.2. If yes, how many days did you seek work for? (In Days)
C.10.3. How many days of work did you get? (In days)
C.10.4. How much do you get as daily wages in PM GKRY?
Block D: Recovery of Wages
D.1. Average monthly wages earned during lockdown (March-April-May)
D.2. Average monthly wages earned during unlock phase (June-July-August)
D.3. Have people received any unpaid wage from contractor or employer which was due to them before lockdown?
Workers in the Time of COVID-19Round II of the National Study on Informal Workers

85
(1-Full Wages 2-Partial Wages 3-No Wages 9- Not applicable)
D.4. In the unlock phase (since June 1, 2020) are you working without pay or on promise to pay in future? (1-Yes 2-No)
Block E: Consumption Patterns
E.1. Daily Utilities Since June 1, 2020
E.1.1 Food ration (1-Sufficient; 2-Not Suffi-cient 3-Barely)
E.1.2 Water (1-Sufficient; 2-Not Sufficient 3-Barely)
E.1.3 Savings (1-Sufficient; 2-Not Sufficient 3-Barely)
E.1.4. Frequency of access to food for self-consumption (1. Once a day 2. Twice a day 3. Once in two day)
E.1.5. Sources of access to food (1. Self-procured 2. Relief Camp/Govt 3. PDS 4. Distributed by CSOs)
E.2.1 Monthly Average Expenditure on Food Consumption (in INR)
E.2.2. Monthly Average Expenditure on Non-Food Consumption (in INR)
Block F: Incidence of debt
F.1. Did you borrow money/take loan since June 1, 2020? (1-Yes 2-No)
F.1.1 If yes, what are the sources of borrowing money/loan)? 1. Friends/Relatives/Neighbours 2. Money Lenders 3. Landlords 4. Employer 5. Contractor 6. Co-workers 7. Self Help Groups 8. Non-Banking Financial Institutions 9 Banking Institutions
F.1.2. For what purpose did you borrow/take loan? 1. Food Consumption 2. Restart livelihood 3. Inputs for Agriculture 4. Restoring damaged property due to flood or cyclone etc. 5. Health Care 6. Education
Appendix II

86
fees 7. Online learning devices 7. Electricity Bills 8. Transportation costs 9. Preventive and Sanitation Measure 10. Marriage 11. Funerals 12. To pay interest/repayment on existing loan 12. Rent 13. Other
F.1.3. Were you denied loan/borrowings from any of these sources? (1- Yes 2-No)
F.2.1. Burden of debts
Burden of Debts (in INR) During lockdown Since June 1, 2020
Total debt
F.3. Did you have to mortgage any assets or any other property to get loan? (1. Yes 2- No)
F.3.1 If yes, then what? -------------------------------------------------------------
Block G: Access to entitlements
PDS/AAY
G.1.1 Do you have a ration card?
G.1.2 Do you have an AAY card?
G.1.3 If yes, are you receiving extra 5 kg rice/wheat and 1kg pulses for free every month?
G.1.4. If no, why? 1- No Ration Card 2- Ration Card not of current location 3- Denied by official for some other reason 4- Unaware of the scheme 5- Others
ICDS/Mid-day meal
G.2.1 Are children below 6 years enrolled in ICDS/ Anganwadi centres? (Yes/No/NA)
G.2.2 If yes, are they receiving mid-day meal daily?
G.2.3 If no, why? 1- ICDS/ Angwanwadi centres closed 2- Denied by officials 3- Unaware of the scheme 4- Others
Workers in the Time of COVID-19Round II of the National Study on Informal Workers

87
G.2.4. Are children between 6 to 14 years enrolled in public school? (Yes/No/NA)
G.2.5. If yes, are they receiving mid-day meal daily?
G.2.6. If no, reason: 1- Denied by officials 2- Unaware of the scheme 3- Others
G.3.1. Did you or any family member need to access healthcare during this time (Since June1, 2020)? (1-Yes 2-No)
G.3.2. Were you able to access it when needed? (1-Yes 2-No)
G.3.3. If not, why?
1. OPD Closed
2. Refusal to admit conditioned on producing COVID-19 test certificate
3. Refused due to religion
4. Refused due to Caste
5. Non-availability of transportation
6. Lockdown induced movement restriction
7. Travel Distance to hospital
8. Inability to pay
9. Other
G.3.4 Are you enrolled under Ayushman Bharat Scheme?
G.3.5. If yes, were you able to claim benefits under the scheme when required?
G.3.6. If no, reasons:
G.3.7. Were you able to access reproductive health services? 1. Yes 2. No. 3. Not applicable
G.3.8 What are the preventative measures that you have been able to take against COVID-19?
Appendix II

88
1. Mask 2. Regular Washing of Hands 3. Using sanitiser 4. Immunity boosting tablets 5. Avoiding unnecessary travel 6. Physical Distancing 7. Other
G.4.1. Are you enrolled in any Workers Welfare Board? 1. Yes 2. No
G.4.2 If yes, which board?
G.4.3 Did you receive any relief amount from these boards?
G.5.1 State Level Schemes
Sl No Name of Scheme Enrolled
(Yes/No)Received Benefit (Yes/No)
Block H: Impact of Emergencies
H.1. Have you been affected by the recent disaster (flood, cyclone, drought, any other)- 1. Yes 2. No.
H.2.1 If yes, Impact Assessment:
House Damage 1. Yes 2. No.
Livelihood Loss1. Yes 2. No.
Water Shortage 1. Yes 2. No.
Food Shortage 1. Yes 2. No.
Loss of documents 1. Yes 2. No
Loss of valuables (cash, jewellery) 1. Yes 2. No
Loss of essential household items (cooking utensils for example)
Death in family 1. Yes 2. No
Workers in the Time of COVID-19Round II of the National Study on Informal Workers

89
H.3.1. Were you able to access relief?
Access to Relief
Source1. Self-pro-cured 2. Relief Camp/Govt 3. PDS 4. Distrib-uted by CSOs 5. Neigh-bours/Friends/Relatives
August (1. Yes 2- No)
Food Rations
Cooked Food
Shelter
Financial Support
Block I: Perceptions
I.1. If you have not been able to resume your livelihood, are you now considering shifting to another source of livelihood? Yes/No/don’t know
I.2. If you have resumed your livelihood, but your income is low, are you planning to shift to another source of livelihood? Yes/No? Don’t know
I.3. Would you want to continue staying in your source district? Yes/No/Don’t know. If yes, why? -Fear of disease in destination, lack of opportunities in destination fear of uncertainty at destination
Appendix II

90
I.4. If you are planning to migrate, do you want to go back to the same city/district you were working in prior to the lockdown or go somewhere else? Yes/no/don’t know
I.5. If you are planning to change destination place, on what factors is the decision based? Yes/No/not applicable/don’t know. If yes, why? -Based on contractor’s information, availability of local networks in the destination, proximity to source district, high wage, spread of disease
I.6. If you have been unable to resume livelihood, how much time would you require to return to your job: (1. Immediately 2. One to Three Months 3. More than 3 Months)
I.7. How much time your sector/industry would require to return to normalcy? (1-Short Term (less than three months) 2- Medium Term (3 to12 Months) and 3- Long Term (more than 12 months).
Any comments
Workers in the Time of COVID-19Round II of the National Study on Informal Workers

2
@actionaidindia
@actionaid_india
@actionaidcomms
ActionAid Association, F-5, First Floor, Kailash Colony New Delhi-110048.
+911-11-4064 0500
www.actionaidindia.org
@company/actionaidindia