Ross Hydrogen Storage 20041216
18
Institute for Materials Research University of Salford Hydrogen adsorption on carbon surfaces Keith Ross, Ian Morrison, Peter Georgiev, Jian Liu, Keith Ross, I an Morrison, Peter Georgiev, Jian Liu, Xiangyuan Xiangyuan Cui, Dan Bu ll, Juan Fern andez Cui, Dan Bu ll, Juan Fernandez- Garcia; Garcia; Institute for Materials Research Institute for Materials Research University of Salford, Manchester, UK. University of Salford, Manchester, UK. Timmy Ramirez Timmy Ramirez - Cuesta Cuesta , M ark A dams, Daniel , Mark Adams , Daniel Cologneisi Cologneisi , Ken , Ken Anderson, Anderson, ISIS, Rutherford Appleton Laboratory, ISIS, Rutherford Appleton Laboratory, Didcot Didcot , Oxon , Oxon
-
Upload
tuhin-dutta -
Category
Documents
-
view
220 -
download
0
Transcript of Ross Hydrogen Storage 20041216
8/8/2019 Ross Hydrogen Storage 20041216
http://slidepdf.com/reader/full/ross-hydrogen-storage-20041216 1/18
Institute for Materials ResearchUniversity of Salford
Hydrogen adsorption on carbon
surfaces
Keith Ross, Ian Morrison, Peter Georgiev, Jian Liu,Keith Ross, Ian Morrison, Peter Georgiev, Jian Liu, XiangyuanXiangyuan
Cui, Dan Bull, Juan FernandezCui, Dan Bull, Juan Fernandez--Garcia;Garcia; Institute for Materials Research Institute for Materials Research
University of Salford, Manchester, UK.University of Salford, Manchester, UK.
Timmy RamirezTimmy Ramirez--CuestaCuesta, Mark Adams, Daniel, Mark Adams, Daniel CologneisiCologneisi , Ken, KenAnderson,Anderson,
ISIS, Rutherford Appleton Laboratory, ISIS, Rutherford Appleton Laboratory, Didcot Didcot , Oxon , Oxon
8/8/2019 Ross Hydrogen Storage 20041216
http://slidepdf.com/reader/full/ross-hydrogen-storage-20041216 2/18
Institute for Materials Research
University of Salford
Hydrogen adsorption on carbon
surfaces
Measured using IGA
N2 BET Measurements H2 at pressures up top 20 Bars
On a Chemical Potential plot, a fixedadsorption energy gives a straightline
8/8/2019 Ross Hydrogen Storage 20041216
http://slidepdf.com/reader/full/ross-hydrogen-storage-20041216 3/18
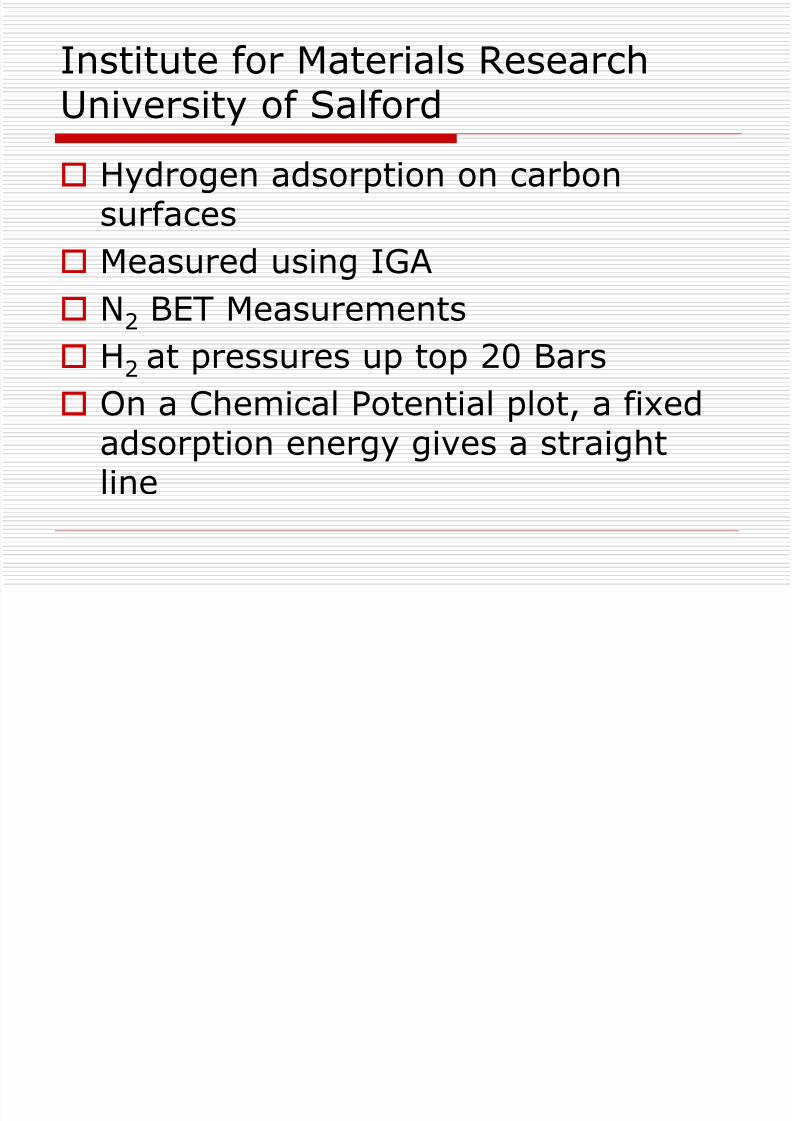
0 2000 4000 6000 8000 10000 12000
0.000
0.005
0.010
0.015
0.020
0.025
0.030
AP
SE
Darco
Pressure, mBar
S t o r a g e d e n s i t y ,
m g H
2 / m
2 a
d s o r b e n t
-90 -80 -70 -60 -50 -40 -30
0.000
0.005
0.010
0.015
0.020
0.025
0.030
AP
SEDarco
Chemical potential, meV
S t o r a g e c a p a c i t y ,
m g H
2 / m
2 a
d s o r b e n t
Hydrogen storage densities of the three materials as
functions of the equilibrium pressure in a, and the
chemical potential in b.
a
b
8/8/2019 Ross Hydrogen Storage 20041216
http://slidepdf.com/reader/full/ross-hydrogen-storage-20041216 4/18
-90 -80 -70 -60 -50 -40 -30
-0.2
0.0
0.2
0.4
0.6
0.8
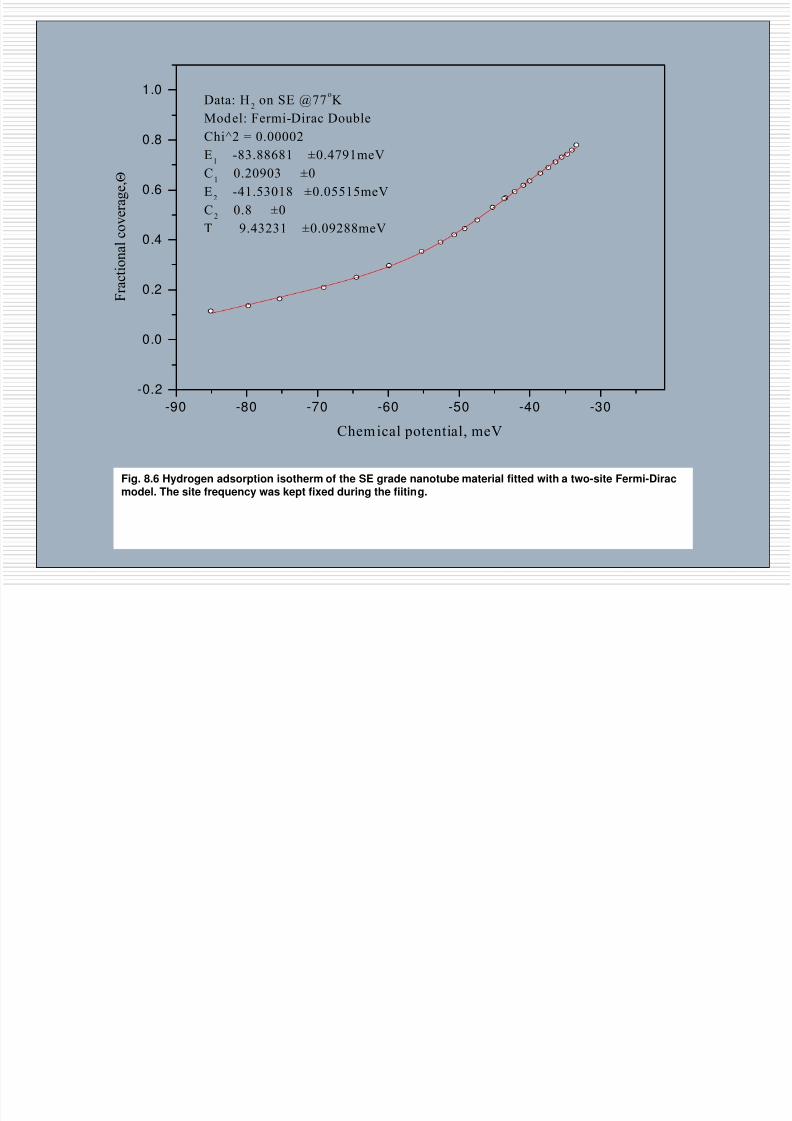
1.0
Data: H2 on SE @77
o
K Model: Fermi-Dirac Double
Chi^2 = 0.00002
E1
-83.88681 ±0.4791meV
C1
0.20903 ±0
E2
-41.53018 ±0.05515meV
C2 0.8 ±0T 9.43231 ±0.09288meV
Chemical potential, meV
F r a c t i o n a l c o v e r a g e , Θ
Fig. 8.6 Hydrogen adsorption isotherm of the SE grade nanotube material fitted with a two-site Fermi-Diracmodel. The site frequency was kept fixed during the fiiting.
8/8/2019 Ross Hydrogen Storage 20041216
http://slidepdf.com/reader/full/ross-hydrogen-storage-20041216 5/18
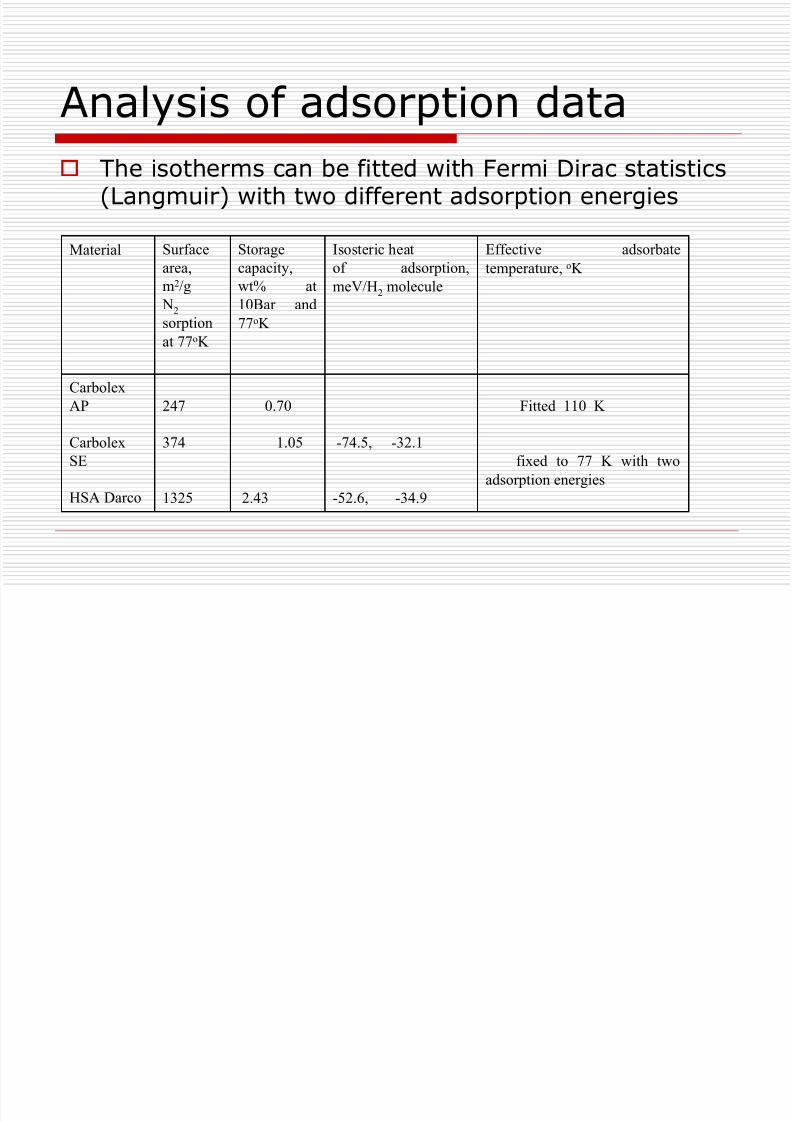
Analysis of adsorption data The isotherms can be fitted with Fermi Dirac statistics
(Langmuir) with two different adsorption energies
Material Surfacearea,m2/g
N2sorptionat 77oK
Storagecapacity,wt% at
10Bar and77oK
Isosteric heatof adsorption,meV/H2 molecule
Effective adsorbatetemperature, oK
Carbolex
AP
CarbolexSE
HSA Darco
247
374
1325
0.70
1.05
2.43
-74.5, -32.1
-52.6, -34.9
Fitted 110 K
fixed to 77 K with twoadsorption energies
8/8/2019 Ross Hydrogen Storage 20041216
http://slidepdf.com/reader/full/ross-hydrogen-storage-20041216 6/18
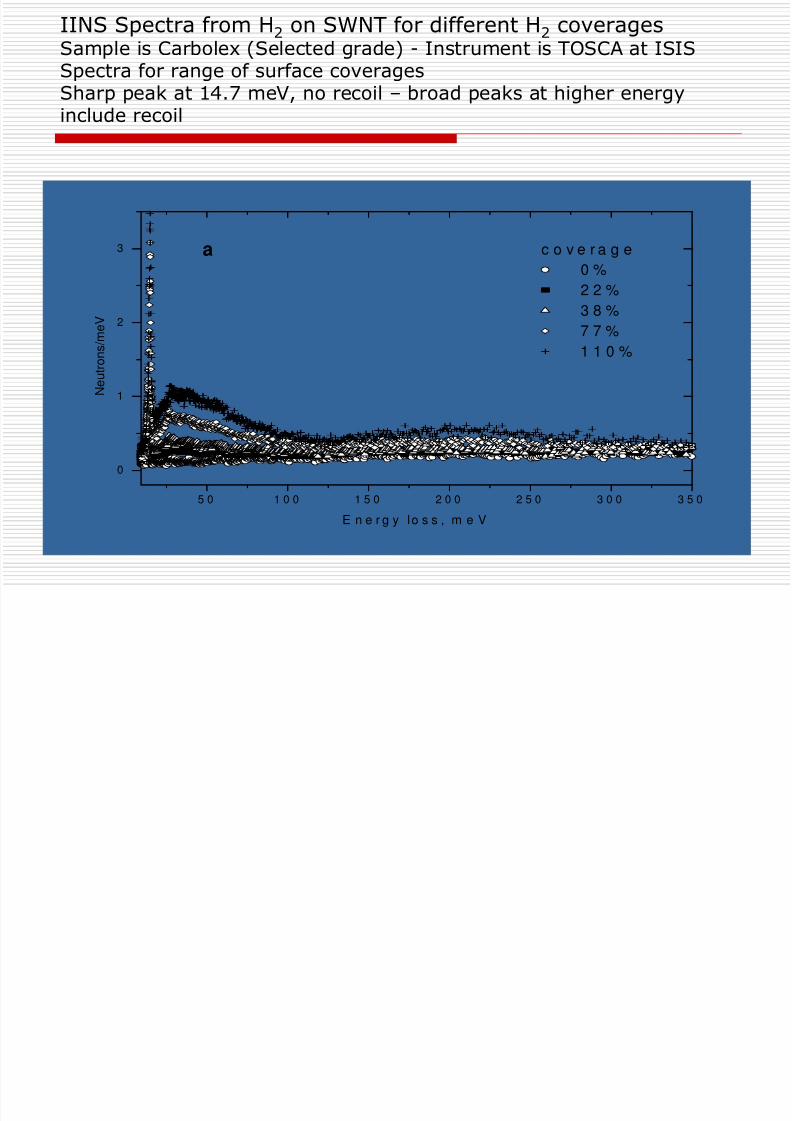
IINS Spectra from H2 on SWNT for different H2 coveragesSample is Carbolex (Selected grade) - Instrument is TOSCA at ISISSpectra for range of surface coveragesSharp peak at 14.7 meV, no recoil – broad peaks at higher energyinclude recoil
5 0 1 0 0 1 5 0 2 0 0 2 5 0 3 0 0 3 5 0
0
1
2
3 a c o v e r a g e
0 %
2 2 %
3 8 %7 7 %
1 1 0 %
E n e r g y lo s s , m e V
N e u t r o n s / m e V
8/8/2019 Ross Hydrogen Storage 20041216
http://slidepdf.com/reader/full/ross-hydrogen-storage-20041216 7/18
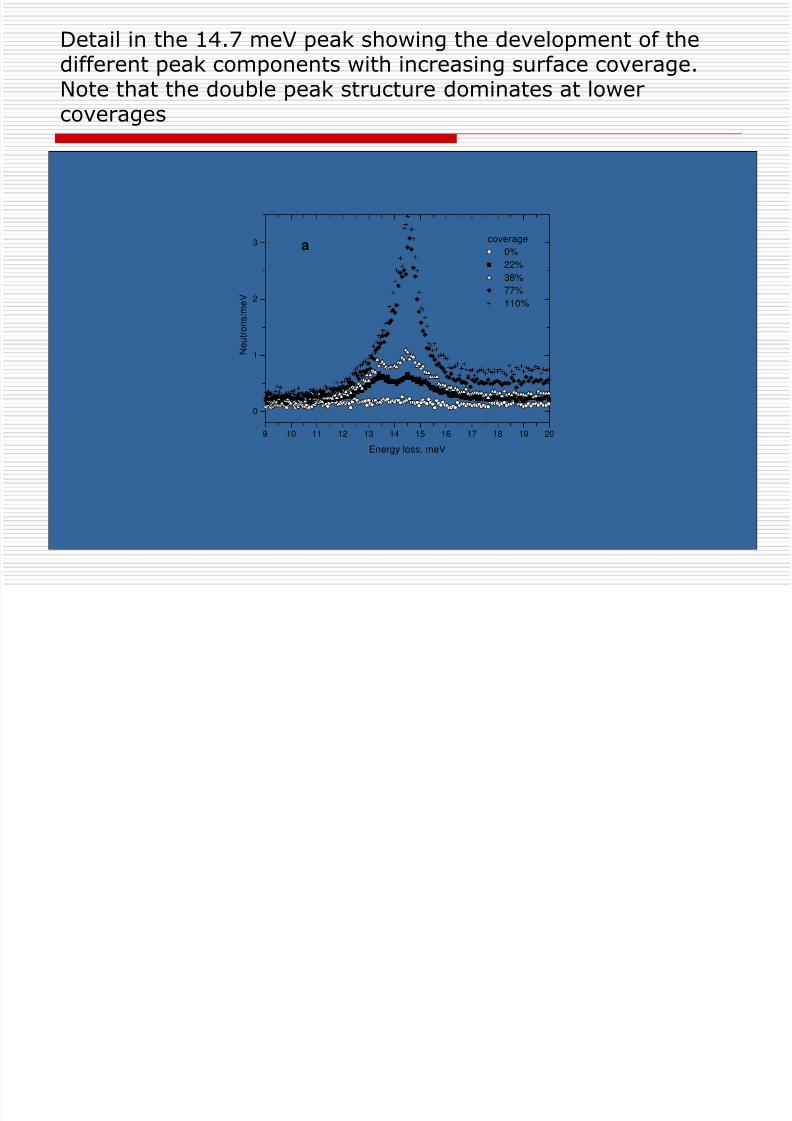
Detail in the 14.7 meV peak showing the development of thedifferent peak components with increasing surface coverage.Note that the double peak structure dominates at lowercoverages
9 10 11 12 13 14 15 16 17 18 19 20
0
1
2
3 acoverage
0%
22%
38%
77%
110%
Energy loss, meV
N e u t r o n s / m
e V
8/8/2019 Ross Hydrogen Storage 20041216
http://slidepdf.com/reader/full/ross-hydrogen-storage-20041216 8/18
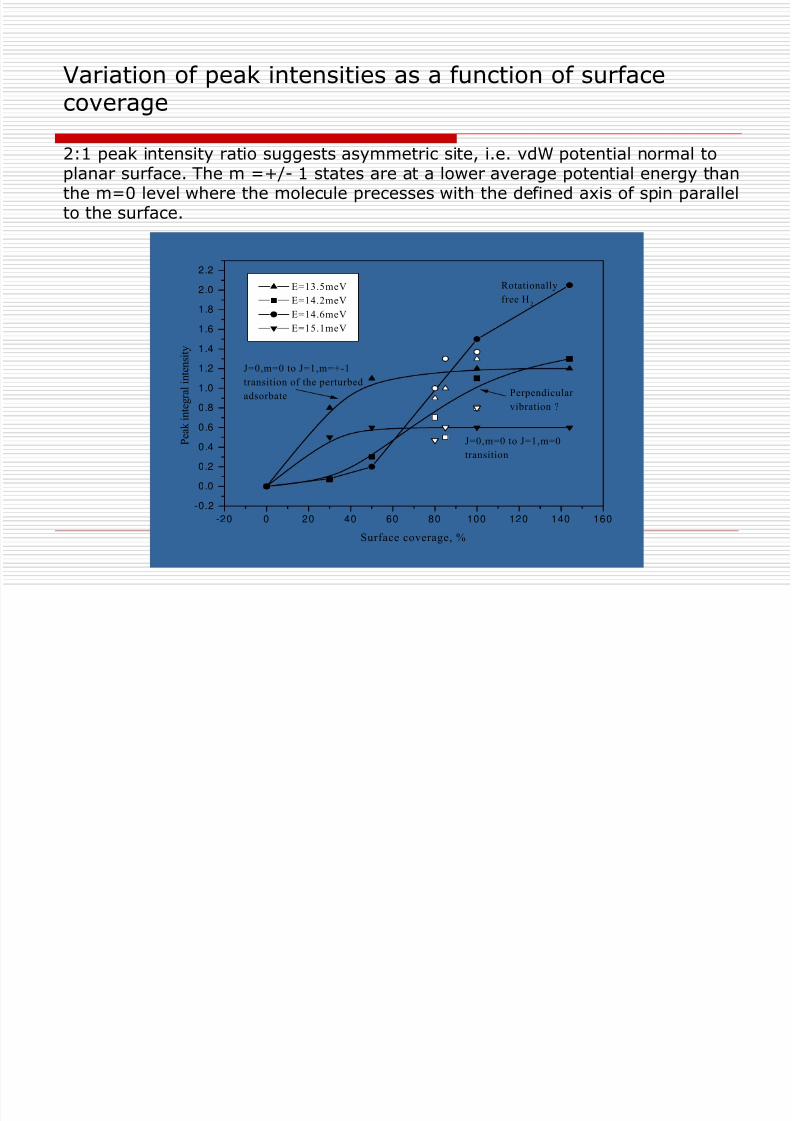
Variation of peak intensities as a function of surface
coverage
2:1 peak intensity ratio suggests asymmetric site, i.e. vdW potential normal toplanar surface. The m =+/- 1 states are at a lower average potential energy thanthe m=0 level where the molecule precesses with the defined axis of spin parallel
to the surface.
-20 0 20 40 60 80 100 120 140 160
-0.2
0.0
0.2
0.4
0.6
0.8
1.0
1.2
1.4
1.6
1.8
2.0
2.2
J=0,m=0 to J=1,m=0
transition
J=0,m=0 to J=1,m=+-1
transition of the perturbed
adsorbate Perpendicular
vibration ?
Rotationally
free H2
E=13.5meV
E=14.2meV
E=14.6meVE=15.1meV
Surface coverage, %
P e a k i n
t e g r a l i n t e n s i t y
8/8/2019 Ross Hydrogen Storage 20041216
http://slidepdf.com/reader/full/ross-hydrogen-storage-20041216 9/18
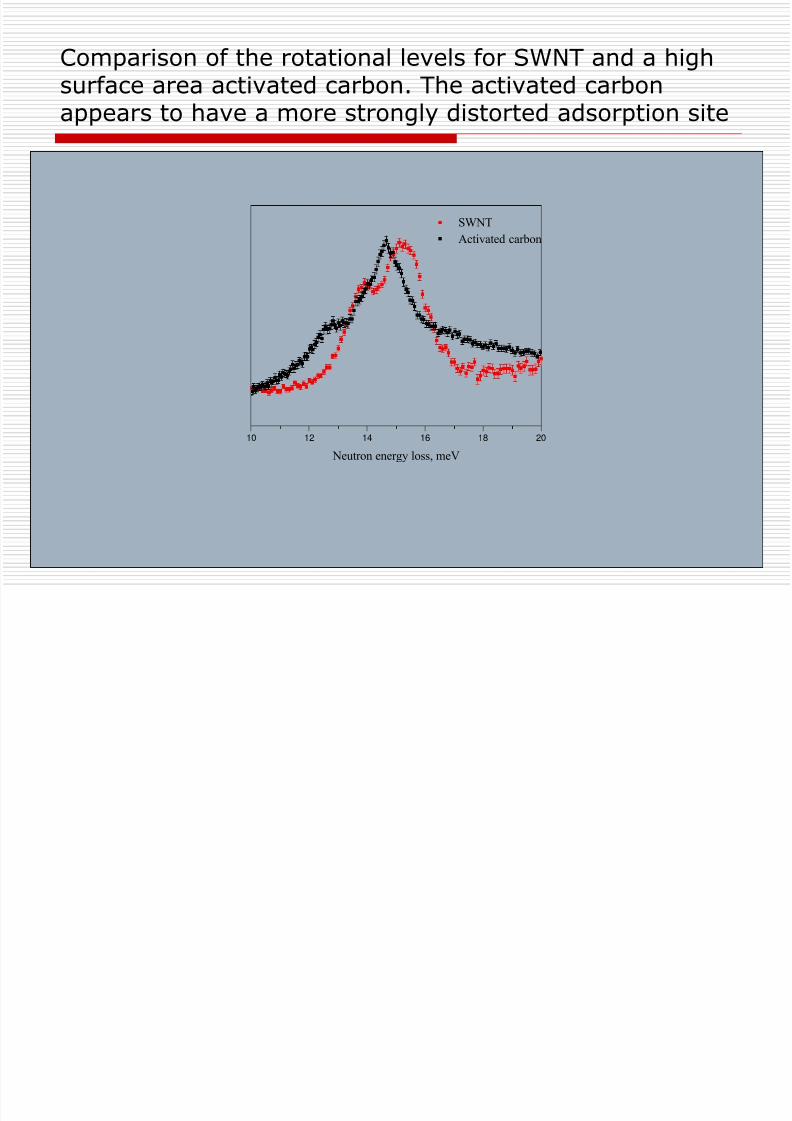
Comparison of the rotational levels for SWNT and a highsurface area activated carbon. The activated carbon
appears to have a more strongly distorted adsorption site
10 12 14 16 18 20
SWNT
Activated carbon
Neutron energy loss, meV
8/8/2019 Ross Hydrogen Storage 20041216
http://slidepdf.com/reader/full/ross-hydrogen-storage-20041216 10/18
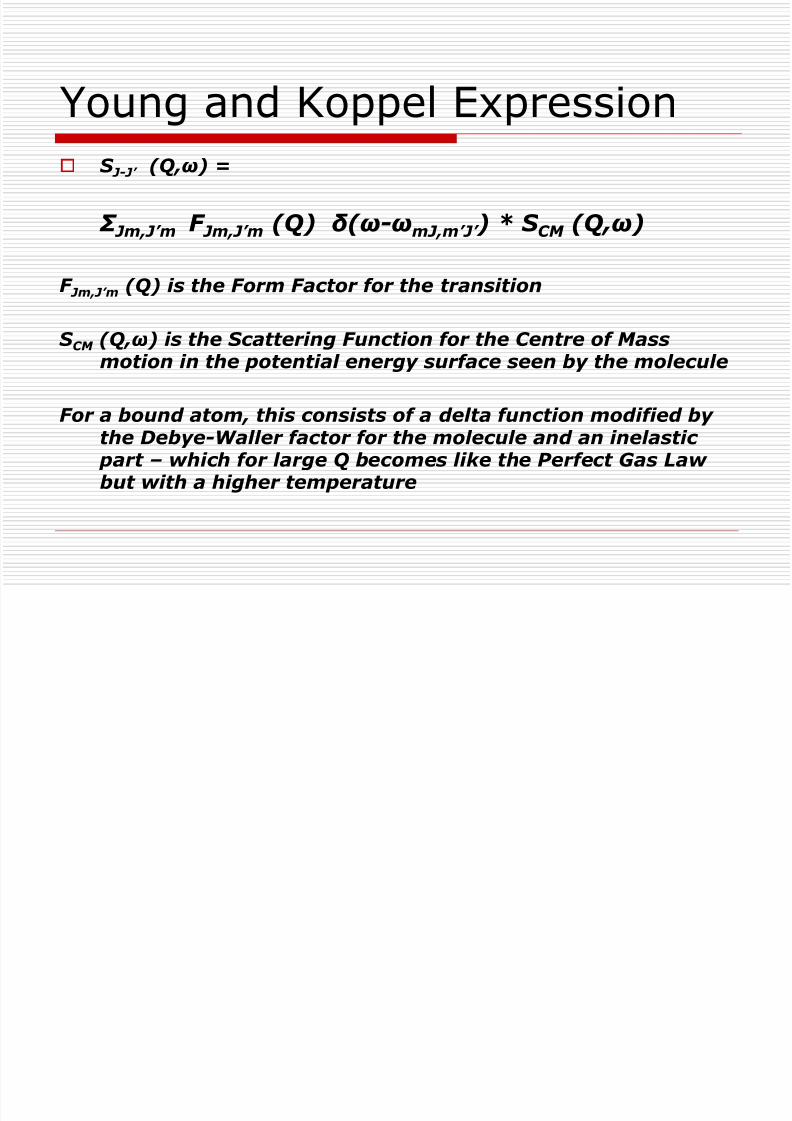
Young and Koppel Expression S J-J’ (Q,ω ) =
Σ Jm,J’m F Jm,J’m (Q) δ ( ω-ωmJ,m’J’ ) * S CM (Q,ω )
F Jm,J’m (Q) is the Form Factor for the transition
S CM (Q,ω ) is the Scattering Function for the Centre of Massmotion in the potential energy surface seen by the molecule
For a bound atom, this consists of a delta function modified by the Debye-Waller factor for the molecule and an inelastic
part – which for large Q becomes like the Perfect Gas Law but with a higher temperature
8/8/2019 Ross Hydrogen Storage 20041216
http://slidepdf.com/reader/full/ross-hydrogen-storage-20041216 11/18
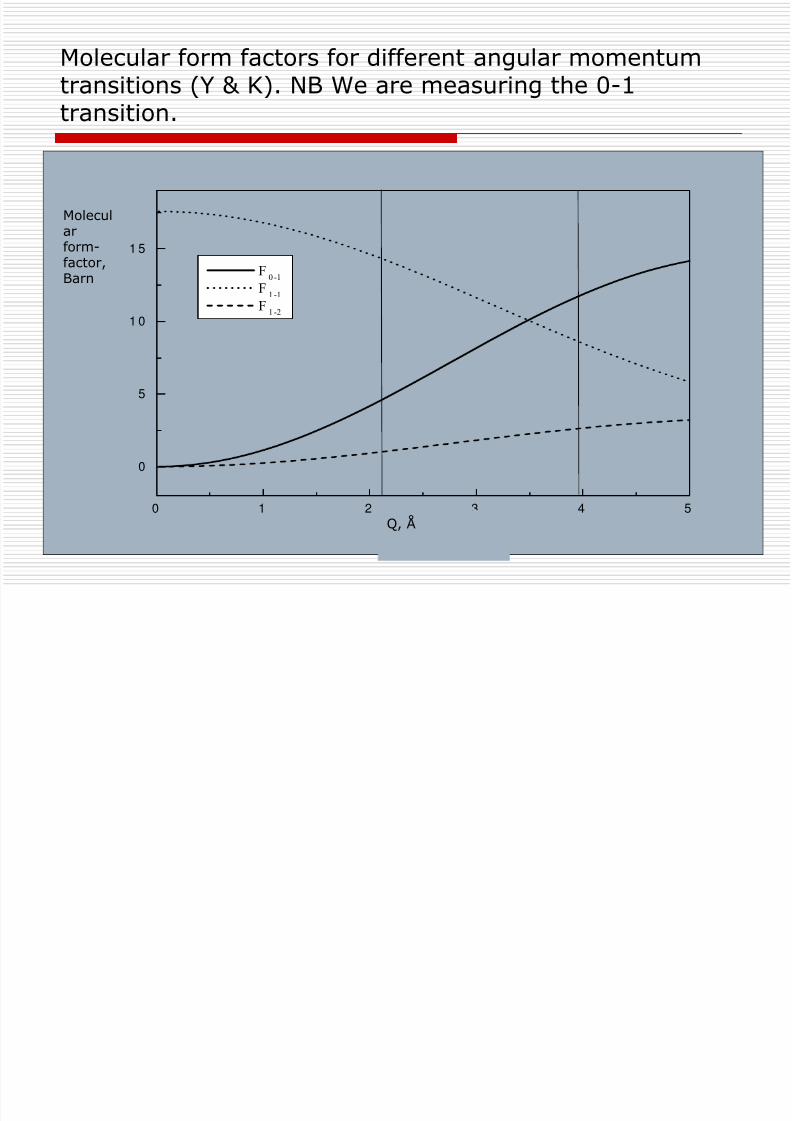
Molecular form factors for different angular momentumtransitions (Y & K). NB We are measuring the 0-1
transition.
0 1 2 3 4 5
0
5
1 0
1 5
F0 -1
F1 -1
F1 -2
Molecularform-factor,Barn
Q, Å
8/8/2019 Ross Hydrogen Storage 20041216
http://slidepdf.com/reader/full/ross-hydrogen-storage-20041216 12/18
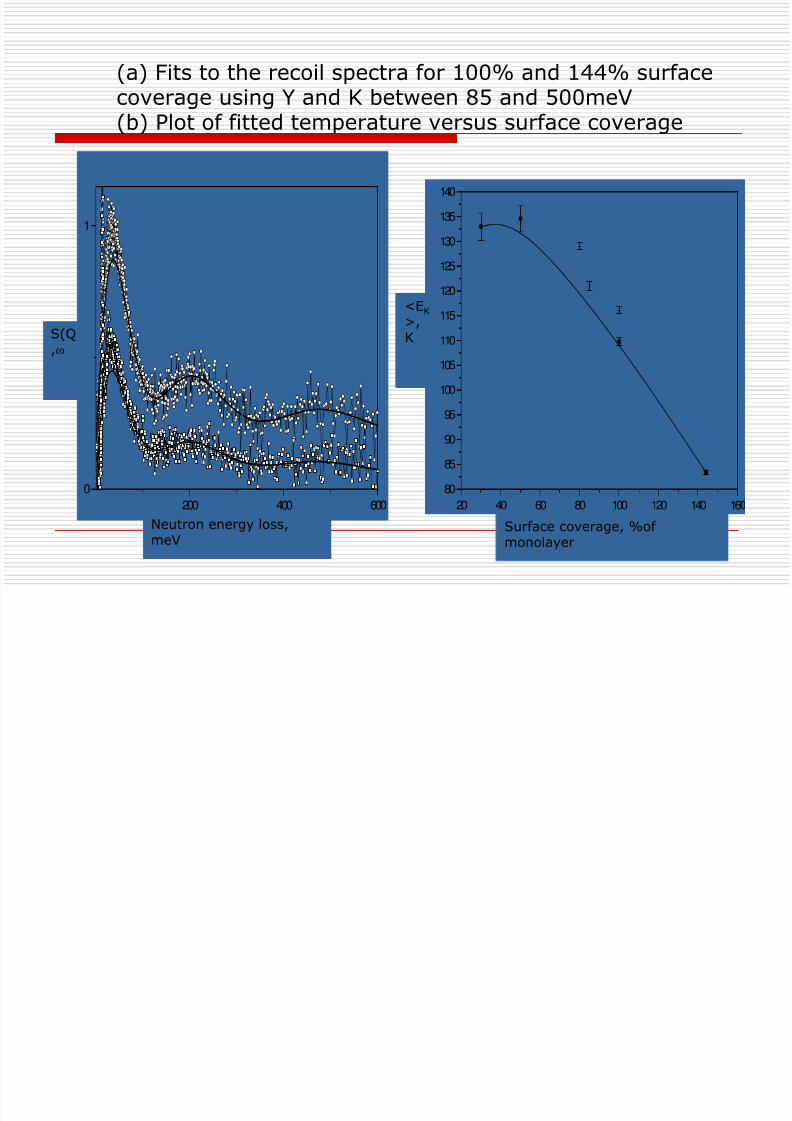
(a) Fits to the recoil spectra for 100% and 144% surface
coverage using Y and K between 85 and 500meV(b) Plot of fitted temperature versus surface coverage
200 400 600
0
1
S(Q,ω
Neutron energy loss,meV
20 40 60 80 100 120 140 16
80
85
90
95
100
105
110
115
120
125
130
135
140
<EK>,K
Surface coverage, %of monolayer
8/8/2019 Ross Hydrogen Storage 20041216
http://slidepdf.com/reader/full/ross-hydrogen-storage-20041216 13/18
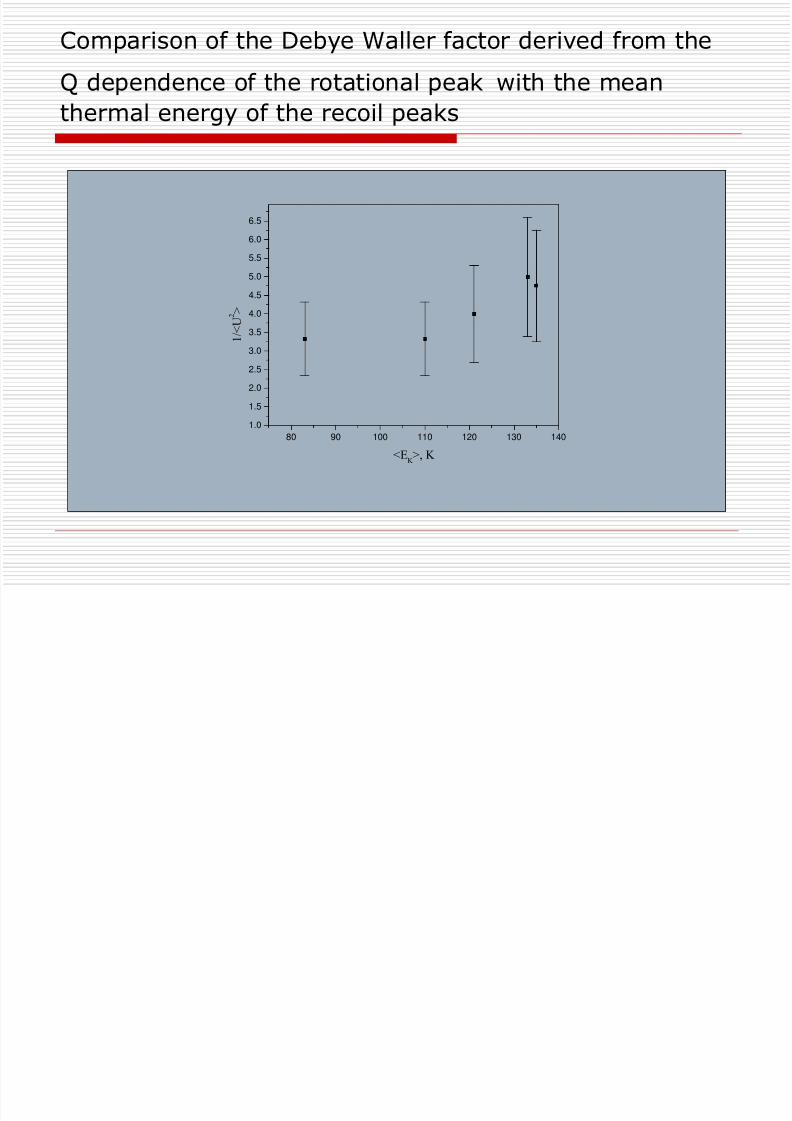
Comparison of the Debye Waller factor derived from the
Q dependence of the rotational peak with the mean
thermal energy of the recoil peaks
80 90 100 110 120 130 140
1.0
1.5
2.0
2.5
3.0
3.5
4.0
4.5
5.0
5.5
6.0
6.5
<EK >, K
1 / < U 2 >
8/8/2019 Ross Hydrogen Storage 20041216
http://slidepdf.com/reader/full/ross-hydrogen-storage-20041216 14/18
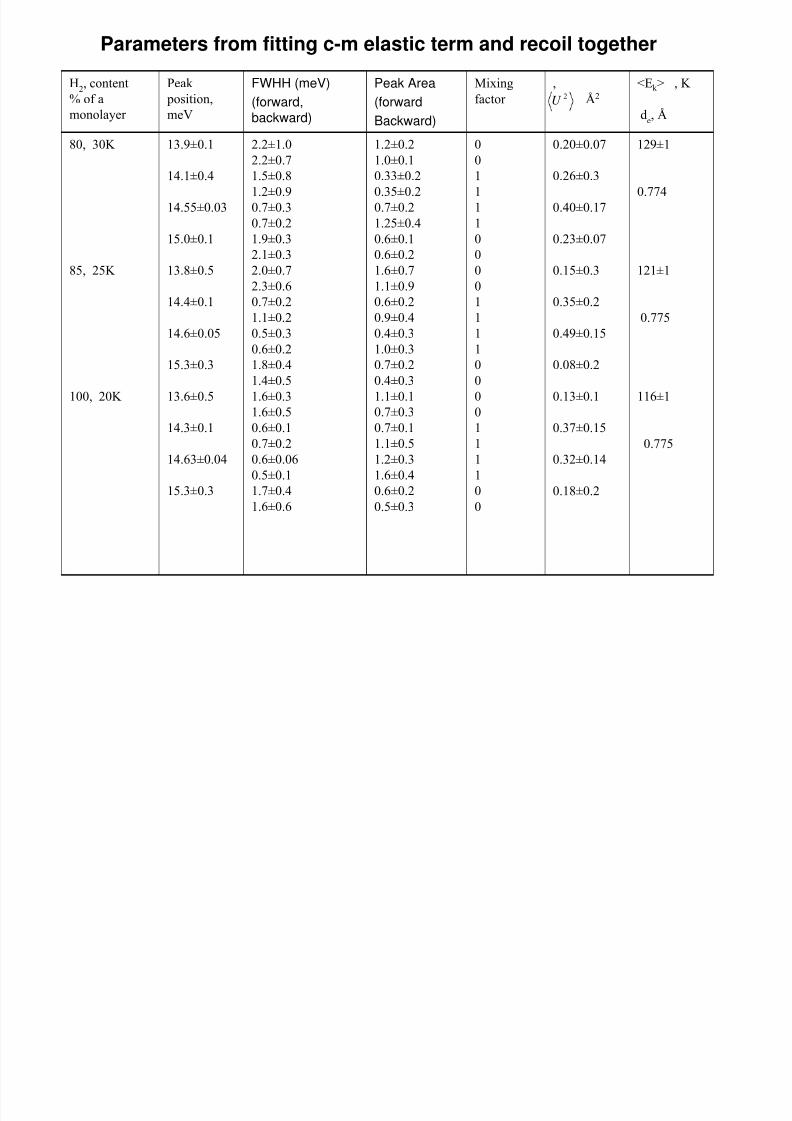
Parameters from fitting c-m elastic term and recoil together
2U
H2, content% of amonolayer
Peak position,meV
FWHH (meV)
(forward,backward)
Peak Area
(forwardBackward)
Mixingfactor
,Å2
<Ek > , K
de, Å
80, 30K
85, 25K
100, 20K
13.9±0.1
14.1±0.4
14.55±0.03
15.0±0.1
13.8±0.5
14.4±0.1
14.6±0.05
15.3±0.3
13.6±0.5
14.3±0.1
14.63±0.04
15.3±0.3
2.2±1.02.2±0.71.5±0.81.2±0.9
0.7±0.30.7±0.21.9±0.32.1±0.32.0±0.72.3±0.60.7±0.2
1.1±0.20.5±0.30.6±0.21.8±0.41.4±0.51.6±0.3
1.6±0.50.6±0.10.7±0.20.6±0.060.5±0.11.7±0.41.6±0.6
1.2±0.21.0±0.10.33±0.20.35±0.2
0.7±0.21.25±0.40.6±0.10.6±0.21.6±0.71.1±0.90.6±0.2
0.9±0.40.4±0.31.0±0.30.7±0.20.4±0.31.1±0.1
0.7±0.30.7±0.11.1±0.51.2±0.31.6±0.40.6±0.20.5±0.3
0011
1100001
111000
0111100
0.20±0.07
0.26±0.3
0.40±0.17
0.23±0.07
0.15±0.3
0.35±0.2
0.49±0.15
0.08±0.2
0.13±0.1
0.37±0.15
0.32±0.14
0.18±0.2
129±1
0.774
121±1
0.775
116±1
0.775
G h h i th t f i f th t h d
8/8/2019 Ross Hydrogen Storage 20041216
http://slidepdf.com/reader/full/ross-hydrogen-storage-20041216 15/18
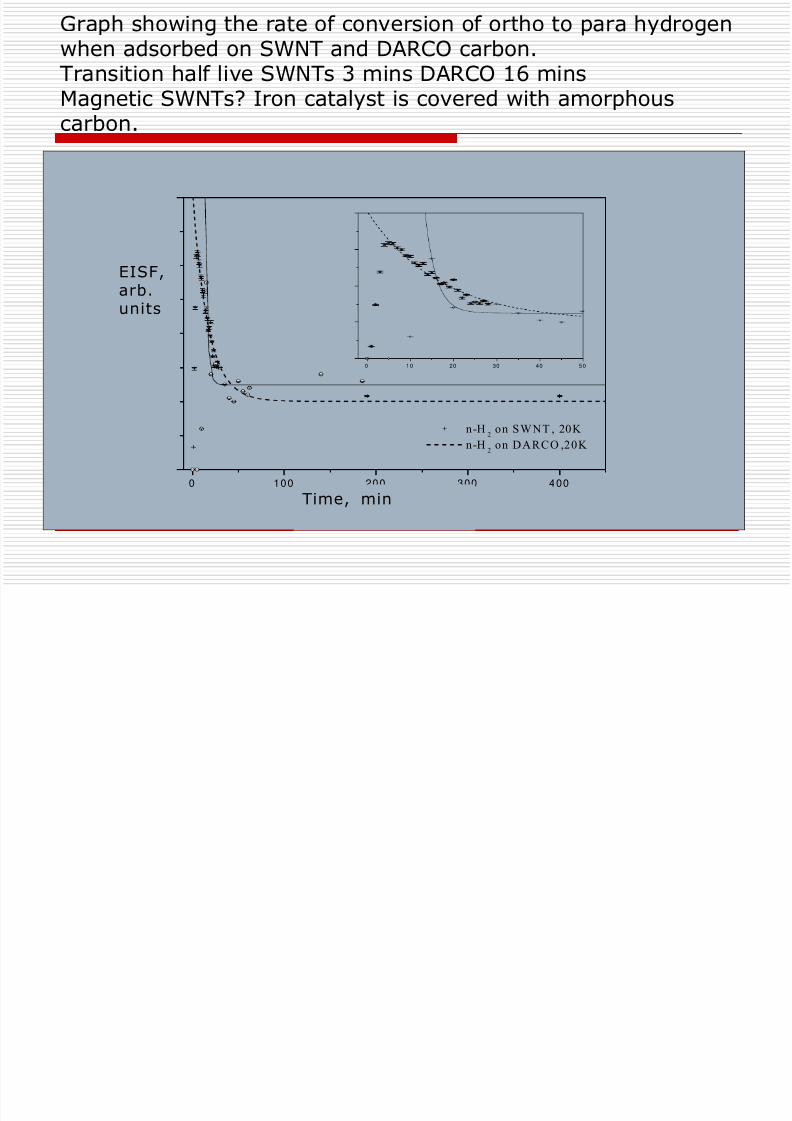
Graph showing the rate of conversion of ortho to para hydrogenwhen adsorbed on SWNT and DARCO carbon.Transition half live SWNTs 3 mins DARCO 16 mins
Magnetic SWNTs? Iron catalyst is covered with amorphouscarbon.
0 100 200 300 400
n-H2
on SWNT , 20K
n-H2
on DARCO ,20K
0 10 20 30 40 50
Time, min
EISF,arb.
units

8/8/2019 Ross Hydrogen Storage 20041216
http://slidepdf.com/reader/full/ross-hydrogen-storage-20041216 16/18
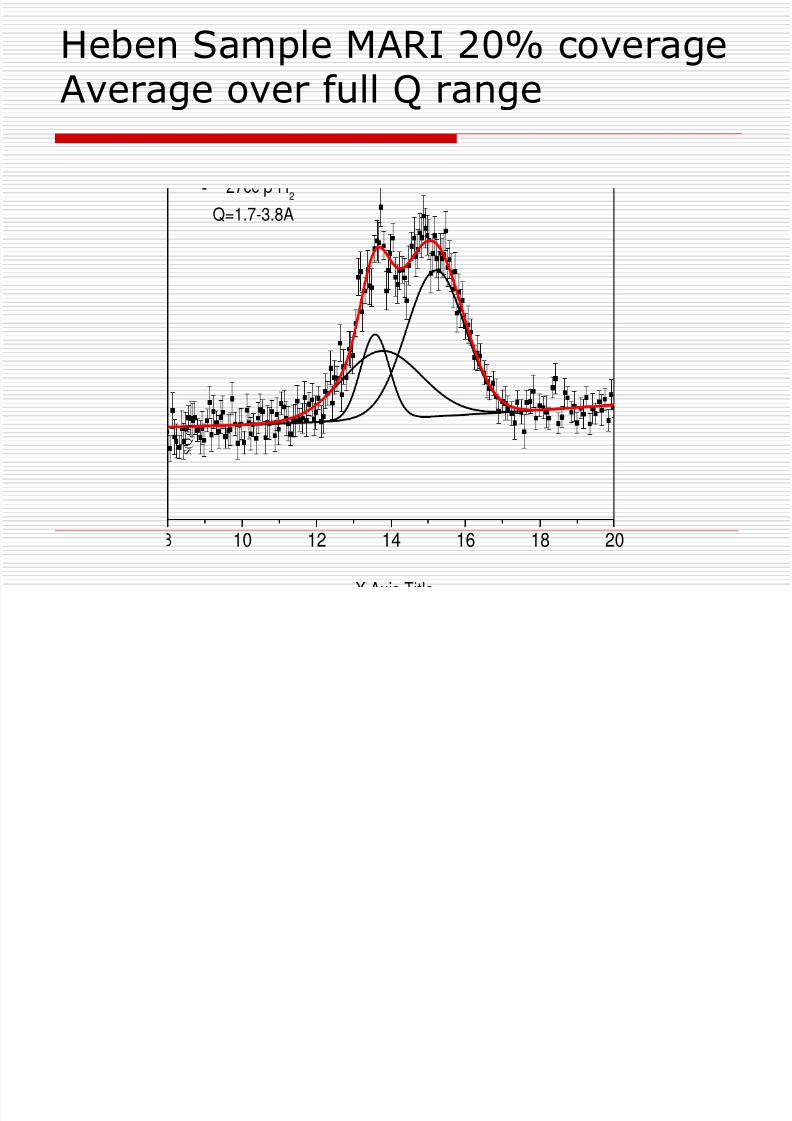
New MARI data on SWNT sample from Heben
Monolayer coverage 140m ccs H2 at NTP
Neutron energy loss, meV
12 14 16 18 20
X Axis Title
Q=2.4-2.9, T=17K
140cc pH2
40cc
17cc
S ( Q , ω )
8/8/2019 Ross Hydrogen Storage 20041216
http://slidepdf.com/reader/full/ross-hydrogen-storage-20041216 17/18
Q dependence of the peak intensity
8/8/2019 Ross Hydrogen Storage 20041216
http://slidepdf.com/reader/full/ross-hydrogen-storage-20041216 18/18
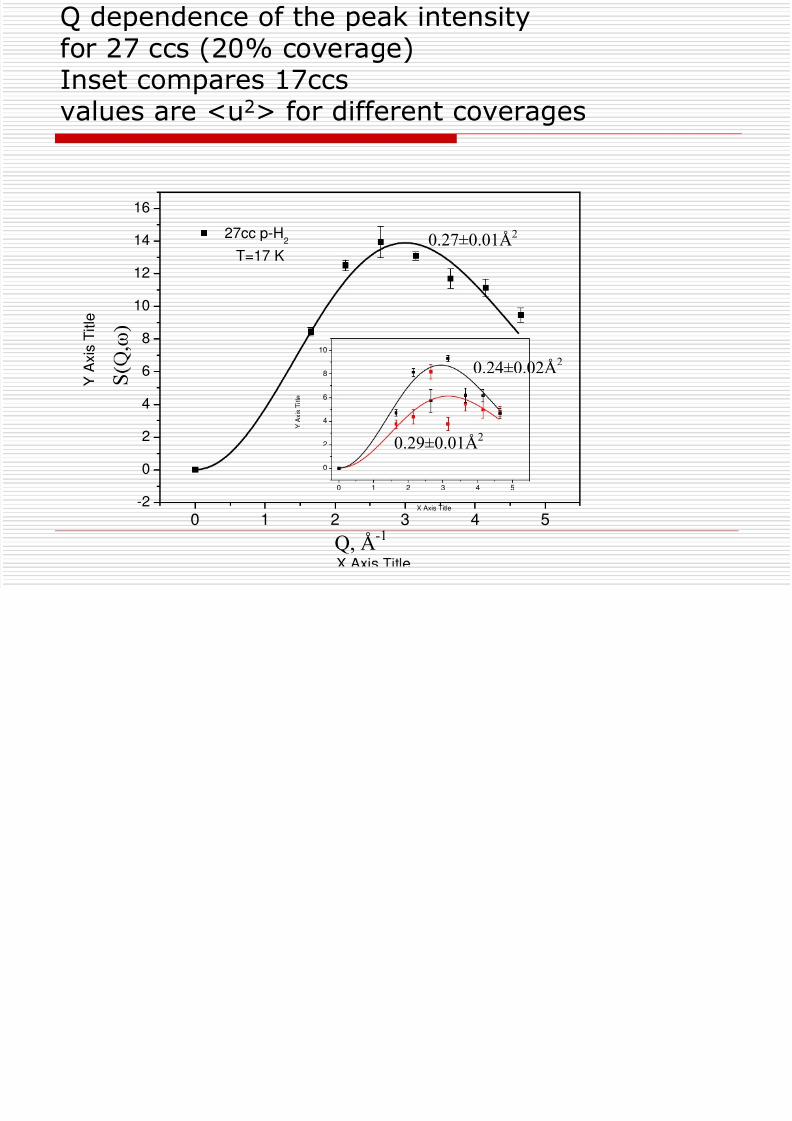
Q dependence of the peak intensityfor 27 ccs (20% coverage)Inset compares 17ccs
values are <u2> for different coverages
0 1 2 3 4 5
-2
0
2
4
6
8
10
12
14
16
Y A
x i s T i t l e
27cc p-H2
T=17 K
0 1 2 3 4 5
0
2
4
6
8
10
Y
A x
i s T i t l e
X Axis Title
Q, Å-1
S
, ω
0.24±0.02Å2
0.29±0.01Å2
0.27±0.01Å2