Role of ClC-K and barttin in low-potassium induced sodium … · Role of ClC-K and barttin in...
36
Role of ClC-K and barttin in low-potassium induced sodium-chloride cotransporter activation and hypertension in mouse kidney Naohiro Nomura*, Wakana Shoda, Yuanlong Wang, Shintaro Mandai, Taisuke Furusho, Daiei Takahashi, Moko Zeniya, Eisei Sohara, Tatemitsu Rai, Shinichi Uchida Affiliation: Department of Nephrology, Graduate School of Medical and Dental Sciences, Tokyo Medical and Dental University, 1-5-45 Yushima, Bunkyo, Tokyo 113-8519, Japan *Corresponding author: Naohiro Nomura Department of Nephrology, Graduate School of Medical and Dental Sciences, Tokyo Medical and Dental University Address: 1- 5-45 Yushima, Bunkyo, Tokyo 113- 8519, Japan Tel: +81-3-5803-5214; Fax: +81-3-5803-5215 E-mail: [email protected] ACCEPTED MANUSCRIPT 10.1042/BSR20171243 . Please cite using the DOI 10.1042/BSR20171243 http://dx.doi.org/ up-to-date version is available at encouraged to use the Version of Record that, when published, will replace this version. The most this is an Accepted Manuscript, not the final Version of Record. You are : Bioscience Reports ). http://www.portlandpresspublishing.com/content/open-access-policy#Archiving Archiving Policy of Portland Press ( which the article is published. Archiving of non-open access articles is permitted in accordance with the Use of open access articles is permitted based on the terms of the specific Creative Commons Licence under
Transcript of Role of ClC-K and barttin in low-potassium induced sodium … · Role of ClC-K and barttin in...
Role of ClC-K and barttin in low-potassium induced sodium-chloride
cotransporter activation and hypertension in mouse kidney
Naohiro Nomura*, Wakana Shoda, Yuanlong Wang, Shintaro Mandai, Taisuke
Furusho, Daiei Takahashi, Moko Zeniya, Eisei Sohara, Tatemitsu Rai, Shinichi
Uchida
Affiliation:
Department of Nephrology, Graduate School of Medical and Dental Sciences, Tokyo
Medical and Dental University, 1-5-45 Yushima, Bunkyo, Tokyo 113-8519, Japan
*Corresponding author: Naohiro Nomura
Department of Nephrology, Graduate School of Medical and Dental Sciences, Tokyo
Medical and Dental University
Address: 1-5-45 Yushima, Bunkyo, Tokyo 113-8519, Japan
Tel: +81-3-5803-5214; Fax: +81-3-5803-5215
E-mail: [email protected]
AC
CE
PT
ED
MA
NU
SC
RIP
T
10.1042/BSR20171243. Please cite using the DOI 10.1042/BSR20171243http://dx.doi.org/up-to-date version is available at
encouraged to use the Version of Record that, when published, will replace this version. The most this is an Accepted Manuscript, not the final Version of Record. You are:Bioscience Reports
). http://www.portlandpresspublishing.com/content/open-access-policy#ArchivingArchiving Policy of Portland Press (which the article is published. Archiving of non-open access articles is permitted in accordance with the Use of open access articles is permitted based on the terms of the specific Creative Commons Licence under
2
Abstract
The sodium-chloride cotransporter (NCC) has been identified as a key molecule
regulating potassium balance. The mechanisms of NCC regulation during low
extracellular potassium concentrations have been studied in vitro. These studies have
shown that hyperpolarization increased chloride efflux, leading to the activation of
chloride-sensitive WNK kinases and their downstream molecules, including
STE20/SPS1-related proline/alanine-rich kinase (SPAK) and NCC. However, this
mechanism was not studied in vivo. Previously, we developed the barttin
hypomorphic mouse (Bsndneo/neo mice), expressing very low levels of barttin and ClC-
K channels, because barttin is an essential ß-subunit of ClC-K. In contrast to Bsnd-/-
mice, Bsndneo/neo mice survived to adulthood. In Bsndneo/neo mice, SPAK and NCC
activation after consuming a low-potassium diet was clearly impaired compared to
that in wild-type mice. In ex vivo kidney slice experiment, the increase in
phosphorylated NCC and SPAK in low-potassium medium was also impaired in
Bsndneo/neo mice. Furthermore, increased blood pressure was observed in wild-type
mice fed a high-salt and low-potassium diet, which was not evident in Bsndneo/neo
mice. Thus, our study provides in vivo evidence that, in response to a low-potassium
diet, ClC-K and barttin play important roles in the activation of the WNK4-SPAK-
NCC cascade and blood pressure regulation.
Key Words
Hypertension, transport, chloride, renal physiology

3
Introduction
Hypertension is a major worldwide public health problem associated with a
variety of complications including stroke, heart failure and kidney failure. Diets play
a strong contributory role in blood pressure. Dietary potassium (K+) intake is highly
related to blood pressure and mortality, and recent studies have shown that K+ intake
was inversely related to blood pressure [1–3]. The sodium (Na+)-chloride (Cl-)
cotransporter (NCC) expressed in the distal convoluted tubules (DCT) in the kidney
plays an important role in the regulation of urinary K+ excretion, as well as in blood
pressure regulation by NaCl reabsorption. In previous animal studies, a low-K+ diet
increased the total amount and the phosphorylation of NCC [4–9] and elevated blood
pressure [4,10]. This elevation of blood pressure with a low-K+ diet was dependent
upon NCC, because NCC-/- mice did not show an elevation of blood pressure when
under a low-K+ diet [4]. Although NCC itself does not directly transport K+, the
amount of NaCl reabsorption in the DCT affects the delivery of Na+ to the
downstream cortical collecting ducts where K+ is excreted, based upon Na+
reabsorption via epithelial Na+ channels. The notion that the NCC is important for
regulating K+ excretion is also supported by the facts that two genetic diseases,
Gitelman syndrome (caused by the loss-of-function of NCC) and
pseudohypoaldosteronism type II (caused by the gain-of-function of NCC) show
hypokalemia and hyperkalemia, respectively [11,12].
With-no-lysine kinase (WNK) kinases phosphorylate the STE20/SPS-1-44
related proline-alanine-rich protein kinase (SPAK) and the related oxidative stress-
related kinase (OSR1), which directly activate NCC [13,14]. It has been proposed that
the phosphorylation of NCC with a low-K+ diet is dependent upon WNK4 and
OSR1/SPAK kinases. Low-K+ activates not only NCC but also WNKs and SPAK
4
[4,7,8,10]. Furthermore, WNK4-/- and SPAK-/- mice showed either no increase, or
only a mild increase, in phosphorylation of NCC (pNCC) in response to a low-K+
diet, respectively [4,7–9,15]. Disrupting both SPAK and OSR1 almost completely
ablated the response of pNCC to dietary K+ restriction [4,9]. The mechanism by
which low-K+ activates WNKs was previously investigated in cultured cells and
postulated as follows: a decrease in extracellular K+ concentration ([K+]ex) affects the
membrane potential of cells, thereby decreasing intracellular Cl- concentration ([Cl-]i)
with Cl- efflux via a Cl- channel [4]. Since WNK kinases are regulated by [Cl-]i
[15,16], this decrease of [Cl-]i by low [K+]ex activates WNK signaling. As for the
molecular identity of the channel responsible for the Cl- efflux in DCT, ClC-Kb (a
human homolog of ClC-K2) chloride channel has been postulated due to its
localization in the DCT [17,18]. Additional genetic evidence showed that Barter
syndrome type III caused by the loss-of-function mutations in the CLCKB gene
(which codes ClC-Kb) had similar phenotypes to Gitelman syndrome [19,20].
Further, a recent study using patch clamp analysis of tubules isolated from the ClC-
K2 knockout mouse reported that ClC-K2 is the predominant Cl- channel on the
basolateral membrane of DCT cells [21]. Indeed, Terker et al. prepared HEK293 cells
overexpressing wild-type or loss-of-function mutant ClC-Kb, and they found that
low-K+-induced phosphorylation of NCC was attenuated by the mutation suggesting
the potential role of ClC-Kb in regulating [Cl-]i in the DCT cells [4]. However, these
data were obtained only from in vitro cultured cell studies. To clarify the contribution
of ClC-K2 in the mechanism of NCC phosphorylation in response to K+ restriction in
vivo, we performed animal studies. Previously, we generated Bsndneo(R8L)/neo(R8L)
(Bsndneo/neo) mice, which are hypomorphic of a disease-causing mutant barttin (R8L
barttin) [22]. Barttin (coded by the Bsnd gene) is an essential ß-subunit for both ClC-
5
Ka/1 and ClC-Kb/2 channels [23,24]. Since barttin is crucial for ClC-K membrane
localization and stability, the genetic ablation of barttin resulted in a ClC-K knockout
condition [25]. We used Bsndneo/neo mice to investigate the role of ClC-K and barttin
in NCC activation by low-K+ diet.
Materials and methods Animal experiments. All experiments were performed in accordance with the guidelines for animal
research of Tokyo Medical and Dental University, and the protocol was approved by
The Animal Care and Use Committee of Tokyo Medical and Dental University.
Studies were performed on Bsndneo/neo mice (C57BL6 background) as a loss-of-
function model for ClC-K [22]. Littermates wild-type mice or C57BL/6 mice (Japan
SLC, Inc., Hamamatsu, Japan) were used for wild-type control mice. We used mixed
sex, 20-30-g body weight, 10-16-week-old age mice. These parameters were matched
in each group. A high salt and normal-K+ diet (6% NaCl, 1% K+, a HSNK diet) and a
high salt and low-K+ diet (6% NaCl, 0.01% K+, a HSLK diet) were prepared by
adding NaCl and KCl (or sucrose for adjustment of volume) to a K+-deficient diet
which were modified from AIN-76 diet (Oriental Yeast Co., Tokyo, Japan). Blood was
collected from the retro-orbital venous plexus under anesthesia. Blood data were
analyzed by iSTAT EC8+ (Abbott, Inc., Abbott Park, IL). Serum aldosterone levels
were measured by the SRL clinical laboratory service (Tokyo, Japan). Noninvasive
systolic blood pressures were measured by a programmable tail-cuff
sphygmomanometer (MK-2000A, Muromachi Kikai Co., Tokyo, Japan) with the
investigator blinded for the treatment groups. Systolic blood pressure of mice
consuming a HSNK diet was measured after a two-day period of acclimation to the

6
instrument. Blood pressure was recorded again two days after switching diets from a
HSNK diet to a HSLK diet. The changes in blood pressure after the switching diets
were compared between wild-type mice and Bsndneo/neo mice with un-paired t-test.
Each blood pressure data point was calculated as the mean of around 20 sequential
measurements.
Western blotting and immunofluorescence
Immunoblotting and immunofluorescence were performed as previously
described [7]. The detail of the method is described in a supplementary information.
Briefly, kidneys were homogenized, and then the homogenates were centrifuged to
separate to entire kidney samples without the nuclear fraction, as either whole kidney
lysates (600 g, supernatant) and crude membrane fraction (17000 g, pellet). The
membrane fractions were used for the analysis of barttin, ClC-K, pNCC, and tNCC.
The whole kidney lysates were used for the WNK4, pSPAK, and tSPAK detection.
The relative intensities of immunoblot bands were analyzed and quantified using
ImageJ software (National Institutes of Health, Bethesda, MD). For the experiment of
correlation between pNCC and plasma K+ concentration (Fig. 2D), each value of
pNCC/tNCC from HSLK groups were compared with their internal control group on
a HSNK diet. pNCC/tNCC average of the internal control group was set to 1.
For immunofluorescence, kidneys were fixed by perfusion through the left
ventricle with periodate lysine (0.2 M) and paraformaldehyde (2%) in phosphate-
buffered saline. Tissue samples were soaked for several hours in 20% sucrose in
phosphate-buffered saline, embedded in Tissue Tek O.C.T. Compound (Sakura Fine-
technical Co., Ltd, Tokyo, Japan), and frozen in liquid nitrogen.
7
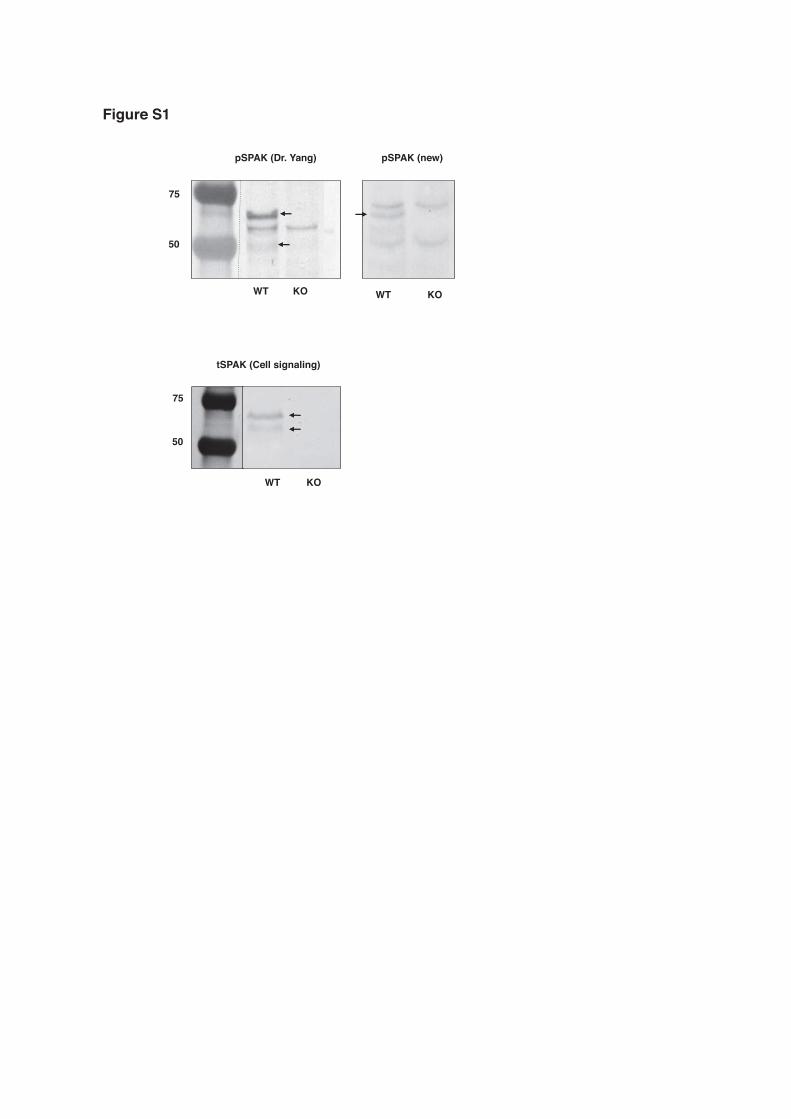
Antibodies are listed in Table S1. The primary antibodies used in this study
were as follows: rabbit anti-WNK4 [7], rabbit anti-phosphorylated SPAK (Ser 383,
kindly gifted by Dr. Yang SS) [26], rabbit anti-total SPAK (Cell Signaling
Technology, Inc., Danvers, MA. #2281), rabbit anti-phosphorylated NCC (Ser 71)
[27], rabbit anti-total NCC [7], guinea pig anti-total NCC [7,22], rabbit anti-ClC-K
(kindly gifted by Dr. Jentsch TJ) [25] and rabbit anti-actin antibody (Cytoskeleton,
Inc. Denver, CO. AAN01, Lot 121). We raised a new anti-phosphorylated-SPAK
antibody in rabbit against the synthetic peptide, which recognizes a same
phosphorylation site as previous one [26]. The band of WNK4, phosphorylated SPAK
and total SPAK had been confirmed by using the knock out mice (Fig. S1) [7]. We
used two difference pSPAK antibodies because we had used up the previous one. As
for secondary antibodies, alkaline phosphatase-conjugated anti-IgG antibodies
(Promega Corporation, Fitchburg, WI) and Alexa 488 or 546 dye-labeled antibodies
(Molecular Probes, Inc., Eugene, OR) were used for Western blotting and
immunofluorescence, respectively. Western Blue® (Promega Corporation, Fitchburg,
WI) was used to detect the signals, and immunofluorescence images were acquired
using the LSM510 Meta confocal microscope (Carl Zeiss, Oberkochen, German). The
linearity of protein detection for each antibody was confirmed in Figure S2, S3 and
S4.
Ex vivo kidney slice experiment
Kidney slices were prepared as described previously [28]. Kidney slices of less
than 0.5 mm were cut using a microslicer (Natume Seisakusho Co., Ltd, Tokyo,
Japan) on ice-cold Hank’s buffer medium. (110 mM NaCl, 3 mM KCl, 1.2 mM
MgSO4, 1.8 mM CaCl2, 4 mM Na acetate, 1 mM Na citrate, 6 mM D-glucose, 6 mM
8
L-alanine, 1 mM NaH2PO4, 3 mM Na2HPO4, 25 mM NaHCO3). All of the sliced
kidneys were incubated in the Hank’s buffer medium at room temperature for 20 min.
After the recovery in the Hank’s buffer medium for 20 min, the slices from a same
kidney were separated in normal-K+ (4 mEq/l) or low-K+ (2 mEq/l) medium, then
incubated for 30 min at 28 oC. Different K+ concentration medium was prepared by
using KCl or choline chloride to maintain the same Cl- concentration in each medium.
During the experiments, all solutions were continuously bubbled with 95% O2 and 5%
CO2. After the incubation, slices were snap frozen in liquid nitrogen and processed for
immunoblotting as same as for whole kidney samples described above and
supplementary information. After Western blotting, the fold change of the band
density in a low-K+ medium to the one in a normal medium were analyzed.
Statistical analysis
Data were presented as the means ± SEM. Two-way ANOVA and Bonferroni’s
posttest was used to compare the multiple groups while the t-test was used to
compare two groups. For all analyzes, a p-value <0.05 was considered to be
statistically significant. For correlation analyzes, Pearson’s test was performed.
Results
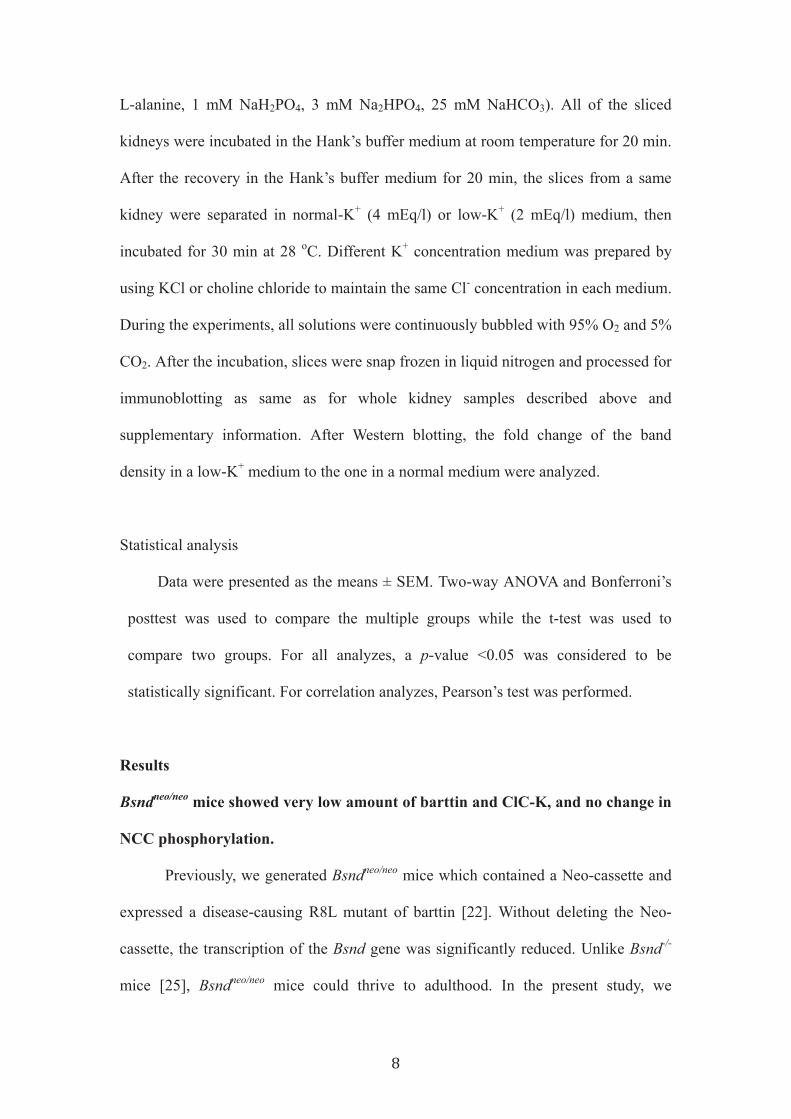
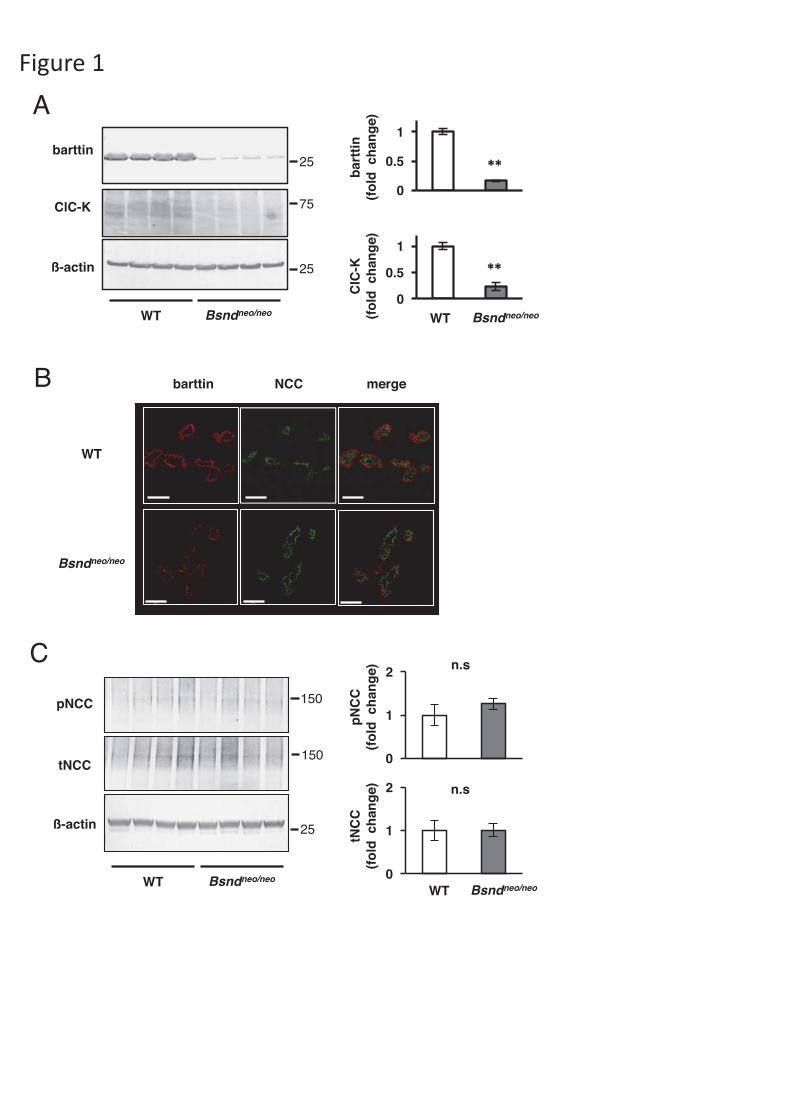
Bsndneo/neo mice showed very low amount of barttin and ClC-K, and no change in
NCC phosphorylation.
Previously, we generated Bsndneo/neo mice which contained a Neo-cassette and
expressed a disease-causing R8L mutant of barttin [22]. Without deleting the Neo-
cassette, the transcription of the Bsnd gene was significantly reduced. Unlike Bsnd-/-
mice [25], Bsndneo/neo mice could thrive to adulthood. In the present study, we
9
confirmed that Bsndneo/neo mice expressed only minimal amounts of barttin and ClC-K
in their kidneys (Fig 1A). We performed immunofluorescence to investigate the
amount and localization of barttin in DCT in Bsndneo/neo mice. In Bsndneo/neo mice, the
staining of barttin was reduced in the DCT cells. Furthermore, basolateral staining of
the R8L barttin mutant was clearly impaired (Fig. 1B) as we previous reported [22].
These results suggested that ClC-K function in DCT cells was significantly reduced in
Bsndneo/neo mice.
We performed immunoblotting to determine whether Bsndneo/neo mice on a
normal diet have alterations in the NCC expression. No significant differences were
observed in pNCC and total NCC (tNCC) between Bsndneo/neo mice and wild-type
(WT) mice (Fig. 1C).
The increase in NCC and SPAK phosphorylation in response to a low-K+ diet
was significantly impaired in Bsndneo/neo mice
To investigate the change of pNCC to a K+ restriction, both wild-type mice
and the Bsndneo/neo mice were fed a HSNK diet or a HSLK diet as same as a previous
study [4]. Although general appearance of the mice consuming a HSLK diet were
normal, Bsndneo/neo mice started to lose weight after 3 days on a HSLK diet, which is
probably due to potassium deficiency. Thus, we fed a HSLK diet, or a HSNK diet, to
the mice for only two days to avoid non-specific effects due to intolerance to HSLK
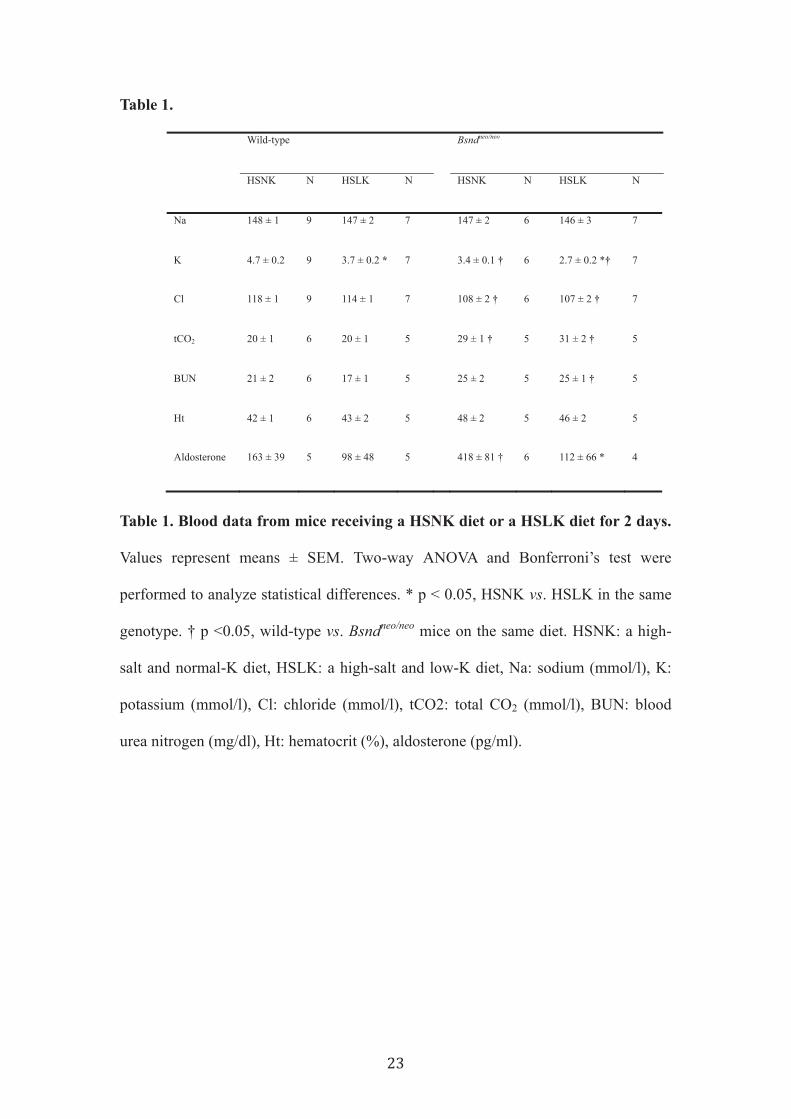
diet. Bsndneo/neo mice showed hypokalemia, metabolic alkalosis with low Cl-, and
higher aldosterone levels when fed a HSNK diet (Table 1). In both wild-type mice and
Bsndneo/neo mice, plasma K+ levels were significantly reduced with a HSLK diet.
There was no significant difference in the aldosterone level between Bsndneo/neo and
wild-type mice when compared to mice fed upon a HSLK diet.
10
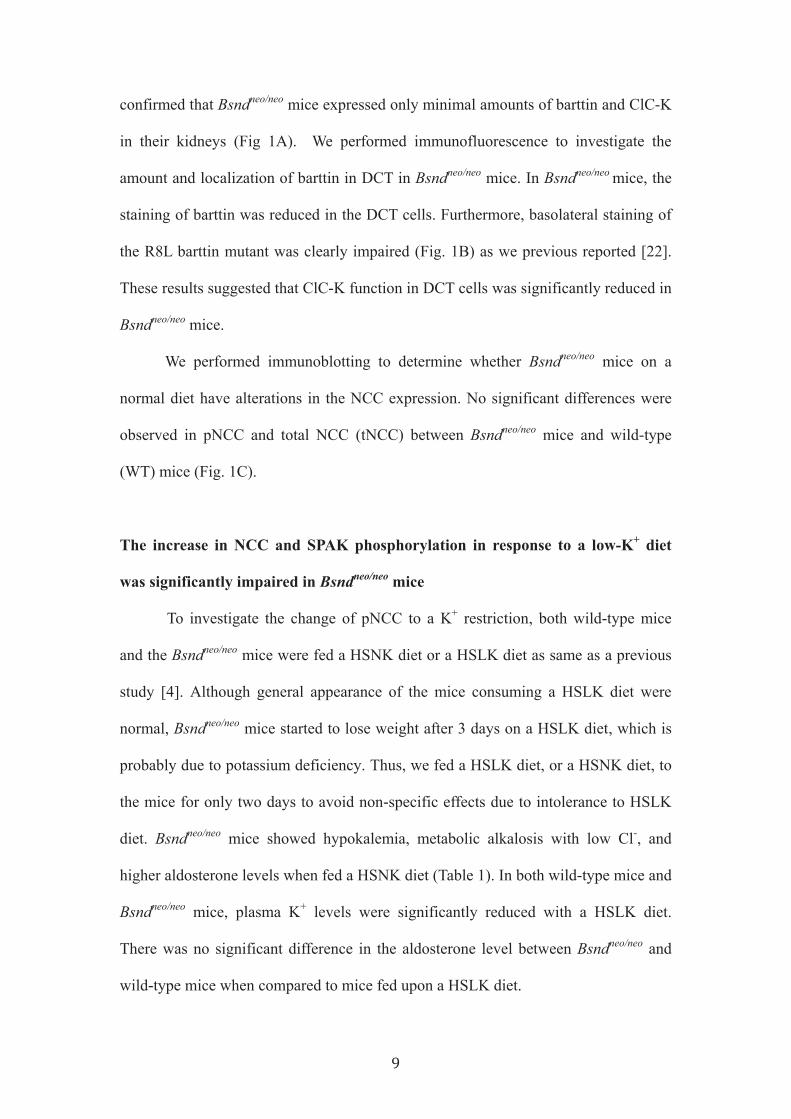
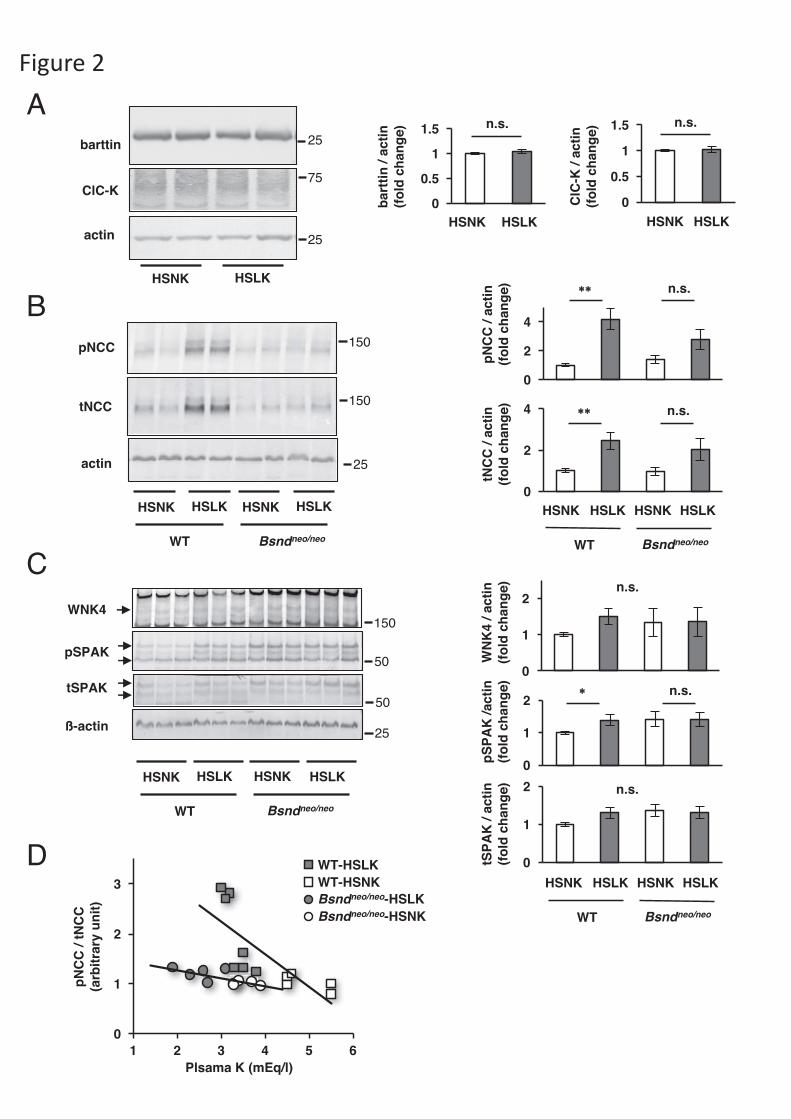
We performed immunoblotting to evaluate the relative levels of WNK4-
SPAK-NCC cascade. First, we analyzed the expression levels of barttin and ClC-K in
the wild-type mice consuming a HSNK or HSLK diet, and we found that there was no
significant difference in barttin and ClC-K between the diets (Fig 2A). Next, we
found that both pNCC and tNCC were more abundant in the kidneys of wild-type
mice consuming a HSLK diet than those maintained upon a HSNK diet (Fig. 2B). In
Bsndneo/neo mice, the increase in pNCC and tNCC with a HSLK diet was not enough to
show a statistical difference (Fig. 2B). The abundance of phosphorylated SPAK
(pSPAK) and WNK4 in wild-type mice consuming a HSLK diet showed significant
increase and increasing tendency, respectively. However, the increase was not evident
in Bsndneo/neo mice (Fig. 2C). The abundance of pNCC is known to correlate with
plasma K+ concentration [6]. We found that pNCC/tNCC was well correlated with
plasma K+ level in both wild-type mice (r = -0.76, p = 0.0038) and Bsndneo/neo mice (r
= -0.68, p = 0.0071) (Fig. 2D). However, the slope of the regression lines was
significantly greater in wild-type mice than in Bsndneo/neo mice (p = 0.020). These
results indicate that the activation of WNK4-SPAK-NCC cascade in response to a
low-K+ diet is dependent upon ClC-K function.
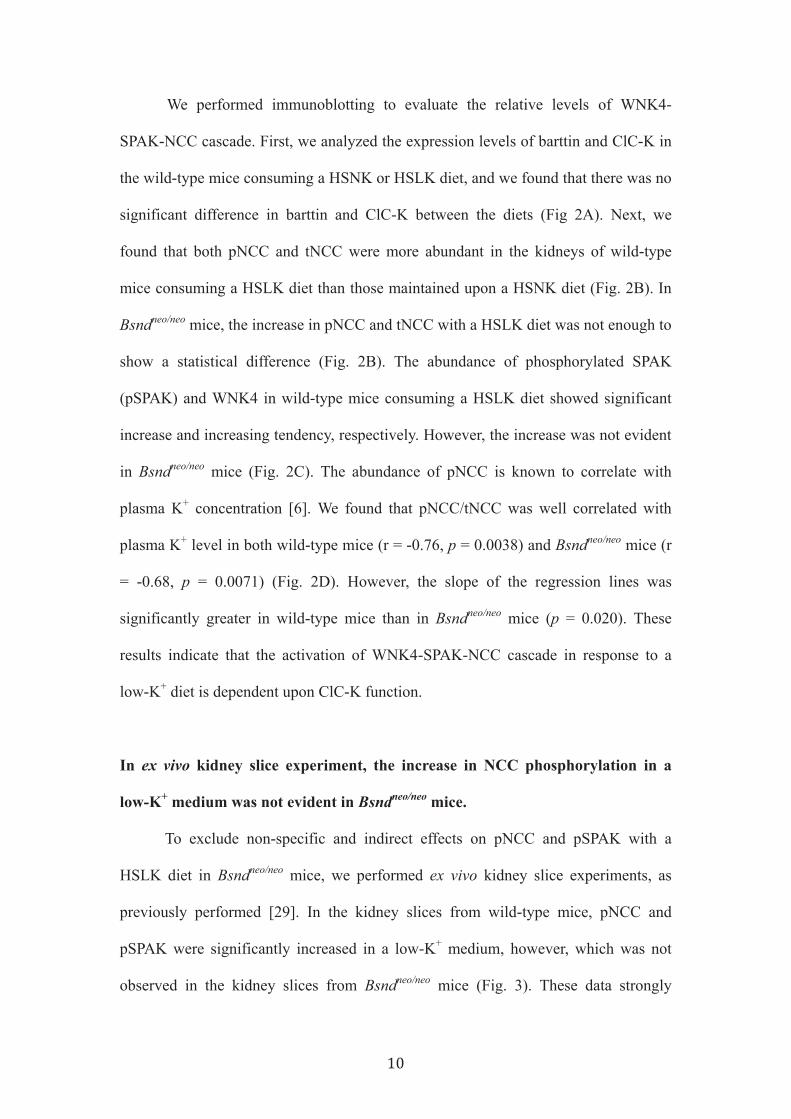
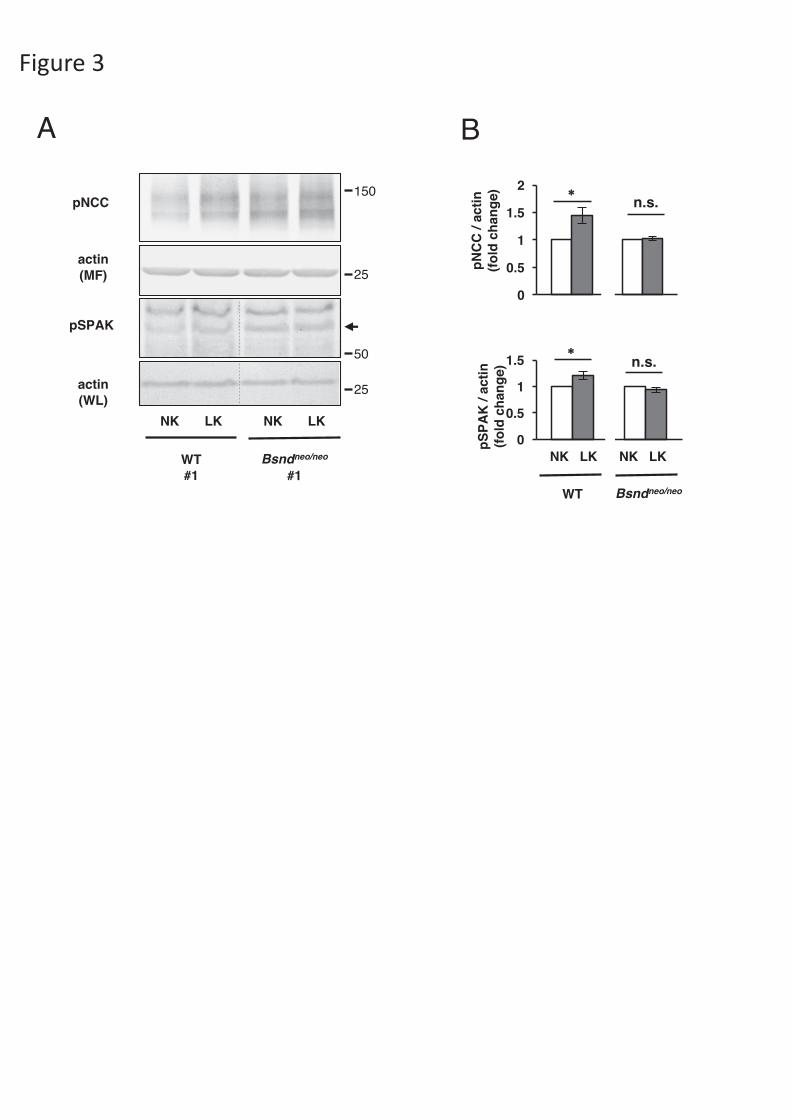
In ex vivo kidney slice experiment, the increase in NCC phosphorylation in a
low-K+ medium was not evident in Bsndneo/neo mice.
To exclude non-specific and indirect effects on pNCC and pSPAK with a
HSLK diet in Bsndneo/neo mice, we performed ex vivo kidney slice experiments, as
previously performed [29]. In the kidney slices from wild-type mice, pNCC and
pSPAK were significantly increased in a low-K+ medium, however, which was not
observed in the kidney slices from Bsndneo/neo mice (Fig. 3). These data strongly
11
supported our in vivo evidence that ClC-K is involved in SPAK and NCC activation in
response to K+ restriction.
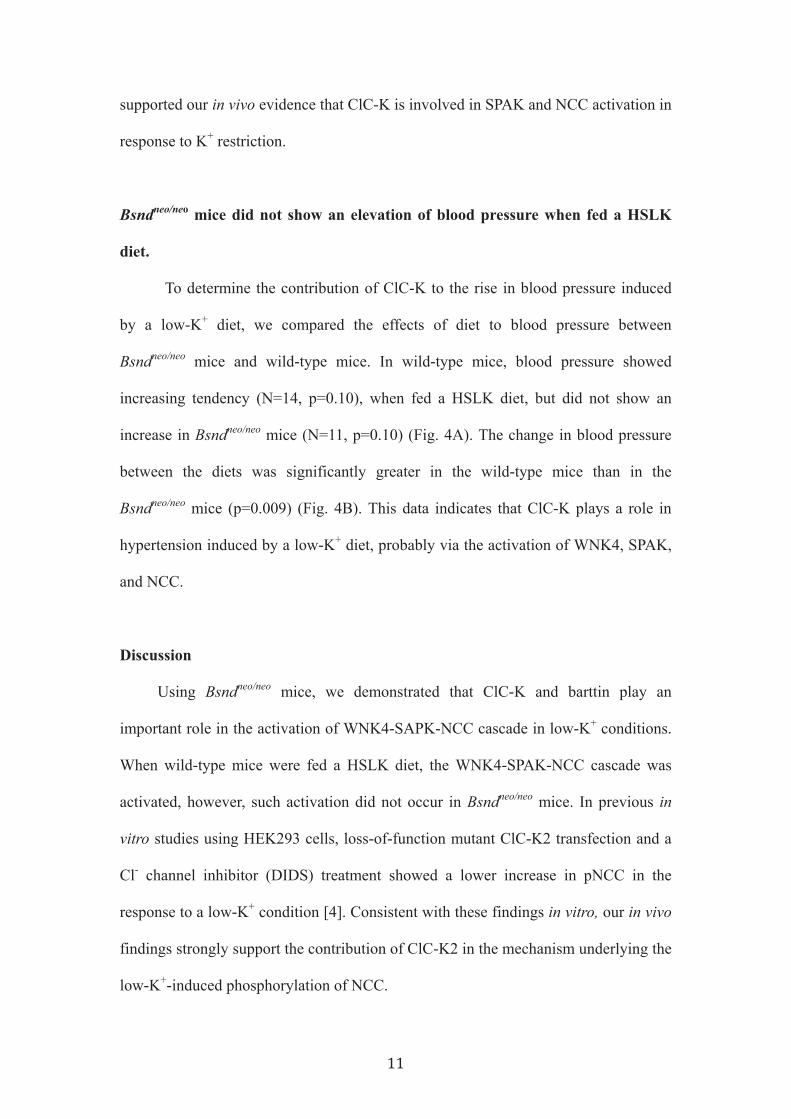
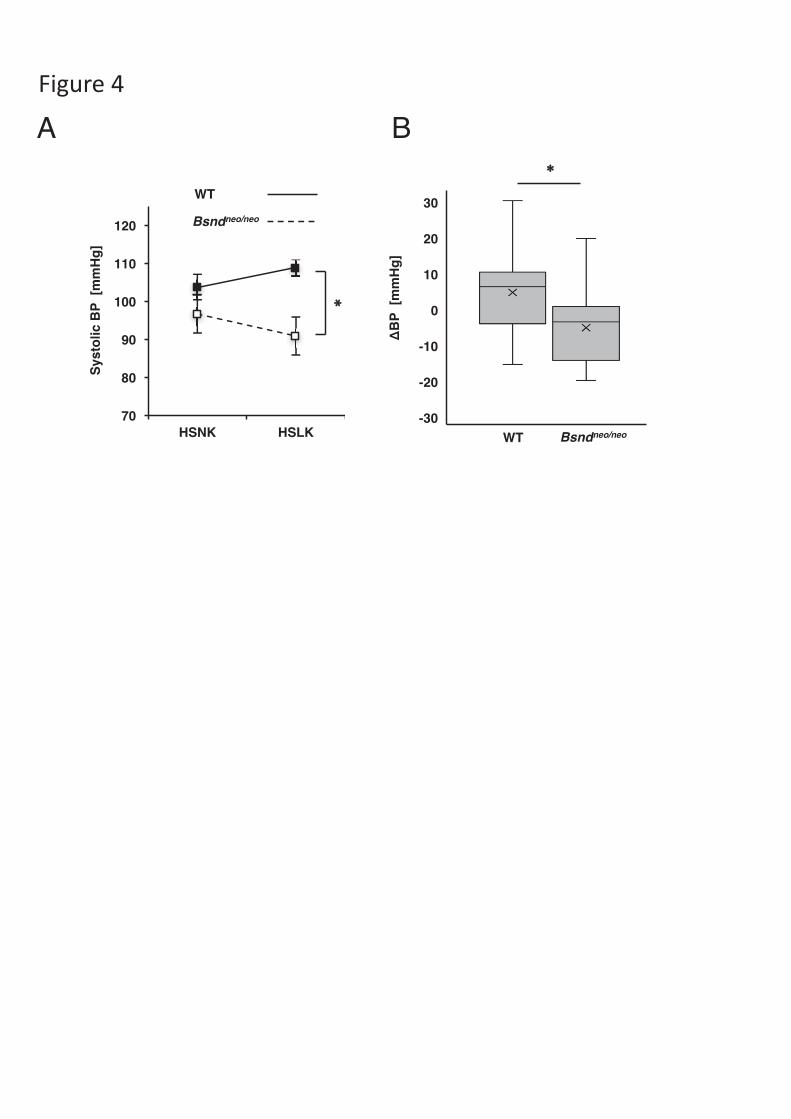
Bsndneo/neo mice did not show an elevation of blood pressure when fed a HSLK
diet.
To determine the contribution of ClC-K to the rise in blood pressure induced
by a low-K+ diet, we compared the effects of diet to blood pressure between
Bsndneo/neo mice and wild-type mice. In wild-type mice, blood pressure showed
increasing tendency (N=14, p=0.10), when fed a HSLK diet, but did not show an
increase in Bsndneo/neo mice (N=11, p=0.10) (Fig. 4A). The change in blood pressure
between the diets was significantly greater in the wild-type mice than in the
Bsndneo/neo mice (p=0.009) (Fig. 4B). This data indicates that ClC-K plays a role in
hypertension induced by a low-K+ diet, probably via the activation of WNK4, SPAK,
and NCC.
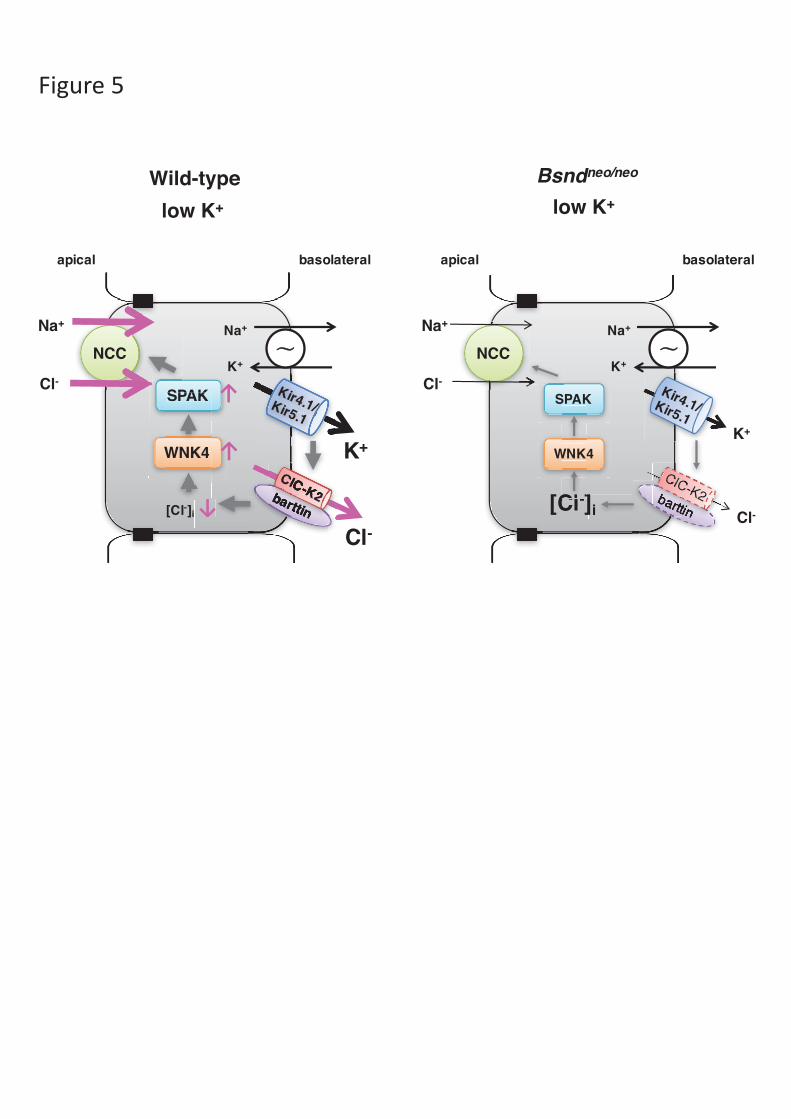
Discussion
Using Bsndneo/neo mice, we demonstrated that ClC-K and barttin play an
important role in the activation of WNK4-SAPK-NCC cascade in low-K+ conditions.
When wild-type mice were fed a HSLK diet, the WNK4-SPAK-NCC cascade was
activated, however, such activation did not occur in Bsndneo/neo mice. In previous in
vitro studies using HEK293 cells, loss-of-function mutant ClC-K2 transfection and a
Cl- channel inhibitor (DIDS) treatment showed a lower increase in pNCC in the
response to a low-K+ condition [4]. Consistent with these findings in vitro, our in vivo
findings strongly support the contribution of ClC-K2 in the mechanism underlying the
low-K+-induced phosphorylation of NCC.
12
The potential importance of the Cl- channel in the regulation of WNK kinases is
based on the idea that WNKs behave as Cl--sensitive kinases [6,30]. WNKs have
direct Cl--binding sites in their catalytic sites, and these residues are conserved among
WNKs [15,16]. The Cl- ion binding to these sites inhibits autophosphorylation (=
activity) of WNK kinases. It is thought that the negative basolateral membrane
potential (hyperpolarization) is the main driving force for Cl- to exit the cell [31]. In
low-K+ condition, the Kir4.1/Kir5.1 complex makes the driving force because it is
thought to be the predominant K+ channels in the basolateral membrane of DCT cells
[32,33]. Indeed, the recent report about the doxycycline inducible kidney-specific
Kcnj10 knockout mouse showed that the lack of Kir4.1 (coded by Kcnj10) decreased
the K+ reversal potential and basolateral Cl- conductance in DCT cells [34]. In
humans, loss-of-function mutations in the gene encoding Kir4.1 cause
SeSAME/EAST syndrome, characterized by an electrolyte imbalance reminiscent of
Gitelman syndrome, including salt wasting, hypocalciuria, hypomagnesemia, and
hypokalemic metabolic alkalosis [35]. Because ClC-K2/b is the main Cl- channels in
the basolateral membrane of DCT cell [21], it is expected that the lack of ClC-K2/b
disrupts the Cl- exit in response to the change of [K+]ex. Indeed, although we could not
analyze a change of [Cl-]i in DCT cells, our finding that the Bsndneo/neo mice did not
show an increase in pSPAK after consuming a low-K+ diet strongly supports this
hypothesis. We designed the scheme in Figure 5.
Furthermore, we found that a low-K+ diet induced an increase in blood pressure
in wild-type mice, which was not observed in the Bsndneo/neo mice. This indicates that
ClC-K2/b contributes to the low-K+-induced hypertension via the WNK4-SPAK-NCC
cascade. Because the elevation of blood pressure by the low-K+ diets was related to
13
cardiovascular events and mortality [3], our findings suggested that CLC-K2/b could
also be a drug target to decrease cardiovascular events as well as blood pressure.
A previous study clearly showed the decrease in NCC in ClC-K2 KO mice on
the normal diet [21]. This result indicates the importance of ClC-K2 in NCC
expression. However, the Bsndneo/neo mice on the normal diet did not show a decrease
in NCC (Fig. 1C). One possible explanation for the discrepancy is that a minimal
expression of ClC-K2 in Bsndneo/neo mice might be enough for NCC expression. A
previous experiment using isolated distal tubules showed that the Cl- channel inhibitor
NPPB had no effect on basolateral resting membrane potential [36]. Thus, it seems
that the Cl- efflux via ClC-K2 mainly occurs when a negative basolateral potential is
generated by K+ channels, and the contribution of ClC-K2 for NCC expression on
normal diet might be minimal.
In summary, Bsndneo/neo mice consuming a low-K+ diet showed a blunted
activation of the WNK4-SPAK-NCC cascade and a lesser increase in blood pressure.
ClC-K2/b and barttin play important roles in low-K+-induced phosphorylation of
NCC and regulation of blood pressure via the WNK4-SPAK cascade.
Acknowledgements
We would like to thank Enago (www.enago.jp) for the English language review.
Competing interests
The authors declare that there are no competing interest associated with the
manuscript.
Funding information

14
This work was supported by Grants-in-Aid for Scientific Research (KAKENHI)
from Japan Society of the Promotion of Science (JSPS) (Grant Numbers
JP125221306, JP15K15327, JP16K09642, JP16H05314, JP16K15467, JP16K19478,
15H06183, and 15H06184), and Salt Science Research Foundation (1629).
Author contributions
N.N. conceived and designed studies, conducted the experiments with
acquisition and analyses of data, and wrote the manuscript. W.S. and Y.W. conducted
part of the experiments with acquisition of data. S.M. and T.F. confirmed the
specificity of antibodies. D.T., M.Z., E.S., and T.R. participated in discussions and
interpretation of the data. SU supervised the project and revised the manuscript.
References
1 Mente, A., O’Donnell, M. J., Rangarajan, S., McQueen, M. J., Poirier, P.,
Wielgosz, A., Morrison, H., Li, W., Wang, X., Di, C., et al. (2014) Association
of Urinary Sodium and Potassium Excretion with Blood Pressure. N. Engl. J.
Med. 371, 601–611.
2 Riphagen, I. J., Gijsbers, L., van Gastel, M. D. A., Kema, I. P., Gansevoort, R.
T., Navis, G., Bakker, S. J. L. and Geleijnse, J. M. (2016) Effects of potassium
supplementation on markers of osmoregulation and volume regulation. J.
Hypertens. 34, 215–220.
3 O’Donnell, M., Mente, A., Rangarajan, S., McQueen, M. J., Wang, X., Liu, L.,
Yan, H., Lee, S. F., Mony, P., Devanath, A., et al. (2014) Urinary sodium and
potassium excretion, mortality, and cardiovascular events. N. Engl. J. Med. 371,
612–23.
15
4 Terker, A. S., Zhang, C., McCormick, J. a, Lazelle, R. a, Zhang, C., Meermeier,
N. P., Siler, D. a, Park, H. J., Fu, Y., Cohen, D. M., et al. (2015) Potassium
modulates electrolyte balance and blood pressure through effects on distal cell
voltage and chloride. Cell Metab. 21, 39–50.
5 Castañeda-Bueno, M., Cervantes-Perez, L. G., Rojas-Vega, L., Arroyo-Garza,
I., Vázquez, N., Moreno, E. and Gamba, G. (2014) Modulation of NCC activity
by low and high K(+) intake: insights into the signaling pathways involved.
Am. J. Physiol. Renal Physiol. 306, F1507-19.
6 Terker, A. S., Zhang, C., Erspamer, K. J., Gamba, G., Yang, C. and Ellison, D.
H. (2016) Unique chloride-sensing properties of WNK4 permit the distal
nephron to modulate potassium homeostasis. Kidney Int., Nature Publishing
Group 89, 127–34.
7 Takahashi, D., Mori, T., Nomura, N., Khan, M. Z. H., Araki, Y., Zeniya, M.,
Sohara, E., Rai, T., Sasaki, S. and Uchida, S. (2014) WNK4 is the major WNK
positively regulating NCC in the mouse kidney. Biosci. Rep. 34, c.
8 Wade, J. B., Liu, J., Coleman, R., Grimm, P. R., Delpire, E. and Welling, P. a.
(2015) SPAK-mediated NCC regulation in response to low-K+ diet. Am. J.
Physiol. Renal Physiol. 308, F923-31.
9 Ferdaus, M. Z., Barber, K. W., López-Cayuqueo, K. I., Terker, A. S., Argaiz, E.
R., Gassaway, B. M., Chambrey, R., Gamba, G., Rinehart, J. and McCormick,
J. A. (2016) SPAK and OSR1 play essential roles in potassium homeostasis
through actions on the distal convoluted tubule. J. Physiol. 594, 4945–66.
10 Vitzthum, H., Seniuk, A., Schulte, L. H., Müller, M. L., Hetz, H. and Ehmke, H.
(2014) Functional coupling of renal K+ and Na+ handling causes high blood
pressure in Na+ replete mice. J. Physiol. 592, 1139–57.
16
11 Wilson, F. H., Disse-Nicodeme, S., Choate, K. A., Ishikawa, K., Nelson-
Willams, C., Desitter, I., Gunel, M., Milford, D. V, Lipkin, G. W., Achard, J.
M., et al. (2001) Human hypertension caused by mutations in WNK kinases.
Science (80-. ). 293, 1107–1112.
12 Simon, D. B., Nelson-Williams, C., Bia, M. J., Ellison, D., Karet, F. E., Molina,
A. M., Vaara, I., Iwata, F., Cushner, H. M., Koolen, M., et al. (1996)
Gitelman’s variant of Bartter’s syndrome, inherited hypokalaemic alkalosis, is
caused by mutations in the thiazide-sensitive Na-Cl cotransporter. Nat. Genet.
12, 24–30.
13 Moriguchi, T., Urushiyama, S., Hisamoto, N., Iemura, S. I., Uchida, S.,
Natsume, T., Matsumoto, K. and Shibuya, H. (2005) WNK1 regulates
phosphorylation of cation-chloride-coupled cotransporters via the STE20-
related kinases, SPAK and OSR1. J. Biol. Chem. 280, 42685–42693.
14 Vitari, A. C., Deak, M., Morrice, N. A. and Alessi, D. R. (2005) The WNK1
and WNK4 protein kinases that are mutated in Gordon’s hypertension
syndrome phosphorylate and activate SPAK and OSR1 protein kinases.
Biochem. J. 391, 17.
15 Bazúa-Valenti, S., Chávez-Canales, M., Rojas-Vega, L., González-Rodríguez,
X., Vázquez, N., Rodríguez-Gama, A., Argaiz, E. R., Melo, Z., Plata, C.,
Ellison, D. H., et al. (2015) The Effect of WNK4 on the Na+-Cl- Cotransporter
Is Modulated by Intracellular Chloride. J. Am. Soc. Nephrol. 26, 1781–6.
16 Piala, A. T., Moon, T. M., Akella, R., He, H., Cobb, M. H. and Goldsmith, E. J.
(2014) Chloride sensing by WNK1 involves inhibition of autophosphorylation.
Sci. Signal. 7, ra41.
17
17 Kobayashi, K., Uchida, S., Mizutani, S., Sasaki, S. and Marumo, F. (2001)
Intrarenal and cellular localization of CLC-K2 protein in the mouse kidney. J.
Am. Soc. Nephrol. 12, 1327–34.
18 Yoshikawa, M., Uchida, S., Yamauchi, a, Miyai, a, Tanaka, Y., Sasaki, S. and
Marumo, F. (1999) Localization of rat CLC-K2 chloride channel mRNA in the
kidney. Am. J. Physiol. 276, F552-8.
19 Nozu, K., Iijima, K., Kanda, K., Nakanishi, K., Yoshikawa, N., Satomura, K.,
Kaito, H., Hashimura, Y., Ninchoji, T., Komatsu, H., et al. (2010) The
pharmacological characteristics of molecular-based inherited salt-losing
tubulopathies. J. Clin. Endocrinol. Metab. 95, E511-8.
20 Fukuyama, S., Okudaira, S., Yamazato, S., Yamazato, M. and Ohta, T. (2003)
Analysis of renal tubular electrolyte transporter genes in seven patients with
hypokalemic metabolic alkalosis. Kidney Int. 64, 808–816.
21 Hennings, J. C., Andrini, O., Picard, N., Paulais, M., Huebner, A. K.,
Cayuqueo, I. K. L., Bignon, Y., Keck, M., Cornière, N., Böhm, D., et al. (2017)
The ClC-K2 Chloride Channel Is Critical for Salt Handling in the Distal
Nephron. J. Am. Soc. Nephrol. 28, 209–217.
22 Nomura, N., Tajima, M., Sugawara, N., Morimoto, T., Kondo, Y., Ohno, M.,
Uchida, K., Mutig, K., Bachmann, S., Soleimani, M., et al. (2011) Generation
and analyses of R8L barttin knockin mouse. Am. J. Physiol. Renal Physiol. 301,
F297-307.
23 Birkenhäger, R., Otto, E., Schürmann, M. J., Vollmer, M., Ruf, E. M., Maier-
Lutz, I., Beekmann, F., Fekete, A., Omran, H., Feldmann, D., et al. (2001)
Mutation of BSND causes Bartter syndrome with sensorineural deafness and
kidney failure. Nat. Genet. 29, 310–4.
18
24 Estévez, R., Boettger, T., Stein, V., Birkenhäger, R., Otto, E., Hildebrandt, F.
and Jentsch, T. J. (2001) Barttin is a Cl- channel β-subunit crucial for renal Cl-
reabsorption and inner ear K+ secretion. Nature 414, 558–561.
25 Rickheit, G., Maier, H., Strenzke, N., Andreescu, C. E., De Zeeuw, C. I.,
Muenscher, A., Zdebik, A. a and Jentsch, T. J. (2008) Endocochlear potential
depends on Cl- channels: mechanism underlying deafness in Bartter syndrome
IV. EMBO J. 27, 2907–17.
26 Sohara, E., Rai, T., Yang, S.-S., Ohta, A., Naito, S., Chiga, M., Nomura, N.,
Lin, S.-H., Vandewalle, A., Ohta, E., et al. (2011) Acute insulin stimulation
induces phosphorylation of the Na-Cl cotransporter in cultured distal mpkDCT
cells and mouse kidney. PLoS One 6, e24277.
27 Yang, S., Morimoto, T., Rai, T., Chiga, M., Sohara, E., Ohno, M., Uchida, K.,
Lin, S., Moriguchi, T., Shibuya, H., et al. (2007) Molecular pathogenesis of
pseudohypoaldosteronism type II: generation and analysis of a
Wnk4(D561A/+) knockin mouse model. Cell Metab. 5, 331–44.
28 Nomura, N., Nunes, P., Bouley, R., Nair, A. V, Shaw, S., Ueda, E.,
Pathomthongtaweechai, N., Lu, H. A. J. and Brown, D. (2014) High-
throughput chemical screening identifies AG-490 as a stimulator of aquaporin
2 membrane expression and urine concentration. Am. J. Physiol. Cell Physiol.
307, C597-605.
29 Penton, D., Czogalla, J., Wengi, A., Himmerkus, N., Loffing-Cueni, D., Carrel,
M., Rajaram, R. D., Staub, O., Bleich, M., Schweda, F., et al. (2016)
Extracellular K + rapidly controls NCC phosphorylation in native DCT by Cl -
-dependent and -independent mechanisms Corresponding author : J. Physiol. 21,
1–24.
19
30 Naito, S., Ohta, A., Sohara, E., Ohta, E., Rai, T., Sasaki, S. and Uchida, S.
(2011) Regulation of WNK1 kinase by extracellular potassium. Clin. Exp.
Nephrol. 15, 195–202.
31 Zaika, O., Tomilin, V., Mamenko, M., Bhalla, V. and Pochynyuk, O. (2016)
New perspective of ClC-Kb/2 Cl − channel physiology in the distal renal
tubule. Am. J. Physiol. - Ren. Physiol. 310, F923–F930.
32 Zhang, C., Wang, L., Zhang, J., Su, X., Lin, D., Scholl, U. I., Giebisch, G.,
Lifton, R. P. and Wang, W. (2014) KCNJ10 determines the expression of the
apical Na-Cl cotransporter (NCC) in the early distal convoluted tubule (DCT1).
Proc. Natl. Acad. Sci. U. S. A. 111, 6–11.
33 Lourdel, S., Paulais, M., Cluzeaud, F., Bens, M., Tanemoto, M., Kurachi, Y.,
Vandewalle, A. and Teulon, J. (2002) An inward rectifier K(+) channel at the
basolateral membrane of the mouse distal convoluted tubule: similarities with
Kir4-Kir5.1 heteromeric channels. J. Physiol. 538, 391–404.
34 Cuevas, C. A., Su, X.-T., Wang, M.-X., Terker, A. S., Lin, D.-H., McCormick,
J. A., Yang, C.-L., Ellison, D. H. and Wang, W.-H. (2017) Potassium Sensing
by Renal Distal Tubules Requires Kir4.1. J. Am. Soc. Nephrol. 28, 1814–1825.
35 Bockenhauer, D., Feather, S., Stanescu, H. C., Bandulik, S., Zdebik, A. A.,
Reichold, M., Tobin, J., Lieberer, E., Sterner, C., Landoure, G., et al. (2009)
Epilepsy, ataxia, sensorineural deafness, tubulopathy, and KCNJ10 mutations.
N. Engl. J. Med. 360, 1960–70.
36 Zaika, O., Mamenko, M., Boukelmoune, N. and Pochynyuk, O. (2015) IGF-1
and insulin exert opposite actions on ClC-K2 activity in the cortical collecting
ducts. Am J Physiol Ren. Physiol 308, F39-48.

20
Figure legends
Figure 1. Baseline characteristics of Bsndneo/neo mice. (A) Representative
immunoblots and densitometric analysis of barttin and ClC-K in the mice consuming
a normal diet. The expression of barttin and ClC-K a quite low in the kidneys of
Bsndneo/neo mice. N=4. **p <0.005 by un-paired t-test. (B) Representative
immunofluorescences in the distal convoluted tubules of WT mice and Bsndneo/neo
mice. In Bsndneo/neo mice, barttin staining (red) was low and the localization upon the
basolateral membrane was impaired. NCC (green) was stained as a marker of distal
convoluted tubules. Scale bars indicate 50 μm. (C) Representative immunoblots and densitometric analysis of NCC. N=4. WT: wild-type mice.
Figure 2. Relationship between plasma potassium and the WNK4-SPAK-NCC
cascade. (A) Representative immunoblots of barttin and ClC-K, and densitometric
analysis in wild-type mice (N=6). (B) Representative immunoblots of NCC, and
densitometric analysis. WT-HSNK, N=8. WT-HSLK, N=9. Bsndneo/neo-HSNK, N=7.
Bsndneo/neo-HSLK, N=7. (C) Representative immunoblots of WNK4 and SPAK, and
densitometric analysis. Arrows on the left side of WNK4, pSPAK and tSPAK blots
indicate WNK4, pSPAK and tSPAK bands (anti-pSPAK antibody from Dr. Yang).
Number of animals was as same as Fig. 2B. (D) Regression lines between the
intensities of pNCC/tNCC and plasma K+ levels. Gray squares, open squares, gray
circles and open circles indicate data from WT-HSLK, WT-HSNK, Bsndneo/neo-HSLK,
and Bsndneo/neo-HSNK groups, respectively. The slopes of the regression lines were
significantly different (p <0.05). Response of pNCC and pSPAK to a HSLK diet was
impaired in Bsndneo/neo mice. *p <0.05 and **p <0.005 by Bonferroni’s test after two-
21
way ANOVA. WT: wild-type mice, K: potassium. HSLK: high-salt and low-
potassium, HSNK: high-salt and normal-potassium. The linearity of protein detection
for each antibody was confirmed in Figure S2 and S3.
Figure 3. ex vivo kidney slices experiment. (A) Representative immunoblots of
kidney slices incubated in a normal or low-K+ medium. NK: normal potassium
medium (K+ 4 mEq/l), LK: low potassium medium (K+ 2 mEq/l), WT: wild-type
mice. (B) Densitometric analysis of phosphorylated NCC and SPAK in kidney slices
(new anti-pSPAK antibody). The slices from a same mouse kidney were incubated in
a normal medium or a low-K+ medium. The fold change to a normal medium was
analyzed by un-paired t-test. *p <0.05. N=6. Open columns indicate normal medium
groups, gray columns indicate low-K medium groups. The linearity of protein
detection for each antibody was confirmed in Figure S4.
Figure 4. Systolic blood pressure measurement by tail cuffs. At first, the mice were
maintained on a HSNK diet, then the food were switched to a HSLK diet. BP were
compared between the HSNK diet and the HSLK diet. (A) The average of systolic
BP. BP from a HSLK diet was significantly greater in WT than in Bsndneo/neo. (B) A
box-and-whisker plot of the change in blood pressure between the diets. Boxes
demonstrate median and 25% 75% range; whiskers extend to the most extreme data
point. The averages were shown as “x”s in the boxes. The change in BP was greater in
WT than in Bsndneo/neo. *p <0.05 according to the unpaired t-test. N=14 (WT), N=11
(Bsndneo/neo). HSNK: high-salt and normal-potassium diet, HSLK: high-salt and low-
potassium diet, WT: wild-type mice. BP: blood pressure. BP: change of BP.
22
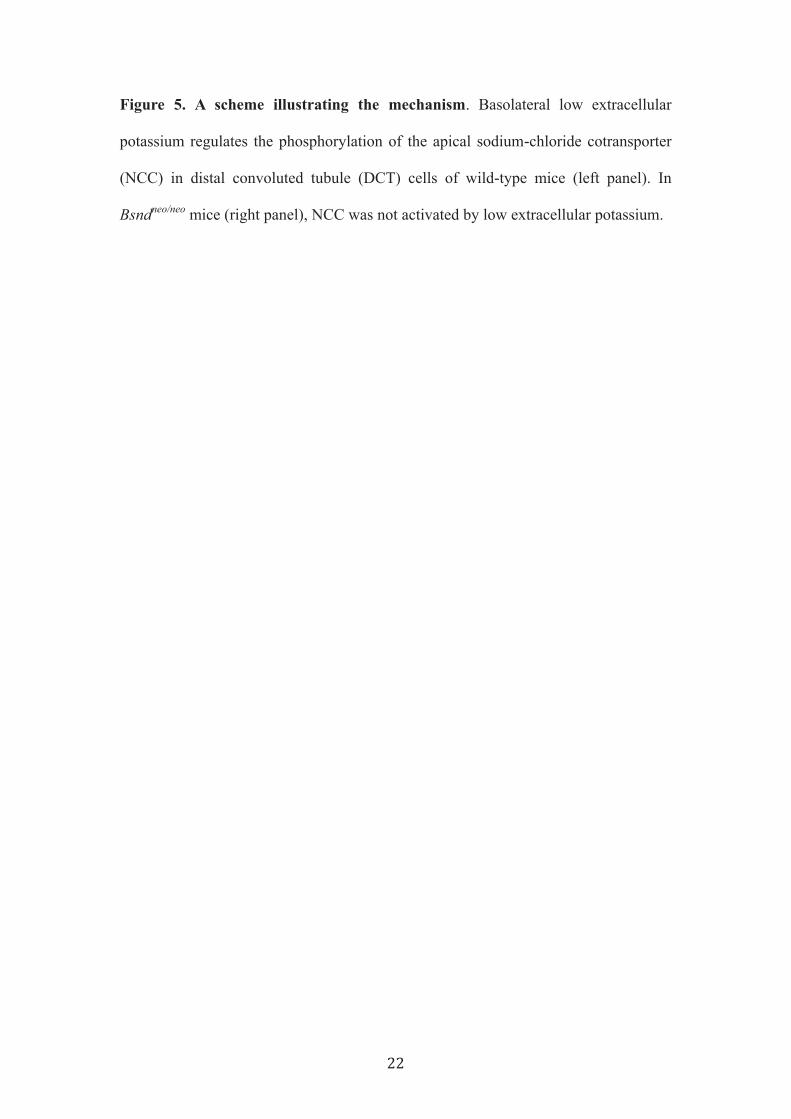
Figure 5. A scheme illustrating the mechanism. Basolateral low extracellular
potassium regulates the phosphorylation of the apical sodium-chloride cotransporter
(NCC) in distal convoluted tubule (DCT) cells of wild-type mice (left panel). In
Bsndneo/neo mice (right panel), NCC was not activated by low extracellular potassium.
23
Table 1.
Wild-type Bsndneo/neo
HSNK N HSLK N HSNK N HSLK N
Na 148 ± 1 9 147 ± 2 7 147 ± 2 6 146 ± 3 7
K 4.7 ± 0.2 9 3.7 ± 0.2 * 7 3.4 ± 0.1 † 6 2.7 ± 0.2 *† 7
Cl 118 ± 1 9 114 ± 1 7 108 ± 2 † 6 107 ± 2 † 7
tCO2 20 ± 1 6 20 ± 1 5 29 ± 1 † 5 31 ± 2 † 5
BUN 21 ± 2 6 17 ± 1 5 25 ± 2 5 25 ± 1 † 5
Ht 42 ± 1 6 43 ± 2 5 48 ± 2 5 46 ± 2 5
Aldosterone 163 ± 39 5 98 ± 48 5 418 ± 81 † 6 112 ± 66 * 4
Table 1. Blood data from mice receiving a HSNK diet or a HSLK diet for 2 days.
Values represent means ± SEM. Two-way ANOVA and Bonferroni’s test were
performed to analyze statistical differences. * p < 0.05, HSNK vs. HSLK in the same
genotype. † p <0.05, wild-type vs. Bsndneo/neo mice on the same diet. HSNK: a high-
salt and normal-K diet, HSLK: a high-salt and low-K diet, Na: sodium (mmol/l), K:
potassium (mmol/l), Cl: chloride (mmol/l), tCO2: total CO2 (mmol/l), BUN: blood
urea nitrogen (mg/dl), Ht: hematocrit (%), aldosterone (pg/ml).
25
25
25
A
C
B
0
0.5
1
∗∗
0
0.5
1
∗∗
WT Bsndneo/neo
ClC
-K(f
old
ch
ang
e)b
artt
in(f
old
ch
ang
e)
barttin
ß-actin
WT Bsndneo/neo
ClC-K 75
Bsndneo/neo
barttin NCC merge
WT
ß-actin
pNCC
tNCC
150
150
WT Bsndneo/neo
0
1
2
0
1
2
WT Bsndneo/neo
pN
CC
(fo
ld c
han
ge)
tNC
C(f
old
ch
ang
e)
n.s
n.s
A
B
0
1
2
0
1
2
0
1
2
WN
K4
/ act
in(f
old
ch
ang
e)
pS
PA
K/a
ctin
(fo
ld c
han
ge)
tS
PA
K/ a
ctin
(fo
ld c
han
ge)
n.s.
n.s.
∗ n.s.
WT
HSNK HSLK
pNCC
tNCC
actin
150
25
Bsndneo/neo
HSNK HSLK
WT
HSNK HSLK
Bsndneo/neo
HSLKHSNK
D
Plsama K (mEq/l)
0
1
2
3
1 2 3 4 5 6
WT-HSLK
pN
CC
/ tN
CC
(arb
itra
ry u
nit
)
C
150
barttin 25
actin
HSNK HSLK
0
2
4
pN
CC
/ act
in(f
old
ch
ang
e)
0
2
4
tNC
C/ a
ctin
(fo
ld c
han
ge)
∗∗ n.s.
∗∗ n.s.
WT
HSNK HSLK
Bsndneo/neo
HSLKHSNK
25
0
0.5
1
1.5
HSNK HSLK
bar
ttin
/ ac
tin
(fo
ld c
han
ge)
n.s.
ClC-K0
0.5
1
1.5
HSNK HSLK
n.s.
ClC
-K /
acti
n(f
old
ch
ang
e)
75
WNK4
pSPAK
tSPAK
ß-actin
50
150
WT
HSNK HSLK
Bsndneo/neo
HSLKHSNK
50
25
WT-HSNK
Bsndneo/neo-HSNKBsndneo/neo-HSLK
0
0.5
1
1.5
0
0.5
1
1.5
2pNCC
NK LK
WT #1
actin(WL)
A
pSPAK
B
∗n.s.
pN
CC
/ act
in(f
old
ch
ang
e)WT Bsndneo/neo
pS
PA
K/ a
ctin
(fo
ld c
han
ge)
NK LK NK LK
actin(MF)
NK LK
Bsndneo/neo
#1
∗n.s.50
150
25
25
70
80
90
100
110
120
HSNK HSLK
WT
∗
Sys
tolic
BP
[m
mH
g]
Bsndneo/neo
∗
30
20
10
0
-10
-20
-30WT Bsndneo/neo
A B
ΔB
P [
mm
Hg
]
NCC
Na+
Cl-
Na+
K+
K+
Cl-
apical basolateral
[Cl-]i
low K+
WNK4WNK4
SPAKSPAK
C NCC
Na+
Cl-
Na+
K+
K+
Cl-
apical basolateral
low K+
Wild-type Bsndneo/neo
[Cl-]i
WNK4
Cl ]
SPAK
WT KO
75
50
Figure S1
pSPAK (Dr. Yang) pSPAK (new)
tSPAK (Cell signaling)
WT KO
WT KO
75
50
actin(MF)
WT Bsndneo/neo
barttin
pNCC
tNCC
0
0.5
1
0 0.5 1
tNCC
0
0.5
1
0 0.5 1
pNCC
0
0.5
1
0 0.5 1
actin (MF)
Figure S2
0
0.5
1
0 0.5 1
ClC-K
ClC-K
2 1 0.5
A B
tSPAK
pSPAK
WNK4
actin(WL)
proteinamount (μg)
0
0.5
1
0 0.5 1
WNK4
0
0.5
1
0 0.5 1
actin (WL)
0
0.5
1
0 0.5 1
tSPAK
30 15 7.5 30 15 7.5
proteinamount (μg)
Rel
ativ
e in
ten
sity
of
ban
ds
Relative protein amount Relative protein amount
Rel
ativ
e in
ten
sity
of
ban
ds
Rel
ativ
e in
ten
sity
of
ban
ds
Rel
ativ
e in
ten
sity
of
ban
ds
Rel
ativ
e in
ten
sity
of
ban
ds
0
0.5
1
0 0.5 1
barttin
0
0.5
1
0 0.5 1
pSPAK
pNCC
WT Bsndneo/neo
actin(MF)
pSPAK
actin(WL)
0
0.5
1
0 0.5 1
pNCC
0
0.5
1
0 0.5 1
actin (MF)
0
0.5
1
0 0.5 1
pSPAK
Figure S3
0
0.5
1
0 0.5 1
actin (WL)
50 25 12.5proteinamount (μg) 50 25 12.5
A B
Relative protein amount
Rel
ativ
e in
ten
sity
of
ban
ds
Relative protein amount
Rel
ativ
e in
ten
sity
of
ban
ds
Supplementary Information
Supplementary Material and Methods
Western blotting
Kidneys were lysed in detergent-free buffer {250 mM sucrose, 10 mM
Triethanolamine, 1 mM EGTA, 1 mM EDTA, 1 mM Na orthovanadate, 50 mM Na
fluoride, complete protease inhibitor cocktail (Roche)} with a homogenizer, and then
the homogenates were centrifuged to separate to entire kidney samples without the
nuclear fraction, as either whole kidney lysates (600 g, supernatant) and crude
membrane fraction (17000 g, pellet). Samples were mixed with ß-ME Sample
Treatment for Tris SDS (Cosmo Bio, Tokyo, Japan), and incubated for 20 min at 60 oC.
Protein concentration was determined using Bradford ULTRA (Expedeon, UK). Protein
samples were separated by SDS-PAGE on 5-20% gradient gels in Tris-Glysin SDS
running buffer (Takara Bio Inc., Japna). Proteins were transferred to nitrocellulose
membranes in transfer buffer (100 mM Tris, 192 mM Glysine). Membranes were
blocked with 5% skim milk in TBST for 30 min at room temperature. Primary
antibodies (Table S1) were diluted in TBST. The membrane was incubated with a
primary antibody overnight at 4 oC. Alkaline phosphatase-conjugated anti-IgG
antibodies (anti-rabbit Cat. #S3738, Promega, anti-guinea pig Cat. #A2293, Sigma) as
for secondary antibodies were diluted in 5% skim milk in TBST. After 3 times wash
with TBST, the membrane was incubated with a secondary antibody for 45 min at room
temperature. After 3 times wash with TBST, Western Blue (Promega) was used to detect
the signals. The relative intensities of immunoblot bands were analyzed and quantified
using ImageJ software (National Institutes of Health).
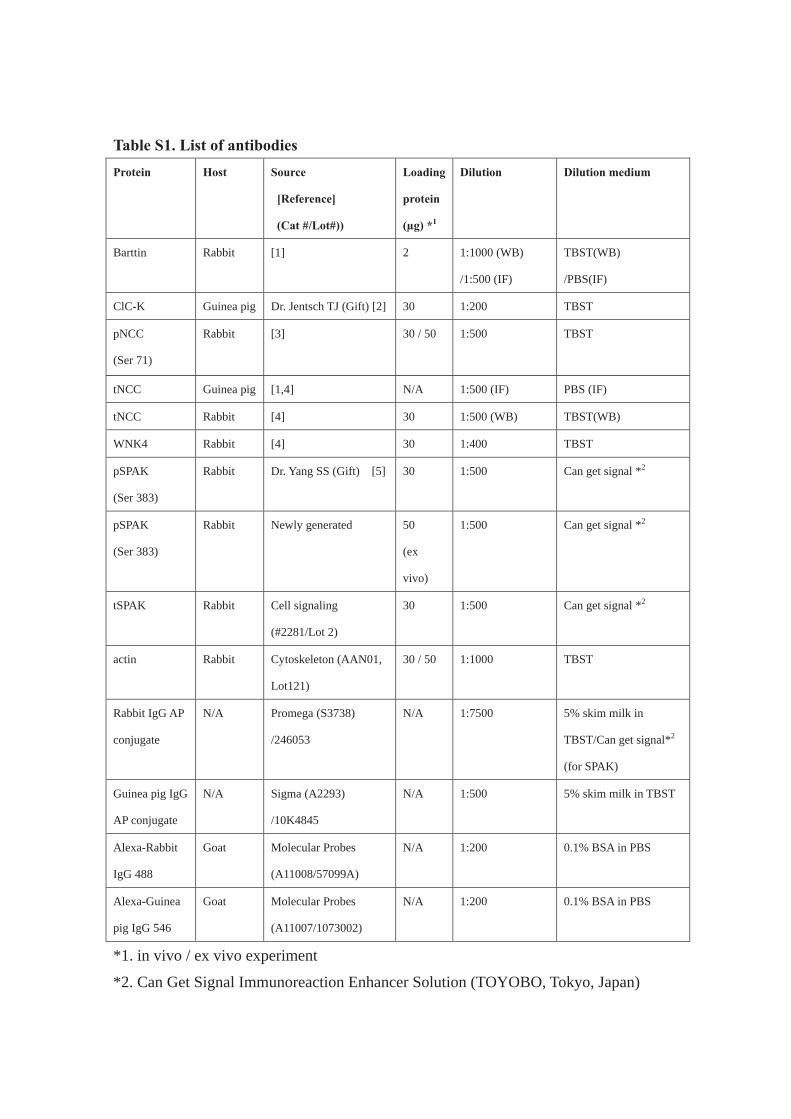
Table S1. List of antibodies Protein Host Source
[Reference]
(Cat #/Lot#))
Loading
protein
(μg) *1
Dilution Dilution medium
Barttin Rabbit [1] 2 1:1000 (WB)
/1:500 (IF)
TBST(WB)
/PBS(IF)
ClC-K Guinea pig Dr. Jentsch TJ (Gift) [2] 30 1:200 TBST
pNCC
(Ser 71)
Rabbit [3] 30 / 50 1:500 TBST
tNCC Guinea pig [1,4] N/A 1:500 (IF) PBS (IF)
tNCC Rabbit [4] 30 1:500 (WB) TBST(WB)
WNK4 Rabbit [4] 30 1:400 TBST
pSPAK
(Ser 383)
Rabbit Dr. Yang SS (Gift) [5] 30 1:500 Can get signal *2
pSPAK
(Ser 383)
Rabbit Newly generated 50
(ex
vivo)
1:500 Can get signal *2
tSPAK Rabbit Cell signaling
(#2281/Lot 2)
30 1:500 Can get signal *2
actin Rabbit Cytoskeleton (AAN01,
Lot121)
30 / 50 1:1000 TBST
Rabbit IgG AP
conjugate
N/A Promega (S3738)
/246053
N/A 1:7500 5% skim milk in
TBST/Can get signal*2
(for SPAK)
Guinea pig IgG
AP conjugate
N/A Sigma (A2293)
/10K4845
N/A 1:500 5% skim milk in TBST
Alexa-Rabbit
IgG 488
Goat Molecular Probes
(A11008/57099A)
N/A 1:200 0.1% BSA in PBS
Alexa-Guinea
pig IgG 546
Goat Molecular Probes
(A11007/1073002)
N/A 1:200 0.1% BSA in PBS
*1. in vivo / ex vivo experiment
*2. Can Get Signal Immunoreaction Enhancer Solution (TOYOBO, Tokyo, Japan)
WB: Western blotting, IF: immunofluorescence
References
1 Nomura, N., Tajima, M., Sugawara, N., Morimoto, T., Kondo, Y., Ohno, M.,
Uchida, K., Mutig, K., Bachmann, S., Soleimani, M., et al. (2011) Generation and
analyses of R8L barttin knockin mouse. Am. J. Physiol. Renal Physiol. 301,
F297-307.
2 Vandewalle, A., Cluzeaud, F., Bens, M., Kieferle, S., Steinmeyer, K. and Jentsch,
T. J. (1997) Localization and induction by dehydration of ClC-K chloride channels
in the rat kidney. Am. J. Physiol. 272, F678-88.
3 Yang, S., Morimoto, T., Rai, T., Chiga, M., Sohara, E., Ohno, M., Uchida, K., Lin,
S., Moriguchi, T., Shibuya, H., et al. (2007) Molecular pathogenesis of
pseudohypoaldosteronism type II: generation and analysis of a Wnk4(D561A/+)
knockin mouse model. Cell Metab. 5, 331–44.
4 Takahashi, D., Mori, T., Nomura, N., Khan, M. Z. H., Araki, Y., Zeniya, M.,
Sohara, E., Rai, T., Sasaki, S. and Uchida, S. (2014) WNK4 is the major WNK
positively regulating NCC in the mouse kidney. Biosci. Rep. 34, c.
5 Sohara, E., Rai, T., Yang, S.-S., Ohta, A., Naito, S., Chiga, M., Nomura, N., Lin,
S.-H., Vandewalle, A., Ohta, E., et al. (2011) Acute insulin stimulation induces
phosphorylation of the Na-Cl cotransporter in cultured distal mpkDCT cells and
mouse kidney. PLoS One 6, e24277.
Supplementary Figure legends
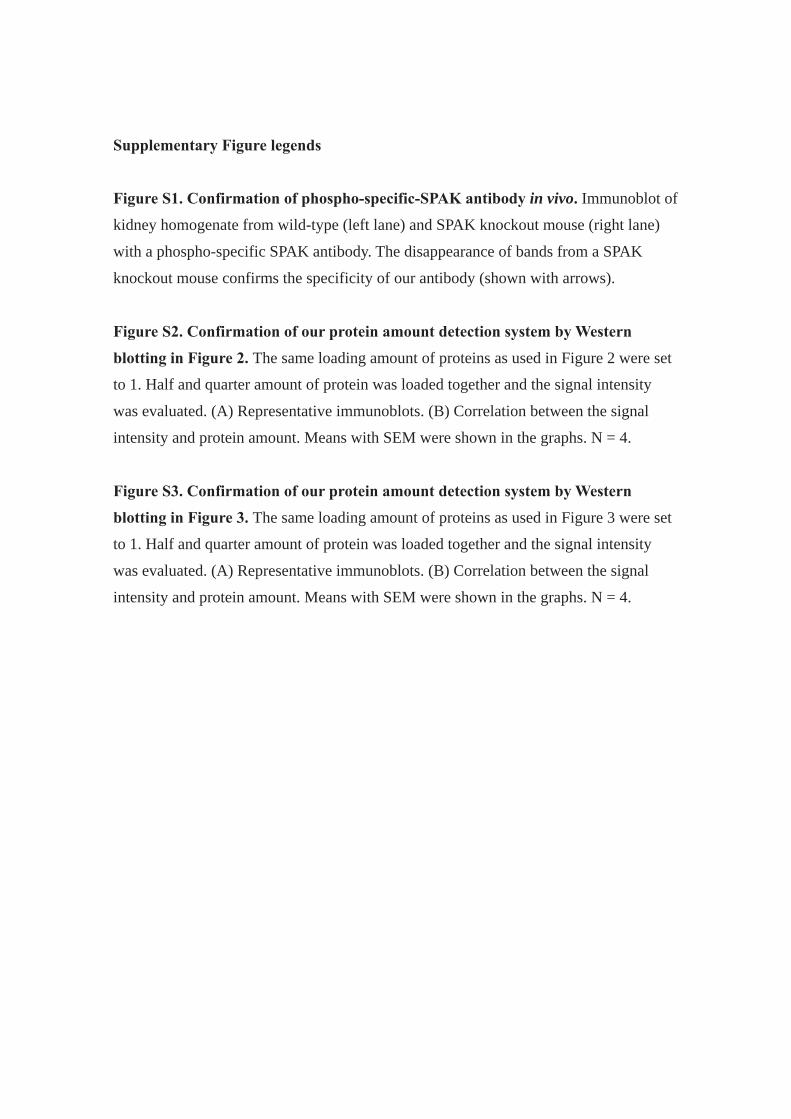
Figure S1. Confirmation of phospho-specific-SPAK antibody in vivo. Immunoblot of
kidney homogenate from wild-type (left lane) and SPAK knockout mouse (right lane)
with a phospho-specific SPAK antibody. The disappearance of bands from a SPAK
knockout mouse confirms the specificity of our antibody (shown with arrows).
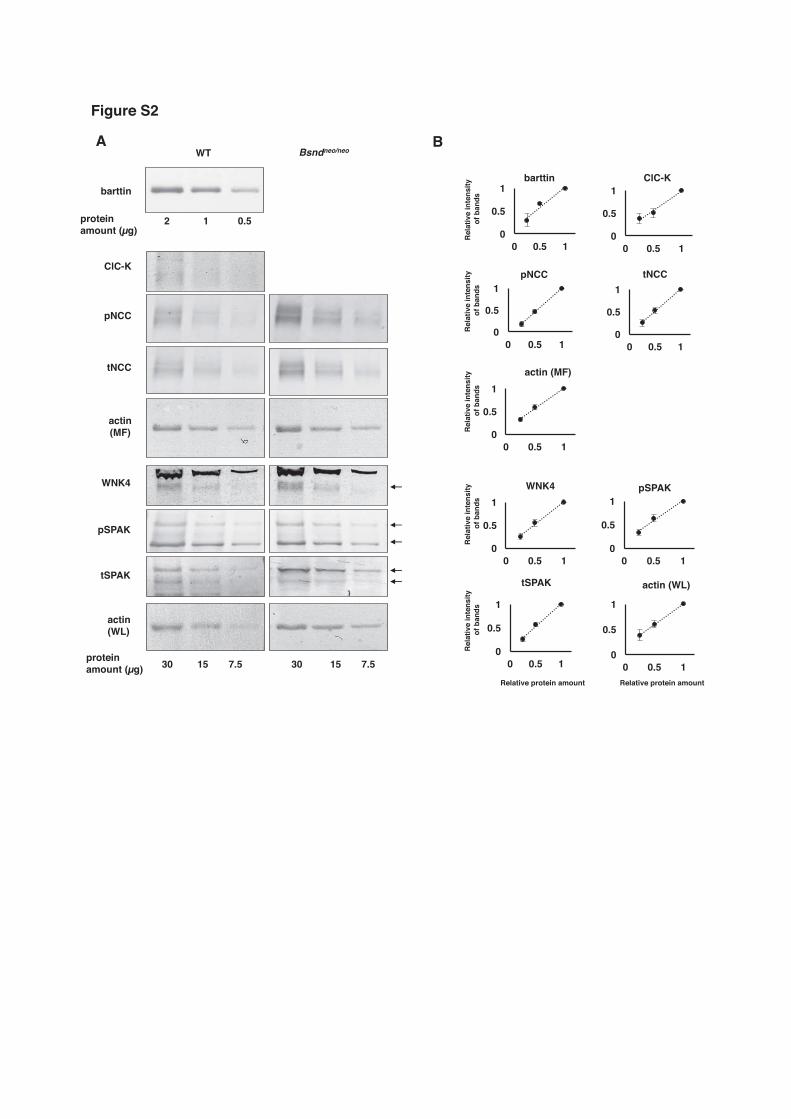
Figure S2. Confirmation of our protein amount detection system by Western
blotting in Figure 2. The same loading amount of proteins as used in Figure 2 were set
to 1. Half and quarter amount of protein was loaded together and the signal intensity
was evaluated. (A) Representative immunoblots. (B) Correlation between the signal
intensity and protein amount. Means with SEM were shown in the graphs. N = 4.
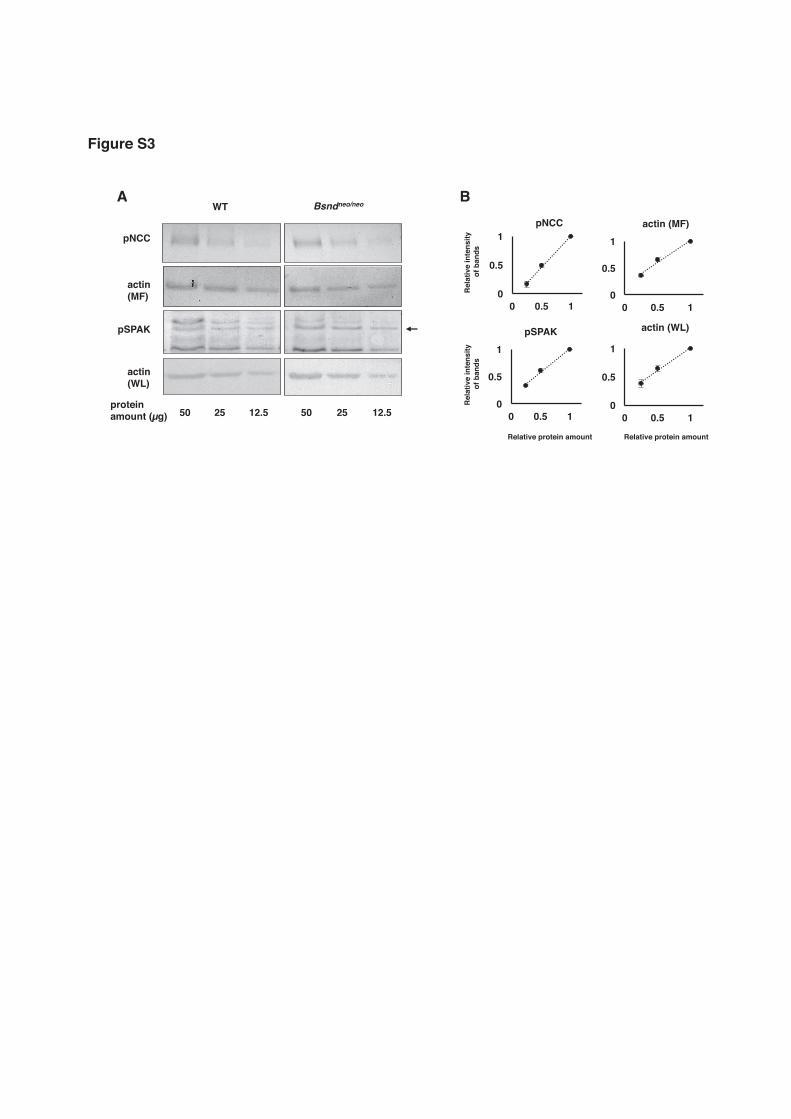
Figure S3. Confirmation of our protein amount detection system by Western
blotting in Figure 3. The same loading amount of proteins as used in Figure 3 were set
to 1. Half and quarter amount of protein was loaded together and the signal intensity
was evaluated. (A) Representative immunoblots. (B) Correlation between the signal
intensity and protein amount. Means with SEM were shown in the graphs. N = 4.