POTASSIUM FIXATION CAPACITY RELATED TO ADDED POTASSIUM …
14
JOURNAL OF INTERNATIONAL ACADEMIC RESEARCH FOR MULTIDISCIPLINARY Impact Factor 5.419, ISSN: 2320-5083, Volume 7, Issue 11, December 2019 1 www.jiarm.com POTASSIUM FIXATION CAPACITY RELATED TO ADDED POTASSIUM DOSES IN SOME SELECTED SOILS IN ALBANIA. JULITA SULA* FATOSHUQI* ILIRKRISTO* *Department of Agro-environment and Ecology, Faculty of Agriculture and Environment, Agriculture University of Tirana, Tirana, Albania Abstract Although a lot of studies are conducted in Albania, little is known and published about soil potassium status. Most of studies have been to know the level of exchangeable forms of potassium. Up to now, there are limited publications about the capacity of soils in Albania for K fixation. The objective of this study is to make a assessment of the capacity for K fixation related to added potassium doses of some soils selected in the western regions of Albania Capacity for K fixation of soils is an important indicator affecting the status of soil K and its availability to crops. Potassium fixation characteristics were studied in 4 selected soil samples collected in the western regions of Albania and 5 doses of added potassium 0; 200; 400; 800 and 1600 mg K kg -1 soil. After two equilibration periods 24 hours and 30 days soil samples were analyzed for K in 1M NH 4 OAc extract. Results shown a K fixation capacity of studies soils in range from 49 mg K kg -1 soil to 1194 mg K kg -1 soil or 16% - 78% of added potassium in the first period of equilibrium and in range from 91 mg K kg -1 soil to 1140 mg K kg -1 soil or 46% - 71% of added potassium in the second period of equilibrium. Correlation between applied K and fixed K was calculate. Fixation increased with increase in the concentration of added K. There was also a linear relationship between the proportion of K fixed and the amount added at both equilibrium periods. Keywords: Potassium, K fixation, Exchangeable and Fixed forms 1. INTRODUCTION Although a lot of studies are conducted in Albania, little is known and published about soil potassium status. Most of studies have been to know the level of exchangeable and non exchangeable forms of potassium.3][11] Up to now, there are limited publications about the capacity of soils in Albania for K fixation. Fractions of Potassium in soil are (a) total potassium, (b) nonexchangeable (but plant- available) potassium, (c) exchangeable potassium and (d) water-soluble potassium.
Transcript of POTASSIUM FIXATION CAPACITY RELATED TO ADDED POTASSIUM …

JOURNAL OF INTERNATIONAL ACADEMIC RESEARCH FOR MULTIDISCIPLINARY Impact Factor 5.419, ISSN: 2320-5083, Volume 7, Issue 11, December 2019
1 www.jiarm.com
POTASSIUM FIXATION CAPACITY RELATED TO ADDED POTASSIUM DOSES IN SOME SELECTED SOILS IN ALBANIA.
JULITA SULA* FATOSHUQI* ILIRKRISTO*
*Department of Agro-environment and Ecology, Faculty of Agriculture and Environment, Agriculture
University of Tirana, Tirana, Albania
Abstract
Although a lot of studies are conducted in Albania, little is known and published
about soil potassium status. Most of studies have been to know the level of exchangeable
forms of potassium. Up to now, there are limited publications about the capacity of soils in
Albania for K fixation. The objective of this study is to make a assessment of the capacity for
K fixation related to added potassium doses of some soils selected in the western regions of
Albania Capacity for K fixation of soils is an important indicator affecting the status of soil K
and its availability to crops. Potassium fixation characteristics were studied in 4 selected soil
samples collected in the western regions of Albania and 5 doses of added potassium 0; 200;
400; 800 and 1600 mg K kg-1 soil. After two equilibration periods 24 hours and 30 days soil
samples were analyzed for K in 1M NH4OAc extract. Results shown a K fixation capacity of
studies soils in range from 49 mg K kg-1 soil to 1194 mg K kg-1 soil or 16% - 78% of added
potassium in the first period of equilibrium and in range from 91 mg K kg-1 soil to 1140 mg
K kg-1 soil or 46% - 71% of added potassium in the second period of equilibrium.
Correlation between applied K and fixed K was calculate. Fixation increased with increase in
the concentration of added K. There was also a linear relationship between the proportion of
K fixed and the amount added at both equilibrium periods.
Keywords: Potassium, K fixation, Exchangeable and Fixed forms
1. INTRODUCTION
Although a lot of studies are conducted in Albania, little is known and published
about soil potassium status. Most of studies have been to know the level of exchangeable and
non exchangeable forms of potassium.3][11] Up to now, there are limited publications about
the capacity of soils in Albania for K fixation.
Fractions of Potassium in soil are (a) total potassium, (b) nonexchangeable (but plant-
available) potassium, (c) exchangeable potassium and (d) water-soluble potassium.
JOURNAL OF INTERNATIONAL ACADEMIC RESEARCH FOR MULTIDISCIPLINARY Impact Factor 5.419, ISSN: 2320-5083, Volume 7, Issue 11, December 2019
2 www.jiarm.com
The most common test for available K+ is the exchangeable K+ obtained by extraction with
1M NH4Cl or NH4OAc. [4]
Potassium availability in soils is regulated by the equilibrium between the forms of
potassium and potassium fixation capacity which is further conditioned by the soil
characteristics like clay, silt, Organic matter, pH and nature of the exchange complex.[2]
The distribution and fixation of K added to a soil, among water-soluble, exchangeable, and
nonexchangeable forms, is related to the surface charge density and degree of interlayering of
the clay minerals present [5]
When the easily available K is depleted by crop removal or leaching, fixed potassium
is released to replenish the labile pool.[7]
Capacity for K fixation of soils is an important indicator affecting the status of soil K
and its availability to crops.[2][3]Among the various factors affecting K fixation, soil clay
(quantity and type) constitutes the most important one. It determines the magnitude of the soil
fixing capacity and it 2 generally controls the K fixation-release processes [1]
Potassium fixation in soils has a direct effect on K availability and on the degree of
fertilizer K uptake by plants. Consequently, the study of K fixation problems in soils is of
particular agronomic and practical interest. It permits a better understanding of the soil
behavior to the application of fertilizer and it generally contributes to the more effective
evaluation of crop needs for potassium.[10]
In the soils with exchangeable potassium under 180 mg of K kg-1 soil is fixed about
2.5 times more potassium than in soils with exchangeable potassium larger than 180 mg K
kg-1soil. In the first group of soils, potassium fertilizer should be used both for plant nutrition
and to enrich the soil while in the second group of soils of potassium fertilizers should
primarily target plant nutrition.[13]
Hence it is imperative to know the fixation characteristics of soils with a view to
making rational recommendations about K-fertilizers.[10]
Fixation of added fertilizer potassium is important in the dynamics of soil K and it
affects the availability of K to crops. [8] Fertilizer recommendation programs must therefore
take into account this amount that is initially fixed. In general, periodic evaluation of soil K
status is necessary for rational K fertilizer management.[14]
Further K fixation and its retention in slowly available form is beneficial especially in
light textured sandy soils under high rainfall condition. [8]

JOURNAL OF INTERNATIONAL ACADEMIC RESEARCH FOR MULTIDISCIPLINARY Impact Factor 5.419, ISSN: 2320-5083, Volume 7, Issue 11, December 2019
3 www.jiarm.com
Exchangeable K+ ranges between 40 and about 400 mg kg-1 soil even more.
Concentration of <100 mg K kg-1 soil are frequently in the deficiency range; concentration
between 100 and 250 mg K kg-1 soil are in the range of sufficiently to well-supplied soils. [4]
When the solution and exchangeable pool of K are low to medium status and are
enriched with potassium through K-fertilizers, potassium is likely to be fixed with passage of
time. [7]
The objective of this study is to make an assessment of the capacity for K fixation
related to added potassium doses of some soils selected in the western regions of Albania.
The quantity of potassium extracted with 1M NH4OAc before treatment with KCl
represents the total amount of exchangeable forms having the studied soil. The amount of
potassium extracted with 1 N NH4OAc solution after the equilibrium time with the added
KCl represents the total amount of exchangeable forms having the soils under study after
addition of K to the soil.
Difference before and after treatment with KCl is added potassium that is fixed to the soil.
2. MATERIAL AND METHODS
Soils from four different sites in the western regions of Albania are used. Soil samples
was collected: Two samples from Tirana region (S-TR1 and S-TR2); one sample from Berat
region (S-BR); and one samples from Vlora region S-VL1.
The soil samples were air-dried, were sieves to pass a 2 mm sieve, and were used for
analyzing of physical and chemical properties as:
Soil Texture (Hydrometer method); Organic matter (Potassium dichromate method);
pH-H2O (1:5 soil – water ratio); Total Nitrogen (Kjeldahl method); Available Phosphorus.
(Mehlich–3 Method); Exchangeable Potassium (Mehlich–3 Method)
Some data on physical and chemical properties of the soil selected for this study are
presented in Table 1.
Table 1. Physical chemical properties of selected soils.
Organic Matter %
pH-H2O
Total Nitrogen mg kg-1
Available phosphorus mg kg-1
Exchangeable potassium mg kg-1
Sand %
Silt %
Clay %
Minimum 0,48 7,8 655,9 3,0 65,5 6,5 8,6 20.8 Maximum 1.73 8,5 1064,0 108 192,3 20,9 67,3 81,2 Average 0.96 8,12 820,4 16.6 148,9 11,5 47,0 41,4

JOURNAL OF INTERNATIONAL ACADEMIC RESEARCH FOR MULTIDISCIPLINARY Impact Factor 5.419, ISSN: 2320-5083, Volume 7, Issue 11, December 2019
4 www.jiarm.com
The data presented in Table 1 show that the soils obtained in this study have a high
variability in their physical and chemical properties.
Potassium fixation experiments. Potassium fixation characteristics were studied in
the first (surface) layer (0-30 cm) of the soil profiles from the four soil samples selected
from samples collected in Tirana
Berat and from Vlora regions. Two samples from Tirana (S-TR1 and S-TR2); one
sample from Berat (S-BR); and one samples from Vlora (S-VL1).
Fifty gram of each soil sample were weighed into 100 mL plastic bottles and
equilibrated in the room temperature (≈25oC) after adding as a KCl solution of five rates of
K, 0; 200; 400; 800 and 1600 mg K kg-1 soil. A known volume of standard K solution was
added to each bottle to make the final soil – solution ratio of 1:1. After equilibration for 24
hours about 5 grams soil samples was dried at 105 ° C and analyzed for K in 1M NH4OAc
extract. The ratio soil – extraction solution was 1 : 10. (2.5 g dried soil : 25 ml 1M NH4OAc
extract)
The same procedure is repeated after an equilibrium period of 30 days.
Potassium concentration in the filtrate was determined by Flame AAS.
The K fixation capacity was calculated as follows:
K fixed = applied-K + NH4OAc-extractable K of control sample – NH4OAc-
extractable K.
Where:
K-fixed = amount of added K fixed, mg kg-1 soil
applied - K = amount of added-K, mg kg-1 soil
Extractable-K= amount of extractable K in K-treated soil after incubation time, mg
kg-1 soil
Extractable-K control sample = amount of extractable K without added K, mg kg-1 soil
3. RESULTS AND DISCUSSION
Potassium fixation characteristics were studied in 4 selected soil samples collected in
the western regions of Albania. Soils have exchangeable K extracted by 1M NH4OAc in
range from 109 mg K kg-1 soil to 238 mg K kg-1 soil and extractable K extracted by 1 N
HNO3 in range from 467 mg K kg-1 soil to 820 mg K kg-1 soil. [12]
The capacity to fix potassium is an important characteristic of the soil and is
determined by many environmental factors such as clay fraction mineralogy, organic matter

JOURNAL OF INTERNATIONAL ACADEMIC RESEARCH FOR MULTIDISCIPLINARY Impact Factor 5.419, ISSN: 2320-5083, Volume 7, Issue 11, December 2019
5 www.jiarm.com
content, cation exchange capacity, soil reaction, etc.[2][1]It is also reported that a significant
impact on soil capacity to fix potassium has also the sand and silt fractions [6]
In other side, capacity for fixing potassium is a very important indicator to show the
potentials of the soil to adsorb potassium from available forms of soil potassium as is
considered extracted potassium from soils with 1M NH4OAc solution.
Fixed potassium in soils considered the amount of added potassiumthatisnotextracted
with 1 N NH4OAc, according to the procedure wehavepresented in the Material and Methods.
Thispotassiumisstronglyattached to the soil and isincludedas non-replaceable or difficult to
replacepotassium.
In our study we are focused on a quantitative assessment of the capacity of the
selected soils to fix potassium in different added potassium doses and in two times of
equilibrium between soils and added potassium.
3.1. Soil capacity for fixing potassium after 1 day equilibrium.
Experimentalresults of the soil'scapacity to fixpotassiumafter a 24-hour
equilibriumperiod are presented in Table 2and Figure 1.
The amount of fixedpotassium on averagevalueis 354 mg K kg-1soil in S-TR2 sample,
366 mg K kg-1 soil in S-BR sample, 400 mg K kg-1soil in S-VL1 sample and 549 mg K kg-
1soil in S-TR1 sample.
In the other side, according to addedpotassiumdoses, the amount of fixedpotassiumis
81 mg K kg-1 soilat 200 mg K kg-1soil, 196 mg K kg-1soil at 400 mg K kg-1soil, 505 mg K kg-
1soil at a dose of 800 mg K kg-1soil and 882 mg K kg-1soil at a dose of 1600 mg K kg-1soil.
Table 2. Fixedpotassiumafter24 hours equilibrium.
Added potassium
(mg kg-1 soil)
Sample code
S-VL1 S-TR1 S-BR S-TR2 Average
(mg kg-1 soil)
200 116 103 79 49 87
400 244 310 168 63 196
800 404 590 490 535 505
1600 836 1194 730 769 882
Average 400 549 366 354

JOURNAL OF INTERNATIONAL ACADEMIC RESEARCH FOR MULTIDISCIPLINARY Impact Factor 5.419, ISSN: 2320-5083, Volume 7, Issue 11, December 2019
6 www.jiarm.com
Figure 1.Fixedpotassiumafter24 hours equilibrium.
The amount of fixedpotassiumreflects a very strong relationship with the amount of
potassiumadded to the soil. Thisisveryclear for allsoils and dosesstudied. Itisclearthat the
impact of the increased dose of potassiumhas a stronger impact (p <0.001) than the influence
of soilproperties (p <0.1) thatwehave in the study.
The information presented in Figure 1clearly shows that for all the soilsstudiedthereis
a very strong correlationbetween the increasedpotassium dose and the amount of soil-
fixedpotassium. The highestfixationcapacityisrepresented by the S-TR1 sample while the
othersoils show the same fixing capacity.
Ratio of fixed potash from the soils to added potash expressed as a percentage
(relative fixing capacity) after 24 hours of equilibrium is given in Table 3.
The amount of fixedpotassiumis on average 39% in S-TR2 sample, 47% in S-BR
sample, 55% in S-VL1 sample and 69% in S-TR1 sample.
Table 3. The relative fixing capacity after 24 hours of equilibrium
Addedpotassium
mg kg-1soil
Sample code Average
S-VL1 S-TR1 S-BR S-TR2
200 58 52 40 25 43,75
400 61 78 42 16 49,25
800 51 74 61 67 63,25
1600 52 75 46 48 55,25
Average 55 69 47 39
According to the addedpotassiumdoses, the amount of potassiumfixedis 43% at the
200 mg K kg-1 dose, 49% at the 400 mg K kg-1 dose, 63% at the 800 mg K kg-1 dose and
55% at a dose of 1600 mg K kg-1 soil. The data presented show thatincrease in the amount of
JOURNAL OF INTERNATIONAL ACADEMIC RESEARCH FOR MULTIDISCIPLINARY Impact Factor 5.419, ISSN: 2320-5083, Volume 7, Issue 11, December 2019
7 www.jiarm.com
addedpotassium up to 800 mg K kg-1 soilisalsoassociated with the increase in the
fixationpercentage, abovethisamountwehave a decrease in the fixationpercentage.
3.2. Soil capacity for fixing potassium after 30 days equilibrium.
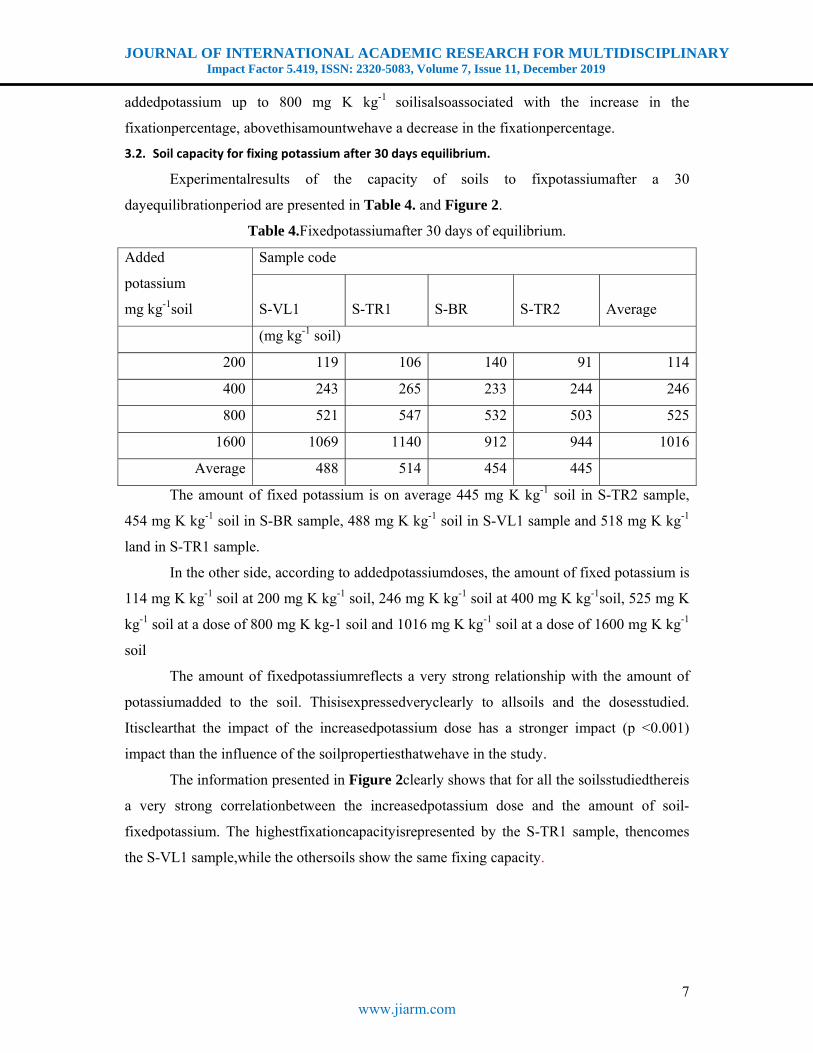
Experimentalresults of the capacity of soils to fixpotassiumafter a 30
dayequilibrationperiod are presented in Table 4. and Figure 2.
Table 4.Fixedpotassiumafter 30 days of equilibrium.
Added
potassium
mg kg-1soil
Sample code
S-VL1 S-TR1 S-BR S-TR2 Average
(mg kg-1 soil)
200 119 106 140 91 114
400 243 265 233 244 246
800 521 547 532 503 525
1600 1069 1140 912 944 1016
Average 488 514 454 445
The amount of fixed potassium is on average 445 mg K kg-1 soil in S-TR2 sample,
454 mg K kg-1 soil in S-BR sample, 488 mg K kg-1 soil in S-VL1 sample and 518 mg K kg-1
land in S-TR1 sample.
In the other side, according to addedpotassiumdoses, the amount of fixed potassium is
114 mg K kg-1 soil at 200 mg K kg-1 soil, 246 mg K kg-1 soil at 400 mg K kg-1soil, 525 mg K
kg-1 soil at a dose of 800 mg K kg-1 soil and 1016 mg K kg-1 soil at a dose of 1600 mg K kg-1
soil
The amount of fixedpotassiumreflects a very strong relationship with the amount of
potassiumadded to the soil. Thisisexpressedveryclearly to allsoils and the dosesstudied.
Itisclearthat the impact of the increasedpotassium dose has a stronger impact (p <0.001)
impact than the influence of the soilpropertiesthatwehave in the study.
The information presented in Figure 2clearly shows that for all the soilsstudiedthereis
a very strong correlationbetween the increasedpotassium dose and the amount of soil-
fixedpotassium. The highestfixationcapacityisrepresented by the S-TR1 sample, thencomes
the S-VL1 sample,while the othersoils show the same fixing capacity.

JOURNAL OF INTERNATIONAL ACADEMIC RESEARCH FOR MULTIDISCIPLINARY Impact Factor 5.419, ISSN: 2320-5083, Volume 7, Issue 11, December 2019
8 www.jiarm.com
Figure 2.Fixedpotassiumafter 30 days of equilibrium.
Ratio of fixed potash from the soils to added potash expressed as a percentage after 30
days of equilibrium is given in Table 5.
Table 5. The relative fixing capacity after 30 days of equilibrium
Added
potassium
mg kg-1soil
Sample code Average
S-VL1 S-TR1 S-BR S-TR2
200 60 53 70 46 57
400 61 66 58 61 62
800 65 68 67 63 66
1600 67 71 57 59 64
Average 63 65 63 57
The amount of fixedpotassiumis on average 57% in S-TR2 sample, 63% in S-BR
sample, 63% in S-VL1 sample and 65% in S-TR1 sample.
According to the addedpotassium dose the amount of potassiumfixedis 57 % at the
200 mg K kg-1 dose, 62 % at the 400 mg K kg-1 dose, 66 % at the 800 mg K kg-1 dose and
63% at a dose of 1600 mg K kg-1 soil. The data presented show thatincrease in the amount of
addedpotassium up to 800 mg K kg-1soil isassociated with the increase in relative fixing
capacity and abovethisamountwehave a slightlyreduced in the relative fixing capacity. Also,
we can seethatafter 30 days the equilibriumwehave a stabilization of potassiumfixation.
3.3. Impact of time on soilcapacity for potassiumfixation
The length of the equilibriumperiodhas a significant impact on the amount of
fixedpotassiumthatresults from the contribution of addedpotassium.

JOURNAL OF INTERNATIONAL ACADEMIC RESEARCH FOR MULTIDISCIPLINARY Impact Factor 5.419, ISSN: 2320-5083, Volume 7, Issue 11, December 2019
9 www.jiarm.com
Ratio of fixed potash from the soils to added potash expressed as a percentage 24 hour and 30
days after equilibrium is given in Figure 3.
As shown in Figure 3. the extension of the interactionperiodgive an increase in
potassiumfixed in the soil.
Figure 3. Percentage of soil-fixedpotassium in relation to addedpotassium in twoperiods of interaction
The strongest impact of the time of interaction in amount of fixedpotassiumrelated to
addedpotassium dose wasgiven in the addedpotassiumdoses of 200 mg K kg-1 soil and 400
mg K kg-1 soil. The data presented indicate an increase in the amount of potassiumfixedat 25
mg K kg-1 soil or 31% and 50 mg K kg-1 soil or 26%. Whileatotherdoses the increase in the
amount of fixedpotassiumis 134 mg K kg-1 soil or 15% for the amount of 1600 mg K kg-1 soil
of addedpotassium and 20 mg K kg-1 soil or 4% for the amount of 800 mg K kg-1 soil of
potassiumadded.
Ratio of fixed potash from the soils to added potash expressed as a percentage 24 hour
and 30 days after equilibrium is given in Figure 4.
Asshown in Figure 4. the extension of the interactionperiodgive an increase in
potassiumfixed in the soil with the exception of soil sample S-TR1
Allothersoilsanalyzed show about the samelevel of increase in the amount of
potassiumfixed over 30 days of interaction of soil with addedpotassiumcompared to 24-hour
interaction. Values are 88, 88 and 91 mg K kg-1soil or 22, 24 and 26% for S-VL1, S-BR and
S-TR2 samples, respectively

JOURNAL OF INTERNATIONAL ACADEMIC RESEARCH FOR MULTIDISCIPLINARY Impact Factor 5.419, ISSN: 2320-5083, Volume 7, Issue 11, December 2019
10 www.jiarm.com
Figure 4.Percentage of soil-fixedpotassium in relation to the soilssamplesin twoperiods of interaction
Trends of the potassium fixing capacityrelated to addedpotassiumdoses in the
studiedsoilsispresented in Figures 5 - 8.
Here wehavecalculated the linear equations of potassium fixing capacityas a function
of the amount of potassiumadded to the soil for the twoincubationperiods.The
regressioncoefficient "a" represents the amount of potassiumfixed for
eachpotassiumunitadded to the soil.
In Figure 5wepresent the effect of the addedamount of potassium in the soil on the
amount of potassiumfixed to the sample S-VL1.
Figure 5. Fixing potassiumcapacity in sample S-VL1
The S-VL1 sample exhibits a high potassium fixation capacity. For each unit of
potassium added to the soil after 30 days 0.673 units are fixed by the soil and only 0.327 units
remain in the soil as exchangeable potassium. In this sample we find that the fixation capacity
after 30 days is 31.2% higher than the fixation capacity on the first day of interaction of

JOURNAL OF INTERNATIONAL ACADEMIC RESEARCH FOR MULTIDISCIPLINARY Impact Factor 5.419, ISSN: 2320-5083, Volume 7, Issue 11, December 2019
11 www.jiarm.com
potassium added with the soil. This is the sample where we have had the strongest effect of
the timing of the interaction of potassium added with the soil. We think that this strong effect
of time in the fixing capacity of soils is related with high content of the clay in this sample.
(Clay 81.2%; Silt 8.6%). Such a strong effect of Clay on soil fixing capacity has been
reported.[9] [10]
In Figure 6 wepresent the effect of the addedamount of potassium in the soil on the
amount of potassiumfixed to the sample S-TR1.
The S-TR1 sample exhibits the highest potassium fixing capacity. For each unit of
potassium added to the soil after 30 days, 0.721 units are fixed from the soil and only 0.279
units remain in the soil as exchangeable potassium.
In this sample we find that the fixation capacity after 30 days was 4.7% lower than the
fixation capacity on the first day of interaction of potassium added with the soil. A similar
result has been reported in other studies.[14]Although the differences are very small, probably
the dominant role in the texture of the soils was the dominance of the silt fraction in soil
texture (Silt 67.3%; Clay 26.3%). Such a strong effect of Silt on soil fixing capacity has been
reported [6]
Figure 6. Fixing potassiumcapacity in sample S-TR1
In Figure 7wepresent the effect of the addedamount of potassium in the soil on the
amount of potassiumfixed to the sample S-BR.

JOURNAL OF INTERNATIONAL ACADEMIC RESEARCH FOR MULTIDISCIPLINARY Impact Factor 5.419, ISSN: 2320-5083, Volume 7, Issue 11, December 2019
12 www.jiarm.com
Figure 7. Fixing potassiumcapacity in sample S-BR
The S-BR sample exhibits a moderate potassium fixation capacity. For each unit of
potassium added to the soil after 30 days 0.572 units are fixed by the soil and 0.428 units
remain in the soil as exchangeable potassium. In this sample we find that the fixation capacity
after 30 days is 20.2% higher than the fixation capacity on the first day of interaction of
potassium added with the soil. This is the sample where we have had a strong effect of the
time of the interaction of potassium added with the soil.
In Figure 8wepresent the effect of the addedamount of potassium in the soil on the
amount of potassiumfixed to the sample S-TR2.
The S-TR2 sample exhibits a moderate potassium fixation capacity. For each unit of
potassium added to the soil after 30 days 0.599 units are fixed by the soil and 0.401 units
remain in the soil as exchangeable potassium. In this sample we find that the fixation capacity
after 30 days was 13.7% higher than the fixation capacity on the first day of interaction of
potassium added with the soil.
+
Figure 8. Fixing potassiumcapacity in sample S-TR2

JOURNAL OF INTERNATIONAL ACADEMIC RESEARCH FOR MULTIDISCIPLINARY Impact Factor 5.419, ISSN: 2320-5083, Volume 7, Issue 11, December 2019
13 www.jiarm.com
In this sample the time of the interaction of potassium added with the soil have had a
moderate effect in increasing the fixing soil capacity of potassium.
The above mentioned data show us that the studied soils require different treatments in the
use of potassium fertilizers.
For the studies soils, the contribution of potassium fertilization to increasing the
exchangeable potassium capacity is highest in soils with balanced content of clay and silt.
Thus in the soils represented by S-TR2 sample (Clay 37.4%; Silt 54.0%). ) and S-BR sample
(Clay 20.8%; Silt 58.3%) the exchangeable forms of potassium remaining in the soil after 30
days are 0.401 and 0.428 units per any unit of added fertilizer, respectively.
In othersoils with high-content of silt and in very high - contaent of clay the
fixedcapacity for addedpotassiumisvery high. So, wehavereducing of the
exchangeableforms of potassiumthat come from fertilization. Thus in the soilsrepresented by
S-TR1 sample (Silt 63.7%) and S-VL1 sample (Clay 81.2%) the exchangeableforms of
potassiumremaining in the soilafter 30 days are 0.279 and 0. 327 units per anyunit of
addedfertilizer, respectively.
In the first group of soils, potassium fertilizer should be used both for plant nutrition
and to enrich the soil while in the second group of soils of potassium fertilizers should
primarily target plant nutrition.
However, further research is required to study the contribution of different soil factors
to capacity of fixation for potassium added to the soil from fertilizers.
CONCLUSIONS
K fixation capacity of studies soils was in range from 354 mg K kg-1 soil to 549 mg K
kg-1 (39 – 69 % of added potassium) after first day of equilibrium with an average value 417
mg K kg-1 soil for all samples and range from 445 mg K kg-1 soil to 514 mg K kg-1 (57 – 65
% of added potassium) after 30 days of equilibrium with an average value 475 mg K kg-1 soil
for all samples. K fixation capacity of studies soils according to added potassium dose was in
range from 87 mg K kg-1 soil to 882 mg K kg-1 (44 – 63 % of added potassium) after first day
of equilibrium and range from 114 mg K kg-1 soil to 1016 mg K kg-1 (57 – 66 % of added
potassium) after 30 days of equilibrium.
Increase in the amount of addedpotassium up to 800 mg K kg-1soil isassociated with
the increase in the relative fixing capacity and abovethisamountwehave a slightlyreduced in
the relative fixing capacity.

JOURNAL OF INTERNATIONAL ACADEMIC RESEARCH FOR MULTIDISCIPLINARY Impact Factor 5.419, ISSN: 2320-5083, Volume 7, Issue 11, December 2019
14 www.jiarm.com
The strongest impact of the time of interaction in amount of fixedpotassiumrelated to
addedpotassium dose wasgiven in the loweraddedpotassiumdoses (200 mg K kg-1 soil and
400 mg K kg-1 soil) compare to the higheraddedpotassiumdoses (800 mg K kg-1 soil and 1600
mg K kg-1 soil).
In the studied soils the amount of fixedpotassiumfitswell with the amount of
potassiumadded and can express a linear equation y = ax + b with a high coefficient of
determination (R2 = 0.992 - 0.999) and only in one case R2 = 0.921
Potassium fixing capacity of soils according to added potassium doses is very important in
fertilizers recommendation. In soils with high potential to fix potassium the potassium
fertilizers should primarily target plant nutrition.
REFERENCES
1. Beckett, P H T 1970. Fixed K and the residual effects of K fertilizers. Potash Review Subject 16, 52th Suite:1-12
2. Joshi, D. C. et al. (1982) Soil factors affecting forms of potassium and potassium fixation in some arid soils. Annals of Arid Zone - 21 (3), 199-205,
3. Kristo, I., F. Sallaku., S. Shallari. 2003. Available potassium in some Albanian soils estimated by CAL and EUF methods (In Albanian). Albanian Sciences. N 2; 5-14.
4. Mengel, K., 2006. Potassium. In Handbook of Plant nutrition. Edited by A.V. Berker and D. J. Pilbeam. 91-121.
5. Mengel, K., and E. A. Kirkby. 1980. Potassium in crop production. Adv. Agron. 33:59-110 6. Najafi-Ghiri, M. and Abtahi, A.(2013).Potassium Fixation in Soil Size Fractions of Arid
Soils.Soil& Water Res., 8, 2013 (2): 49–55 7. Panda, R., Patra, S.K. (2017) Fixation and Recovery of Applied Potassium in Some Coastal
Soils of West Bengal, India. International Journal of Current Microbiology and Applied Sciences ISSN: 2319-7706 Volume 6 Number 3 pp. 2286-2295
8. Seal, A., et al. (2006) Potassium Fixation Capability of Some Acid Alfisols Developed under Tropical Environment in Eastern India International Journal of Soil Science, Volume 1 (2): 128-133,
9. Sharpley A. N. 1990. Reaction of Fertilizer Potassium in Soils of Differing Mineralogy. Soil Science, Vol. 149, No.1 44-51
10. Simonis, A., Setatou, H., Tsadilas, C. Potassium Fixation in Soils and Recovery of Fertilizer Potassium by the Plants. natres.psu.ac.th/link/soilcongress/bdd/symp13b/1164-t.pdf
11. Sula, J., Kristo, I. 2019. Available Phosphorus and Exchangeable Potassium in some Albanian Soils Extracted by Different Extraction Methods. Albanian j. agric. sci. 2019;18 (1): 20-25.
12. Sula, J., Huqi, F. Kristo, I. 2019. Estimation of Extractable Potassium in some Selected Soils in Albania. Albanian j. agric. sci. 2019; (Special edition); 157-160
13. Sula, J., Huqi, F. Kristo, I. 2019. Potassium Fixation Capacity in some Selected Soils in Albania. Albanian j. agric. sci. 2019; 149-156
14. Thomas EY, Omueti J, BandeleB.(2016) Potassium Fixing Capacities of Some Selected Soils in South Western Nigeria. Agri Res & Tech: Open Access J. 2016; 2(1): 555577. DOI: 10.19080/ARTOAJ.2016.01.555577