ROE Dr Roger Morin Rebuttal Testimony - PNM Resources · REBUTTAL TESTIMONY OF DR. ROGER A. MORIN...
69
BEFORE THE NEW MEXICO PUBLIC REGULATION COMMISSION IN THE MATTER OF THE APPLICATION ) OF PUBLIC SERVICE COMPANY OF NEW ) MEXICO FOR REVISION OF ITS RETAIL ) ELECTRIC RATES PURSUANT TO ADVICE ) Case No. 07-00077-UT NOTICE NO. 334 ) ) PUBLIC SERVICE COMPANY OF NEW ) MEXICO, ) ) Applicant. ) ) REBUTTAL TESTIMONY OF DR. ROGER A. MORIN NOVEMBER 19, 2007
-
Upload
vuongduong -
Category
Documents
-
view
218 -
download
0
Transcript of ROE Dr Roger Morin Rebuttal Testimony - PNM Resources · REBUTTAL TESTIMONY OF DR. ROGER A. MORIN...
BEFORE THE NEW MEXICO PUBLIC REGULATION COMMISSION
IN THE MATTER OF THE APPLICATION ) OF PUBLIC SERVICE COMPANY OF NEW ) MEXICO FOR REVISION OF ITS RETAIL ) ELECTRIC RATES PURSUANT TO ADVICE ) Case No. 07-00077-UT NOTICE NO. 334 ) ) PUBLIC SERVICE COMPANY OF NEW ) MEXICO, ) )
Applicant. ) )
REBUTTAL TESTIMONY
OF
DR. ROGER A. MORIN
NOVEMBER 19, 2007

REBUTTAL TESTIMONY OF DR. ROGER A. MORIN
NMPRC CASE NO. 07-00077-UT
1
I. INTRODUCTION
Q. PLEASE STATE YOUR NAME, ADDRESS, AND OCCUPATION. 1
A. My name is Dr. Roger A. Morin. My business address is Georgia State 2
University, Robinson College of Business, University Plaza, Atlanta, Georgia, 3
30303. I am Emeritus Professor of Finance at the Robinson College of Business, 4
Georgia State University and Professor of Finance for Regulated Industry at the 5
Center for the Study of Regulated Industry at Georgia State University. I am also 6
a principal in Utility Research International, an enterprise engaged in regulatory 7
finance and economics consulting to business and government. 8
9
Q. PLEASE DESCRIBE YOUR EDUCATIONAL BACKGROUND. 10
A. I hold a Bachelor of Engineering degree and an MBA in Finance from McGill 11
University, Montreal, Canada. I received my Ph.D. in Finance and Econometrics 12
at the Wharton School of Finance, University of Pennsylvania. 13
14
Q. PLEASE SUMMARIZE YOUR ACADEMIC AND BUSINESS CAREER. 15
A. I have taught at the Wharton School of Finance, University of Pennsylvania, 16
Amos Tuck School of Business at Dartmouth College, Drexel University, 17
University of Montreal, McGill University, and Georgia State University. I was a 18
faculty member of Advanced Management Research International, and I am 19
currently a faculty member of The Management Exchange Inc. and Exnet, Inc., 20
where I continue to conduct frequent national executive-level education seminars 21
throughout the United States and Canada. In the last thirty years, I have 22

REBUTTAL TESTIMONY OF DR. ROGER A. MORIN
NMPRC CASE NO. 07-00077-UT
2
conducted numerous national seminars on “Utility Finance,” "Utility Cost of 1
Capital," "Alternative Regulatory Frameworks," and on "Utility Capital 2
Allocation," which I have developed on behalf of The Management Exchange Inc. 3
and Exnet in conjunction with Public Utilities Reports, Inc. 4
I have authored or co-authored several books, monographs, and articles in 5
academic scientific journals on the subject of finance. They have appeared in a 6
variety of journals, including The Journal of Finance, The Journal of Business 7
Administration, International Management Review, and Public Utility 8
Fortnightly. I published a widely-used treatise on regulatory finance, Utilities' 9
Cost of Capital, Public Utilities Reports, Inc., Arlington, Va. 1984. My second 10
book on regulatory matters, Regulatory Finance, is a comprehensive treatise on 11
the application of finance to regulated utilities and was released by the same 12
publisher in late 1994. My third book, The New Regulatory Finance, was recently 13
published in July 2006. I have engaged in extensive consulting activities on 14
behalf of numerous corporations, legal firms, and regulatory bodies in matters of 15
financial management and corporate litigation. PNM Exhibit RAM-1R describes 16
my professional credentials in more detail. 17
18
Q. HAVE YOU PREVIOUSLY TESTIFIED ON COST OF CAPITAL 19
BEFORE UTILITY REGULATORY COMMISSIONS? 20
A. Yes, I have been a cost of capital witness before some fifty (50) regulatory bodies 21
in North America, including the Federal Energy Regulatory Commission 22
(“FERC”, or “Commission”) and the Federal Communications Commission. I 23

REBUTTAL TESTIMONY OF DR. ROGER A. MORIN
NMPRC CASE NO. 07-00077-UT
3
have also testified before the following state, provincial, and other local 1
regulatory commissions: 2
Alabama Hawaii Montana Ontario Alaska Illinois Nevada Oregon Alberta Indiana New Brunswick Pennsylvania Arizona Iowa New Hampshire Quebec Arkansas Kentucky New Jersey South Carolina British Columbia Louisiana New York South Dakota California Maine Newfoundland Tennessee Colorado Manitoba North Carolina Texas Delaware Michigan North Dakota Utah District of Columbia Minnesota Nova Scotia Vermont Florida Mississippi Ohio Washington Georgia Missouri Oklahoma West Virginia
3
PNM Exhibit RAM-1R provides the details of my participation in regulatory 4
proceedings. 5
6
Q. WHAT IS THE PURPOSE OF THIS REBUTTAL TESTIMONY? 7
A. I have been asked to rebut Mr. Patin’s (Utility Division Staff of the New Mexico 8
Public Regulation Commission), and Ms. Crane’s (New Mexico Attorney 9
General) cost of capital testimonies. 10
11
Q. HOW IS YOUR REBUTTAL TESTIMONY ORGANIZED? 12
A. My rebuttal testimony is organized in two sections, corresponding to the 13
aforementioned tasks. 14
15
16

REBUTTAL TESTIMONY OF DR. ROGER A. MORIN
NMPRC CASE NO. 07-00077-UT
4
I. REBUTTAL OF MR. PATIN’S TESTIMONY 1
Q. PLEASE SUMMARIZE MR. PATIN'S RATE OF RETURN 2
RECOMMENDATION. 3
A. In determining Public Service Company of New Mexico’s (“PNM”, or the 4
“Company”) cost of equity capital, Mr. Patin applies only one methodology, 5
namely the Discounted Cash Flow (“DCF”) model, to a group of seventeen (17) 6
electric utility companies. No other methodologies or checks are applied. Based 7
on the results of this single DCF analysis, Mr. Patin recommends a return of only 8
9.10% on PNM's common equity capital as the fair and reasonable return on the 9
Company’s common equity investment (“ROE”). 10
I will address the very limited scope and the numerous flaws and errors of logic in 11
Mr. Patin's testimony. 12
13
Q. DO YOU HAVE ANY GENERAL COMMENTS ON MR. PATIN'S 14
TESTIMONY? 15
A. Yes. Before engaging in specific criticisms of Mr. Patin's testimony, I should set 16
forth my general reactions to his testimony. My first reaction is that Mr. Patin's 17
single-digit ROE recommendation of 9.10% for PNM would be the lowest 18
authorized rate of return for a major electric utility in the United States. This is a 19
clear indication that his ROE recommendation for PNM is far too low. 20
My second general reaction is that Mr. Patin’s testimony is extremely narrow in 21
scope, relying exclusively on the fragile DCF methodology. This very narrow 22
approach to determining the cost of equity stands in sharp contrast with the 23

REBUTTAL TESTIMONY OF DR. ROGER A. MORIN
NMPRC CASE NO. 07-00077-UT
5
practices of investment analysts, finance experts, corporate analysts, finance 1
professionals, and most expert witnesses in regulatory finance. It is very 2
dangerous and highly inappropriate to rely solely on the DCF method because it is 3
the most delicate conceptually. Moreover, there are numerous logical 4
inconsistencies and errors in Mr. Patin’s implementation of the one method he 5
used. 6
My third reaction is that Mr. Patin’s testimony contains several outrageous, 7
unfounded, and erroneous statements with regards to utility regulation and 8
financial models. 9
10
Q. WHAT ARE THE BASIC CONCLUSIONS OF YOUR REBUTTAL TO 11
MR. PATIN'S COST OF EQUITY TESTIMONY? 12
A. Mr. Patin's recommendation is highly unreliable as it relies exclusively on a single 13
version of the DCF methodology. Moreover, the one methodology that Mr. Patin 14
has employed to support his ROE recommendation contains several errors and 15
omissions. As a result, PNM's cost of equity capital is understated by 310 – 340 16
basis points. Correcting these errors would easily bring Mr. Patin’s recommended 17
ROE above 11.0%. 18
19
Q. PLEASE SUMMARIZE YOUR SPECIFIC CRITICISMS OF MR. PATIN'S 20
TESTIMONY. 21
A. I have fourteen (14) specific criticisms: 22
REBUTTAL TESTIMONY OF DR. ROGER A. MORIN
NMPRC CASE NO. 07-00077-UT
6
1. Unreliable Recommendation. Mr. Patin’s ROE recommendation is 1
unreasonably low, and is not a reliable estimate of PNM's cost of equity capital 2
given his sole reliance on one particular cost of equity methodology that is known 3
to understate investor returns. 4
2. Allowed returns. Mr. Patin's recommended return is well outside the zone of 5
currently allowed rates of return for his sample companies and for the industry 6
generally. 7
3. The DCF Model Understates the Cost of Equity. It is well known that 8
application of the standard DCF model to utility stocks understates the investor's 9
expected return when the Market-to-Book (M/B) ratio exceeds unity. This is 10
particularly relevant in the current capital market environment where utility 11
stocks, including Mr. Patin’s sample companies, are trading at M/B ratios well 12
above unity. 13
4. Understated Dividend Yield. It is inappropriate to rely on the spot dividend 14
yield (Do/P) when implementing the DCF model. The appropriate manner of 15
implementing the DCF model is to rely on the expected dividend yield (D1/P) 16
rather than the spot dividend yield. The former is obtained by multiplying the 17
latter by one plus the growth rate (1 + g). This error understates the DCF results 18
by some 30 basis points. 19
5. DCF Functional Form. By ignoring the time value of quarterly dividend 20
payments, Mr. Patin's application of the DCF method does not properly match the 21
observed stock price with the dividend payments expected by the investor and 22
thus understates the expected return on equity by approximately 20 basis points. 23

REBUTTAL TESTIMONY OF DR. ROGER A. MORIN
NMPRC CASE NO. 07-00077-UT
7
6. DCF Dividend Yield and Flotation Costs. Mr. Patin's dividend yield 1
component is understated by 30 basis points because it does not allow for 2
flotation costs, and, as a result, a legitimate stockholder expense is left 3
unrecovered. 4
7. Stale Dividend Yield. Mr. Patin relies on a 2006 dividend yield component 5
in two of his DCF analyses. The appropriate dividend yield to employ is the 6
prospective dividend yield at the time of estimating the cost of equity, rather than 7
some historical dividend yield reaching back almost one year. 8
8. DCF Historical Growth Rates. Mr. Patin examines historical data despite 9
substantial changes occurring in the energy utility industry. Moreover, the 10
historical growth rates that Mr. Patin examines in his DCF analysis are largely 11
redundant since historical growth patterns are already reflected in Value Line’s 12
growth forecasts, which he also uses. Also, the stock price Mr. Patin uses in the 13
dividend yield component of his DCF analysis is predicated on analysts’ growth 14
forecasts and not on historical growth rates. 15
9. DCF Dividend Growth Rates. Mr. Patin examines historical and projected 16
dividend growth in his DCF analysis even though electric utilities are reducing 17
dividend payouts. Because energy utilities are expected to continue lowering 18
their dividend payout ratio over the next several years in response to heightened 19
business risk, the use of dividend growth projections is inappropriate in the DCF 20
model. Earnings growth projections are far more relevant at this point. 21
10. DCF Analysts’ Growth Forecasts. Mr. Patin fails to use analysts’ earnings 22
growth forecasts in his DCF analyses, even though stock prices are predicated on 23

REBUTTAL TESTIMONY OF DR. ROGER A. MORIN
NMPRC CASE NO. 07-00077-UT
8
such forecasts. Investors expect substantially higher growth rates for utilities than 1
what Mr. Patin employs in his DCF analysis. 2
11. Long-Term Economic Growth. Because the growth term of the DCF 3
model is perpetual in nature, it is quite reasonable to assume that a utility’s long-4
term growth profile will match the overall growth of the economy, as measured 5
by the Gross Domestic Product (GDP). Mr. Patin’s average growth rates are 6
quite inconsistent with the long-term growth of the economy. 7
12. Circular Logic. Mr. Patin’s implementation of DCF Model 8 is circular, for 8
he is using an assumed ROE that exceeds his own recommended ROE. 9
13. Negative Risk Premium. One third of Mr. Patin’s DCF estimates are less 10
than the cost of debt. The notion of a negative risk premium whereby the expected 11
market return of common equity is less than that of the bonds of the same issuer is 12
not consistent with the basic precepts of finance, economics, and business law. 13
14. Unfounded Statements. Mr. Patin makes several outrageous, unfounded, and 14
unprofessional statements in his testimony. 15
16
1. UNRELIABLE RECOMMENDATION 17
Q. DID MR. PATIN PERFORM ANY KIND OF RISK PREMIUM ANALYSIS 18
IN ORDER TO ARRIVE AT HIS RECOMMENDATION? 19
A. No, he did not. 20
21
REBUTTAL TESTIMONY OF DR. ROGER A. MORIN
NMPRC CASE NO. 07-00077-UT
9
Q. DID MR. PATIN PERFORM A CAPITAL ASSET PRICING MODEL 1
(“CAPM”) ANALYSIS IN ORDER TO ARRIVE AT HIS 2
RECOMMENDATION? 3
A. No, he did not. 4
5
Q. DID MR. PATIN PERFORM A COMPARABLE EARNINGS ANALYSIS 6
IN ORDER TO ARRIVE AT HIS RECOMMENDATION? 7
A. No, he did not. 8
9
Q. MR. PATIN HAS LIMITED THE COST OF EQUITY ESTIMATION 10
PROCESS TO ONE METHODOLOGY, NAMELY THE DCF METHOD. 11
DOES THIS AFFECT THE RELIABILITY OF HIS RESULTS? 12
A. Yes, very much so. The major problem in his testimony is the lack of 13
corroborating evidence. There are no other methodologies applied and there are 14
no objective crosschecks on his results. The 9.10% cost of equity recommended 15
by Mr. Patin is unreasonably low, and is not a reliable estimate of PNM’s cost of 16
equity capital. 17
There are four broad generic methodologies available to measure the cost of 18
equity: DCF, Risk Premium, Capital Asset Pricing Model (CAPM), which are 19
market-oriented, and Comparable Earnings, which is accounting-oriented. Each 20
generic market-based methodology in turn contains several variants. Mr. Patin 21
has chosen to rely on only one and to ignore other methodologies despite the fact 22
that he relied on more than one methodology in past testimonies. 23
REBUTTAL TESTIMONY OF DR. ROGER A. MORIN
NMPRC CASE NO. 07-00077-UT
10
When measuring equity costs, which essentially deal with the measurement of 1
investor expectations, no one single methodology provides a foolproof panacea. 2
Each methodology requires the exercise of considerable judgment on the 3
reasonableness of the assumptions underlying the methodology and on the 4
reasonableness of the proxies used to validate the theory. The failure of the DCF 5
model to account for changes in relative market valuation, and the practical 6
difficulties of specifying the expected growth component are vivid examples of 7
the potential shortcomings of the DCF model. It follows that more than one 8
methodology should be employed in arriving at a judgment on the cost of equity 9
and that these methodologies should be applied across a series of comparable risk 10
companies. 11
There is no single model that conclusively determines or estimates the expected 12
return for an individual firm. Each methodology possesses its own way of 13
examining investor behavior, its own premises, and its own set of simplifications 14
of reality. Each method proceeds from different fundamental premises, which 15
cannot be validated empirically. Investors do not necessarily subscribe to any one 16
method, nor does the stock price reflect the application of any one single method 17
by the price-setting investor. 18
There is no monopoly as to which method is used by investors. Absent any hard 19
evidence as to which method outdoes the other, all relevant evidence should be 20
used and weighted equally, in order to minimize judgmental error, measurement 21
error, and conceptual infirmities. I submit that the Commission should rely on 22
the results of a variety of methods applied to a variety of comparable groups, and 23
REBUTTAL TESTIMONY OF DR. ROGER A. MORIN
NMPRC CASE NO. 07-00077-UT
11
not rely, as Mr. Patin has done, on one particular methodology applied to a 1
sample group deemed to be comparable. There is no guarantee that a single DCF 2
result is necessarily the ideal predictor of the stock price and of the cost of equity 3
reflected in that price, just as there is no guarantee that a single CAPM or Risk 4
Premium result constitutes the perfect explanation of that stock price. 5
6
Q. DOES THE FINANCIAL LITERATURE SUPPORT SUCH A NARROW 7
APPROACH? 8
A. No, it does not. Authoritative financial literature strongly supports the use of 9
multiple methods. For example, Professor Eugene F. Brigham, a widely 10
respected scholar and finance academician, asserts in his cost of capital chapter: 11
Three methods typically are used: (1) the Capital Asset Pricing Model 12 (CAPM), (2) the discounted cash flow (DCF) method, and (3) the bond-yield-13 plus-risk-premium approach. These methods are not mutually exclusive – no 14 method dominates the others, and all are subject to error when used in practice. 15 Therefore, when faced with the task of estimating a company’s cost of equity, we 16 generally use all three. .1 17
18
Another prominent finance scholar, Professor Stewart Myers explains: 19
Use more than one model when you can. Because estimating the 20 opportunity cost of capital is difficult, only a fool throws away useful information. 21 That means you should not use any one model or measure mechanically and 22 exclusively. Beta is helpful as one tool in a kit, to be used in parallel with DCF 23 models or other techniques for interpreting capital market data.2 24
25
1 E. F. Brigham and M. C. Ehrhardt, Corporate Finance: A Focused Approach, p. 281 (2nd ed., Thomson
South-Western, 2006) 2 S. C. Myers, “On the Use of Modern Portfolio Theory in Public Utility Rate Cases: Comment,” Financial
Management, p. 67 (Autumn 1978)

REBUTTAL TESTIMONY OF DR. ROGER A. MORIN
NMPRC CASE NO. 07-00077-UT
12
Q. DOES THE BROAD USE OF THE DCF METHODOLOGY IN PAST 1
REGULATORY PROCEEDINGS INDICATE THAT IT IS SUPERIOR TO 2
OTHER METHODS? 3
A. No, it does not. Uncritical acceptance of the standard DCF equation vests the 4
model with a degree of reliability that is simply not justified. One of the leading 5
experts on regulation, Dr. Charles F. Phillips discusses the dangers of relying 6
solely on the DCF model: 7
“[U]se of the DCF model for regulatory purposes involves both 8 theoretical and practical difficulties. The theoretical issues include the 9 assumption of a constant retention ratio (i.e. a fixed payout ratio) and the 10 assumption that dividends will continue to grow at a rate 'g' in perpetuity. 11 Neither of these assumptions has any validity, particularly in recent years. 12 Further, the investors' capitalization rate and the cost of equity capital to a utility 13 for application to book value (i.e. an original cost rate base) are identical only 14 when market price is equal to book value. Indeed, DCF advocates assume that if 15 the market price of a utility's common stock exceeds its book value, the allowable 16 rate of return on common equity is too high and should be lowered; and vice 17 versa. Many question the assumption that market price should equal book value, 18 believing that the earnings of utilities should be sufficiently high to achieve 19 market-to-book ratios which are consistent with those prevailing for stocks of 20 unregulated companies.” 21
22 ...[T]here remains the circularity problem: Since regulation establishes a 23 level of authorized earnings which, in turn, implicitly influences dividends per 24 share, estimation of the growth rate from such data is an inherently circular 25 process. For all of these reasons, the DCF model suggests a degree of precision, 26 which is in fact not present and leaves wide room for controversy about the level 27 of k [cost of equity].3 28
29
Sole reliance on any one model, whether it is DCF, CAPM, or Risk Premium, 30
simply ignores the capital market evidence and investors’ use of the other 31
3 C. F. Phillips, The Regulation of Public Utilities Theory and Practice (Public Utilities Reports, Inc., 1988)
pp. 376-77 [Footnotes omitted]
REBUTTAL TESTIMONY OF DR. ROGER A. MORIN
NMPRC CASE NO. 07-00077-UT
13
theoretical frameworks. The DCF model is only one of many tools to be 1
employed in conjunction with other methods to estimate the cost of equity. It is 2
not a superior methodology that supplants other financial theory and market 3
evidence. 4
5
Q. HAS THE FEDERAL ENERGY REGULATORY COMMISSION (FERC) 6
RECOGNIZED THE NEED TO RELY ON MULTIPLE 7
METHODOLOGIES IN ESTIMATING THE COST OF EQUITY? 8
A. Yes, FERC has recognized that no one single methodology is preferred to the 9
exclusion of all others and that it is appropriate to consider the results of 10
alternative methods4. 11
12
Q. DOES THE DCF MODEL NEED TO BE APPLIED WITH EXTREME 13
CAUTION? 14
A. Yes, it does. Caution has to be used in applying the DCF model to utility stocks for 15
four reasons. The first reason is that the stock price used as input in the dividend 16
yield component may be unduly influenced by structural changes and changing 17
investor expectations in the utility industry. Stock prices can also be influenced by 18
mergers and acquisitions possibilities, by speculation concerning asset restructurings 19
and deregulation of certain assets, and by corporate takeover rumors. 20
The second reason is that the traditional DCF model is based on a number of 21
assumptions, some of which may be unrealistic in a given capital market 22
4 Distribas of Massachusetts Corp., 41 FERCD, 61,205 at 61,550 (1987).

REBUTTAL TESTIMONY OF DR. ROGER A. MORIN
NMPRC CASE NO. 07-00077-UT
14
environment. For example, the standard infinite growth DCF model assumes a 1
constant market valuation multiple, that is, a constant price/earnings (P/E) ratio. In 2
other words, the model assumes that investors expect the ratio of market price to 3
dividends (or earnings) in any given year to be the same as the current 4
price/dividend (or earnings) ratio. This must be true if the infinite growth 5
assumption is made. As the graph below attests, this assumption is somewhat 6
unrealistic given the surges in P/E ratios experienced by utility stocks in the last 7
decade. 8
9
1990
1991
1992
1993
1994
1995
1996
1997
1998
1999
2000
2001
2002
2003
2004
2005
2006
10
12
14
16
18
20
22
P/E
Ratio
Electric Utility IndustryP/E Ratios 1990-2006
10
11
Several fundamental and structural changes have transformed the utility industry 12
from the times when the standard DCF model and its assumptions were developed 13
by Professor Gordon. Increased competition triggered by national policy, 14
accounting rule changes, represcription of capital recovery rates, changes in 15
customer attitudes regarding utility services, the evolution of alternative energy and 16
information sources, deregulation, and mergers-acquisitions have all influenced 17

REBUTTAL TESTIMONY OF DR. ROGER A. MORIN
NMPRC CASE NO. 07-00077-UT
15
stock prices in ways vastly different from the early assumptions of the DCF model 1
developed in the early 1970s. These changes suggest that some of the raw 2
assumptions underlying the standard DCF model are questionable, and that the DCF 3
model should be complemented by alternate methodologies to estimate the cost of 4
common equity. 5
Contrary to the standard DCF assumption of a constant P/E ratio, stock price may 6
not necessarily be expected to grow at the same rate as earnings and dividends by 7
investors. This is especially true in the short run. Investors may very well assume 8
that the P/E ratio will in fact continue to increase in the short run, fueling the 9
expected rate of return. The converse is also true. P/E ratios have proved volatile 10
and unstable in recent years. The essential point is that the constancy of the P/E 11
ratio required in the standard DCF model may not always be a valid assumption. To 12
the extent that increases (decreases) in relative market valuation are anticipated by 13
investors, especially myopic investors with short-term investment horizons, the 14
standard DCF model will understate (overstate) the cost of equity. 15
The third reason, as I show below, is that the application of the DCF model produces 16
estimates of common equity cost that are consistent with investors' expected return 17
only when stock price and book value are reasonably similar, that is, when the 18
market-to-book (“M/B”) ratio is close to unity. The simple numerical illustration 19
shown below demonstrates that when the DCF cost rate is applied to a book value 20
rate base well above the market price, the DCF cost rate understates the investor's 21
required return. 22

REBUTTAL TESTIMONY OF DR. ROGER A. MORIN
NMPRC CASE NO. 07-00077-UT
16
A fourth concern deals with the realism of the constant growth rate assumption and 1
with the difficulty of finding an adequate proxy for that growth rate. The standard 2
DCF model assumes that a single growth rate of dividends is applicable in 3
perpetuity. It is difficult to imagine that today’s energy utility industry can be 4
described as stable. Not only is the constant growth rate assumption somewhat 5
unrealistic, but it is difficult to proxy. Analysts' growth forecasts are usually made 6
for not more than 2 to 5 years, or if they are made for more than a few years, they 7
are dominated by the near-term earnings and dividends picture. In short, the 8
perpetual growth term of the DCF model does not square well with the shorter-term 9
focus of institutional investors. 10
In summary, caution and judgment are required in interpreting the results of the DCF 11
model. There is a clear need to go beyond the DCF model, accord it the weight it 12
deserves, and to examine the results produced by several alternate methodologies, as 13
Mr. Patin should have done. 14
15
Q. IS THERE ANY EVIDENCE THAT MR. PATIN’S DCF RESULTS ARE 16
UNRELIABLE AND UNDERSTATED? 17
A. Yes, there is solid evidence that the DCF results are unreliable and understated. I 18
have examined Mr. Patin’s DCF results on Exhibit TCP-2 for his sample of 17 19
companies. The DCF results on which he relies for his final recommendation 20
(Models 4 to 8) are scattered all over, ranging from a low of 3.0% to a high of 21
19.8%. The gigantic variability in the results demonstrates the lack of reliability 22
of the DCF approach and the need to employ, and rely more heavily upon, a 23
REBUTTAL TESTIMONY OF DR. ROGER A. MORIN
NMPRC CASE NO. 07-00077-UT
17
variety of methodologies when estimating the cost of capital. Moreover, one third 1
of Mr. Patin’s estimates are below the cost of debt for these companies, that is, 2
imply a negative risk premium. The notion of a negative risk premium whereby the 3
cost of common equity is less than the cost of debt is not consistent with the basic 4
precepts of finance, economics, and business law. 5
6
2. ALLOWED RETURNS 7
Q. DO INVESTORS TAKE INTO ACCOUNT ALLOWED RETURNS IN 8
FORMULATING THEIR RETURN EXPECTATIONS? 9
A. Yes, they do. Investors do take into account returns granted by various regulators 10
in formulating their risk and return expectations, as evidenced by the widespread 11
availability of commercial publications disseminating such data, including Value 12
Line and Regulatory Research Associates. Allowed returns are important 13
determinants of investor growth perceptions and investor expected returns and are 14
routinely referenced in investment reports. 15
16
Q. DO ALLOWED RETURNS REFLECT INVESTOR EXPECTATIONS? 17
A. Yes, I believe they do. Regulators presumably base their allowed ROE decisions 18
relative to the level of interest rates on a wide variety of evidence concerning 19
investor expected returns and risks submitted by various parties. 20
21

REBUTTAL TESTIMONY OF DR. ROGER A. MORIN
NMPRC CASE NO. 07-00077-UT
18
Q. IS MR. PATIN'S RATE OF RETURN RECOMMENDATION 1
COMPATIBLE WITH CURRENTLY ALLOWED RETURNS IN THE 2
UTILITY INDUSTRY? 3
A. No, it is not. Allowed returns, while certainly not a precise indication of a 4
company's cost of equity capital, are nevertheless important determinants of 5
investor growth perceptions and investor expected returns. They also serve to 6
provide some perspective on the validity and reasonableness of Mr. Patin's 7
recommendation. 8
ROE awards in the industry exceed Mr. Patin's recommended ROE of 9.10% for 9
PNM. I have examined the returns currently allowed on common equity for the 17 10
electric utilities in Mr. Patin’s comparable group as reported in AUS Utility 11
Reports survey for September 2007. The currently authorized ROEs for Mr. 12
Patin’s sample of electric utilities, shown in Table 1 below, average 10.8% in 13
sharp contrast to his ROE recommendation of only 9.1%. 14
The average ROE currently allowed for the overall combination gas & electric 15
industry is 10.83% and 11.0% for the overall electric utility industry, well above 16
Mr. Patin’s anemic recommendation of only 9.1%. 17
Table 1 Authorized ROEs 18 Mr. Patin’s Comparable Group 19
20 Company Name Allowed ROE
1 Ameren 10.37 2 CH Energy Group 9.60 3 Cent. Vermont P.S. 10.75 4 Cleco Corporation 11.25 5 Con. Edison 10.53 6 DTE Energy Co. 11.00

REBUTTAL TESTIMONY OF DR. ROGER A. MORIN
NMPRC CASE NO. 07-00077-UT
19
7 Empire District 10.90 8 Energy East Corp. 10.69 9 Hawaiian Electric 10.82
10 MGE Energy, Inc. 11.00 11 Northeast Utilities 9.86 12 NSTAR 12.50 13 Pinnacle West 10.75 14 PPL Corporation 9.57 15 SCANA Corp. 10.71 16 Southern Co. 12.20 17 Vectren Corp. 10.53
AVERAGE 10.77
Source: AUS Utility Reports 11/2007 1
2
In short, Mr. Patin's ROE recommendation is well outside the mainstream of the 3
allowed rates of return that were current during the period in which he performed 4
his analysis, lies outside the zone of recently authorized ROEs for electric utilities 5
and for his own sample of companies, and would constitute the lowest ROE 6
allowance in the country for a major utility. The Commission is not bound by 7
decisions of other regulators regarding allowed ROE, but one cannot overlook the 8
glaring difference between Mr. Patin’s recommendation and the returns currently 9
allowed for the very same firms that Mr. Patin deems comparable in risk. 10
Unreasonable rate treatment for a New Mexico utility, if implemented, may have 11
serious public policy implications and repercussions for the State of New Mexico, 12
which are not mentioned in Mr. Patin's testimony. For example, the quality of 13
regulation and the reasonableness of rate of return awards clearly have 14
implications for regulatory climate, economic development and job creation in a 15
given jurisdiction. The consistency of regulation in a given state has similar 16

REBUTTAL TESTIMONY OF DR. ROGER A. MORIN
NMPRC CASE NO. 07-00077-UT
20
implications. It is my belief that Mr. Patin's recommended return has serious 1
negative implications on these grounds and is not consistent with the economic 2
well being of the State of New Mexico. 3
Mr. Patin, along with the other parties who have filed rate of return testimony in 4
this proceeding, is completely silent on the fact that PNM has a substantial 5
construction program in the future. The Company's ability to tap capital markets 6
and attract funds on reasonable terms occurs at a crucial point in time when PNM 7
has an ambitious capital expenditures program and will require external financing. 8
PNM’s large capital expenditure program over the next several years increases its 9
dependence on capital markets, which have become volatile and more 10
unpredictable. This is certainly no time to recommend what would be the lowest 11
ROE award for a major integrated electric utility in the country. 12
13
3. DCF MODEL UNDERSTATES THE COST OF EQUITY 14
Q. DO MR. PATIN’S DCF RESULTS UNDERSTATE THE COST OF 15
EQUITY? 16
A. Yes, they do. Application of the DCF model produces estimates of common 17
equity cost that are consistent with investors' expected return only when stock 18
price and book value are reasonably similar, that is, when the M/B ratio is close to 19
unity. As shown below, application of the standard DCF model to utility stocks 20
understates the investor's expected return when the M/B ratio of a given stock 21
exceeds unity. This item is particularly relevant in the current capital market 22
environment where utility stocks are trading at M/B ratios well above unity and 23

REBUTTAL TESTIMONY OF DR. ROGER A. MORIN
NMPRC CASE NO. 07-00077-UT
21
have been for two decades. The converse is also true, that is, the DCF model 1
overstates the investor's return when the stock's M/B ratio is less than unity. The 2
reason for the distortion is that the DCF market return is applied to a book value 3
rate base by the regulator, that is; a utility's earnings are limited to earnings on a 4
book value rate base. 5
6
Q. CAN YOU ILLUSTRATE THE EFFECT OF THE M/B RATIO ON THE 7
DCF MODEL BY MEANS OF A SIMPLE EXAMPLE? 8
A. Yes. The simple numerical illustration shown in Table 2 below demonstrates the 9
result of applying a market value cost rate to book value rate base under three 10
different M/B scenarios. The three columns correspond to three M/B situations: 11
the stock trades below, equal to, and above book value, respectively. The last 12
situation (third column of numbers) is noteworthy and representative of the 13
current capital market environment. The DCF cost rate of 10%, made up of a 5% 14
dividend yield and a 5% growth rate, is applied to the book value rate base of $50 15
to produce $5.00 of earnings. Of the $5.00 of earnings, the full $5.00 is required 16
for dividends to produce a dividend yield of 5% on a stock price of $100.00, and 17
no dollars are available for growth. The investor's return is therefore only 5% 18
versus his required return of 10%. A DCF cost rate of 10%, which implies $10.00 19
of earnings, translates to only $5.00 of earnings on book value, a 5% return. 20
The situation is reversed in the first column when the stock trades below book 21
value. The $5.00 of earnings is more than enough to satisfy the investor's 22
dividend requirements of $1.25, leaving $3.75 for growth, for a total return of 23

REBUTTAL TESTIMONY OF DR. ROGER A. MORIN
NMPRC CASE NO. 07-00077-UT
22
20%. This item occurs when the DCF cost rate is applied to a book value rate 1
base well above the market price. 2
Therefore, the DCF cost rate understates the investor's required return when stock 3
prices are well above book, as is the case presently, and Mr. Patin’s DCF results, 4
the only basis for his recommended ROE, understate PNM’s cost of common 5
equity capital. 6
TABLE 2 EFFECT OF M/B RATIO ON MARKET RETURN
Situation 1 2 3
1 Initial purchase price $25 $50 $100 2 Initial book value $50 $50 $50 3 Initial M/B 0.50 1.00 2.00 4 DCF Return 10% = 5% + 5% 10% 10% 10% 5 Dollar Return $5.00 $5.00 $5.00 6 Dollar Dividends 5% Yield $1.25 $2.50 $5.00 7 Dollar Growth 5% Growth $3.75 $2.50 $0.00 8 Market Return 20% 10% 5%
Q. DO REGULATORS RELY ON THE DCF MODEL? 7
A. A majority of regulatory commissions do not, as a matter of practice, rely solely 8
on the DCF model results in setting the allowed ROE. According to the survey 9
results posted in the Utility Regulatory Policy in the United States and Canada – 10
1994-1995 Compilation, which was conducted by the National Association of 11
Regulatory Utility Commissioners (“NARUC”), regulators utilize a variety of 12
methods and rely on all the evidence submitted. 13
14

REBUTTAL TESTIMONY OF DR. ROGER A. MORIN
NMPRC CASE NO. 07-00077-UT
23
Q. DO REGULATORS SHARE YOUR RESERVATIONS ON THE 1
RELIABILITY OF THE DCF MODEL? 2
A. Yes, I believe they do. While a majority of regulatory commissions do not, as a 3
matter of practice, rely solely on the DCF model results in setting the allowed 4
ROE, some regulatory commissions have explicitly recognized the need to avoid 5
exclusive reliance upon the DCF model and have acknowledged the need to adjust 6
the DCF result when M/B ratios exceed one5. 7
My sentiments on the DCF model were echoed in a decision by the Indiana Utility 8
Regulatory Commission (IURC). The IURC recognized its concerns with the 9
DCF model and that the model understates the cost of equity. In Cause No. 10
39871 Final Order, the IURC states on page 24: 11
“....the DCF model, heavily relied upon by the Public, understates the cost 12 of common equity. The Commission has recognized this fact before. In Indiana 13 Mich. Power Co. (IURC 8/24/90), Cause No. 38728, 116 PUR4th 1, 17-18, we 14 found: 15 The unadjusted DCF result is almost always well below what any 16 informed financial analyst would regard as defensible, and therefore requires an 17 upward adjustment based largely on the expert witness’s judgment.” 18
The Commission also expressed its concern with a witness relying solely on one 19
methodology: 20
“......the Commission has had concerns in our past orders with a witness 21 relying solely on one methodology in reaching an opinion on a proper return on 22 equity figure.” (page 25) 23 24
5 See the Indiana Utility Regulatory Commission decision in Indiana Mich. Power Co. (IURC 8/24/90), Cause No. 38728, 116 PUR4th 1, 17-18. See also the Iowa Utilities Board decision in U.S. West Communications, Inc. Docket No. RPR-93-9, 152 PUR4th 446, 459 (Iowa 1994). See also the Hawaii Public Utilities Commission decision in Hawaiian Electric Company, Inc., 134 PUR4th 418, 479 (1992). More recently, see the Pennsylvania Public Utility Commission decision in Pennsylvania-American Water Co., Docket R-00016339, Slip Opinion at http://www.puc.state.pa.us/PcDocs/304982.doc.
REBUTTAL TESTIMONY OF DR. ROGER A. MORIN
NMPRC CASE NO. 07-00077-UT
24
Even more convincing is the fact that M/B ratios have exceeded unity for over 1
two decades; this fact is clear evidence that regulators have in fact not relied on 2
the DCF model exclusively. Had regulators relied exclusively on the DCF model, 3
utility stocks would have traded at or near book value. Regulators have 4
“corrected” for this M/B problem by considering alternative methods for 5
estimating capital cost. 6
7
Q. IS THE USAGE OF THE DCF MODEL PREVALENT IN CORPORATE 8
PRACTICES? 9
A. No, not really. The CAPM constitutes a fundamental paradign of modern finance 10
and continues to be widely used by analysts, investors, and corporations. Bruner, 11
Eades, Harris, and Higgins (1998) in a comprehensive survey6 of current practices 12
for estimating the cost of capital found that 81% of companies used the CAPM to 13
estimate the cost of equity, 4% used a modified CAPM, and 15% were uncertain. In 14
another comprehensive survey conducted by Graham and Harvey (2001), the 15
managers surveyed reported using more than one methodology to estimate the cost 16
of equity, and 73% used the CAPM.7 Since its introduction by Professor William 17
F. Sharpe in 1964, the CAPM has gained immense popularity as the practitioner’s 18
method of choice when estimating cost of capital under conditions of risk.8 The 19
intuitive simplicity of its basic concept (that investors must get compensated for 20
6 Bruner, R. F., Eades, K. M., Harris, R. S., and Higgins, R. C., “Best Practices in Estimating the Cost of Capital: Survey and Synthesis,” Financial Practice and Education, Vol. 8, Number 1, Spring/Summer 1998, page 18. 7 Graham, J. R. and Harvey, C. R., “The Theory and Practice of Corporate Finance: Evidence from the Field,” Journal of Financial Economics, Vol. 61, 2001, pp. 187-243. 8 See practitioner surveys by Graham & Harvey (2001) and Bruner, et. al. (1988)
REBUTTAL TESTIMONY OF DR. ROGER A. MORIN
NMPRC CASE NO. 07-00077-UT
25
the risk they assume), and the relatively easy application of the CAPM are the 1
main reasons behind its popularity. 2
3
Q. DO THE ASSUMPTIONS UNDERLYING THE DCF MODEL REQUIRE 4
THAT THE MODEL BE TREATED WITH CAUTION? 5
A. Yes, particularly in today’s rapidly changing electric utility industry. As I 6
discussed earlier, even ignoring the fundamental thesis that several methods 7
and/or variants of such methods should be used in measuring equity costs, the 8
DCF methodology, as those familiar with the industry and the accepted norms for 9
estimating the cost of equity are aware, is problematic for use in estimating cost 10
of equity at this time. 11
12
Q. WHAT IS YOUR RECOMMENDATION GIVEN SUCH MARKET 13
CONDITIONS? 14
A. In short, caution and judgment are required in interpreting the results of the 15
standard DCF model because of (1) the effect of changes in risk and growth on 16
electric utilities, (2) the questionable applicability of the DCF model to electric 17
utilities stocks in the current capital market environment, and (3) the practical 18
difficulties associated with the growth component of the standard DCF model. 19
Hence, there is a clear need to go beyond the standard DCF results and take into 20
account the results produced by alternate methodologies in arriving at a common 21
equity recommendation. 22
23

REBUTTAL TESTIMONY OF DR. ROGER A. MORIN
NMPRC CASE NO. 07-00077-UT
26
4. UNDERSTATED DIVIDEND YIELD 1
Q. DO YOU HAVE ANY COMMENT ON MR. PATIN'S DIVIDEND YIELD 2
COMPONENT IN THE DCF ANALYSIS? 3
A. Yes. I disagree with Mr. Patin’s dividend yield calculation in his DCF analysis 4
because he failed to multiply the spot dividend yield by one plus the expected 5
growth rate (1 + g) as clearly required by the annual DCF model. This flaw 6
understates the return expected by the investor by approximately 30 basis points. 7
For example, for a spot dividend yield of 5.0% and a growth rate of 6.0% the 8
correct expected dividend yield is 5.0% times (1 + 0.06), which equals 5.30% and 9
not 5.00%. The correct dividend yield to employ is the expected dividend yield, 10
here 5% times (1 + .06), which equals 5.30%. 11
One fundamental assumption of the annual DCF model is that dividends are 12
received by investors annually at the end of each year and that the first dividend is 13
to be received by the investor one year from now. Since the appropriate dividend 14
to use in the annual DCF model is the prospective dividend one year from now, 15
rather than the current dividend yield, Mr. Patin’s approach understates the proper 16
dividend yield. This creates a downward bias in his dividend yield component, 17
and underestimates the return on equity by approximately 30 basis points. 18
Incidentally, I know of very few rate of return “experts,” if any, that utilize the 19
raw spot dividend yield in implementing the DCF model. 20
21
22
REBUTTAL TESTIMONY OF DR. ROGER A. MORIN
NMPRC CASE NO. 07-00077-UT
27
5. DCF FUNCTIONAL FORM 1
Q. PLEASE COMMENT ON THE USE OF THE ANNUAL DCF MODEL. 2
A. The DCF model used by Mr. Patin assumes that dividend payments are made 3
annually at the end of the year and are increased once a year, while most utilities 4
in fact pay dividends on a quarterly basis. Since the stock price fully reflects the 5
quarterly payment of dividends, it is essential that the DCF model used to 6
estimate equity returns also reflect the actual timing of quarterly dividends. In the 7
same way that bond yield calculations are routinely adjusted to reflect semiannual 8
interest payments, it stands to reason that stock yields should be similarly adjusted 9
for quarterly compounding. It should be pointed out that the quarterly DCF 10
model uses the exact same assumptions as the annual DCF model, but refines the 11
latter so as to capture the exact timing of cash flows received by the investor. 12
By analogy, a bank rate on deposits which does not take into consideration the 13
timing of the interest payments understates the true yield if you receive the 14
interest payments more than once a year. The actual yield will exceed the stated 15
nominal rate. To illustrate, if an investor has a choice between investing $1,000 16
in a bank account which promises a return of 10% compounded annually and 17
another bank account which promises a return of 10% but compounded quarterly, 18
he will clearly select the latter. Due to the quarterly compounding of interest, the 19
investor earns an effective return of 10.38% on the latter bank account versus 20
10% on the former. The same is true for the return on common stocks. 21
22
Q. WHAT IS THE APPROPRIATE FORM OF THE DCF MODEL? 23

REBUTTAL TESTIMONY OF DR. ROGER A. MORIN
NMPRC CASE NO. 07-00077-UT
28
A. The plain vanilla annual DCF model ignores the time value of quarterly dividend 1
payments and assumes dividends are paid once a year at the end of the year. 2
Since investors are aware of the quarterly timing of dividend payments, this 3
knowledge is reflected in stock prices. As I show in Chapter 11 of my book, The 4
New Regulatory Finance, the use of the annual version of the DCF model 5
understates the cost of equity by approximately 20 basis points, depending on the 6
magnitude of the dividend yield component. 7
In short, by failing to recognize the quarterly nature of dividend payments in his 8
DCF computation, Mr. Patin understates the required return on equity capital by 9
about 20 basis points. 10
11
6. DCF DIVIDEND YIELD AND FLOTATION COSTS 12
Q. SHOULD THE RETURN ON EQUITY BE ADJUSTED TO INCLUDE AN 13
ALLOWANCE FOR FLOTATION COSTS? 14
A. Yes, it should. Flotation costs are very similar to the closing costs on a home 15
mortgage. In the case of issues of new equity, flotation costs represent the 16
discounts that must be provided to place the new securities. Flotation costs have a 17
direct and an indirect component. The direct component represents monetary 18
compensation to the security underwriter for marketing/consulting services, for 19
the risks involved in distributing the issue, and for any operating expenses 20
associated with the issue (printing, legal, prospectus, etc.). The indirect 21
component represents the downward pressure on the stock price as a result of the 22

REBUTTAL TESTIMONY OF DR. ROGER A. MORIN
NMPRC CASE NO. 07-00077-UT
29
increased supply of stock from the new issue. The latter component is frequently 1
referred to as "market pressure." 2
Flotation costs for common stock are analogous to the flotation costs associated 3
with past bond issues which, as a matter of routine regulatory policy, continue to 4
be amortized over the life of the bond, even though no new bond issues are 5
contemplated. In the case of common stock, which has no finite life, flotation 6
costs are not amortized. Therefore, the recovery of flotation cost requires an 7
upward adjustment to the allowed return on equity. 8
9
Q. DO YOU HAVE ANY COMMENT ON MR. PATIN'S DIVIDEND YIELD 10
COMPONENT IN HIS DCF APPROACH? 11
A. Yes. I disagree with Mr. Patin's dividend yield calculation in his DCF analyses 12
because it totally ignores flotation costs. Flotation costs are fees legitimately 13
incurred as part of the securities issuance process. 14
15
Q. WHAT FLOTATION COST TREATMENT DOES MR. PATIN 16
RECOMMEND IN THIS CASE? 17
A. Mr. Patin is totally silent on the subject of a flotation cost allowance and I can 18
only conclude that he believes that such an adjustment is unwarranted. As 19
demonstrated in PNM Exhibit RAM-2R, the flotation adjustment is made to the 20
DCF analysis by dividing the expected dividend yield component of the DCF by 21
(1 - f), where f is the flotation cost allowance factor. This type of flotation cost 22
allowance to the cost of common equity capital is routinely discussed and applied 23
REBUTTAL TESTIMONY OF DR. ROGER A. MORIN
NMPRC CASE NO. 07-00077-UT
30
in most corporate finance textbooks. Total flotation costs amount to 5%, which in 1
turn amounts to approximately 30 basis points for PNM. Mr. Patin has thus 2
understated PNM's cost of equity by 30 basis points from this omission alone. 3
4
7. STALE DIVIDEND YIELD 5
Q. PLEASE DESCRIBE MR. PATIN'S DCF METHODOLOGIES. 6
A. As summarized on page 19 and Exhibit TCP-2 (Column ROE-3) of his testimony, 7
Mr. Patin applies five variations of the DCF model to his comparable group of 17 8
electric utilities. The DCF variations are labeled Models 4, 5, 6, 7, and 8. 9
Model 4 is computed by adding the actual 2006 dividend yield (Y1) to actual 10
dividend growth over the 5-year period 2002-2006 (G1). Model 5 is computed by 11
adding the projected dividend yield (Y2) to actual dividend growth over the 5-year 12
period 2002-2006 (G1). Models 6 and 7 add projected dividend growth (G2) to 13
the actual dividend yield (Y1) and to the projected dividend yield (Y2), 14
respectively. Finally, Model 8 is simply the investor expected return forecast by 15
Value Line. 16
17
Q. WHAT IS WRONG WITH MR. PATIN’S MODELS 4 AND 6? 18
A. There are three serious problems with Models 4 and 6. First, the dividend yields 19
are almost one year old, and the results are therefore stale. Mr. Patin should have 20
relied on current dividend yields. Second, both models rely on dividend growth. 21
Third, analysts are expecting far greater growth rates than Mr. Patin used. 22
23

REBUTTAL TESTIMONY OF DR. ROGER A. MORIN
NMPRC CASE NO. 07-00077-UT
31
Q. WHAT’S WRONG WITH USING A STALE DIVIDEND YIELD WHEN 1
IMPLEMENTING THE DCF APPROACH? 2
A. Mr. Patin relies on a 2006 dividend yield component in Models 4 and 6. I 3
disagree with the use of a stale dividend yield reaching as far back as last year. 4
The appropriate dividend yield to employ is the prospective dividend yield at the 5
time of estimating the cost of equity, rather than some historical dividend yield 6
reaching back almost one year. The reason is that the analyst is attempting to 7
determine a utility's cost of equity in the future, and keeping in mind that dividend 8
yield is obtained by dividing the dollar dividend by the stock price, and since 9
current stock prices provide a better indication of expected future prices than any 10
other price according to the basic tenets of the Efficient Market Hypothesis, the 11
most relevant stock price is the most recent one. The Efficient Market 12
Hypothesis, which is widely accepted, states that capital markets, at least as a 13
practical matter, incorporate into security prices relevant publicly available 14
information, such that current security prices reflect the most recent information 15
and thus are the best representation of investor expectations. Use of any other 16
price, hence dividend yield, violates market efficiency principles. 17
There is yet another justification for using current stock prices and current 18
dividend yields. In measuring the cost of equity as the sum of dividend yield and 19
growth, the period used in measuring the dividend yield component must be 20
consistent with the estimate of growth with which it is paired. Since the current 21
stock price is caused by the growth foreseen by investors at the present time and 22
not at any other time, it is clear that the use of spot prices is preferable. Mr. Patin 23

REBUTTAL TESTIMONY OF DR. ROGER A. MORIN
NMPRC CASE NO. 07-00077-UT
32
has essentially mismatched a stale average stock price reaching as far back as last 1
year with a current estimate of expected growth. This not only violates market 2
efficiency principles, but also constitutes a classic apples & oranges mismatch in 3
the application of the DCF model, and the result is a lemon. This is a particularly 4
dangerous procedure in the fast-changing circumstances of the utility industry. A 5
stock price (dividend yield) dating back almost one year reflects stale information 6
and is not representative of current market conditions. 7
An analogy with interest rates will clarify this point. If, for example, interest rates 8
have climbed from 5% to 6% over the past twelve months, it would be incorrect 9
to state that the current interest rate is in the range of 5% to 6% just because this is 10
the interest rate range for the past twelve months. Analogously, it is incorrect to 11
state that the cost of equity, which has also risen along with interest rates, is in 12
some given twelve-month range. Just as the current interest rate is 6%, the cost of 13
equity estimate is that which is obtained from the standard DCF using current spot 14
prices and current dividend yields. 15
16
8. DCF HISTORICAL GROWTH RATES 17
Q. DOES MR. PATIN RELY ON DIVIDEND GROWTH ? 18
A. Yes. The second problem with Mr. Patin’s DCF Models 4 and 6 is that they both 19
rely on dividend growth. Model 4 relies on historical dividend growth over the 20
2002-2006 periods and Model 6 relies on projected dividend growth. The use of 21
dividend growth is not appropriate at this time. 22
23
REBUTTAL TESTIMONY OF DR. ROGER A. MORIN
NMPRC CASE NO. 07-00077-UT
33
Q. ARE THE HISTORICAL GROWTH RATES OF ELECTRIC UTILITIES 1
RELIABLE? 2
A. No, they are not. Mr. Patin uses historical growth rates in dividends as proxies for 3
expected growth in DCF Models 4 and 5. If historical growth rates are to be 4
representative of long-term future growth rates, they must not be biased by non-5
recurring events. This was certainly the case for electric utilities, where growing 6
competition, diversification programs, acquisitions, restructurings and write-off 7
activities have exerted a dilutive effect on historical earnings and dividends. In 8
such cases, it is obvious that analysts' growth forecasts provide a more realistic 9
and representative growth proxy for what investors expect is likely to happen in 10
the future than historical growth. In any event, historical growth rates are largely 11
redundant given that analysts, including Value Line forecasts on which Mr. Patin 12
relies, formulate their growth expectations based in part on historical patterns. 13
Mr. Patin's historical growth rates should be given considerably less, if any, 14
weight than the analysts' growth forecasts. 15
16
Q. WHAT IS WRONG WITH DCF MODELS 5 AND 7? 17
A. There are two serious problems with Models 5 and 7. First, as was the case with 18
Models 4 and 6, they both rely on dividend growth. I have already commented on 19
the impropriety of relying on historical growth rates. Second, analysts are 20
expecting far greater growth rates than Mr. Patin used. 21
22
23
REBUTTAL TESTIMONY OF DR. ROGER A. MORIN
NMPRC CASE NO. 07-00077-UT
34
9. DCF PROJECTED DIVIDEND GROWTH 1
Q. SHOULD MR. PATIN HAVE CONSIDERED PROJECTED DIVIDEND 2
GROWTH IN APPLYING HIS DCF MODEL 7? 3
A. No, not at this time. The reason is that it is widely expected that utilities will 4
continue to lower their dividend payout ratio over the next several years. In other 5
words, earnings are expected to grow faster than dividends in the future. 6
Whenever the dividend payout ratio is expected to change, the intermediate 7
growth rate in dividends cannot equal the long-term growth rate, because 8
dividend/earnings growth must adjust to the changing payout ratio. The 9
assumptions of constant perpetual growth and constant payout ratio are clearly not 10
met. Thus, the implementation of the standard DCF model is of questionable 11
relevance in this circumstance. 12
Dividend growth rates are unlikely to provide a meaningful guide to investors’ 13
growth expectations for utilities in general. This result is because utilities’ 14
dividend policies have become increasing conservative as business risks in the 15
industry have intensified steadily. Dividend growth has remained largely stagnant 16
in past years as utilities are increasingly conserving financial resources in order to 17
hedge against rising business risks. As a result, investors’ attention has shifted 18
from dividends to earnings. Therefore, earnings growth provides a more 19
meaningful guide to investors’ long-term growth expectations. Indeed, it is 20
growth in earnings that will support future dividends and share prices. 21
22
23

REBUTTAL TESTIMONY OF DR. ROGER A. MORIN
NMPRC CASE NO. 07-00077-UT
35
10. DCF ANALYSTS’ GROWTH FORECASTS 1
Q. WHAT GROWTH RATES SHOULD HAVE MR. PATIN CONSIDERED 2
IN HIS DCF ANALYSIS? 3
A. Mr. Patin should have relied on analysts’ consensus growth forecast of earnings 4
rather than on historical growth rates and on Value Line’s dividend growth 5
projections. 6
7
Q. DO YOU SEE ANY DANGERS IN RELYING ON VALUE LINE AS AN 8
EXCLUSIVE SOURCE OF FORECASTS IN APPLYING THE DCF 9
MODEL? 10
A. Yes, I do. In DCF Models 6 and 7, Mr. Patin relies on Value Line’s dividend 11
growth forecast as a surrogate for growth in the DCF model. Mr. Patin's 12
exclusive reliance on Value Line growth forecasts runs the risk that such forecasts 13
are not representative of investors' consensus forecast. One would expect that 14
averages of analysts' growth forecasts such as those contained in First Call, 15
Thomson, Yahoo Finance, MSN Investor, and/or Zacks, rather than one particular 16
firm's forecast, are more reliable estimates of the investors' consensus 17
expectations likely to be impounded in stock prices. 18
19
Q. IS THERE ANY EMPIRICAL EVIDENCE DOCUMENTING THE 20
IMPORTANCE OF EARNINGS IN ASSESSING INVESTORS’ 21
EXPECTATIONS IN THE INVESTMENT COMMUNITY? 22

REBUTTAL TESTIMONY OF DR. ROGER A. MORIN
NMPRC CASE NO. 07-00077-UT
36
A. Yes, there is. Mr. Patin completely omits earnings growth rates in his DCF 1
analyses despite the abundance of evidence attesting to the importance of earnings 2
in assessing investors’ expectations. First, the sheer volume of earnings forecasts 3
available from the investment community relative to the scarcity of dividend 4
forecasts attests to their importance. To illustrate, Value Line, Zacks Investment, 5
First Call Thompson, and Multex provide comprehensive compilations of 6
investors’ earnings forecasts, to name some. The fact that these investment 7
information providers focus on growth in earnings rather than growth in dividends 8
indicates that the investment community regards earnings growth as a superior 9
indicator of future long-term growth. Second, the analytical techniques actually 10
used by analysts reveal the dominance of earnings and imply that earnings are 11
considered far more important than dividends. Third, Value Line’s principal 12
investment rating assigned to individual stocks, Timeliness Rank, is based 13
primarily on earnings, which account for 65% of the ranking. 14
15
Q. PLEASE DISCUSS THE USE OF ANALYSTS’ FORECASTS IN 16
APPLYING THE DCF MODEL TO UTILITIES. 17
A. The best proxy for the growth component of the DCF model is analysts’ long-18
term earnings growth forecasts. Mr. Patin should have relied on such forecasts in 19
deriving the DCF growth component. These forecasts are made by large 20
reputable organizations, and the data are readily available to investors and are 21
representative of the consensus view of investors. 22
23

REBUTTAL TESTIMONY OF DR. ROGER A. MORIN
NMPRC CASE NO. 07-00077-UT
37
Q. WHAT DOES THE PUBLISHED ACADEMIC LITERATURE SAY ON 1
THE SUBJECT OF GROWTH RATES IN THE DCF MODEL? 2
A. Published studies in the academic literature demonstrate that growth forecasts 3
made by security analysts are reasonable indicators of investor expectations, and 4
that investors rely on analysts' forecasts. This considerable literature is 5
summarized in Chapter 9 of Dr. Morin’s most recent book, The New Regulatory 6
Finance. Cragg and Malkiel ["Expectations and the Structure of Share Prices", 7
Chicago: University of Chicago Press, 1982] present detailed empirical evidence 8
that the average analysts' expectation is more similar to expectations being 9
reflected in the marketplace than are historical growth rates, and represents the 10
best possible source of DCF growth rates. Cragg and Malkiel show that historical 11
growth rates do not contain any information that is not already impounded in 12
analysts' growth forecasts. A study by Professors Vander Weide and Carleton, 13
"Investor Growth Expectations: Analysts vs. History" (The Journal of Portfolio 14
Management, Spring 1988), also confirms the superiority of analysts' forecasts 15
over historical growth extrapolations. Another study by Timme & Eiseman, "On 16
the Use of Consensus Forecasts of Growth in the Constant Growth Model: The 17
Case of Electric Utilities," Financial Management, Winter 1989, produces similar 18
results. 19
20
Q. ARE INVESTORS EXPECTING GROWTH RATES EQUAL TO MR. 21
PATIN'S RANGE? 22
REBUTTAL TESTIMONY OF DR. ROGER A. MORIN
NMPRC CASE NO. 07-00077-UT
38
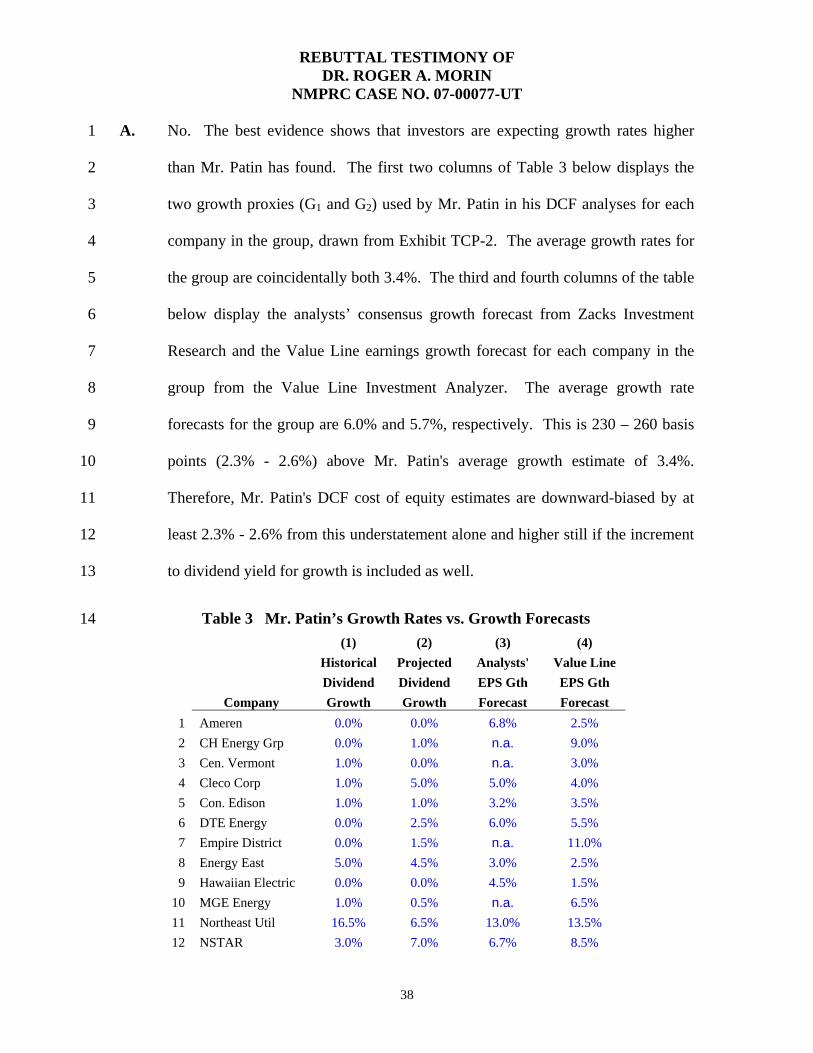
A. No. The best evidence shows that investors are expecting growth rates higher 1
than Mr. Patin has found. The first two columns of Table 3 below displays the 2
two growth proxies (G1 and G2) used by Mr. Patin in his DCF analyses for each 3
company in the group, drawn from Exhibit TCP-2. The average growth rates for 4
the group are coincidentally both 3.4%. The third and fourth columns of the table 5
below display the analysts’ consensus growth forecast from Zacks Investment 6
Research and the Value Line earnings growth forecast for each company in the 7
group from the Value Line Investment Analyzer. The average growth rate 8
forecasts for the group are 6.0% and 5.7%, respectively. This is 230 – 260 basis 9
points (2.3% - 2.6%) above Mr. Patin's average growth estimate of 3.4%. 10
Therefore, Mr. Patin's DCF cost of equity estimates are downward-biased by at 11
least 2.3% - 2.6% from this understatement alone and higher still if the increment 12
to dividend yield for growth is included as well. 13
Table 3 Mr. Patin’s Growth Rates vs. Growth Forecasts 14 (1) (2) (3) (4) Historical Projected Analysts' Value Line Dividend Dividend EPS Gth EPS Gth Company Growth Growth Forecast Forecast 1 Ameren 0.0% 0.0% 6.8% 2.5% 2 CH Energy Grp 0.0% 1.0% n.a. 9.0% 3 Cen. Vermont 1.0% 0.0% n.a. 3.0% 4 Cleco Corp 1.0% 5.0% 5.0% 4.0% 5 Con. Edison 1.0% 1.0% 3.2% 3.5% 6 DTE Energy 0.0% 2.5% 6.0% 5.5% 7 Empire District 0.0% 1.5% n.a. 11.0% 8 Energy East 5.0% 4.5% 3.0% 2.5% 9 Hawaiian Electric 0.0% 0.0% 4.5% 1.5%
10 MGE Energy 1.0% 0.5% n.a. 6.5% 11 Northeast Util 16.5% 6.5% 13.0% 13.5% 12 NSTAR 3.0% 7.0% 6.7% 8.5%
REBUTTAL TESTIMONY OF DR. ROGER A. MORIN
NMPRC CASE NO. 07-00077-UT
39
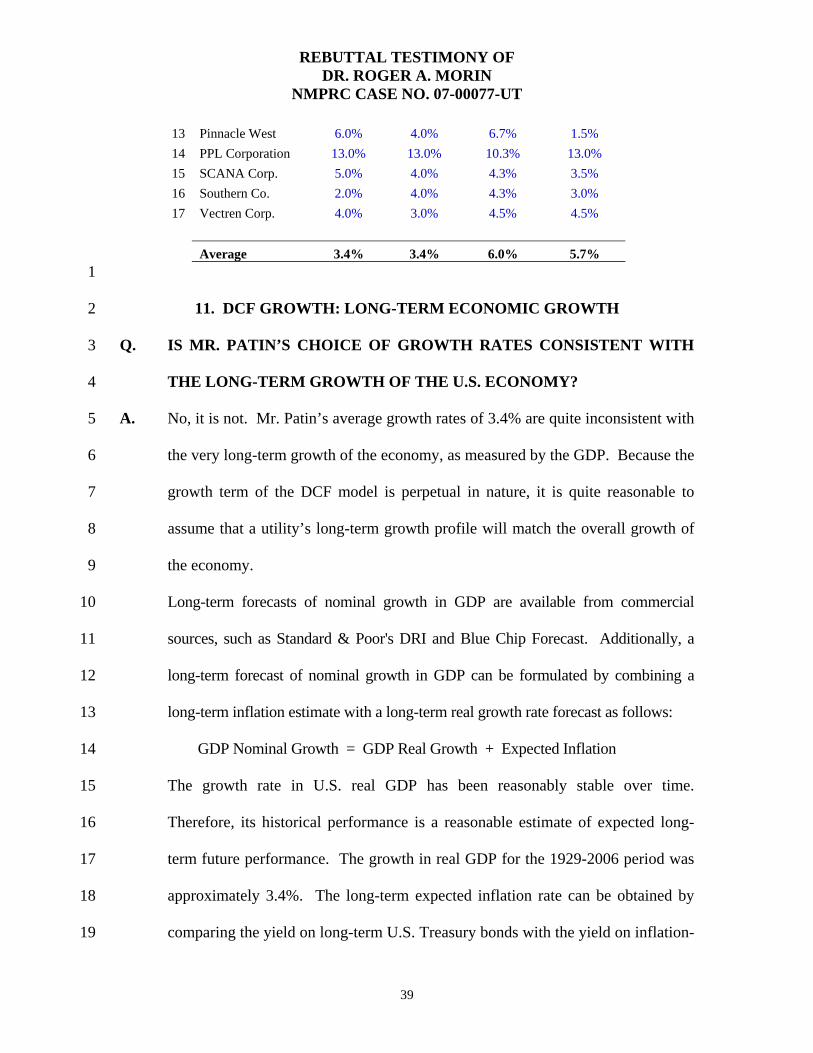
13 Pinnacle West 6.0% 4.0% 6.7% 1.5% 14 PPL Corporation 13.0% 13.0% 10.3% 13.0% 15 SCANA Corp. 5.0% 4.0% 4.3% 3.5% 16 Southern Co. 2.0% 4.0% 4.3% 3.0% 17 Vectren Corp. 4.0% 3.0% 4.5% 4.5%
Average 3.4% 3.4% 6.0% 5.7%
1
11. DCF GROWTH: LONG-TERM ECONOMIC GROWTH 2
Q. IS MR. PATIN’S CHOICE OF GROWTH RATES CONSISTENT WITH 3
THE LONG-TERM GROWTH OF THE U.S. ECONOMY? 4
A. No, it is not. Mr. Patin’s average growth rates of 3.4% are quite inconsistent with 5
the very long-term growth of the economy, as measured by the GDP. Because the 6
growth term of the DCF model is perpetual in nature, it is quite reasonable to 7
assume that a utility’s long-term growth profile will match the overall growth of 8
the economy. 9
Long-term forecasts of nominal growth in GDP are available from commercial 10
sources, such as Standard & Poor's DRI and Blue Chip Forecast. Additionally, a 11
long-term forecast of nominal growth in GDP can be formulated by combining a 12
long-term inflation estimate with a long-term real growth rate forecast as follows: 13
GDP Nominal Growth = GDP Real Growth + Expected Inflation 14
The growth rate in U.S. real GDP has been reasonably stable over time. 15
Therefore, its historical performance is a reasonable estimate of expected long-16
term future performance. The growth in real GDP for the 1929-2006 period was 17
approximately 3.4%. The long-term expected inflation rate can be obtained by 18
comparing the yield on long-term U.S. Treasury bonds with the yield on inflation-19

REBUTTAL TESTIMONY OF DR. ROGER A. MORIN
NMPRC CASE NO. 07-00077-UT
40
adjusted bonds of the same maturity. The current yield on 20-year Treasury 1
bonds is 4.9%, and the yield on inflation-adjusted bonds ("Treasury Inflation 2
Protected Securities," or "TIPS") for the same maturity is 2.4%. The difference 3
between the two securities yields an approximate inflation rate of 2.5% (4.9% – 4
2.4% = 2.5%). 5
Using the above formula, the long-term expected GDP nominal growth is 6
approximately 5.9%, that is, 3.4% + 2.5% = 5.9%. In sum, Mr. Patin's growth 7
forecast of 3.4% for his comparable group of electric utilities understates the 8
long-term expected GDP nominal growth by approximately 250 basis points 9
(2.5%). 10
Incidentally, Ms. Crane dismisses GDP growth on the grounds that overall 11
economic activity has no direct impact on a utility’s dividend policy. This is 12
incorrect because, given that the growth term of the DCF model is perpetual in 13
nature, a utility’s long-term growth profile will match the overall growth of the 14
economy. 15
16
Q. HOW WOULD MR. PATIN'S DCF RESULT CHANGE IF A MORE 17
REASONABLE GDP GROWTH FORECAST WERE USED IN HIS DCF 18
ANALYSIS? 19
A. Using the projected long-term growth of GDP of 5.9% instead of Mr. Patin's 3.4% 20
would increase the DCF estimate of the cost of common equity from 9.1 to 11.6% 21
from this flaw alone. 22
23

REBUTTAL TESTIMONY OF DR. ROGER A. MORIN
NMPRC CASE NO. 07-00077-UT
41
12. CIRCULAR LOGIC 1
Q. DOES MR. PATIN'S LAST DCF MODEL CONTAIN A LOGICAL FLAW? 2
A. Yes, it does. The last model used by Mr. Patin to support his ROE 3
recommendation is DCF Model 8, which is simply Value Line’s ROE average 4
forecast of 10.26% for his group of electric utilities. The problem with this model 5
is that it contains a puzzling logical flaw. The average expected ROE of 10.26% 6
reported on Mr. Patin’s Exhibit TCP-2 exceeds Mr. Patin’s recommended 9.1%. 7
Mr. Patin is assuming in effect that his sample companies will earn a ROE 8
exceeding what he has determined to be their cost of equity forever. That is, he is 9
assuming that these companies will earn a ROE higher than that granted by 10
their regulators and reflected in their rates. While this scenario may be 11
imaginable for an unregulated company with substantial market power, it is 12
implausible for a regulated company whose rates are set by its regulator at a 13
level designated to permit the company to earn a return equal to its cost of 14
capital. I am perplexed as to why Mr. Patin assumes that his group of 15
comparable electric utilities is expected to earn 10.26% forever, while at the same 16
time he recommends an ROE of only 9.1%. The only way that these electric 17
utilities can earn a ROE of 10.26% is if rates are set so that they will in fact earn 18
10.26%. The only logical conclusion to be drawn from the data is that the group's 19
cost of equity is 10.26%, since these are the returns implied in Mr. Patin's DCF 20
Model 8 analysis. So, how can the cost of equity be any different from 10.26%? 21
In short, Mr. Patin’s implementation of DCF Model 8 is circular, for he is using 22
an assumed ROE that exceeds his own recommended ROE. He is in effect 23

REBUTTAL TESTIMONY OF DR. ROGER A. MORIN
NMPRC CASE NO. 07-00077-UT
42
assuming that the electric utility companies in his comparable group will earn at a 1
return rate exceeding his recommended ROE forever, while at the same time 2
recommending that a different ROE be authorized by the Commission. 3
4
13. NEGATIVE RISK PREMIUM 5
Q. DR. MORIN, DO MR. PATIN’S COST OF EQUITY ESTIMATES THAT 6
ARE LESS THAN THE COST OF DEBT MAKE ECONOMIC SENSE? 7
A. No, they do not. Several of Mr. Patin’s DCF results displayed on Exhibit TCP-2 are 8
in fact less than the utilities’ cost of debt, approximately 6% at this time. In fact, one 9
third of Mr. Patin’s DCF estimates shown on Exhibit TCP-2 for his sample of 17 10
companies are less than the cost of debt. The idea that a company’s cost of common 11
equity is less than the cost of its debt is at serious odds with common sense and with 12
the basic tenets of finance, economics, and business law. By simple legal fact, 13
common shareholders are residual claimants to a company's earnings and assets, 14
while bondholders are priority claimants on corporate assets and earnings. The 15
interest payments to bondholders take precedence and must be serviced first, before 16
any distribution of dividends to common shareholders can be contemplated. It 17
follows that the basic business risks of a company will fall much more heavily upon 18
the earnings available to shareholders than upon the earnings available to service the 19
priority claims of bondholders, and that therefore stocks are riskier than bonds. 20
Financial theory has always asserted that the greater a security's risk, the greater 21
the return required from that security, with risk defined as the uncertainty of the 22
return. The return on a bond, represented by fixed interest payments and 23

REBUTTAL TESTIMONY OF DR. ROGER A. MORIN
NMPRC CASE NO. 07-00077-UT
43
repayment of principal, is contractual in nature. But there is no such guarantee in 1
the case of common stocks. Dividend payments are not guaranteed, and the 2
shareholders' claim on assets and earnings is junior to that of the bondholders. 3
Bondholders expect that they will earn the prevailing coupon rate or 4
yield-to-maturity when they purchase a bond, and shareholders expect a return 5
made up of dividends and capital gains. 6
The first column of Table 4 below replicates Mr. Patin’s average DCF results for 7
the 17 comparable utilities, and the second column reports his average DCF 8
results excluding the DCF estimates that are less than the cost of debt. The 9
average result increases from 8.4% to 10.2%, an increase of 1.8% from this 10
change alone, leaving aside all the other errors and inconsistencies noted above. 11
Table 4 Amended DCF Results 12 Mr. Patin’s Corrected DCF Results DCF Results Model 4 7.9 11.1 Model 5 8.0 11.2 Model 6 7.9 9.2 Model 7 7.9 9.2 Model 8 10.3 10.3 MEAN 8.4 10.2
13
14. MISCELLANEOUS COMMENTS 14
Q. DR. MORIN, HAVE REGULATORS AUTHORIZED EXCESSIVELY 15
HIGH RATES OF RETURN TO UTILITIES IN YOUR OPINION? 16
A. No, they have not. On page 9 of his testimony (see also page 3) Mr. Patin makes 17
the shocking statement that regulatory agencies have made a policy decision to 18
authorize excessively high returns to utilities. No foundation, study, publication, 19
REBUTTAL TESTIMONY OF DR. ROGER A. MORIN
NMPRC CASE NO. 07-00077-UT
44
or reference is offered to support this outrageous claim. Nor do I believe that 1
regulators have been somehow systematically misguided in rendering hundreds of 2
ROE decisions and have authorized inappropriate returns. Regulators base their 3
allowed ROE decisions relative to the level of interest rates on a wide variety of 4
evidence concerning investor expected returns and risks submitted by various 5
intervening parties, including consumer groups, industrial intervenors, utility 6
companies, and others. If allowed returns have escalated relative to interest rates, 7
it is because utility risk profiles have escalated steadily over the last decade as is 8
well known. 9
I was also astonished by Mr. Patin’s second unfounded claim on pages 4 and 9 10
that regulators have turned conservative utility income stocks into speculative 11
growth stocks financed by ratepayers. I find such unfounded statements offensive 12
to regulators, inflammatory, and patently false. 13
14
Q. DR. MORIN, WHAT DOES THE DCF MODEL ASSUME IN REGARD TO 15
STOCK PRICE APPRECIATION? 16
A. On page 7 lines 2-3 of his testimony, Mr. Patin argues that the DCF model 17
“makes no reference to price appreciation (capital growth). In fact, the DCF 18
model reflects only the cash flows to the investor from dividends.” On page 15, he 19
states that “the DCF model is not intended to reflect capital appreciation.” 20
These statements fly in the face of basic DCF theory and are totally incorrect. 21
From basic DCF principles, the investor's return can be broken down into its two 22
REBUTTAL TESTIMONY OF DR. ROGER A. MORIN
NMPRC CASE NO. 07-00077-UT
45
component parts, dividend yield and capital appreciation. The standard DCF 1
formulation widely used in regulatory proceedings is: 2
0
1
PDK = + g 3
This formula states that the equity investor's expected return, K, can be envisaged 4
as the sum of an expected dividend yield, (D1/P0), plus the expected growth rate 5
of future dividends, g. Clearly, the DCF model makes reference to growth (g) and 6
reflects capital appreciation. Moreover, one of the hallmark assumptions behind 7
the DCF model is that earnings, dividends, book value, and stock price all grow at 8
a constant rate forever, hence the appellation “Constant Growth DCF.” I refer 9
Mr. Patin to just about any college-level textbook in finance/investments where 10
the DCF model and its underlying assumptions are described and developed. 11
12
Q. WHAT DO YOU MAKE OF MR. PATIN’S DCF MODELS 9 AND 10? 13
A. They are nonsensical. On page 19 of his testimony, Mr. Patin multiplies the 14
results from DCF Models 6 and 7 by the forecast dividend payout ratio in order to 15
adjust the DCF results to reflect dividend payout ratios. This makes no economic 16
sense. The DCF model already embodies a company’s dividend payout ratio. As 17
I discussed above, the smaller the fraction of earnings paid out as dividends, the 18
higher the growth rate as more funds are ploughed back in the asset base, and 19
conversely as well. In other words, smaller (larger) retained earnings result in a 20
higher (lower) dividend yield component. There is no need to multiply the DCF 21
return by the payout ratio which is already structurally embedded in the DCF return. 22

REBUTTAL TESTIMONY OF DR. ROGER A. MORIN
NMPRC CASE NO. 07-00077-UT
46
This is the first time I have ever seen this bizarre adjustment to DCF results. I am 1
not aware of my textbook, analyst, regulator, expert witness, or practitioner ever 2
using this adjustment. 3
4
Q. DR. MORIN, IS IT TRUE THAT THE DCF MODEL DOES NOT 5
RECOGNIZE MARKET FACTORS SUCH AS RISK, AS MR. PATIN 6
CONTENDS ? 7
A. No, of course not. I was astounded by another one of Mr. Patin’s gratuitous 8
pronouncements on page 14 lines 15-16 that “….the DCF model…. does not rely 9
on, or recognize, market factors such as relative risk.” 10
This is totally incorrect. First of all, the dividend yield component of the DCF 11
model certainly moves with interest rates and other market factors such as 12
inflation and monetary policy. For example, when interest rates go up, utility 13
dividend yields typically follow suit, and conversely. Second, when it comes to 14
risk changes, the DCF model certainly reacts to such changes. The return required 15
by equity owners for a given risk class is implicitly embedded in the share price of 16
that firm. The heart and soul of the DCF approach is that, given estimates of the 17
current stock price and future dividends, the stock's implied discount rate can be 18
calculated. The higher the risk perceived by investors, the lower the stock price and 19
the higher the discount rate (cost of equity). So, it is quite incorrect for Mr. Patin to 20
state the DCF model is insensitive to risk and/or market factors. 21
22
REBUTTAL TESTIMONY OF DR. ROGER A. MORIN
NMPRC CASE NO. 07-00077-UT
47
Q. WHAT RISK ASSUMPTIONS DO RISK PREMIUM MODELS SUCH AS 1
THE CAPM INCORPORATE? 2
A. On page 13 of his testimony, Mr. Patin states that he rejects risk premium models 3
such as the CAPM “for the simple reason that they incorporate measurements of 4
an unregulated company’s market risk relative to the market risk of other 5
unregulated companies.” Again, this is wrong. The CAPM is applicable to any 6
financial or real asset, and postulates that the relevant measure of risk for a 7
diversified investor is measured by beta. The latter is a measure of that asset’s 8
degree of co-movement with the overall market, regardless of whether the asset is 9
a regulated company stock or unregulated company stock. Beta estimates have 10
been available for regulated companies for several decades, for example Value 11
Line betas. Mr. Patin himself has relied on such betas in past testimonies. It is 12
not clear as to why he has undergone a change of heart regarding the CAPM and 13
other risk premium techniques in this proceeding. 14
All in all from the above statements, I find Mr. Patin’s knowledge and/or 15
understanding of basic financial theory questionable. 16
17
CONCLUSIONS 18
Q. WHAT RETURNS ARE INVESTORS EXPECTING FOR MR. PATIN’S 19
GROUP OF COMPANIES? 20
A. As shown in Mr. Patin’s Exhibit TCP-2, investors are expecting an average ROE 21
of 10.26%. 22
23
REBUTTAL TESTIMONY OF DR. ROGER A. MORIN
NMPRC CASE NO. 07-00077-UT
48
Q. WHAT IS THE AVERAGE AUTHORIZED ROE FOR MR. PATIN’S 1
GROUP OF COMPANIES? 2
A. As shown in Table 1, the average authorized ROE for Mr. Patin’s comparable 3
companies is 10.8%. 4
5
Q. WHAT ROE DOES MR. PATIN RECOMMEND? 6
A. Mr. Patin’s recommended ROE is 9.10%. 7
8
Q. WHAT IS THE NET IMPACT OF MR. PATIN’S ERRORS ON HIS 9
RECOMMENDATION? 10
A. As shown on the summary table below, a cumulative quantification of the errors 11
and omissions in Mr. Patin’s DCF approach adds some 310 - 340 basis points to 12
his recommendation, bringing the estimate well above 11%: 13
14 ITEM NO. OF BASIS POINTS 15 16
Expected dividend yield 30 17 flotation costs 30 18
DCF functional form 20 19 growth rate forecasts 230 - 260 20
--------------- 21 TOTAL UNDERSTATEMENT 310 - 340 22
23
II. REBUTTAL OF MS. CRANE’S TESTIMONY 24
Q. PLEASE SUMMARIZE MS. CRANE'S ROE RECOMMENDATION. 25
A. Ms. Crane recommends a ROE allowance of only 9.57%. In determining the cost 26
of equity, Ms. Crane applies a DCF analysis and a CAPM analysis to the same 27

REBUTTAL TESTIMONY OF DR. ROGER A. MORIN
NMPRC CASE NO. 07-00077-UT
49
group of electric utilities used by the Company cost of capital witness. The DCF 1
study, summarized on Page 13 of her testimony, produces a result of 9.71%. The 2
CAPM study, summarized on Page 16 of her testimony, produces a result of 3
9.15%. No other tests and/or checks on her results are performed. Ms. Crane 4
arbitrarily assigns a weight of 75% to her DCF results and 25% to her CAPM 5
results, resulting in a cost of equity recommendation of only 9.57%. 6
7
Q. WHAT IS YOUR GENERAL REACTION TO MS. CRANE'S COST OF 8
COMMON EQUITY RECOMMENDATION? 9
A. My first general reaction to her testimony, before I engage in a more technical 10
critique, is that Ms. Crane's recommended 9.57% ROE for PNM lies completely 11
outside the zone of reasonableness and well outside the zone of currently 12
authorized rates of return for major electric utilities in the United States, and, as 13
such, is very difficult to take seriously. Ms. Crane’s recommended reduction in 14
the Company’s ROE down to only 9.57%, if ever adopted, would result in one of 15
the lowest rate of return award for a major electric utility in the country. I hesitate 16
to think of its adverse consequences on the Company’s credit ratings, the stock of 17
its parent company, the company’s capital raising ability, and ratepayers. 18
Moreover, Ms. Crane’s single-digit recommended ROE lies well outside the zone 19
of her comparable companies’ authorized ROEs. These are clear indications that 20
her ROE recommendation for PNM is too low. 21
My second general reaction is that her recommendation of 9.57% rests very 22
heavily on the questionable results of a DCF analysis. Unfortunately, Ms. Crane 23

REBUTTAL TESTIMONY OF DR. ROGER A. MORIN
NMPRC CASE NO. 07-00077-UT
50
has put 75% of her eggs in the delicate DCF basket, which causes her to 1
recommend returns that are below investors’ required returns. Moreover, her 2
CAPM methodology contains a fatal flaw as well, as I discuss later. 3
4
Q. WHAT ARE THE BASIC CONCLUSIONS OF YOUR REBUTTAL TO 5
MS. CRANE'S COST OF EQUITY TESTIMONY? 6
A. Ms. Crane understates PNM’s cost of common equity. A proper application of 7
cost of capital methodologies would give results substantially higher than those 8
that she obtained. 9
10
Q. PLEASE SUMMARIZE YOUR SPECIFIC CRITICISMS OF MS. 11
CRANE'S TESTIMONY. 12
A. I have ten (10) specific criticisms: 13
1. Return Recommendation Out of the Mainstream. Ms. Crane's 14
recommended return is outside the zone of currently allowed rates of return for 15
major electric utilities in the United States and for her sample of companies. The 16
currently authorized ROE for Ms. Crane’s comparable companies is 10.9%, 17
which is much higher than her recommended ROE of 9.57% for PNM. 18
2. The DCF Model Understates the Cost of Equity. As previously discussed, 19
application of the standard DCF model to utility stocks understates the investor's 20
expected return when the M/B ratio exceeds unity. 21
3. DCF Dividend Yield and Flotation Costs. As was the case with Mr. Patin’s 22
DCF analysis, Ms. Crane's dividend yield component is understated by 30 basis 23

REBUTTAL TESTIMONY OF DR. ROGER A. MORIN
NMPRC CASE NO. 07-00077-UT
51
points because it does not allow for flotation costs, and, as a result, a legitimate 1
expense is left unrecovered. 2
4. Understated Dividend Yield. Ms. Crane's dividend yield component is 3
further understated because it is not consistent with the annual form of the DCF 4
model. It is inappropriate to increase the dividend yield by adding one-half of the 5
future growth rate (1 + 1/2 g) to the spot dividend yield. The appropriate manner 6
of computing the expected dividend yield when using the plain vanilla annual 7
DCF model is to add the full growth rate rather than one-half of the growth rate. 8
This error understates the DCF results by some 20 basis points. 9
5. DCF Growth Rate. Ms. Crane’s final choice of growth rate in the DCF 10
analysis is arbitrary and unfounded. 11
6. DCF Historical Growth Rates. As was the case with Mr. Patin’s DCF 12
analysis, the historical growth rates that Ms. Crane examines in her DCF analysis 13
are largely redundant. 14
7. DCF Dividend Growth Rates. As was the case with Mr. Patin’s DCF 15
analysis, the use of dividend growth projections is inappropriate in the DCF 16
model. Earnings growth projections are far more relevant at this point. 17
8. Analysts’ Growth Forecasts. Investors expect substantially higher growth 18
rates for utilities than what Ms. Crane employs in her DCF analysis. 19
9. CAPM Market Risk Premium. Ms. Crane's estimate of the market risk 20
premium (“MRP”) is too low because she has erroneously employed geometric 21
means instead of the correct arithmetic means. Use of the correct MRP increases 22

REBUTTAL TESTIMONY OF DR. ROGER A. MORIN
NMPRC CASE NO. 07-00077-UT
52
Ms. Crane’s CAPM estimate of PNM's cost of equity by 80 basis points, from 1
9.8% to 10.6%. 2
10. CAPM and the Empirical CAPM (ECAPM). The plain vanilla version of 3
the CAPM used by Ms. Crane understates the Company’s cost of equity for low-4
beta securities. 5
I have already addressed items 2, 3, 6, and 7 in my rebuttal of Mr. Patin. I shall 6
now discuss the remaining items in turn. 7
8
1. ALLOWED RETURNS 9
Q. IS MS. CRANE'S RATE OF RETURN RECOMMENDATION 10
COMPATIBLE WITH CURRENTLY ALLOWED RETURNS IN THE 11
ELECTRIC UTILITY INDUSTRY? 12
A. No, it is not. The average allowed return in the electric utility industry in the 13
years 2005, 2006, and 2007 as reported by Regulatory Research Associates was 14
10.5%, 10.4%, and 10.2%, respectively. These ROE awards exceed by a 15
substantial margin Ms. Crane's recommended ROE of 9.57% for PNM. I have 16
also examined the ROEs currently allowed for the electric utilities in Ms. Crane’s 17
barometer group as reported in AUS Utility Reports survey for November 2007. 18
The currently authorized ROEs for Ms. Crane’s sample, shown in the table below, 19
average 10.9%: 20
Company Allowed ROE 1 Alliant Energy 11.02 2 Amer. Elec. Power 10.93 3 Ameren Corp. 10.37 4 Cen. Vermont PS 10.75
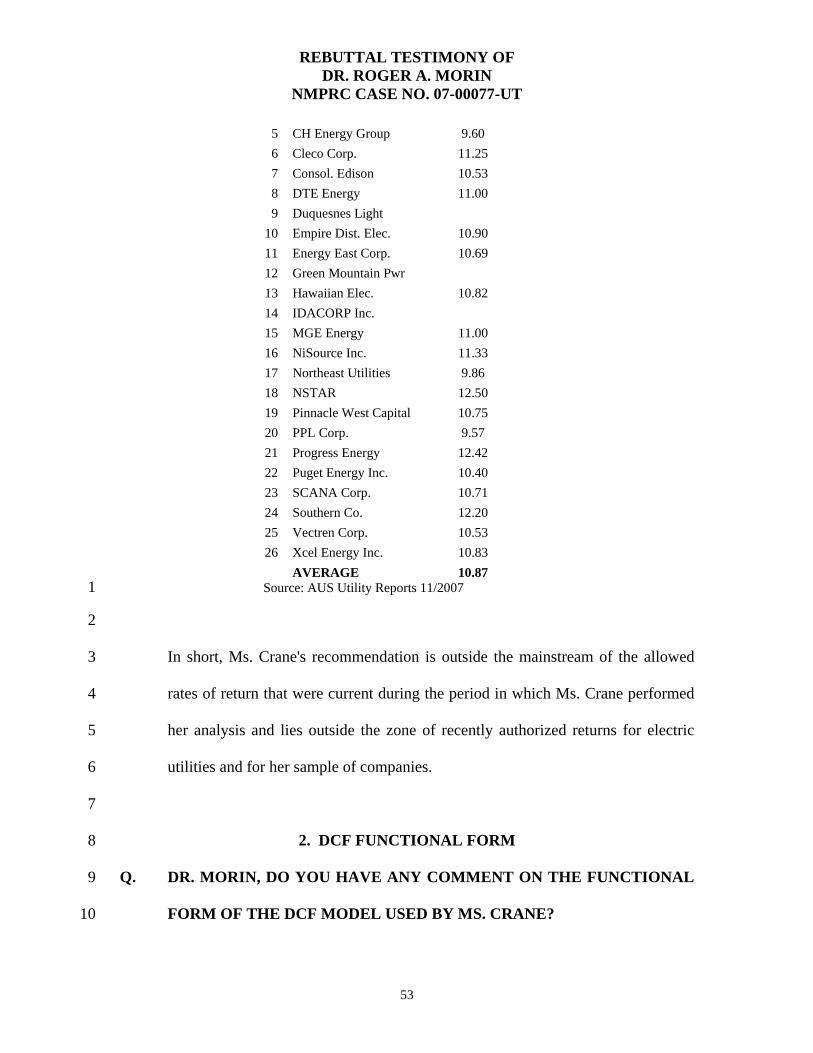
REBUTTAL TESTIMONY OF DR. ROGER A. MORIN
NMPRC CASE NO. 07-00077-UT
53
5 CH Energy Group 9.60 6 Cleco Corp. 11.25 7 Consol. Edison 10.53 8 DTE Energy 11.00 9 Duquesnes Light
10 Empire Dist. Elec. 10.90 11 Energy East Corp. 10.69 12 Green Mountain Pwr 13 Hawaiian Elec. 10.82 14 IDACORP Inc. 15 MGE Energy 11.00 16 NiSource Inc. 11.33 17 Northeast Utilities 9.86 18 NSTAR 12.50 19 Pinnacle West Capital 10.75 20 PPL Corp. 9.57 21 Progress Energy 12.42 22 Puget Energy Inc. 10.40 23 SCANA Corp. 10.71 24 Southern Co. 12.20 25 Vectren Corp. 10.53 26 Xcel Energy Inc. 10.83 AVERAGE 10.87
Source: AUS Utility Reports 11/2007 1
2
In short, Ms. Crane's recommendation is outside the mainstream of the allowed 3
rates of return that were current during the period in which Ms. Crane performed 4
her analysis and lies outside the zone of recently authorized returns for electric 5
utilities and for her sample of companies. 6
7
2. DCF FUNCTIONAL FORM 8
Q. DR. MORIN, DO YOU HAVE ANY COMMENT ON THE FUNCTIONAL 9
FORM OF THE DCF MODEL USED BY MS. CRANE? 10
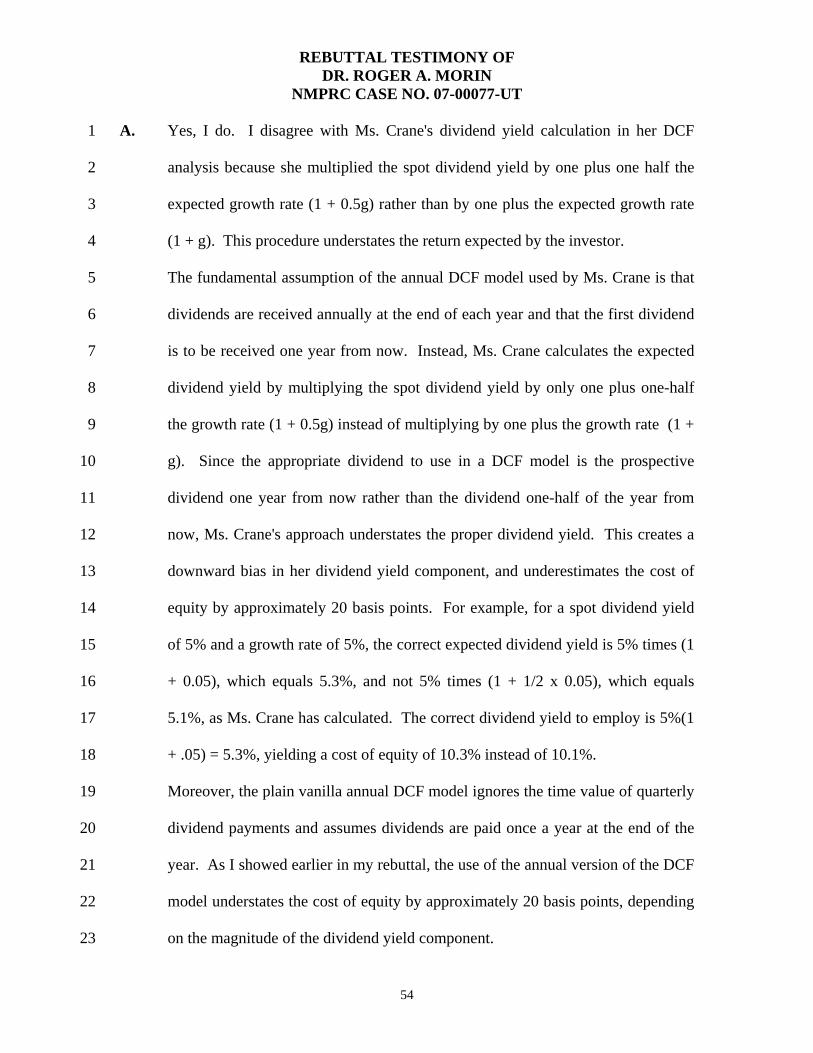
REBUTTAL TESTIMONY OF DR. ROGER A. MORIN
NMPRC CASE NO. 07-00077-UT
54
A. Yes, I do. I disagree with Ms. Crane's dividend yield calculation in her DCF 1
analysis because she multiplied the spot dividend yield by one plus one half the 2
expected growth rate (1 + 0.5g) rather than by one plus the expected growth rate 3
(1 + g). This procedure understates the return expected by the investor. 4
The fundamental assumption of the annual DCF model used by Ms. Crane is that 5
dividends are received annually at the end of each year and that the first dividend 6
is to be received one year from now. Instead, Ms. Crane calculates the expected 7
dividend yield by multiplying the spot dividend yield by only one plus one-half 8
the growth rate (1 + 0.5g) instead of multiplying by one plus the growth rate (1 + 9
g). Since the appropriate dividend to use in a DCF model is the prospective 10
dividend one year from now rather than the dividend one-half of the year from 11
now, Ms. Crane's approach understates the proper dividend yield. This creates a 12
downward bias in her dividend yield component, and underestimates the cost of 13
equity by approximately 20 basis points. For example, for a spot dividend yield 14
of 5% and a growth rate of 5%, the correct expected dividend yield is 5% times (1 15
+ 0.05), which equals 5.3%, and not 5% times (1 + 1/2 x 0.05), which equals 16
5.1%, as Ms. Crane has calculated. The correct dividend yield to employ is 5%(1 17
+ .05) = 5.3%, yielding a cost of equity of 10.3% instead of 10.1%. 18
Moreover, the plain vanilla annual DCF model ignores the time value of quarterly 19
dividend payments and assumes dividends are paid once a year at the end of the 20
year. As I showed earlier in my rebuttal, the use of the annual version of the DCF 21
model understates the cost of equity by approximately 20 basis points, depending 22
on the magnitude of the dividend yield component. 23

REBUTTAL TESTIMONY OF DR. ROGER A. MORIN
NMPRC CASE NO. 07-00077-UT
55
1
3. DCF GROWTH RATES 2
Q. PLEASE DESCRIBE MS. CRANE’S GROWTH RATE ESTIMATE IN 3
HER DCF ANALYSIS? 4
A. From page 13 of her testimony, the table below replicates Ms. Crane’s growth 5
rate estimates for her sample companies. 6
Growth Proxy Earnings - 5 Year Growth (0.9%) Dividends – 5 Year Growth 0.2% Book Value - 5 Year Growth 2.5% Earnings – 10 Year Growth 0.1% Dividends - 10 Year Growth (0.8% Book Value - 10 Year Growth 2.4% Value Line Projections – Earnings 5.3% Value Line Projections - Dividends 4.4% Value Line Projections – Book Value 3.8%
AVERAGE 2.2% 7
From the smorgasbord of growth rates shown in the above table, which range 8
from -0.9% to + 5.3% and average 2.2%, Ms. Crane ends up picking Value Line’s 9
earnings growth forecast of 5.3% as her final estimate of the DCF growth rate 10
without providing any foundation or justification for this arbitrary choice. 11
12
4. ANALYSTS’ GROWTH FORECASTS 13
Q. PLEASE DISCUSS THE USE OF ANALYSTS’ FORECASTS IN 14
APPLYING THE DCF MODEL TO UTILITIES. 15
A. As discussed earlier in my rebuttal of Mr. Patin, the best proxy for the growth 16
component of the DCF model is the analysts’ long-term earnings growth 17
forecasts. These forecasts are made by large reputable organizations, and the data 18

REBUTTAL TESTIMONY OF DR. ROGER A. MORIN
NMPRC CASE NO. 07-00077-UT
56
are readily available to investors and are representative of the consensus view of 1
investors. 2
3
Q. HAS MS. CRANE RELIED ON ANALYSTS’ GROWTH FORECASTS IN 4
PAST PROCEEDINGS? 5
A. Yes, she has. In past proceedings, notably in a recent electric utility proceeding 6
regarding Delmarva Power & Light before the Delaware Commission (Docket 7
No. 05-304), Ms. Crane reported and relied on the analysts’ consensus growth 8
forecast. She failed to rely on such forecasts in this proceeding. 9
10
Q. DOES MS. CRANE OFFER ANY EXPLANATION FOR HER 11
DEVIATION FROM PAST PRACTICE OF ESTIMATING DCF 12
GROWTH RATES? 13
A. No, she does not. 14
15
Q. WHAT WOULD MS. CRANE'S DCF ESTIMATES BE HAD SHE RELIED 16
UPON THE SAME GROWTH ESTIMATES AS IN THE PAST? 17
A. The table below reports the consensus analysts’ growth forecasts for the 18
companies in Ms. Crane’s sample from the Zacks Investment Research Web site, 19
the same source used by Value Line in reporting such growth rates. The average 20
growth forecast is 6.0% compared to Ms. Crane’s 5.3% estimate. Substituting the 21
average consensus analysts’ growth forecast of 6.0% instead of the 5.3% used by 22
Ms. Crane in this proceeding raises her DCF estimates by 0.7%, the difference 23

REBUTTAL TESTIMONY OF DR. ROGER A. MORIN
NMPRC CASE NO. 07-00077-UT
57
between 6.0% and 5.3%, which would in turn raise her DCF estimates from 1
9.71% to 10.41% without flotation cost and to 10.71% with flotation cost. 2
Company Analysts' Growth
1 Alliant Energy 6.0 2 Amer. Elec. Power 5.0 3 Ameren Corp. 6.8 4 Cen. Vermont PS 9.0 5 CH Energy Group 3.0 6 Cleco Corp. 5.0 7 Consol. Edison 3.2 8 DTE Energy 6.0 9 Duquesnes Light n.a
10 Empire Dist. Elec. 11.0 11 Energy East Corp. 3.0 12 Green Mountain Pwr n.a. 13 Hawaiian Elec. 4.5 14 IDACORP Inc. 5.0 15 MGE Energy 6.5 16 NiSource Inc. 3.3 17 Northeast Utilities 13.0 18 NSTAR 6.7 19 Pinnacle West Capital 6.7 20 PPL Corp. 10.3 21 Progress Energy 5.8 22 Puget Energy Inc. 5.5 23 SCANA Corp. 4.3 24 Southern Co. 4.3 25 Vectren Corp. 4.5 26 Xcel Energy Inc. 4.8 AVERAGE 6.0
Source: Zacks Investment Research 3
4
5. CAPM MARKET RISK PREMIUM 5
Q. DOES MS. CRANE EMPLOY A CAPM ESTIMATE? 6
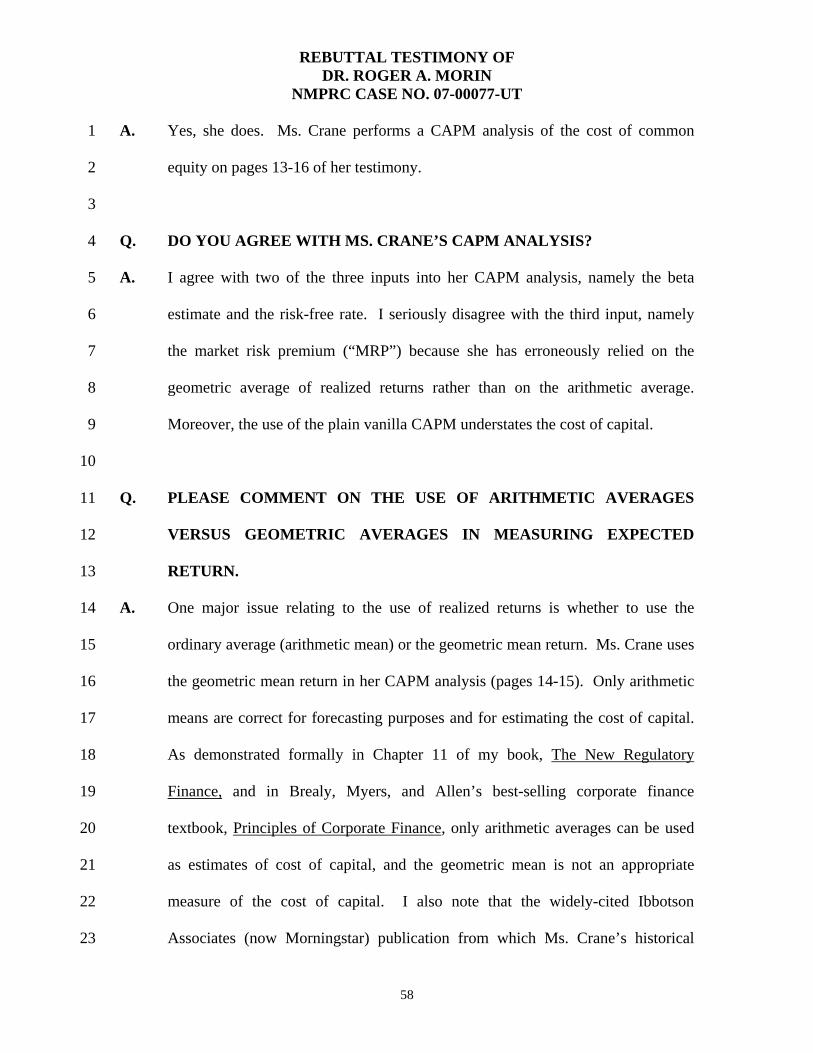
REBUTTAL TESTIMONY OF DR. ROGER A. MORIN
NMPRC CASE NO. 07-00077-UT
58
A. Yes, she does. Ms. Crane performs a CAPM analysis of the cost of common 1
equity on pages 13-16 of her testimony. 2
3
Q. DO YOU AGREE WITH MS. CRANE’S CAPM ANALYSIS? 4
A. I agree with two of the three inputs into her CAPM analysis, namely the beta 5
estimate and the risk-free rate. I seriously disagree with the third input, namely 6
the market risk premium (“MRP”) because she has erroneously relied on the 7
geometric average of realized returns rather than on the arithmetic average. 8
Moreover, the use of the plain vanilla CAPM understates the cost of capital. 9
10
Q. PLEASE COMMENT ON THE USE OF ARITHMETIC AVERAGES 11
VERSUS GEOMETRIC AVERAGES IN MEASURING EXPECTED 12
RETURN. 13
A. One major issue relating to the use of realized returns is whether to use the 14
ordinary average (arithmetic mean) or the geometric mean return. Ms. Crane uses 15
the geometric mean return in her CAPM analysis (pages 14-15). Only arithmetic 16
means are correct for forecasting purposes and for estimating the cost of capital. 17
As demonstrated formally in Chapter 11 of my book, The New Regulatory 18
Finance, and in Brealy, Myers, and Allen’s best-selling corporate finance 19
textbook, Principles of Corporate Finance, only arithmetic averages can be used 20
as estimates of cost of capital, and the geometric mean is not an appropriate 21
measure of the cost of capital. I also note that the widely-cited Ibbotson 22
Associates (now Morningstar) publication from which Ms. Crane’s historical 23

REBUTTAL TESTIMONY OF DR. ROGER A. MORIN
NMPRC CASE NO. 07-00077-UT
59
MRP estimate is derived contains a detailed and rigorous discussion of the 1
impropriety of using geometric averages in estimating the cost of capital. There is 2
no theoretical or empirical justification for the use of geometric mean rates of 3
returns in estimating a utility’s cost of capital. I know of no textbook on finance 4
or scientific journal article which advocates the use of the geometric mean as a 5
measure of the appropriate discount rate in computing the cost of capital or in 6
computing present values. 7
The net effect of Ms. Crane's use of the geometric mean MRP 4.9% rather than 8
the arithmetic mean of 6.5% is to decrease her estimates of the required market 9
return by 1.6%, that is, the difference between the arithmetic and geometric mean 10
reported in the aforementioned Ibbotson Associates publication. This, in turn, 11
translates into an understatement of PNM’s cost of equity by approximately 1.4%. 12
The latter estimate is derived by assuming that PNM's beta is 0.89 from Ms. 13
Crane’s Page 14 and multiplying that beta by 1.6%, the difference between the 14
arithmetic and geometric mean MRP. This correction would in turn raise Ms. 15
Crane’s CAPM estimate from 9.15% to 10.75% without flotation cost and about 16
11% with flotation cost. 17
18
Q. CAN YOU PROVIDE A BRIEF EXPLANATION AS TO WHY THE 19
ARITHMETIC MEAN IS PREFERABLE TO THE GEOMETRIC MEAN 20
WHEN ESTIMATING THE COST OF CAPITAL? 21
A. The use of the arithmetic mean appears counter-intuitive at first glance, because 22
we commonly use the geometric mean return to measure the average annual 23
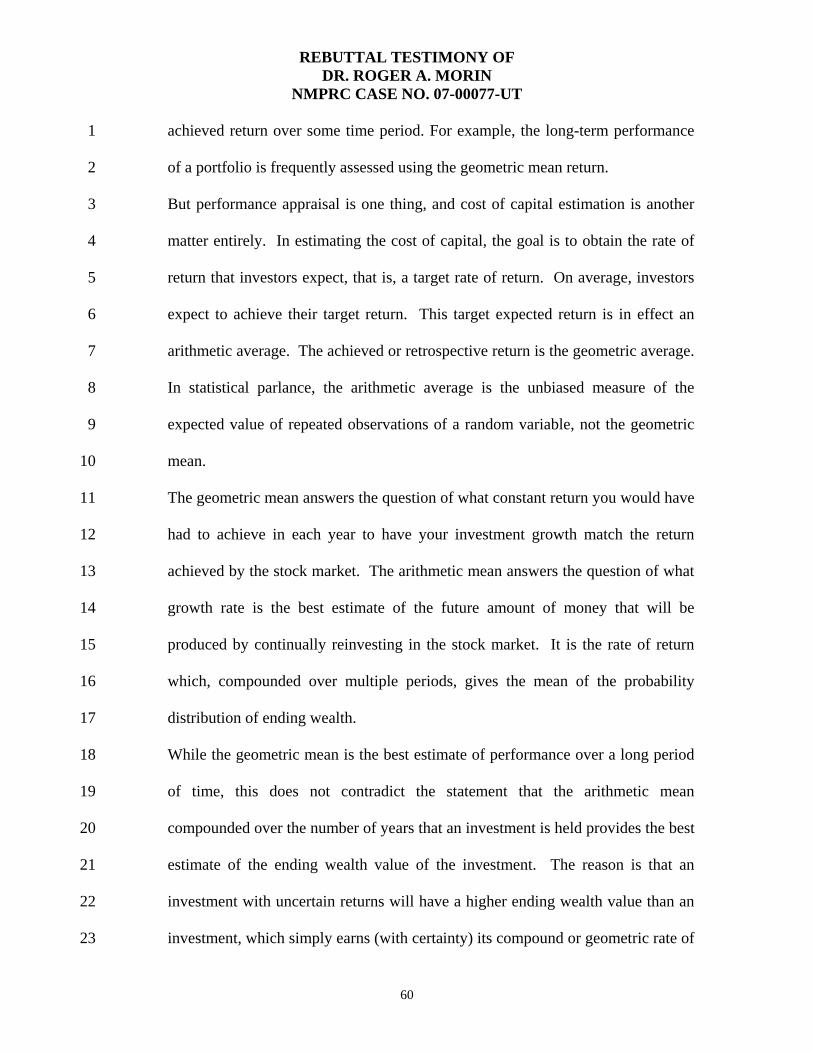
REBUTTAL TESTIMONY OF DR. ROGER A. MORIN
NMPRC CASE NO. 07-00077-UT
60
achieved return over some time period. For example, the long-term performance 1
of a portfolio is frequently assessed using the geometric mean return. 2
But performance appraisal is one thing, and cost of capital estimation is another 3
matter entirely. In estimating the cost of capital, the goal is to obtain the rate of 4
return that investors expect, that is, a target rate of return. On average, investors 5
expect to achieve their target return. This target expected return is in effect an 6
arithmetic average. The achieved or retrospective return is the geometric average. 7
In statistical parlance, the arithmetic average is the unbiased measure of the 8
expected value of repeated observations of a random variable, not the geometric 9
mean. 10
The geometric mean answers the question of what constant return you would have 11
had to achieve in each year to have your investment growth match the return 12
achieved by the stock market. The arithmetic mean answers the question of what 13
growth rate is the best estimate of the future amount of money that will be 14
produced by continually reinvesting in the stock market. It is the rate of return 15
which, compounded over multiple periods, gives the mean of the probability 16
distribution of ending wealth. 17
While the geometric mean is the best estimate of performance over a long period 18
of time, this does not contradict the statement that the arithmetic mean 19
compounded over the number of years that an investment is held provides the best 20
estimate of the ending wealth value of the investment. The reason is that an 21
investment with uncertain returns will have a higher ending wealth value than an 22
investment, which simply earns (with certainty) its compound or geometric rate of 23

REBUTTAL TESTIMONY OF DR. ROGER A. MORIN
NMPRC CASE NO. 07-00077-UT
61
return every year. In other words, more money, or terminal wealth, is gained by 1
the occurrence of higher than expected returns than is lost by lower than expected 2
returns. 3
In capital markets, where returns are a probability distribution, the answer that 4
takes account of uncertainty, the arithmetic mean, is the correct one for estimating 5
discount rates and the cost of capital. In conclusion, Ms. Crane commits a serious 6
error in logic by relying on geometric averages rather than on the conceptually 7
correct arithmetic averages of historical returns. I know of no valid textbook, 8
article, or professional journal that advocates discounting cash flows (estimating 9
cost of capital) using the geometric rate of return. 10
While it is true that a geometric mean is correct and indeed appropriate when 11
measuring performance over a long time period, it is incorrect when estimating a 12
risk premium to compute the cost of capital. 13
14
Q. ARE THERE THEORETICAL REASONS WHY THE ARITHMETIC 15
MEAN IS THE CORRECT ONE? 16
A. Yes, there are. The geometric mean measures the magnitude of the returns, as the 17
investor starts with one portfolio and ends with another. It does not measure the 18
variability of the journey, as does the arithmetic mean. The geometric mean is 19
backward looking. Two very different stocks or portfolios, one of which is highly 20
volatile and the other of which is absolutely stable, can have the exact same 21
geometric mean. The arithmetic mean, on the other hand, is forward looking in 22
that it does impound the volatility of the stocks. 23
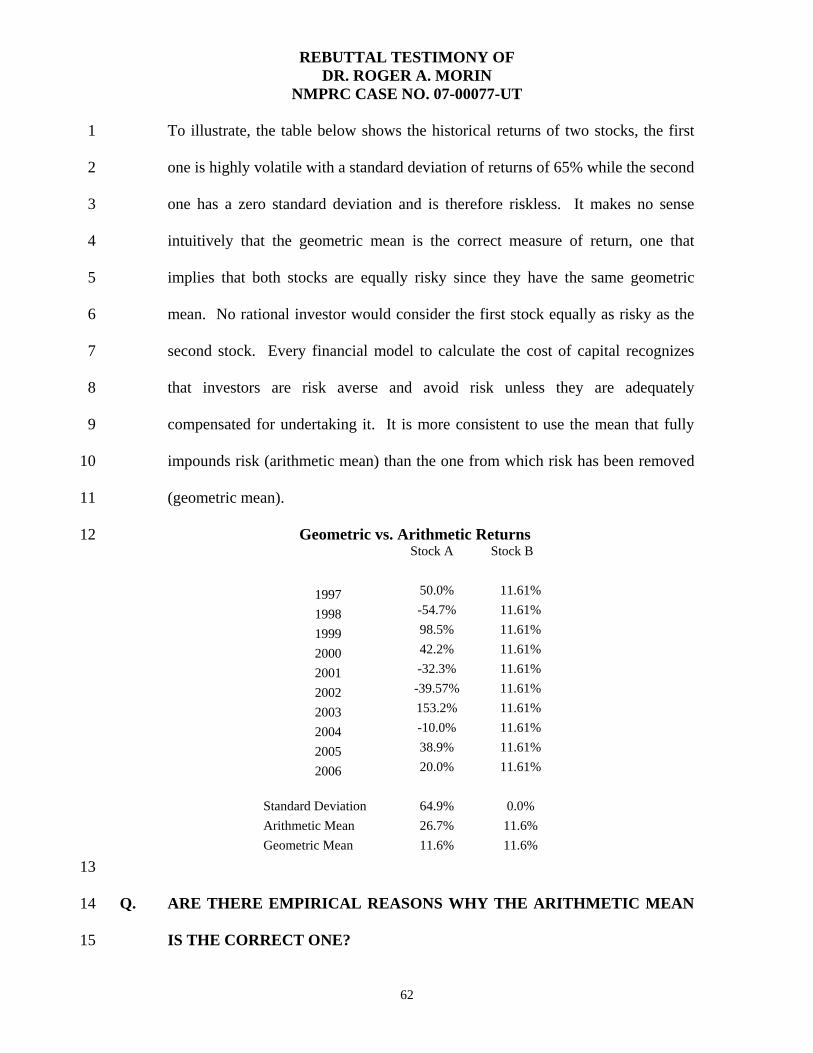
REBUTTAL TESTIMONY OF DR. ROGER A. MORIN
NMPRC CASE NO. 07-00077-UT
62
To illustrate, the table below shows the historical returns of two stocks, the first 1
one is highly volatile with a standard deviation of returns of 65% while the second 2
one has a zero standard deviation and is therefore riskless. It makes no sense 3
intuitively that the geometric mean is the correct measure of return, one that 4
implies that both stocks are equally risky since they have the same geometric 5
mean. No rational investor would consider the first stock equally as risky as the 6
second stock. Every financial model to calculate the cost of capital recognizes 7
that investors are risk averse and avoid risk unless they are adequately 8
compensated for undertaking it. It is more consistent to use the mean that fully 9
impounds risk (arithmetic mean) than the one from which risk has been removed 10
(geometric mean). 11
Geometric vs. Arithmetic Returns 12 Stock A Stock B
1997 50.0% 11.61%
1998 -54.7% 11.61%
1999 98.5% 11.61%
2000 42.2% 11.61%
2001 -32.3% 11.61%
2002 -39.57% 11.61%
2003 153.2% 11.61%
2004 -10.0% 11.61%
2005 38.9% 11.61%
2006 20.0% 11.61% Standard Deviation 64.9% 0.0% Arithmetic Mean 26.7% 11.6% Geometric Mean 11.6% 11.6%
13
Q. ARE THERE EMPIRICAL REASONS WHY THE ARITHMETIC MEAN 14
IS THE CORRECT ONE? 15
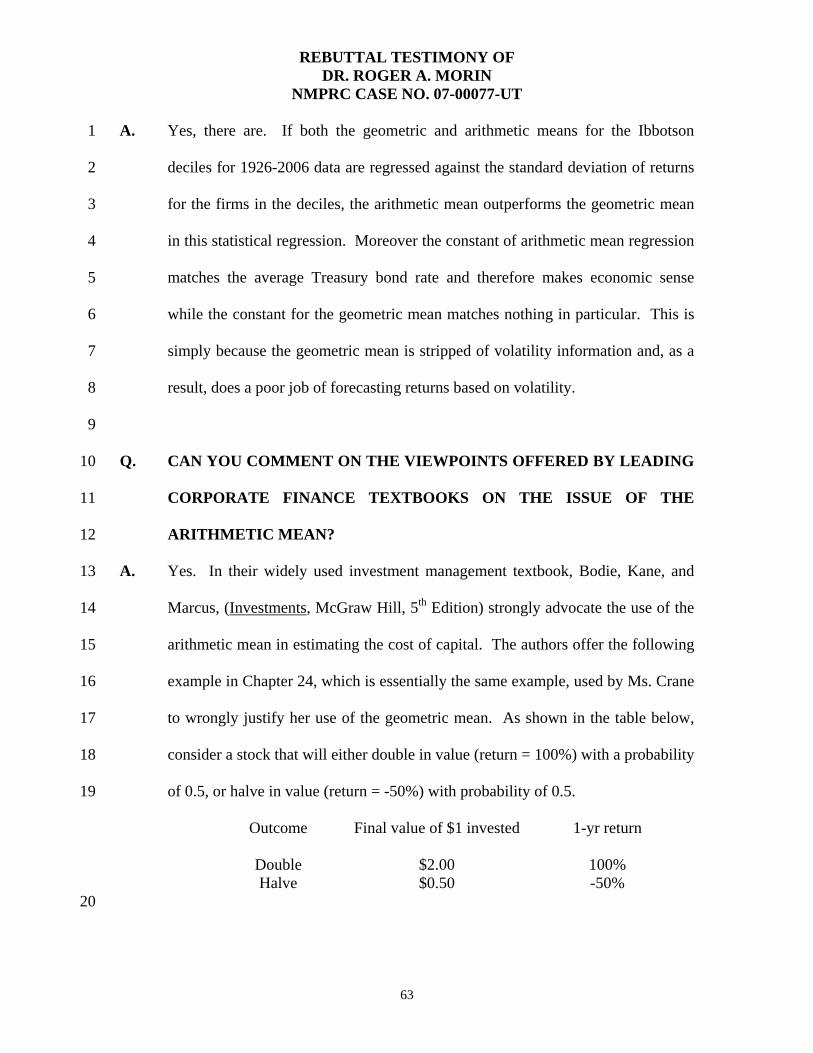
REBUTTAL TESTIMONY OF DR. ROGER A. MORIN
NMPRC CASE NO. 07-00077-UT
63
A. Yes, there are. If both the geometric and arithmetic means for the Ibbotson 1
deciles for 1926-2006 data are regressed against the standard deviation of returns 2
for the firms in the deciles, the arithmetic mean outperforms the geometric mean 3
in this statistical regression. Moreover the constant of arithmetic mean regression 4
matches the average Treasury bond rate and therefore makes economic sense 5
while the constant for the geometric mean matches nothing in particular. This is 6
simply because the geometric mean is stripped of volatility information and, as a 7
result, does a poor job of forecasting returns based on volatility. 8
9
Q. CAN YOU COMMENT ON THE VIEWPOINTS OFFERED BY LEADING 10
CORPORATE FINANCE TEXTBOOKS ON THE ISSUE OF THE 11
ARITHMETIC MEAN? 12
A. Yes. In their widely used investment management textbook, Bodie, Kane, and 13
Marcus, (Investments, McGraw Hill, 5th Edition) strongly advocate the use of the 14
arithmetic mean in estimating the cost of capital. The authors offer the following 15
example in Chapter 24, which is essentially the same example, used by Ms. Crane 16
to wrongly justify her use of the geometric mean. As shown in the table below, 17
consider a stock that will either double in value (return = 100%) with a probability 18
of 0.5, or halve in value (return = -50%) with probability of 0.5. 19
Outcome Final value of $1 invested 1-yr return
Double $2.00 100% Halve $0.50 -50%
20

REBUTTAL TESTIMONY OF DR. ROGER A. MORIN
NMPRC CASE NO. 07-00077-UT
64
Suppose that the stock’s performance over a two-year period is representative of 1
the probability distribution, doubling in one year (r1 = 100%) and halving in the 2
next (r2 = -50%). The stock’s price ends up exactly where it started, and the 3
geometric average annual return over the two-year period, rg, is zero: 4
1 + rg = [( 1 + r1)(1 + r2)]1/2 5
= [( 1 + 1)(1 - .50)]1/2 = 1 6
rg = 0 7
confirming that a zero year-by-year return would have replicated the total return 8
earned on the stock. The expected annual future rate of return on the stock is not 9
zero, however. It is the arithmetic average of 100% and -50%, (100-50)/2 = 25%. 10
There are two equally likely outcomes per dollar invested: either a gain of $1 11
when r = 100% or a loss of $0.50 when r = -50%. The expected profit is ($1-12
$.50)/2 = $.25 for a 25% expected rate of return. The profit in the good year more 13
than offsets the loss in the bad year, despite the fact that the geometric return is 14
zero. The arithmetic average return thus provides the best guide to expected 15
future returns. In conclusion, Ms. Crane should have heeded professors Bodie, 16
Kane, and Marcus’ advice, and commits a serious logical error by relying on 17
geometric averages rather than on the conceptually correct arithmetic averages of 18
historical returns. 19
The following extract from a widely utilized corporate finance textbook illustrates 20
the distinction between arithmetic and geometric averages and concludes that 21
arithmetic averages are appropriate when estimating the cost of capital. 22

REBUTTAL TESTIMONY OF DR. ROGER A. MORIN
NMPRC CASE NO. 07-00077-UT
65
“The proper uses of arithmetic and compound rates of return from past 1 investments are often misunderstood. Therefore, we call a brief time-out for a 2 clarifying example. 3 4 Suppose that the price of Big Oil’s common stock is $100. There is an 5 equal chance that at the end of the year the stock will be worth $90, $110, or 6 $130. Therefore, the return could be –10 percent, +10 percent or +30 percent 7 (we assume that Big Oil does not pay a dividend). The expected return is 1/3(-8 10+10+30) = +10 percent. 9 10 If we run the process in reverse and discount the expected cash flow by the 11 expected rate of return, we obtain the value of Big Oil’s stock: 12 13 PV = 110 = $100 14 1.10 15 16 The expected return of 10 percent is therefore the correct rate at which to 17 discount the expected cash flow from Big Oil’s stock. It is also the opportunity 18 cost of capital for investments, which have the same degree of risk as Big Oil. 19 20 Now suppose that we observe the returns on Big Oil stock over a large 21 number of years. If the odds are unchanged, the return will be –10 percent in a 22 third of the years, +10 percent in a further third, and +30 percent in the 23 remaining years. The arithmetic average of these yearly returns is 24 25 - 10 + 10 + 30 = + 10% 26 3 27 Thus the arithmetic average of the returns correctly measures the 28 opportunity cost of capital for investments of similar risk to Big Oil stock. 29 30 The average compound annual return on Big Oil stock would be 31 (.9 x 1.1 x 1.3)1/3 –1 = .088, or 8.8% 32 33 less than the opportunity cost of capital. Investors would not be willing to 34 invest in a project that offered an 8.8 percent expected return if they could get an 35 expected return of 10 percent in the capital markets. The net present value of 36 such a project would be 37 38 NPV = -100 + 108.8 = -1.1 39 1.1 40 41 Moral: If the cost of capital is estimated from historical returns or risk 42 premiums, use arithmetic averages, not compound annual rates of return.” 43 (Richard A. Brealey, Stewart C. Myers, and Paul Allen, Principles of Corporate 44 Finance, 8th Edition, Irwin McGraw-Hill, 2006.) 45
REBUTTAL TESTIMONY OF DR. ROGER A. MORIN
NMPRC CASE NO. 07-00077-UT
66
1
It is noteworthy that a survey published in 1998 found that 71% of 2
textbooks/tradebooks used a historical arithmetic mean as the market risk 3
premium and 60% of financial advisors used either a market risk premium of 7.0-4
7.4% (similar to the arithmetic mean) or a long-term arithmetic mean. See Robert 5
F. Bruner, Kenneth M. Eades, Robert S. Harris, and Robert C. Higgins, “Best 6
Practices in Estimating the Cost of Capital: Survey and Synthesis”, Financial 7
Practice and Education, Vol. 8, Number 1, Spring/Summer 1998, page 18. 8
9
6. CAPM AND THE EMPIRICAL CAPM 10
Q. DO YOU AGREE WITH THE USE OF THE RAW FORM OF THE CAPM 11
USED BY MS. CRANE TO ESTIMATE THE COST OF CAPITAL? 12
A. No, I do not. I believe that the plain vanilla version of the CAPM should be 13
supplemented by the more refined version of the CAPM. There have been 14
countless empirical tests of the CAPM to determine to what extent security 15
returns and betas are related in the manner predicted by the CAPM. The results of 16
the tests support the idea that beta is related to security returns, that the risk-return 17
tradeoff is positive, and that the relationship is linear. The contradictory finding 18
is that the risk-return tradeoff is not as steeply sloped as the predicted CAPM. 19
That is, low-beta securities earn returns somewhat higher than the CAPM would 20
predict, and high-beta securities earn less than predicted. I was surprised that Ms. 21
Crane was unaware of this important financial literature, for this is one of the 22
most well known results in finance. A CAPM-based estimate of the cost of 23

REBUTTAL TESTIMONY OF DR. ROGER A. MORIN
NMPRC CASE NO. 07-00077-UT
67
capital underestimates the return required from low-beta securities and overstates 1
the return from high-beta securities, based on the empirical evidence. 2
The downward bias is particularly significant for low-beta securities, such as the 3
electric utilities used by Ms. Crane. Ms. Crane's CAPM estimates of equity costs 4
are understated by about 30 basis points from this bias alone. 5
6
CONCLUSIONS 7
Q. WHAT DO YOU CONCLUDE FROM MS. CRANE'S COST OF CAPITAL 8
TESTIMONY? 9
A. My general conclusion is that there are many infirmities in Ms. Crane’s 10
methodology in arriving at her ROE recommendation. Her recommendation of 11
9.57% rests heavily on the questionable results of her DCF analysis. I also 12
conclude that Ms. Crane’s recommended 9.57% ROE for the Company is outside 13
the zone of currently authorized rates of return for major energy utilities in the 14
United States and for her own samples of comparable risk utilities, and would be 15
among the lowest, if not the lowest, in the country, if adopted. 16
As shown in the summary table below, my specific conclusions on Ms. Crane’s 17
DCF analysis are that it is understated by: (i) 30 basis points from the omission of 18
an appropriate flotation cost allowance; (ii) 20 basis points from the 19
understatement of growth in the dividend yield component due to the use of an 20
improper DCF functional form; (iii) 20 basis points for not properly accounting 21
for the quarterly nature of dividend payments, and (iv) 70 basis points from 22
failure to use analysts’ consensus growth forecasts. Her total DCF 23

REBUTTAL TESTIMONY OF DR. ROGER A. MORIN
NMPRC CASE NO. 07-00077-UT
68
understatement of the Company’s ROE from these sources alone is approximately 1
140 basis points, increasing Ms. Crane's recommended ROE from 9.57% to 2
11.0%. 3
DCF Errors Source Basis Points
DCF Dividend Yield 20 DCF Quarterly version 20 Flotation Cost Allowance 30 Analysts’ Growth Forecast 70
With respect to the CAPM analysis on which she places 25% weight, Ms. Crane’s
CAPM result is also 11% using the correct MRP.
All in all, her overall corrected results strongly suggest a ROE recommendation 4
not so significantly different from the Company’s requested ROE. 5
6
Q. DOES THIS COMPLETE YOUR REBUTTAL TESTIMONY? 7
A. Yes, it does. 8
#496306 9