Roadshow Presentation March 2017 - Frac Sand |...
43
Roadshow Presentation March 2017
Transcript of Roadshow Presentation March 2017 - Frac Sand |...
Roadshow PresentationMarch 2017

Important Notice
A preliminary prospectus and amended and restated preliminary prospectus containing important information relating to the securities described in this presentation has been filed with the securities regulatory authorities in Québec and each of the provinces and territories of Canada, respectively. A copy of the preliminary prospectus and amended and restated preliminary prospectus, and any amendment thereto (collectively, the “preliminary prospectus”), is required to be delivered with this presentation. The preliminary prospectus is still subject to completion. There will not be any sale or acceptance of an offer to buy the securities until a receipt for the final prospectus has been issued. This presentation does not provide full disclosure of all material facts relating to the securities offered. Investors should read the preliminary prospectus, the final prospectus and any amendment for disclosure of those facts, especially risk factors relating to the securities offered, before making an investment decision.
The information contained in this presentation does not purport to be all‐inclusive or to contain all information that prospective investors may require. Prospective investors are encouraged to conduct their own analysis and review of the Company (as defined in the preliminary prospectus) and Source (as defined in the preliminary prospectus) and of the information contained in this presentation. Without limitation, prospective investors should read the entire preliminary prospectus and final prospectus, and any amendments thereto, consider the advice of their financial, legal, accounting, tax and other professional advisors and such other factors they consider appropriate in investigating and analyzing Source. An investor should rely only on the information contained in the final prospectus relating to the Offering (as defined in the preliminary prospectus), which will include this presentation, and is not entitled to rely on parts of the information contained in the final prospectus to the exclusion of others. None of the Company, the Selling Shareholders (as defined in the preliminary prospectus) or the Underwriters (as defined in the preliminary prospectus) has authorized anyone to provide investors with additional or different information, and any such information, including statements in media articles about Source, should not be relied upon.
Certain capitalized terms and abbreviations not otherwise defined herein have the meaning assigned to them in the preliminary prospectus.
There is currently no market through which the Common Shares may be sold and purchasers may not be able to resell Common Shares purchased under the final prospectus. This may affect the pricing of the Common Shares in the secondary market, the transparency and availability of trading prices, the liquidity of the Common Shares and the extent of issuer regulation. An investment in the Common Shares is speculative and involves a high degree of risk that should be considered by potential purchasers. The Company’s business is subject to the risks normally encountered in the fracsand industry and the Company’s business of mining, processing and transporting of frac sand. An investment in the Common Shares is suitable only for those purchasers who are willing to risk a loss of some or all of their investment and who can afford to lose some or all of their investment. See “Risk Factors” in the preliminary prospectus.
Scientific and Technical Information
The scientific and technical information in this presentation that relates to the Sumner Facility and the Blair Facility was estimated as of December 16, 2015 and as of February 12, 2017, respectively, and has been approved by D. Roy Eccles, M. Sc P. Geol and Steven Nicholls, BA.Sc, MAIG, each full time employees of APEX and independent QPs, as set out in the Sumner APEX Report and the Blair APEX Report. Reference should be made to the full text of the Sumner APEX Report and the Blair APEX Report, which are available under the Company’s profile at www.sedar.com. See “Scientific and Technical Information” in the preliminary prospectus.
The scientific and technical information in this presentation has been updated with current information, where applicable. Unless otherwise indicated, all Mineral Resource estimates contained in such scientific and technical information have been prepared in accordance with NI 43-101 and the Canadian Institute of Mining, Metallurgy and Petroleum Classification System “Estimation of Mineral Resources and Mineral Reserves Best Practice Guidelines” dated November 23, 2003 and CIM amended and adopted “Definition Standards for Mineral Resources and Mineral Reserves” dated May 20, 2014. Without limiting the foregoing, such scientific and technical information uses terms that comply with reporting standards in Canada and certain estimates are made in accordance with NI 43-101. NI 43-101 is a rule developed by the Canadian Securities Administrators that establishes standards for all public disclosure an issuer makes of scientific and technical information concerning mineral projects.
Source has not based its production decisions and ongoing mine production on Mineral Reserve estimates, preliminary economic assessments, pre-feasibility studies or feasibility studies. As a result, there may be an increased uncertainty of achieving any particular level of recovery of minerals or the cost of such recovery and historically projects without any Mineral Reserves have increased uncertainty and risk of failure.
Non-IFRS Measures
In addition to using financial measures prescribed by IFRS, references are made in this presentation to “Adjusted EBITDA”, “EBITDA” and “Adjusted Gross Margin” which are measures that do not have any standardized meaning as prescribed by IFRS. Accordingly, Source’s use of such terms may not be comparable to similarly defined measures presented by other entities. For further details on these non-IFRS financial measures, see “IFRS and Non-IFRS Measures” in the preliminary prospectus.
United States Matters
The securities of the Company referred to herein have not been and will not be registered under the U.S. Securities Act of 1933 (the “Securities Act”), as amended, and may only be offered, and this presentation may only be made, to persons within the United States that are “qualified institutional buyers” within the meaning of Rule 144A under the Securities Act. The Company does not have a class of securities registered with the Securities and Exchange Commission (the “SEC”). Source prepares its disclosure in accordance with the requirements of applicable securities laws in effect in Canada, which differ significantly from the requirements of U.S. securities laws.
2
Disclaimer
Forward-Looking Statements
Certain statements contained in this presentation constitute “forward-looking information” or “forward-looking statements” (collectively, “forward-looking statements”) within the meaning of applicable Canadian and United States securities laws relating to, without limitation, expectations, intentions, plans and beliefs, including information as to the future events, results of operations and Source’s future performance (both operational and financial) and business prospects. In certain cases, forward-looking statements can be identified by the use of words such as “expects”, “estimates”, “forecasts”, “intends”, “anticipates”, “believes”, “plans”, “seeks”, “projects” or variations of such words and phrases, or state that certain actions, events or results “may” or “will” be taken, occur or be achieved. Such forward-looking statements reflect Source’s beliefs, estimates and opinions regarding its future growth, results of operations, future performance (both operational and financial), and business prospects and opportunities at the time such statements are made, and Source undertakes no obligation to update forward-looking statements if these beliefs, estimates and opinions or circumstances should change. Forward-looking statements are necessarily based upon a number of estimates and assumptions made by Source that are inherently subject to significant business, economic, competitive, political and social uncertainties and contingencies. Forward-looking statements are not guarantees of future performance. In particular, this presentation contains forward-looking statements pertaining, but not limited, to: the completion, size, expenses and timing of the offering of common shares by Source and the use of proceeds therefrom; the characteristics of the Blair Facility and the benefits of its acquisition; changes to laws and regulations affecting Source’s business; expectations regarding the price of proppants and sensitivity to changes in such prices; outlook for operations; expectations respecting future competitive conditions; industry activity levels; industry conditions pertaining to the frac sand industry; and Source’s objectives, strategies and competitive strengths.
By their nature, forward-looking statements involve numerous current assumptions, known and unknown risks, uncertainties and other factors which may cause the actual results, performance or achievements of Source to differ materially from those anticipated by Source and described in the forward-looking statements.
With respect to the forward-looking statements contained in this presentation, assumptions have been made regarding, among other things: proppant market prices; future oil, natural gas and natural gas liquids prices; future global economic and financial conditions; future commodity prices, demand for oil and gas and the product mix of such demand, and levels of activity in the oil and gas industry in the areas in which Source operates; the timing for receipt of regulatory and stock exchange approvals and the execution of ancillary agreements in connection with the offering of common shares; Source’s ability to successfully complete and integrate the Blair Facility and the anticipated benefits of acquiring the Blair Facility; the continued availability of timely and safe transportation for Source’s products, including without limitation, rail accessibility; the maintenance of Source’s key customers and the financial strength of its key customers, the maintenance of Source’s significant contracts or their replacement with new contracts on substantially similar terms and that contractual counterparties will comply with current contractual terms; operating costs; that the regulatory environment in which Source operates will be maintained in the manner currently anticipated by Source; future exchange and interest rates; geological and engineering estimates in respect of Source’s resources; the recoverability of Source’s resources; the accuracy and veracity of information and projections sourced from third parties respecting, among other things, future industry conditions and product demand; demand for horizontal drilling and hydraulic fracturing and the maintenance of current techniques and procedures, particularly with respect to the use of proppants; Source’s ability to obtain qualified staff and equipment in a timely and cost-efficient manner; the regulatory framework governing royalties, taxes and environmental matters in the jurisdictions in which Source conducts its business and any other jurisdictions in which Source may conduct its business in the future; future capital expenditures to be made by Source; future sources of funding for Source’s capital program; Source’s future debt levels; the impact of competition on Source; Source’s ability to obtain financing on acceptable terms; and, where applicable, each of those assumptions set forth in the footnotes provided herein in respect of particular forward-looking statements.
A number of factors, risks and uncertainties could cause results to differ materially from those anticipated and described herein including, among others: the effects of competition and pricing pressures; risks inherent in key customer dependence; effects of fluctuations in the price of proppants; possible failure to realize the anticipated benefits of the acquisition of the Blair Facility; inability to complete the acquisition of the Blair Facility on the terms specified or at all; potential undisclosed liabilities associated with the acquisition of the Blair Facility; risks related to indebtedness and liquidity, including Source’s leverage, restrictive covenants in Source’s debt instruments and Source’s capital requirements; risks related to interest rate fluctuations and foreign exchange rate fluctuations; changes in general economic, financial, market and business conditions in the markets in which Source operates; changes in the technologies used to drill for and produce oil and natural gas; Source’s ability to obtain, maintain and renew required permits, licenses and approvals from regulatory authorities; the stringent requirements of and potential changes to applicable legislation, regulations and standards; the ability of Source to comply and unexpected costs of complying with government regulations; liabilities resulting from Source’s operations; the results of litigation or regulatory proceedings that may be brought against us; the ability of Source to successfully bid on new contracts and the loss of significant contracts; uninsured and underinsured losses; risks related to the transportation of Source’s products, including potential rail line interruptions or a reduction in rail car availability; the geographic and customer concentration of Source; the ability of Source to retain and attract qualified management and staff in the markets in which Source operates; labour disputes and work stoppages and risks related to employee health and safety; general risks associated with the oil and natural gas industry, loss of markets, consumer and business spending and borrowing trends; limited, unfavourable, or a lack of access to capital markets; uncertainties inherent in estimating quantities of mineral resources; sand processing problems; and the use and suitability of Source’s accounting estimates and judgments.
Statements relating to Mineral Resources are deemed to be forward-looking statements, as they involve the implied assessment, based on certain estimates and assumptions, that the Mineral Resources described exist in the quantities predicted or estimated and that the Mineral Resources described might be able to be profitably produced in the future.
Although Source has attempted to identify important factors that could cause actual actions, events or results to differ materially from those described in its forward-looking statements, there may be other factors that cause actions, events or results not to be as anticipated, estimated or intended. There can be no assurance that forward-looking statements will materialize or prove to be accurate, as actual results and future events could differ materially from those anticipated in such statements. The forward-looking statements contained in this presentation are expressly qualified by this cautionary statement. Readers should not place undue reliance on forward-looking statements. These statements speak only as of the date of this presentation. Except as may be required by law, Source expressly disclaims any intention or obligation to revise or update any forward-looking statements or information whether as a result of new information, future events or otherwise.
3
Presenting Executives
4
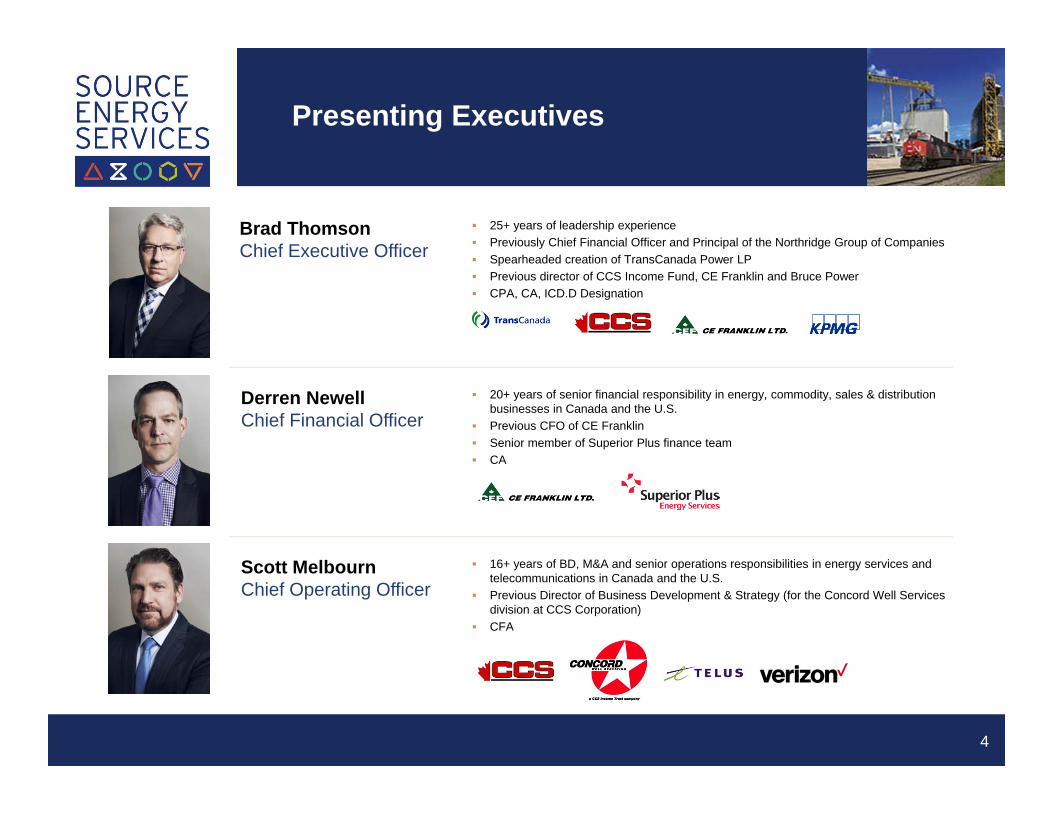
16+ years of BD, M&A and senior operations responsibilities in energy services and telecommunications in Canada and the U.S.
Previous Director of Business Development & Strategy (for the Concord Well Services division at CCS Corporation)
CFA
Scott MelbournChief Operating Officer
20+ years of senior financial responsibility in energy, commodity, sales & distribution businesses in Canada and the U.S.
Previous CFO of CE Franklin Senior member of Superior Plus finance team CA
Derren NewellChief Financial Officer
25+ years of leadership experience Previously Chief Financial Officer and Principal of the Northridge Group of Companies Spearheaded creation of TransCanada Power LP Previous director of CCS Income Fund, CE Franklin and Bruce Power CPA, CA, ICD.D Designation
Brad ThomsonChief Executive Officer
Investment Highlights
5
1, 2, 3, 4 – Slide Notes
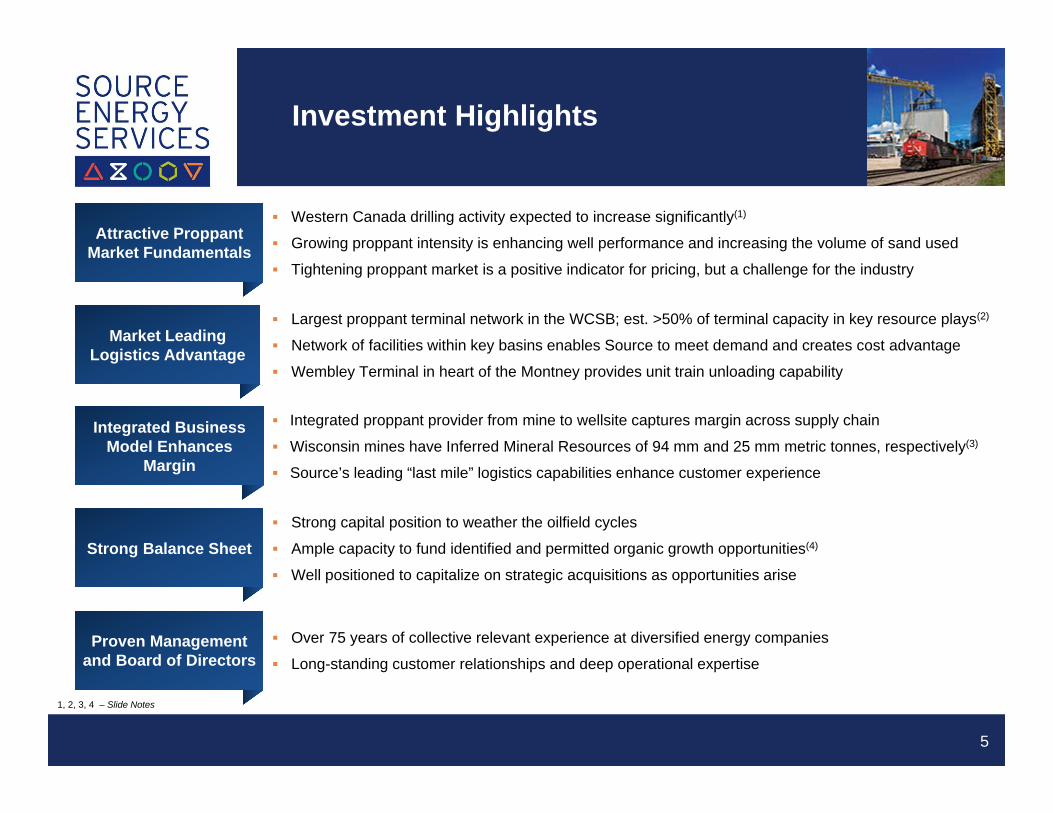
Western Canada drilling activity expected to increase significantly(1)
Growing proppant intensity is enhancing well performance and increasing the volume of sand used
Tightening proppant market is a positive indicator for pricing, but a challenge for the industry
Attractive Proppant Market Fundamentals
Integrated proppant provider from mine to wellsite captures margin across supply chain
Wisconsin mines have Inferred Mineral Resources of 94 mm and 25 mm metric tonnes, respectively(3)
Source’s leading “last mile” logistics capabilities enhance customer experience
Integrated Business Model Enhances
Margin
Over 75 years of collective relevant experience at diversified energy companies
Long-standing customer relationships and deep operational expertiseProven Management
and Board of Directors
Strong capital position to weather the oilfield cycles
Ample capacity to fund identified and permitted organic growth opportunities(4)
Well positioned to capitalize on strategic acquisitions as opportunities arise
Strong Balance Sheet
Largest proppant terminal network in the WCSB; est. >50% of terminal capacity in key resource plays(2)
Network of facilities within key basins enables Source to meet demand and creates cost advantage
Wembley Terminal in heart of the Montney provides unit train unloading capability
Market Leading Logistics Advantage
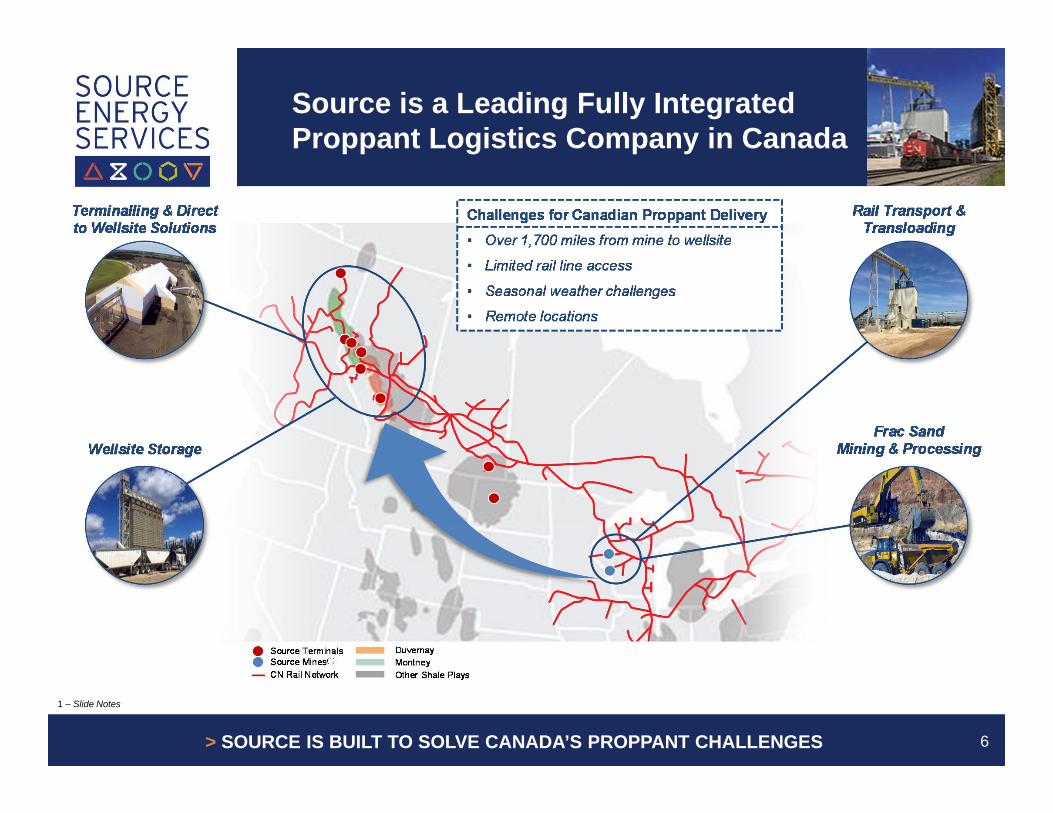
Source is a Leading Fully Integrated Proppant Logistics Company in Canada
6
1 – Slide Notes
> SOURCE IS BUILT TO SOLVE CANADA’S PROPPANT CHALLENGES
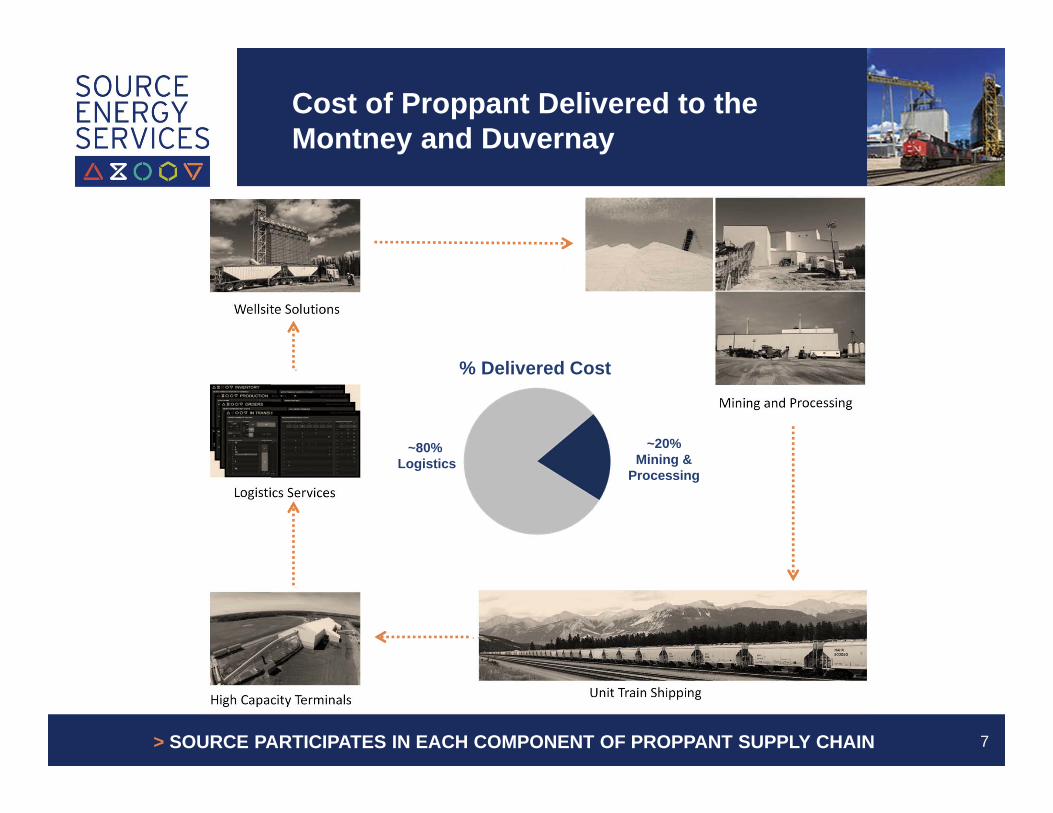
Cost of Proppant Delivered to the Montney and Duvernay
7> SOURCE PARTICIPATES IN EACH COMPONENT OF PROPPANT SUPPLY CHAIN
~80%Logistics
~20% Mining &
Processing
% Delivered Cost

Canadian Industry Challenge
1 – Slide Notes
Large scale, Northern White sand mine connected to processing and rail Enclosed, year-round plants with 54,000 metric tonnes of on-site finished
product storage(1)
Inefficient mines Seasonality impact
Processing Capabilities
Source developed the Wembley Terminal; capable of unloading a 100 car unit train in under 24 hours
Full mine to wellsite solution embeds Source with clients
Inefficient manifest rail shipping Disjointed supply chain
Rail Shipping
Owned and operated high capacity transloads Current terminal storage capacity of over 90,000 metric tonnes Advantaged terminal locations in key plays Source terminals are purpose built and operated to service the 24/7
needs of the oilfield
Capacity inadequate for large fracs Truck loading times / demurrage charges Distance to the wellsite 24/7 demand
Terminals
Sahara: Proprietary, custom mobile wellsite storage units reduce logistics issues, wait time, trucking costs and product damage
Reduces silica dust and quieter than pneumatic systems
Inefficient sand storage at wellsite Environmental and safety
Wellsite “Last Mile”
Why Do Customers Choose Source?
8
SOURCE’S ADVANTAGE
> SOURCE’S BEST-IN-CLASS PROPPANT DELIVERY ENHANCES CUSTOMER EXPERIENCE
I. Compelling Industry Fundamentals
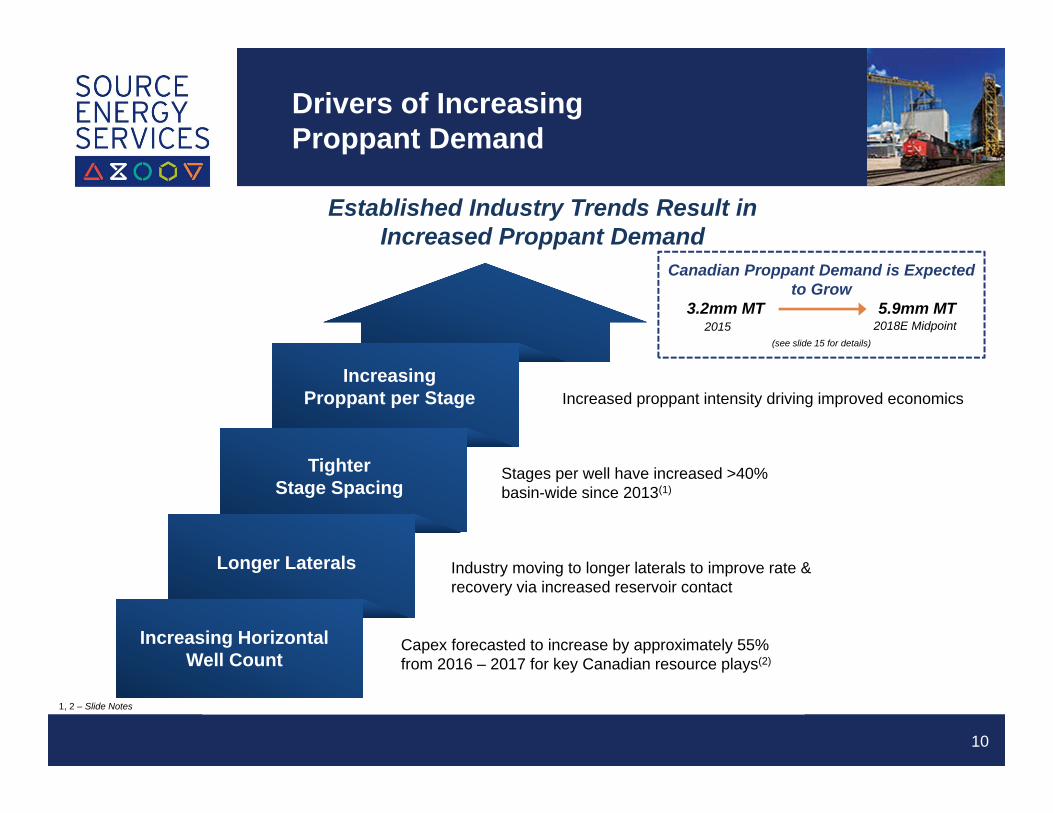
Capex forecasted to increase by approximately 55% from 2016 – 2017 for key Canadian resource plays(2)
Industry moving to longer laterals to improve rate & recovery via increased reservoir contact
Stages per well have increased >40% basin-wide since 2013(1)
Increased proppant intensity driving improved economics
Increasing Horizontal Well Count
Longer Laterals
Tighter Stage Spacing
Increasing Proppant per Stage
Drivers of Increasing Proppant Demand
10
Established Industry Trends Result in Increased Proppant Demand
1, 2 – Slide Notes
Canadian Proppant Demand is Expected to Grow
3.2mm MT 5.9mm MT
(see slide 15 for details)
2015 2018E Midpoint
Canadian Plays Compete on Rate of Return
11
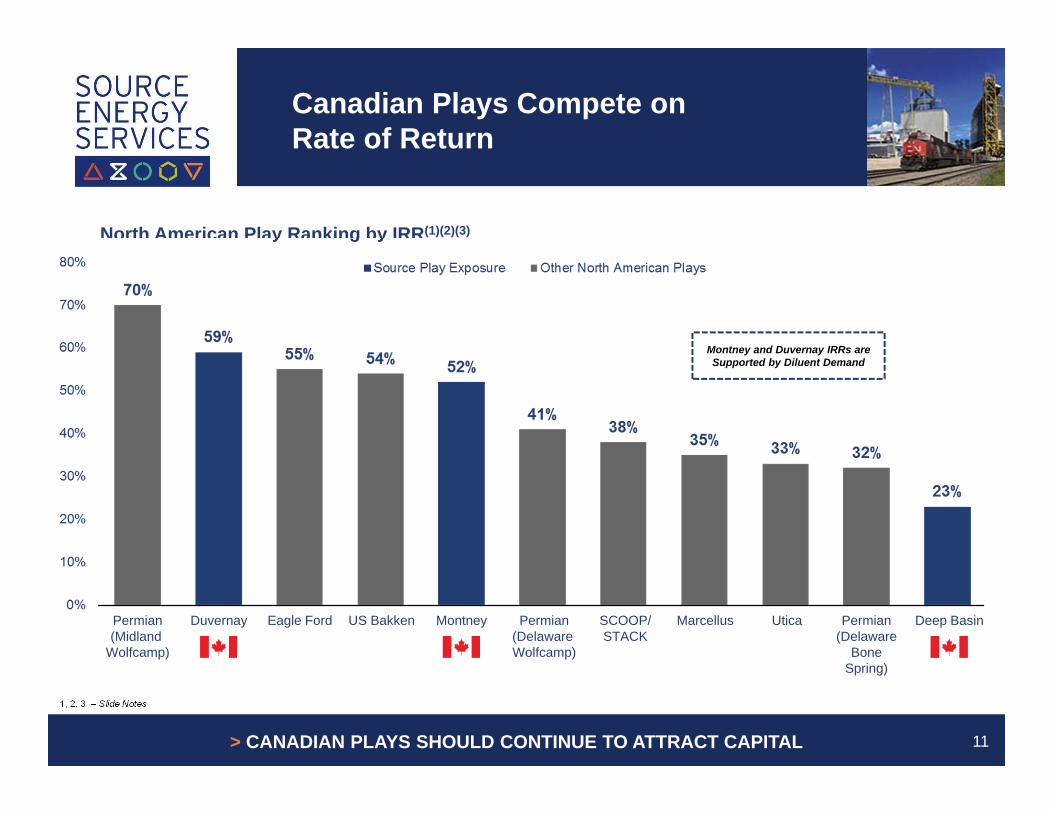
North American Play Ranking by IRR(1)(2)(3)
1, 2, 3 – Slide Notes
> CANADIAN PLAYS SHOULD CONTINUE TO ATTRACT CAPITAL
Permian(Midland
Wolfcamp)
Duvernay Eagle Ford US Bakken Montney Permian(Delaware Wolfcamp)
SCOOP/STACK
Marcellus Utica Permian(Delaware
BoneSpring)
Deep Basin
Montney and Duvernay IRRs are Supported by Diluent Demand

Diluent Demand Enhances Canadian Shale Economics
12
0.0
0.1
0.2
0.3
0.4
0.5
0.6
2016 AB Diluent Supply (C5+) 2016 AB Diluent Demand
Dilu
ent S
uppl
y / D
eman
d (m
mbb
l/d)
0.0
1.0
2.0
3.0
4.0
5.0
6.0
2013 2015 2017 2019 2021 2023 2025
Oil
& B
itum
en (m
mbb
l/d)
Crude Oil Bitumen
Alberta Diluent Supply & Demand(1)(2) Crude Oil and Bitumen Production(1)
1, 2 – Slide Notes
> CANADA IS NET SHORT DILUENT SUPPORTING ATTRACTIVE NGL PRICING
Canada is net short diluent resulting in
premium pricing
Oil sands require diluent (C5+) for
blending in order to ship to market

Key Canadian Plays are Growing
13
1,501
2,032
1,442
943
1,462
1,754
0
500
1,000
1,500
2,000
2,500
3,000
2013 2014 2015 2016 2017E 2018E
MontneyDuvernayDeep Basin
0
200,000
400,000
600,000
800,000
1,000,000
1,200,000
2008 2009 2010 2011 2012 2013 2014 2015 2016
Bar
rels
of o
il eq
uiva
lent
per
day
MontneyDuvernayDeep Basin
Canadian Production by Key Play(6)boe/d
Wells Drilled by Higher Frac Intensity Plays(1)(2)(3)(4)Number of Horizontal Wells Rig Released
Capex forecasted to increase 55% in
2017(5)
Duvernay is Emerging
1, 2, 3, 4, 5, 6 – Slide Notes
> ACTIVITY EXPECTED TO INCREASE IN KEY CANADIAN PLAYS
Increasing Proppant Intensity
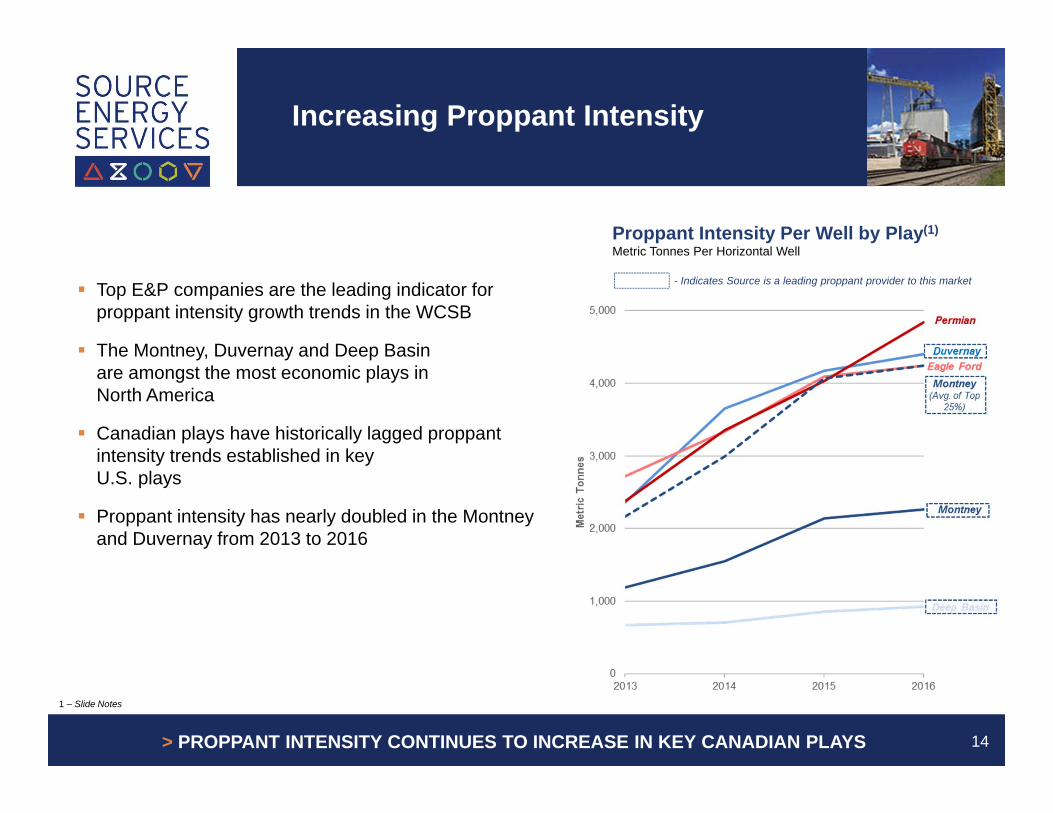
Top E&P companies are the leading indicator for proppant intensity growth trends in the WCSB
The Montney, Duvernay and Deep Basin are amongst the most economic plays in North America
Canadian plays have historically lagged proppant intensity trends established in key U.S. plays
Proppant intensity has nearly doubled in the Montneyand Duvernay from 2013 to 2016
14
1 – Slide Notes
Proppant Intensity Per Well by Play(1)Metric Tonnes Per Horizontal Well
- Indicates Source is a leading proppant provider to this market
> PROPPANT INTENSITY CONTINUES TO INCREASE IN KEY CANADIAN PLAYS
Canadian Proppant Demand is Increasing
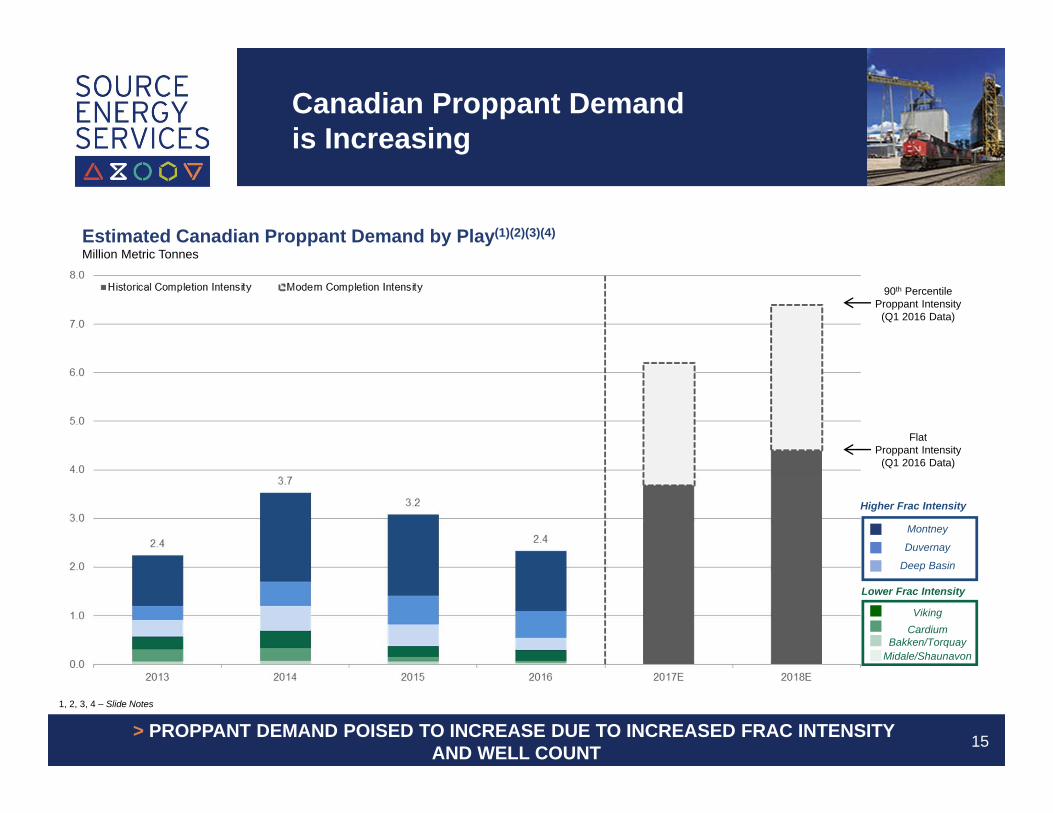
15> PROPPANT DEMAND POISED TO INCREASE DUE TO INCREASED FRAC INTENSITYAND WELL COUNT
1, 2, 3, 4 – Slide Notes
Estimated Canadian Proppant Demand by Play(1)(2)(3)(4)Million Metric Tonnes
Montney
Duvernay
Deep Basin
VikingCardium
Bakken/TorquayMidale/Shaunavon
Higher Frac Intensity
Lower Frac Intensity
90th Percentile Proppant Intensity
(Q1 2016 Data)
FlatProppant Intensity
(Q1 2016 Data)
II. Mine to Wellsite Proppant Solution
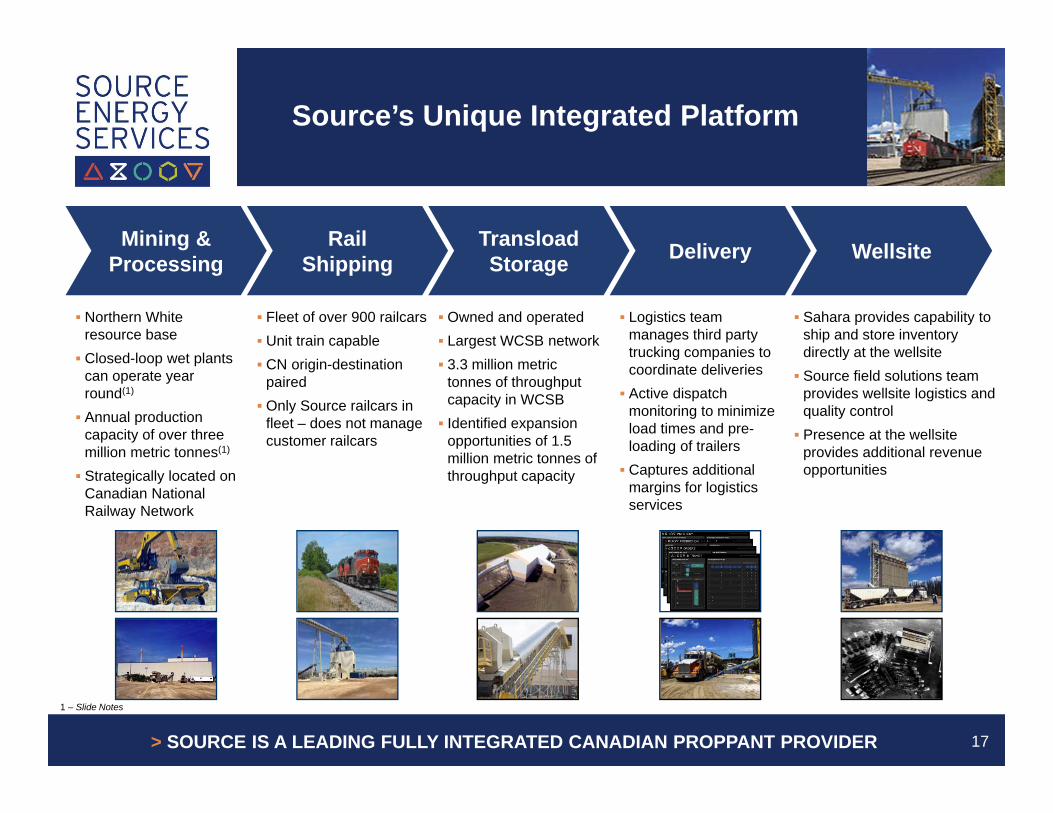
> SOURCE IS A LEADING FULLY INTEGRATED CANADIAN PROPPANT PROVIDER
Source’s Unique Integrated Platform
17
Mining & Processing
Rail Shipping
Transload Storage Delivery Wellsite
Northern White resource base Closed-loop wet plants
can operate year round(1)
Annual production capacity of over three million metric tonnes(1)
Strategically located on Canadian National Railway Network
Fleet of over 900 railcars Unit train capable CN origin-destination
paired Only Source railcars in
fleet – does not manage customer railcars
Owned and operated Largest WCSB network 3.3 million metric
tonnes of throughput capacity in WCSB Identified expansion
opportunities of 1.5 million metric tonnes of throughput capacity
Logistics team manages third party trucking companies to coordinate deliveries Active dispatch
monitoring to minimize load times and pre-loading of trailers Captures additional
margins for logistics services
Sahara provides capability to ship and store inventory directly at the wellsite Source field solutions team
provides wellsite logistics and quality control Presence at the wellsite
provides additional revenue opportunities
1 – Slide Notes
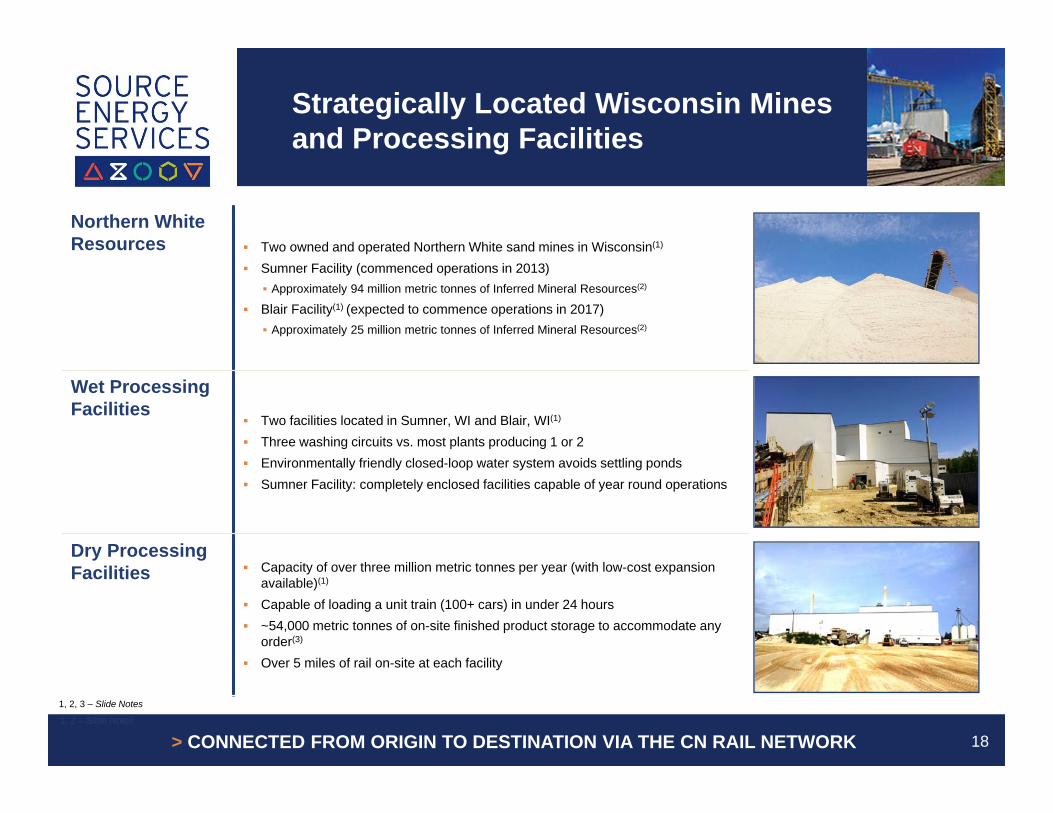
Strategically Located Wisconsin Mines and Processing Facilities
181, 2 – Slide Notes
Northern White Resources Two owned and operated Northern White sand mines in Wisconsin(1)
Sumner Facility (commenced operations in 2013) Approximately 94 million metric tonnes of Inferred Mineral Resources(2)
Blair Facility(1) (expected to commence operations in 2017) Approximately 25 million metric tonnes of Inferred Mineral Resources(2)
Wet Processing Facilities
Two facilities located in Sumner, WI and Blair, WI(1)
Three washing circuits vs. most plants producing 1 or 2 Environmentally friendly closed-loop water system avoids settling ponds Sumner Facility: completely enclosed facilities capable of year round operations
Dry Processing Facilities Capacity of over three million metric tonnes per year (with low-cost expansion
available)(1)
Capable of loading a unit train (100+ cars) in under 24 hours ~54,000 metric tonnes of on-site finished product storage to accommodate any
order(3)
Over 5 miles of rail on-site at each facility
1, 2, 3 – Slide Notes
> CONNECTED FROM ORIGIN TO DESTINATION VIA THE CN RAIL NETWORK
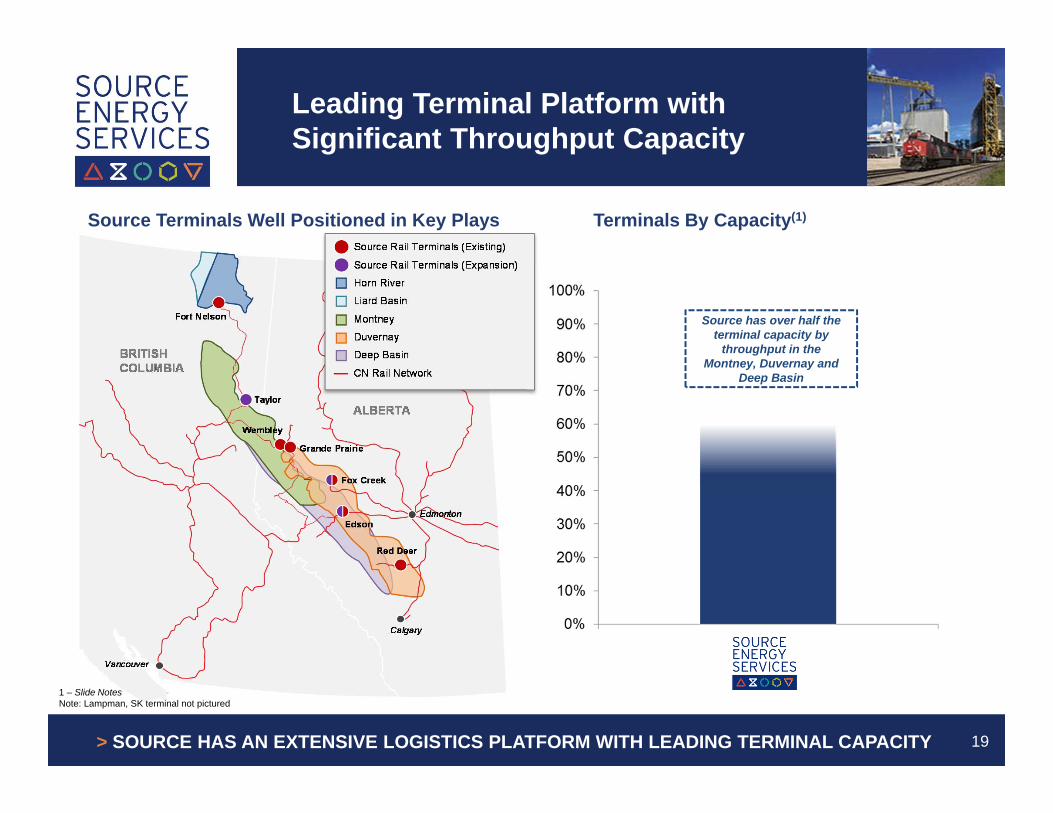
Leading Terminal Platform with Significant Throughput Capacity
19
1 – Slide NotesNote: Lampman, SK terminal not pictured
> SOURCE HAS AN EXTENSIVE LOGISTICS PLATFORM WITH LEADING TERMINAL CAPACITY
Source Terminals Well Positioned in Key Plays Terminals By Capacity(1)
Source has over half the terminal capacity by
throughput in the Montney, Duvernay and
Deep Basin
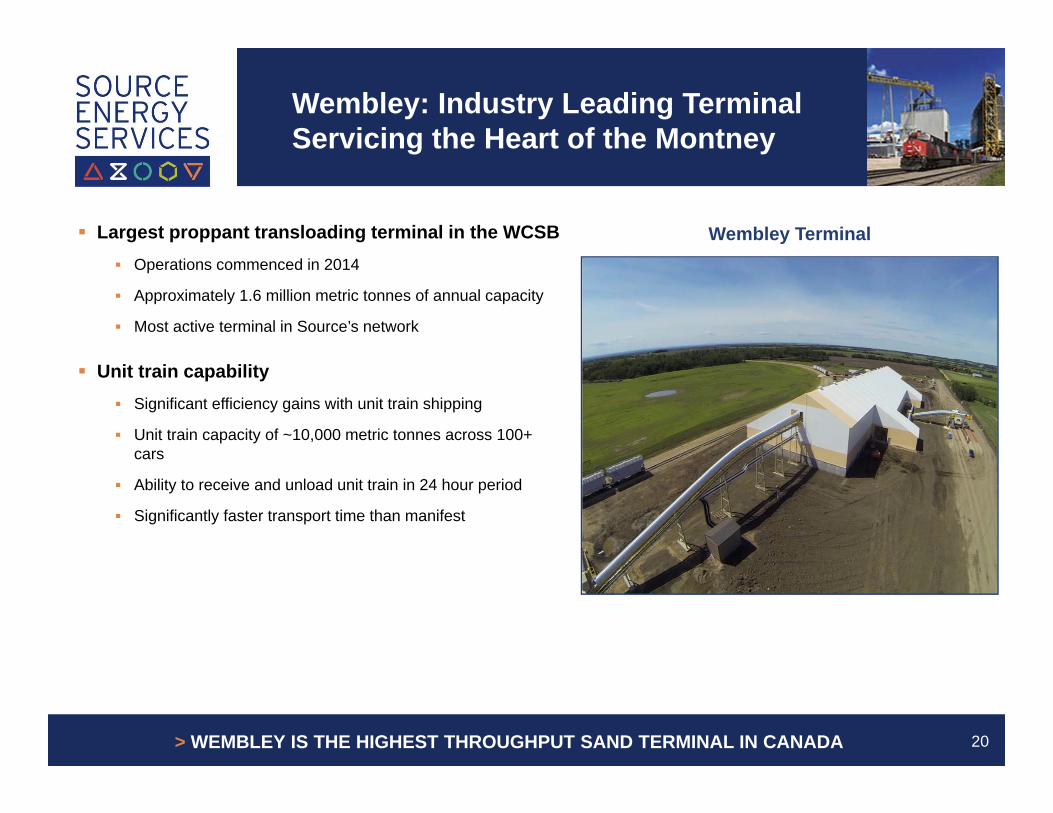
Wembley: Industry Leading Terminal Servicing the Heart of the Montney
Largest proppant transloading terminal in the WCSB Operations commenced in 2014
Approximately 1.6 million metric tonnes of annual capacity
Most active terminal in Source’s network
Unit train capability Significant efficiency gains with unit train shipping
Unit train capacity of ~10,000 metric tonnes across 100+ cars
Ability to receive and unload unit train in 24 hour period
Significantly faster transport time than manifest
> WEMBLEY IS THE HIGHEST THROUGHPUT SAND TERMINAL IN CANADA 20
Wembley Terminal
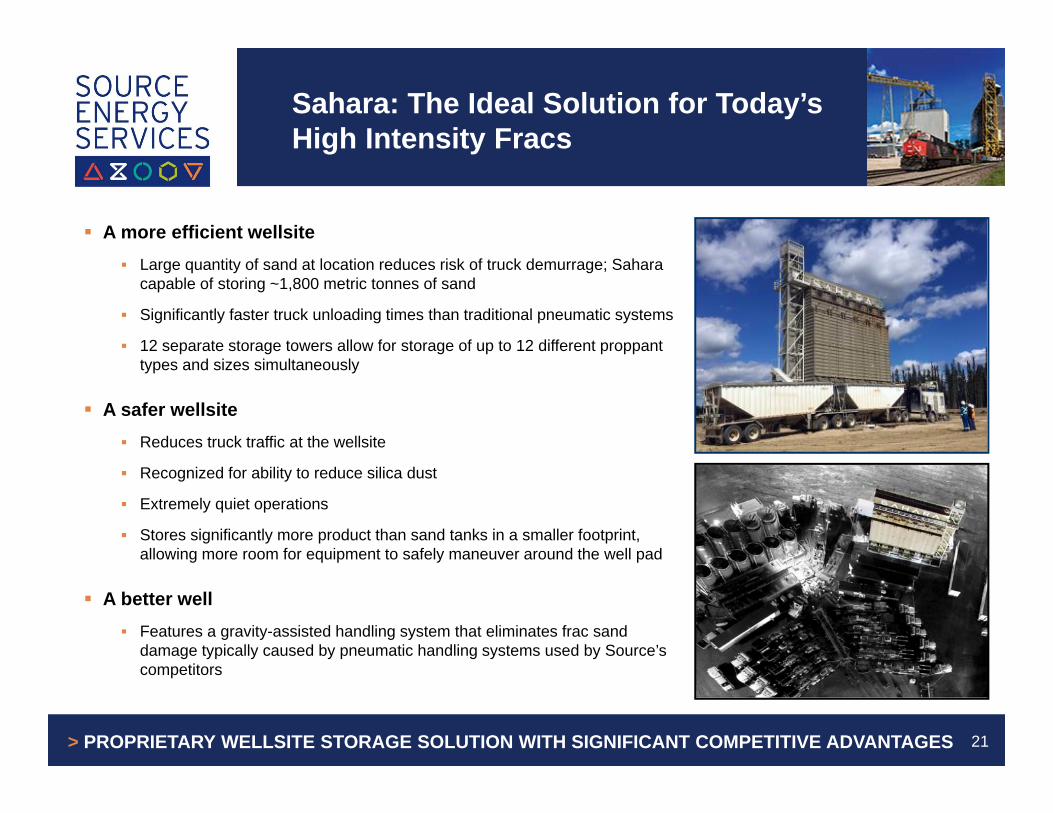
Sahara: The Ideal Solution for Today’sHigh Intensity Fracs
A more efficient wellsite Large quantity of sand at location reduces risk of truck demurrage; Sahara
capable of storing ~1,800 metric tonnes of sand
Significantly faster truck unloading times than traditional pneumatic systems
12 separate storage towers allow for storage of up to 12 different proppant types and sizes simultaneously
A safer wellsite Reduces truck traffic at the wellsite
Recognized for ability to reduce silica dust
Extremely quiet operations
Stores significantly more product than sand tanks in a smaller footprint, allowing more room for equipment to safely maneuver around the well pad
A better well Features a gravity-assisted handling system that eliminates frac sand
damage typically caused by pneumatic handling systems used by Source’s competitors
21> PROPRIETARY WELLSITE STORAGE SOLUTION WITH SIGNIFICANT COMPETITIVE ADVANTAGES
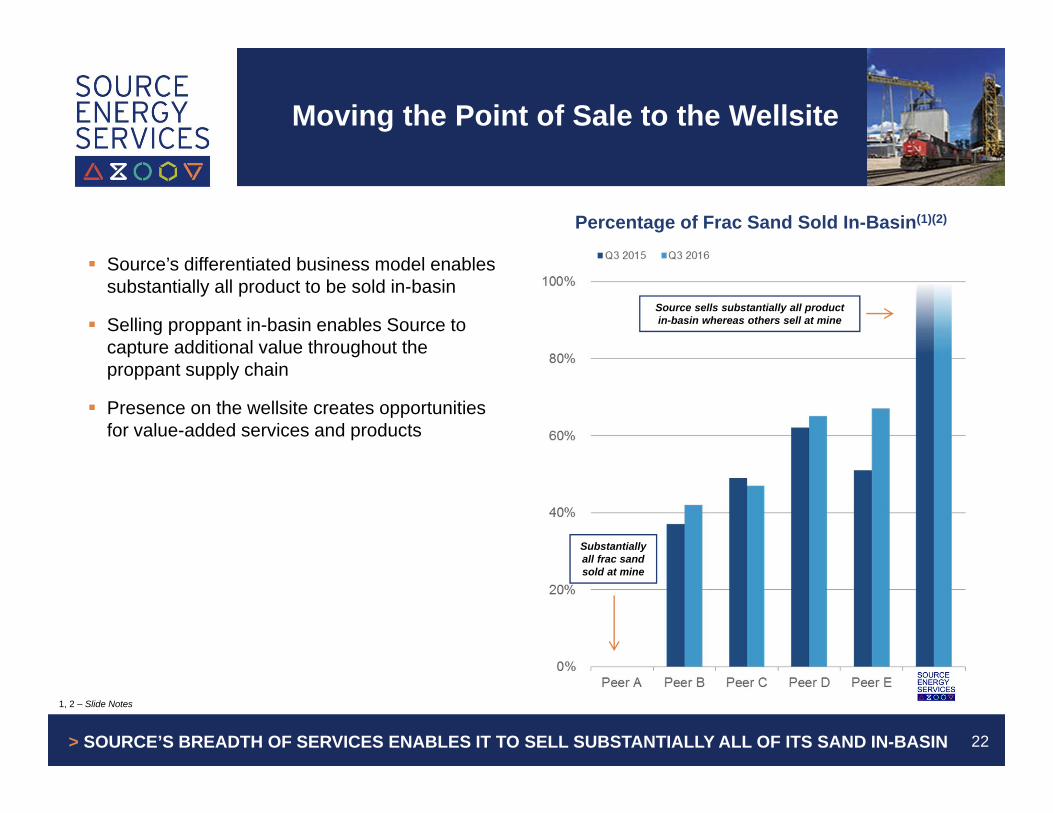
Moving the Point of Sale to the Wellsite
Source’s differentiated business model enables substantially all product to be sold in-basin
Selling proppant in-basin enables Source to capture additional value throughout the proppant supply chain
Presence on the wellsite creates opportunities for value-added services and products
Percentage of Frac Sand Sold In-Basin(1)(2)
Substantially all frac sand sold at mine
Source sells substantially all product in-basin whereas others sell at mine
> SOURCE’S BREADTH OF SERVICES ENABLES IT TO SELL SUBSTANTIALLY ALL OF ITS SAND IN-BASIN 22
1, 2 – Slide Notes
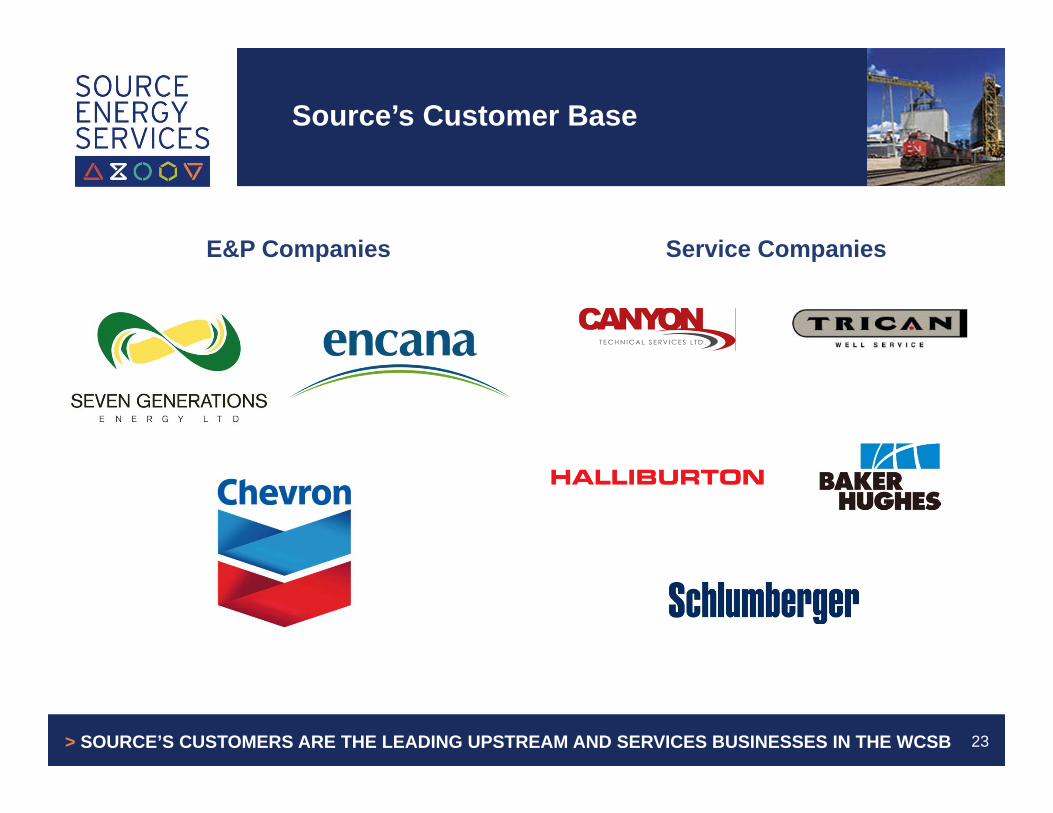
Source’s Customer Base
23> SOURCE’S CUSTOMERS ARE THE LEADING UPSTREAM AND SERVICES BUSINESSES IN THE WCSB
E&P Companies Service Companies
III. Uniquely Positioned toCapitalize on Frac Sand Growth
Uniquely Positioned to Capture Greater Market Share
25
1 – Slide Notes
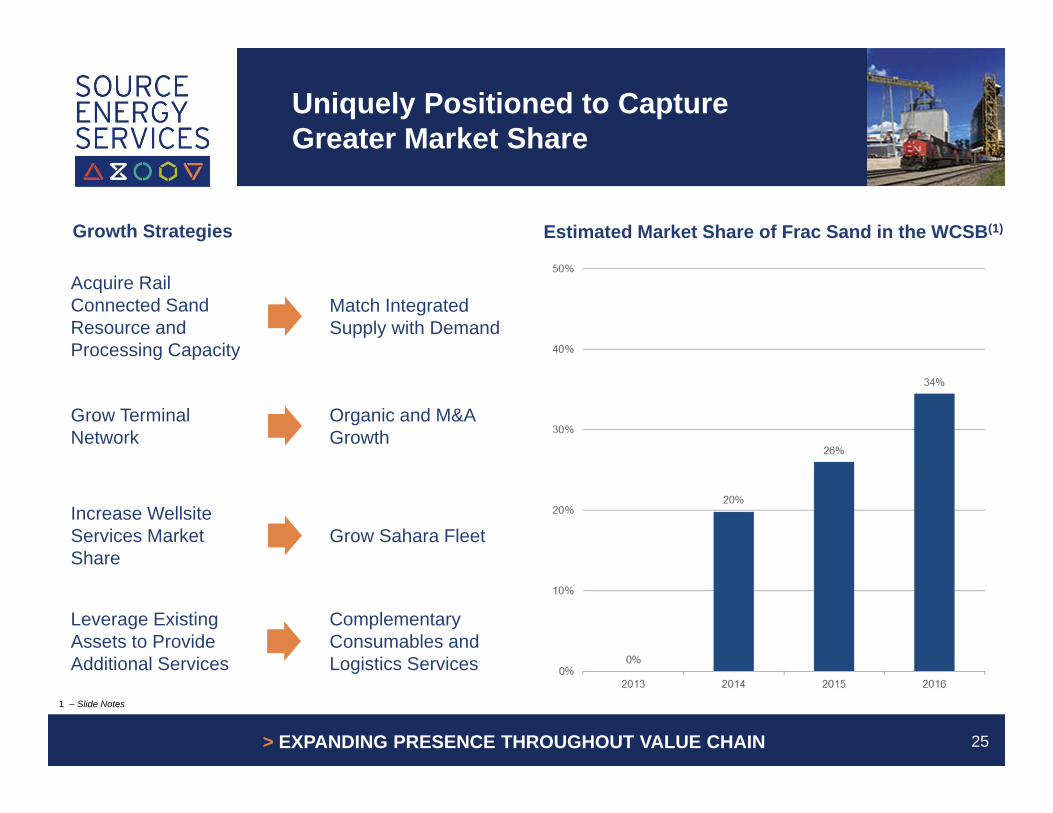
Growth Strategies Estimated Market Share of Frac Sand in the WCSB(1)
> EXPANDING PRESENCE THROUGHOUT VALUE CHAIN
Acquire Rail Connected Sand Resource and Processing Capacity
Match Integrated Supply with Demand
Grow Terminal Network
Organic and M&A Growth
Increase Wellsite Services Market Share
Grow Sahara Fleet
Leverage Existing Assets to Provide Additional Services
Complementary Consumables and Logistics Services

Matching Proppant Supply with Demand at In-Basin Terminals
Acquiring Sand Products Wisconsin, LLC Consideration of US$45 million
Source expects to complete the acquisition in connection with or immediately following Closing of the Offering
Highly Strategic Transaction Adds over one million metric tonnes per
annum of sand capacity
CN unit train capable origin is complementaryto operations
26> SIGNIFICANTLY INCREASES SOURCE’S ANNUAL PROCESSING CAPACITY
Storage & Load Out Rail & Logistics
Wet Plant Dry Plant
Premium Assets

Organic Terminal Growth in Key Plays
27> SOURCE IS GROWING ITS EXTENSIVE TERMINAL PLATFORM
Edson II Unit train capable
30,000 metric tonnes of storage
Capacity: 600,000 metric tonnes/yr
Taylor Unit train capable
Capacity: 265,000 metric tonnes/yr
Fox Creek Unit train capable
30,000 metric tonnes of storage
Capacity: 600,000 metric tonnes/yr
Source Terminals Well Positioned in Key Plays(1) New Terminal Projects
1) Lampman, SK terminal not pictured

IV. Financial Overview andOffering Summary
Select Historical Financials and 2017 Capex
29
1, 2 – Slide Notes
> DEMONSTRATED ABILITY TO GENERATE ATTRACTIVE MARGINS
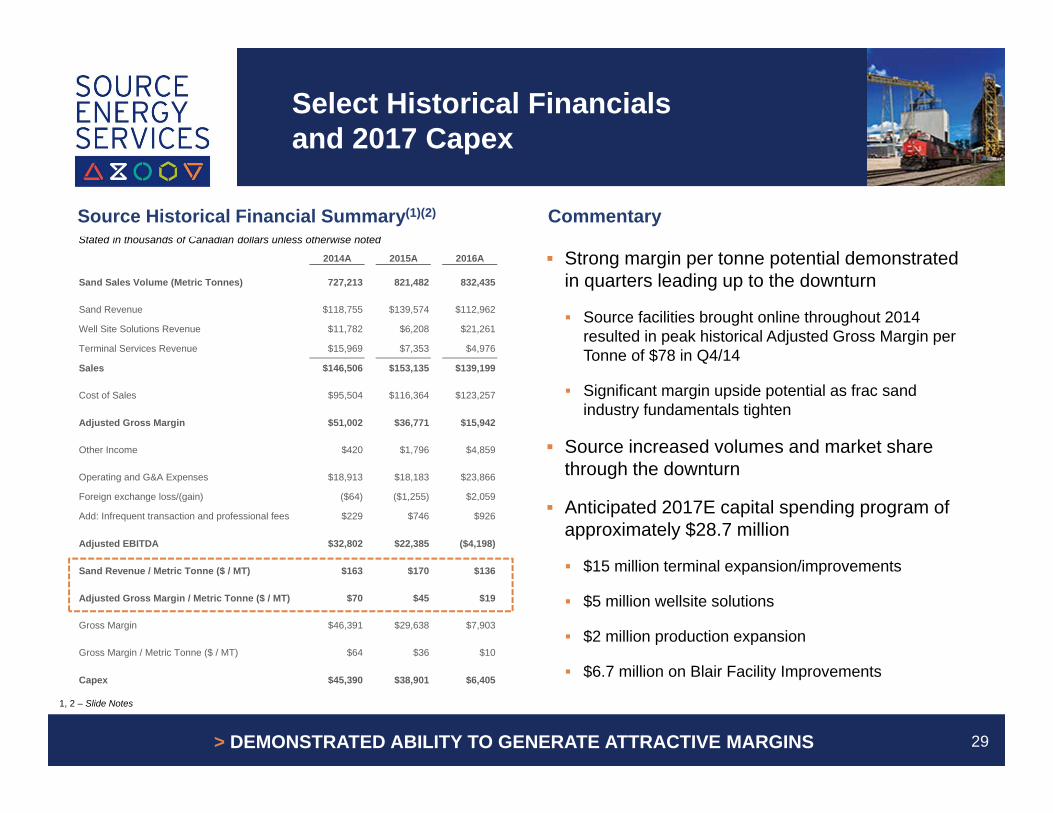
Stated in thousands of Canadian dollars unless otherwise noted
Source Historical Financial Summary(1)(2) Commentary
Strong margin per tonne potential demonstrated in quarters leading up to the downturn
Source facilities brought online throughout 2014 resulted in peak historical Adjusted Gross Margin per Tonne of $78 in Q4/14
Significant margin upside potential as frac sand industry fundamentals tighten
Source increased volumes and market share through the downturn
Anticipated 2017E capital spending program of approximately $28.7 million
$15 million terminal expansion/improvements
$5 million wellsite solutions
$2 million production expansion
$6.7 million on Blair Facility Improvements
2014A 2015A 2016A
Sand Sales Volume (Metric Tonnes) 727,213 821,482 832,435
Sand Revenue $118,755 $139,574 $112,962
Well Site Solutions Revenue $11,782 $6,208 $21,261
Terminal Services Revenue $15,969 $7,353 $4,976
Sales $146,506 $153,135 $139,199
Cost of Sales $95,504 $116,364 $123,257
Adjusted Gross Margin $51,002 $36,771 $15,942
Other Income $420 $1,796 $4,859
Operating and G&A Expenses $18,913 $18,183 $23,866
Foreign exchange loss/(gain) ($64) ($1,255) $2,059
Add: Infrequent transaction and professional fees $229 $746 $926
Adjusted EBITDA $32,802 $22,385 ($4,198)
Sand Revenue / Metric Tonne ($ / MT) $163 $170 $136
Adjusted Gross Margin / Metric Tonne ($ / MT) $70 $45 $19
Gross Margin $46,391 $29,638 $7,903
Gross Margin / Metric Tonne ($ / MT) $64 $36 $10
Capex $45,390 $38,901 $6,405

Record January Volumes
Activity levels have increased in Q1/17 consistent with customer spending plans
Source’s January volumes have increasedyear-over-year
Strong activity levels are expected to continue through the remainder of the year
30
Year-over-Year
> RECORD JANUARY VOLUMES INDICATE STRONG RECOVERY UNDERWAY
Change in Sand VolumesThousand Metric Tonnes Commentary
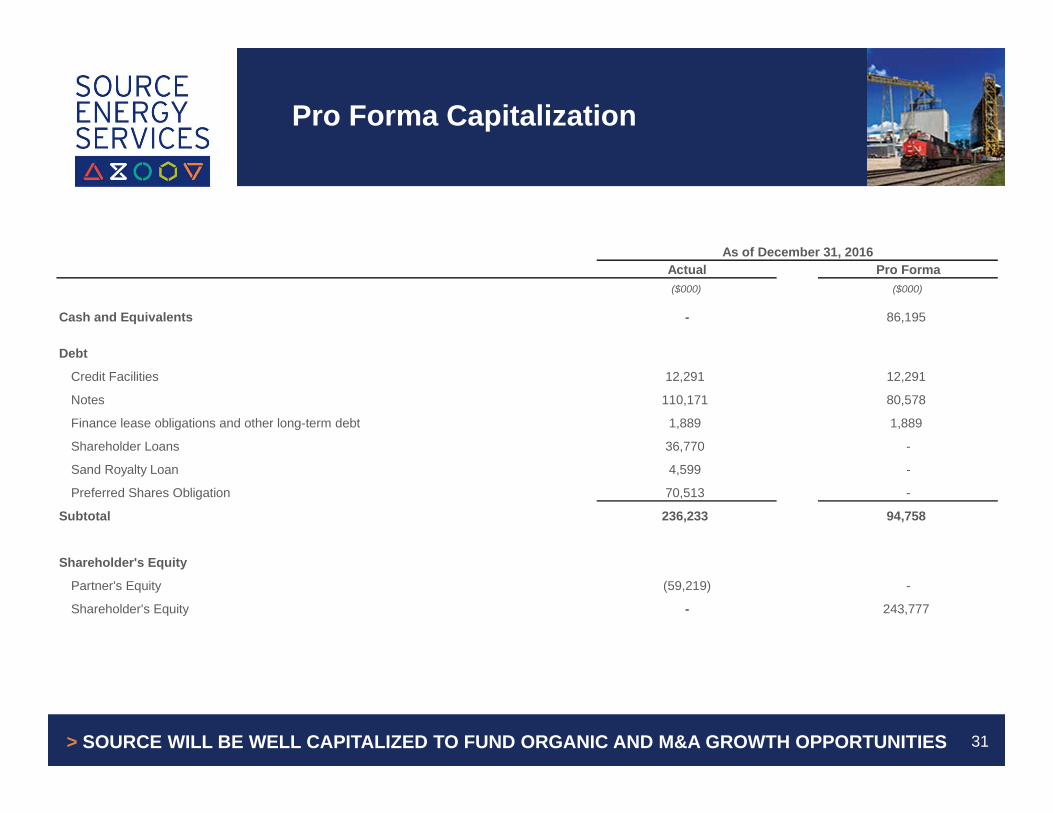
Pro Forma Capitalization
31> SOURCE WILL BE WELL CAPITALIZED TO FUND ORGANIC AND M&A GROWTH OPPORTUNITIES
As of December 31, 2016Actual Pro Forma($000) ($000)
Cash and Equivalents - 86,195
Debt
Credit Facilities 12,291 12,291
Notes 110,171 80,578
Finance lease obligations and other long-term debt 1,889 1,889
Shareholder Loans 36,770 -
Sand Royalty Loan 4,599 -
Preferred Shares Obligation 70,513 -
Subtotal 236,233 94,758
Shareholder's Equity
Partner's Equity (59,219) -
Shareholder's Equity - 243,777
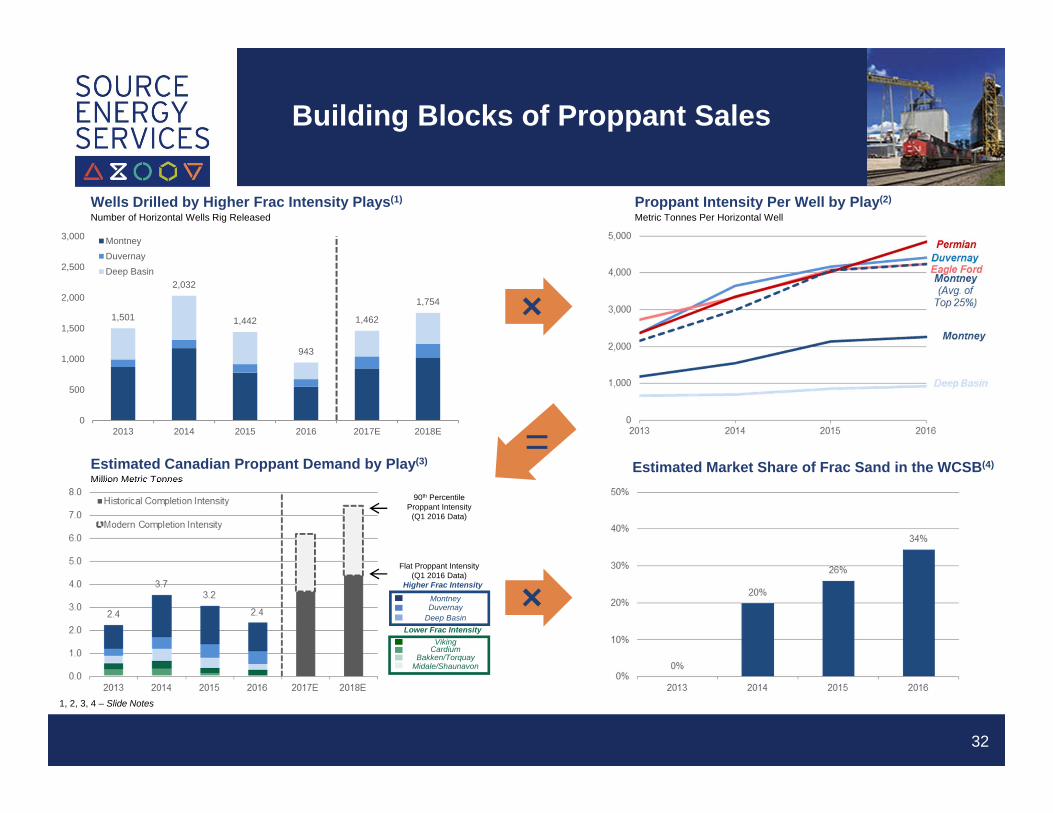
Building Blocks of Proppant Sales
32
1,501
2,032
1,442
943
1,462
1,754
0
500
1,000
1,500
2,000
2,500
3,000
2013 2014 2015 2016 2017E 2018E
MontneyDuvernayDeep Basin
Wells Drilled by Higher Frac Intensity Plays(1)
Number of Horizontal Wells Rig ReleasedProppant Intensity Per Well by Play(2)
Metric Tonnes Per Horizontal Well
Estimated Canadian Proppant Demand by Play(3)
Million Metric Tonnes
Flat Proppant Intensity(Q1 2016 Data)
MontneyDuvernay
Deep Basin
VikingCardium
Bakken/TorquayMidale/Shaunavon
Higher Frac Intensity
Lower Frac Intensity
90th Percentile Proppant Intensity
(Q1 2016 Data)
Estimated Market Share of Frac Sand in the WCSB(4)=
1, 2, 3, 4 – Slide Notes
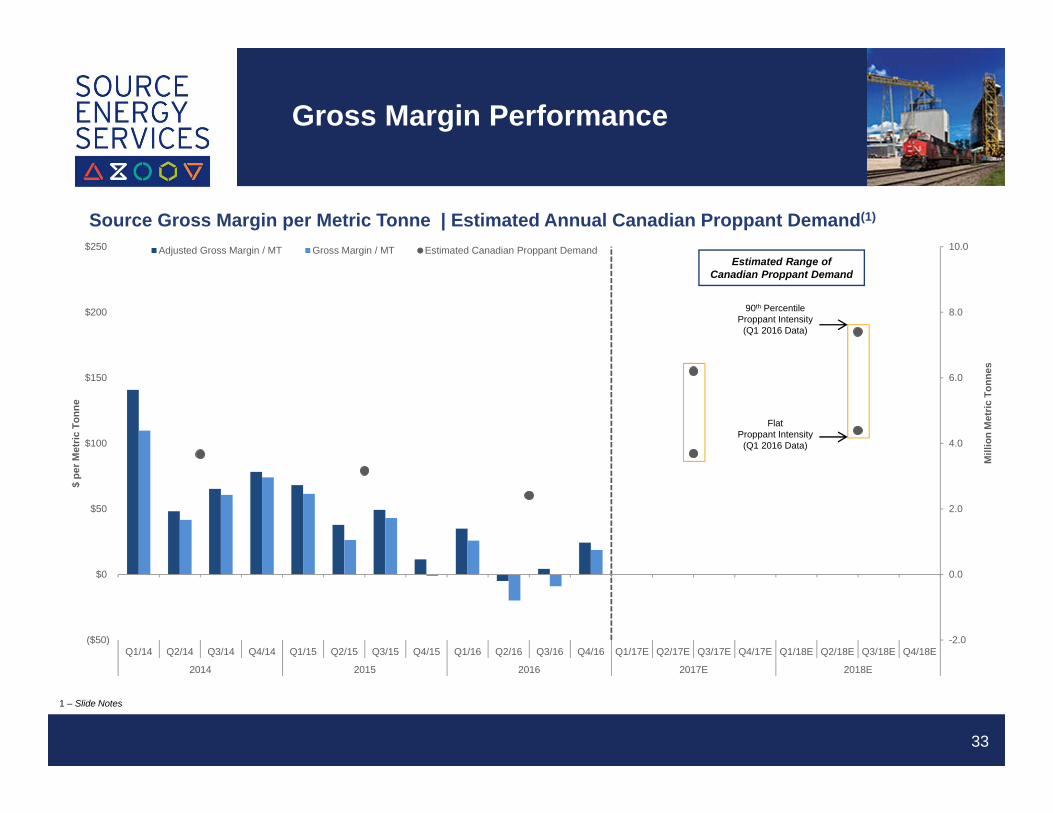
-2.0
0.0
2.0
4.0
6.0
8.0
10.0
($50)
$0
$50
$100
$150
$200
$250
Q1/14 Q2/14 Q3/14 Q4/14 Q1/15 Q2/15 Q3/15 Q4/15 Q1/16 Q2/16 Q3/16 Q4/16 Q1/17E Q2/17E Q3/17E Q4/17E Q1/18E Q2/18E Q3/18E Q4/18E
2014 2015 2016 2017E 2018E
Mill
ion
Met
ric T
onne
s
$ pe
r Met
ric T
onne
Adjusted Gross Margin / MT Gross Margin / MT Estimated Canadian Proppant Demand
Gross Margin Performance
33
Source Gross Margin per Metric Tonne | Estimated Annual Canadian Proppant Demand(1)
1 – Slide Notes
90th Percentile Proppant Intensity
(Q1 2016 Data)
FlatProppant Intensity
(Q1 2016 Data)
Estimated Range of Canadian Proppant Demand
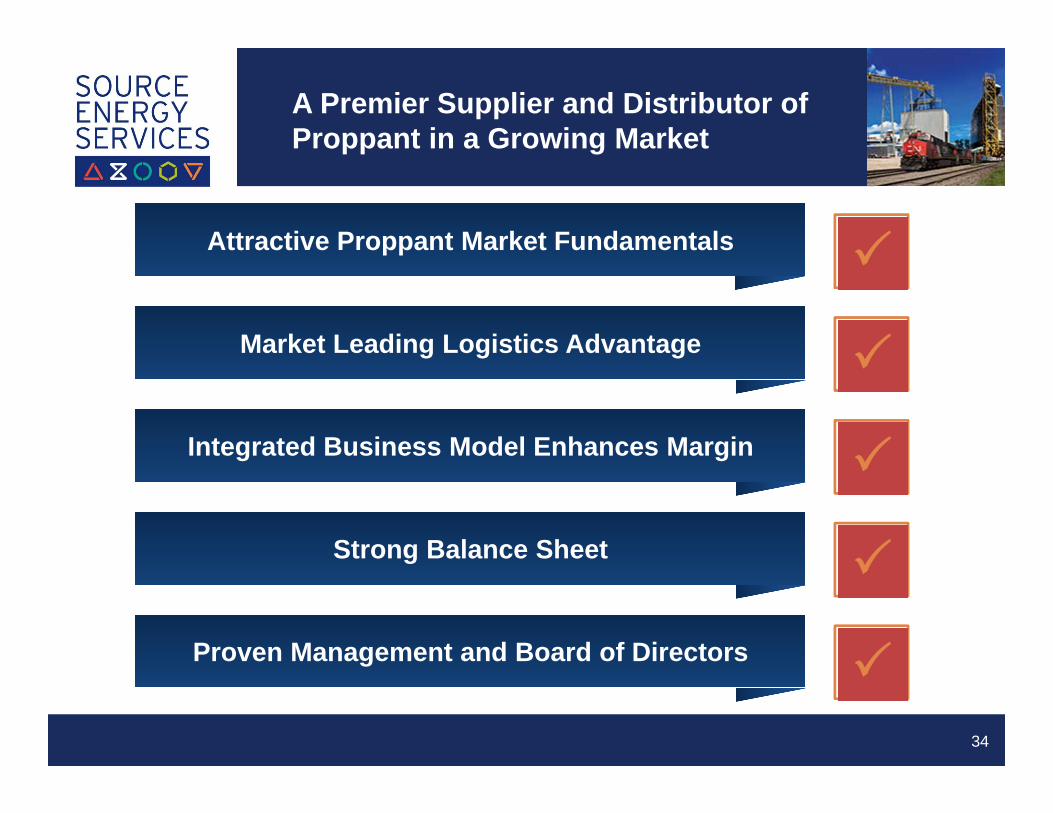
A Premier Supplier and Distributor of Proppant in a Growing Market
34
Market Leading Logistics Advantage
Strong Balance Sheet
Integrated Business Model Enhances Margin
Proven Management and Board of Directors
Attractive Proppant Market Fundamentals
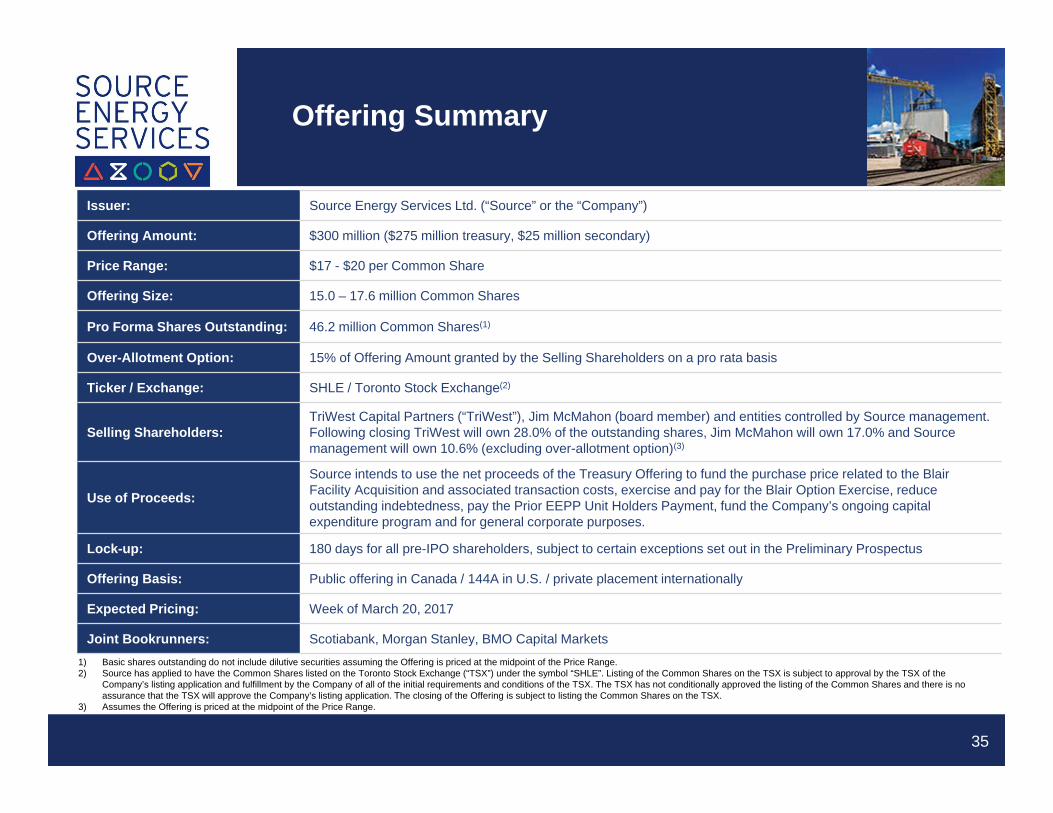
Offering Summary
35
Issuer: Source Energy Services Ltd. (“Source” or the “Company”)
Offering Amount: $300 million ($275 million treasury, $25 million secondary)
Price Range: $17 - $20 per Common Share
Offering Size: 15.0 – 17.6 million Common Shares
Pro Forma Shares Outstanding: 46.2 million Common Shares(1)
Over-Allotment Option: 15% of Offering Amount granted by the Selling Shareholders on a pro rata basis
Ticker / Exchange: SHLE / Toronto Stock Exchange(2)
Selling Shareholders:TriWest Capital Partners (“TriWest”), Jim McMahon (board member) and entities controlled by Source management. Following closing TriWest will own 28.0% of the outstanding shares, Jim McMahon will own 17.0% and Source management will own 10.6% (excluding over-allotment option)(3)
Use of Proceeds:
Source intends to use the net proceeds of the Treasury Offering to fund the purchase price related to the Blair Facility Acquisition and associated transaction costs, exercise and pay for the Blair Option Exercise, reduce outstanding indebtedness, pay the Prior EEPP Unit Holders Payment, fund the Company’s ongoing capital expenditure program and for general corporate purposes.
Lock-up: 180 days for all pre-IPO shareholders, subject to certain exceptions set out in the Preliminary Prospectus
Offering Basis: Public offering in Canada / 144A in U.S. / private placement internationally
Expected Pricing: Week of March 20, 2017
Joint Bookrunners: Scotiabank, Morgan Stanley, BMO Capital Markets 1) Basic shares outstanding do not include dilutive securities assuming the Offering is priced at the midpoint of the Price Range.2) Source has applied to have the Common Shares listed on the Toronto Stock Exchange (“TSX”) under the symbol “SHLE”. Listing of the Common Shares on the TSX is subject to approval by the TSX of the
Company’s listing application and fulfillment by the Company of all of the initial requirements and conditions of the TSX. The TSX has not conditionally approved the listing of the Common Shares and there is no assurance that the TSX will approve the Company’s listing application. The closing of the Offering is subject to listing the Common Shares on the TSX.
3) Assumes the Offering is priced at the midpoint of the Price Range.

Advisory
In accordance with Section 13.7(4) of National Instrument 41-101 – General Prospectus Requirements, all the information relating to Source’s comparables and any disclosure relating to the comparables, which is contained in the presentation to be provided to potential investors, has been removed from this template version for the purposes of its filing on the System for Electronic Document Analysis and Retrieval (SEDAR).
36
Appendix: Supporting Materials
38
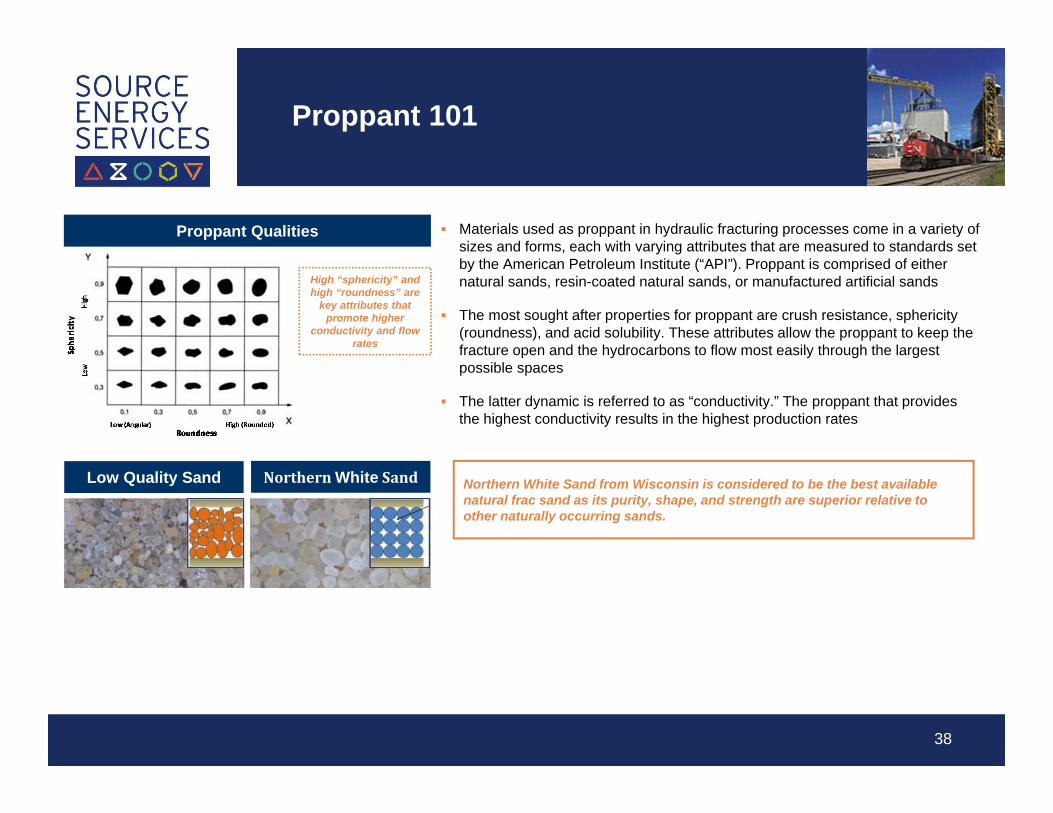
Materials used as proppant in hydraulic fracturing processes come in a variety of sizes and forms, each with varying attributes that are measured to standards set by the American Petroleum Institute (“API”). Proppant is comprised of either natural sands, resin-coated natural sands, or manufactured artificial sands
The most sought after properties for proppant are crush resistance, sphericity (roundness), and acid solubility. These attributes allow the proppant to keep the fracture open and the hydrocarbons to flow most easily through the largest possible spaces
The latter dynamic is referred to as “conductivity.” The proppant that provides the highest conductivity results in the highest production rates
Proppant Qualities
High “sphericity” and high “roundness” are
key attributes that promote higher
conductivity and flow rates
Low Quality Sand NorthernWhite Sand Northern White Sand from Wisconsin is considered to be the best available natural frac sand as its purity, shape, and strength are superior relative to other naturally occurring sands.
Proppant 101
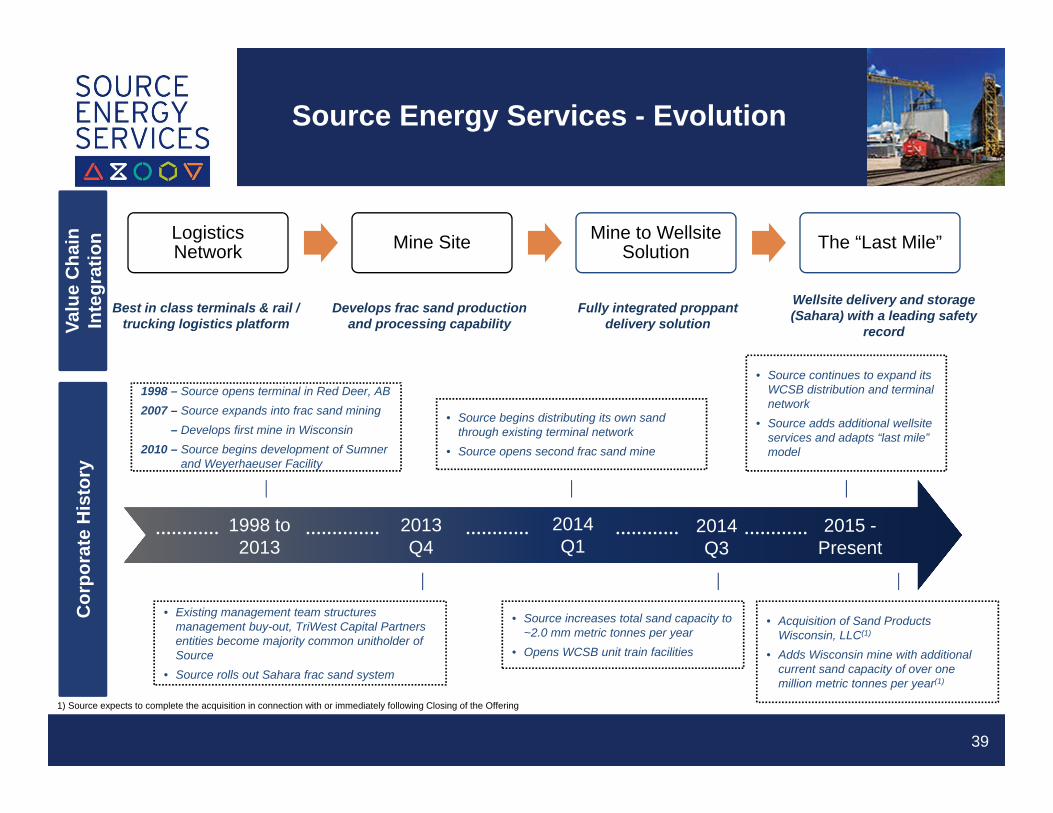
Source Energy Services - Evolution
39
1) Source expects to complete the acquisition in connection with or immediately following Closing of the Offering
2014 Q1
2014 Q3
2015 -Present
• Existing management team structures management buy-out, TriWest Capital Partners entities become majority common unitholder of Source
• Source rolls out Sahara frac sand system
• Source begins distributing its own sand through existing terminal network
• Source opens second frac sand mine
• Source increases total sand capacity to ~2.0 mm metric tonnes per year
• Opens WCSB unit train facilities
• Source continues to expand its WCSB distribution and terminal network
• Source adds additional wellsite services and adapts “last mile” model
1998 – Source opens terminal in Red Deer, AB2007 – Source expands into frac sand mining
– Develops first mine in Wisconsin2010 – Source begins development of Sumner
and Weyerhaeuser Facility
Cor
pora
te H
isto
ry
2013 Q4
1998 to 2013
• Acquisition of Sand Products Wisconsin, LLC(1)
• Adds Wisconsin mine with additional current sand capacity of over one million metric tonnes per year(1)
Valu
e C
hain
In
tegr
atio
n Logistics Network Mine Site Mine to Wellsite
Solution The “Last Mile”
Fully integrated proppant delivery solution
Wellsite delivery and storage (Sahara) with a leading safety
record
Best in class terminals & rail / trucking logistics platform
Develops frac sand production and processing capability

Management and Board
40
Brad ThomsonCEO & Director 25+ years of leadership experience Previously Chief Financial Officer and
Principal of the Northridge Group of Companies
Spearheaded creation of TransCanada Power LP (now Capital Power Corp.)
Previous director of CCS Income Fund, CE Franklin and Bruce Power
CPA, CA, ICD.D Designation
Scott Melbourn COO 16+ years of BD, M&A and senior
operations responsibilities in energy services and telecommunications in Canada and the U.S.
Previous Director of Business Development & Strategy (for the Concord Well Services division at CCS Corporation)
CFA
Joe JacksonSVP, Commercial Development 10+ years of BD and M&A
experience in energy services in Canada and the U.S.
Previously responsible for mergers and acquisitions function at CCS in the United States
CFA
Derren Newell CFO 20+ years of senior financial
responsibility in energy, commodity, sales & distribution businesses in Canada and the U.S.
Previous CFO of CE Franklin Senior member of Superior Plus
finance team CA
Cody ChurchChairman Co-founder and
Senior Managing Director, TriWest
Jeff BelfordDirector Senior Managing
Director, TriWest
Jim McMahonDirector Former Owner,
Executive Vice President, Director and Secretary of Source
Prior to joining Source, was VP Business Development for CCS (Tervita)
Marshall L. McRaeProposed Director Former CFO of
CCS Inc. Director of
Athabasca Oil Corp., Black Diamond Group Ltd. and Gibson Energy Inc.
Neil CameronProposed Director President and CEO
of NSC Minerals Ltd. a leading supplier in de-icing products in Western Canada
Stew HanlonProposed Director President, CEO
and Director of Gibson Energy Inc.
MA
NA
GEM
ENT
TEA
MB
OA
RD
OF
DIR
ECTO
RS Brad Thomson
CEO & Director See Above
> EXPERIENCED AND ALIGNED MANAGEMENT AND BOARD
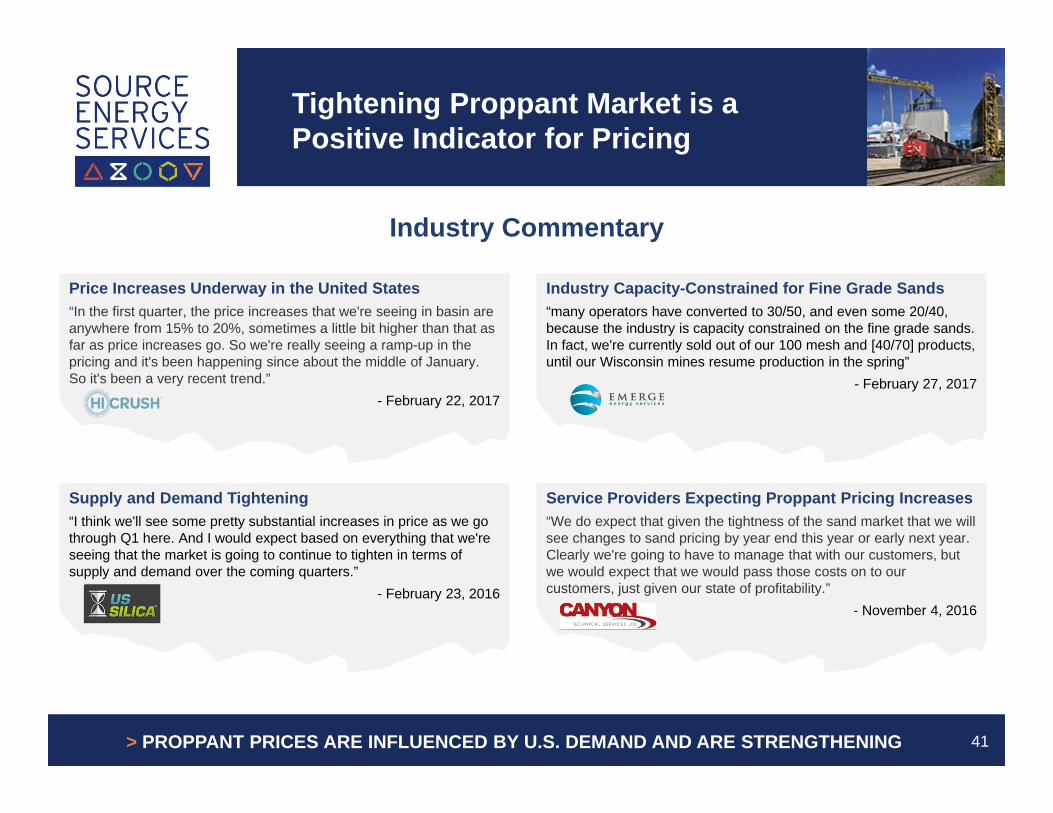
Price Increases Underway in the United States“In the first quarter, the price increases that we're seeing in basin are anywhere from 15% to 20%, sometimes a little bit higher than that as far as price increases go. So we're really seeing a ramp-up in the pricing and it's been happening since about the middle of January. So it's been a very recent trend.”
- February 22, 2017
Tightening Proppant Market is a Positive Indicator for Pricing
41
Supply and Demand Tightening“I think we'll see some pretty substantial increases in price as we go through Q1 here. And I would expect based on everything that we're seeing that the market is going to continue to tighten in terms of supply and demand over the coming quarters.”
- February 23, 2016
Industry Capacity-Constrained for Fine Grade Sands“many operators have converted to 30/50, and even some 20/40, because the industry is capacity constrained on the fine grade sands. In fact, we're currently sold out of our 100 mesh and [40/70] products, until our Wisconsin mines resume production in the spring”
- February 27, 2017
Service Providers Expecting Proppant Pricing Increases“We do expect that given the tightness of the sand market that we will see changes to sand pricing by year end this year or early next year. Clearly we're going to have to manage that with our customers, but we would expect that we would pass those costs on to our customers, just given our state of profitability.”
- November 4, 2016
> PROPPANT PRICES ARE INFLUENCED BY U.S. DEMAND AND ARE STRENGTHENING
Industry Commentary

Slide Notes
42
Slide 5 (Investment Highlights)--------------------------------------------------1) Based on the increase in the estimated average annual capital
expenditures of the Higher Frac Intensity Companies (as defined below) as estimated by Bloomberg using the consensus median capital expenditures estimate. The “Higher Frac Intensity Companies” means Advantage Oil & Gas Ltd., ARC Resources Ltd., Bellatrix Exploration Ltd., Birchcliff Energy Ltd., BonavistaEnergy Corporation, Crew Energy Inc., Encana Corporation, KeltExploration Ltd., NuVista Energy Ltd., Painted Pony Petroleum Ltd., Paramount Resources Ltd., Peyto Exploration and Development Corp., Seven Generations Energy Ltd., Tourmaline Oil Corp. and Trilogy Energy Corp.
2) Key resource plays mean the Montney, Duvernay and Deep Basin and terminal capacity is measured in terms of throughput.
3) Assumes the Blair Facility Acquisition is completed and according to the Sumner APEX Report and the Blair APEX Report.
4) Assumes completion of the Offering.Slide 6 (Source is a Leading Fully Integrated…)----------------------------1) Assumes completion of the Blair Facility Acquisition.Slide 8 (Why do Customers Choose Source?)------------------------------1) On-site sand storage assumes the Blair Facility Acquisition is
completed which adds approximately 9,000 metric tonnes to Source’s existing storage capacity of approximately 45,000 metric tonnes.
Slide 10 (Drivers of Increasing Proppant Demand)------------------------1) Increase in fracture stages per well calculated as the average
number of fracture stages pumped per well in Q1 2016 divided by the average number of fracture stages pumped per well in 2013, based on data provided by the Well Completions & Frac Database.
2) Based on the increase in the estimated average annual capital expenditures of the Higher Frac Intensity Companies as estimated by Bloomberg using the consensus median capital expenditures estimate.
Slide 11 (Canadian Plays Compete on Rate of Return)-------------------1) The figure reflects estimates of internal rate of return for a single
well in each respective play.2) Data provided via Wood Mackenzie Global Economic Model
(GEM) as accessed on February 7, 2017. Pre-tax IRR using the Wood Mackenzie BASE price scenario (as described below) based on the following sub-plays:
a) Permian (Midland Wolfcamp) indicates the Wood Mackenzie defined sub-play ZS_Type Well MIDWolfcamp Deep Basin Hz SHO TX State;
b) Duvernay indicates the Wood Mackenzie defined sub-play ZS_Type Well Duvernay Kaybob AB;
c) Eagle Ford indicates the Wood Mackenzie defined sub-play ZS_Type Well GFC Eagle Ford Karnes Trough SHG TX Fee;
d) US Bakken indicates the Wood Mackenzie defined sub-play ZS_Type Well WLN Bakken Fort Berthold HzSHO ND Fee;
e) Montney indicates the Wood Mackenzie defined sub-play ZS_Type Well Montney Karr Resthaven AB;
f) Permian (Delaware Wolfcamp) indicates the Wood Mackenzie defined sub-play ZS_Type Well DELWolfcamp Reeves Core Hz SHO TX Fee;
g) SCOOP/STACK indicates the Wood Mackenzie defined sub-play ZS_Type Well ADK STACK OilMississippian Hz SHO OK Fee;
h) Marcellus indicates the Wood Mackenzie defined sub-play ZS_Type Well APP Marcellus Susquehanna CoreHz SHG PA Fee;
i) Utica indicates the Wood Mackenzie defined sub-play ZS_Type Well APP Utica Lean Gas Core Choked HzSHG OH Fee;
j) Permian (Delaware Bone Spring) indicates the Wood Mackenzie defined sub-play ZS_Type Well DEL BoneSpring Western Fairway Hz SHO NM Fee; and
k) Deep Basin indicates the Wood Mackenzie defined sub-play ZS_Type Well Deep Basin Glauconite AB
3) The Wood Mackenzie BASE price scenario assumed the following price and forecasts:
a) WTI (US$/bbl): $49.00, $51.00, $61.48, $71.98 for 2017, 2018, 2019, and 2020, grown at 2% annuallythereafter; and
b) Henry Hub (US$/Mcf): $3.19, $3.08, $3.36, $3.62 for 2017, 2018, 2019, and 2020, respectively, grown at 2% annually thereafter.
Slide 12 (Diluent Demand Enhances Canadian Shale Economics)---1) Alberta Energy Regulator ST98-2016: Alberta’s Energy Reserves
2015 and Supply/Demand Outlook 2016-2025; as of January 25, 2017.
2) C5+ satisfies the majority of diluent demand in Alberta.Slide 13 (Key Canadian Plays are Growing)----------------------------------1) Historical number of horizontal wells drilled by play is based on
data provided by geoSCOUT.2) The number of wells forecast to be drilled in each of the Montney,
Deep Basin and Duvernay plays identified above for 2017E and 2018E (the “Higher Frac Intensity Well Count Forecast” for each such play) is calculated as the product of (A) the estimated average annual capital expenditures by the Higher Frac Intensity Companies, expressed as a percentage of average annual capital expenditures by the Higher Frac Intensity Companies in the previous year, as estimated by Bloomberg using the consensus median capital expenditures estimate, multiplied by (B) the number of wells drilled in that play in the previous year. This forecast is based on the assumption that the “Higher FracIntensity Companies” means those companies included in the definition in Note 1 to Slide 5.
3) Although Source believes the above assumptions and forecasts to be reasonable, there can be no assurance that these assumptions and forecasts are accurate, and, as such, undue reliance should not be placed thereon. See “Forward-Looking Statements” and “Risk Factors” in the preliminary prospectus.
4) The forecast set out in note 2) above is based on the assumption that an increase in producers’ overall capital expenditures will yield a proportional increase in the numbers of wells drilled. However, the actual increase in wells drilled could differ from the increase in capital expenditures in the event of a relatively greater increase in non-drilling capital expenditures, such as facility construction or maintenance.
5) Based on the increase in the estimated average annual capital expenditures of the Higher Frac Intensity Companies as estimated by Bloomberg using the consensus median capital expenditures estimate.
6) Production history by play is based on data provided by geoSCOUT.

Slide Notes
43
Slide 14 (Increasing Proppant Intensity)--------------------------------------1) Proppant intensity per well in Canadian plays defined as the
average amount of proppant pumped per well, by play, in the indicated year based on data provided by the Well Completions & Frac Database with the exception of 2016 which uses data for the first quarter of 2016 to calculate proppant intensity due to more complete data. Proppant intensity per well in U.S. plays defined as the average amount of proppant pumped per well, by play, in the indicated year based on data provided from DrillingInfo. Eagle Ford data is as of December 28, 2016 and Permian data is as of January 18, 2017.
Slide 15 (Canadian Proppant Demand is Increasing)---------------------1) The number of wells forecast to be drilled in each of the Lower
Frac Intensity plays identified above for 2017E and 2018E (the “Lower Frac Intensity Well Count Forecast” for each such play) is calculated as the product of (a) the estimated average annual capital expenditures by the Lower Frac Intensity Companies (defined below), expressed as a percentage of annual capital expenditures by the Lower Frac Intensity Companies in the previous year, as estimated by Bloomberg using the consensus median estimate, multiplied by (b) the number of wells drilled in that play in the previous year. The “Lower Frac Intensity Companies” means Bonterra Energy Corp., Cardinal Energy Ltd.,Crescent Point Energy Corp., Penn West Petroleum Ltd., Raging River Exploration Inc., Surge Energy Inc., Tamarack Valley Energy Ltd., TORC Oil & Gas Ltd., Vermilion Resources Ltd. and Whitecap Resources Inc.
2) The demand for proppant from 2013 to 2016 is estimated by multiplying the historical number of wells drilled based on data provided by geoSCOUT in each play by the average amount of proppant pumped per well, by play, in the indicated year with the exception of 2016 which uses data for the first quarter of 2016 to calculate proppant intensity due to more complete data (based on data provided by the Well Completions & Frac Database).
3) The potential range of aggregate demand for proppant in the Higher Frac Intensity plays and Lower Frac Intensity plays identified above for 2017E and 2018E is calculated as the sum, for each such play, of the product of (A) the relevant Higher FracIntensity Well Count Forecast or Lower Frac Intensity Well Count Forecast, as applicable, for the relevant play multiplied by (B) Historical Completion Intensity for such play (as defined below) (shown as “Flat Proppant Intensity” in the slide exhibit) and by Modern Completion Intensity for such play (as defined below) (shown as “90th Percentile Proppant Intensity” in the slide exhibit). Proppant per well forecast by play assuming “HistoricalCompletion Intensity” means the amount of frac sand utilized as proppant pumped per well that is equal to the level for an average well in the first quarter of 2016 for the indicated play; and proppant per well forecast by play assuming “Modern Completion Intensity” means the amount of frac sand utilized as proppant pumped per well that is equal to the level for a well in the 90th percentile in the first quarter of 2016 for the indicated play, in each case based on data provided by the Well Completions & FracDatabase.
4) Although Source believes the above assumptions and forecasts to be reasonable, there can be no assurance that these assumptions and forecasts are accurate, and, as such, undue reliance should not be placed thereon. See “Forward-Looking Statements” and “Risk Factors” in the preliminary prospectus.
Slide 17 (Source’s Unique Integrated Platform)-----------------------------1) Assumes the Blair Facility Acquisition is completed.Slide 18 (Strategically Located Wisconsin Mines….)---------------------1) Assumes the Blair Facility Acquisition is completed.2) According to the Sumner APEX Report and the Blair APEX
Report.3) On-site sand storage assumes the Blair Facility Acquisition is
completed which adds approximately 9,000 metric tonnes to Source’s existing storage capacity of approximately 45,000 metric tonnes.
Slide 19 (Leading Terminal Platform with Significant)--------------------1) Management Estimates.Slide 22 (Moving the Point of Sale to the Wellsite)------------------------1) Peers include Emerge Energy Services LP, Fairmount Santrol
Holdings Inc., Hi-Crush Partners LP, Smart Sand, Inc. and U.S. Silica Holdings Inc.
2) In-basin sales and percentages derived from the related issuers’ public filings available from the Electronic Data Gathering, Analysis and Retrieval system maintained by the United States Securities and Exchange Commission and the Fairmount SantrolHoldings Inc. Investor Presentation dated December 2016.
Slide 25 (Uniquely Positioned to Capture Greater Market Share)-----1) Estimated market share of the total frac sand market in the WCSB
is based on Source’s historical sand sales volumes in metric tonnes divided by the total market for sand estimated as follows: historical well count by play, based on data provided by geoSCOUT and the Well Completions & Frac Database, multiplied by the average amount of proppant pumped per well, by play, in the indicated year based on data provided by the Well Completions & Frac Database with the exception of 2016, which uses data for the first quarter of 2016 to calculate proppant intensity due to more complete data.
Slide 29 (Select Historical Financials and 2017 Capex)------------------1) Cost of Sales excludes depreciation.2) See “IFRS and Non-IFRS Measures” in the preliminary
prospectus.Slide 32 (Building Blocks of Proppant Sales)--------------------------------1) See notes 1, 2, 3 and 4 to Slide 13 .2) See Note 1 to Slide 14.3) See Notes 1, 2, 3, and 4 to Slide 15.4) See Note 1 to Slide 25.Slide 33 (Gross Margin Performance)----------------------------1) See Notes 1, 2, 3, and 4 to Slide 15.