March 2012 Roadshow Presentation
35
March 2012 Roadshow Presentation
Transcript of March 2012 Roadshow Presentation

March 2012 Roadshow Presentation
The information contained in this document is confidential and proprietary to YOOX Group SLIDE 2
DISCLAIMER
This presentation has been prepared by YOOX S.p.A. for information purposes only and for use in presentations of the Group’s results and
strategies.
For further details on the YOOX Group, reference should be made to publicly available information.
Statements contained in this presentation, particularly the ones regarding any possible or assumed future performance of the Group, are or may be
forward looking statements, and in this respect, may involve some risks and uncertainties.
Any reference to past performance of the YOOX Group shall not be taken as an indication of future performance.
This document does not constitute an offer or invitation to purchase or subscribe for any shares and no part of it shall form the basis of or be relied
upon in connection with any contract or commitment whatsoever.
By attending the presentation you agree to be bound by the foregoing terms.

The information contained in this document is confidential and proprietary to YOOX Group SLIDE 3
TABLE OF CONTENTS
INTRODUCTION TO YOOX GROUP
LATEST BUSINESS DEVELOPMENTS
FY 2011 FINANCIAL ANALYSIS
UPDATE ON STRATEGIC GUIDELINES
APPENDIX

The information contained in this document is confidential and proprietary to YOOX Group SLIDE 4
YOOX GROUP, ESTABLISHED IN 2000
The Global Internet Retailing Partner
for the Leading Fashion & Design Brands
The information contained in this document is confidential and proprietary to YOOX Group SLIDE 5
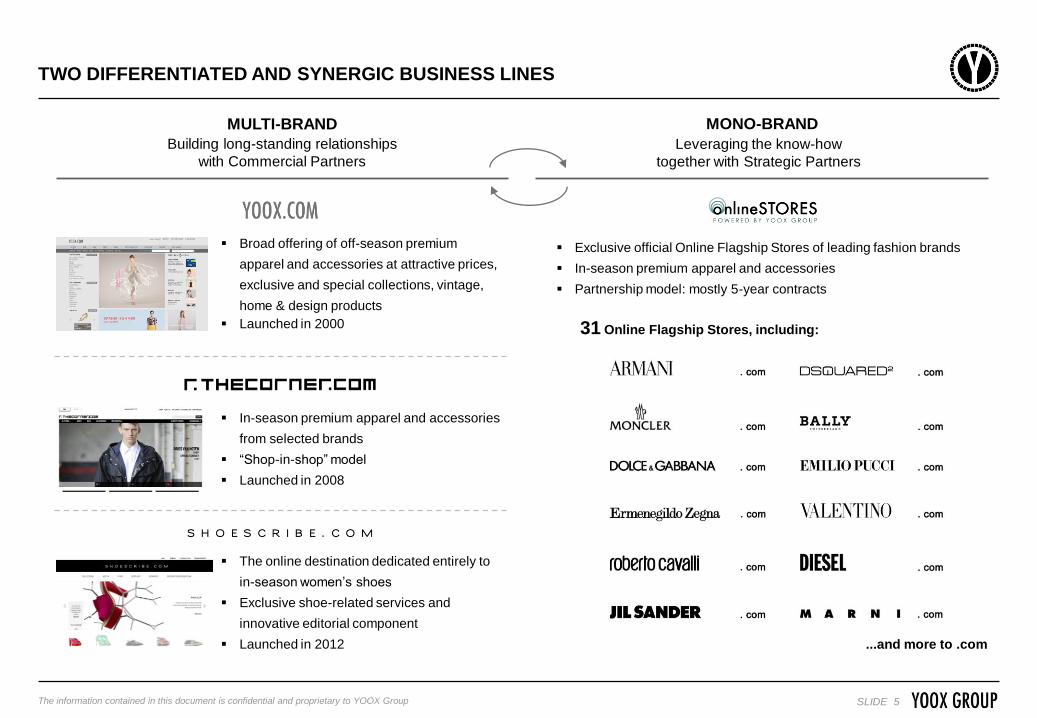
TWO DIFFERENTIATED AND SYNERGIC BUSINESS LINES
MULTI-BRAND
Exclusive official Online Flagship Stores of leading fashion brands
In-season premium apparel and accessories
Partnership model: mostly 5-year contracts
...and more to .com
31 Online Flagship Stores, including:
MONO-BRAND
Building long-standing relationships
with Commercial Partners
Leveraging the know-how
together with Strategic Partners
Broad offering of off-season premium
apparel and accessories at attractive prices,
exclusive and special collections, vintage,
home & design products
Launched in 2000
In-season premium apparel and accessories
from selected brands
“Shop-in-shop” model
Launched in 2008
The online destination dedicated entirely to
in-season women’s shoes
Exclusive shoe-related services and
innovative editorial component
Launched in 2012

The information contained in this document is confidential and proprietary to YOOX Group SLIDE 6
STRONG TRACK RECORD OF GROWTH FUELLED BY BUSINESS INNOVATION
Launch of yoox.com
International expansion
Launch of Online Stores Powered by YOOX Group
Broadening of multi-brand offering
Note: YOOX Group Annual Reports, Italian GAAP 2000-2006, IFRS 2007-2011 results
2000 2001 2002 2003 2004 2005 2006 2007 2008 2009 2010 2011
Multi-brand Net Revenues (€m) Mono-brand Net Revenues (€m)
49.3
68.8
101.5
152.2
214.3
291.2
The information contained in this document is confidential and proprietary to YOOX Group SLIDE 7
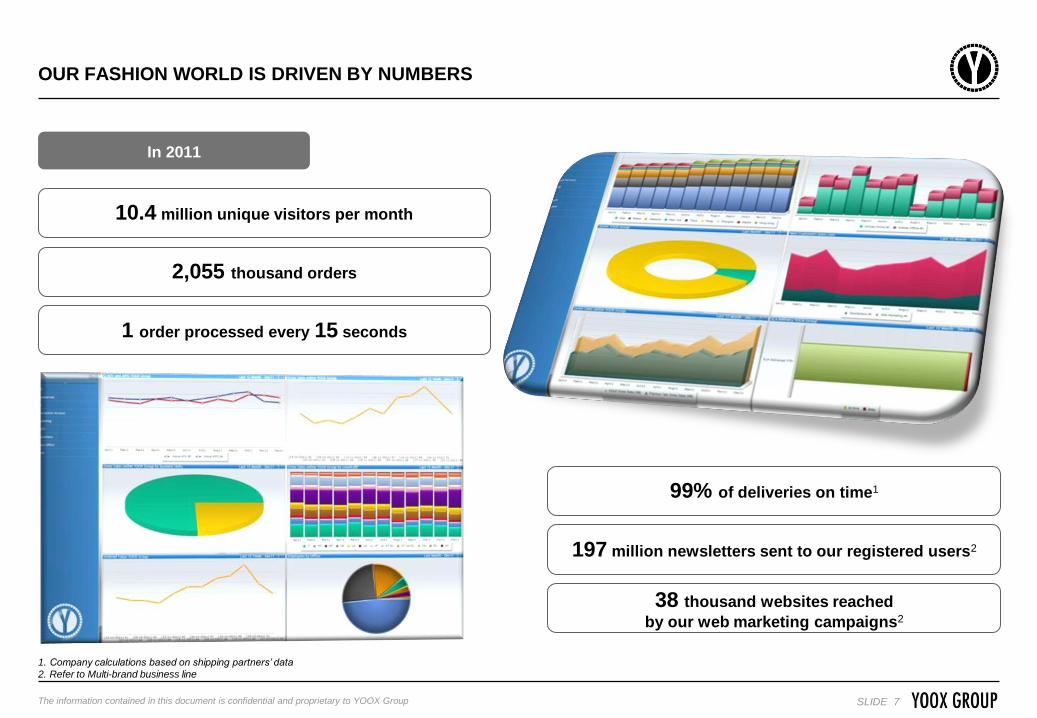
OUR FASHION WORLD IS DRIVEN BY NUMBERS
1. Company calculations based on shipping partners’ data
2. Refer to Multi-brand business line
In 2011
10.4 million unique visitors per month
2,055 thousand orders
1 order processed every 15 seconds
99% of deliveries on time1
197 million newsletters sent to our registered users2
38 thousand websites reached
by our web marketing campaigns2
The information contained in this document is confidential and proprietary to YOOX Group SLIDE 8
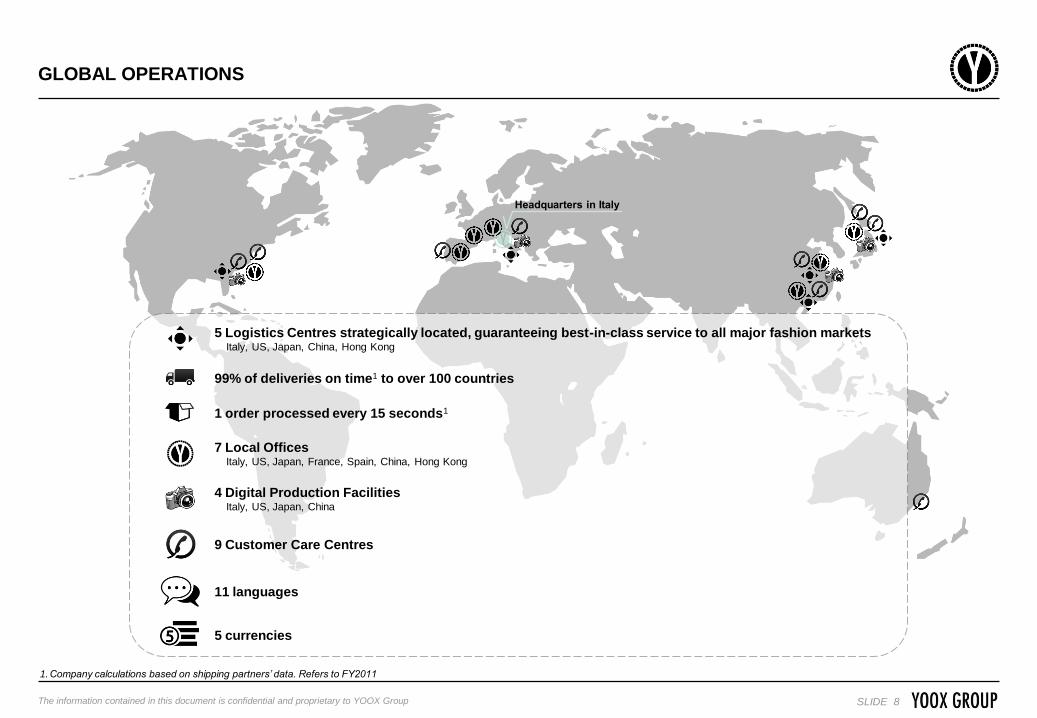
GLOBAL OPERATIONS
1.Company calculations based on shipping partners’ data. Refers to FY2011
4 Digital Production Facilities Italy, US, Japan, China
7 Local Offices Italy, US, Japan, France, Spain, China, Hong Kong
Headquarters in Italy
9 Customer Care Centres
11 languages
5 currencies
1 order processed every 15 seconds1
99% of deliveries on time1 to over 100 countries
5 Logistics Centres strategically located, guaranteeing best-in-class service to all major fashion markets Italy, US, Japan, China, Hong Kong

The information contained in this document is confidential and proprietary to YOOX Group SLIDE 9
UNIQUE SHOPPING EXPERIENCE COMBINED WITH BEST IN CLASS CUSTOMER SERVICE
Innovative and Entertaining Shopping Experience Best in Class Customer Service
for multi-brand online stores
and Online Flagship Stores
Exclusive Shopping
directly from the Catwalk
Loyalty Program
iPhone, iPad &
Android yoox.com
Proximity to the Customer in All Key Geographies
Safe Payment and Easy Returns
Fast and Reliable Delivery
Dedicated Customer Care
Distinctive Packaging
Thanks to a balanced mix of creativity, technical competencies and constant focus on the customer

The information contained in this document is confidential and proprietary to YOOX Group SLIDE 10
TABLE OF CONTENTS
INTRODUCTION TO YOOX GROUP
LATEST BUSINESS DEVELOPMENTS
FY 2011 FINANCIAL ANALYSIS
UPDATE ON STRATEGIC GUIDELINES
APPENDIX

The information contained in this document is confidential and proprietary to YOOX Group SLIDE 11
LATEST BUSINESS DEVELOPMENTS
Mono-brand
7 new Online Flagship Stores launched, bringing the total number of Online Flagship Stores to 30 as of Dec. 2011 (vs. 23 as of Dec. 2010)
3 partnerships renewed for another 5 years (Armani, Marni and Valentino)
New brand lines added to existing Online Flagship Stores (Z Zegna, Just Cavalli and Jil Sander Navy)
Extensions of existing partnerships to China (Marni, Bally, D&G, Dsquared) and Japan (Diesel)
New agreements signed with
Pomellato S.p.A. for the launch of 2 distinct Online Stores for the Pomellato and Dodo lines in Europe, the US and Japan in 2012
Pringle of Scotland Lts for the launch of the Pringle of Scotland Online Store in Europe, the US and Japan in March 2012
barbarabui.com launched in Europe, the US and Japan in February 2012
Technological Innovations
shoescribe.com - strong integration with social networks and tablet-oriented
thecorner.com - release 4.0 launched (improved usability, enhanced accessibility for multimedia contents, new architecture and design), including China
yoox.com - release 9.5 and yoox.com native application for Android launched
Operations
New highly-automated global operations and distribution platform fully operational since end of September 2011
Significant reduction of logistics costs as a percentage of net revenues
Record level of on-time deliveries thanks to significant improvement of order fulfillment capacity
Multi-brand
Launched shoescribe.com - a new in-season multi-brand online store, entirely dedicated to women’s shoes
thecorner.com
localised versions launched in China and Russia in September and October 2011 respectively
new major luxury goods brands added (e.g., Dolce & Gabbana, Ferragamo, Marc Jacobs, Paul Smith, Sergio Rossi)
partnered with Vogue (Condè Nast) in numerous initiatives to reward the talent of emerging designers across Italy, the US and China
yoox.com - successfully tested the new jewellery category within the assortment mix
The information contained in this document is confidential and proprietary to YOOX Group SLIDE 12
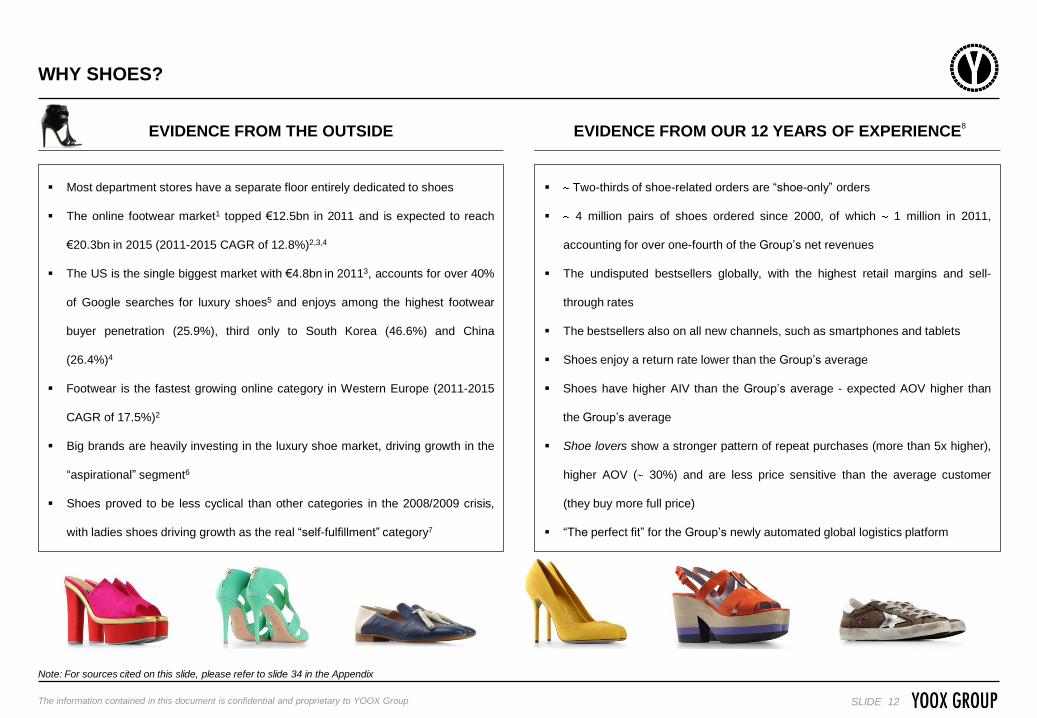
WHY SHOES?
Most department stores have a separate floor entirely dedicated to shoes
The online footwear market1 topped €12.5bn in 2011 and is expected to reach
€20.3bn in 2015 (2011-2015 CAGR of 12.8%)2,3,4
The US is the single biggest market with €4.8bn in 20113, accounts for over 40%
of Google searches for luxury shoes5 and enjoys among the highest footwear
buyer penetration (25.9%), third only to South Korea (46.6%) and China
(26.4%)4
Footwear is the fastest growing online category in Western Europe (2011-2015
CAGR of 17.5%)2
Big brands are heavily investing in the luxury shoe market, driving growth in the
“aspirational” segment6
Shoes proved to be less cyclical than other categories in the 2008/2009 crisis,
with ladies shoes driving growth as the real “self-fulfillment” category7
EVIDENCE FROM THE OUTSIDE
Two-thirds of shoe-related orders are “shoe-only” orders
4 million pairs of shoes ordered since 2000, of which 1 million in 2011,
accounting for over one-fourth of the Group’s net revenues
The undisputed bestsellers globally, with the highest retail margins and sell-
through rates
The bestsellers also on all new channels, such as smartphones and tablets
Shoes enjoy a return rate lower than the Group’s average
Shoes have higher AIV than the Group’s average - expected AOV higher than
the Group’s average
Shoe lovers show a stronger pattern of repeat purchases (more than 5x higher),
higher AOV ( 30%) and are less price sensitive than the average customer
(they buy more full price)
“The perfect fit” for the Group’s newly automated global logistics platform
EVIDENCE FROM OUR 12 YEARS OF EXPERIENCE
Note: For sources cited on this slide, please refer to slide 34 in the Appendix
8
The information contained in this document is confidential and proprietary to YOOX Group SLIDE 13
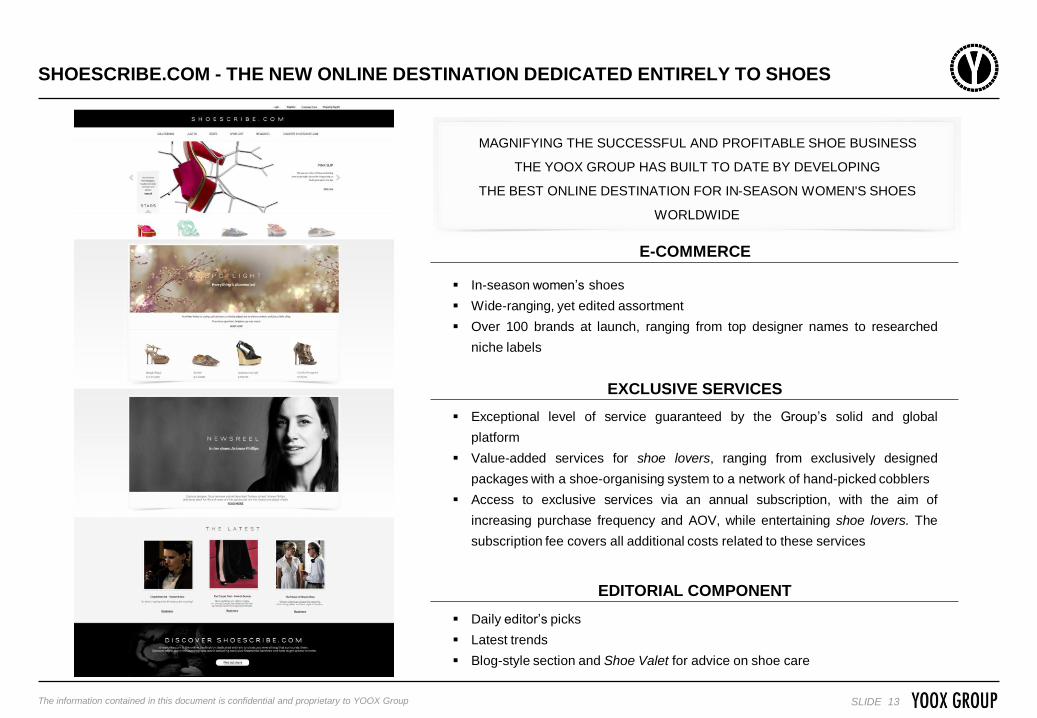
MAGNIFYING THE SUCCESSFUL AND PROFITABLE SHOE BUSINESS
THE YOOX GROUP HAS BUILT TO DATE BY DEVELOPING
THE BEST ONLINE DESTINATION FOR IN-SEASON WOMEN'S SHOES
WORLDWIDE
In-season women’s shoes
Wide-ranging, yet edited assortment
Over 100 brands at launch, ranging from top designer names to researched
niche labels
E-COMMERCE
Exceptional level of service guaranteed by the Group’s solid and global
platform
Value-added services for shoe lovers, ranging from exclusively designed
packages with a shoe-organising system to a network of hand-picked cobblers
Access to exclusive services via an annual subscription, with the aim of
increasing purchase frequency and AOV, while entertaining shoe lovers. The
subscription fee covers all additional costs related to these services
EXCLUSIVE SERVICES
Daily editor’s picks
Latest trends
Blog-style section and Shoe Valet for advice on shoe care
EDITORIAL COMPONENT
SHOESCRIBE.COM - THE NEW ONLINE DESTINATION DEDICATED ENTIRELY TO SHOES
The information contained in this document is confidential and proprietary to YOOX Group SLIDE 14
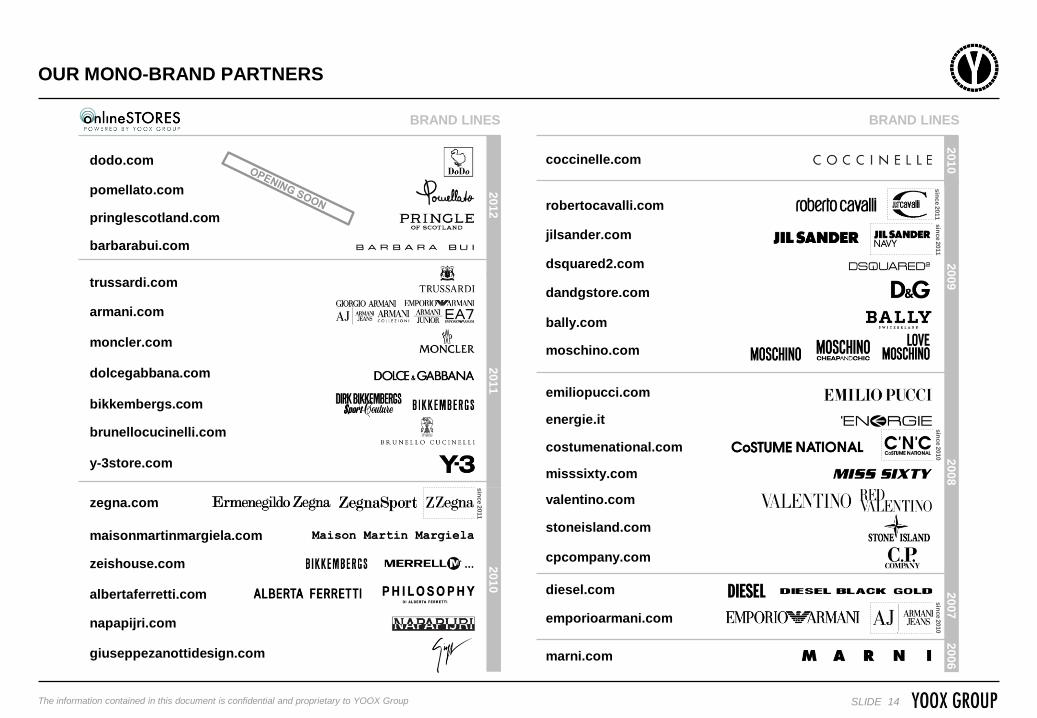
OUR MONO-BRAND PARTNERS
BRAND LINES BRAND LINES
barbarabui.com
pringlescotland.com
dodo.com
pomellato.com
moncler.com
dolcegabbana.com
brunellocucinelli.com
y-3store.com
trussardi.com
armani.com
bikkembergs.com
2011
2010
2009
2008
2007
2006
2012
2010
zeishouse.com
albertaferretti.com
napapijri.com
giuseppezanottidesign.com
maisonmartinmargiela.com
zegna.com
sin
ce 2
010
coccinelle.com
bally.com
energie.it
misssixty.com
stoneisland.com
marni.com
diesel.com
dandgstore.com
cpcompany.com
valentino.com
moschino.com
dsquared2.com
costumenational.com
robertocavalli.com
jilsander.com
emiliopucci.com
emporioarmani.com
sin
ce 2
010
sin
ce 2
011
sin
ce 2
011
sin
ce 2
011

The information contained in this document is confidential and proprietary to YOOX Group SLIDE 15
TABLE OF CONTENTS
INTRODUCTION TO YOOX GROUP
LATEST BUSINESS DEVELOPMENTS
FY 2011 FINANCIAL ANALYSIS
UPDATE ON STRATEGIC GUIDELINES
APPENDIX

The information contained in this document is confidential and proprietary to YOOX Group SLIDE 16
2011 RESULTS HIGHLIGHTS
1.Excludes Not Country Related
Key Financials
Net Revenues at €291.2m (vs. €214.3m in 2010)
North America no. 1 market in 2011
Increased contribution from all international markets, now accounting for 79.8%1 of the Group’s Net Revenues (vs. 76.6%1 in 2010)
EBITDA Excluding Incentive Plan Costs at €28.2m (vs. €22.5m in 2010)
Net Income at €10.0m (vs. €9.1m in 2010)
Positive Net Financial Position at €12.9m (vs. €22.8m at Dec. 2010)
The information contained in this document is confidential and proprietary to YOOX Group SLIDE 17
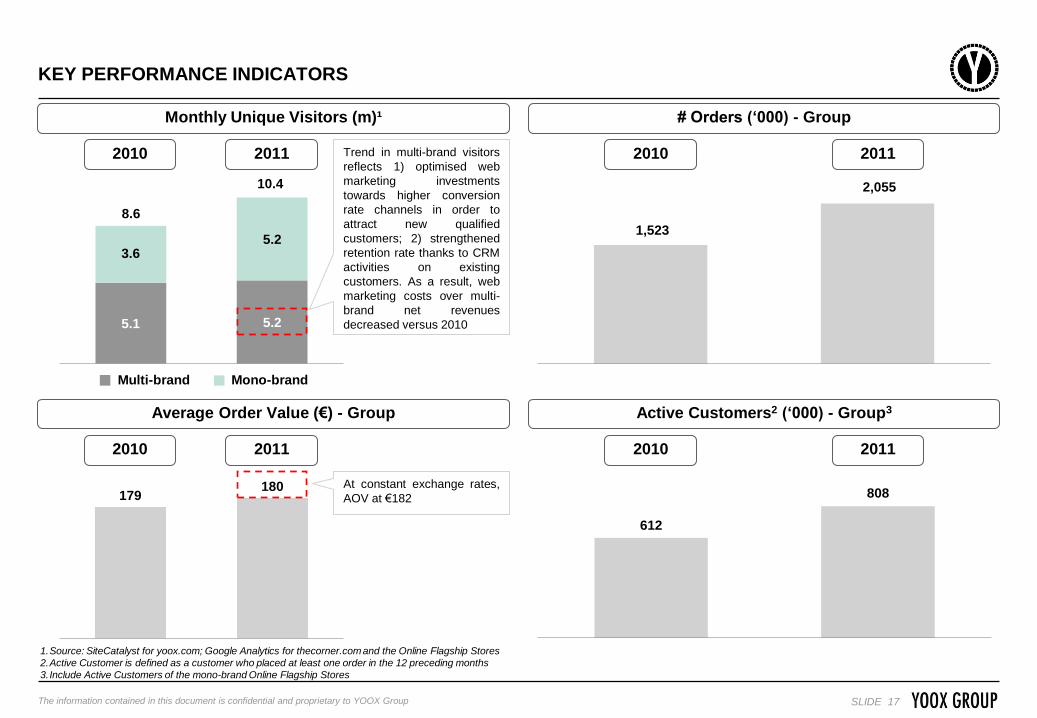
612
808
1,523
2,055
KEY PERFORMANCE INDICATORS
5.1 5.2
3.6 5.2
2010 2011
Monthly Unique Visitors (m)¹
Active Customers2 (‘000) - Group3
# Orders (‘000) - Group
1.Source: SiteCatalyst for yoox.com; Google Analytics for thecorner.com and the Online Flagship Stores
2.Active Customer is defined as a customer who placed at least one order in the 12 preceding months
3.Include Active Customers of the mono-brand Online Flagship Stores
8.6
10.4
2010 2011
2010 2011
Multi-brand Mono-brand
2010 2011 Trend in multi-brand visitors
reflects 1) optimised web
marketing investments
towards higher conversion
rate channels in order to
attract new qualified
customers; 2) strengthened
retention rate thanks to CRM
activities on existing
customers. As a result, web
marketing costs over multi-
brand net revenues
decreased versus 2010
Average Order Value (€) - Group
179 180
2011
At constant exchange rates,
AOV at €182
2010
The information contained in this document is confidential and proprietary to YOOX Group SLIDE 18
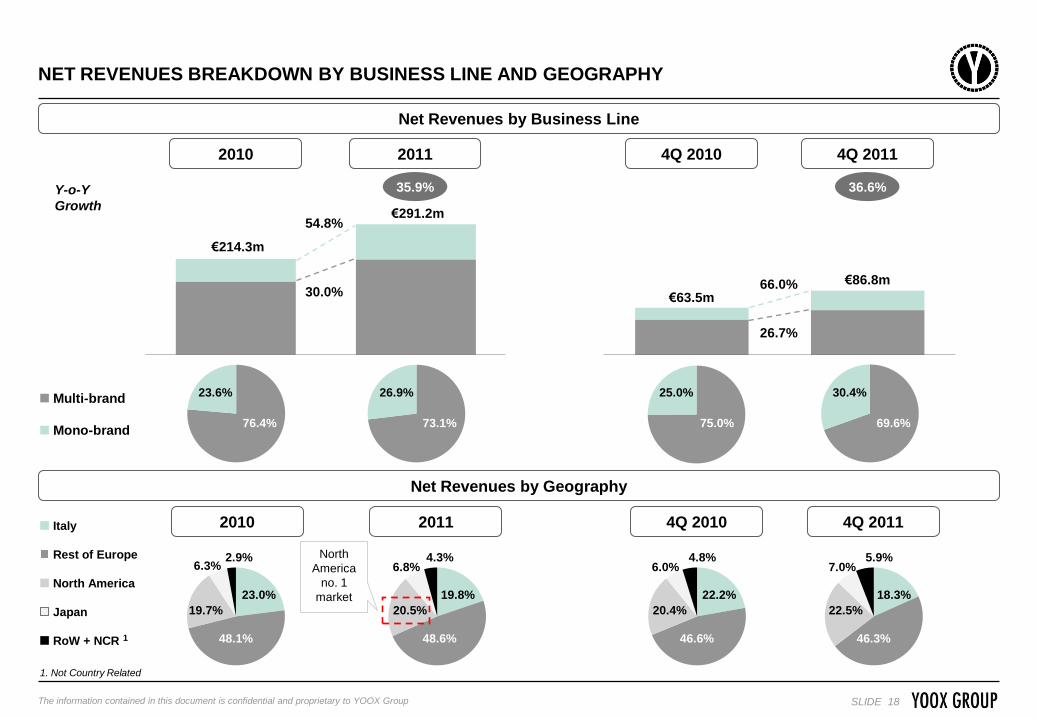
NET REVENUES BREAKDOWN BY BUSINESS LINE AND GEOGRAPHY
4Q10 4Q11
2010 2011
26.7%
66.0%
Net Revenues by Business Line
2010 2011
35.9%
4Q 2010 4Q 2011
36.6%
Net Revenues by Geography
Y-o-Y
Growth
30.0% €63.5m
€86.8m
4Q 2010 4Q 2011 2010 2011
1. Not Country Related
46.6%
20.4%
22.2%
6.0% 4.8%
46.3%
22.5%
18.3%
7.0% 5.9%
48.1%
19.7%
23.0%
6.3% 2.9%
€214.3m
€291.2m
Italy
Rest of Europe
North America
Japan
RoW + NCR 1
Multi-brand
Mono-brand
54.8%
73.1%
26.9%
76.4%
23.6% 25.0%
75.0%
30.4%
69.6%
North
America
no. 1
market
48.6%
20.5%
19.8%
6.8% 4.3%

The information contained in this document is confidential and proprietary to YOOX Group SLIDE 19
YOOX GROUP PROFIT & LOSS
4Q 2010 2010 2011 4Q 2011 (€m)
Net Revenues 214.3 291.2 63.5 86.8
growth 35.9% 39.7% 36.6%
COGS (129.9) (183.0) (36.2) (52.5)
Gross Profit 84.4 108.2 27.3 34.2
% of Net Revenues 39.4% 37.1% 43.0% 39.5%
Fulfillment (21.5) (29.6) (6.1) (7.2)
% of Net Revenues 10.1% 10.2% 9.6% 8.3%
Sales & Marketing (24.7) (31.5) (6.9) (9.4)
% of Net Revenues 11.5% 10.8% 10.9% 10.9%
EBITDA Pre Corporate Costs 38.2 47.0 14.3 17.6
% of Net Revenues 17.8% 16.2% 22.6% 20.3%
General & Administrative (18.9) (22.6) (5.3) (5.7)
% of Net Revenues 8.8% 7.8% 8.4% 6.6%
Other Income/ (Expenses) (0.5) (0.4) (0.1) 0.4
% of Net Revenues 0.2% 0.1% 0.2% 0.5%
EBITDA 18.8 24.1 8.9 12.3
% of Net Revenues 8.8% 8.3% 14.0% 14.1%
Depreciation & Amortisation (3.7) (7.7) (1.4) (2.8)
% of Net Revenues 1.7% 2.6% 2.2% 3.2%
Operating Profit 15.0 16.4 7.5 9.5
% of Net Revenues 7.0% 5.6% 11.8% 10.9%
Net Financial Income / (Expenses) (0.1) 0.0 0.2 0.4
Profit Before Tax 14.9 16.5 7.7 9.9
% of Net Revenues 7.0% 5.6% 12.1% 11.4%
Taxes (5.8) (6.4) (2.6) (3.5)
Net Income 9.1 10.0 5.1 6.4
% of Net Revenues 4.3% 3.4% 8.0% 7.3%
EBITDA Excluding Incentive Plan Costs 22.5 28.2 10.0 13.3
% of Net Revenues 10.5% 9.7% 15.8% 15.3%Note: Figures as absolute values and in percentages are calculated using precise financial data. Some of the differences found in this presentation are due to rounding of the values expressed in millions of Euro
In this presentation, fourth quarter figures are calculated as the difference between the full year results and the first nine months results of the same year
Depreciation & Amortisation included in Fulfillment, Sales & Marketing, General & Administrative have been reclassified and grouped under Depreciation & Amortisation
EBITDA Excluding Incentive Plan Costs calculated adding back to EBITDA the costs associated with incentive plans in each period
The information contained in this document is confidential and proprietary to YOOX Group SLIDE 20
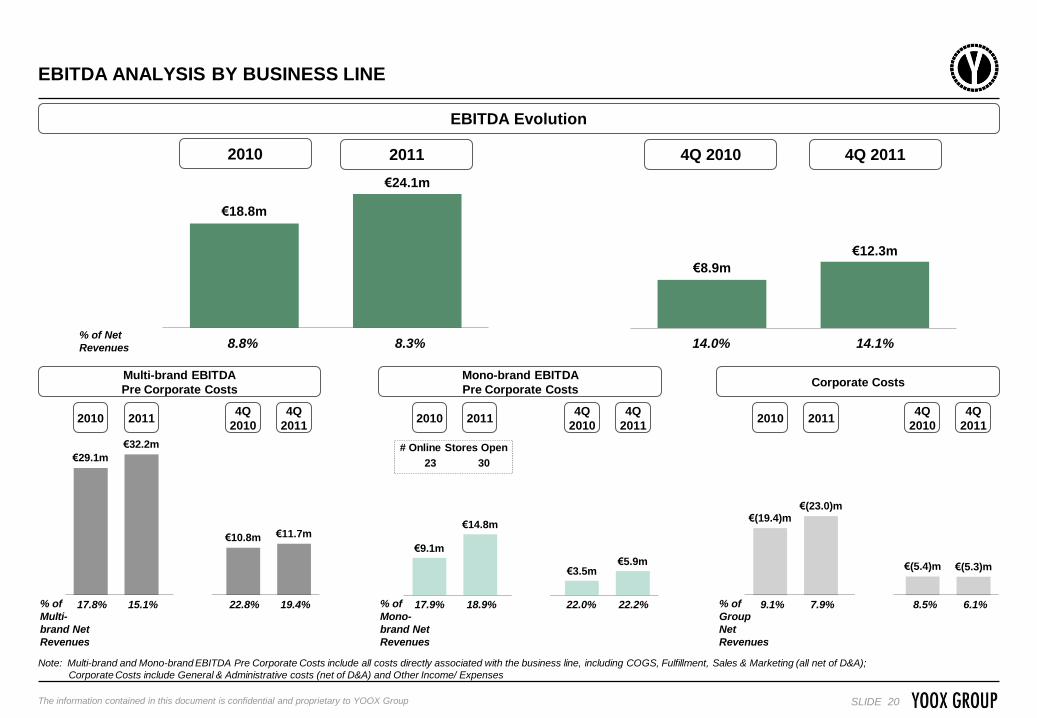
€8.9m
€12.3m
€18.8m
€24.1m
EBITDA ANALYSIS BY BUSINESS LINE
€(19.4)m €(23.0)m
€(5.4)m €(5.3)m
2010 2011 GAP 4Q2010 4Q2011
€9.1m
€14.8m
€3.5m €5.9m
2010 2011 GAP 4Q2010 4Q2011
€29.1m
€32.2m
€10.8m €11.7m
2010 2011 GAP 4Q2010 4Q2011
# Online Stores Open
23 30
4Q 2010 4Q 2011
Note: Multi-brand and Mono-brand EBITDA Pre Corporate Costs include all costs directly associated with the business line, including COGS, Fulfillment, Sales & Marketing (all net of D&A);
Corporate Costs include General & Administrative costs (net of D&A) and Other Income/ Expenses
% of Net
Revenues
EBITDA Evolution
Multi-brand EBITDA
Pre Corporate Costs Corporate Costs
Mono-brand EBITDA
Pre Corporate Costs
% of
Multi-
brand Net
Revenues
19.4% 17.8% 15.1% 22.8%
8.8% 8.3% 14.0% 14.1%
% of
Mono-
brand Net
Revenues
% of
Group
Net
Revenues
2010 2011
22.2% 17.9% 18.9% 22.0% 6.1% 9.1% 7.9% 8.5%
2010 2011
2010 2011 2010 2011 4Q
2010
4Q
2011
4Q
2010
4Q
2011
4Q
2010
4Q
2011
The information contained in this document is confidential and proprietary to YOOX Group SLIDE 21
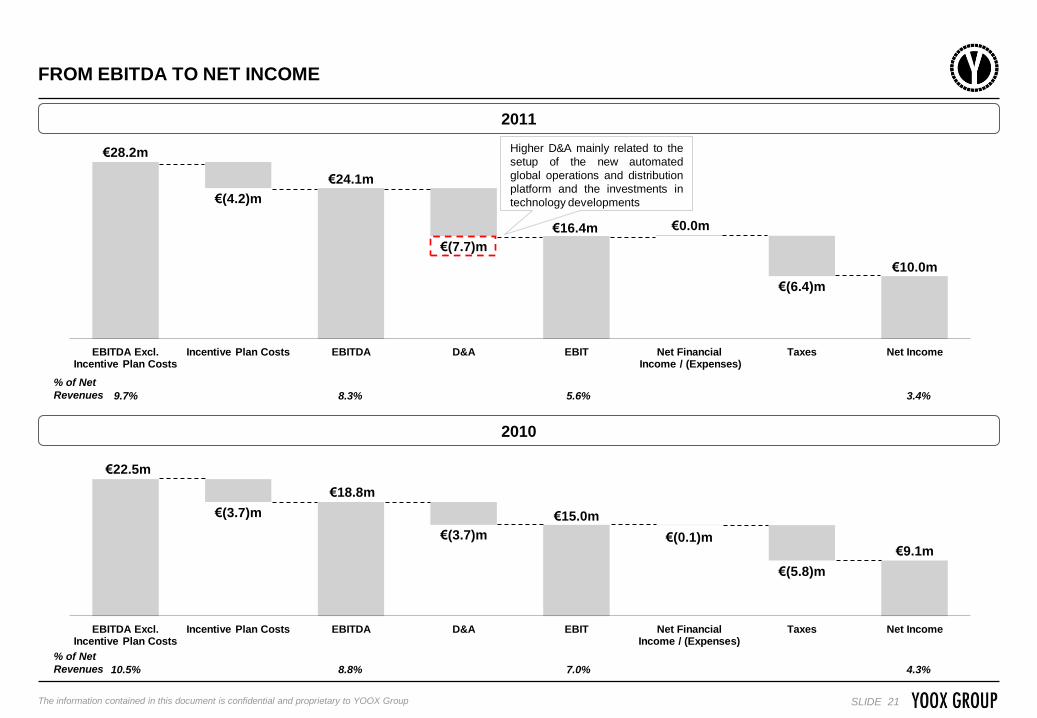
FROM EBITDA TO NET INCOME
2011
2010
€28.2m
€(4.2)m
€24.1m
€(7.7)m
€16.4m €0.0m
€(6.4)m
€10.0m
EBITDA Excl. Incentive Plan Costs
Incentive Plan Costs EBITDA D&A EBIT Net Financial Income / (Expenses)
Taxes Net Income
€22.5m
€(3.7)m
€18.8m
€(3.7)m
€15.0m
€(0.1)m
€(5.8)m
€9.1m
EBITDA Excl. Incentive Plan Costs
Incentive Plan Costs EBITDA D&A EBIT Net Financial Income / (Expenses)
Taxes Net Income
% of Net
Revenues
% of Net
Revenues 10.5% 8.8% 7.0% 4.3%
9.7% 8.3% 5.6% 3.4%
Higher D&A mainly related to the
setup of the new automated
global operations and distribution
platform and the investments in
technology developments

The information contained in this document is confidential and proprietary to YOOX Group SLIDE 22
YOOX GROUP SUMMARY BALANCE SHEET
2011 2010 (€m)
Net Working Capital 24.8 33.0
Non Current Assets 21.5 36.9
Non Current Liabilities (excl. financial liabilities) (0.4) (0.3)
Total 45.9 69.6
Net Financial Debt / (Net Cash) (22.8) (12.9)
Shareholders' Equity 68.7 82.6
Total 45.9 69.6

The information contained in this document is confidential and proprietary to YOOX Group SLIDE 23
NET WORKING CAPITAL EVOLUTION
2011
Inventory Level Evolution
2010
Net Working Capital
46.6% 47.9%
35.6% 35.0%
2010 2011
Inventories as % of Multi-brand Net Revenues Inventories as % of Group Net Revenues
2011 Inventories as % of
Multi-brand Net Revenues
include stock related to
shoescribe.com
(€m)
Inventories 76.3 101.9
Trade Receivables 9.4 8.2
Trade Payables (48.9) (62.8)
Other Receivables / (Payables) (12.0) (14.3)
Net Working Capital 24.8 33.0
as % of Net Revenues 11.6% 11.3%
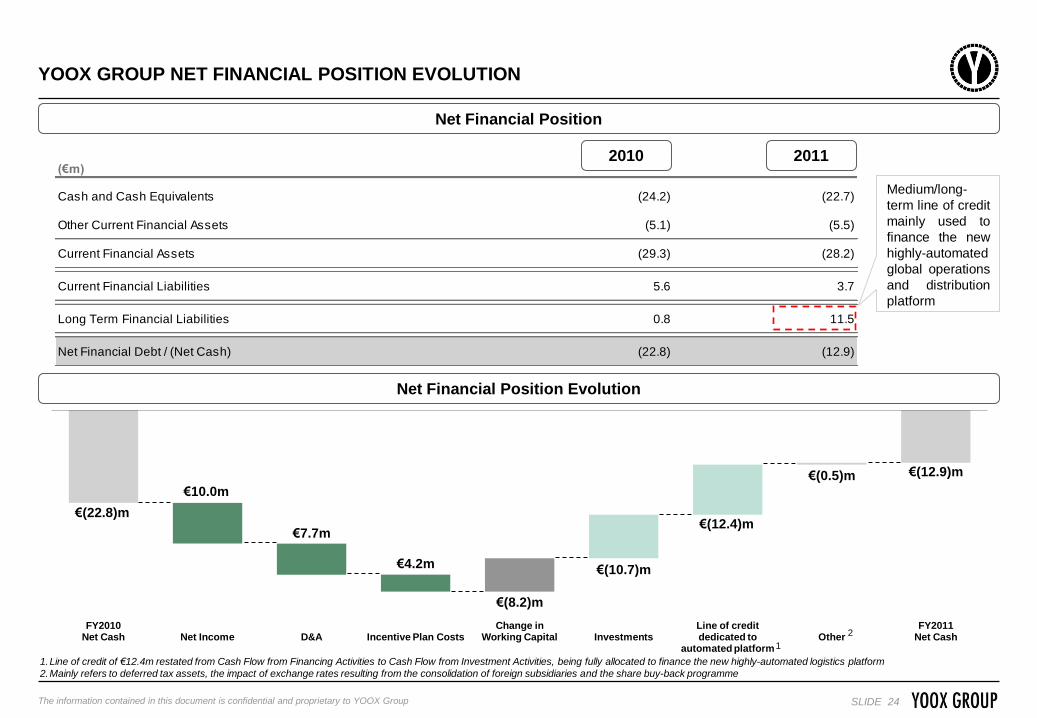
The information contained in this document is confidential and proprietary to YOOX Group SLIDE 24
(€m)
Cash and Cash Equivalents (24.2) (22.7)
Other Current Financial Assets (5.1) (5.5)
Current Financial Assets (29.3) (28.2)
Current Financial Liabilities 5.6 3.7
Long Term Financial Liabilities 0.8 11.5
Net Financial Debt / (Net Cash) (22.8) (12.9)
YOOX GROUP NET FINANCIAL POSITION EVOLUTION
€(22.8)m
€10.0m
€7.7m
€4.2m
€(8.2)m
€(10.7)m
€(12.4)m
€(0.5)m €(12.9)m
FY2010 Net Cash
Net Income
D&A
Incentive Plan Costs
Change in Working Capital
Investments
Line of credit dedicated to
automated platform
Other
FY2011 Net Cash
Net Financial Position
Net Financial Position Evolution
1
Medium/long-
term line of credit
mainly used to
finance the new
highly-automated
global operations
and distribution
platform
2010 2011
2
1.Line of credit of €12.4m restated from Cash Flow from Financing Activities to Cash Flow from Investment Activities, being fully allocated to finance the new highly-automated logistics platform
2.Mainly refers to deferred tax assets, the impact of exchange rates resulting from the consolidation of foreign subsidiaries and the share buy-back programme
The information contained in this document is confidential and proprietary to YOOX Group SLIDE 25
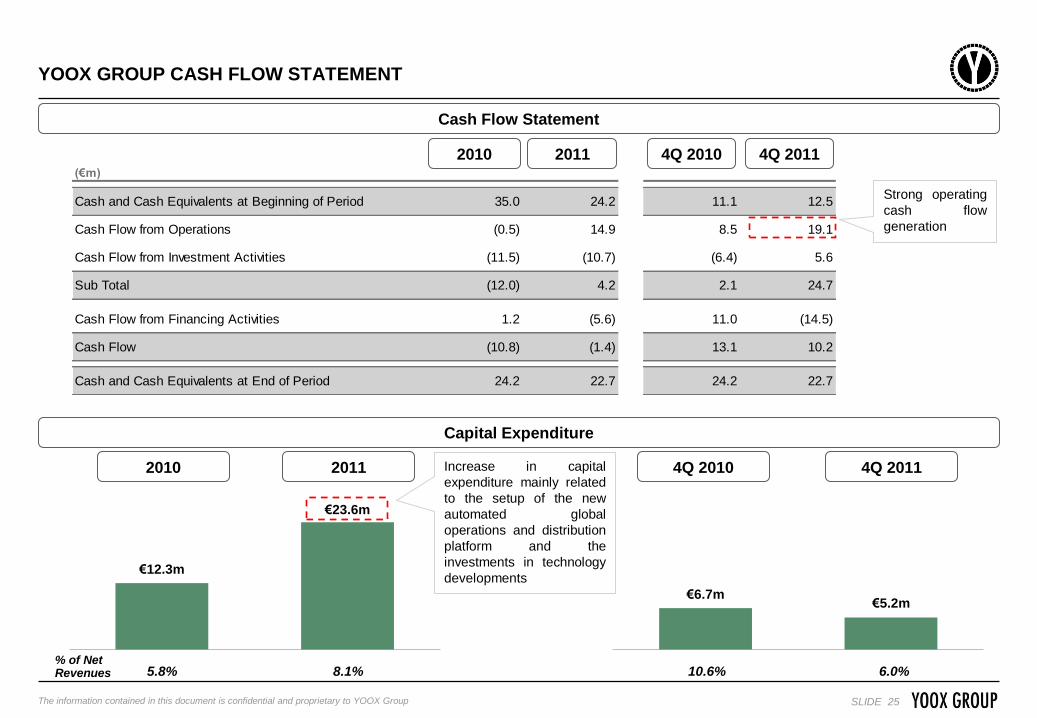
€12.3m
€23.6m
€6.7m €5.2m
YOOX GROUP CASH FLOW STATEMENT
Cash Flow Statement
Capital Expenditure
4Q 2010 4Q 2011
% of Net Revenues 10.6% 6.0% 5.8% 8.1%
Increase in capital
expenditure mainly related
to the setup of the new
automated global
operations and distribution
platform and the
investments in technology
developments
2010 2011
(€m)
Cash and Cash Equivalents at Beginning of Period 35.0 24.2 11.1 12.5
Cash Flow from Operations (0.5) 14.9 8.5 19.1
Cash Flow from Investment Activities (11.5) (10.7) (6.4) 5.6
Sub Total (12.0) 4.2 2.1 24.7
Cash Flow from Financing Activities 1.2 (5.6) 11.0 (14.5)
Cash Flow (10.8) (1.4) 13.1 10.2
Cash and Cash Equivalents at End of Period 24.2 22.7 24.2 22.7
2010 2011 4Q 2010 4Q 2011
Strong operating
cash flow
generation
The information contained in this document is confidential and proprietary to YOOX Group SLIDE 26
TABLE OF CONTENTS
INTRODUCTION TO YOOX GROUP
LATEST BUSINESS DEVELOPMENTS
FY 2011 FINANCIAL ANALYSIS
UPDATE ON STRATEGIC GUIDELINES
APPENDIX
The information contained in this document is confidential and proprietary to YOOX Group SLIDE 27
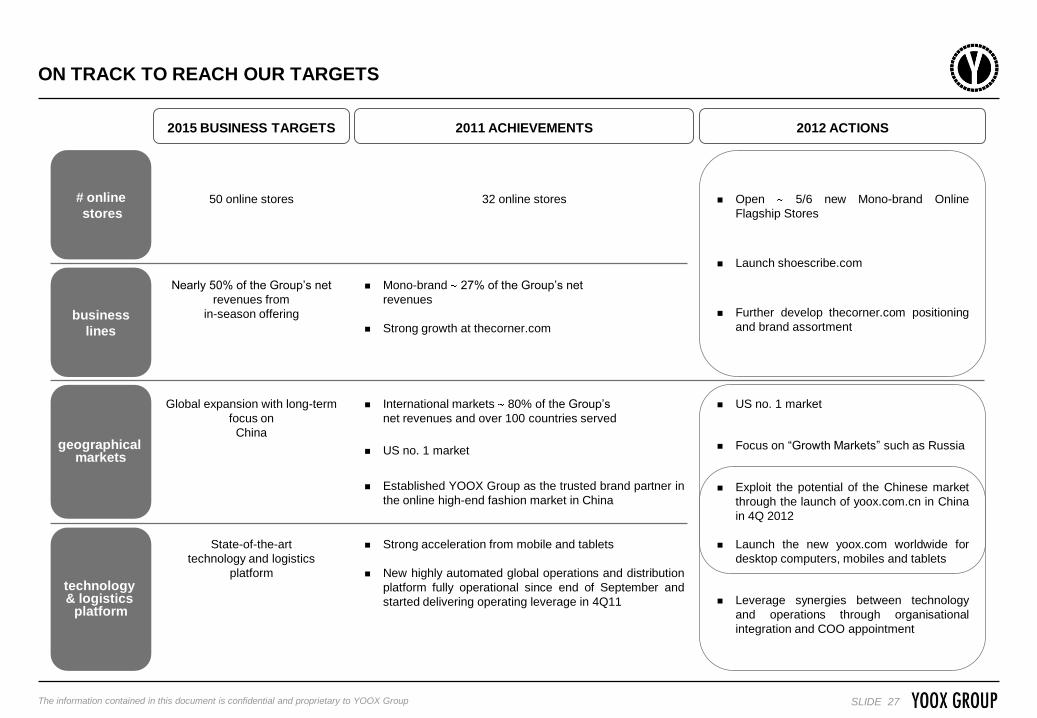
ON TRACK TO REACH OUR TARGETS
2015 BUSINESS TARGETS 2012 ACTIONS 2011 ACHIEVEMENTS
50 online stores
Nearly 50% of the Group’s net
revenues from
in-season offering
Global expansion with long-term
focus on
China
State-of-the-art
technology and logistics
platform
32 online stores
Mono-brand 27% of the Group’s net
revenues
Strong growth at thecorner.com
International markets 80% of the Group’s
net revenues and over 100 countries served
US no. 1 market
Established YOOX Group as the trusted brand partner in
the online high-end fashion market in China
Strong acceleration from mobile and tablets
New highly automated global operations and distribution
platform fully operational since end of September and
started delivering operating leverage in 4Q11
# online
stores
technology & logistics
platform
geographical markets
business
lines
Launch the new yoox.com worldwide for
desktop computers, mobiles and tablets
Leverage synergies between technology
and operations through organisational
integration and COO appointment
US no. 1 market
Focus on “Growth Markets” such as Russia
Exploit the potential of the Chinese market
through the launch of yoox.com.cn in China
in 4Q 2012
Open 5/6 new Mono-brand Online
Flagship Stores
Launch shoescribe.com
Further develop thecorner.com positioning
and brand assortment
The information contained in this document is confidential and proprietary to YOOX Group SLIDE 28
TABLE OF CONTENTS
INTRODUCTION TO YOOX GROUP
LATEST BUSINESS DEVELOPMENTS
FY 2011 FINANCIAL ANALYSIS
UPDATE ON STRATEGIC GUIDELINES
APPENDIX

The information contained in this document is confidential and proprietary to YOOX Group SLIDE 29
YOOX GROUP PROFIT & LOSS EXCLUDING INCENTIVE PLAN COSTS
4Q 2010 2010 2011 4Q 2011 (€m)
Net Revenues 214.3 291.2 63.5 86.8
growth 40.8% 35.9% 39.7% 36.6%
COGS (129.9) (183.0) (36.2) (52.5)
Gross Profit 84.4 108.2 27.3 34.2
% of Net Revenues 39.4% 37.1% 43.0% 39.5%
Fulfillment Excl. Incentive Plan Costs (21.4) (29.3) (6.0) (7.2)
% of Net Revenues 10.0% 10.1% 9.5% 8.3%
Sales & Marketing Excl. Incentive Plan Costs (23.5) (30.2) (6.5) (9.1)
% of Net Revenues 11.0% 10.4% 10.2% 10.5%
EBITDA Pre Corporate Costs 39.5 48.7 14.8 18.0
% of Net Revenues 18.4% 16.7% 23.3% 20.7%
General & Administrative Excl. Incentive Plan Costs (16.5) (20.0) (4.7) (5.1)
% of Net Revenues 7.7% 6.9% 7.4% 5.8%
Other Income/(Expenses) (0.5) (0.4) (0.1) 0.4
% of Net Revenues 0.2% 0.1% 0.2% 0.5%
EBITDA Excluding Incentive Plan Costs 22.5 28.2 10.0 13.3
% of Net Revenues 10.5% 9.7% 15.8% 15.3%

The information contained in this document is confidential and proprietary to YOOX Group SLIDE 30
(€m)
Fulfillment (21.539) (29.580) (6.077) (7.243)
of which Incentive Plan Costs (0.152) 4.0% (0.243) 5.8% (0.050) 4.5% (0.064) 6.3%
Sales & Marketing (24.691) (31.549) (6.896) (9.421)
of which Incentive Plan Costs (1.163) 31.1% (1.370) 32.9% (0.399) 36.4% (0.325) 31.9%
General & Administrative (18.945) (22.601) (5.322) (5.698)
of which Incentive Plan Costs (2.429) 64.9% (2.554) 61.3% (0.648) 59.0% (0.628) 61.8%
Incentive Plan Costs (3.744) 100.0% (4.167) 100.0% (1.097) 100.0% (1.017) 100.0%
EBITDA Reported 18.751 24.081 8.920 12.268
% of Net Revenues 8.8% 8.3% 14.0% 14.1%
Incentive Plan Costs (3.744) (4.167) (1.097) (1.017)
EBITDA Excl. Incentive Plan Costs 22.495 28.248 10.017 13.285
% of Net Revenues 10.5% 9.7% 15.8% 15.3%
FOCUS ON INCENTIVE PLAN COSTS
% of
Total
% of
Total
% of
Total
% of
Total 2010 2011
4Q
2010
4Q
2011

The information contained in this document is confidential and proprietary to YOOX Group SLIDE 31
€5.6m
€4.5m
€4.9m
€13.3m €28.2m
1Q11 2Q11 3Q11 4Q11 FY2011
€69.7m
€61.5m
€73.2m
€86.8m €291.2m
1Q11 2Q11 3Q11 4Q11 FY2011
Net Revenues
EBITDA Excluding Incentive Plan Costs
24% 21% 25% 30%
% of
Total
Year
% of
Total
Year
1Q 2011 3Q 2011 4Q 2011 FY 2011 2Q 2011
20% 16% 17% 47%
6.7% 15.3% 9.7% 7.4% 8.0%
% of Net
Revenues
3Q 2011 4Q 2011 FY 2011 2Q 2011 1Q 2011
2011 NET REVENUES AND EBITDA QUARTERLY CONTRIBUTION

The information contained in this document is confidential and proprietary to YOOX Group SLIDE 32
Federico Marchetti 7,090,501 11.0% 3,590,433 6.5%
Management team and other stock option holders 5,605,756 8.7%
Sub-total 12,696,257 19.8% 3,590,433 6.5%
Balderton Capital 5,870,280 9.1% 5,870,280 10.7%
Red Circle Unipersonale 3,392,430 5.3% 3,392,430 6.2%
Federated 3,055,784 4.8% 3,055,784 5.5%
Baillie Gifford & Co 2,758,937 4.3% 2,758,937 5.0%
Caledonia Investments 2,705,422 4.2% 2,705,422 4.9%
Wasatch Advisors 1,535,015 2.4% 1,535,015 2.8%
Aviva Investors Global Services 1,289,013 2.0% 1,289,013 2.3%
Capital Research and Management Company 1,125,212 1.8% 1,125,212 2.0%
OppenheimerFunds 1,124,050 1.8% 1,124,050 2.0%
Pictet Funds (Europe) S.A. 1,105,129 1.7% 1,105,129 2.0%
Market 27,547,911 42.9% 27,547,911 50.0%
Total 64,205,440 100.0% 55,099,616 100.0%
SHAREHOLDER STRUCTURE
Updated as of 7 March 2012
1.The fully diluted column shows the effect on the Company’s shareholder structure calculated assuming that all the stock options granted under the Company’s stock option plans are exercised. It does not
include 158,640 ordinary shares granted under the 2009 - 2014 Incentive Plan
2.Excludes Federico Marchetti
3.Includes 162,000 proprietary shares
2
3
Shareholder Current Fully Diluted 1

The information contained in this document is confidential and proprietary to YOOX Group SLIDE 33
ONLINE STORES PARTNERSHIP
YOOX Group Strategic Partner
Fashion Responsibilities
Definition of Online Store look&feel
Product assortment definition
Pricing definition
Marketing activities
YOOX Group
additional
services:
Yagency
Key
Responsibilities
E-commerce Responsibilities
Set-up and management of the Online Store
Logistics
Digital production
Handling and shipping
Invoicing
Fraud checking and credit collection
Customer care
Support and advisory to the Strategic Partner in
all key decisions
Digital experience (Web Design)
Content Production
Media Partnership
Web Marketing
Digital PR and Social Activities
The information contained in this document is confidential and proprietary to YOOX Group SLIDE 34
SOURCES INDEX
1. Includes the US, 17 Western European countries (Austria, Belgium, Denmark, Finland, France, Germany, Greece, Ireland, Italy, Luxembourg, Netherlands,
Norway, Portugal, Spain, Sweden, Switzerland, United Kingdom) and the APAC Region (China, India, Japan, South Korea and Australia)
2. Company calculations based on Forrester Research Online Retail Forecast, 2011 to 2016 (Western Europe), February 2012
3. Company calculations based on Forrester Research Online Retail Forecast, 2011 to 2016 (US), January 2012
4. Company calculations based on Forrester Research Online Retail Forecast, 2010 to 2015 (Asia Pacific), October 2010
5. “The Luxury Shoe Industry: Analysis of Consumers’ Search Intentions and Brands’ Social Media Presence”, Digital Luxury Group, December 2011
6. Altagamma 2011 Worldwide Markets Monitor, 17 October 2011
7. Altagamma 2009 Worldwide Markets Monitor, 19 October 2009
8. Internal findings are based on several historical analyses of YOOX Group’s customers’ data
Please note that data in USD has been converted in EUR at a USD/EUR exchange rate of 1.3920

The information contained in this document is confidential and proprietary to YOOX Group SLIDE 35
CONTACTS
Investor Relations
www.yooxgroup.com
BOLOGNA - MILANO - NEW YORK - MADRID - PARIS - TOKYO - SHANGHAI - HONG KONG